Embed Size (px)
Citation preview
Suicide in the Central Health Planning Region, 2003-2008Marc E. LeslieCoordinator, Virginia Violent Death Reporting SystemOffice of the Chief Medical Examiner, Virginia Department of Health
Presented by Stephanie GoodmanInjury Data and Evaluation CoordinatorOffice of Family Health Services, Virginia Department of Health
The Central Health Planning Region Suicide Prevention Summit June 1, 2011Chesterfield County, VA
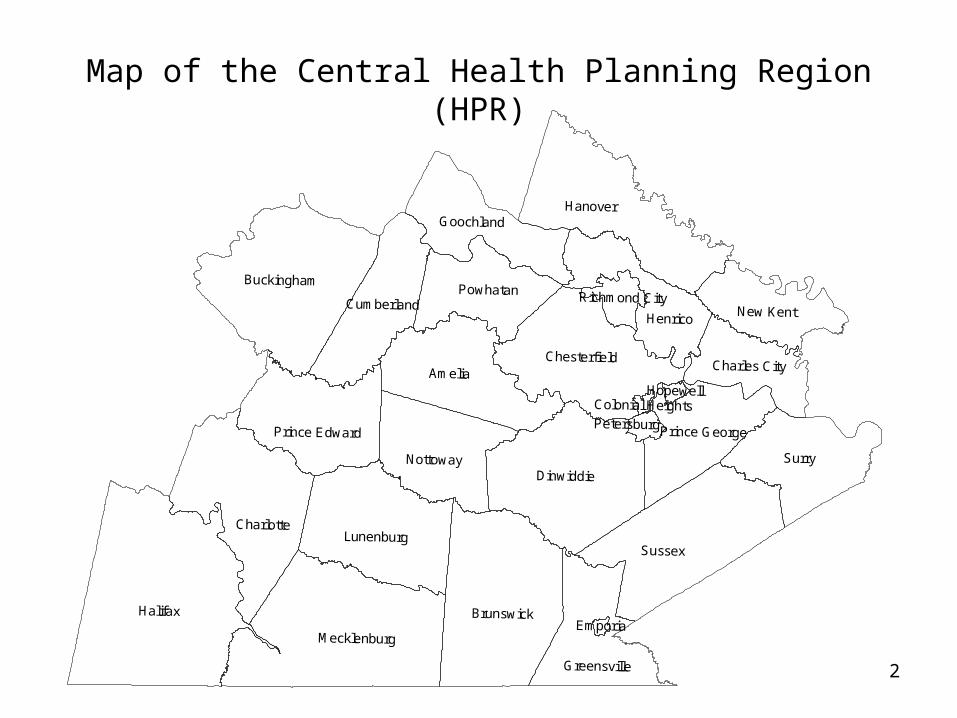
Map of the Central Health Planning Region (HPR)
2
Halifax
Sussex
Surry
Brunswick
Mecklenburg
Charlotte
Dinwiddie
Lunenburg
Nottoway
Greensville
Prince Edward
Hanover
Amelia
Buckingham
Chesterfield
Henrico
Goochland
PowhatanCumberland New Kent
Prince George
Charles City
Richmond City
Petersburg
Hopewell
Emporia
Colonial Heights
3
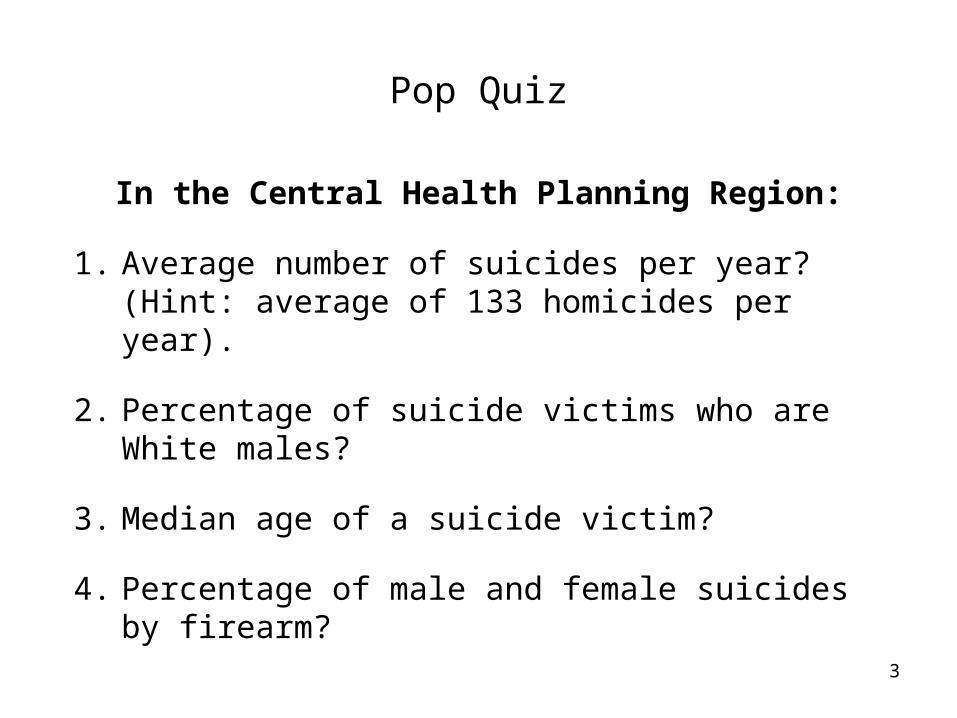
Pop Quiz
In the Central Health Planning Region:
1. Average number of suicides per year? (Hint: average of 133 homicides per year).
2. Percentage of suicide victims who are White males?
3. Median age of a suicide victim?
4. Percentage of male and female suicides by firearm?
4
Suicide in the Central HPR, 2003-2008
Overview of the Problem
5
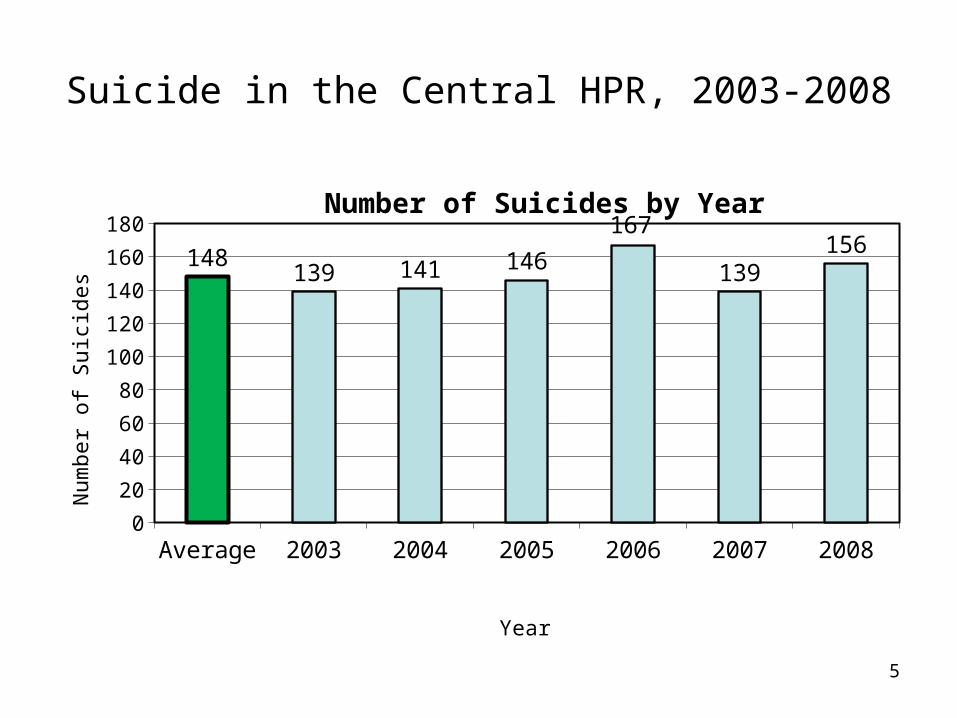
Suicide in the Central HPR, 2003-2008
Average 2003 2004 2005 2006 2007 20080
20
40
60
80
100
120
140
160
180
148139 141 146
167
139156
Number of Suicides by Year
Year
Nu
mb
er
of
Su
icid
es
6
Suicide in the Central HPR, 2003-2008
Total 2003 2004 2005 2006 2007 20080.0
2.0
4.0
6.0
8.0
10.0
12.0
14.0
16.0
18.0
20.0
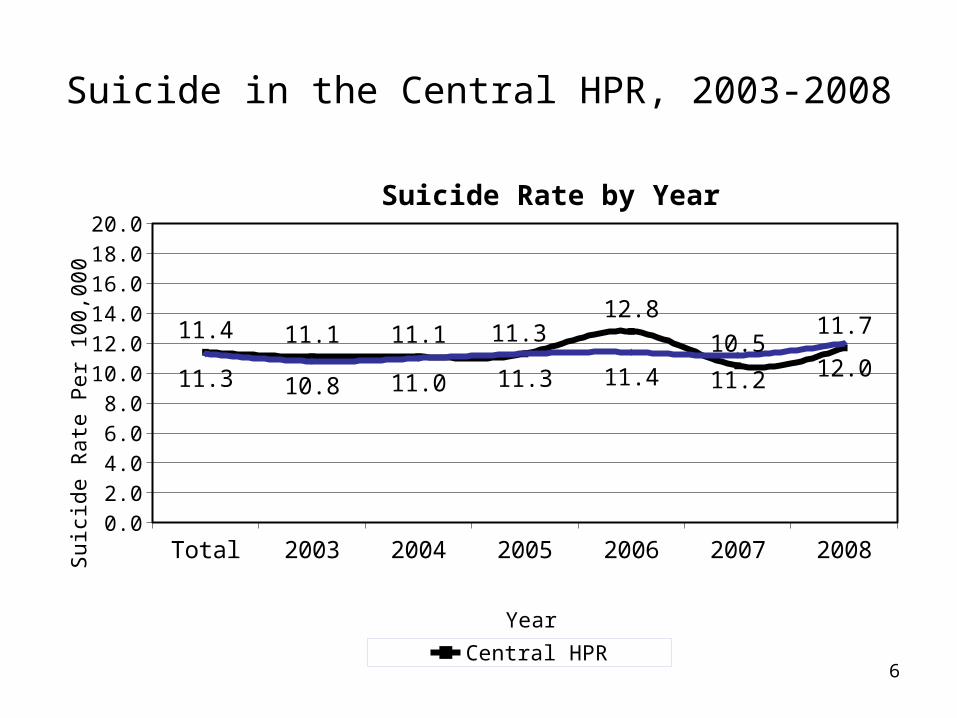
11.4 11.1 11.1 11.312.8
10.511.7
11.3 10.8 11.0 11.3 11.4 11.2 12.0
Suicide Rate by Year
Central HPR Virginia
Year
Su
icid
e R
ate
Pe
r 1
00
,00
0
7
Suicide in the Central HPR, 2003-2008
Suicide vs. Homicide (2003-2008)
• 888 suicides; rate of 11.4
• 799 homicides; rate of 10.3
• Suicide slightly more common than homicide
8
Suicide in the Central HPR, 2003-2008
Average 2003 2004 2005 2006 2007 20080
200
400
600
800
1000
1200
1400
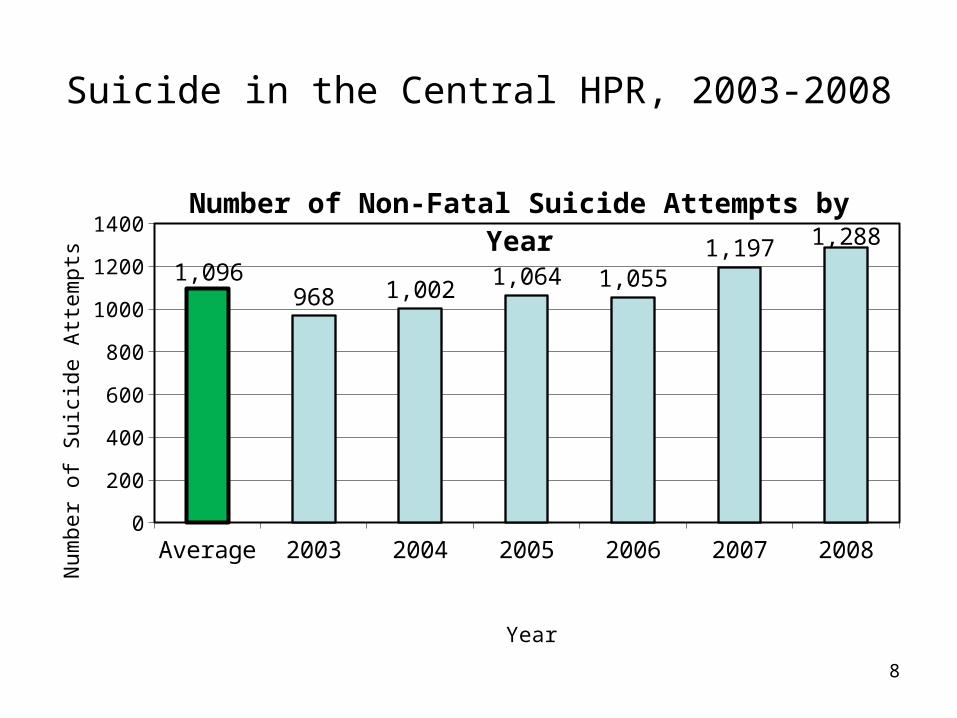
1,096968 1,002 1,064 1,055
1,197 1,288
Number of Non-Fatal Suicide Attempts by Year
Year
Nu
mb
er
of
Su
icid
e A
tte
mp
ts
9
Suicide in the Central HPR, 2003-2008
Total 2003 2004 2005 2006 2007 20080.0
20.0
40.0
60.0
80.0
100.0
120.0
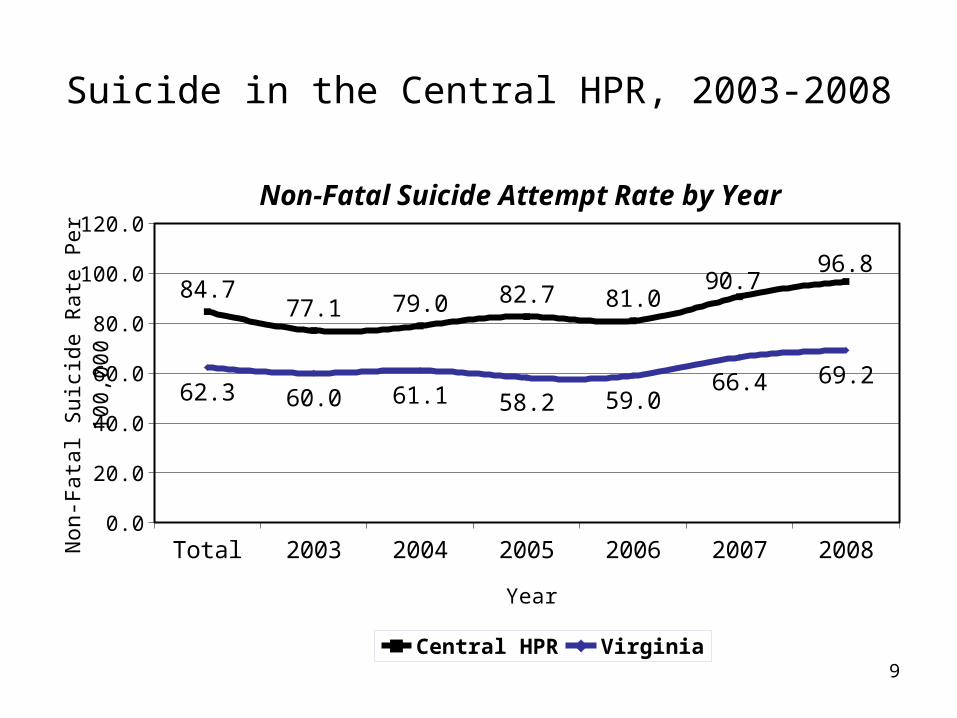
84.777.1 79.0 82.7 81.0
90.796.8
62.3 60.0 61.1 58.2 59.066.4 69.2
Non-Fatal Suicide Attempt Rate by Year
Central HPR Virginia
Year
No
n-F
ata
l Su
icid
e R
ate
Pe
r 1
00
,00
0
10
Suicide in the Central HPR, 2003-2008
Who is at Risk?
11
Suicide in the Central HPR, 2003-2008
Selected Demographic Elements
Gender
Race
Age
12
Suicide in the Central HPR, 2003-2008
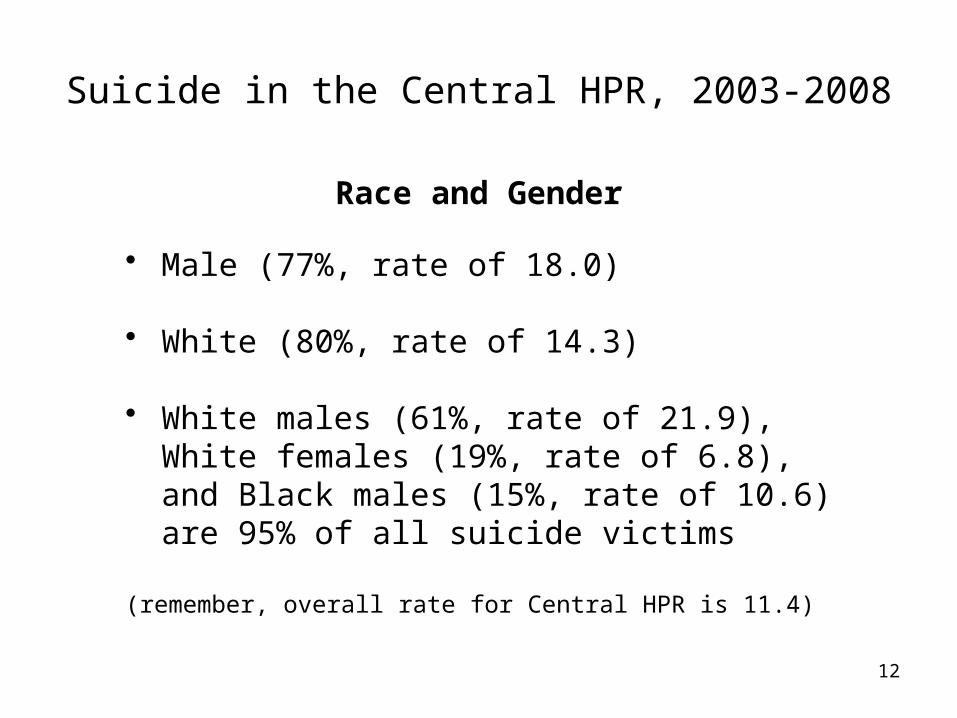
Race and Gender
• Male (77%, rate of 18.0)
• White (80%, rate of 14.3)
• White males (61%, rate of 21.9), White females (19%, rate of 6.8), and Black males (15%, rate of 10.6) are 95% of all suicide victims
(remember, overall rate for Central HPR is 11.4)
13
Suicide in the Central HPR, 2003-2008
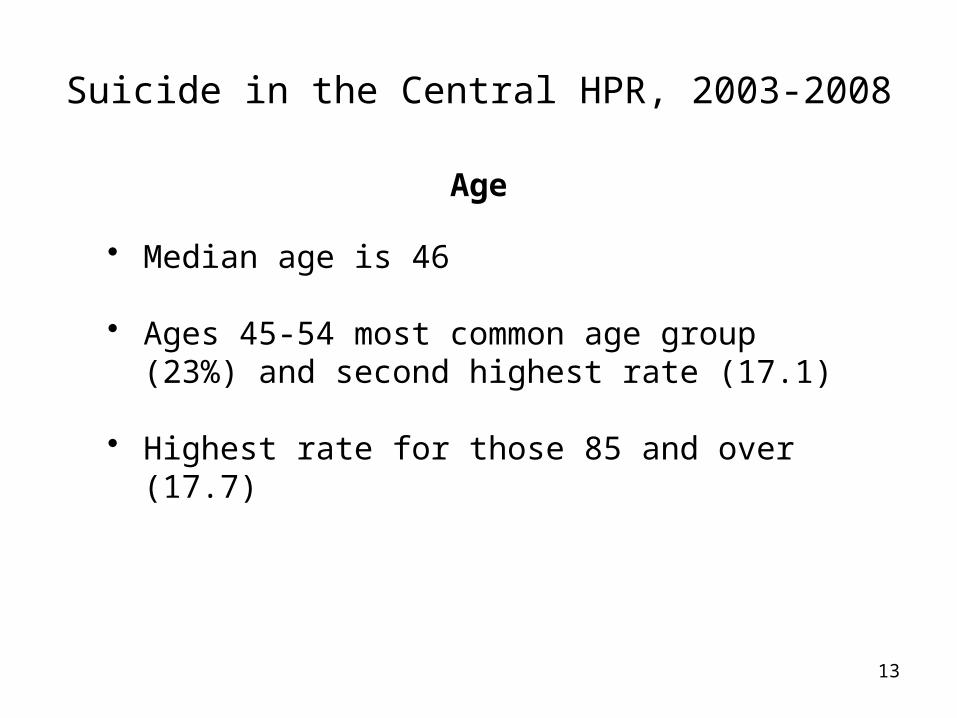
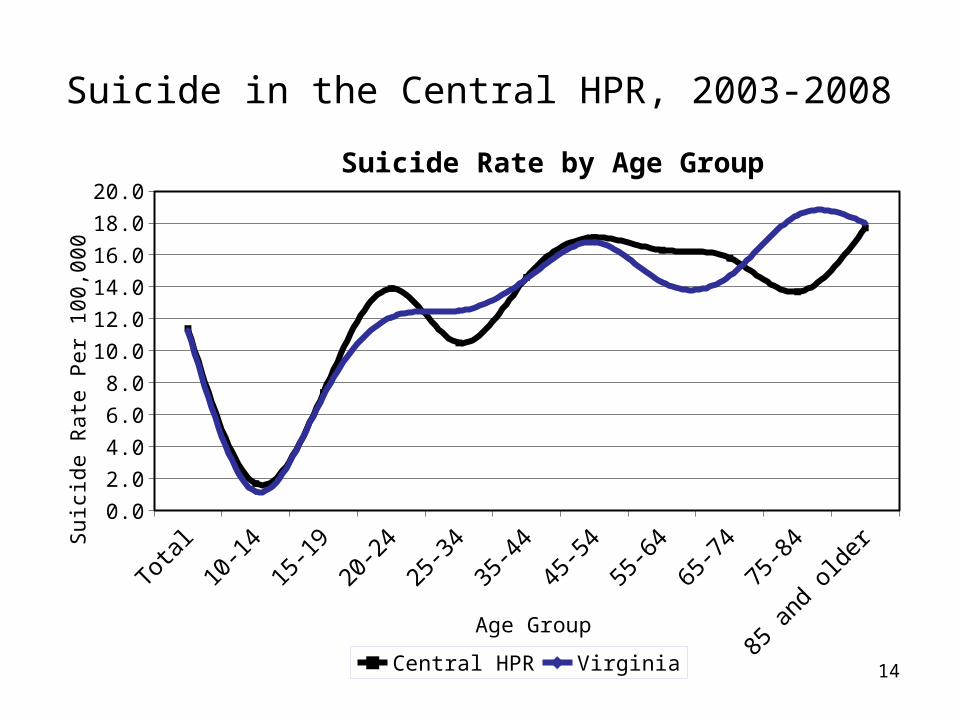
Age
• Median age is 46
• Ages 45-54 most common age group (23%) and second highest rate (17.1)
• Highest rate for those 85 and over (17.7)
14
Suicide in the Central HPR, 2003-2008
Total
10-1
415
-19
20-2
425
-34
35-4
445
-54
55-6
465
-74
75-8
4
85 a
nd o
lder
0.0
2.0
4.0
6.0
8.0
10.0
12.0
14.0
16.0
18.0
20.0
Suicide Rate by Age Group
Central HPR Virginia
Age Group
Su
icid
e R
ate
Pe
r 1
00
,00
0
15
Suicide in the Central HPR, 2003-2008
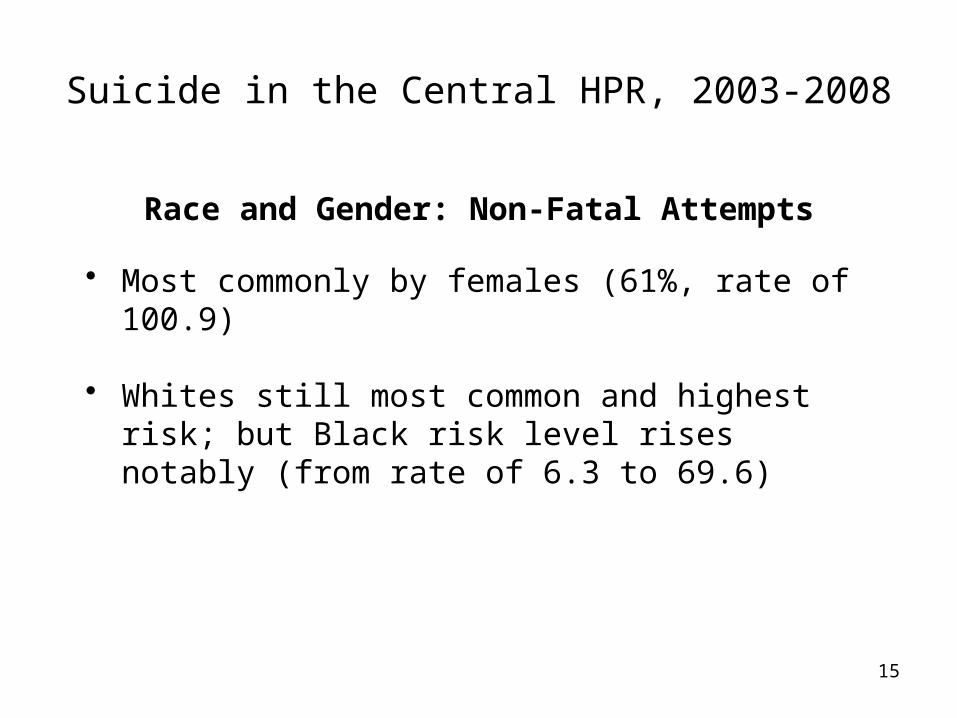
Race and Gender: Non-Fatal Attempts
• Most commonly by females (61%, rate of 100.9)
• Whites still most common and highest risk; but Black risk level rises notably (from rate of 6.3 to 69.6)
16
Suicide in the Central HPR, 2003-2008
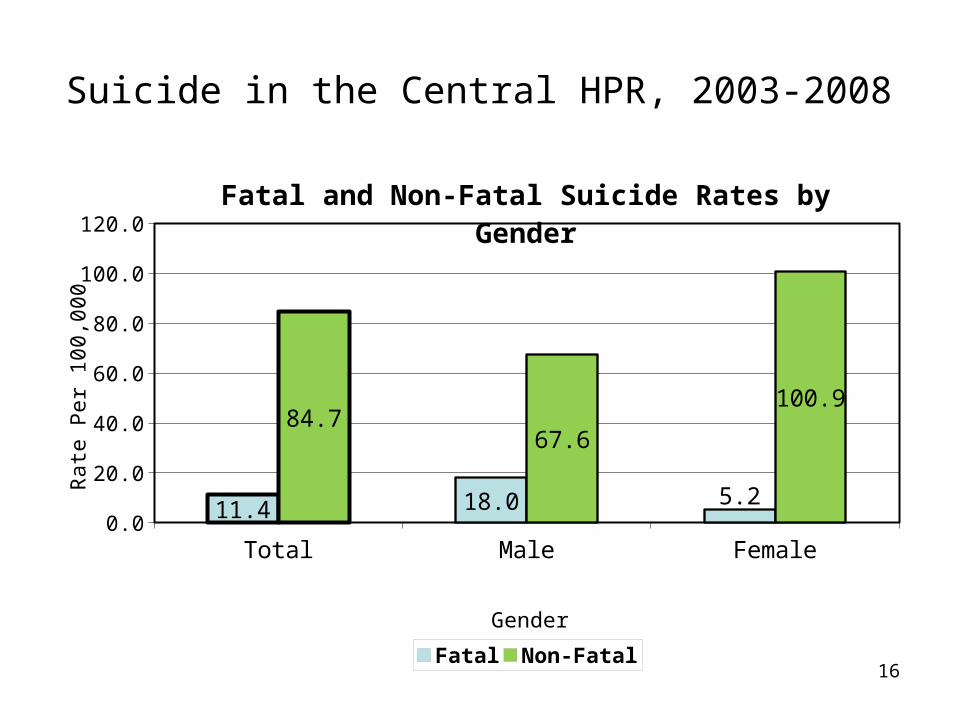
Total Male Female0.0
20.0
40.0
60.0
80.0
100.0
120.0
11.4 18.0 5.2
84.767.6
100.9
Fatal and Non-Fatal Suicide Rates by Gender
Fatal Non-Fatal
Gender
Ra
te P
er
10
0,0
00
17
Suicide in the Central HPR, 2003-2008
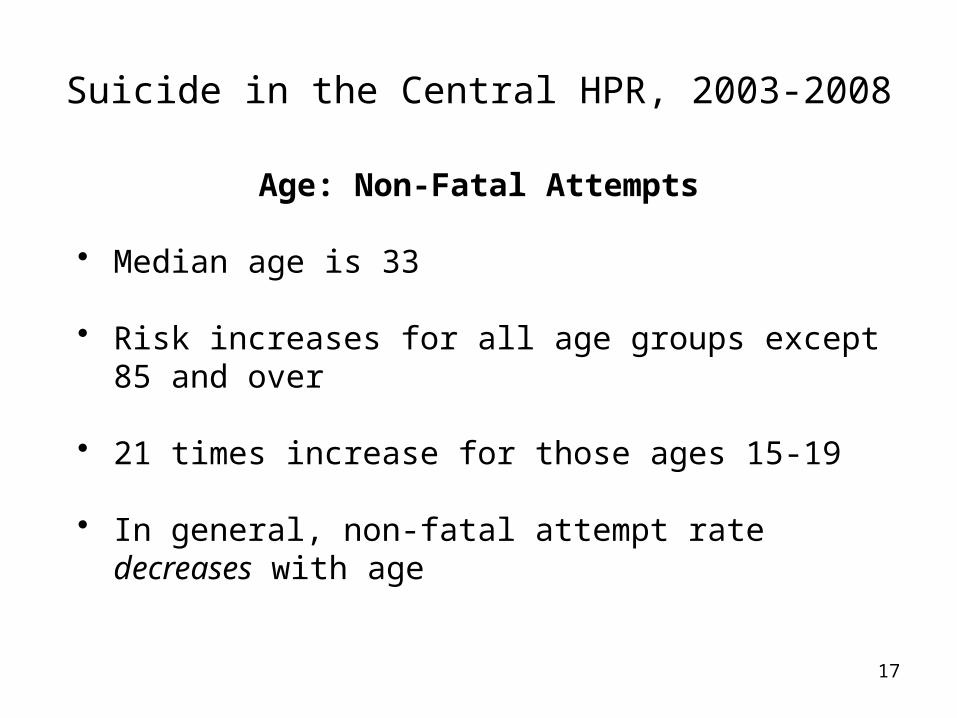
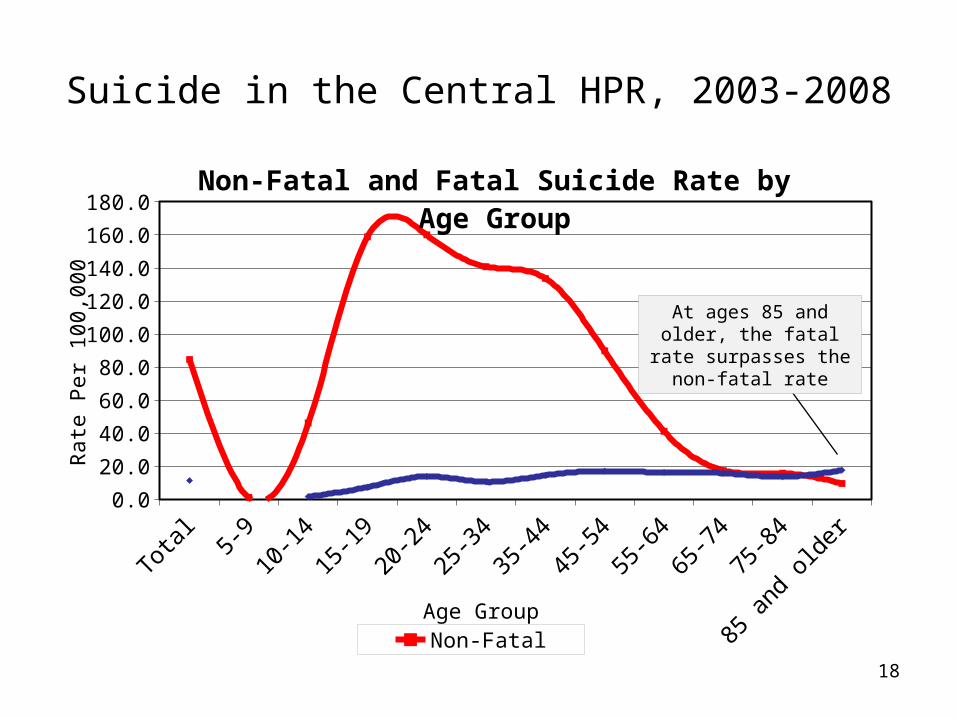
Age: Non-Fatal Attempts
• Median age is 33
• Risk increases for all age groups except 85 and over
• 21 times increase for those ages 15-19
• In general, non-fatal attempt rate decreases with age
18
Suicide in the Central HPR, 2003-2008
Total 5-
910
-14
15-1
920
-24
25-3
435
-44
45-5
455
-64
65-7
475
-84
85 a
nd o
lder
0.0
20.0
40.0
60.0
80.0
100.0
120.0
140.0
160.0
180.0Non-Fatal and Fatal Suicide Rate by Age Group
Non-Fatal Fatal
Age Group
Ra
te P
er
10
0,0
00
At ages 85 and older, the fatal rate surpasses
the non-fatal rate
19
Suicide in the Central HPR, 2003-2008
Veterans
20
Suicide in the Central HPR, 2003-2008
Veterans
• 22% of all suicide victims (18 years and older)
• 21% of males; 1% of all females
• Unknown if veterans served in combat, but can generally tell if they are currently in the military
21
Suicide in the Central HPR, 2003-2008
Veterans
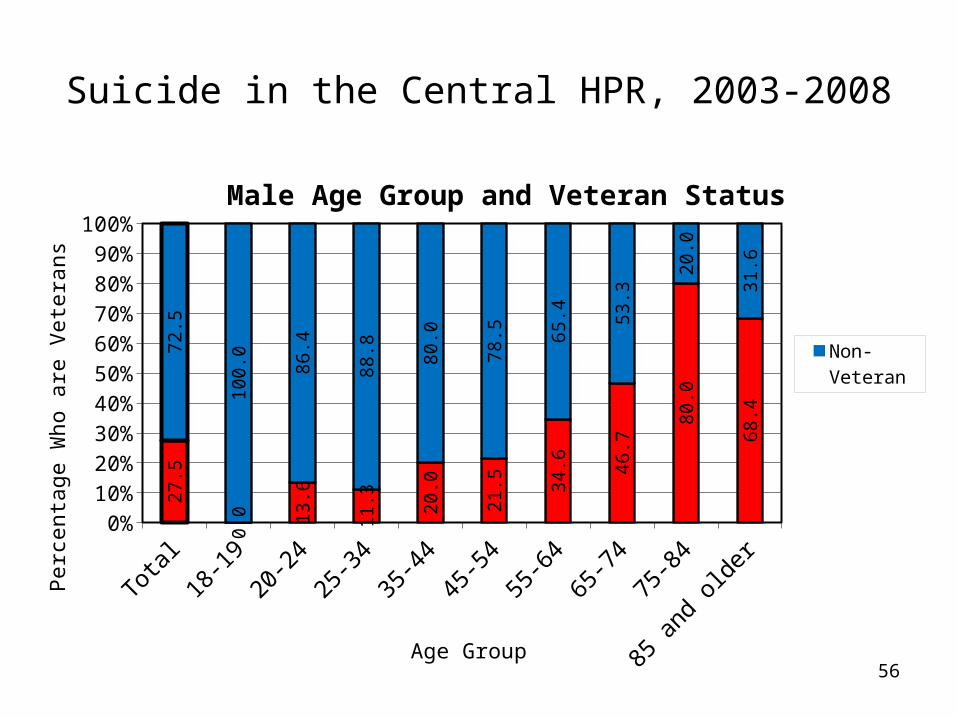
• Male veterans older than male non-veterans (median ages of 58 and 44, respectively)
• Median age suggests that those who are combat veterans generally not in the most recent conflicts
• 61% of males ages 65 and over are veterans compared to 20% of males ages 18-64
22
Suicide in the Central HPR, 2003-2008
Method of Fatal Injury
23
Suicide in the Central HPR, 2003-2008
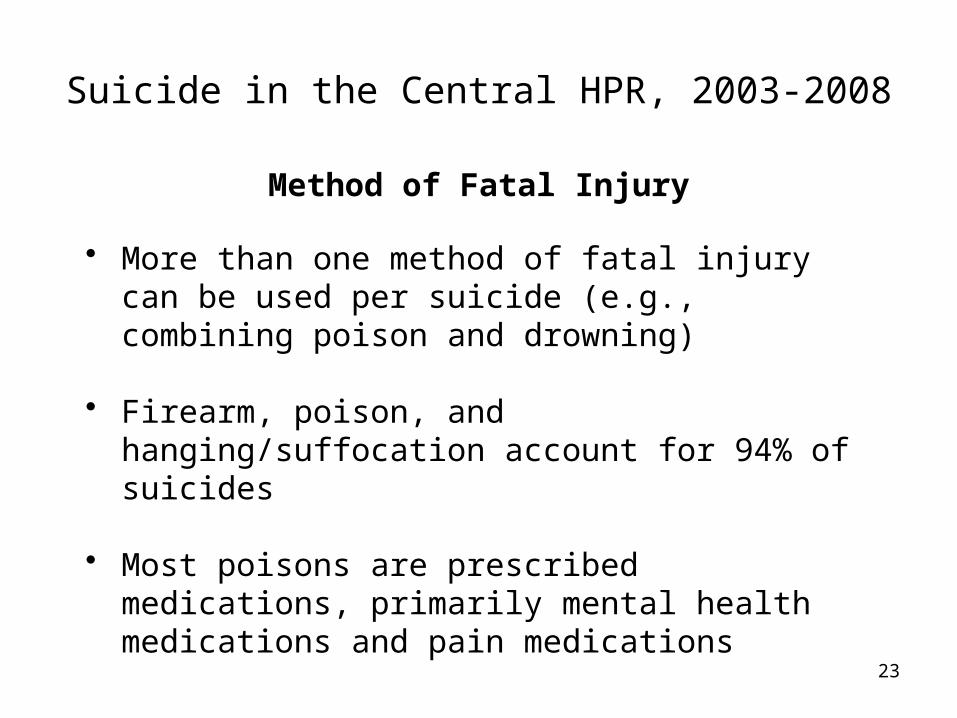
Method of Fatal Injury
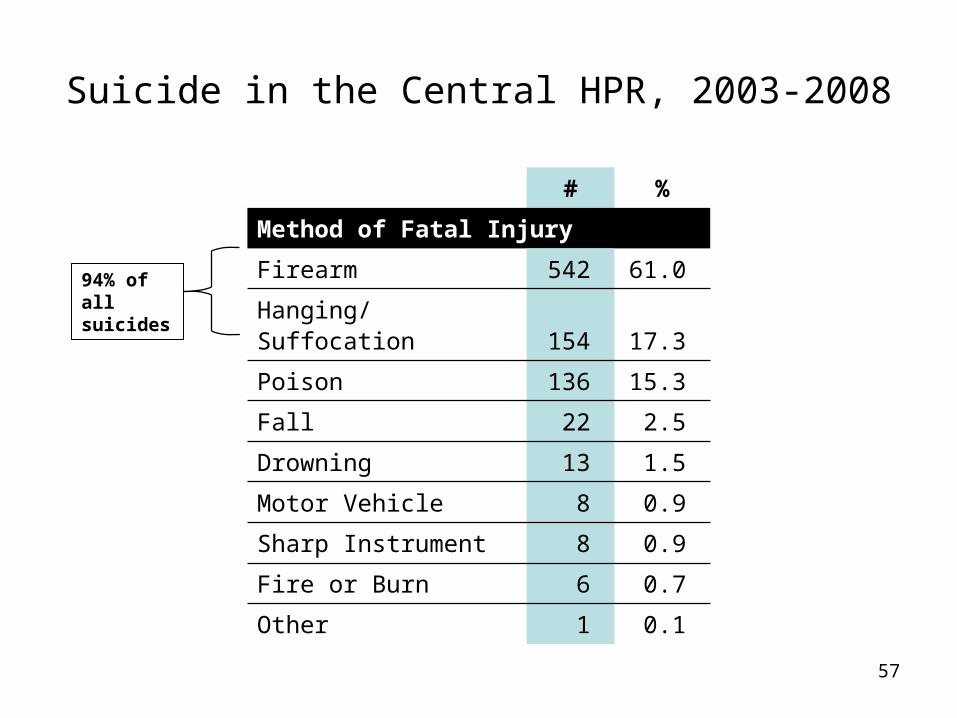
• More than one method of fatal injury can be used per suicide (e.g., combining poison and drowning)
• Firearm, poison, and hanging/suffocation account for 94% of suicides
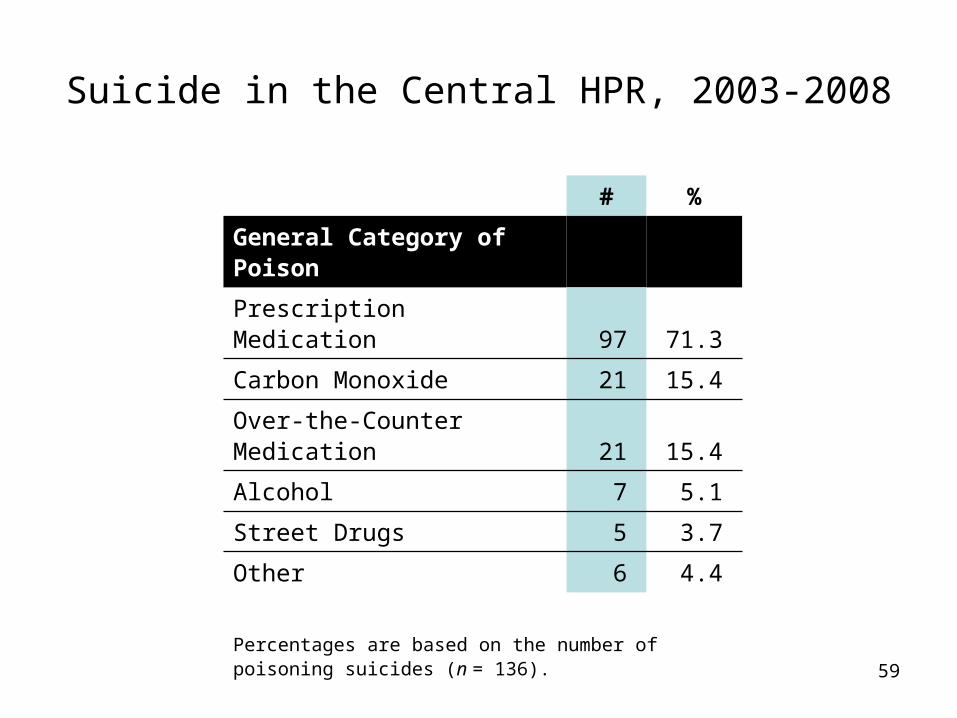
• Most poisons are prescribed medications, primarily mental health medications and pain medications
24
Suicide in the Central HPR, 2003-2008
Total Males Females0.0
10.0
20.0
30.0
40.0
50.0
60.0
70.0
80.0
90.0
100.0
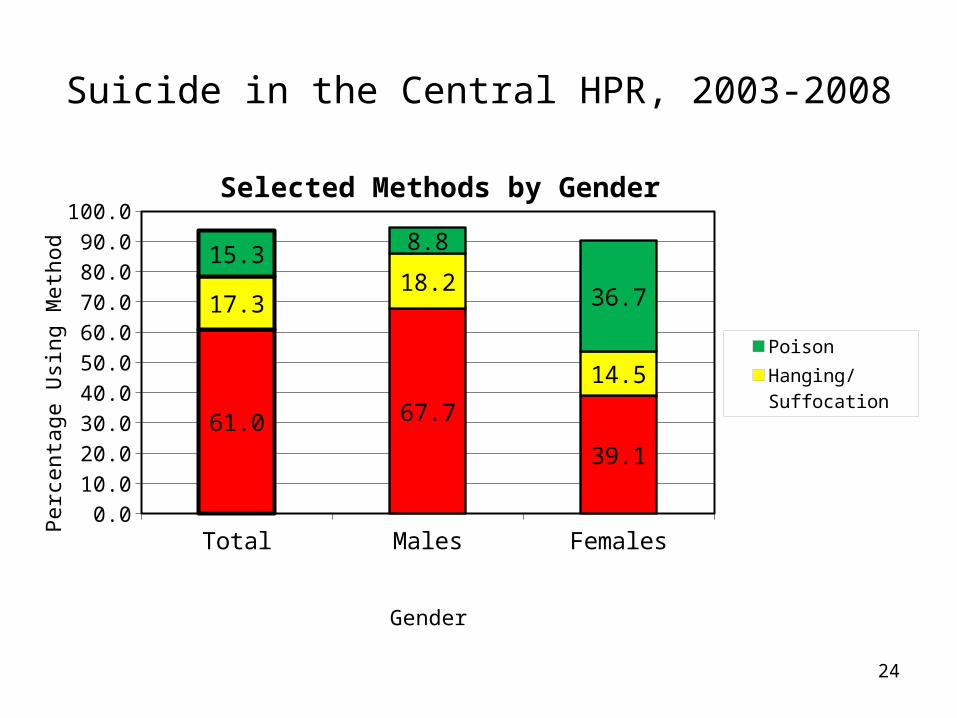
61.0 67.7
39.1
17.318.2
14.5
15.3 8.8
36.7
Selected Methods by Gender
Poison
Hanging/Suffocation
Firearm
Gender
Pe
rce
nta
ge
Usi
ng
Me
tho
d
25
Suicide in the Central HPR, 2003-2008
Method of Fatal Injury: Non-Fatal Attempts
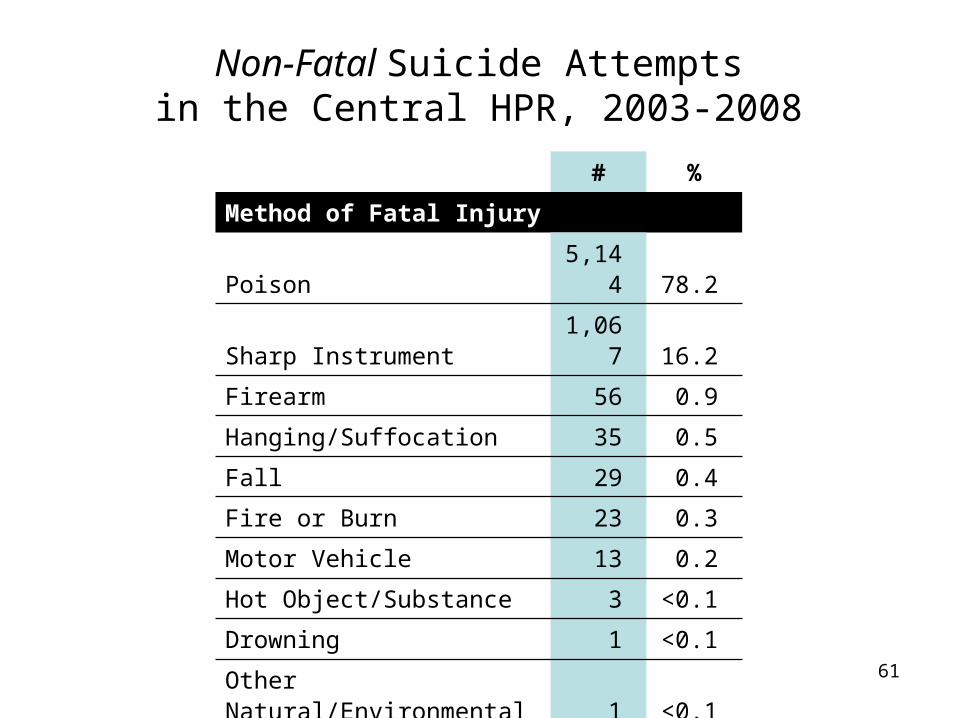
• Most common method for non-fatal attempts is poison (78%)
• Poison use is defining method difference between fatal and non-fatal attempts
26
Suicide in the Central HPR, 2003-2008
Geography
27
Suicide in the Central HPR, 2003-2008
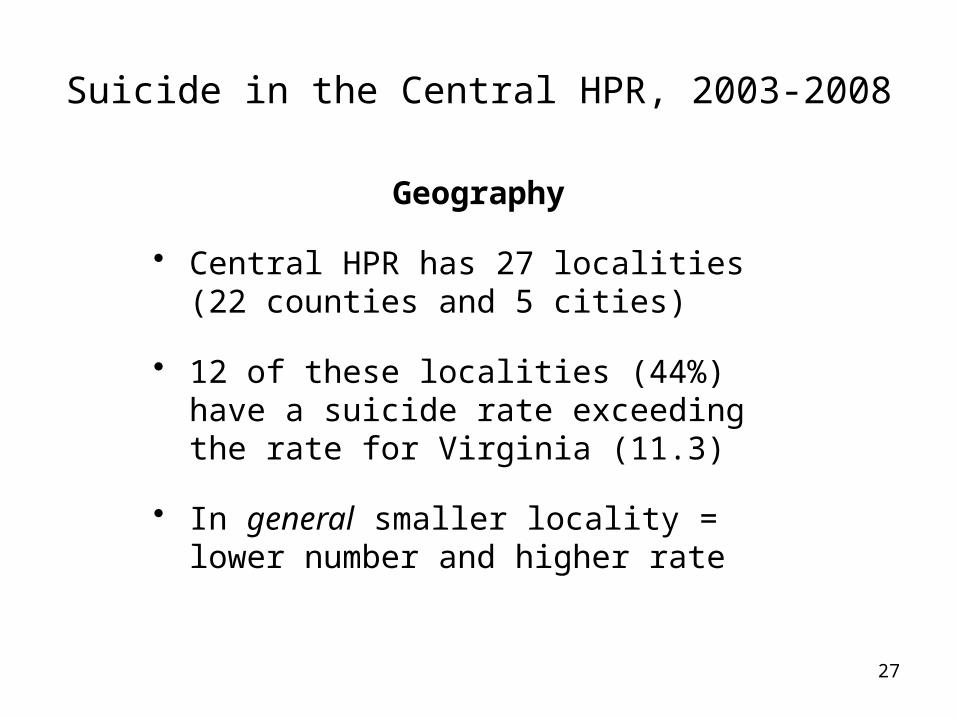
Geography
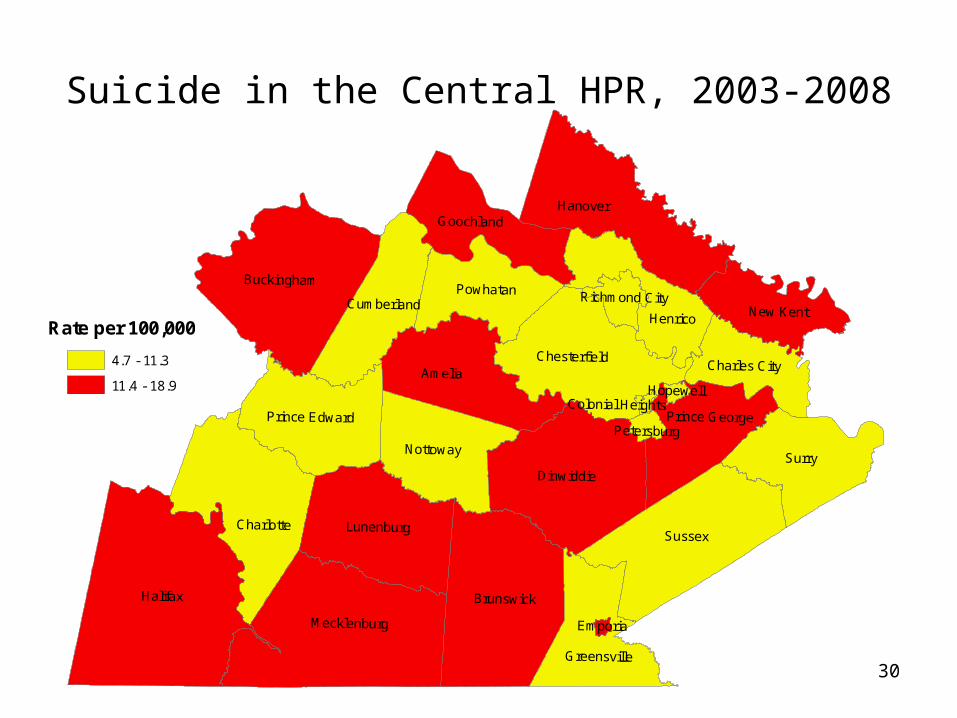
• Central HPR has 27 localities (22 counties and 5 cities)
• 12 of these localities (44%) have a suicide rate exceeding the rate for Virginia (11.3)
• In general smaller locality = lower number and higher rate
28
Suicide in the Central HPR, 2003-2008
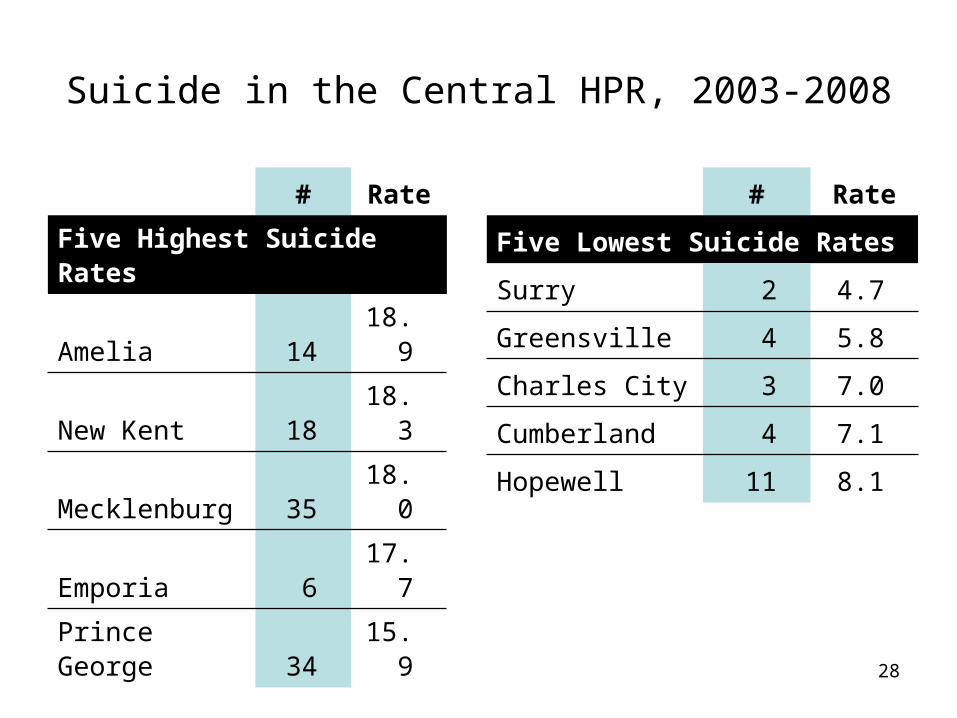
# Rate
Five Highest Suicide Rates
Amelia 14 18.9
New Kent 18 18.3
Mecklenburg 35 18.0
Emporia 6 17.7
Prince George 34 15.9
# Rate
Five Lowest Suicide Rates
Surry 2 4.7
Greensville 4 5.8
Charles City 3 7.0
Cumberland 4 7.1
Hopewell 11 8.1
29
Suicide in the Central HPR, 2003-2008
Halifax
Sussex
Surry
Hanover
Brunswick
Mecklenburg
Charlotte
Amelia
Dinwiddie
Buckingham
Lunenburg
Chesterfield
Nottoway
Henrico
Greensville
Goochland
Powhatan
Prince Edward
New Kent
Prince George
Charles City
CumberlandRichmond City
Petersburg
Hopewell
Emporia
Colonial Heights
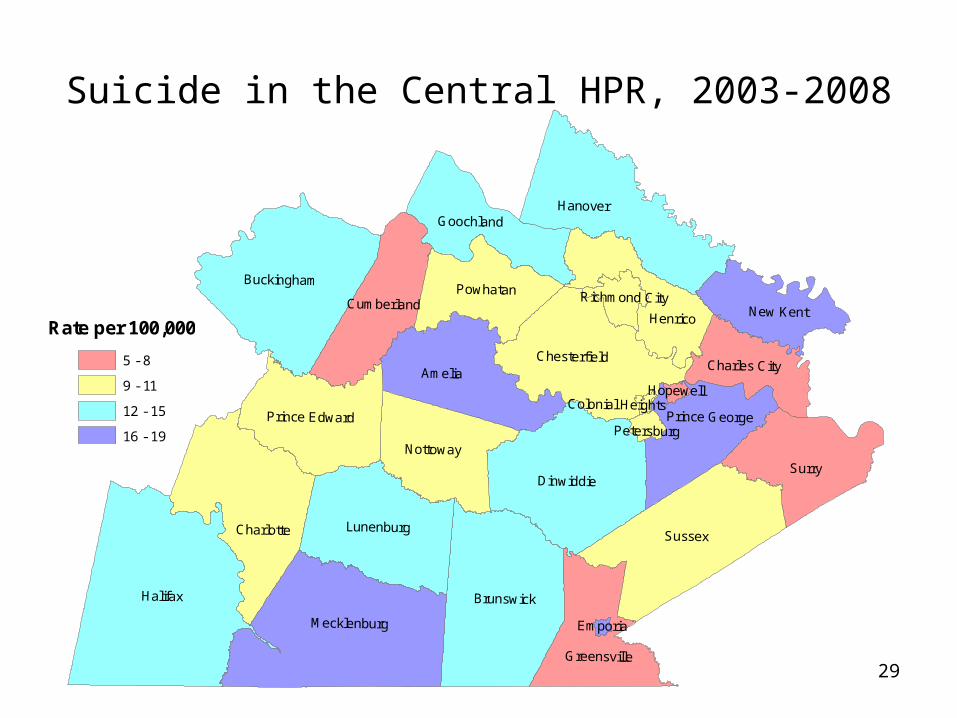
Rate per 100,000
5 - 8
9 - 11
12 - 15
16 - 19
30
Suicide in the Central HPR, 2003-2008
Halifax
Sussex
Surry
Hanover
Brunswick
Mecklenburg
Charlotte
Amelia
Dinwiddie
Buckingham
Lunenburg
Chesterfield
Nottoway
Henrico
Greensville
Goochland
Powhatan
Prince Edward
New Kent
Prince George
Charles City
CumberlandRichmond City
Petersburg
Hopewell
Emporia
Colonial Heights
Rate per 100,000
4.7 - 11.3
11.4 - 18.9
31
Suicide in the Central HPR, 2003-2008
Selected Circumstances
32
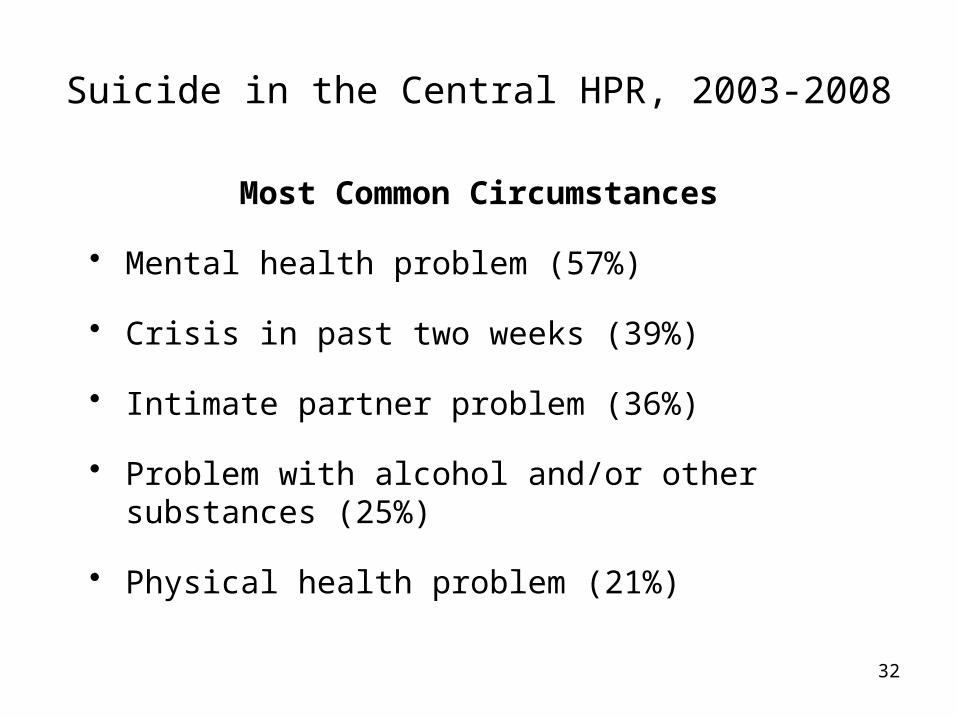
Suicide in the Central HPR, 2003-2008
Most Common Circumstances
• Mental health problem (57%)
• Crisis in past two weeks (39%)
• Intimate partner problem (36%)
• Problem with alcohol and/or other substances (25%)
• Physical health problem (21%)
33
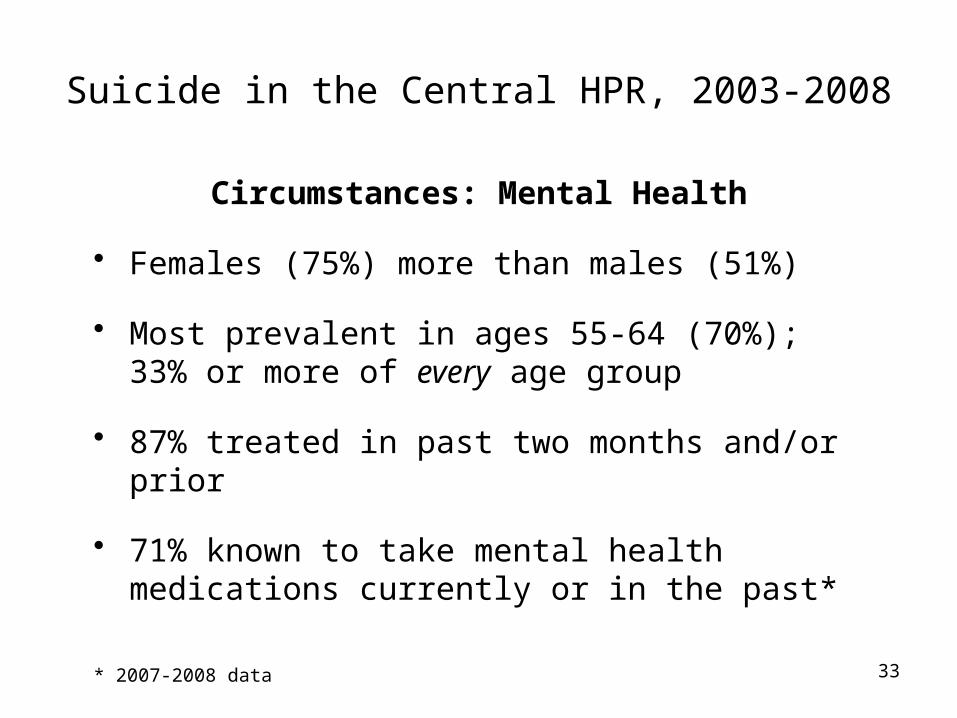
Suicide in the Central HPR, 2003-2008
Circumstances: Mental Health
• Females (75%) more than males (51%)
• Most prevalent in ages 55-64 (70%); 33% or more of every age group
• 87% treated in past two months and/or prior
• 71% known to take mental health medications currently or in the past*
* 2007-2008 data
34
Suicide in the Central HPR, 2003-2008
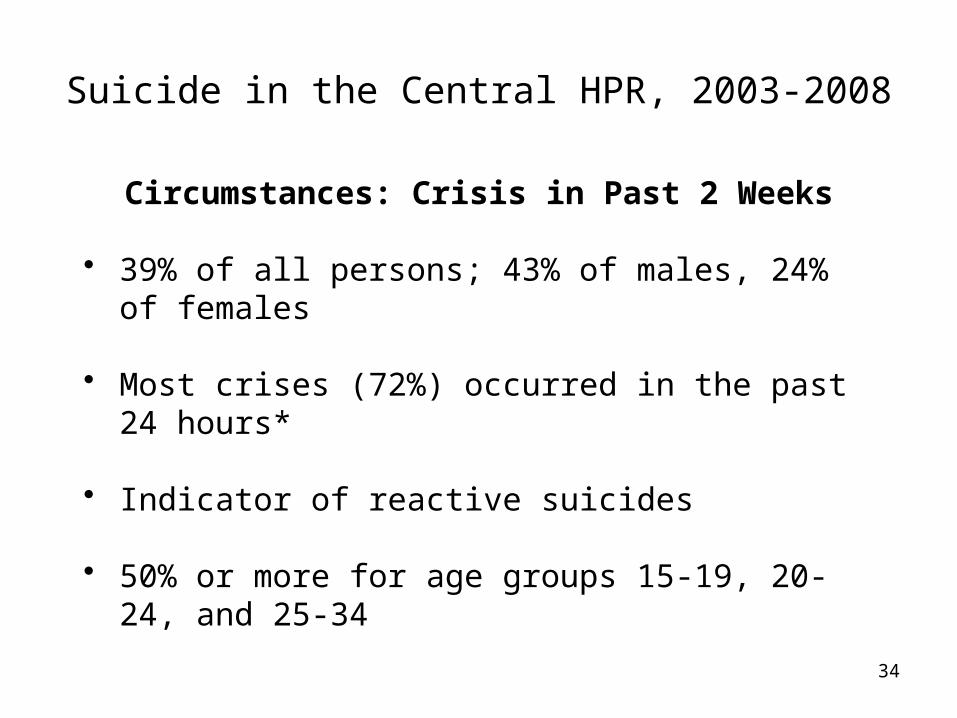
Circumstances: Crisis in Past 2 Weeks
• 39% of all persons; 43% of males, 24% of females
• Most crises (72%) occurred in the past 24 hours*
• Indicator of reactive suicides
• 50% or more for age groups 15-19, 20-24, and 25-34
*2007-2008 data
35
Suicide in the Central HPR, 2003-2008
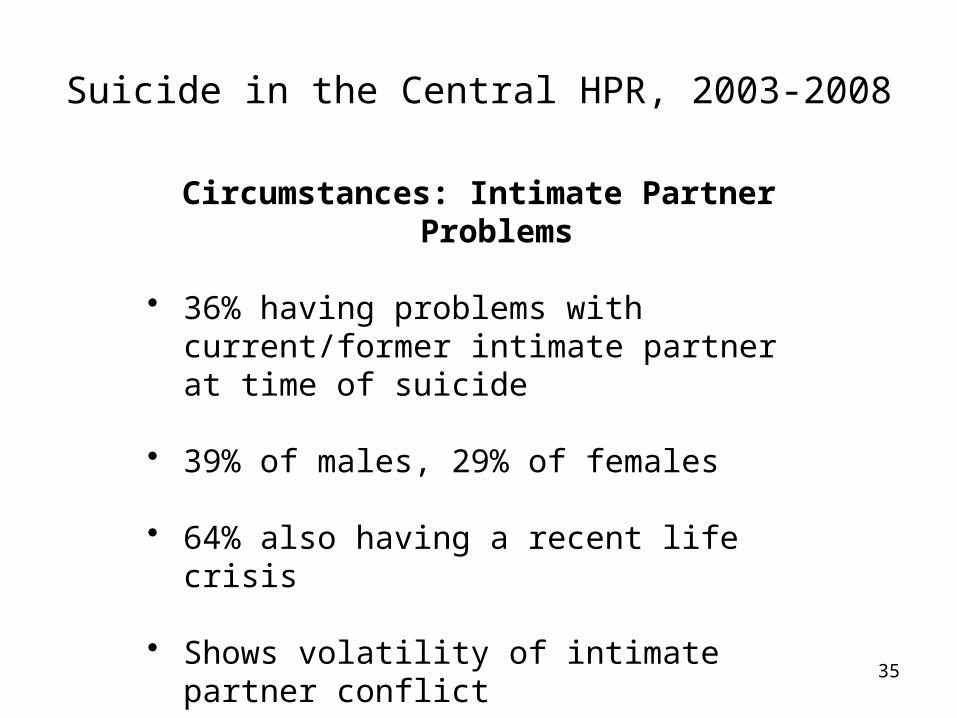
Circumstances: Intimate Partner Problems
• 36% having problems with current/former intimate partner at time of suicide
• 39% of males, 29% of females
• 64% also having a recent life crisis
• Shows volatility of intimate partner conflict
36
Suicide in the Central HPR, 2003-2008
Total
10-1
415
-19
20-2
425
-34
35-4
445
-54
55-6
465
-74
75-8
4
85 a
nd o
lder
0.0
10.0
20.0
30.0
40.0
50.0
60.0
70.0
80.0
90.0
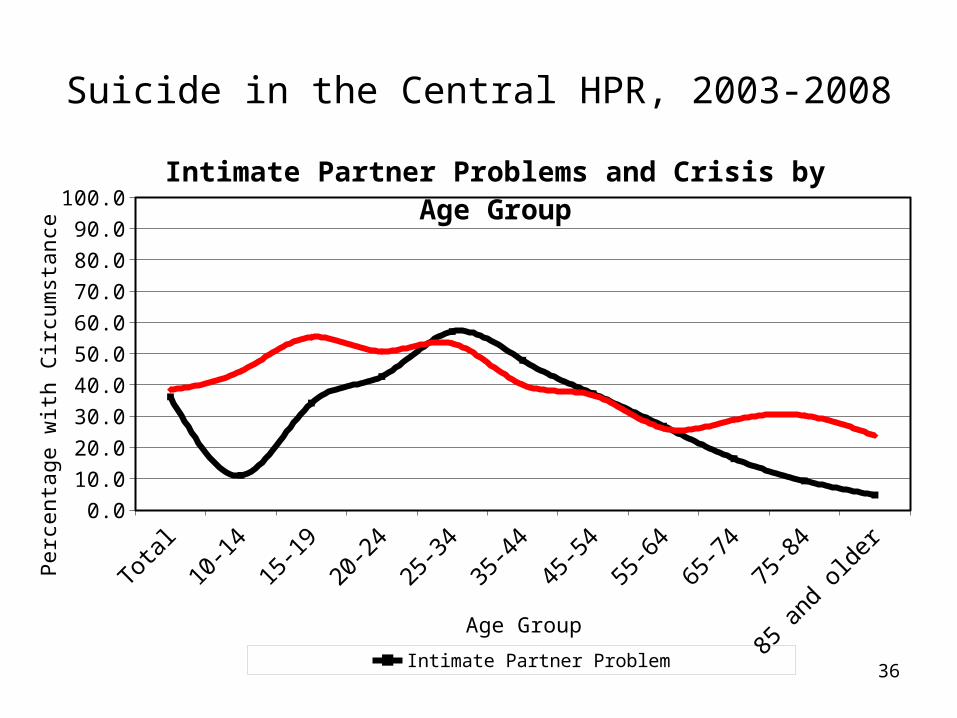
100.0Intimate Partner Problems and Crisis by Age Group
Intimate Partner Problem Crisis in Past 2 Weeks
Age Group
Pe
rce
nta
ge
with
Cir
cum
sta
nce
37
Suicide in the Central HPR, 2003-2008
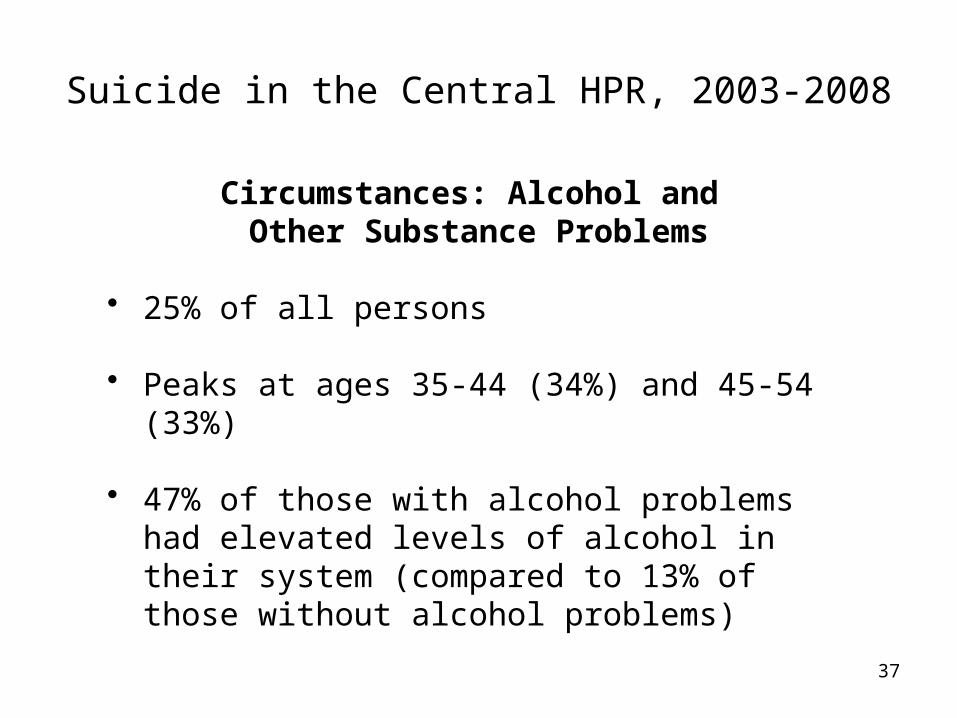
Circumstances: Alcohol and Other Substance Problems
• 25% of all persons
• Peaks at ages 35-44 (34%) and 45-54 (33%)
• 47% of those with alcohol problems had elevated levels of alcohol in their system (compared to 13% of those without alcohol problems)
38
Suicide in the Central HPR, 2003-2008
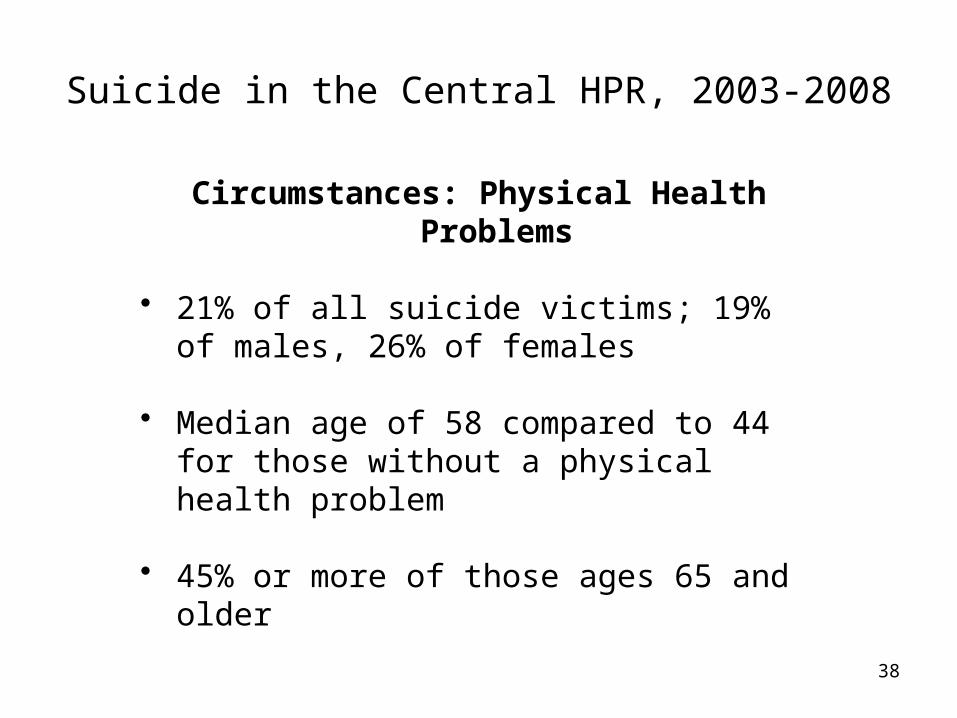
Circumstances: Physical Health Problems
• 21% of all suicide victims; 19% of males, 26% of females
• Median age of 58 compared to 44 for those without a physical health problem
• 45% or more of those ages 65 and older
39
Suicide in the Central HPR, 2003-2008
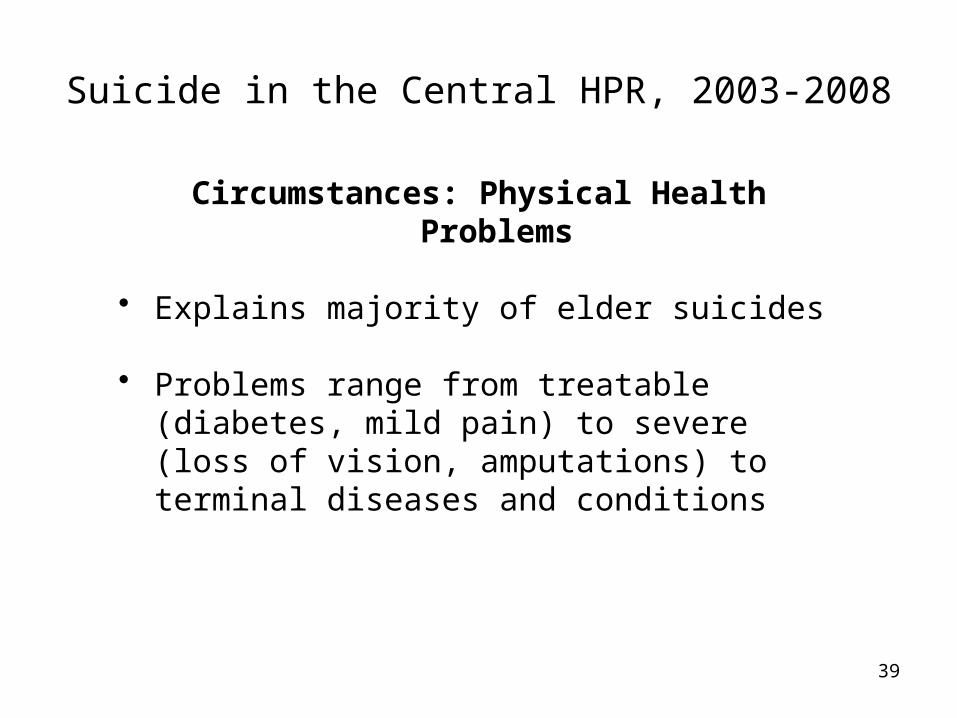
Circumstances: Physical Health Problems
• Explains majority of elder suicides
• Problems range from treatable (diabetes, mild pain) to severe (loss of vision, amputations) to terminal diseases and conditions
40
Suicide in the Central HPR, 2003-2008
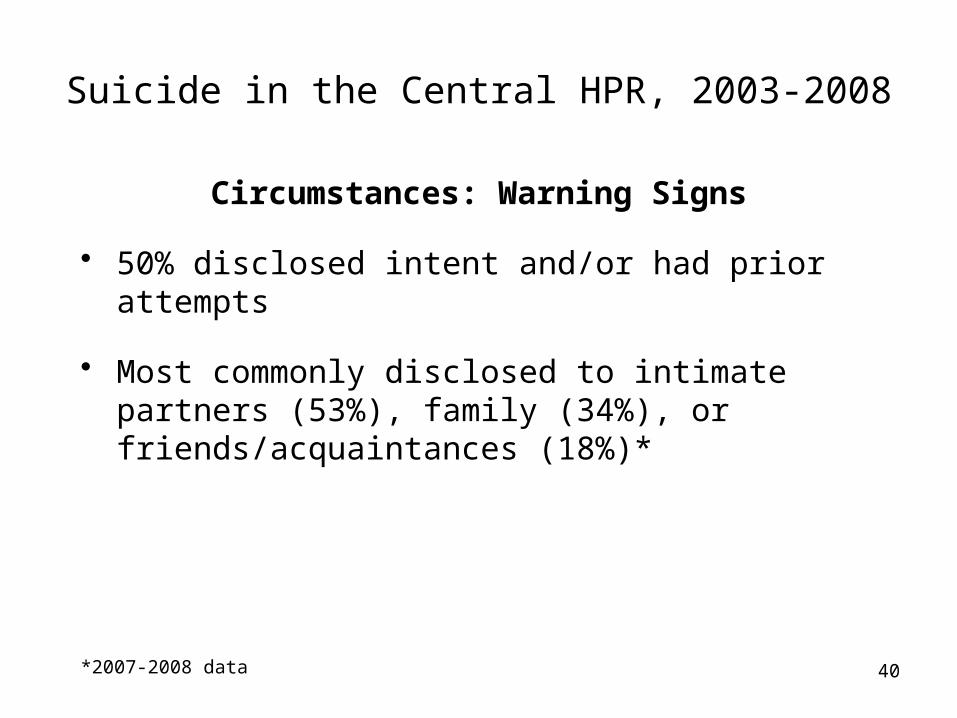
Circumstances: Warning Signs
• 50% disclosed intent and/or had prior attempts
• Most commonly disclosed to intimate partners (53%), family (34%), or friends/acquaintances (18%)*
*2007-2008 data
41
Suicide in the Central HPR, 2007-2008
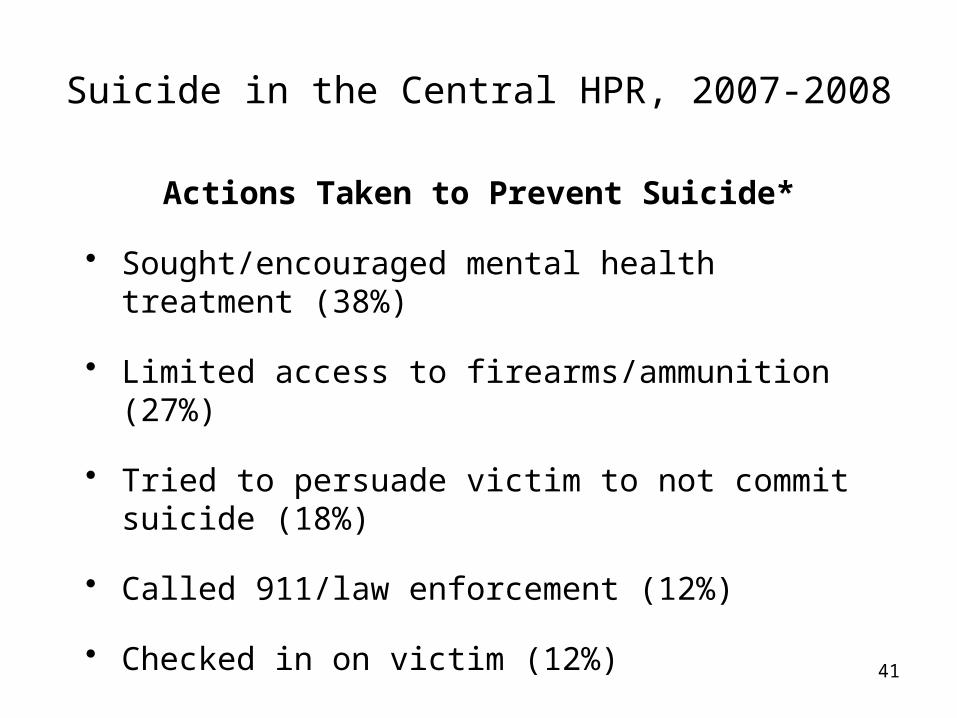
Actions Taken to Prevent Suicide*
• Sought/encouraged mental health treatment (38%)
• Limited access to firearms/ammunition (27%)
• Tried to persuade victim to not commit suicide (18%)
• Called 911/law enforcement (12%)
• Checked in on victim (12%)
*2007-2008 data (entire slide)
42
Suicide in the Central HPR, 2007-2008
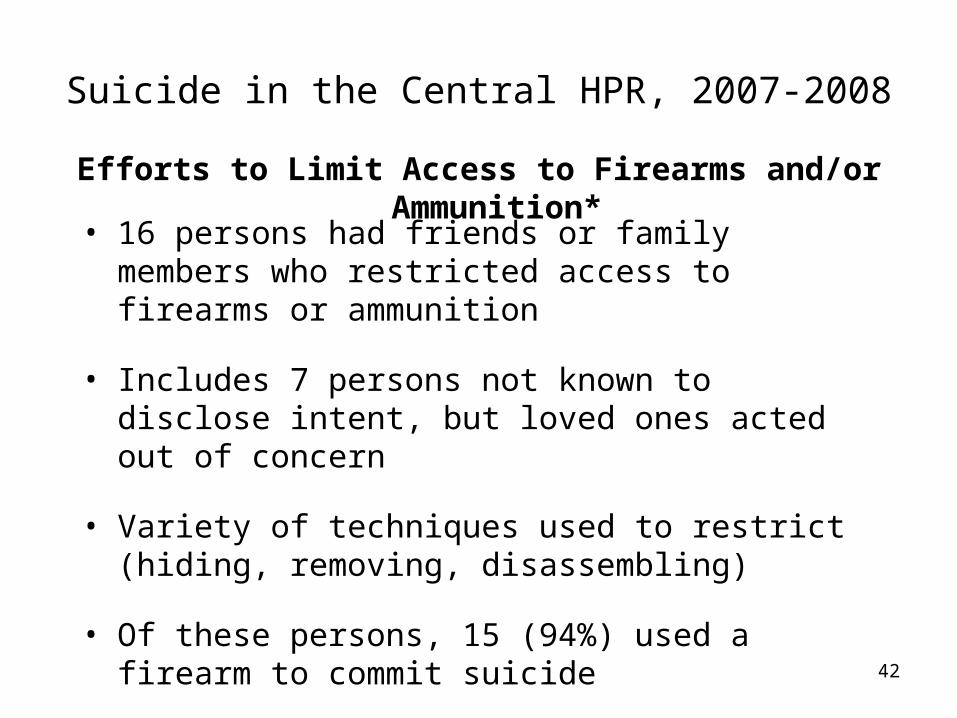
Efforts to Limit Access to Firearms and/or Ammunition*
• 16 persons had friends or family members who restricted access to firearms or ammunition
• Includes 7 persons not known to disclose intent, but loved ones acted out of concern
• Variety of techniques used to restrict (hiding, removing, disassembling)
• Of these persons, 15 (94%) used a firearm to commit suicide
*2007-2008 data (entire slide)
43
Suicide in the Central HPR, 2003-2008
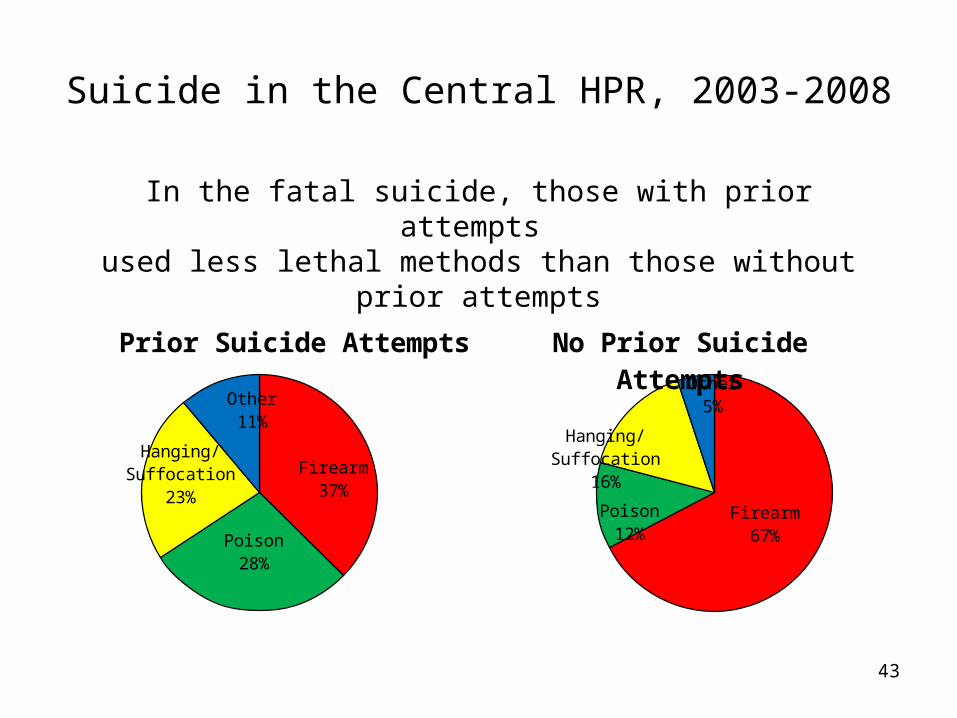
In the fatal suicide, those with prior attempts used less lethal methods than those without prior attempts
Firearm67%
Poison12%
Hanging/Suffocation
16%
Other5%
No Prior Suicide Attempts
Firearm37%
Poison28%
Hanging/Suffocation
23%
Other11%
Prior Suicide Attempts
44
Suicide in the Central HPR, 2007-2008
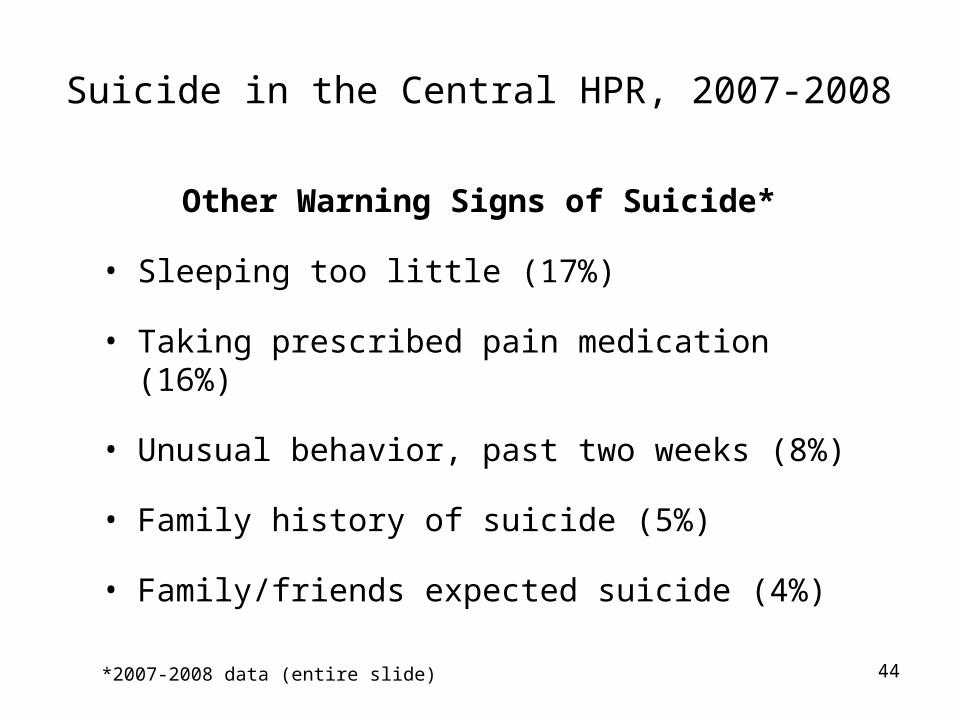
Other Warning Signs of Suicide*
• Sleeping too little (17%)
• Taking prescribed pain medication (16%)
• Unusual behavior, past two weeks (8%)
• Family history of suicide (5%)
• Family/friends expected suicide (4%)
*2007-2008 data (entire slide)
45
Suicide in the Central HPR, 2003-2008
Conclusions
• Suicide rates are highest among Whites, males, and middle-aged and older adults
• Most suicides involve use of a firearm to inflict fatal injury
• The majority of suicide victims have a mental health problem, and most of these persons were being treated
46
Suicide in the Central HPR, 2003-2008
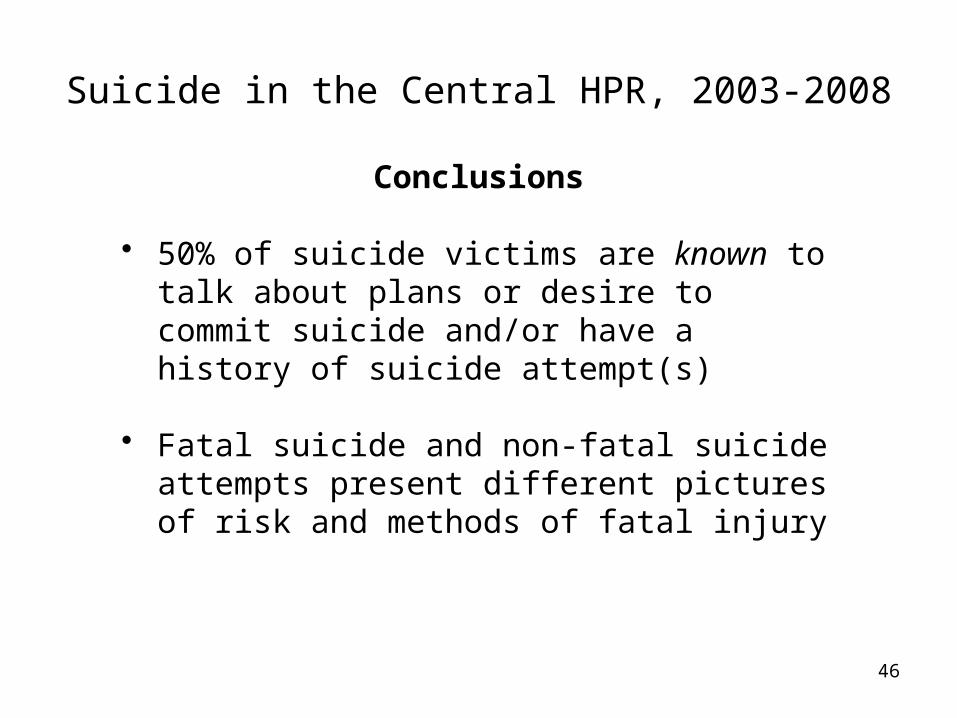
Conclusions
• 50% of suicide victims are known to talk about plans or desire to commit suicide and/or have a history of suicide attempt(s)
• Fatal suicide and non-fatal suicide attempts present different pictures of risk and methods of fatal injury
47
Questions, Data Requests, Further Information
Marc Leslie, VVDRS Coordinator
737 N. 5th Street, Suite 301Richmond, VA 23219
804-205-3855
http://www.vdh.virginia.gov/medExam/NVDRS.htm
Our goal is to provide data and information that can be used for prevention and education; please let me know how I can help

48
Appendix: Additional Information and Complete Tables
49
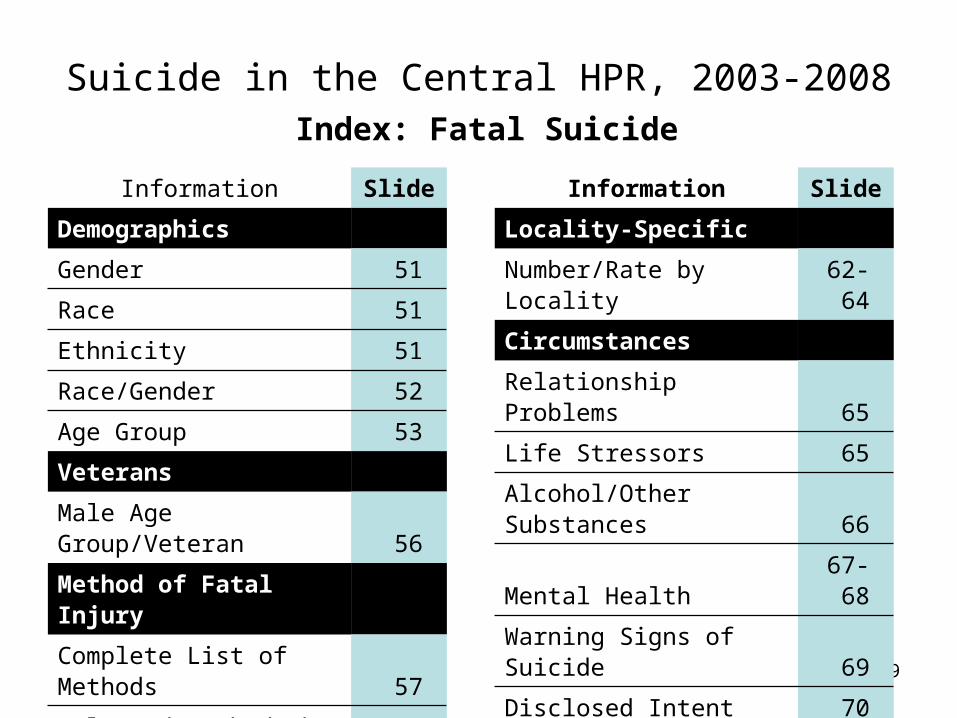
Suicide in the Central HPR, 2003-2008
Information Slide
Demographics
Gender 51
Race 51
Ethnicity 51
Race/Gender 52
Age Group 53
Veterans
Male Age Group/Veteran 56
Method of Fatal Injury
Complete List of Methods 57
Selected Methods by Age 58
Categories of Poison 59
Most Common Poisons 60
Information Slide
Locality-Specific
Number/Rate by Locality 62-64
Circumstances
Relationship Problems 65
Life Stressors 65
Alcohol/Other Substances 66
Mental Health 67-68
Warning Signs of Suicide 69
Disclosed Intent 70
Actions to Prevent Suicide 71-72
Prior Suicide Attempts 73
Other Warning Signs 74
Index: Fatal Suicide
50
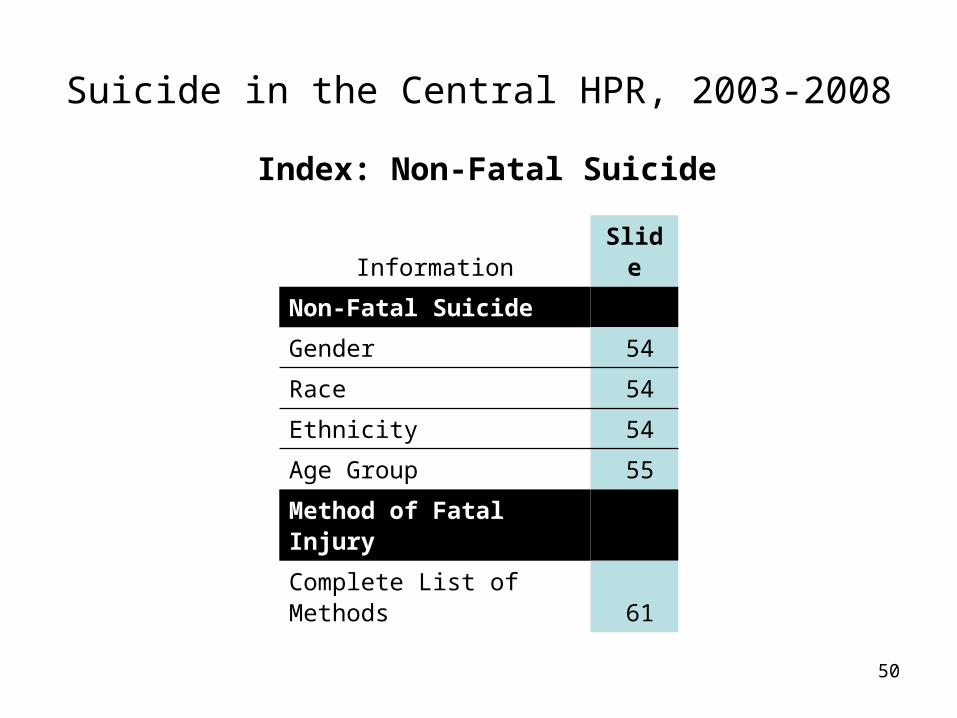
Suicide in the Central HPR, 2003-2008
Information Slide
Non-Fatal Suicide
Gender 54
Race 54
Ethnicity 54
Age Group 55
Method of Fatal Injury
Complete List of Methods 61
Index: Non-Fatal Suicide
51
Suicide in the Central HPR, 2003-2008
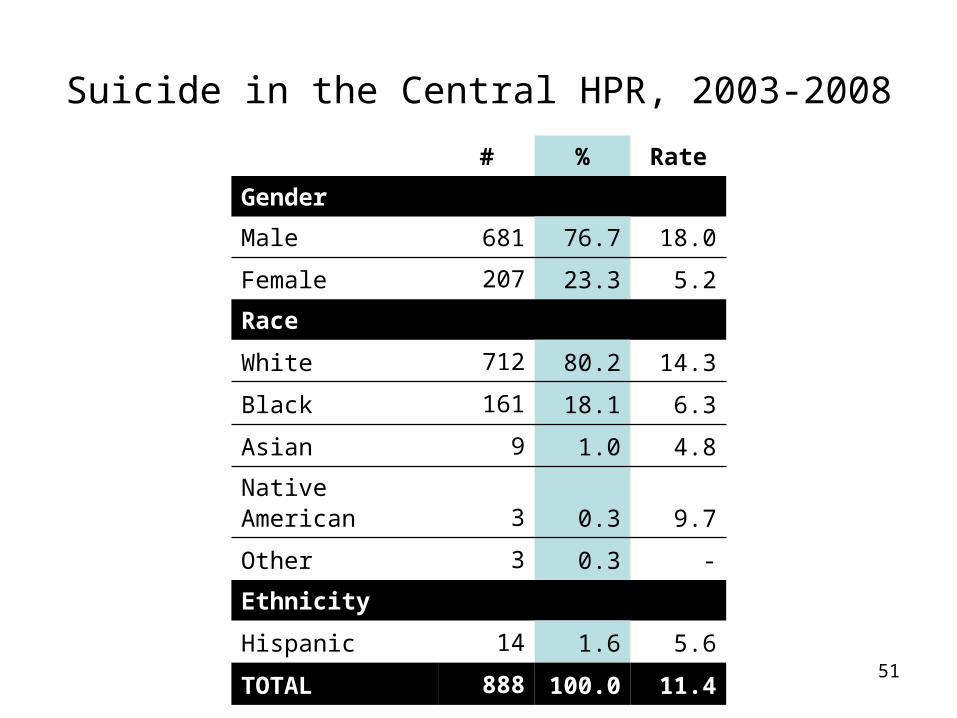
# % Rate
Gender
Male 681 76.7 18.0
Female 207 23.3 5.2
Race
White 712 80.2 14.3
Black 161 18.1 6.3
Asian 9 1.0 4.8
Native American 3 0.3 9.7
Other 3 0.3 -
Ethnicity
Hispanic 14 1.6 5.6
TOTAL 888 100.0 11.4
52
Suicide in the Central HPR, 2003-2008
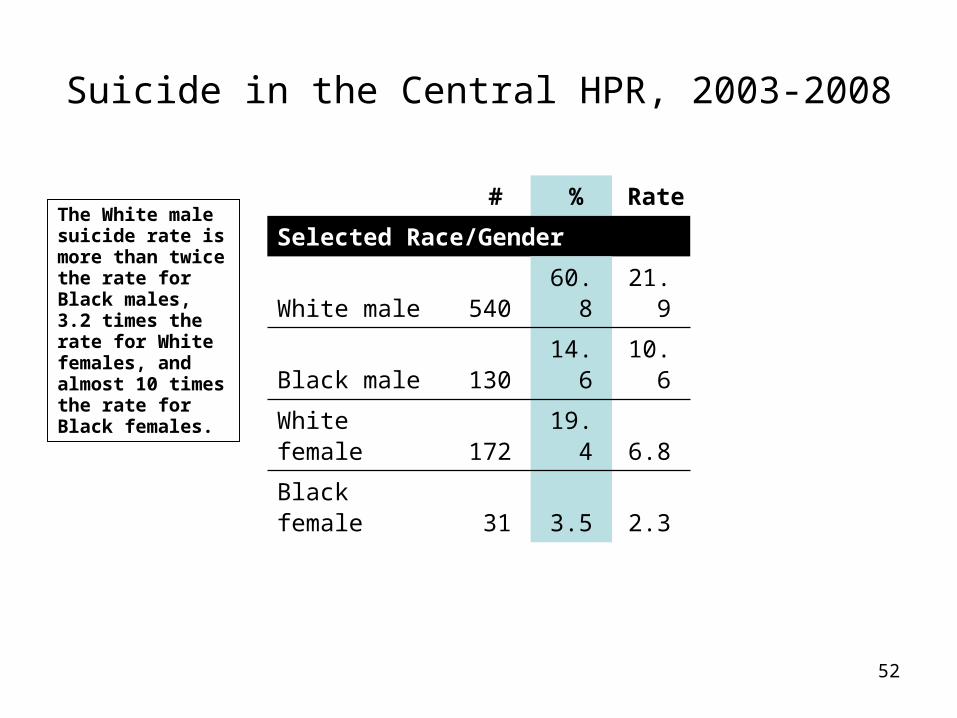
# % Rate
Selected Race/Gender
White male 540 60.8 21.9
Black male 130 14.6 10.6
White female 172 19.4 6.8
Black female 31 3.5 2.3
The White male suicide rate is more than twice the rate for Black males, 3.2 times the rate for White females, and almost 10 times the rate for Black females.
53
Suicide in the Central HPR, 2003-2008
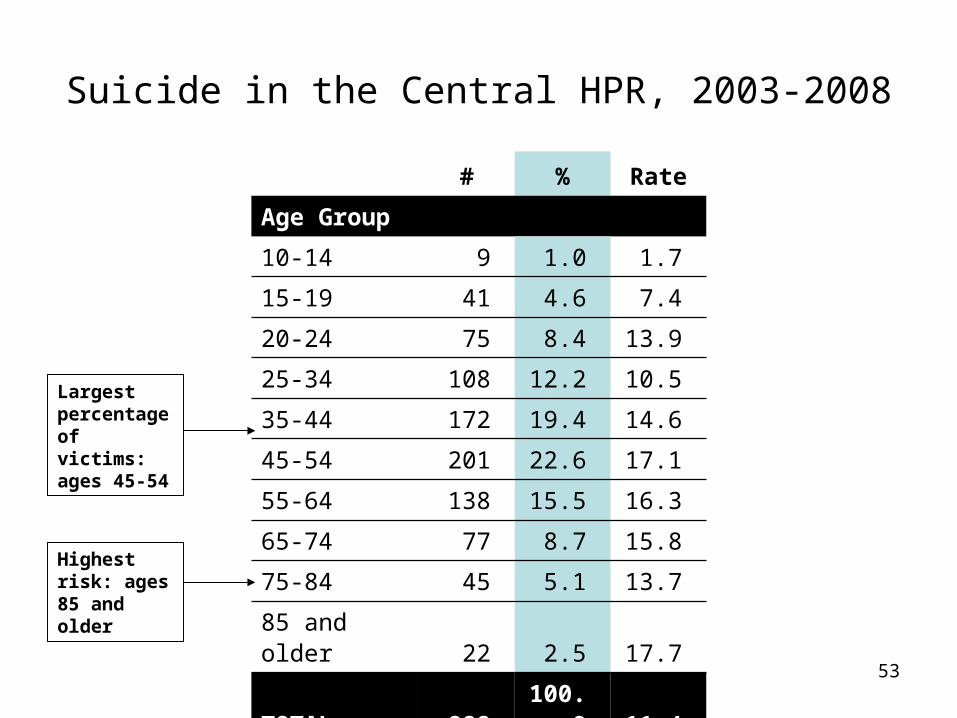
# % Rate
Age Group
10-14 9 1.0 1.7
15-19 41 4.6 7.4
20-24 75 8.4 13.9
25-34 108 12.2 10.5
35-44 172 19.4 14.6
45-54 201 22.6 17.1
55-64 138 15.5 16.3
65-74 77 8.7 15.8
75-84 45 5.1 13.7
85 and older 22 2.5 17.7
TOTAL 888 100.0 11.4
Highest risk: ages 85 and older
Largest percentage of victims: ages 45-54
54
Non-Fatal Suicide Attempts in the Central HPR, 2003-2008
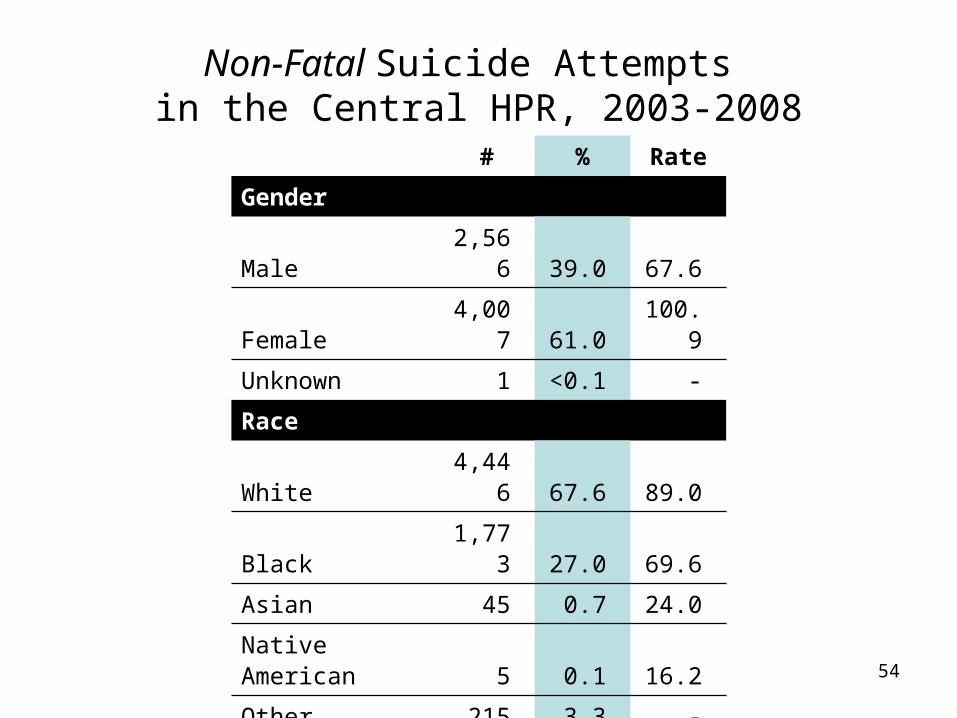
# % Rate
Gender
Male 2,566 39.0 67.6
Female 4,007 61.0 100.9
Unknown 1 <0.1 -
Race
White 4,446 67.6 89.0
Black 1,773 27.0 69.6
Asian 45 0.7 24.0
Native American 5 0.1 16.2
Other 215 3.3 -
Unknown 90 1.4 -
Ethnicity
Hispanic 142 2.2 57.0
TOTAL 6,574 100.0 84.7
55
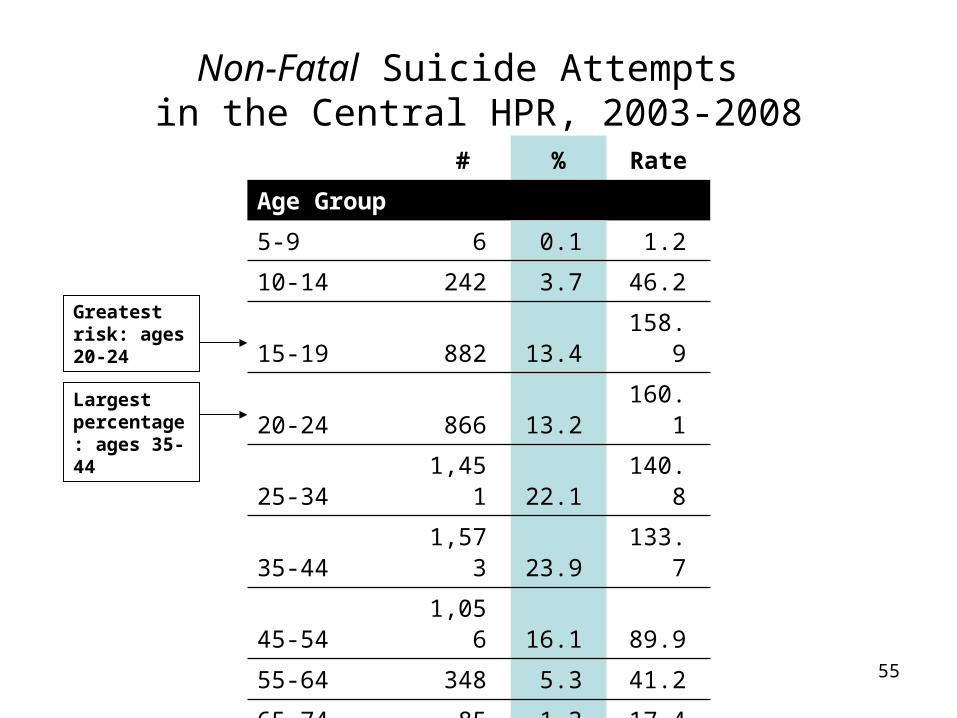
Non-Fatal Suicide Attempts in the Central HPR, 2003-2008
# % Rate
Age Group
5-9 6 0.1 1.2
10-14 242 3.7 46.2
15-19 882 13.4 158.9
20-24 866 13.2 160.1
25-34 1,451 22.1 140.8
35-44 1,573 23.9 133.7
45-54 1,056 16.1 89.9
55-64 348 5.3 41.2
65-74 85 1.3 17.4
75-84 52 0.8 15.8
85 and older 12 0.2 9.6
Unknown 1 <0.1 -
TOTAL 6,574 100.0 84.7
Largest percentage: ages 35-44
Greatest risk: ages 20-24
56
Suicide in the Central HPR, 2003-2008
Total
18-1
920
-24
25-3
435
-44
45-5
455
-64
65-7
475
-84
85 a
nd o
lder
0%
10%
20%
30%
40%
50%
60%
70%
80%
90%
100%
27
.5
0.0 1
3.6
11
.3 20
.0
21
.5 34
.6 46
.7
80
.0
68
.4
72
.5
10
0.0 86
.4
88
.8 80
.0
78
.5 65
.4 53
.3
20
.0
31
.6
Male Age Group and Veteran Status
Non-Veteran
Veteran
Age Group
Pe
rce
nta
ge
Wh
o a
re V
ete
ran
s
57
Suicide in the Central HPR, 2003-2008
# %
Method of Fatal Injury
Firearm 542 61.0
Hanging/Suffocation 154 17.3
Poison 136 15.3
Fall 22 2.5
Drowning 13 1.5
Motor Vehicle 8 0.9
Sharp Instrument 8 0.9
Fire or Burn 6 0.7
Other 1 0.1
94% of all suicides
58
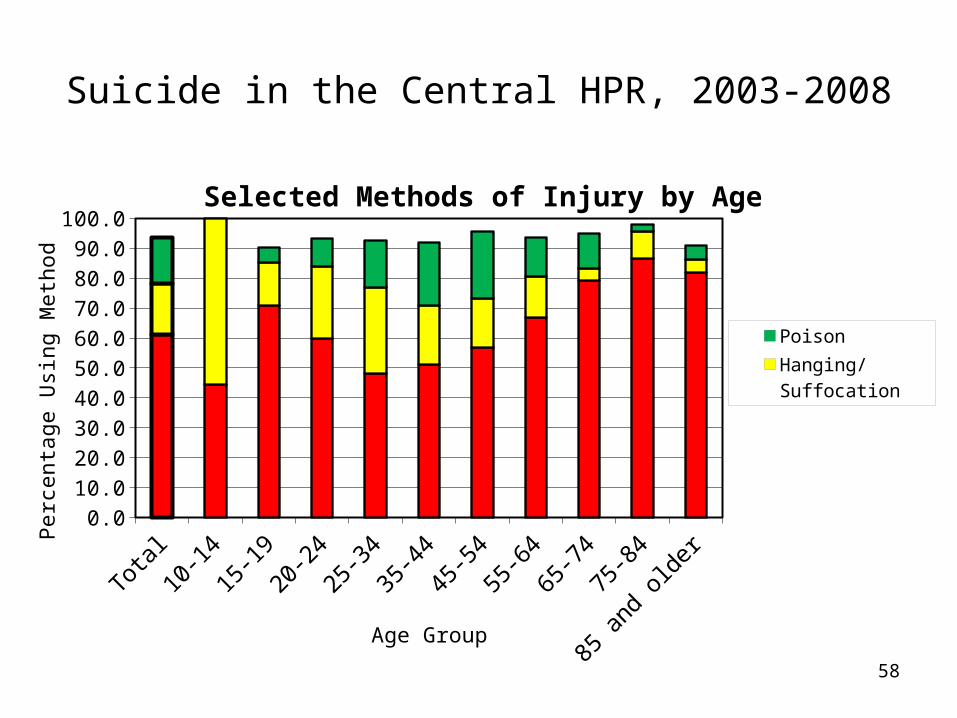
Suicide in the Central HPR, 2003-2008
Total
10-1
415
-19
20-2
425
-34
35-4
445
-54
55-6
465
-74
75-8
4
85 a
nd o
lder
0.0
10.0
20.0
30.0
40.0
50.0
60.0
70.0
80.0
90.0
100.0Selected Methods of Injury by Age
Poison
Hanging/Suffocation
Firearm
Age Group
Pe
rce
nta
ge
Usi
ng
Me
tho
d
59
Suicide in the Central HPR, 2003-2008
# %
General Category of Poison
Prescription Medication 97 71.3
Carbon Monoxide 21 15.4
Over-the-Counter Medication 21 15.4
Alcohol 7 5.1
Street Drugs 5 3.7
Other 6 4.4
Percentages are based on the number of poisoning suicides (n = 136).
60
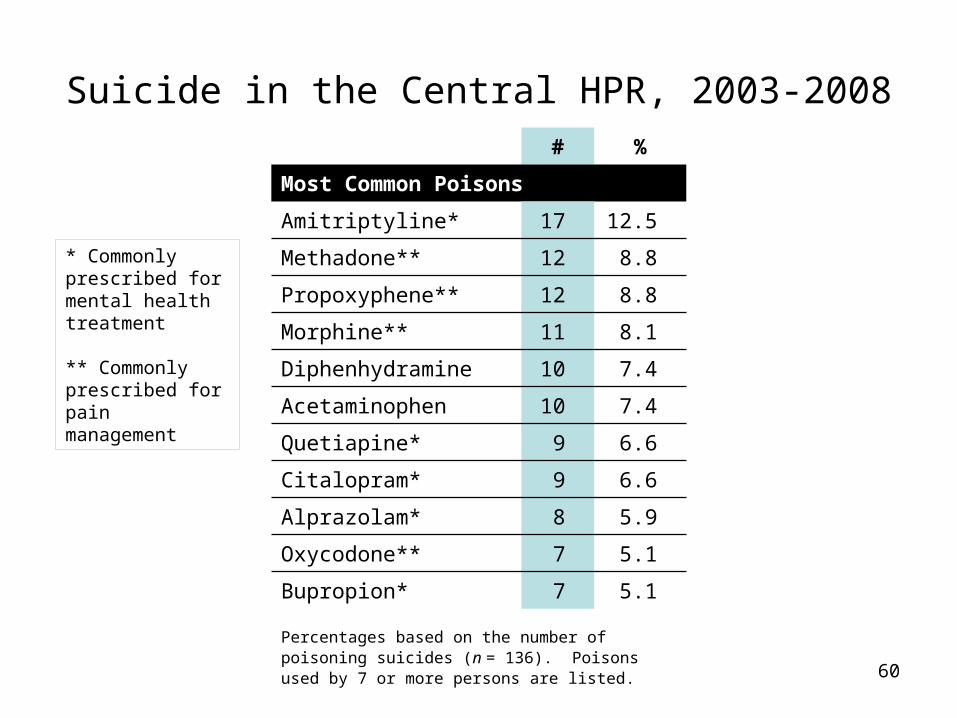
Suicide in the Central HPR, 2003-2008# %
Most Common Poisons
Amitriptyline* 17 12.5
Methadone** 12 8.8
Propoxyphene** 12 8.8
Morphine** 11 8.1
Diphenhydramine 10 7.4
Acetaminophen 10 7.4
Quetiapine* 9 6.6
Citalopram* 9 6.6
Alprazolam* 8 5.9
Oxycodone** 7 5.1
Bupropion* 7 5.1
Percentages based on the number of poisoning suicides (n = 136). Poisons used by 7 or more persons are listed.
* Commonly prescribed for mental health treatment
** Commonly prescribed for pain management
61
Non-Fatal Suicide Attemptsin the Central HPR, 2003-2008
# %
Method of Fatal Injury
Poison 5,144 78.2
Sharp Instrument 1,067 16.2
Firearm 56 0.9
Hanging/Suffocation 35 0.5
Fall 29 0.4
Fire or Burn 23 0.3
Motor Vehicle 13 0.2
Hot Object/Substance 3 <0.1
Drowning 1 <0.1
Other Natural/Environmental 1 <0.1
Other 145 2.2
Unspecified 57 0.9
62
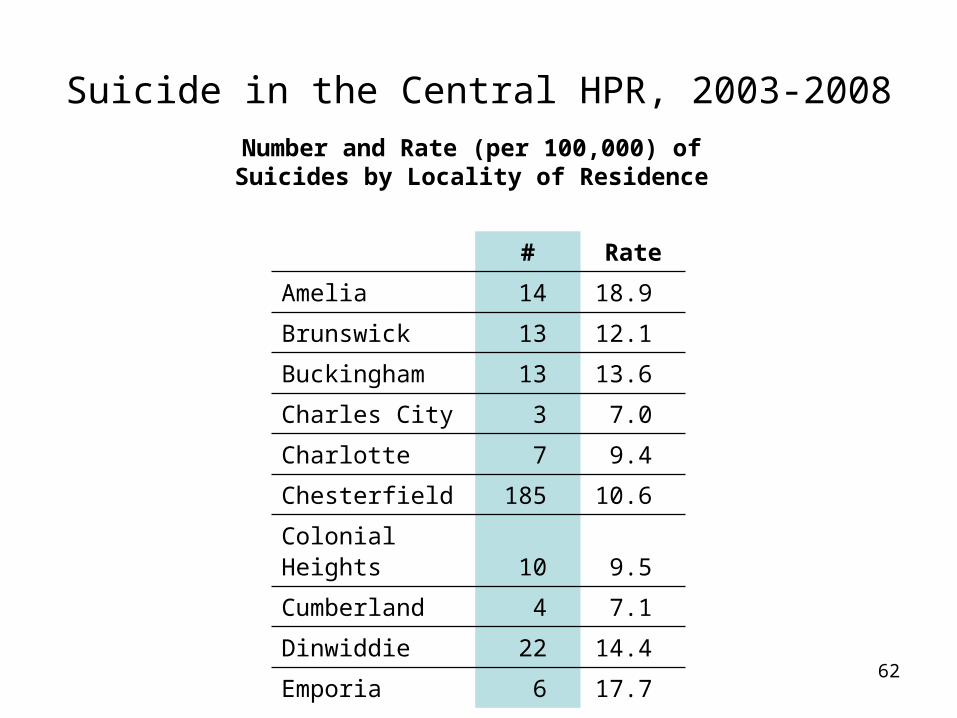
Suicide in the Central HPR, 2003-2008
# Rate
Amelia 14 18.9
Brunswick 13 12.1
Buckingham 13 13.6
Charles City 3 7.0
Charlotte 7 9.4
Chesterfield 185 10.6
Colonial Heights 10 9.5
Cumberland 4 7.1
Dinwiddie 22 14.4
Emporia 6 17.7
Number and Rate (per 100,000) of Suicides by Locality of Residence
63
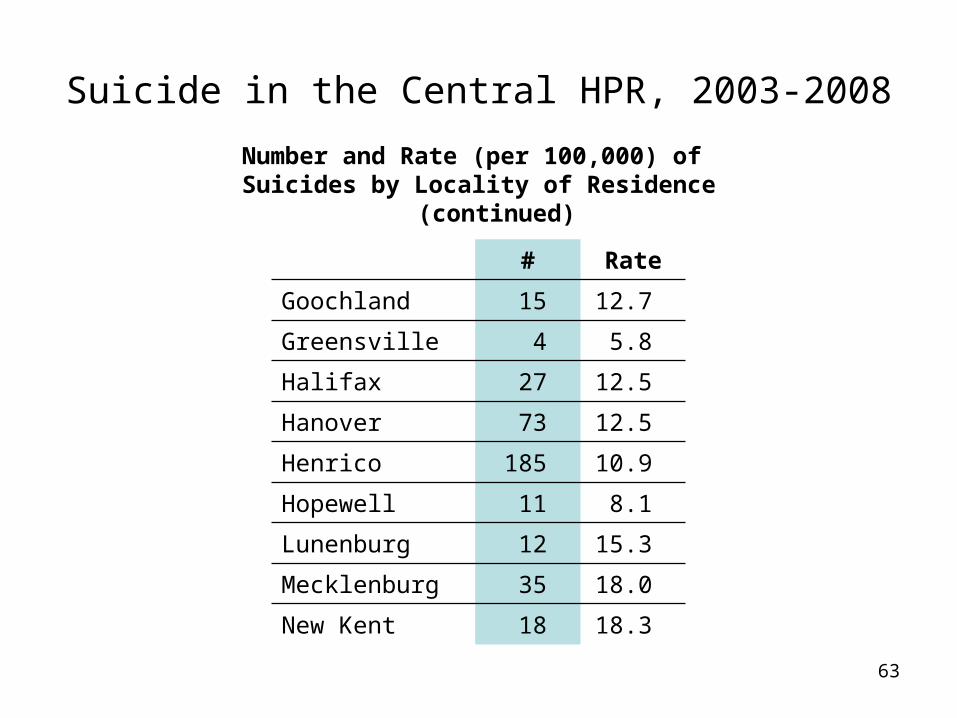
Suicide in the Central HPR, 2003-2008
# Rate
Goochland 15 12.7
Greensville 4 5.8
Halifax 27 12.5
Hanover 73 12.5
Henrico 185 10.9
Hopewell 11 8.1
Lunenburg 12 15.3
Mecklenburg 35 18.0
New Kent 18 18.3
Number and Rate (per 100,000) of Suicides by Locality of Residence (continued)
64
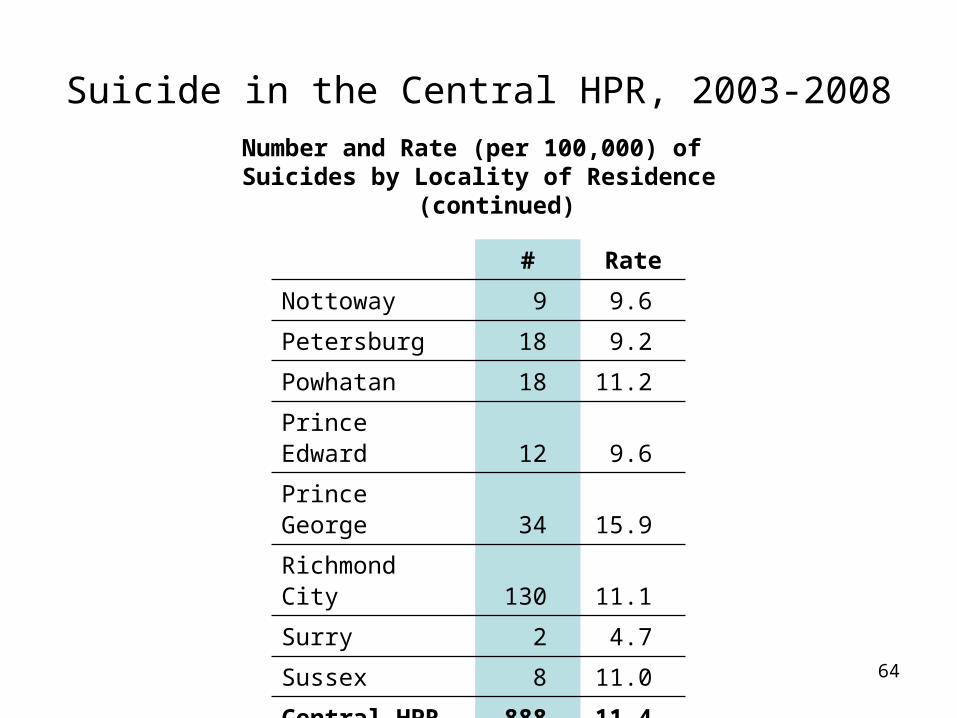
Suicide in the Central HPR, 2003-2008
# Rate
Nottoway 9 9.6
Petersburg 18 9.2
Powhatan 18 11.2
Prince Edward 12 9.6
Prince George 34 15.9
Richmond City 130 11.1
Surry 2 4.7
Sussex 8 11.0
Central HPR 888 11.4
Virginia 5,146 11.3
Number and Rate (per 100,000) of Suicides by Locality of Residence (continued)
65
Suicide in the Central HPR, 2003-2008
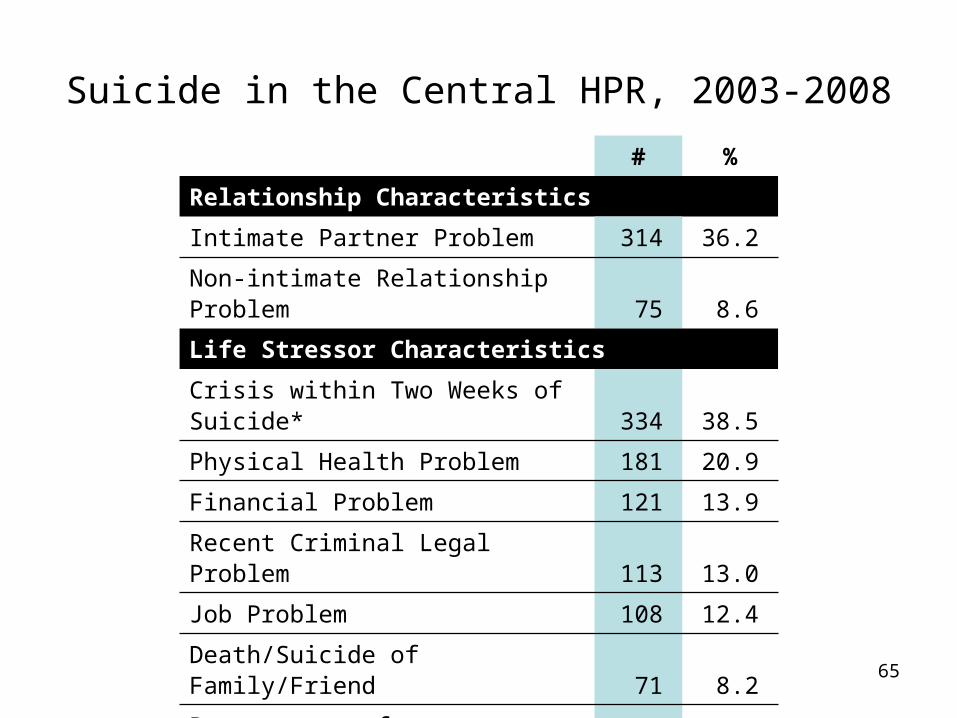
# %
Relationship Characteristics
Intimate Partner Problem 314 36.2
Non-intimate Relationship Problem 75 8.6
Life Stressor Characteristics
Crisis within Two Weeks of Suicide* 334 38.5
Physical Health Problem 181 20.9
Financial Problem 121 13.9
Recent Criminal Legal Problem 113 13.0
Job Problem 108 12.4
Death/Suicide of Family/Friend 71 8.2
Perpetrator of Interpersonal Violence 68 7.8
Percentages are based on the number of suicides with at least one known circumstance (n = 868).
* Of these, 72% had a crisis in past 24 hours (2007-2008 data)
66
Suicide in the Central HPR, 2003-2008
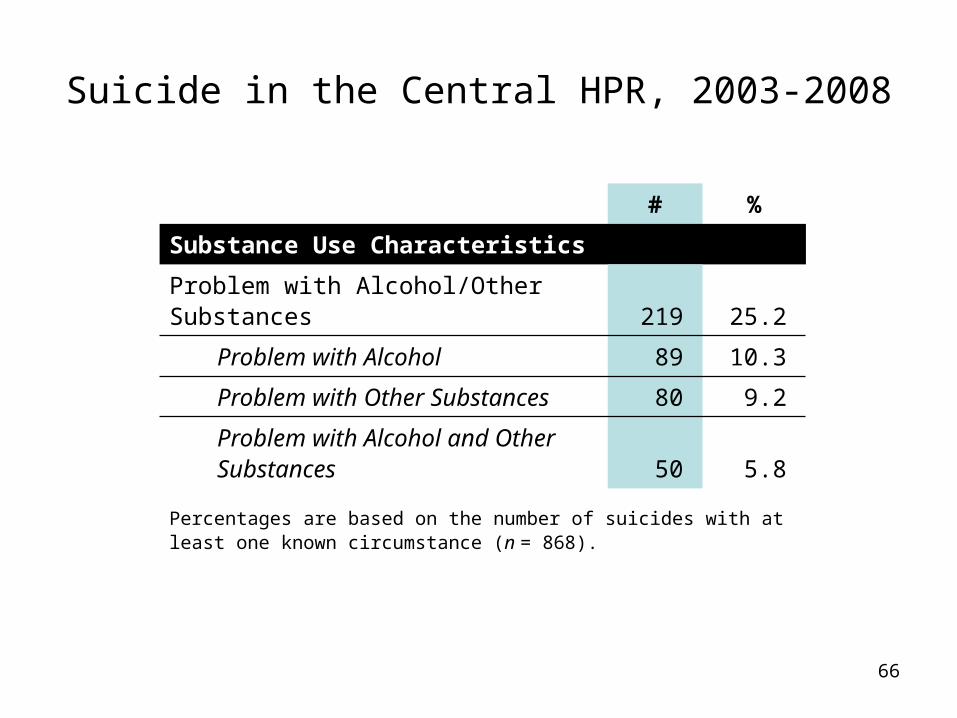
# %
Substance Use Characteristics
Problem with Alcohol/Other Substances 219 25.2
Problem with Alcohol 89 10.3
Problem with Other Substances 80 9.2
Problem with Alcohol and Other Substances 50 5.8
Percentages are based on the number of suicides with at least one known circumstance (n = 868).
67
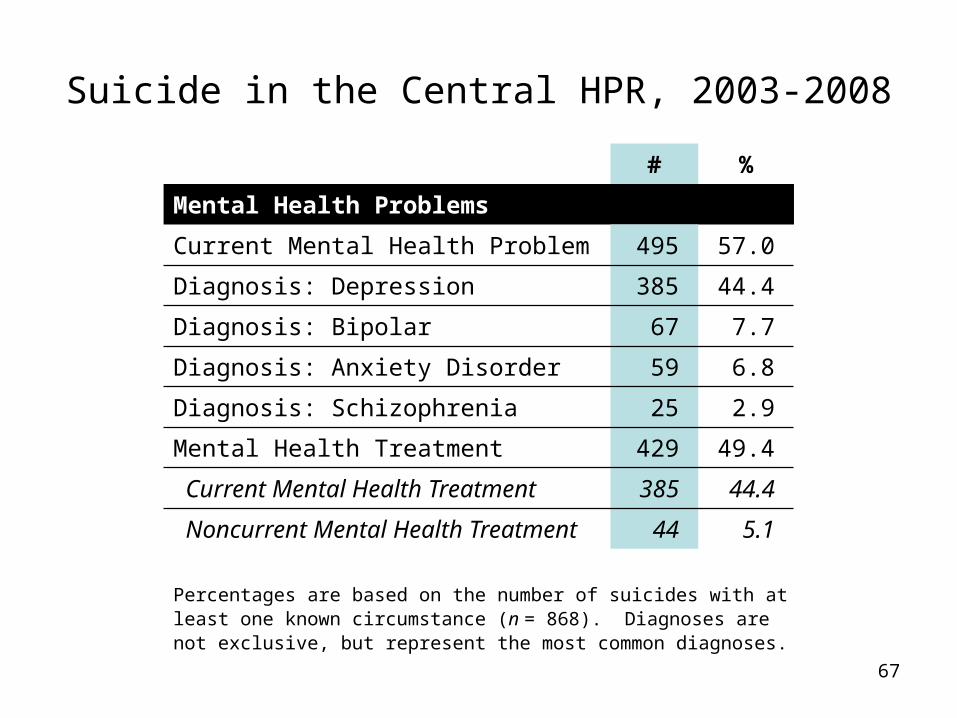
Suicide in the Central HPR, 2003-2008
# %
Mental Health Problems
Current Mental Health Problem 495 57.0
Diagnosis: Depression 385 44.4
Diagnosis: Bipolar 67 7.7
Diagnosis: Anxiety Disorder 59 6.8
Diagnosis: Schizophrenia 25 2.9
Mental Health Treatment 429 49.4
Current Mental Health Treatment 385 44.4
Noncurrent Mental Health Treatment 44 5.1
Percentages are based on the number of suicides with at least one known circumstance (n = 868). Diagnoses are not exclusive, but represent the most common diagnoses.
68
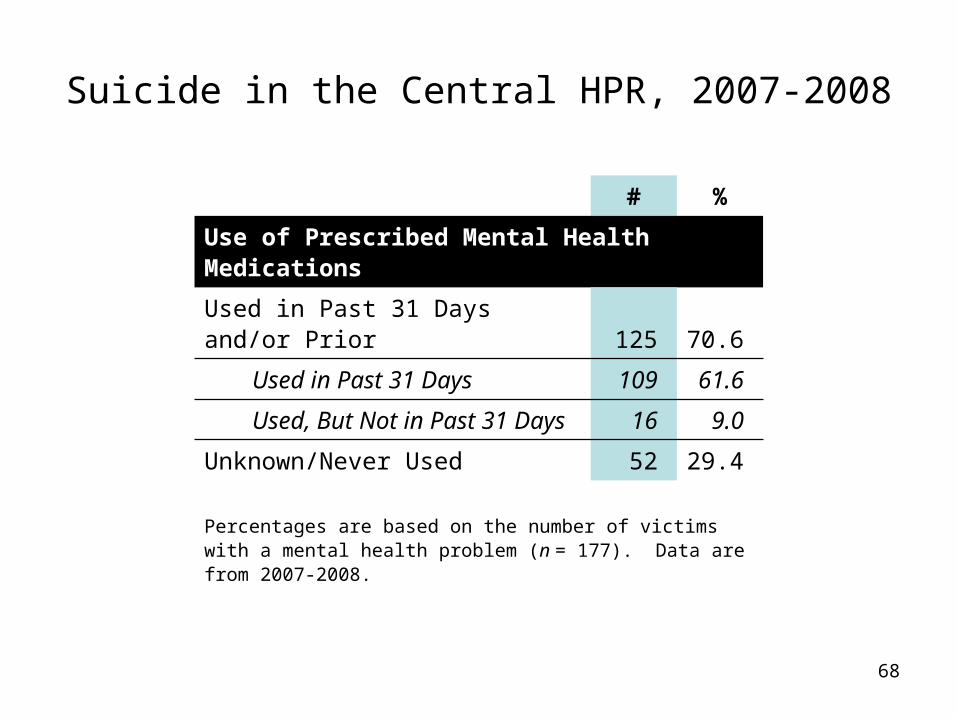
Suicide in the Central HPR, 2007-2008
# %
Use of Prescribed Mental Health Medications
Used in Past 31 Days and/or Prior 125 70.6
Used in Past 31 Days 109 61.6
Used, But Not in Past 31 Days 16 9.0
Unknown/Never Used 52 29.4
Percentages are based on the number of victims with a mental health problem (n = 177). Data are from 2007-2008.
69
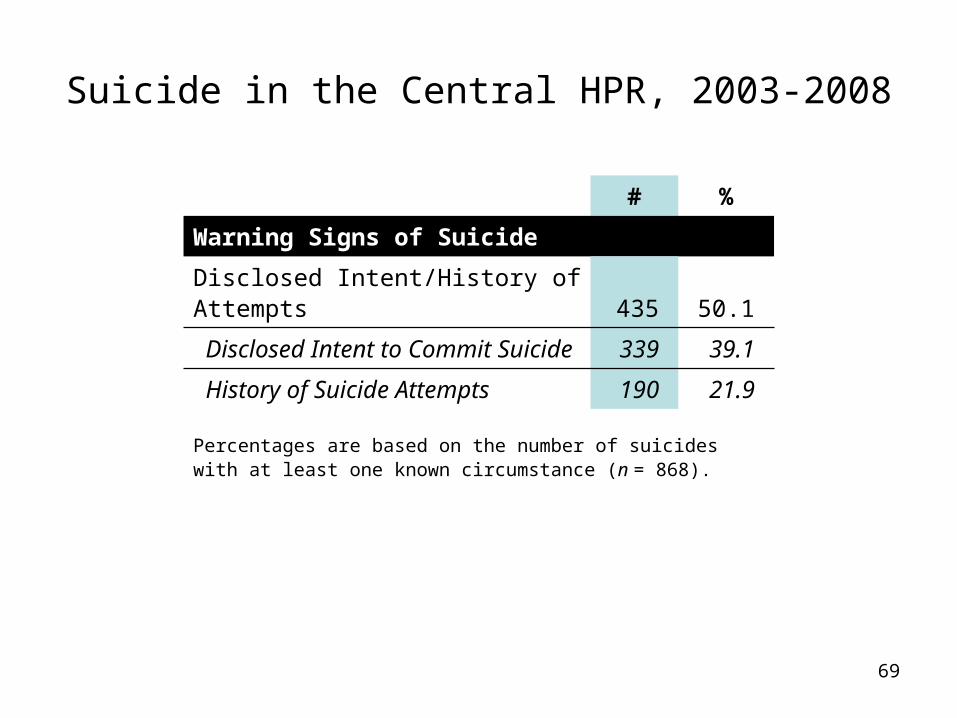
Suicide in the Central HPR, 2003-2008
# %
Warning Signs of Suicide
Disclosed Intent/History of Attempts 435 50.1
Disclosed Intent to Commit Suicide 339 39.1
History of Suicide Attempts 190 21.9
Percentages are based on the number of suicides with at least one known circumstance (n = 868).
70
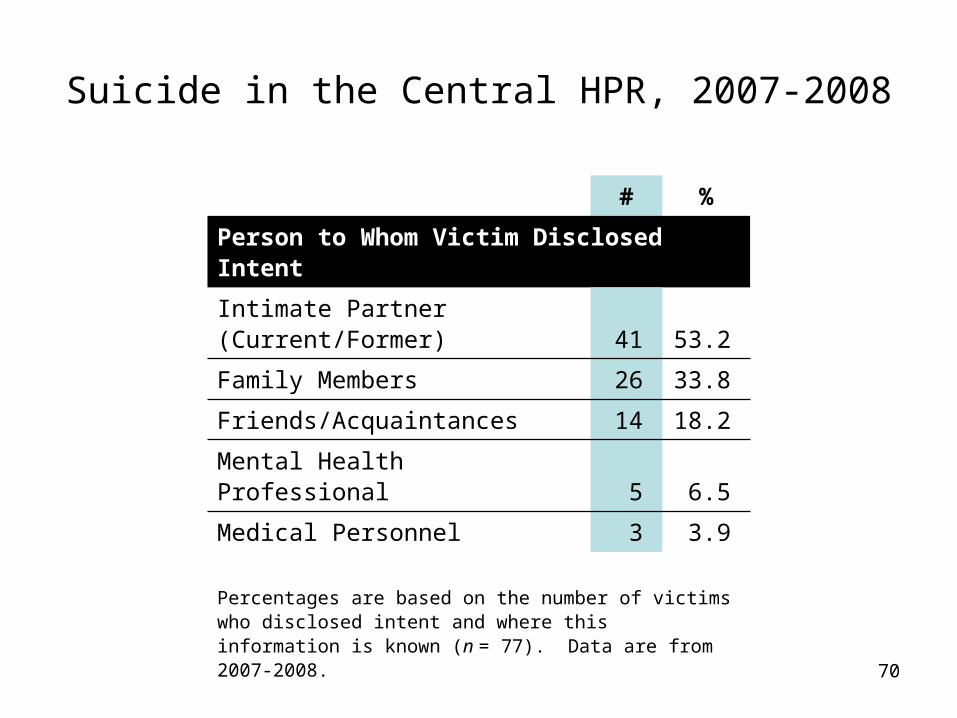
Suicide in the Central HPR, 2007-2008
# %
Person to Whom Victim Disclosed Intent
Intimate Partner (Current/Former) 41 53.2
Family Members 26 33.8
Friends/Acquaintances 14 18.2
Mental Health Professional 5 6.5
Medical Personnel 3 3.9
Percentages are based on the number of victims who disclosed intent and where this information is known (n = 77). Data are from 2007-2008.
71
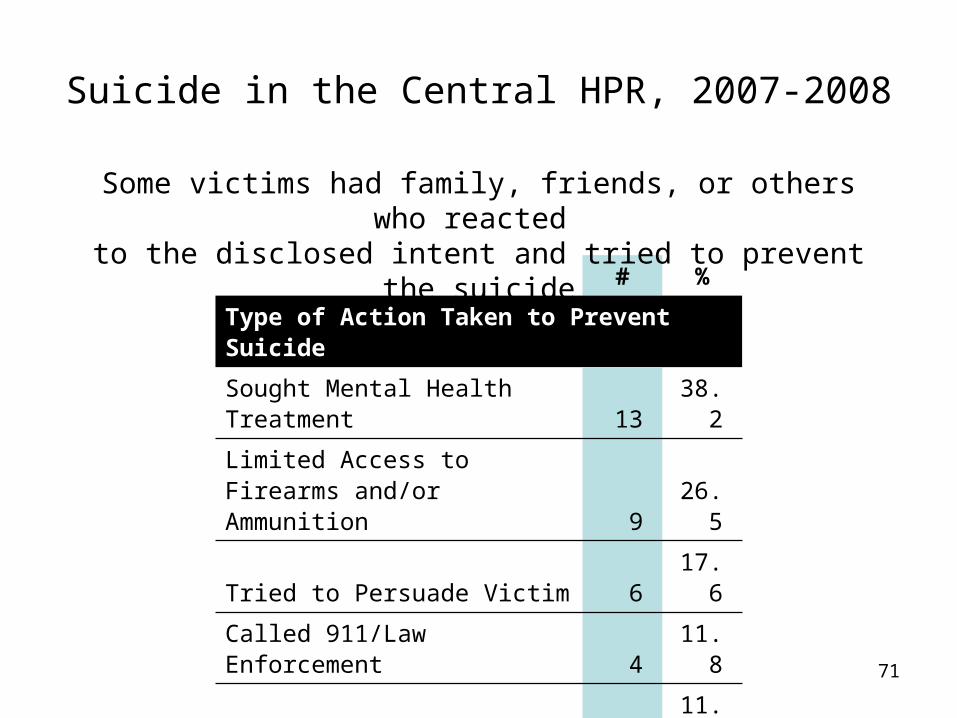
Suicide in the Central HPR, 2007-2008
# %
Type of Action Taken to Prevent Suicide
Sought Mental Health Treatment 13 38.2
Limited Access to Firearms and/or Ammunition 9 26.5
Tried to Persuade Victim 6 17.6
Called 911/Law Enforcement 4 11.8
Checked on Victim 4 11.8
Monitored Victim 2 5.9
Percentages are based on the number of suicides where someone took action to prevent the suicide (n = 34). Data are from 2007-2008.
Some victims had family, friends, or others who reacted to the disclosed intent and tried to prevent the suicide
72
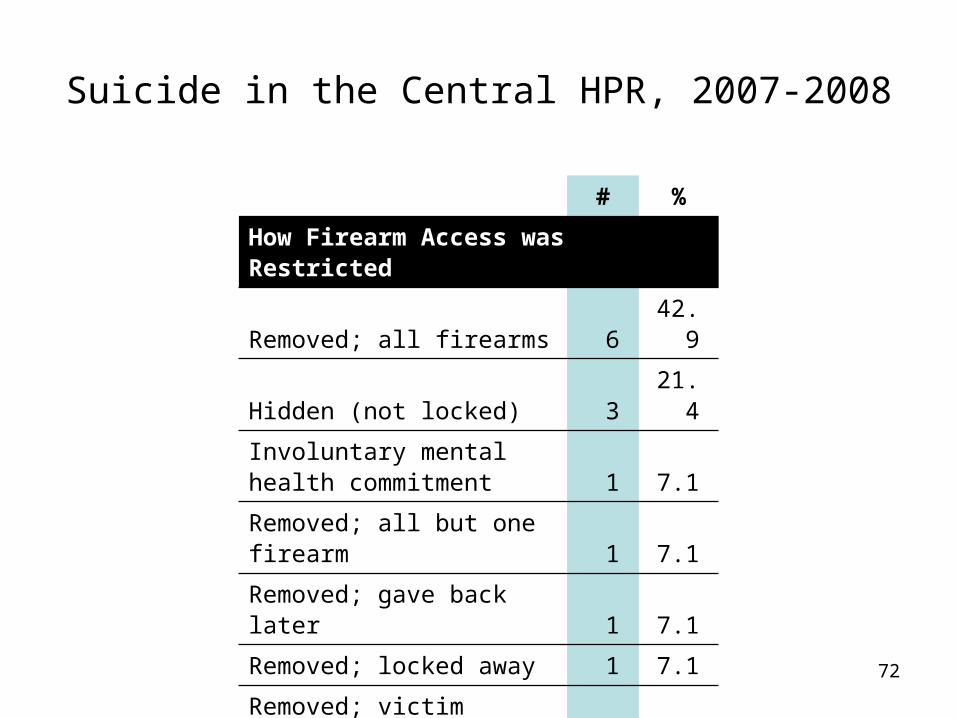
Suicide in the Central HPR, 2007-2008
# %
How Firearm Access was Restricted
Removed; all firearms 6 42.9
Hidden (not locked) 3 21.4
Involuntary mental health commitment 1 7.1
Removed; all but one firearm 1 7.1
Removed; gave back later 1 7.1
Removed; locked away 1 7.1
Removed; victim purchased a new firearm 1 7.1
Percentages are based on the number of victims where it was known how firearm access was restricted (n = 14). Data are from 2007-2008.
73
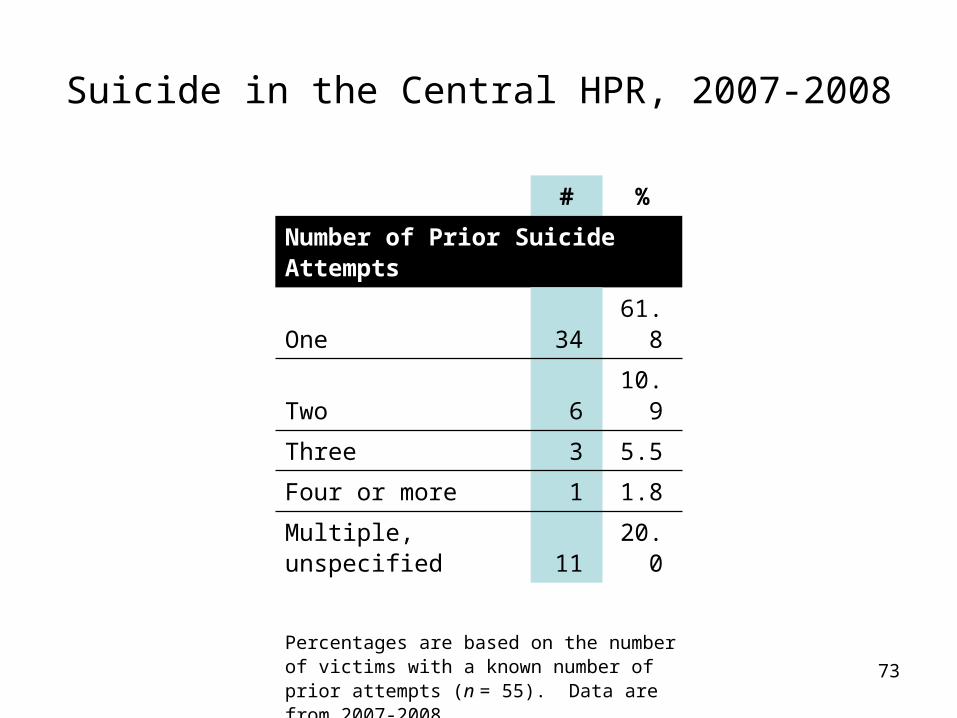
Suicide in the Central HPR, 2007-2008
# %
Number of Prior Suicide Attempts
One 34 61.8
Two 6 10.9
Three 3 5.5
Four or more 1 1.8
Multiple, unspecified 11 20.0
Percentages are based on the number of victims with a known number of prior attempts (n = 55). Data are from 2007-2008.
74
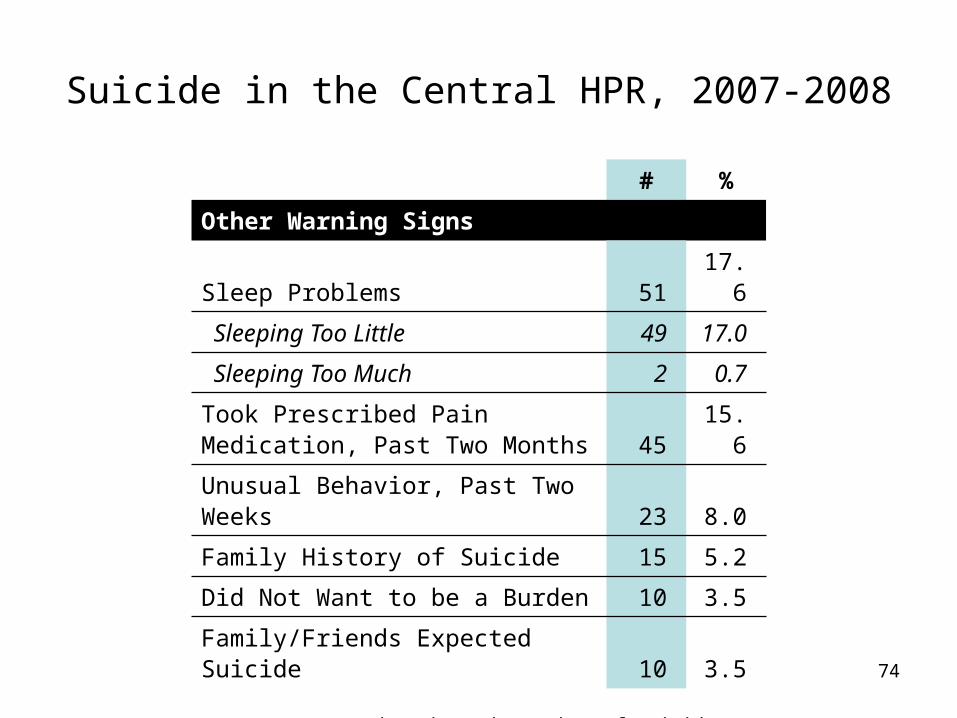
Suicide in the Central HPR, 2007-2008
# %
Other Warning Signs
Sleep Problems 51 17.6
Sleeping Too Little 49 17.0
Sleeping Too Much 2 0.7
Took Prescribed Pain Medication, Past Two Months 45 15.6
Unusual Behavior, Past Two Weeks 23 8.0
Family History of Suicide 15 5.2
Did Not Want to be a Burden 10 3.5
Family/Friends Expected Suicide 10 3.5
Percentages are based on the number of suicides with at least one known circumstance (n = 289). Data are from 2007-2008.