Embed Size (px)
Citation preview

Subordinated Notes Offering August 2021 Filed Pursuant to Rule 433 Supplementing the Preliminary Prospectus Dated December 30, 2020 Registration No. 333-251393 August 17, 2021

This presentation supplement contains forward-looking statements within the meaning of the federal securities laws. These statements include statements with respect to our beliefs, plans, objectives, goals, expectations, anticipations, assumptions, estimates, intentions and future performance and involve known and unknown risks, uncertainties and other factors, many of which may be beyond our control and that may cause the actual results, performance or achievements of the Company to be materially different from future results, performance or achievements expressed or implied by such forward-looking statements. All forward-looking statements are subject to risks, uncertainties and other factors that may cause the actual results, performance or achievements of Hanmi to differ materially from any results expressed or implied by such forward-looking statements. Such factors include, among others: a failure to maintain adequate levels of capital and liquidity to support our operations; the effect of potential future supervisory action against us or Hanmi Bank; the effect of our rating under the Community Reinvestment Act and our ability to address any issues raised in our regulatory exams; general economic and business conditions internationally, nationally and in those areas in which we operate; volatility and deterioration in the credit and equity markets; changes in consumer spending, borrowing and savings habits; availability of capital from private and government sources; demographic changes; competition for loans and deposits and failure to attract or retain loans and deposits; fluctuations in interest rates and a decline in the level of our interest rate spread; risks of natural disasters; a failure in or breach of our operational or security systems or infrastructure, including cyberattacks; the failure to maintain current technologies; the inability to successfully implement future information technology enhancements; difficult business and economic conditions that can adversely affect our industry and business, including competition and fraudulent activity and negative publicity; risks associated with Small Business Administration loans; failure to attract or retain key employees; our ability to access cost-effective funding; fluctuations in real estate values; changes in accountingpolicies and practices; the imposition of tariffs or other domestic or international governmental policies impacting the value of the products of our borrowers; changes in governmental regulation, including, but not limited to, any increase in FDIC insurance premiums; the ability of Hanmi Bank to make distributions to Hanmi Financial Corporation, which is restricted by certain factors, including Hanmi Bank’s retained earnings, net income, prior distributions made, and certain other financial tests; ability to identify a suitable strategic partner or to consummate a strategic transaction; the adequacy of our allowance for credit losses; our credit quality and the effect of credit quality on our credit losses expense and allowance for credit losses; changes in the financial performance and/or condition of our borrowers and the ability of our borrowers to perform under the terms of their loans and other terms of credit agreements; our ability to control expenses; changes in securities markets; and risks as it relates to cyber security against our information technology infrastructure and those of our third party providers and vendors. Further, given its ongoing and dynamic nature, it is difficult to predict what continued effects the COVID-19 pandemic will have on our business and results of operations. The pandemic and the related local and national economic disruption may result in a decline in demand for our products and services; increased levels of loan delinquencies, problem assets and foreclosures; an increase in our allowance for credit losses; a decline in the value of loan collateral, including real estate; a greater decline in the yield on our interest-earning assets than the decline in the cost of our interest-bearing liabilities; and increased cybersecurity risks, as employees increasingly work remotely. These and other factors are more fully described under “Risk Factors” in Item 1A of our most recent Annual Report on Form 10-K for the fiscal year ended December 31, 2020, filed with the SEC on March 1, 2021, and other factors discussed in the filings we make with the SEC under the Securities Exchange Act of 1934, as amended. All forward-looking statements attributable to our Company are expressly qualified in their entirety by these cautionary statements. Forward-looking statements speak only as of the date on whichsuch statements are made. Except as required by law, we disclaim any obligation to update these forward-looking statements, whether as a result of new information, future events or otherwise. There is no assurance that future results, levels of activity, performance or goals will be achieved. Forward-Looking Statements

Non-GAAP Financial Measures This presentation contains supplemental financial information determined by methods other than in accordance with U.S. generally accepted accounting principles ("GAAP") that management uses in its analysis of the Company's underlying operation performance and business and performance trends and facilitate comparisons with performance of others in the financial services industry. These non-GAAP financial measures should not be considered in isolation or as a substitute for, or superior to, financial measures calculated in accordance with U.S. GAAP. These non-GAAP financial measures may also be calculated differently from similar measures disclosed by other companies. A reconciliation of the non-GAAP measures used in this presentation to the most directly comparable GAAP measures is provided in the Appendix to this presentation. Additional Information and Where to Find It The Company has filed a registration statement (including a prospectus) (File No. 333-251393) and a preliminary prospectus supplement with the Securities and Exchange Commission (“SEC”) for the offering to which this presentation relates. Before you invest, you should read the prospectus and the preliminary prospectus supplement in that registration statement and the other documents that the Company has filed with the SEC for more complete information about the Company and the offering. You may get these documents for free by visiting EDGAR on the SEC’s web site at www.sec.gov. Alternatively, the Company, any underwriter or any dealer participating in the offering will arrange to send you copies of the prospectus and the preliminary prospectus supplement relating to the offering if you request it by emailing Piper Sandler & Co. at [email protected] or by emailing Keefe, Bruyette, and Woods, Inc. at [email protected]. Additional Disclaimers

Terms of Planned Capital Raise Issuer Security Amount Issuance Type Offering Structure Term No Call Period Use of Proceeds Bookrunners Hanmi Financial Corporation Subordinated Notes due 2031 $100 million SEC Registered Fixed-to-Floating Rate (Fixed during First Five Years) 10 Years 5 Years Possible redemption of outstanding subordinated debt callable in March 2022 or other general corporate purposes Security Rating BBB- by Kroll Co-Managers

Investment Highlights Leading Korean American Bank with a long history of serving Korean Americans and other ethnic communities across a nationwide footprint Experienced leadership team complemented by a diversified Board Consistent profitability driven by a diversified franchise and business mix Fortified balance sheet focused on stable, low-cost deposits, disciplined commercial lending and positive asset quality trends through COVID-19 Strong capital base and above peer¹ reserve levels make the Company well-positioned for both organic and M&A growth Proceeds of proposed debt offering for possible redemption of outstanding subordinated debt callable in March 2022 or other general corporate purposes Peers include banks that comprise the SNL U.S. Bank $5B - $10B Index (see Historical Credit Statistics on page 23)

The Hanmi Story 2001 Listed HAFC common stock 2004 Acquired Pacific Union Bank ($1.2B in assets acquired) 2016 Acquired Commercial Equipment Leasing Division (CELD) 2017 Assets surpassed $5 billion Opened a Manhattan, NY branch 2018 Opened Houston Chinatown branch in Texas 2007 Completed $70 million secondary common stock offering 1982 First Korean American Bank in the U.S. 2014 Acquired Central Bancorp, Inc. ($1.3B in assets acquired) 2020 Embarked on mortgage & digital banking initiatives by on-boarding new management team 1988 Began offering SBA loans Acquired First Global Bank 2019 Launched U.S. Subsidiaries of Korean Companies (“USKC”) initiative

Experienced, Deep Leadership Team Name Position Banking Experience (Years) Hanmi Experience (Years) Previous Experience Bonita I. “Bonnie” Lee President & CEO 35 8 BBCN Bancorp, Shinhan Bank America, Nara Bank Romolo Santarosa SEVP, Chief Financial Officer 30 6 Opus Bank, First California Financial Group Anthony Kim EVP, Chief Banking Officer 27 8 BBCN Bancorp Matthew Fuhr EVP, Chief Credit Administration Officer 25 6 Pacific Western Bank, FDIC Michael Du SVP, Chief Risk & Compliance Officer 22 2 Pacific Western Bank, Unify Financial Federal Credit Union Vivian Kim EVP, General Counsel & Chief People Officer 6 6 Dykema Gossett LLP

Name Title; Position Age Year Elected John J. Ahn Chairman of the Board; CEO of Whitehawk Capital Partners 56 2014 David L. Rosenblum Vice Chairman of the Board; Former Senior Principal for Deloitte Consulting LLP 68 2014 Bonita I. “Bonnie” Lee Director; President and CEO of Hanmi Bank 58 2019 Kiho Choi Director; Managing Partner of CKP, LLP 65 2018 Christie K. Chu Director; President and CEO of CKC Accountancy Corp. 56 2015 Harry H. Chung Director; COO and CFO of WhiteHawk Capital Partners 51 2016 Scott R. Diehl Director; Former Group Head at Wells Fargo Capital Finance, Inc. 59 2018 Thomas J. “Tom” Williams Director; Former SVP and CRO at BofI Federal Bank 58 2016 Michael M. Yang Director; Founder & CEO of Michael Yang Capital Management LLC 59 2016 Gideon Yu Director; Co-Owner and Former President of San Francisco 49ers 50 2021 Experienced & Diversified Board of Directors

Hanmi at a Glance Focus on growth and value preservation for our shareholders Second largest Korean American Bank with 39 years of history and $6.6 billion in assets as of June 30, 2021 35 branches coast-to-coast in highly attractive major banking markets & 9 LPOs Commitment to conservative, disciplined underwriting, and strong asset quality Well capitalized, significantly above the regulatory requirements Equity Snapshot Assets $ in billions Loans $ in billions Deposits $ in billions Stockholders’ Equity $ in millions Branch Loan Production Office (LPO) Bank Network¹ (as of August 9, 2021) HAFC’s branches and LPO’s are strategically located in the top MSAs for Asian Americans in the U.S.: Los Angeles, San Francisco, New York, Chicago, Dallas, Houston, Seattle, Colorado, and Atlanta

2Q21 Highlights $0.72 1.38% 3.19% 52.66% 1.78% Efficiency Ratio ROAA NIM Net Income Diluted EPS $22.1M Net income of $22.1 million, or $0.72 per diluted share, up 32.8% from $16.7 million, or $0.54 per diluted share, from the prior quarter Loans receivable of $4.82 billion, unchanged from the prior quarter; excluding Paycheck Protection Program (“PPP”) loans, up 2.5% quarter-over-quarter Loan production of $465.6 million, offset by payoffs/paydowns and forgiveness on first draw PPP loans Deposits of $5.63 billion, up 2.2% from the prior quarter Noninterest-bearing demand deposits of $2.35 billion, up 8.3% from the prior quarter Cost of interest-bearing deposits declined 12 basis points from the prior quarter to 0.37% Recovery of credit loss expense of $3.3 million for the second quarter; allowance for credit losses was 1.73% of loans at June 30, 2021 (1.78%¹ excluding PPP loans) Well-capitalized with a Total Risk-Based capital ratio of 15.41% and a Common Equity Tier 1 capital ratio of 11.76% and TCE/TA² ratio of 9.01% at June 30, 2021 (9.23%² excluding PPP loans) Net Income Reserves / Loans¹ Reserves / Loans HFI excluding PPP loans (see Non-GAAP Reconciliation beginning on pg. 32) Non-GAAP financial measure (see Non-GAAP Reconciliation beginning on pg. 32)

Strong Historical Profitability Return on Average Assets (ROAA) Return on Average Equity (ROAE) Net Interest Margin Net Income ($ in millions) & Earnings Per Share Reflects, among other things, elevated charges arising from a $40.7 million single troubled loan relationship identified in 2Q19 comprised of a land loan ($27.9 million) and a business loan ($12.8 million) which declined to $10.0 million at 2Q20 after $24.5 million charge-offs Excludes purchase accounting impact of Central Bancorp, Inc. acquisition 1 1

Net interest income was $49.6 million for the second quarter compared with $46.0 million for the prior quarter; net interest margin for the quarter was 3.19% (3.12%1 excluding PPP loans) compared with 3.09% for the prior quarter (3.13%1 excluding PPP loans). Net Interest Income / Net Interest Margin Net Interest Income and Net Interest Margin Net Interest Margin Analysis 1 ($ millions) Non-GAAP financial measure (see Non-GAAP Reconciliation beginning on pg. 32)

Noninterest Expenses Reflects, among other things, elevated charges arising from a single troubled loan relationship (See pg. 9) Efficiency ratio excluding PPP loans and securities gains for 2Q20 was 60.82% and for FY 2020 was 58.63%. Non-GAAP financial measure (see Non-GAAP Reconciliation beginning on pg. 32) 2 NIE / Avg. Assets NIE / Avg. Assets Efficiency Ratio Efficiency Ratio 1 1 2

($ in millions) 2Q21 1Q21 4Q20 3Q20 2Q20 Income Statement Summary Net Interest Income $ 49.6 $ 46.0 $ 46.9 $ 45.6 $ 44.4 Adjusted Noninterest Income1,2 8.6 7.0 7.8 7.1 5.2 Adjusted Operating Revenue1 58.2 53.0 54.7 52.7 49.6 Adjusted Noninterest Expense1,3 30.8 30.9 30.9 29.9 30.2 Adjusted Pretax, Pre-Provision Income3 $ 27.4 $ 22.1 23.8 22.8 19.4 Adjusted operating revenue1 increased by 10% quarter-over-quarter Adjusted operating revenue1 includes non-PPP 7(a) SBA gains of $3.3 million (2Q21), $1.7 million (1Q21), $1.8 million (4Q20), and $2.3 million (3Q20) Adjusted pretax, pre-provision income1 increased by 24% quarter-over-quarter Adjusted Pretax Pre-Provision Income1 Note: Numbers may not add due to rounding Non-GAAP financial measure (see Non-GAAP Reconciliation beginning on pg. 32) Excludes $203 thousand of PPP gains, and $75 thousand legal settlement for 2Q21, $2.5 million of PPP gains, $250 thousand legal settlement and $99 thousand gain on securities for 1Q21, $1.0 million legal settlement for 4Q20, and gains on securities of $15.7 million for 2Q20 Excludes PPP deferred loan origination costs of $1.4 million for 1Q21 and $3.1 million for 2Q20 1,2,3 1,3 Adjusted Noninterest Expense over Avg. Assets Adjusted Pretax, Pre-Provision Income ($ millions)

Successful Portfolio Diversification Strategy Total Portfolio: $3.4 billion Total Portfolio: $4.8 billion Significant progress in reducing CRE concentration from 82% of total portfolio to 72% as of June 30, 2021 7% CAGR CRE 71.3% C&I 12% CRE 72% SFR 7% Leases 9% Loan Composition 2Q 2016 Loan Composition 2Q 2021 C&I 8.9% C&I 8.8% RRE 4.1% C&I 9% SFR 9% CRE 82% Includes $182 million and $16 million of the retained unguaranteed portion of the SBA loans across CRE and C&I respectively Includes $138 million and $40 million of the retained unguaranteed portion of the SBA loans across CRE and C&I respectively, and $144 million of guaranteed loans funded through the PPP net of deferred fees in C&I SFR includes Consumer 1 1 2 2 3 3

Loan Portfolio Composition Granular loan portfolio with small average loan sizes and strong QTD¹ average yields despite the low interest rate environment SFR & Consumer Portfolio2 $ in millions Outstanding $349 Average Size $0.4 QTD Average Yield 3.16% Commercial & Industrial Portfolio3 $ in millions Outstanding $588 Average Size $0.2 QTD Average Yield 5.16% Leasing Portfolio $ in millions Outstanding $432 Average Size $0.04 QTD Average Yield 5.29% Commercial Real Estate Portfolio $ in millions Outstanding $3,452 Average Size $1.7 QTD Average Yield 4.35% 3 2 Loan Portfolio Composition $4.82 Billion For the quarter ended June 30, 2021 SFR includes Consumer C&I portfolio includes $144 million of loans funded through the PPP net of $1.5 million of deferred fees

Loan Portfolio Diversification Loan portfolio is well diversified across property and business types. CRE Portfolio $3.45B¹ C&I Portfolio $588M 2 1.8% represent construction/land 65% of this category represents PPP loans Note: Numbers may not add due to rounding; data as of June 30, 2021

SBA Loan Sales ($ in millions) ($ in thousands) SBA Gain on Sale SBA Loan Sales Excludes $203 thousand of PPP gains The volume of SBA loans sold and gains on sales of SBA loans, excluding PPP loans, for the second quarter of 2021 were $26.6 million and $3.3 million¹, respectively

Hospitality Segment by Location Type Hospitality segment is $847 million, representing 18% of the loan portfolio. Total Hospitality Segment: $847M Average balance within the segment was $3.2 million Weighted average debt coverage ratio of the segment was 2.0x at origination Weighted average loan to value of the segment was 50% at origination 12% of the hospitality portfolio was criticized as of June 30, 2021, with almost half stemming from the Metropolitan location category The current2 weighted average loan to value of all criticized hospitality loans was 68% Nonaccrual hospitality loans represented 1% of the portfolio with only two loans over $3 million – a $5.6 million California-based convention center location and a $3.0 million Texas-based metropolitan location Hospitality Portfolio Detail Metropolitan is categorized as a location that is in a major city and in proximity to downtown areas; destination is categorized as a hotel whose location/amenities make it a distinct tourist location; suburban is defined as areas outside of major city hubs and can include more rural areas Current refers to appraisals received within the past 12 months Note: Data as of June 30, 2021

Excellent Modification Trend 95% decline in modifications since June 30, 2020 – from $1.4B to $72M as of June 30, 2021 Modified portfolio represents 1.5% of loans receivable as of June 30, 2021 At June 30, 2021, 50.7% of modified loans were special mention and 17.6% were classified; 7.0% were nonaccrual. -89% -99% -93% ($ millions) Modified & Deferred Payments as of June 30, 2020 $579 $116 2020 -59% ($ millions) $593 $1,408 -73% 2020 2021 1 Modified & Deferred Payments as of June 30, 2021 2020 $156 -26% 2021 $72 -38% Note: Numbers may not add due to rounding Modified payments include Interest Only, Hybrid, Reduced Payment and other type of modifications -100% -100%

Credit Culture Fundamentals Conservative Policies and Monitoring for Enhanced Diligence Conservative credit culture with well-defined policies and procedures Dual and committee authority structure for loan approval DCR and LTV stress testing conducted as part of underwriting, while individual portfolio loan review is conducted on a sample of loans using third party consultants To further its monitoring of commercial real estate, the Board and Management created a CRE Concentration Risk Program that details seven core elements to enhanced monitoring of its portfolio Board and Management Oversight Portfolio Management Management Information Systems Market Analysis Credit Underwriting Standards Portfolio Stress Testing and Sensitivity Analysis Credit Review Function
Asset Quality – Nonaccrual Loans ($ millions) Nonaccrual loans1 decreased 28% quarter-over-quarter. 47% of nonaccruals represent three loans of $3 million or more. Includes $14.9 million and $5.0 million of modified loans at March 31, 2021 and June 30, 2021, respectively Specific allowance for credit losses at March 31, 2021 and June 30, 2021 were $12.2 million and $4.7 million, respectively SFR includes Consumer loans

Historical Credit Statistics NCOs / Avg. Loans NPAs / Assets Reserves / Loans HFI Reserves / NPAs Note: SNL US Bank Index includes all major exchange banks in SNL’s coverage universe with total assets between $5 billion and $10 billion; NPAs exclude troubled debt restructurings Adjusted for a single troubled loan relationship identified in 2Q19 (See pg. 9) Reserves / Loans HFI excluding PPP (see Non-GAAP Reconciliation beginning on pg. 32) Related to a single troubled loan relationship identified in 2Q19 unrelated to COVID-19

Diversified Deposit Base Deposits ($ in millions) Deposits ($ in millions) Deposits by Type – June 30, 2021 ($ in millions) Note: Numbers may not add due to rounding Time Deposits Money Market & Savings Demand Interest-bearing Demand Noninterest-bearing

Summary of Funding $100.0 million of outstanding subordinated debt is callable beginning March 30, 2022 at which time it assumes a floating rate of 3M LIBOR + 313.5 bps Trust Preferred has a fair value of $18.5 million on HAFC’s balance sheet. Includes $150.0 million of advances and $130.0 million letter of credit for state CDs

Securities Portfolio Estimated Fair Value: $862M 100% Available-For-Sale Yield on securities portfolio on a fully taxable equivalent basis of 0.69%¹ Composition of the securities portfolio remains relatively unchanged quarter-over-quarter with the introduction of municipal securities in the second quarter of 2021 and is conservative in nature Amounts calculated on a fully taxable equivalent basis using the current statutory federal tax rate Note: Data as of June 30, 2021

Interest Rate Sensitivity Percent Changes in Net Interest Income Percent Changes in Economic Value of Equity Note: Assumes an instantaneous parallel shift in the yield curve HAFC remains well-positioned for a rising interest rate environment

Minimum threshold for a well-capitalized institution A capital conservation buffer of 2.5 percent became effective on January 1, 2019, and must be met to avoid limitations on the ability of the Bank to pay dividends, repurchase shares or pay discretionary bonuses. The Bank's capital conservation buffer was 7.25 percent as of June 30, 2021; the capital conservation buffer is an amount in excess of the 4.5% minimum CET1 ratio Note: Ratios exceed current regulatory requirements; Financial data as of June 30, 2021 Capital Ratios Exceed Well-Capitalized Thresholds Total RBC Tier 1 RBC CET1² Tier 1 Leverage 1 1 2 1

Note: Ratios exceed current regulatory requirements Capital Ratio Trends Total RBC Tier 1 RBC CET1 Tier 1 Leverage

Sources of Holding Company Liquidity Hanmi Financial Corporation’s main source of liquidity is dividends from its subsidiary, Hanmi Bank Dividend capacity from the Bank is $10.5 million in retained earnings without prior regulatory approval, as of June 30, 2021 California law restricts the amount available for cash dividends to the lesser of a bank’s retained earnings or net income for its last three years less any distributions made during such periods. Cash dividends may still be paid, with prior approval, in an amount not exceeding the greatest of (1) retained earnings of the bank, (2) net income of the bank for its last fiscal year, or (3) the net income of the bank for it current fiscal year. $6.0 million of cash and equivalents at the Holding Company as of June 30, 2021 Hanmi Financial Corporation expects to retain the entirety of the net proceeds from the proposed offering at the Holding Company in preparation for possible redemption of outstanding subordinated debt callable in March 2022 or other general corporate purposes

Interest Coverage & Double Leverage Assumes $100.0M gross offering with net proceeds of $98.0M 0% of net proceeds assumed to be downstreamed to the Bank Pro forma double leverage is equal to 117.4%; 0% of net proceeds are downstreamed to bank-level Note: For illustrative purposes, assumes $100 million of gross proceeds from the subordinated notes (net proceeds of $98.0 million after 1.25% underwriting spread and $750k of expenses) and 0% downstreamed to the Bank; Assumes 3.75% interest rate on current issuance of subordinated debt and 5.45% fixed interest rate on outstanding subordinated debt

Pro Forma Capitalization Note: For illustrative purposes, assumes $100 million of gross proceeds from the subordinated notes (net proceeds of $98.0 million after 1.25% underwriting spread and $750k of expenses) and a risk–weighting of 20%; the after-tax impact of debt extinguishment charges has been excluded, the impact is not expected to be significant Does not take into account after-tax debt extinguishment charges Assumes $100.0M gross offering with net proceeds of $98.0M 0% of net proceeds assumed to be downstreamed to the Bank

Appendix

Historical Balance Sheet

Historical Income Statement

Interest Coverage & Double Leverage Assumes $100.0M gross offering with net proceeds of $98.0M 0% of net proceeds assumed to be downstreamed to the Bank Pro forma double leverage is equal to 117.4%; 0% of net proceeds are downstreamed to bank-level Note: For illustrative purposes, assumes $100 million of gross proceeds from the subordinated notes (net proceeds of $98.0 million after 1.25% underwriting spread and $750k of expenses) and 0% downstreamed to the Bank; Assumes 3.75% interest rate on current issuance of subordinated debt and 5.45% fixed interest rate on outstanding subordinated debt

Non-GAAP Reconciliation – PPP (2Q20) In response to the Covid-19 pandemic, the Coronavirus Aid, Relief and Economic Security Act (the “CARES Act”) was adopted, which included authorization for the U.S. Small Business Administration (the “SBA”) to introduce a new program, entitled the “Paycheck Protection Program,” which provides loans for eligible businesses through the SBA’s 7(a) loan guaranty program. These loans are fully guaranteed and available for loan forgiveness of up to the full principal amount so long as certain employee and compensation levels of the business are maintained and the proceeds of the loan are used as required under the program. The Paycheck Protection Program (“PPP”) and loan forgiveness are intended to provide economic relief to small businesses nationwide adversely impacted under the COVID-19 pandemic. Hanmi participated in this program and the financial information for the 2020 second quarter reflects this participation. This table shows financial information excluding the effect of the origination of the PPP loans, including the corresponding interest income earned on such loans, which constitutes a non-GAAP measure. Management believes the presentation of certain financial measures excluding the effect of PPP loans provides useful supplemental information that is essential to a proper understanding of the financial condition and results of operations of Hanmi. This disclosure should not be viewed as a substitution for results determined in accordance with GAAP, nor is it necessarily comparable to non-GAAP financial measures that may be used by other companies. As of June 30, 2020 Tangible Common Equity to Tangible Assets Tangible assets $ 6,206,421 Less PPP loans (301,836) Tangible assets adjusted for PPP loans $ 5,904,585 Tangible stockholders' equity 1 $ 535,694 TCE / TA Ratio 8.63% TCE / TA Ratio adjusted for PPP loans 9.07% Allowance for Credit Losses to Loans Receivable Allowance for credit losses $ 86,330 Loans receivable $ 4,825,642 Less PPP loans (301,836) Loans receivable adjusted for PPP loans $ 4,523,806 ACL / Loans Receivable 1.79% ACL / Loans Receivable adjusted for PPP loans 1.91% Three Months Ended June 30, 2020 Net Interest Margin Net interest income $44,442 Less PPP loan interest income (1,129) Net interest income adjusted for PPP loans $ 43,313 Average interest-earning assets $ 5,673,321 Less average PPP loans (251,758) Average interest-earning assets adjusted for PPP loans $ 5,421,563 NIM 2 3.15% NIM adjusted for PPP loans 2 3.21% Efficiency Ratio Noninterest expense $ 27,138 Less PPP deferred origination costs 3,064 Noninterest expense adjusted for PPP loans $ 30,202 Net interest income plus noninterest income $ 65,373 Less net gain on sales of securities (15,712) Net interest income plus noninterest income adjusted for net securities gains $ 49,661 Efficiency ratio 3 41.51% Efficiency ratio adjusted for PPP loans and securities gains 3 60.82% ($ in thousands, except share and per share data) (1) There were no preferred shares outstanding at June 30, 2020 (2) Net interest income (as applicable) divided by average interest-earning assets (as applicable), annualized (3) Noninterest expense (as applicable) divided by the sum of net interest income and noninterest income (as applicable)

Non-GAAP Reconciliation ($ in thousands, except per share data) June 30, 2021 March 31, 2021 December 31, 2020 September 30, 2020 June 30, 2020 Tangible Common Equity to Tangible Assets Ratio Assets $ 6,578,856 $ 6,438,401 $ 6,201,888 $ 6,106,782 $ 6,218,163 Less goodwill and other intangible assets (11,504) (11,558) (11,612) (11,677) (11,742) Tangible assets $ 6,567,352 $ 6,426,843 $ 6,190,276 $ 6,095,105 $ 6,206,421 Stockholders' equity1 $ 602,977 $ 581,822 $ 577,044 $ 563,203 $ 547,436 Less goodwill and other intangible assets (11,504) (11,558) (11,612) (11,677) (11,742) Tangible stockholders' equity1 $ 591,473 $ 570,264 $ 565,432 $ 551,526 $ 535,694 Stockholders' equity to assets 9.17% 9.04% 9.30% 9.22% 8.80% Tangible common equity to tangible assets1 9.01% 8.87% 9.13% 9.05% 8.63% Common shares outstanding 30,697,652 30,682,533 30,717,835 30,719,591 30,657,629 Tangible common equity per common share $ 19.27 $ 18.59 $ 18.41 $ 17.95 $ 17.47 There were no preferred shares outstanding at the periods indicated

Non-GAAP Reconciliation: Pretax Pre-Provision Income Note: Numbers may not add due to rounding ($ millions) 2Q21 1Q21 4Q20 3Q20 2Q20 Pretax income $ 31.0 $ 24.2 $ 19.7 $ 22.8 $ 13.6 less credit loss expense (3.3) 2.1 5.1 - 24.6 Pretax, Pre-provision, income $ 27.7 $ 26.3 $ 24.8 $ 22.8 $ 38.2 less income from PPP gains (0.2) (2.5) - - - less income from legal settlement (0.1) (0.3) (1.0) - - less gain on sales of securities - (0.1) - - (15.7) less PPP capitalized cost - (1.4) - - (3.1) Adjusted pretax, pre-provision, income $ 27.4 $ 22.1 $ 23.8 $ 22.8 $ 19.4 Operating revenue $ 58.5 $ 55.8 $ 55.7 $ 52.7 $ 65.4 less income from PPP gains (0.2) (2.5) - - - less income from legal settlement (0.1) (0.3) (1.0) - - less gain on sales of securities - (0.1) - - (15.7) Adjusted operating revenue $ 58.2 $ 53.0 $ 54.7 $ 52.7 $ 49.7 Noninterest income $ 8.9 $ 9.8 $ 8.8 $ 7.1 $ 20.9 less income from PPP gains (0.2) (2.5) - - - less income from legal settlement (0.1) (0.3) (1.0) - - less gain on sales of securities - (0.1) - - (15.7) Adjusted noninterest income $ 8.6 $ 7.0 $ 7.8 $ 7.1 $ 5.2 Noninterest expense $ 30.8 $ 29.5 $ 30.9 $ 29.9 $ 27.1 less PPP capitalized cost - 1.4 - - 3.1 Adjusted noninterest expense $ 30.8 $ 30.9 $ 30.9 $ 29.9 $ 30.2

Non-GAAP Reconciliation – PPP (2Q21) In response to the COVID-19 pandemic, the Coronavirus Aid, Relief and Economic Security Act (the “CARES Act”) was adopted, which included authorization for the U.S. Small Business Administration (the “SBA”) to introduce a new program, entitled the “Paycheck Protection Program,” which provides loans for eligible businesses through the SBA’s 7(a) loan guaranty program. These loans are fully guaranteed and available for loan forgiveness of up to the full principal amount so long as certain employee and compensation levels of the business are maintained and the proceeds of the loan are used as required under the program. The Paycheck Protection Program (“PPP”) and loan forgiveness provide economic relief to small businesses nationwide adversely impacted under the COVID-19 pandemic. Hanmi participated in this program and the financial information for the 2021 second quarter reflects this participation. This table shows financial information excluding the effect of the origination of the PPP loans, including the corresponding interest income earned and non-interest expense incurred on such loans, which constitutes a non-GAAP measure. Management believes the presentation of certain financial measures excluding the effect of PPP loans provides useful supplemental information that is essential to a proper understanding of the financial condition and results of operations of Hanmi. This disclosure should not be viewed as a substitution for results determined in accordance with GAAP, nor is it necessarily comparable to non-GAAP financial measures that may be used by other companies. As of June 30, 2021 Tangible Common Equity to Tangible Assets Tangible assets $ 6,567,352 Less first and second draw PPP loans (158,134) Tangible assets adjusted for PPP loans $ 6,409,218 Tangible stockholders' equity (1) $ 591,473 TCE / TA Ratio(1) 9.01% TCE / TA Ratio adjusted for PPP loans(1) 9.23% Allowance for Credit Losses to Loans Receivable Allowance for credit losses $ 83,372 Loans receivable $ 4,820,092 Less first draw PPP loans (144,077) Loans receivable adjusted for PPP loans $ 4,676,015 ACL / Loans Receivable 1.73% ACL / Loans Receivable adjusted for PPP loans 1.78% Three MonthsEnded June 30, 2021 Net Interest Margin Net interest income $ 49,572 Less PPP loan interest income (2,680) Net interest income adjusted for PPP loans $ 46,892 Average interest-earning assets 6,242,421 Less average PPP loans (220,965) Average interest-earning assets adjusted for PPP loans $ 6,021,456 NIM(2) 3.19% NIM adjusted for PPP loans (2) 3.12% Efficiency Ratio Noninterest expense 30,783 Less PPP deferred origination costs 13 Noninterest expense adjusted for PPP loans $ 30,796 Net interest income plus noninterest income $ 58,458 Less securities and PPP gains (203) Net interest income plus noninterest income adjusted for securities and PPP gains $ 58,255 Efficiency ratio (3) 52.66% Efficiency ratio adjusted for PPP loans and securities gains (3) 52.86% ($ in thousands, except share and per share data) 1) There were no preferred shares outstanding at June 30, 2021 2) Net interest income (as applicable) divided by average interest-earning assets (as applicable), annualized 3) Noninterest expense (as applicable) divided by the sum of net interest income and noninterest income (as applicable)

Non-GAAP Reconciliation – PPP (1Q21) In response to the Covid-19 pandemic, the Coronavirus Aid, Relief and Economic Security Act (the “CARES Act”) was adopted, which included authorization for the U.S. Small Business Administration (the “SBA”) to introduce a new program, entitled the “Paycheck Protection Program,” which provides loans for eligible businesses through the SBA’s 7(a) loan guaranty program. These loans are fully guaranteed and available for loan forgiveness of up to the full principal amount so long as certain employee and compensation levels of the business are maintained and the proceeds of the loan are used as required under the program. The Paycheck Protection Program (“PPP”) and loan forgiveness are intended to provide economic relief to small businesses nationwide adversely impacted under the COVID-19 pandemic. Hanmi participated in this program and the financial information for the 2021 first quarter reflects this participation. This table shows financial information excluding the effect of the origination of the PPP loans, including the corresponding interest income earned on such loans, which constitutes a non-GAAP measure. Management believes the presentation of certain financial measures excluding the effect of PPP loans provides useful supplemental information that is essential to a proper understanding of the financial condition and results of operations of Hanmi. This disclosure should not be viewed as a substitution for results determined in accordance with GAAP, nor is it necessarily comparable to non-GAAP financial measures that may be used by other companies. As of March 31, 2021 Tangible Common Equity to Tangible Assets Tangible assets $ 6,426,843 Less first and second draw PPP loans (278,200) Tangible assets adjusted for PPP loans $ 6,148,643 Tangible stockholders' equity 1 $ 570,264 TCE / TA Ratio1 8.87% TCE / TA Ratio adjusted for PPP loans1 9.27% Allowance for Credit Losses to Loans Receivable Allowance for credit losses $ 88,392 Loans receivable $ 4,817,151 Less first draw PPP loans (256,457) Loans receivable adjusted for PPP loans $ 4,560,694 ACL / Loans Receivable 1.83% ACL / Loans Receivable adjusted for PPP loans 1.94% Three Months Ended March 31, 2021Net Interest Margin Net interest income $ 46,001 Less PPP loan interest income (1,865) Net interest income adjusted for PPP loans $ 44,136 Average interest-earning assets 6,029,834 Less average PPP loans (308,543) Average interest-earning assets adjusted for PPP loans $ 5,721,291 NIM2 3.09% NIM adjusted for PPP loans 2 3.13% Efficiency Ratio Noninterest expense 29,535 Less PPP deferred origination costs 1,390 Noninterest expense adjusted for PPP loans $ 30,925 Net interest income plus noninterest income $ 55,809 Less securities and PPP gains (2,553) Net interest income plus noninterest income adjusted for securities and PPP gains $ 53,256 Efficiency ratio 3 52.92% Efficiency ratio adjusted for PPP loans and securities gains 3 58.07% ($ in thousands, except share and per share data) 1) There were no preferred shares outstanding at March 31, 2021 2) Net interest income (as applicable) divided by average interest-earning assets (as applicable), annualized 3) Noninterest expense (as applicable) divided by the sum of net interest income and noninterest income (as applicable)
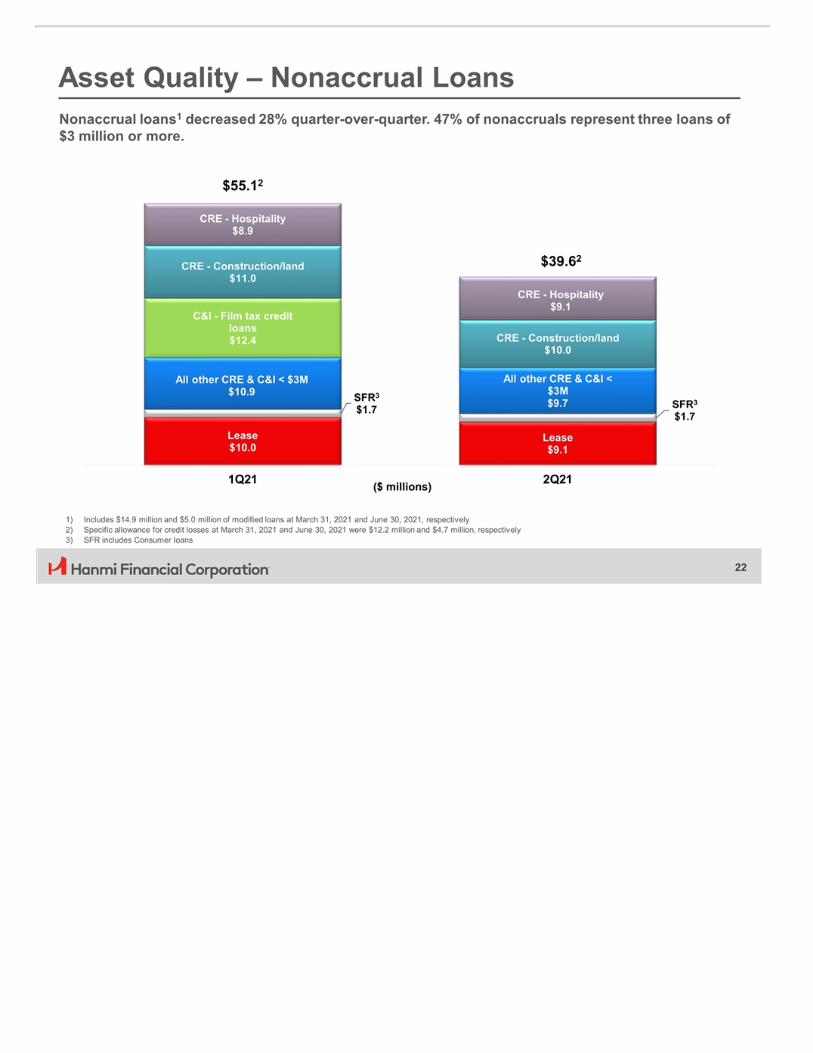
Non-GAAP Reconciliation – PPP (4Q20) In response to the Covid-19 pandemic, the Coronavirus Aid, Relief and Economic Security Act (the “CARES Act”) was adopted, which included authorization for the U.S. Small Business Administration (the “SBA”) to introduce a new program, entitled the “Paycheck Protection Program,” which provides loans for eligible businesses through the SBA’s 7(a) loan guaranty program. These loans are fully guaranteed and available for loan forgiveness of up to the full principal amount so long as certain employee and compensation levels of the business are maintained and the proceeds of the loan are used as required under the program. The Paycheck Protection Program (“PPP”) and loan forgiveness are intended to provide economic relief to small businesses nationwide adversely impacted under the COVID-19 pandemic. Hanmi participated in this program and the financial information for the 2020 fourth quarter reflects this participation. This table shows financial information excluding the effect of the origination of the PPP loans, including the corresponding interest income earned on such loans, which constitutes a non-GAAP measure. Management believes the presentation of certain financial measures excluding the effect of PPP loans provides useful supplemental information that is essential to a proper understanding of the financial condition and results of operations of Hanmi. This disclosure should not be viewed as a substitution for results determined in accordance with GAAP, nor is it necessarily comparable to non-GAAP financial measures that may be used by other companies. As of December 31, 2020 Tangible Common Equity to Tangible Assets Tangible assets $ 6,190,276 Less PPP loans (295,702) Tangible assets adjusted for PPP loans $ 5,894,574 Tangible stockholders' equity 1 $ 565,432 TCE / TA Ratio 9.13% TCE / TA Ratio adjusted for PPP loans 9.59% Allowance for Credit Losses to Loans Receivable Allowance for credit losses $ 90,426 Loans receivable $ 4,880,168 Less PPP loans (295,702) Loans receivable adjusted for PPP loans $ 4,584,466 ACL / Loans Receivable 1.85% ACL / Loans Receivable adjusted for PPP loans 1.97% Three Months Ended December 31, 2020 Net Interest Margin Net interestincome $ 46,877 Less PPP loan interest income (1,751) Net interest income adjusted for PPP loans $ 45,126 Average interest-earning assets $ 5,956,208 Less average PPP loans (304,017) Average interest-earning assets adjusted for PPP loans $ 5,652,191 NIM2 3.13% NIM adjusted for PPP loans 2 3.18% Efficiency Ratio Noninterest expense $ 30,923 Less PPP deferred origination costs - Noninterest expense adjusted for PPP loans $ 30,923 Net interest income plus noninterest income $ 55,686 Less net gain on sales of securities - Net interest income plus noninterest income adjusted for net securities gains $ 55,686 Efficiency ratio 3 55.53% Efficiency ratio adjusted for PPP loans and securities gains 3 55.53% ($ in thousands, except share and per share data) (1) There were no preferred shares outstanding at December 31, 2020 (2) Net interest income (as applicable) divided by average interest-earning assets (as applicable), annualized (3) Noninterest expense (as applicable) divided by the sum of net interest income and noninterest income (as applicable)

Non-GAAP Reconciliation – PPP (3Q20) In response to the Covid-19 pandemic, the Coronavirus Aid, Relief and Economic Security Act (the “CARES Act”) was adopted, which included authorization for the U.S. Small Business Administration (the “SBA”) to introduce a new program, entitled the “Paycheck Protection Program,” which provides loans for eligible businesses through the SBA’s 7(a) loan guaranty program. These loans are fully guaranteed and available for loan forgiveness of up to the full principal amount so long as certain employee and compensation levels of the business are maintained and the proceeds of the loan are used as required under the program. The Paycheck Protection Program (“PPP”) and loan forgiveness are intended to provide economic relief to small businesses nationwide adversely impacted under the COVID-19 pandemic. Hanmi participated in this program and the financial information for the 2020 third quarter reflects this participation. This table shows financial information excluding the effect of the origination of the PPP loans, including the corresponding interest income earned on such loans, which constitutes a non-GAAP measure. Management believes the presentation of certain financial measures excluding the effect of PPP loans provides useful supplemental information that is essential to a proper understanding of the financial condition and results of operations of Hanmi. This disclosure should not be viewed as a substitution for results determined in accordance with GAAP, nor is it necessarily comparable to non-GAAP financial measures that may be used by other companies. As of September 30, 2020 Tangible Common Equity to Tangible Assets Tangible assets $ 6,095,105 Less PPP loans (302,929) Tangible assets adjusted for PPP loans $ 5,792,176 Tangible stockholders' equity 1 $ 551,526 TCE / TA Ratio 9.05% TCE / TA Ratio adjusted for PPP loans 9.52% Allowance for Credit Losses to Loans Receivable Allowance for credit losses $ 86,620 Loans receivable $ 4,834,137 Less PPP loans (302,929) Loans receivable adjusted for PPP loans $ 4,531,208 ACL / Loans Receivable 1.79% ACL / Loans Receivable adjusted for PPP loans 1.91% Three Months Ended September 30, 2020 Net Interest Margin Net interestincome $ 45,605 Less PPP loan interest income (1,713) Net interest income adjusted for PPP loans $ 43,892 Average interest-earning assets $ 5,787,667 Less average PPP loans (302,365) Average interest-earning assets adjusted for PPP loans $ 5,485,302 NIM2 3.13% NIM adjusted for PPP loans 2 3.18% Efficiency Ratio Noninterest expense $ 29,924 Less PPP deferred origination costs - Noninterest expense adjusted for PPP loans $ 29,924 Net interest income plus noninterest income $ 52,745 Less net gain on sales of securities - Net interest income plus noninterest income adjusted for net securities gains $ 52,745 Efficiency ratio 3 56.73% Efficiency ratio adjusted for PPP loans and securities gains 3 56.73% ($ in thousands, except share and per share data) (1) There were no preferred shares outstanding at September 30, 2020 (2) Net interest income (as applicable) divided by average interest-earning assets (as applicable), annualized (3) Noninterest expense (as applicable) divided by the sum of net interest income and noninterest income (as applicable)