Embed Size (px)
Citation preview

April 24, 2006 File: 64145/PW1 Mark Arniola City of Oakland PWA-WSD 250 Frank Ogawa Plaza, Suite 5301 Oakland, California Subject: Analytical Results of Randomly Selected Sample Locations Within
the Ettie Street Pump Station Watershed, Oakland, California Dear Mr. Arniola: Kleinfelder, Inc. (Kleinfelder) prepared this letter report to document the analytical results of samples collected from randomly selected locations within the Ettie Street Pump Station Watershed (Watershed) in Oakland, California. This investigation was performed at the request of the City of Oakland (City). The samples were analyzed for polychlorinated biphenyl (PCBs) congeners, total organic carbon, and grain size. A total of 18 sampling locations were randomly selected for this investigation. Each sampling location consisted of approximately an entire block. The selection of sampling locations consisted of a three-step process.
1) The first step was to divide the watershed into 9-grid cells (zones).
2) The second step consisted of subdividing each zone into 9 areas, which were labeled 1 through 9. Using a random number generator, two areas were randomly selected from each zone, for a total of 18 areas.
3) The third step consisted of subdividing each of the randomly selected areas into 9 potential sampling locations. Each sampling location was subsequently numbered 1 through 9, and with the aid of a random number generator, one of the 9 sampling locations was randomly selected from each of the 18 areas.
The randomly selected sampling locations are presented in Plate 1. SAMPLE COLLECTION
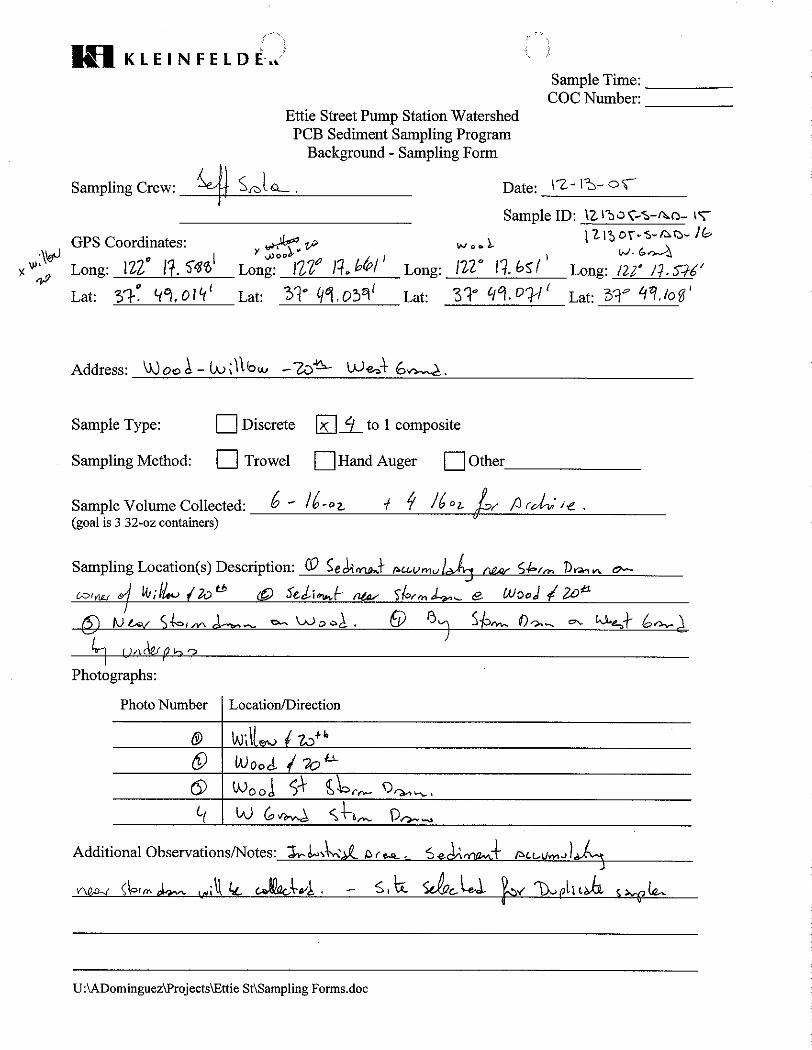
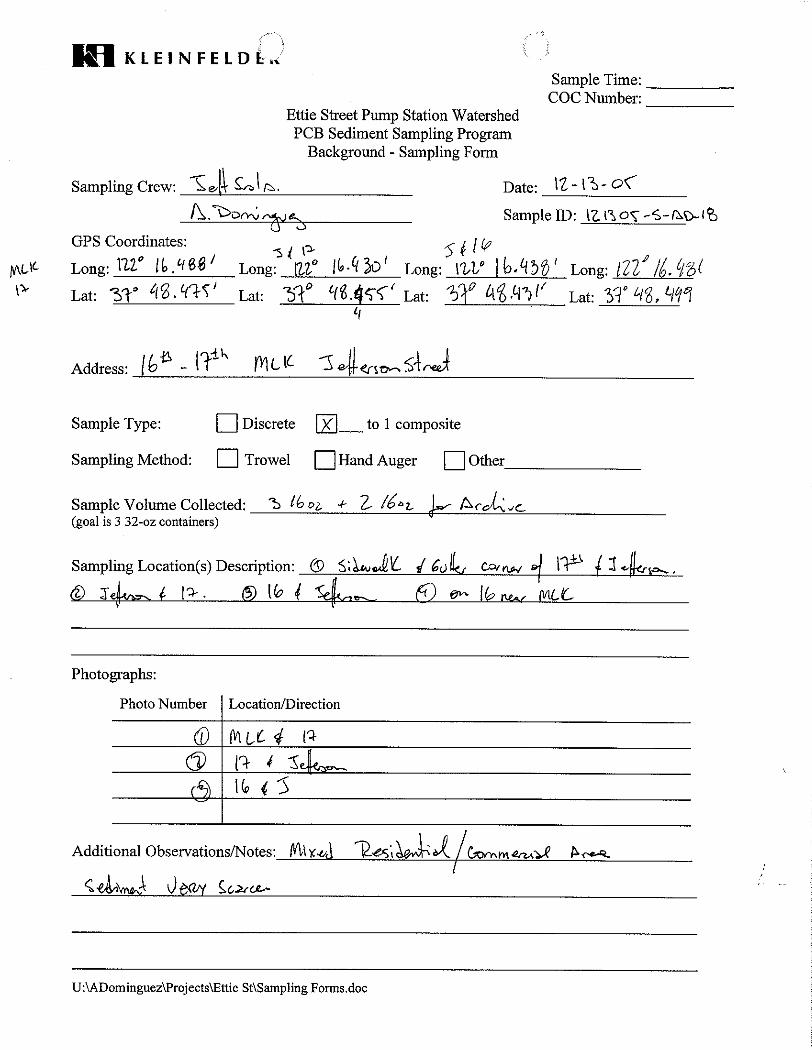
Sediments that had accumulated in the public right-of-way were sampled from each of the randomly selected locations between December 7 and December 13, 2005. Two
64145/PW1 (OAK6P034)/es Page 1 of 4 April 24, 2006 Copyright 2006 Kleinfelder Inc.

duplicate samples were collected from 2 randomly selected locations, for a total of 20 samples. Samples were collected in accordance with the methodology specified in the Sampling and Analysis Plan (SAP) prepared for a Proposition 13 grant to further evaluate sources of PCBs detected in sediment at the Ettie Street Pump Station (Applied Marine Sciences, 2004b). At each randomly selected sampling location, composite samples were collected from two to four locations. Coordinates, latitude and longitude, for each sampling location were obtained with a handheld Garmin Map 76 Global Positioning System unit, and recorded as part of the field notes. Field notes are presented in Appendix A. Samples were collected in areas where sediment appeared to naturally accumulate. These areas included: storm drains, street gutters, and sidewalks. Sediment samples were scooped with a trowel from cracks in the sidewalk or driveway, and placed in a bucket. The sediment was composited in the bucket into a single sample that was deemed representative of the sediments accumulating in the randomly selected location. The samples were then placed into laboratory-provided glass jars. Each sample jar was labeled and identified with a unique sample identification code as specified in the SAP. The labeled jars were placed in chilled coolers until delivery to the analytical laboratory. ANALYTICAL PROGRAM
Sediment samples were delivered to Columbia Analytical in Kelso, WA, via overnight courier service, under chain of custody protocols. Samples were analyzed for PCB congeners following the United States Environmental Protection Agency (EPA) Method 8082, for total solids by EPA Method 160.3, and for total organic carbon (TOC) and grain size following the Puget Sound Estuary Protocols. Samples were analyzed on a standard turnaround time, approximately six weeks per batch. The chain-of-custody records for this investigation are presented in Appendix B. DATA QUALITY
Analytical data quality objectives (DQOs) were presented in Section 3.3 of the Quality Assurance Project Plan (QAPP) prepared for the Proposition 13 grant and specified in Tables 3 (Data Quality Objectives for Analysis of Organic Pollutants in Sediment Samples), 4 (Data Quality Objectives for Analysis of Total Organic Carbon and Grain Size in Sediment Samples), and 5 (Data Quality Objectives for Analysis of Organic Pollutants in Aqueous Samples) (Applied Marine Sciences, 2004a). The specified DQOs were met for the data collected from the randomly selected sampling locations. RESULTS
PCB concentrations detected in the sediment samples ranged from 17 micrograms per kilogram (µg/Kg) to 2,287 µg/Kg. The Regional Water Quality Control Board (RWQCB) has established Environmental Screening Levels (ESLs) for PCBs in
64145/PW1 (OAK6P034)/es Page 2 of 4 April 24, 2006 Copyright 2006 Kleinfelder Inc.
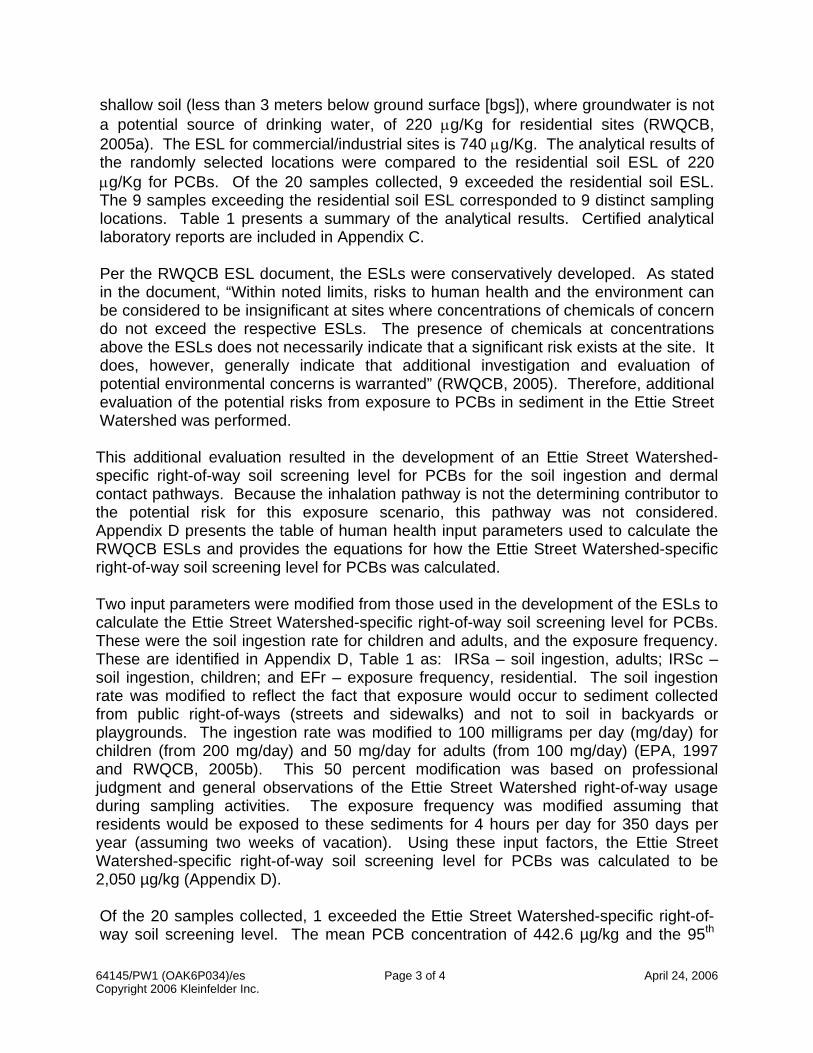
shallow soil (less than 3 meters below ground surface [bgs]), where groundwater is not a potential source of drinking water, of 220 µg/Kg for residential sites (RWQCB, 2005a). The ESL for commercial/industrial sites is 740 µg/Kg. The analytical results of the randomly selected locations were compared to the residential soil ESL of 220 µg/Kg for PCBs. Of the 20 samples collected, 9 exceeded the residential soil ESL. The 9 samples exceeding the residential soil ESL corresponded to 9 distinct sampling locations. Table 1 presents a summary of the analytical results. Certified analytical laboratory reports are included in Appendix C. Per the RWQCB ESL document, the ESLs were conservatively developed. As stated in the document, “Within noted limits, risks to human health and the environment can be considered to be insignificant at sites where concentrations of chemicals of concern do not exceed the respective ESLs. The presence of chemicals at concentrations above the ESLs does not necessarily indicate that a significant risk exists at the site. It does, however, generally indicate that additional investigation and evaluation of potential environmental concerns is warranted” (RWQCB, 2005). Therefore, additional evaluation of the potential risks from exposure to PCBs in sediment in the Ettie Street Watershed was performed. This additional evaluation resulted in the development of an Ettie Street Watershed-specific right-of-way soil screening level for PCBs for the soil ingestion and dermal contact pathways. Because the inhalation pathway is not the determining contributor to the potential risk for this exposure scenario, this pathway was not considered. Appendix D presents the table of human health input parameters used to calculate the RWQCB ESLs and provides the equations for how the Ettie Street Watershed-specific right-of-way soil screening level for PCBs was calculated. Two input parameters were modified from those used in the development of the ESLs to calculate the Ettie Street Watershed-specific right-of-way soil screening level for PCBs. These were the soil ingestion rate for children and adults, and the exposure frequency. These are identified in Appendix D, Table 1 as: IRSa – soil ingestion, adults; IRSc – soil ingestion, children; and EFr – exposure frequency, residential. The soil ingestion rate was modified to reflect the fact that exposure would occur to sediment collected from public right-of-ways (streets and sidewalks) and not to soil in backyards or playgrounds. The ingestion rate was modified to 100 milligrams per day (mg/day) for children (from 200 mg/day) and 50 mg/day for adults (from 100 mg/day) (EPA, 1997 and RWQCB, 2005b). This 50 percent modification was based on professional judgment and general observations of the Ettie Street Watershed right-of-way usage during sampling activities. The exposure frequency was modified assuming that residents would be exposed to these sediments for 4 hours per day for 350 days per year (assuming two weeks of vacation). Using these input factors, the Ettie Street Watershed-specific right-of-way soil screening level for PCBs was calculated to be 2,050 µg/kg (Appendix D). Of the 20 samples collected, 1 exceeded the Ettie Street Watershed-specific right-of-way soil screening level. The mean PCB concentration of 442.6 µg/kg and the 95th
64145/PW1 (OAK6P034)/es Page 3 of 4 April 24, 2006 Copyright 2006 Kleinfelder Inc.

percentile upper confidence limit (UCL95) of the mean concentration of 672.8 µg/kg for the 20 samples collected did not exceed the Ettie Street Watershed-specific right-of-way soil screening level. The UCL95 value represents a reasonable upper end estimate of the concentration likely to be contacted over time (EPA, 1989 and 2002).
64145/PW1 (OAK6P034)/es Page 4 of 4 April 24, 2006 Copyright 2006 Kleinfelder Inc.

BIBLIOGRAPHY
Applied Marine Sciences. 2004a. Quality Assurance Project Plan for the City of
Oakland PCB Abatement Grant Project in the Ettie Street Pump Station Watershed, Oakland, California. September 17.
Applied Marine Sciences. 2004b. Sampling and Analysis Plan for the City of Oakland
PCB Abatement Grant Project in the Ettie Street Pump Station Watershed, Oakland, California. November 23.
California Environmental Protection Agency. 2000. Air Toxics Hot Spots Program Risk
Assessment Guidelines. Part IV. Technical Support Document for Exposure Assessment and Stochastic Analysis. Office of Environmental Health Hazard Assessment. September.
California Environmental Protection Agency. 2002. Air Toxics Hot Spots Program Risk
Assessment Guidelines. Part II. Technical Support Document for Describing Available Cancer Potency Factors. Office of Environmental Health Hazard Assessment. December.
Regional Water Quality Control Board. 2005a. Screening for Environmental Concerns
at Sites with Contaminated Soil and Groundwater – Volume 1: Summary Tier 1 Lookup Tables. Interim Final. February.
Regional Water Quality Control Board. 2005b. Screening for Environmental Concerns
at Sites with Contaminated Soil and Groundwater – Volume 2: Background Documentation for the Development of Tier 1 Environmental Screening Levels. Interim Final. February.
United States Environmental Protection Agency. 1989. Risk Assessment Guidance for
Superfund, Volume 1 – Human Health Evaluation Manual (Part A). Interim Final. Office of Emergency and Remedial Response. Washington, DC. EPA/540/1-89/002.
United States Environmental Protection Agency. 1991. Risk Assessment Guidance for
Superfund, Volume 1 – Human Health Evaluation Manual. Supplemental Guidance. Standard Default Exposure Factors. Interim Final. Office of Emergency and Remedial Response. Washington, DC. PB91-921314.
United States Environmental Protection Agency. 1997. Exposure Factors Handbook.
Volume 1 – General Factors. Update to Exposure Factors Handbook – May 1989. Office of Research and Development. Washington, DC. EPA/600/P-95/002Fa. August.

United States Environmental Protection Agency. 2002. Calculating Upper Confidence Limits for Exposure Point Concentrations at Hazardous Waste Sites. Office of Emergency and Remedial Response. Washington, DC. OSWER 9285.6-10. December.
United States Environmental Protection Agency. 2004. Preliminary Remediation
Goals. Region 9. October.

TABLE
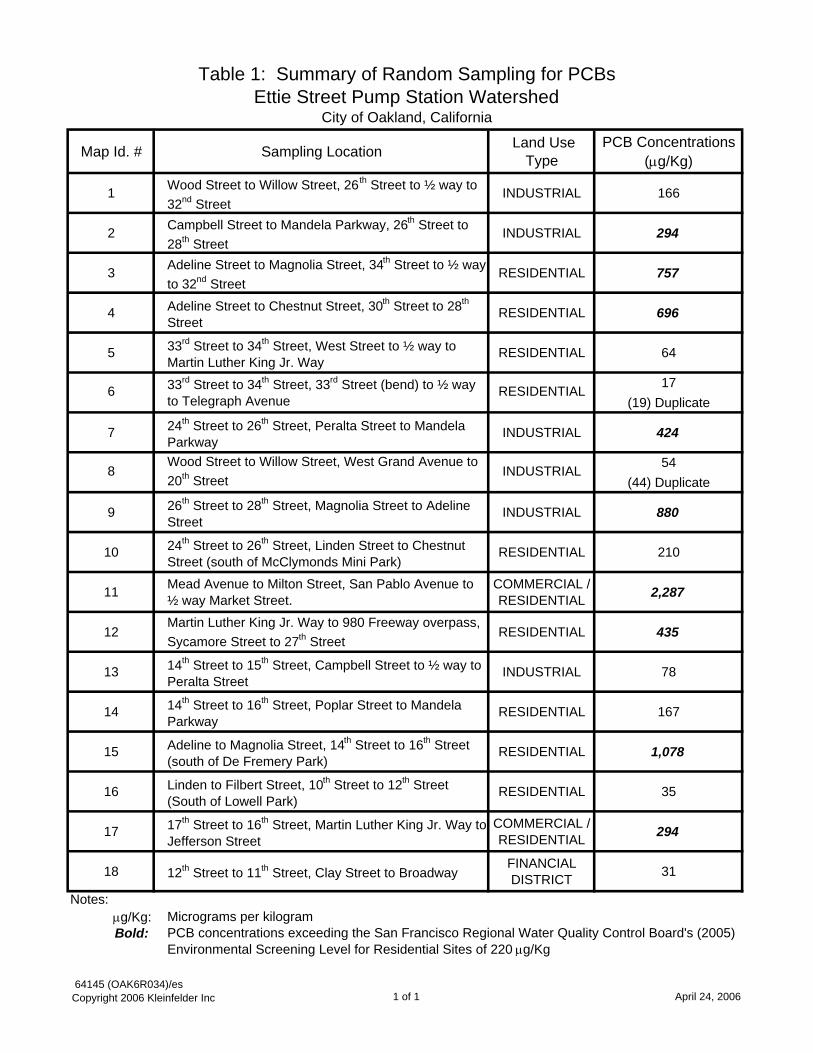
Table 1: Summary of Random Sampling for PCBsEttie Street Pump Station Watershed
City of Oakland, California
Map Id. # Sampling Location Land Use Type
PCB Concentrations (µg/Kg)
1 Wood Street to Willow Street, 26th Street to ½ way to 32nd Street
INDUSTRIAL 166
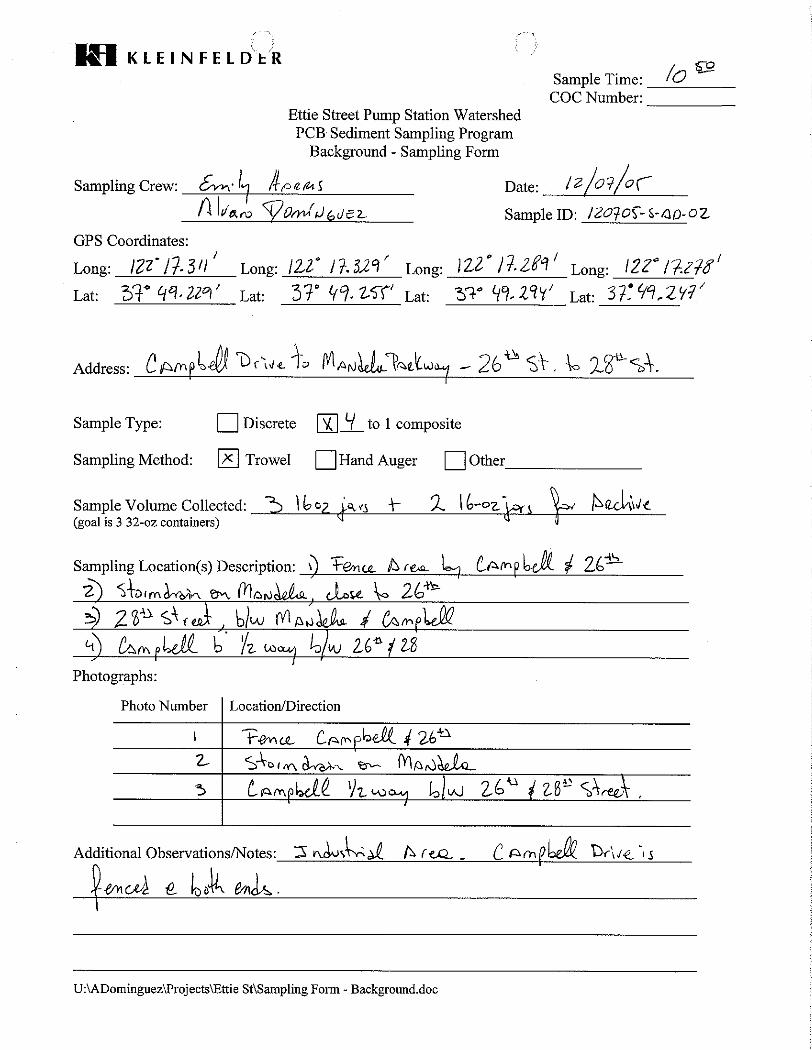
2 Campbell Street to Mandela Parkway, 26th Street to 28th Street
INDUSTRIAL 294
3 Adeline Street to Magnolia Street, 34th Street to ½ way to 32nd Street
RESIDENTIAL 757
4 Adeline Street to Chestnut Street, 30th Street to 28th
StreetRESIDENTIAL 696
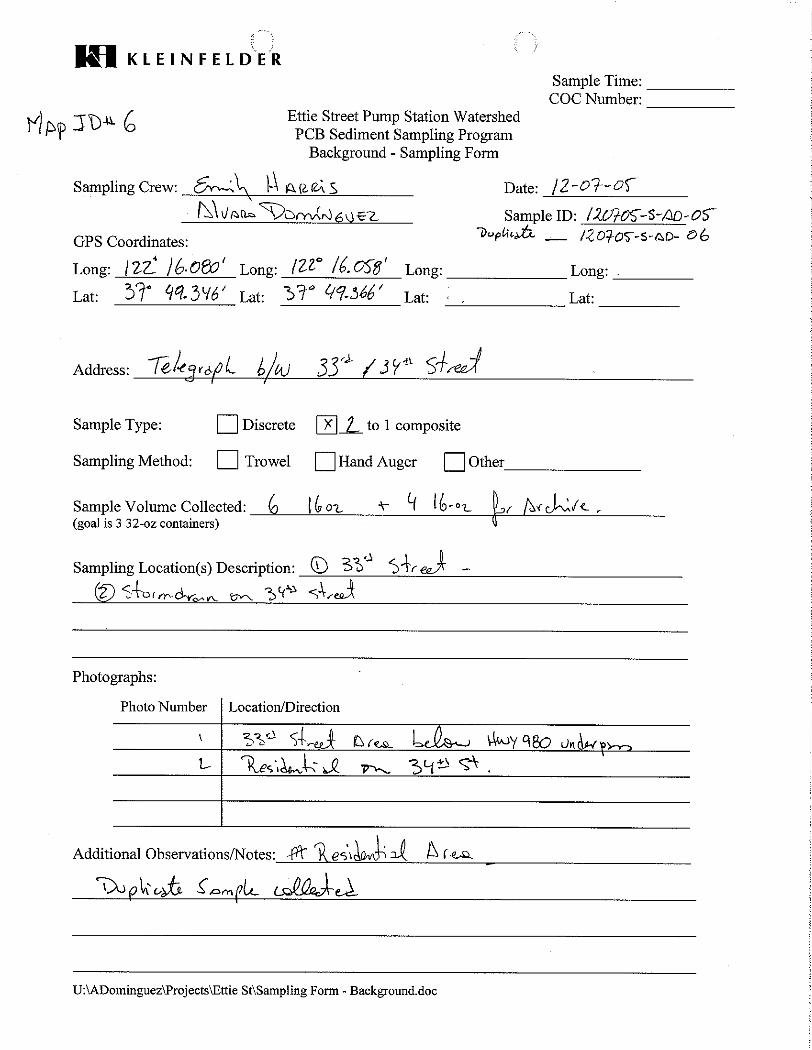
5 33rd Street to 34th Street, West Street to ½ way to Martin Luther King Jr. Way
RESIDENTIAL 64
17(19) Duplicate
7 24th Street to 26th Street, Peralta Street to Mandela Parkway
INDUSTRIAL 424
54(44) Duplicate
9 26th Street to 28th Street, Magnolia Street to Adeline Street
INDUSTRIAL 880
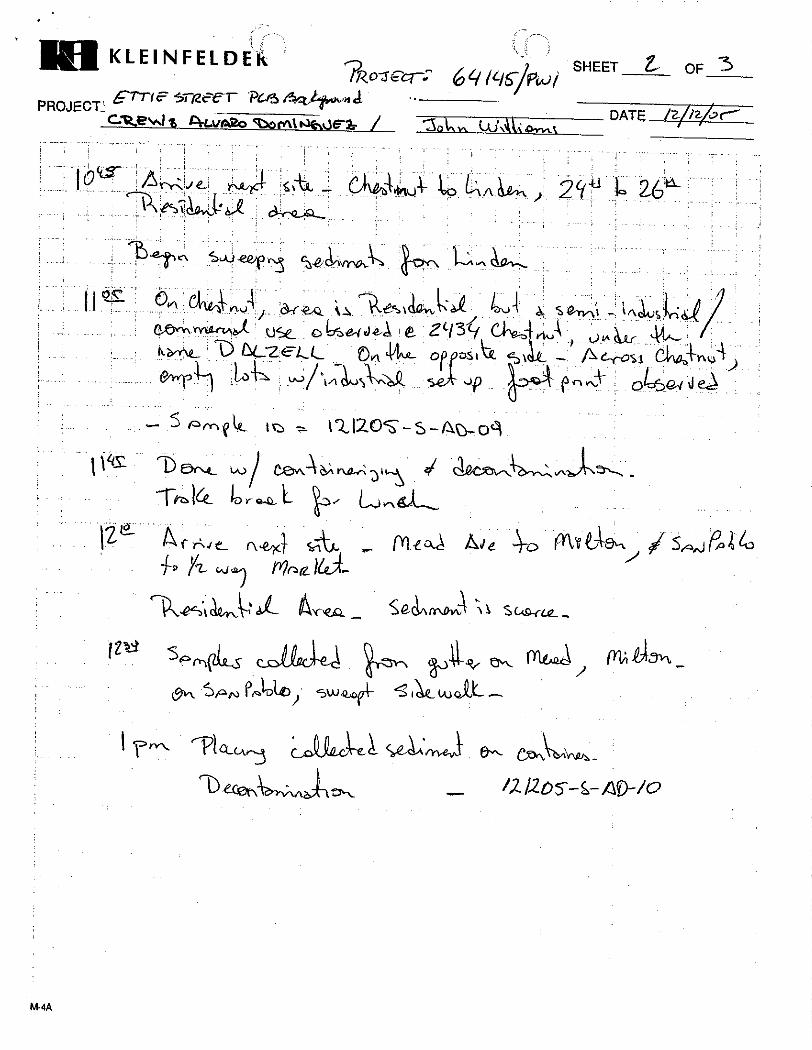
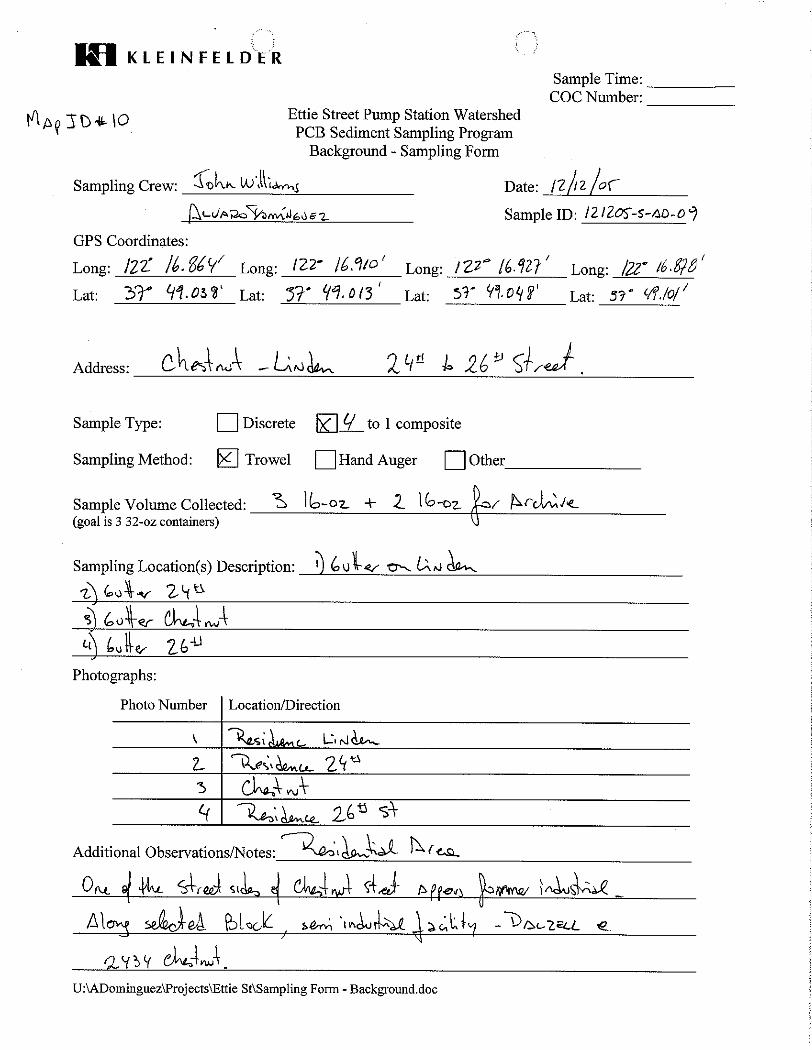
10 24th Street to 26th Street, Linden Street to Chestnut Street (south of McClymonds Mini Park)
RESIDENTIAL 210
11 Mead Avenue to Milton Street, San Pablo Avenue to ½ way Market Street.
COMMERCIAL / RESIDENTIAL 2,287
12Martin Luther King Jr. Way to 980 Freeway overpass, Sycamore Street to 27th Street
RESIDENTIAL 435
13 14th Street to 15th Street, Campbell Street to ½ way to Peralta Street
INDUSTRIAL 78
14 14th Street to 16th Street, Poplar Street to Mandela Parkway
RESIDENTIAL 167
15 Adeline to Magnolia Street, 14th Street to 16th Street (south of De Fremery Park)
RESIDENTIAL 1,078
16 Linden to Filbert Street, 10th Street to 12th Street (South of Lowell Park)
RESIDENTIAL 35
17 17th Street to 16th Street, Martin Luther King Jr. Way to Jefferson Street
COMMERCIAL / RESIDENTIAL 294
18 12th Street to 11th Street, Clay Street to BroadwayFINANCIAL DISTRICT 31
Notes:µg/Kg: Micrograms per kilogramBold:
Environmental Screening Level for Residential Sites of 220 µg/KgPCB concentrations exceeding the San Francisco Regional Water Quality Control Board's (2005)
6 33rd Street to 34th Street, 33rd Street (bend) to ½ way to Telegraph Avenue
RESIDENTIAL
8Wood Street to Willow Street, West Grand Avenue to 20th Street
INDUSTRIAL
64145 (OAK6R034)/esCopyright 2006 Kleinfelder Inc 1 of 1 April 24, 2006

PLATE

1
212
3
4
5
6
7
8
9
10
11 12
13
14
15
1617
18
C
PC
B R
AN
DO
M S
AM
PL
ING
LO
CA
TIO
NS
1

APPENDIX A
FIELD NOTES


APPENDIX B
SAMPLING FORMS


APPENDIX C
ANALYTICAL LABORATORY REPORT
Appendix C contains the analytical results of the private property sampling. The results are organized in an Excel spreadsheet. Please note that the
data is not formatted for printing.
APPENDIX D
HUMAN EXPOSURE PARAMETERS DEFINITIONS AND DEFAULT VALUES (TABLE 1)
And
EQUATION FOR CALCULATING THE ETTIE STREET WATERSHED-SPECIFIC
RIGHT OF WAY PCB SOIL SCREENING LEVEL
Table 1 printed from Screening for Environmental Concerns at Sites with Contaminated Soil and Groundwater – Volume 2: Background
Documentation for the Development of Tier 1 Environmental Screening Levels. Regional Water Quality Control Board. Appendix 2. 2005
February. Interim Final.


CALCULATION ETTIE STREET WATERSHED-SPECIFIC HUMAN HEALTH SOIL SCREENING
LEVEL FOR PCBS RESIDENTIAL EXPOSURE
• Value calculated for carcinogenic effects. • Methodology and assumptions based on US EPA Region 9 Preliminary
Remediation Goal calculations (October, 2004) as used in the RQWCB ESL calculations (RWQCB, 2005a) and CALEPA (December, 2002), except where noted.
• Exposure pathways considered include incidental soil ingestion and dermal
contact with soil. Inhalation of PCB vapors from soil was not considered. Ettie Street Watershed@ Specific Level =
TR x ATc
EFrIFSadj x CSFo
106 mgkgffffffffffff
d e
ffffffffffffffffffffffffffffffffffffffffffffffh
l
j
i
m
k+SFSadj x ABS x CSF o
106 mgkgffffffffffff
d e
fffffffffffffffffffffffffffffffffffffffffffffffffffffffffffffffffffffh
l
j
i
m
k
X
^
^
^
\
^
^
^
Z
Y
^
^
^
]
^
^
^
[
fffffffffffffffffffffffffffffffffffffffffffffffffffffffffffffffffffffffffffffffffffffffffffffffffffffffffffffffffffffff
Where: Ettie Street Watershed-Specific Level = mg/kg TR = Target cancer risk (1 x 10⁻⁶) ATc = Averaging time for carcinogens (25,550 days) EFr = Exposure frequency (4 hours/day, 350 days/year or 58 days/year, Site-specific value) IFSadj = Age-adjusted ingestion factor (57 mg-yr/kg-day,
Site-specific value, see below) CSFo = Oral cancer slope factor (2.0 mg/kg-day-1) SFSadj = Age-adjusted skin contact factor (361 mg-yr/kg-day) ABS = Absorption fraction (0.14; CalEPA, 2000) Where:
IFS adj =
100 mgdayfffffffffffffffffffx 1
15 kgffffffffffffffx 6 years
f g
+50 mgdayffffffffffffffffx 1
70 kgffffffffffffffx 24 years
f g
= 57 mg@ yearkg@ dayffffffffffffffffffffffffffff

SFS adj =
5,700 cm2
dayffffffffffffffffffffffffffx 0.07 mg
cm2fffffffffffffffffffffx 1
70 kgffffffffffffffx 24 years
h
j
i
k+2,800 cm2
dayffffffffffffffffffffffffffx 0.2 mg
cm2ffffffffffffffffffx 1
15 kgffffffffffffffx 6 years
h
j
i
k
= 361 mg@ yearkg@ dayffffffffffffffffffffffffffff
Where: 100 mg/day = soil ingestion rate, child (Site-specific) 15 kg = body weight, child 6 years = exposure duration, child 50 mg/kg = soil ingestion rate, adult (Site-specific) 70 kg = body weight, adult 24 years = exposure duration, adult 5,700 cm2 = exposed skin surface area, adult resident 0.07 mg/cm2 = skin adherence factor, adult resident 2,800 cm2 = exposed skin surface area, child resident 0.2 mg/cm2 = skin adherence factor, child resident Therefore, the Ettie Street Watershed-specific Right-of-Way Soil Screening Level is:
=1 x10@
6x 25,550
58 57 x 2.0106 mg
kgffffffffff
fffffffffffffffffffffffffh
j
i
k+ 361 x 0.14 x 2.0106 mg
kgffffffffff
fffffffffffffffffffffffffffffffffffffffffffffffffffh
j
i
k
X
^
^
\
^
^
Z
Y
^
^
]
^
^
[
fffffffffffffffffffffffffffffffffffffffffffffffffffffffffffffffffffffffffffffffffffffffffffffffffffff
=
0.0255558 0.000114 + 0.00010108` a
ffffffffffffffffffffffffffffffffffffffffffffffffffffffffffffffffffffffffffffffffffffffffff
= 2.05 mg/kg or 2,050 µg/kg