Embed Size (px)
Citation preview

MULTIPLE CHOICE. Choose the one alternative that best completes the statement or answers the question.
Use the given frequency distribution to find the
(a) class width.
(b) class midpoints of the first class.
(c) class boundaries of the first class.
1) Height (in inches)
1) _______
A) (a) 3
(b) 51
(c) 50-52
B) (a) 2
(b) 51.5
(c) 49.5-52.5
C) (a) 3
(b) 51
(c) 49.5-52.5
D) (a) 2
(b) 51.5
(c) 50-52
2) Phone Calls (per day)
2) _______
A) (a) 3
(b) 10.5
(c) 8-11
B) (a) 4
(b) 10.5
(c) 8-11
C) (a) 4
(b) 9.5
(c) 7.5-11.5
D) (a) 3
(b) 9.5
(c) 7.5-11.5
3) Weight (in pounds)
3) _______
A) (a) 5
(b) 137
(c) 134.5-139.5
B) (a) 4
(b) 137.5
(c) 135-139
C) (a) 4
(b) 137.5
(c) 134.5-139.5
D) (a) 5
(b) 137
(c) 135-139
4) Miles (per day)
4) _______
A) (a) 2
(b) 1.5
(c) 0.5-2.5
B) (a) 1
(b) 1
(c) 1-2
C) (a) 2
(b) 1
(c) 1-2
D) (a) 1
(b) 1.5
(c) 0.5-2.5
SHORT ANSWER. Write the word or phrase that best completes each statement or answers the question.
Use the given frequency distribution to construct a frequency histogram, a relative frequency histogram and a
frequency polygon.

5) Height (in inches)
5) _____________
6) Weight (in pounds)
6) _____________
Use the given frequency distribution to construct a cumulative frequency distribution and an ogive.
7) Phone Calls (per day)
7) _____________
8) Height (in inches)
8) _____________
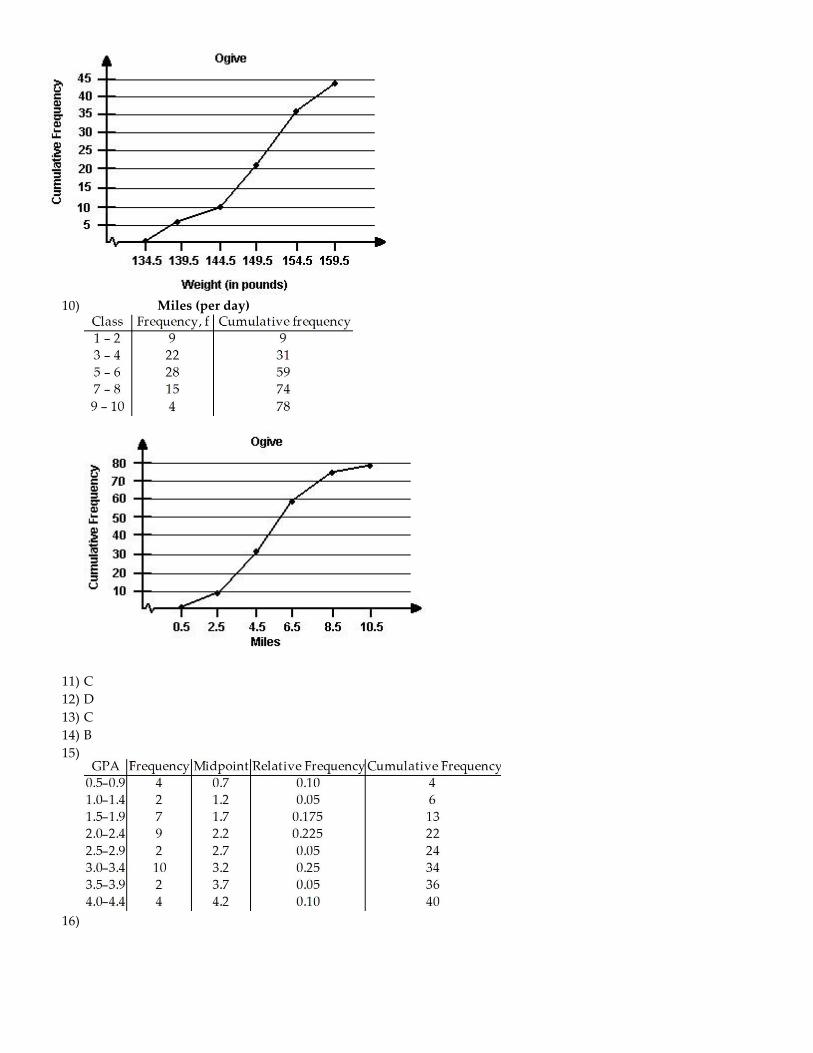
9) Weight (in pounds)
9) _____________
10) Miles (per day)
10) _____________
MULTIPLE CHOICE. Choose the one alternative that best completes the statement or answers the question.
Provide an appropriate response.
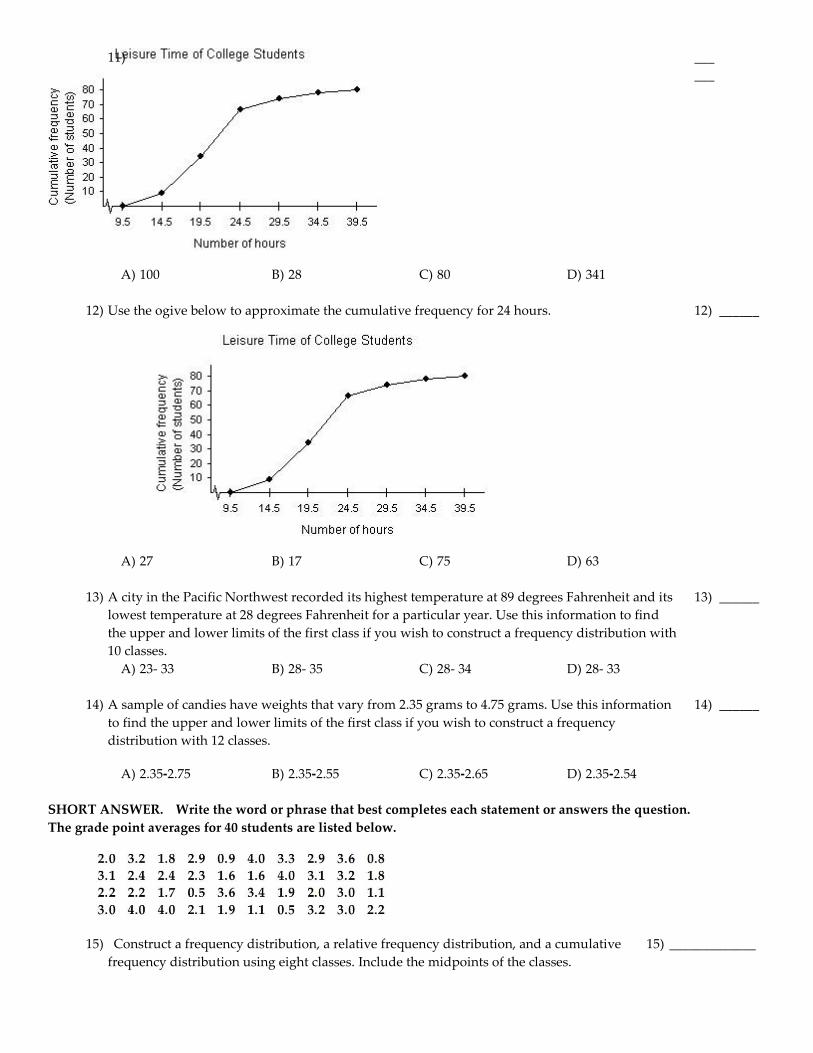
11) Use the ogive below to approximate the number in the sample.
11) ___
___
A) 100 B) 28 C) 80 D) 341
12) Use the ogive below to approximate the cumulative frequency for 24 hours.
12) ______
A) 27 B) 17 C) 75 D) 63
13) A city in the Pacific Northwest recorded its highest temperature at 89 degrees Fahrenheit and its
lowest temperature at 28 degrees Fahrenheit for a particular year. Use this information to find
the upper and lower limits of the first class if you wish to construct a frequency distribution with
10 classes.
13) ______
A) 23- 33 B) 28- 35 C) 28- 34 D) 28- 33
14) A sample of candies have weights that vary from 2.35 grams to 4.75 grams. Use this information
to find the upper and lower limits of the first class if you wish to construct a frequency
distribution with 12 classes.
14) ______
A) 2.35-2.75 B) 2.35-2.55 C) 2.35-2.65 D) 2.35-2.54
SHORT ANSWER. Write the word or phrase that best completes each statement or answers the question.
The grade point averages for 40 students are listed below.
15) Construct a frequency distribution, a relative frequency distribution, and a cumulative
frequency distribution using eight classes. Include the midpoints of the classes.
15) _____________

16) Construct a frequency histogram, a relative frequency histogram and a frequency
polygon using eight classes.
16) _____________
17) Construct an ogive using eight classes. 17) _____________
The heights (in inches) of 30 adult males are listed below.
18) Construct a frequency distribution, a relative frequency distribution, and a cumulative
frequency distribution using five classes.
18) _____________
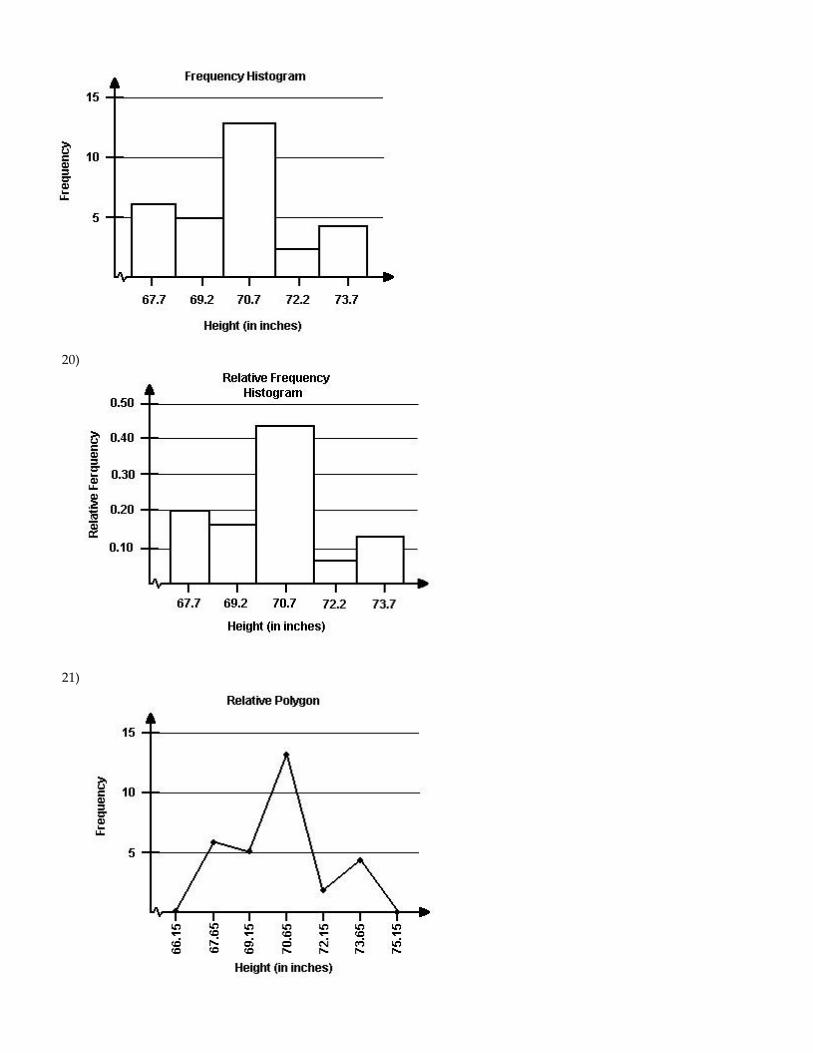
19) Construct a frequency histogram using five classes. 19) _____________
20) Construct a relative frequency histogram using five classes. 20) _____________
21) Construct a frequency polygon using five classes. 21) _____________
22) Construct a ogive using five classes. 22) _____________
The Highway Patrol, using radar, checked the speeds (in mph) of 30 passing motorists at a checkpoint. The results are
listed below.
23) Construct a frequency distribution, a relative frequency distribution, and a cumulative
frequency distribution using six classes.
23) _____________
24) Construct a frequency histogram, a relative frequency histogram and a frequency
polygon using six classes.
24) _____________
25) Construct an ogive using six classes. 25) _____________
Provide an appropriate response.
26) Listed below are the ACT scores of 40 randomly selected students at a major university.
a) Construct a relative frequency histogram of the data, using eight classes.
b) If the university wants to accept the top 90% of the applicants, what should the
minimum score be?
c) If the university sets the minimum score at 17, what percent of the applicants will be
accepted?
26) _____________
27) Explain the difference between class limits and class boundaries. 27) _____________

28) The numbers of home runs that Sammy Sosa hit in the first 15 years of his major league
baseball career are listed below. Make a stem-and-leaf plot for this data. What can you
conclude about the data?
28) _____________
29) The numbers of home runs that Barry Bonds hit in the first 18 years of his major league
baseball career are listed below. Make a stem-and-leaf plot for this data. What can you
conclude about the data?
29) _____________
MULTIPLE CHOICE. Choose the one alternative that best completes the statement or answers the question.
30) For the stem-and-leaf plot below, what is the maximum and what is the minimum entry?
Key : 7 = 11.7
30) ______
A) max: 17.3; min: 11.6 B) max: 173; min: 116
C) max: 17.3; min: 11.7 D) max: 17.0; min: 11.6
31) For the dot plot below, what is the maximum and what is the minimum entry?
31) ______
A) max: 54; min: 12 B) max: 54; min: 15
C) max: 14; min: 12 D) max: 17; min: 12
SHORT ANSWER. Write the word or phrase that best completes each statement or answers the question.
32) The heights (in inches) of 30 adult males are listed below. Construct a stem-and-leaf
chart for the data.
What can you conclude about the data?
32) _____________
33) The Highway Patrol, using radar, checked the speeds (in mph) of 30 passing motorists at
a checkpoint. The results are listed below. Construct a stem-and-leaf plot for the data,
listing each stem twice. What can you conclude about the data?

33) _____________
34) The Highway Patrol, using radar, checked the speeds (in mph) of 30 passing motorists at
a checkpoint. The results are listed below. Construct a dot plot for the data.
34) _____________
35) The heights (in inches) of 30 adult males are listed below. Construct a dot plot for the
data.
35) _____________
36) A study was conducted to determine how people get jobs. Four hundred subjects were
randomly selected and the results are listed below.
Construct a pie chart of the data.
36) _____________
37) A study was conducted to determine how people get jobs. Four hundred subjects were
randomly selected and the results are listed below.
Construct a Pareto chart of the data.
37) _____________
38) The heights (in inches) of 30 adult males are listed below. Construct a Pareto chart for
the data.
38) _____________
39) Use a scatter plot to display the data below. All measurements are in milligrams per
cigarette.

39) _____________
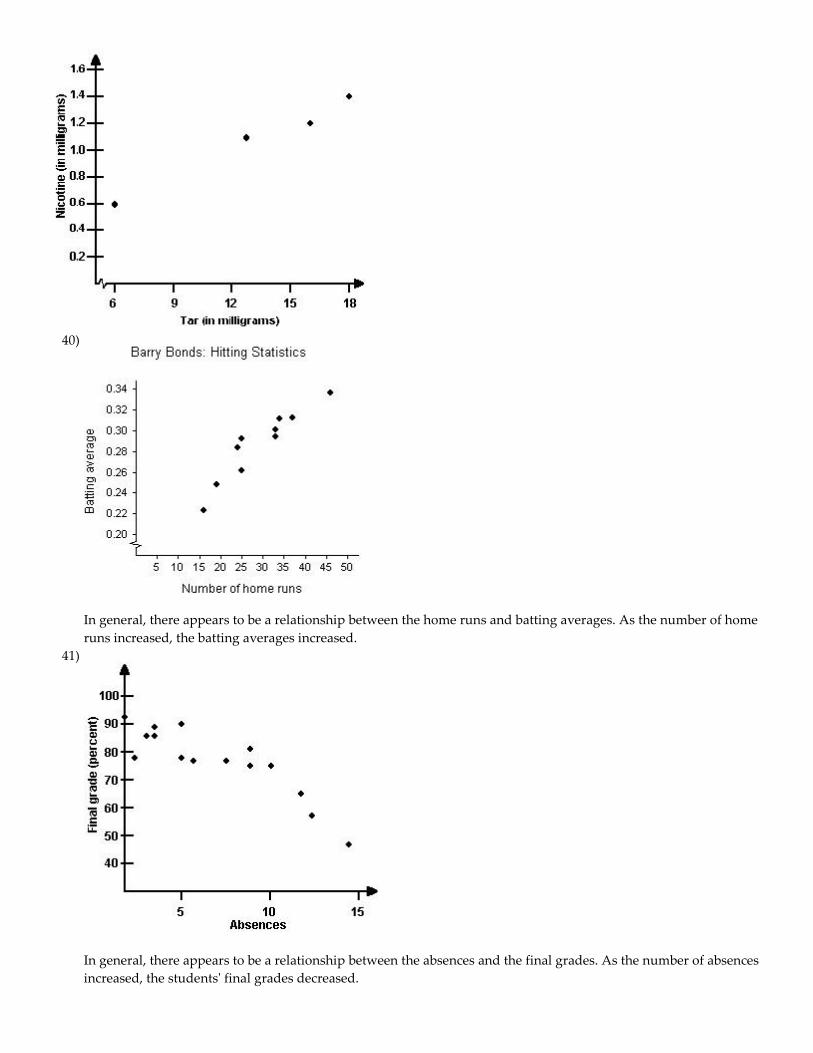
40) The numbers of home runs that Barry Bonds hit in the first 10 years of his major league
baseball career are listed below. Use a scatter plot to display the data. Is there a
relationship between the home runs and the batting averages?
40) _____________
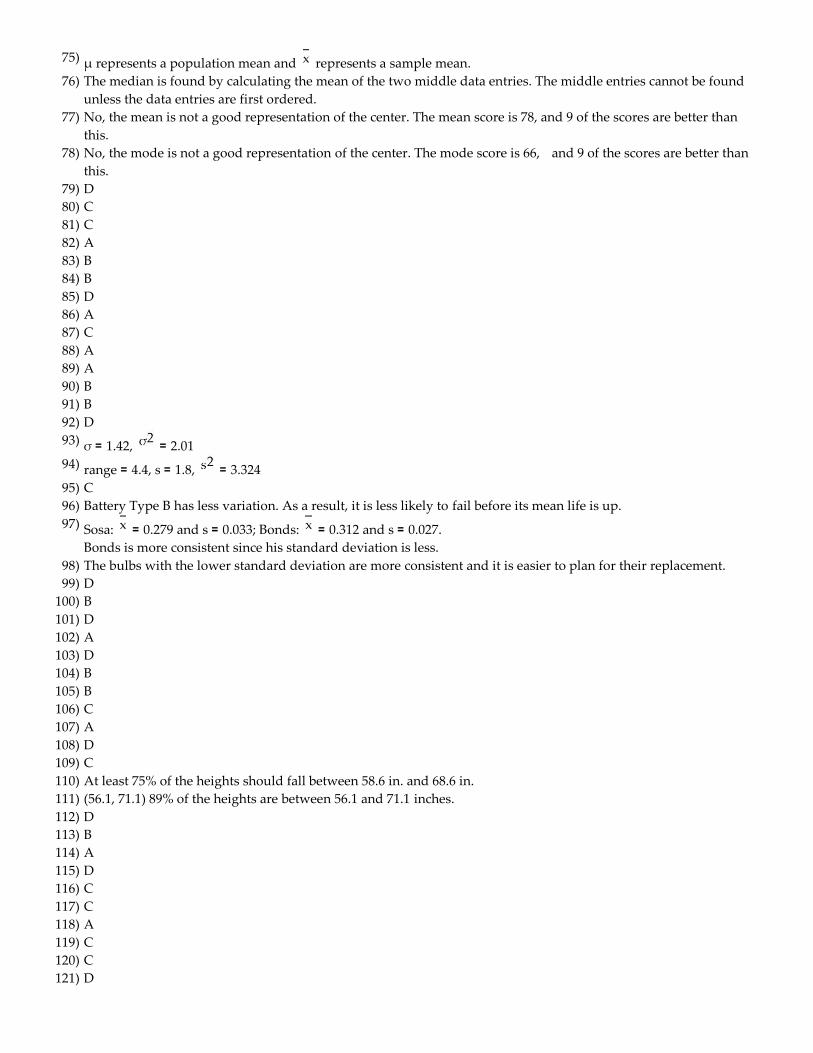
41) The data below represent the numbers of absences and the final grades of 15 randomly
selected students from a statistics class. Use a scatter plot to display the data. Is there a
relationship between the students' absences and their final grades?
41) _____________
42) The data below represent the infant mortality rates and the life expectancies for seven
selected countries in Africa. Use a scatter plot to display the data.
42) _____________
43) The data below represent the smoking prevalence among U.S. adults over a 35-year
period. Use a time series chart to display the data. Describe any trends shown.
43) _____________
44) A safety engineer wishes to use the following data to show the number of deaths from
the collision of passenger cars with trucks on a particular highway. Use a time series
chart to display the data. Describe any trends shown.
44)

________ _____
45) Women were allowed to enter the Boston Marathon for the first time in 1972. Listed
below are the winning women's times (in minutes) for the first 10 years. Use a time
series chart to display the data.
45) _____________
46) The five longest winning streaks for NCAA Men's Division I Basketball are listed below.
Construct a Pareto chart for the data.
46) _____________
47) The lengths, in kilometers, of the world's largest subway systems are listed below.
Construct a Pareto chart for the data.
47) _____________
48) The number of beds in a sample of 24 hospitals are listed below. Construct a
stem-and-leaf plot for the data.
149 167 162 127 130 180
160 167
221 145 137 194 207 150
254 262
244 287 137 204 166 174
180 151
48) _____________
49) The number of minutes that a dentist kept 20 patients waiting beyond their appointment
times are listed below. Construct a stem-and-leaf plot for the data.
49) _____________
50) A study was conducted to determine how certain families pay on their credit card
balances. Two hundred families with a household annual income between $25,000 and
$49,999 were randomly selected and the results are listed below. Construct a pie chart
of the data.
50)

________ _____
51) Of the 55 tornado fatalities in a recent year, the locations of the victims are listed below.
Construct a pie chart of the data.
51) _____________
52) The data below represent the alcohol-related driving fatalities, in thousands, in the
United States over a 20-year period. Use a time series chart to display the data.
Describe any trends shown.
52) _____________
MULTIPLE CHOICE. Choose the one alternative that best completes the statement or answers the question.
For the given data , construct a frequency distribution and frequency histogram of the data using five classes. Describe
the shape of the histogram as symmetric, uniform, skewed left, or skewed right.
53) Data set: California Pick Three Lottery
53) ______
A) symmetric B) uniform C) skewed left D) skewed right
54) Data set: California Pick Three Lottery
54) ______
A) symmetric B) skewed left C) skewed right D) uniform
55) Data set: ages of 20 cars randomly selected in a student parking lot
55) ______
A) skewed right B) skewed left C) symmetric D) uniform
56) Data set: systolic blood pressures of 20 randomly selected patients at a blood bank
56) ______
A) uniform B) skewed right C) symmetric D) skewed left
Provide an appropriate response.
57) Use the histogram below to approximate the mode heart rate of adults in the gym.

57) ___
___
A) 70 B) 55 C) 42 D) 2
58) Use the histogram below to approximate the median heart rate of adults in the gym.
58) ______
A) 42 B) 65 C) 70 D) 75
59) Use the histogram below to approximate the mean heart rate of adults in the gym.
59) ______
A) 1425.7 B) 31.6 C) 70 D) 70.8
SHORT ANSWER. Write the word or phrase that best completes each statement or answers the question.
60) Find the mean, median, and mode of the following numbers:
60) _____________
MULTIPLE CHOICE. Choose the one alternative that best completes the statement or answers the question.
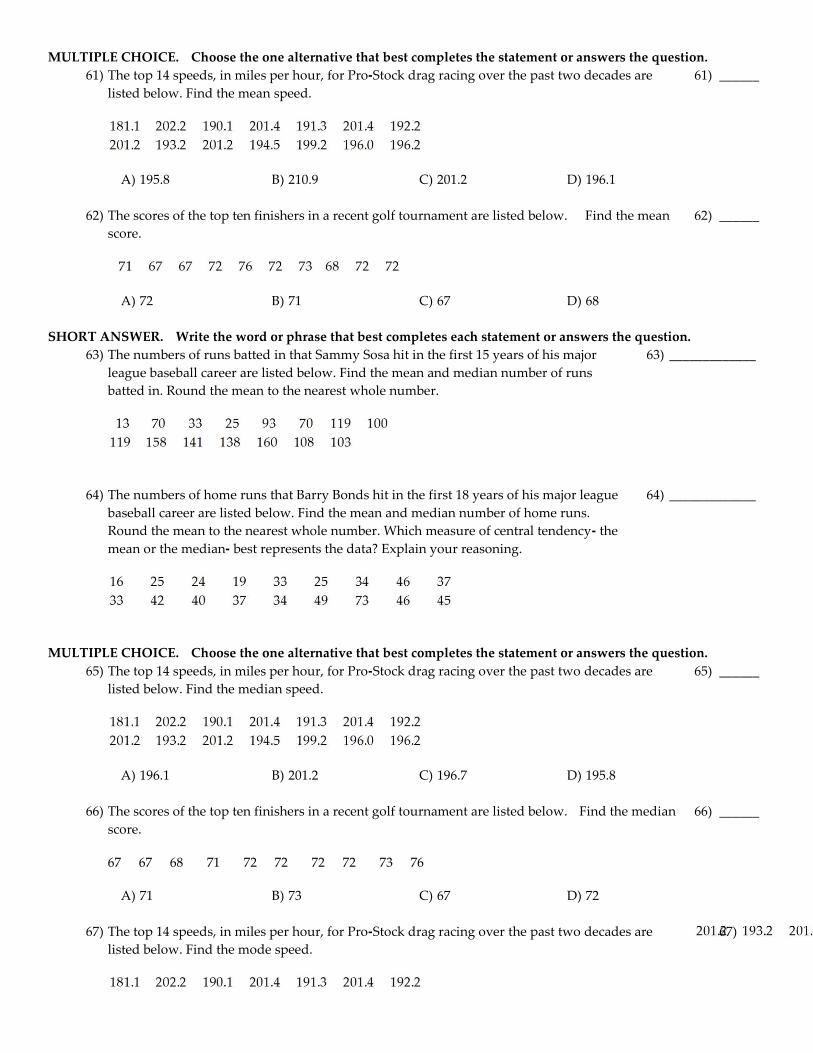
61) The top 14 speeds, in miles per hour, for Pro-Stock drag racing over the past two decades are
listed below. Find the mean speed.
61) ______
A) 195.8 B) 210.9 C) 201.2 D) 196.1
62) The scores of the top ten finishers in a recent golf tournament are listed below. Find the mean
score.
62) ______
A) 72 B) 71 C) 67 D) 68
SHORT ANSWER. Write the word or phrase that best completes each statement or answers the question.
63) The numbers of runs batted in that Sammy Sosa hit in the first 15 years of his major
league baseball career are listed below. Find the mean and median number of runs
batted in. Round the mean to the nearest whole number.
63) _____________
64) The numbers of home runs that Barry Bonds hit in the first 18 years of his major league
baseball career are listed below. Find the mean and median number of home runs.
Round the mean to the nearest whole number. Which measure of central tendency- the
mean or the median- best represents the data? Explain your reasoning.
64) _____________
MULTIPLE CHOICE. Choose the one alternative that best completes the statement or answers the question.
65) The top 14 speeds, in miles per hour, for Pro-Stock drag racing over the past two decades are
listed below. Find the median speed.
65) ______
A) 196.1 B) 201.2 C) 196.7 D) 195.8
66) The scores of the top ten finishers in a recent golf tournament are listed below. Find the median
score.
67 67 68 71 72 72 72 72 73 76
66) ______
A) 71 B) 73 C) 67 D) 72
67) The top 14 speeds, in miles per hour, for Pro-Stock drag racing over the past two decades are
listed below. Find the mode speed.
67)

______
A) no mode B) bimodal C) 201.2 D) 201.4
68) The scores of the top ten finishers in a recent golf tournament are listed below. Find the mode
score.
68) ______
A) 72 B) 76 C) 67 D) 73
SHORT ANSWER. Write the word or phrase that best completes each statement or answers the question.
69) The amounts of money won by the top ten finishers in a recent Daytona 500 are listed
below. Find the mean and median winnings. Round to the nearest dollar. Which
measure- the mean or the median- best represents the data? Explain your reasoning.
69) _____________
MULTIPLE CHOICE. Choose the one alternative that best completes the statement or answers the question.
70) A student receives test scores of 62, 83, and 91. The student's final exam score is 88 and
homework score is 76. Each test is worth 20% of the final grade, the final exam is 25% of the final
grade, and the homework grade is 15% of the final grade. What is the student's mean score in the
class?
70) ______
A) 76.6 B) 85.6 C) 90.6 D) 80.6
71) Grade points are assigned as follows: A = 4, B = 3, C = 2, D = 1, and F = O. Grades are weighted
according to credit hours. If a student receives an A in a four-unit class, a D in a two-unit class, a
B in a three-unit class and a C in a three-unit class, what is the student's grade point average?
71) ______
A) 2.50 B) 3.00 C) 2.75 D) 1.75
Approximate the mean of the grouped data.
72)
72) ______
A) 4 B) 5 C) 15 D) 6
73)
73) ______
A) 18 B) 19 C) 17 D) 28 E) 20
74)

74) ___
___
A) 148 B) 144 C) 12 D) 146
SHORT ANSWER. Write the word or phrase that best completes each statement or answers the question.
Provide an appropriate response.
75) What is the difference between using μ and to represent a mean? 75) _____________
76) Why do data entries need to be ordered before the median can be found? 76) _____________
77) On a recent Statistics test, the scores were 15, 66, 66, 81, 82, 83, 85, 88, 90, 92, 93, and 95. Is
the mean a good representation of the center of data? If not, why?
77) _____________
78) On a recent Statistics test, the scores were 15, 66, 66, 81, 82, 83, 85, 88, 90, 92, 93, and 95. Is
the mode a good representation of the center of data? If not, why?
78) _____________
MULTIPLE CHOICE. Choose the one alternative that best completes the statement or answers the question.
79) On a recent Statistics test, the scores were 61, 66, 68 , 82, 84, 86, 88, 90, 92, and 93. Find the 10%
trimmed mean of this data.
79) ______
A) 38.5 B) 85 C) 77 D) 82
80) The lengths of phone calls from one household (in minutes) were 2, 4, 6, 7, and 8 minutes. Find
the midrange for this data.
80) ______
A) 10 minutes B) 6 minutes C) 5 minutes D) 2 minutes
81) The cost of five homes in a certain area is given.
Which measure of central tendency should be used?
81) ______
A) midrange B) mode C) median D) mean
82) The cost of five homes in a certain area is given.
List any outlier(s).
82) ______
A) $1,240,000 B) $1,240,000 and $162,000
C) $162,000 D) There are no outliers.
83) The cost of five homes in a certain area is given.
Calculate the midrange.
83) ______
A) $395,400 B) $540,000 C) $1,080,000 D) $181,000
84) For the stem-and-leaf plot below, find the range of the data set. Key:

7 = 27
84) ___
___
A) 13 B) 28 C) 34 D) 41
85) Find the range of the data set represented by the graph.
85) ______
A) 17 B) 5 C) 20 D) 6
86) The grade point averages for 10 students are listed below. Find the range of the data set.
86) ______
A) 3.2 B) 2.45 C) 2.8 D) 1.4
87) The heights (in inches) of 20 adult males are listed below. Find the range of the data set.
87) ______
A) 5 B) 6.5 C) 7 D) 6
88) Find the sample standard deviation.
2 6 15 9 11 22 1 4 8 19
88) ______
A) 7.1 B) 6.3 C) 2.1 D) 6.8
89) Find the sample standard deviation.
15 42 53 7 9 12 14 28 47
89) ______
A) 17.8 B) 15.8 C) 29.1 D) 16.6
90) Find the sample standard deviation.
22 29 21 24 27 28 25 36
90) ______
A) 1.6 B) 4.8 C) 4.2 D) 2.8

91) The heights (in inches) of 10 adult males are listed below. Find the sample standard deviation of
the data set.
91) ______
A) 70 B) 1.49 C) 3 D) 2.38
92) Sample annual salaries (in thousands of dollars) for public elementary school teachers are listed.
Find the sample standard deviation.
92) ______
A) 4700.41 B) 38.55 C) 4050.80 D) 11.40
SHORT ANSWER. Write the word or phrase that best completes each statement or answers the question.
93) The heights (in inches) of all 10 adult males in an office are listed below. Find the
population standard deviation and the population variance.
93) _____________
94) In a random sample, 10 students were asked to compute the distance they travel one
way to school to the nearest tenth of a mile. The data is listed below. Compute the range,
standard deviation and variance of the data.
94) _____________
MULTIPLE CHOICE. Choose the one alternative that best completes the statement or answers the question.
95) Without performing any calculations, use the stem-and-leaf plots to determine which statement
is accurate.
95) ______
A) Data set (i) has the smallest standard deviation.
B) Data set (ii) has the greatest standard deviation.
C) Data sets (i) and (ii) have the same standard deviation.
D) Data sets (i) and (iii) have the same range.
SHORT ANSWER. Write the word or phrase that best completes each statement or answers the question.
96) You need to purchase a battery for your car. There are two types available. Type A has a
mean life of five years and a standard deviation of one year. Type B has a mean life of
five years and a standard deviation of one month. Both batteries cost the same. Which
one should you purchase if you are concerned that your car will always start? Explain
your reasoning.
96) _____________
97) Here are the batting averages of Sammy Sosa and Barry Bonds for 13 recent years.
Which player is more consistent? Explain your reasoning.
97)

________ _____
98) You are the maintenance engineer for a local high school. You must purchase fluorescent
light bulbs for the classrooms. Should you choose Type A with and
or Type B with and
98) _____________
MULTIPLE CHOICE. Choose the one alternative that best completes the statement or answers the question.
99) The mean IQ score of adults is 100, with a standard deviation of 15. Use the Empirical Rule to
find the percentage of adults with scores between 70 and 130. (Assume the data set has a
bell-shaped distribution.)
99) ______
A) 99.7% B) 68% C) 100% D) 95%
100) The mean score of a placement exam for entrance into a math class is 80, with a standard
deviation of 10. Use the Empirical Rule to find the percentage of scores that lie between 60 and
80. (Assume the data set has a bell-shaped distribution.)
100) _____
A) 34% B) 47.5% C) 68% D) 95%
101) The mean IQ score of students in a particular calculus class is 110, with a standard deviation of 5.
Use the Empirical Rule to find the percentage of students with an IQ above 120. (Assume the
data set has a bell-shaped distribution.)
101) _____
A) 15.85% B) 11.15% C) 13.5% D) 2.5%
102) The mean score of a competency test is 77, with a standard deviation of 4. Use the Empirical Rule
to find the percentage of scores between 69 and 85. (Assume the data set has a bell-shaped
distribution.)
102) _____
A) 95% B) 68% C) 99.7% D) 50%
103) The mean score of a competency test is 82, with a standard deviation of 2. Between what two
values do about 99.7% of the values lie? (Assume the data set has a bell-shaped distribution.)
103) _____
A) Between 74 and 90 B) Between 78 and 86
C) Between 80 and 84 D) Between 76 and 88
104) The mean length of a human pregnancy is 265 days, with a standard deviation of 10 days. Use
the Empirical Rule to determine the percentage of women whose pregnancies are between 255
and 275 days. (Assume the data set has a bell-shaped distribution.)
104) _____
A) 99.7% B) 68% C) 95% D) 50%
105) The mean SAT verbal score is 428, with a standard deviation of 97. Use the Empirical Rule to
determine what percent of the scores lie between 428 and 525. (Assume the data set has a
bell-shaped distribution.)
105) _____
A) 49.9% B) 34% C) 68% D) 47.5%
106) The mean SAT verbal score is 478, with a standard deviation of 98. Use the Empirical Rule to
determine what percent of the scores lie between 380 and 478. (Assume the data set has a
bell-shaped distribution.)
106) _____
A) 49.9% B) 47.5% C) 34% D) 68%
107) The mean SAT verbal score is 412, with a standard deviation of 90. Use the Empirical Rule to
determine what percent of the scores lie between 412 and 592. (Assume the data set has a
bell-shaped distribution.)
107) _____
A) 47.5% B) 34% C) 49.9% D) 68%
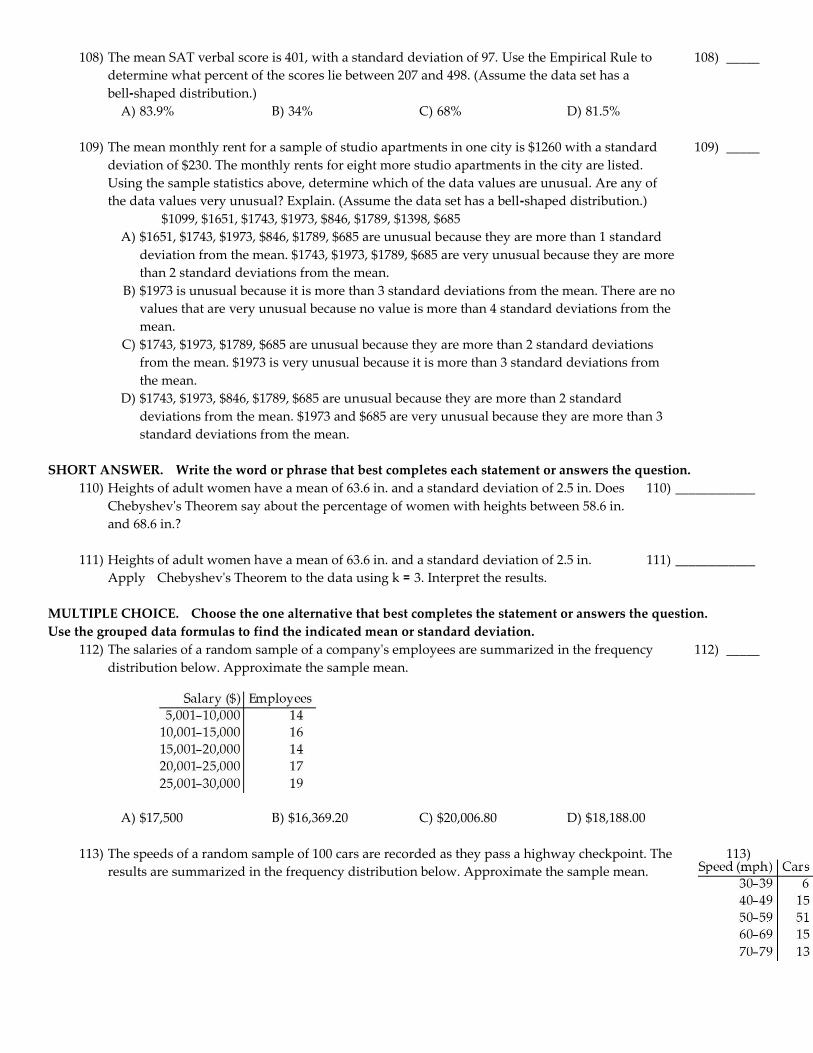
108) The mean SAT verbal score is 401, with a standard deviation of 97. Use the Empirical Rule to
determine what percent of the scores lie between 207 and 498. (Assume the data set has a
bell-shaped distribution.)
108) _____
A) 83.9% B) 34% C) 68% D) 81.5%
109) The mean monthly rent for a sample of studio apartments in one city is $1260 with a standard
deviation of $230. The monthly rents for eight more studio apartments in the city are listed.
Using the sample statistics above, determine which of the data values are unusual. Are any of
the data values very unusual? Explain. (Assume the data set has a bell-shaped distribution.)
$1099, $1651, $1743, $1973, $846, $1789, $1398, $685
109) _____
A) $1651, $1743, $1973, $846, $1789, $685 are unusual because they are more than 1 standard
deviation from the mean. $1743, $1973, $1789, $685 are very unusual because they are more
than 2 standard deviations from the mean.
B) $1973 is unusual because it is more than 3 standard deviations from the mean. There are no
values that are very unusual because no value is more than 4 standard deviations from the
mean.
C) $1743, $1973, $1789, $685 are unusual because they are more than 2 standard deviations
from the mean. $1973 is very unusual because it is more than 3 standard deviations from
the mean.
D) $1743, $1973, $846, $1789, $685 are unusual because they are more than 2 standard
deviations from the mean. $1973 and $685 are very unusual because they are more than 3
standard deviations from the mean.
SHORT ANSWER. Write the word or phrase that best completes each statement or answers the question.
110) Heights of adult women have a mean of 63.6 in. and a standard deviation of 2.5 in. Does
Chebyshev's Theorem say about the percentage of women with heights between 58.6 in.
and 68.6 in.?
110) ____________
111) Heights of adult women have a mean of 63.6 in. and a standard deviation of 2.5 in.
Apply Chebyshev's Theorem to the data using k = 3. Interpret the results.
111) ____________
MULTIPLE CHOICE. Choose the one alternative that best completes the statement or answers the question.
Use the grouped data formulas to find the indicated mean or standard deviation.
112) The salaries of a random sample of a company's employees are summarized in the frequency
distribution below. Approximate the sample mean.
112) _____
A) $17,500 B) $16,369.20 C) $20,006.80 D) $18,188.00
113) The speeds of a random sample of 100 cars are recorded as they pass a highway checkpoint. The
results are summarized in the frequency distribution below. Approximate the sample mean.
113)

_____
A) 61.5 mph B) 55.9 mph C) 58.7 mph D) 54.5 mph
114) The manager of a bank recorded the amount of time a random sample of customers spent
waiting in line during peak business hours one Monday. The frequency distribution below
summarizes the results. Approximate the sample mean. Round your answer to one decimal
place.
114) _____
A) 9.0 min B) 9.2 min C) 7.7 min D) 13.5 min
115) The heights of a random sample of professional basketball players are summarized in the
frequency distribution below. Approximate the sample mean. Round your answer to one
decimal place.
115) _____
A) 75.0 in. B) 13.5 in. C) 77.8 in. D) 76.4 in.
116) A random sample of 30 high school students is selected. Each student is asked how many
hours he or she spent on the Internet during the previous week. The results are shown in the
histogram. Estimate the sample mean.
116) _____
A) 8.3 hr B) 7.7 hr C) 7.9 hr D) 8.1 hr
117) A random sample of 25 community service projects is selected and the scores are recorded. The resul ts are

shown in
the
histogra
m.
Estimate
the
sample
mean.
117) ____
_
A) 96.9 B) 97.3 C) 97.1 D) 96.7
118) For the following data set, approximate the sample standard deviation.
118) _____
A) 2.1 B) 5.1 C) 1.6 D) 2.9
119) For the following data set, approximate the sample standard deviation.
119) _____
A) 2.9 B) 18.8 C) 5.1 D) 3.2
120) For the following data set, approximate the sample standard deviation.

120) _____
A) 0.98 B) 2.57 C) 3.85 D) 1.86
121) A random sample of 30 high school students is selected. Each student is asked how many
hours he or she spent on the Internet during the previous week. The results are shown in the
histogram. Estimate the sample standard deviation.
121) _____
A) 2.6 hr B) 2.0 hr C) 2.2 hr D) 2.4 hr
SHORT ANSWER. Write the word or phrase that best completes each statement or answers the question.
Provide an appropriate response.
122) In a random sample, 10 students were asked to compute the distance they travel one
way to school to the nearest tenth of a mile. The data is listed below. Compute the
coefficient of variation.
122) ____________
123) For the data below, find Pearson's index of skewness. The data set: The systolic blood
pressures of 20 randomly selected patients at a blood bank.
123) ____________
MULTIPLE CHOICE. Choose the one alternative that best completes the statement or answers the question.
124) In a random sample, 10 students were asked to compute the distance they travel one way to
school to the nearest tenth of a mile. The data is listed below.
a) If a constant value k is added to each value, how will the standard deviation be affected?
b) If each value is multiplied by a constant k, how will the standard deviation be affected?
124) _____
A) The standard deviation will not be affected.
B) The standard deviation will be multiplied by the constant k.
125) The test scores of 30 students are listed below. Find the five-number summary.
125) _____

A) Min = 31, = 57, = 72, = 81, Max = 99
B) Min = 31, = 58, = 72, = 83, Max = 99
C) Min = 31, = 57, = 70, = 81, Max = 99
D) Min = 31, = 58, = 70, = 83, Max = 99
126) The weights (in pounds) of 30 preschool children are listed below. Find the five-number
summary.
126) _____
A) Min = 25, = 28, = 30.5, = 34, Max = 38
B) Min = 25, = 28, = 30.75, = 34, Max = 38
C) Min = 25, = 27.5, = 30.75, = 33, Max = 38
D) Min = 25, = 27.5, = 30.5, = 33.5, Max = 38
SHORT ANSWER. Write the word or phrase that best completes each statement or answers the question.
127) The weights (in pounds) of 30 preschool children are listed below. Find the interquartile
range of the 30 weights listed below. What can you conclude from the result?
127) ____________
MULTIPLE CHOICE. Choose the one alternative that best completes the statement or answers the question.
128) The cholesterol levels (in milligrams per deciliter) of 30 adults are listed below. Find the
interquartile range for the cholesterol level of the 30 adults.
128) _____
A) 211 B) 180 C) 30 D) 31
129) The cholesterol levels (in milligrams per deciliter) of 30 adults are listed below. Find .
154 156 165 165 170 171 172 180 184 185
189 189 190 192 195 198 198 200 200 200
205 205 211 215 220 220 225 238 255 265
129) _____
A) 200 B) 180 C) 171 D) 184.5
SHORT ANSWER. Write the word or phrase that best completes each statement or answers the question.
130) The test scores of 30 students are listed below. Draw a box-and-whisker plot that
represents the data.
130) ____________
131) The cholesterol levels (in milligrams per deciliter) of 30 adults are listed below. Draw a
box-and-whisker plot that represents the data.

131) ____
____
____
MULTIPLE CHOICE. Choose the one alternative that best completes the statement or answers the question.
132) Use the box-and-whisker plot below to determine which statement is accurate.
132) _____
A) About 75% of the adults have cholesterol levels less than 180.
B) One half of the cholesterol levels are between 180 and 197.5.
C) One half of the cholesterol levels are between 180 and 211.
D) About 25% of the adults have cholesterol levels of at most 211.
133) Find the z-score for the value 55, when the mean is 58 and the standard deviation is 3. 133) _____
A) z = -0.90 B) z = -1.33 C) z = 0.90 D) z = -1.00
134) Many firms use on-the-job training to teach their employees computer programming. Suppose
you work in the personnel department of a firm that just finished training a group of its
employees to program, and you have been requested to review the performance of one of the
trainees on the final test that was given to all trainees. The mean and standard deviation of the
test scores are 72 and 5, respectively, and the distribution of scores is bell-shaped and symmetric.
Suppose the trainee in question received a score of 68. Compute the trainee's z-score.
134) _____
A) z = -0.80 B) z = 0.88 C) z = -0.88 D) z = 0.8
135) A radio station claims that the amount of advertising per hour of broadcast time has an average
of 17 minutes and a standard deviation equal to 2.2 minutes. You listen to the radio station for 1
hour, at a randomly selected time, and carefully observe that the amount of advertising time is
equal to 15 minutes. Calculate the z-score for this amount of advertising time.
135) _____
A) z = -0.91 B) z = 0.91 C) z = 0.75 D) z = -0.75
SHORT ANSWER. Write the word or phrase that best completes each statement or answers the question.
136) Test scores for a history class had a mean of 79 with a standard deviation of 4.5. Test
scores for a physics class had a mean of 69 with a standard deviation of 3.7. Suppose a
student gets a 83 on the history test and a 84 on the physics test. Calculate the z-score for
each test. On which test did the student perform better?
136) ____________
MULTIPLE CHOICE. Choose the one alternative that best completes the statement or answers the question.
137) For the mathematics part of the SAT the mean is 514 with a standard deviation of 113, and for
the mathematics part of the ACT the mean is 20.6 with a standard deviation of 5.1. Bob scores a
660 on the SAT and a 27 on the ACT. Use z-scores to determine on which test he performed
better.
137) _____
A) ACT B) SAT

138) The birth weights for twins are normally distributed with a mean of 2353 grams and a standard
deviation of 647 grams. Use z-scores to determine which birth weight could be considered
unusual.
138) _____
A) 2000 g B) 2353 g C) 3647 g D) 1200 g
139) The ages of 10 grooms at their first marriage are listed below. Find the midquartile.
139) _____
A) 34.2 B) 43.7 C) 34.5 D) 34.1
140) The cholesterol levels (in milligrams per deciliter) of 30 adults are listed below. Find .
140) _____
A) 171 B) 200 C) 265 D) 205
141) The test scores of 30 students are listed below. Find .
141) _____
A) 63 B) 67 C) 56 D) 90
142) The test scores of 30 students are listed below. Find .
142) _____
A) 67 B) 86 C) 90 D) 56
143) The weights (in pounds) of 30 preschool children are listed below. Find .
25 25 26 26.5 27 27 27.5 28 28 28.5
29 29 30 30 30.5 31 31 32 32.5 32.5
33 33 34 34.5 35 35 37 37 38 38
143) _____
A) 27 B) 37 C) 33 D) 31
144) A teacher gives a 20-point quiz to 10 students. The scores are listed below. What percentile
corresponds to the score of 12?
144) _____
A) 13 B) 12 C) 25 D) 40
145) In a data set with a minimum value of 54.5 and a maximum value of 98.6 with 300 observations,
there are 186 points less than 81.2. Find the percentile for 81.2.
145) _____
A) 53 B) 71 C) 68 D) 62
146) The cholesterol levels (in milligrams per deciliter) of 30 adults are listed below. Find the
percentile that corresponds to cholesterol level of 195.
146)

_____
A) 58 B) 50 C) 33 D) 12
SHORT ANSWER. Write the word or phrase that best completes each statement or answers the question.
147) A student's score on the SAT-1 placement test for U.S. history is in the 90th percentile.
What can you conclude about the student's test score?
147) ____________

1) C
2) C
3) A
4) A
5)
6)
7) Phone Calls (per day)

8) Height (in inches)
9) Weight (in pounds)
10) Miles (per day)
11) C
12) D
13) C
14) B
15)
16)

17)
18)
19)
20)
21)

22)
23)
24)
25)

26) a) See graph below
b) The minimum score = 14
c) The university will accept 76.57% of the applicants.
27) Class limits determine which numbers can belong to that class. Class boundaries are the numbers that separate
classes without forming gaps between them.
28) Key: 4 = 4
Most of these years he hit 36 or more home runs.
29) Key: 6 = 16

Most of these years he hit between 33 and 49 home runs.
30) A
31) D
32) Key: 7 = 67
Most of these males had heights of 70 or more inches.
33) Key: 3 = 33
Most of the motorists were going 40 - 49 miles per hour.
34)
35)
36)

37)
38)
39)
40)
In general, there appears to be a relationship between the home runs and batting averages. As the number of home
runs increased, the batting averages increased.
41)
In general, there appears to be a relationship between the absences and the final grades. As the number of absences
increased, the students' final grades decreased.

42)
43)
It appears the percent of U.S. adults who smoke is declining.
44)
It appears the number of deaths peaked in 1950.
45)

46)
47)
48) Key: 7 = 127

49) Key: 3 = 9.3
50)
51)

52)
It appears the number of alcohol-related fatalities is gradually declining.
53) B
54) B
55) C
56) C
57) A
58) C
59) D
60) mean 71, median 72, mode 73
61) A
62) B
63) mean: 97; median 103
64) mean: 37; median: 35.5; The median best represents the data because the mean is affected by the
outlier (73) which causes a gap in the distribution.
65) A
66) D
67) B
68) A
69) mean: $489,415; median: $265,664; The median represents the data better because the mean is affected by the outlier
($2,194,246) which causes a gap in the distribution.
70) D
71) C
72) B
73) B
74) D
75) μ represents a population mean and represents a sample mean.
76) The median is found by calculating the mean of the two middle data entries. The middle entries cannot be found
unless the data entries are first ordered.
77) No, the mean is not a good representation of the center. The mean score is 78, and 9 of the scores are better than
this.
78) No, the mode is not a good representation of the center. The mode score is 66, and 9 of the scores are better than
this.
79) D
80) C
81) C
82) A
83) B
84) B
85) D
86) A
87) C
88) A
89) A
90) B
91) B
92) D
93) σ = 1.42, = 2.01
94) range = 4.4, s = 1.8, = 3.324
95) C
96) Battery Type B has less variation. As a result, it is less likely to fail before its mean life is up.
97) Sosa: = 0.279 and s = 0.033; Bonds: = 0.312 and s = 0.027.
Bonds is more consistent since his standard deviation is less.
98) The bulbs with the lower standard deviation are more consistent and it is easier to plan for their replacement.
99) D
100) B
101) D
102) A
103) D
104) B
105) B
106) C
107) A
108) D
109) C
110) At least 75% of the heights should fall between 58.6 in. and 68.6 in.
111) (56.1, 71.1) 89% of the heights are between 56.1 and 71.1 inches.
112) D
113) B
114) A
115) D
116) C
117) C
118) A
119) C
120) C
121) D

122)
coefficient of variation = × 100% = 58.3%
123) = 121.7, s = 11.82, P = 0.31. Since -1 ≤ P ≤ 1, there is no significant skewness.
124) A
125) B
126) B
127) IQR = - = 34 - 28 = 6. This means that the weights of the middle half of the data set vary by 6 pounds.
128) D
129) B
130)
131)
132) C
133) D
134) A
135) A
136) history z-score = 0.89; physics z-score = 4.05; The student performed better on the physics test.
137) B
138) C
139) A
140) B
141) A
142) B
143) C
144) D
145) D
146) B
147) The student's score was higher than the scores of 90% of the students who took the test.