Embed Size (px)
Citation preview
Sub-Saharan Africa (SSA) Listed Financial Services Analysis
Cytonn H1’2017 Banking & Insurance Sector Report
November, 2017
22
Table of Contents
I. Overview of the Firm
II. Executive Summary
III. Country and Regional review- Banking Sector Overview
a) Kenya
b) Other East African Countries (Tanzania, Uganda, Rwanda)
c) Nigeria
d) Ghana
e) Other Sub-Saharan Africa Countries (Mauritius, Zambia, Namibia)
IV. Summary Cytonn SSA Banking Sector Report
V. SSA Insurance Sector Overview
VI. Regional and Country Review- Insurance Sector
a) Kenya Insurance Sector
b) SSA Insurance Companies Under Coverage
c) SSA Insurance Companies Under Coverage Comprehensive Rankings
VII. Appendix

33
I. Overview of the Firm

44
What
We S
tand
For Our Values
Our Mission
We deliver innovative&
differentiated financial
solutions that speak to
our clients’needs
Our Vision
To be Africa’s leading
investment manager by
consistently exceeding
clients’ expectations
Integrity
Doing the right things
Client Focus
Putting clients’ interest first at all times
Entrepreneurship
Using innovation and creativity to deliver
differentiated financial solutions
Excellence
Delivering the best at all times
Accountability
We take both corporate andpersonal
responsibility for ouractions
People
Passionate and self-driven people who
thrive in a team context

55
Strategy is
straightforward –
just pick a general
direction and
implement like hell
— Jack Welch
66
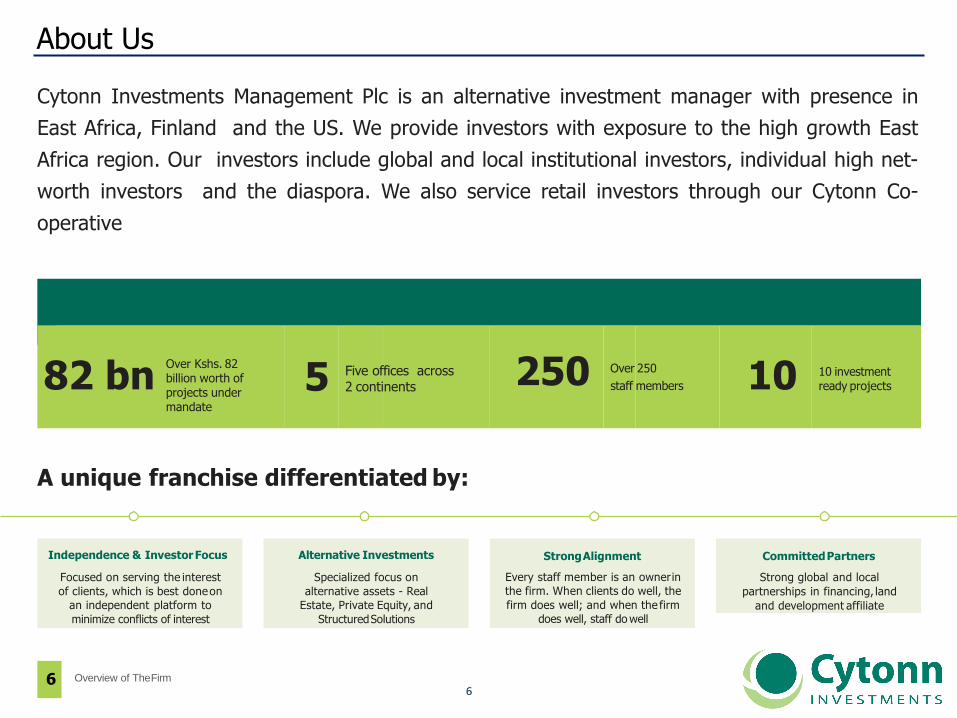
About Us
Cytonn Investments Management Plc is an alternative investment manager with presence in
East Africa, Finland and the US. We provide investors with exposure to the high growth East
Africa region. Our investors include global and local institutional investors, individual high net-
worth investors and the diaspora. We also service retail investors through our Cytonn Co-
operativeFACTFILE
Over Kshs. 82billion worth of projects under mandate
Five offices across 2 continents
10 investment ready projects
A unique franchise differentiated by:
Independence & InvestorFocus
Focused on serving the interest
of clients, which is best doneon
an independent platform to
minimize conflicts of interest
Alternative Investments
Specialized focus on
alternative assets - Real
Estate, Private Equity, and
StructuredSolutions
StrongAlignment
Every staff member is an ownerin
the firm. When clients do well, the
firm does well; and when the firm
does well, staff do well
CommittedPartners
Strong global and local
partnerships in financing, land
and development affiliate
82 bn
6 Overview of TheFirm
5 250 Over 250
staff members 10
77
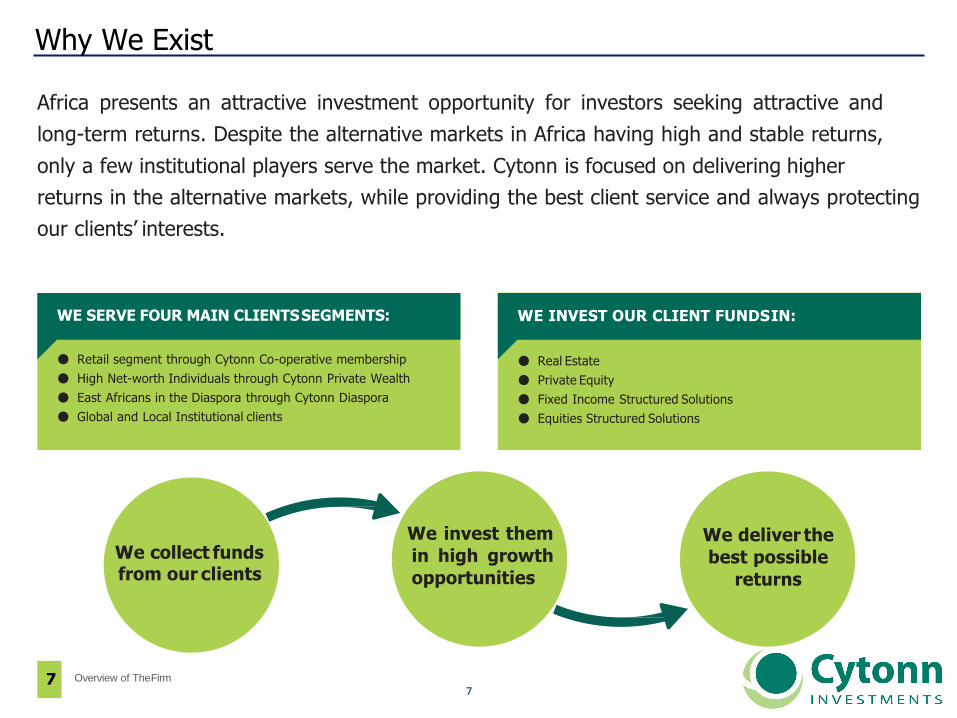
Why We Exist
Africa presents an attractive investment opportunity for investors seeking attractive and
long-term returns. Despite the alternative markets in Africa having high and stable returns,
only a few institutional players serve the market. Cytonn is focused on delivering higher
returns in the alternative markets, while providing the best client service and always protecting
our clients’ interests.
WE SERVE FOUR MAIN CLIENTSSEGMENTS:
● Retail segment through Cytonn Co-operative membership
● High Net-worth Individuals through Cytonn Private Wealth
● East Africans in the Diaspora through Cytonn Diaspora
● Global and Local Institutional clients
WE INVEST OUR CLIENT FUNDSIN:
● Real Estate
● Private Equity
● Fixed Income Structured Solutions
● Equities Structured Solutions
We collect fundsfrom our clients
We invest them
in high growth
opportunities
We deliver the
best possible
returns
7 Overview of TheFirm
88
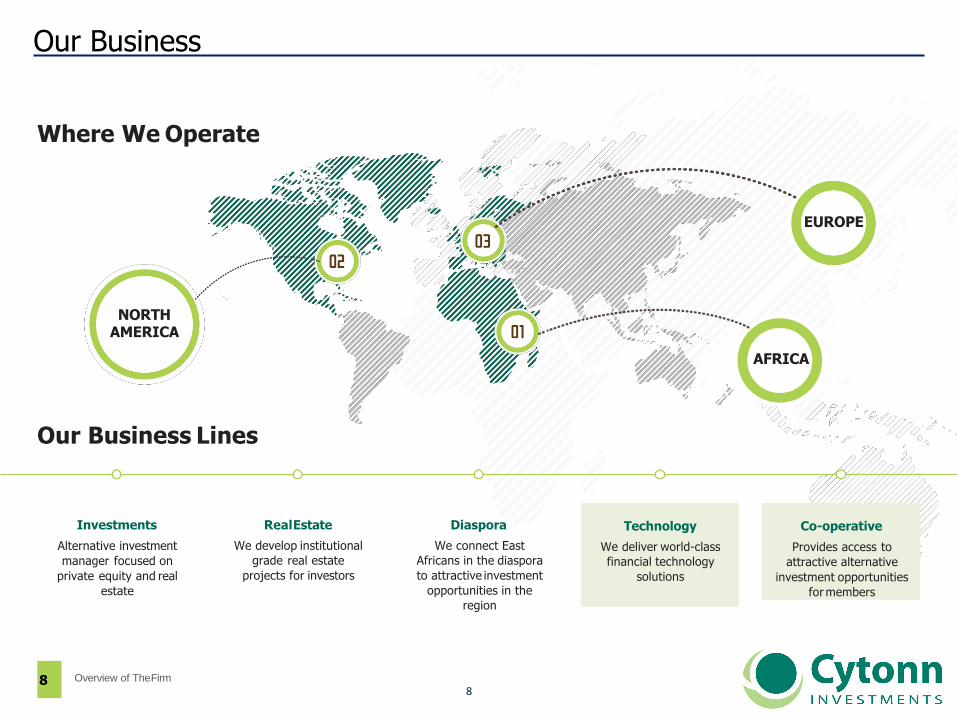
Our Business
Our Business Lines
Where We Operate
Investments
Alternative investment
manager focused on
private equity and real
estate
RealEstate
We develop institutional
grade real estate
projects for investors
Diaspora
We connect East
Africans in the diaspora
to attractive investment
opportunities in the
region
Technology
We deliver world-class
financial technology
solutions
Co-operative
Provides access to
attractive alternative
investment opportunities
for members
EUROPE
NORTH AMERICA
AFRICA
Overview of TheFirm8
99
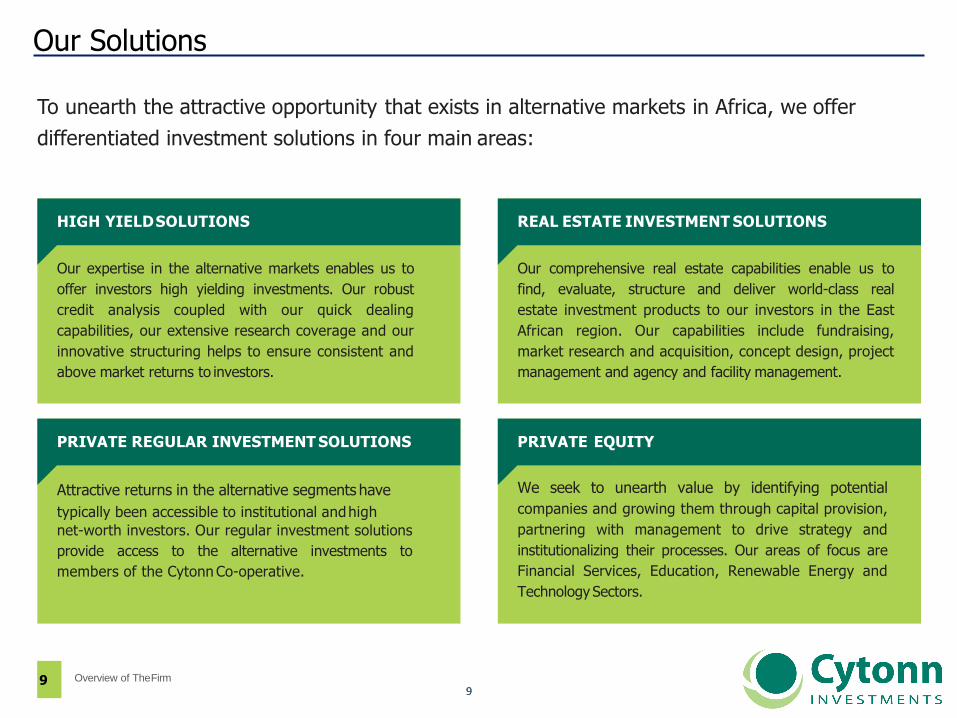
Our Solutions
To unearth the attractive opportunity that exists in alternative markets in Africa, we offer
differentiated investment solutions in four main areas:
PRIVATE REGULAR INVESTMENT SOLUTIONS
Attractive returns in the alternative segments have
typically been accessible to institutional andhigh
net-worth investors. Our regular investment solutions
provide access to the alternative investments to
members of the Cytonn Co-operative.
PRIVATE EQUITY
We seek to unearth value by identifying potential
companies and growing them through capital provision,
partnering with management to drive strategy and
institutionalizing their processes. Our areas of focus are
Financial Services, Education, Renewable Energy and
TechnologySectors.
HIGH YIELDSOLUTIONS
Our expertise in the alternative markets enables us to
offer investors high yielding investments. Our robust
credit analysis coupled with our quick dealing
capabilities, our extensive research coverage and our
innovative structuring helps to ensure consistent and
above market returns to investors.
REAL ESTATE INVESTMENT SOLUTIONS
Our comprehensive real estate capabilities enable us to
find, evaluate, structure and deliver world-class real
estate investment products to our investors in the East
African region. Our capabilities include fundraising,
market research and acquisition, concept design, project
management and agency and facility management.
Overview of TheFirm9
1010
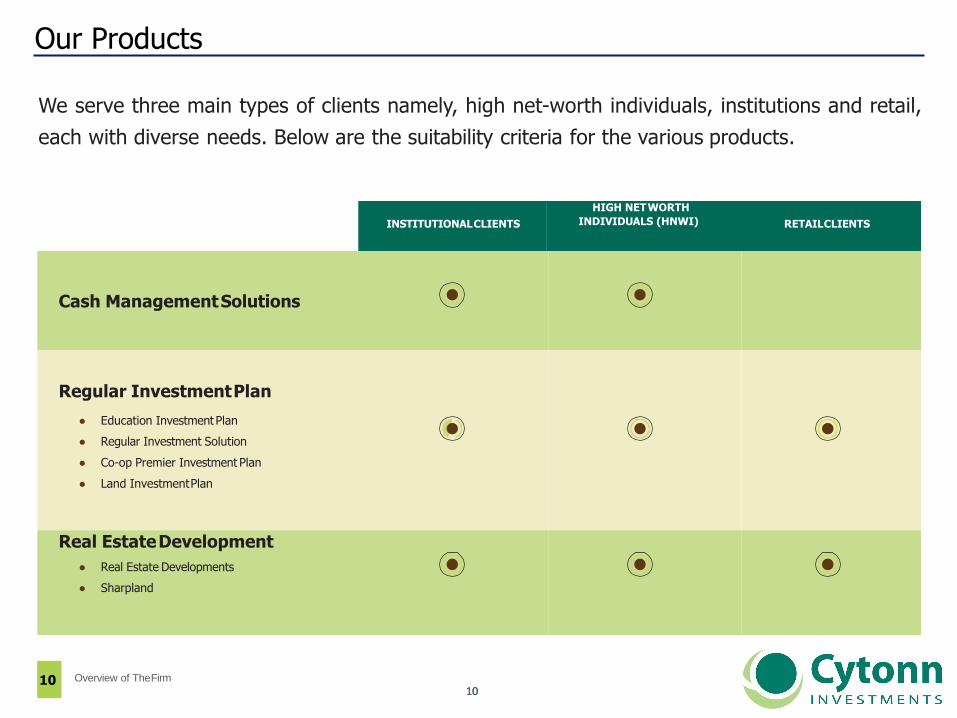
Our Products
We serve three main types of clients namely, high net-worth individuals, institutions and retail,
each with diverse needs. Below are the suitability criteria for the various products.
INSTITUTIONALCLIENTS
HIGH NETWORTH
INDIVIDUALS (HNWI) RETAILCLIENTS
Cash ManagementSolutions
Regular InvestmentPlan
● Education InvestmentPlan
● Regular Investment Solution
● Co-op Premier Investment Plan
● Land InvestmentPlan
Real EstateDevelopment
● Real Estate Developments
● Sharpland
Overview of TheFirm10

1111
Our People
If you could get all the people in an organization rowing the same direction, you could
dominate any industry, in any market, against any competition, at any time.
— Patrick Lencioni
We are focused on one agenda:
THE CLIENT
Overview of TheFirm11

1212
Board of Directors
To ensure that we remain focused on the clients’ interests, we have put in place proper
governance structures. We have a board of directors consisting of 11 members from diverse
backgrounds, each bringing in unique skill-sets to the firm.
12 Overview of TheFirm

1313
Board of Directors, continued …
13 Overview of TheFirm
1414
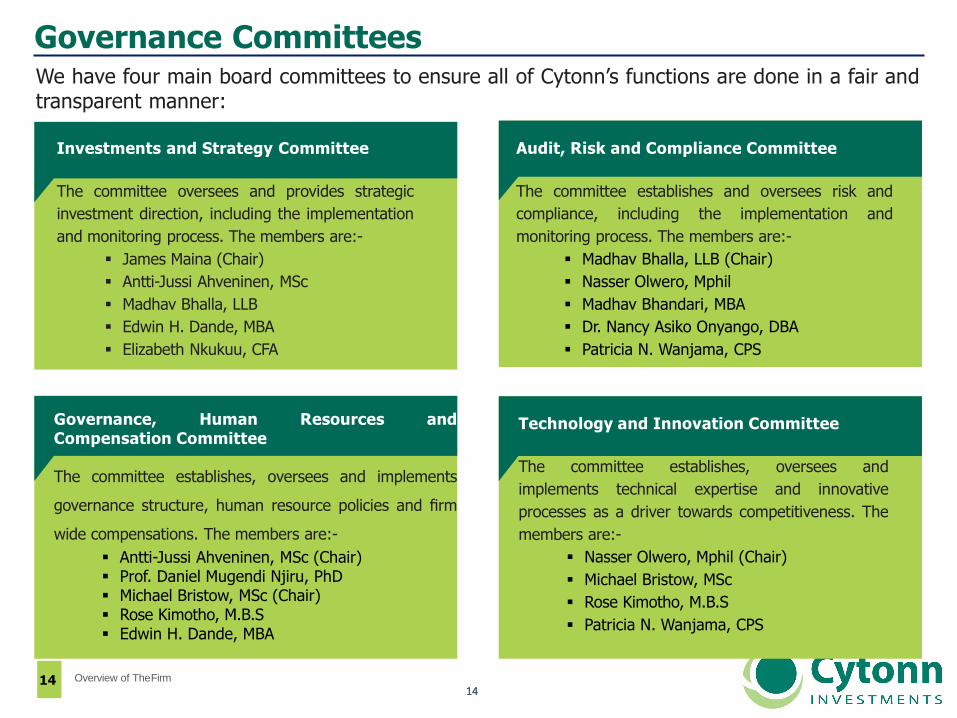
Governance CommitteesWe have four main board committees to ensure all of Cytonn’s functions are done in a fair andtransparent manner:
Governance, Human Resources andCompensation Committee
The committee establishes, oversees and implements
governance structure, human resource policies and firm
wide compensations. The members are:-
Antti-Jussi Ahveninen, MSc (Chair) Prof. Daniel Mugendi Njiru, PhD Michael Bristow, MSc (Chair) Rose Kimotho, M.B.S Edwin H. Dande, MBA
Technology and Innovation Committee
The committee establishes, oversees and
implements technical expertise and innovative
processes as a driver towards competitiveness. The
members are:-
Nasser Olwero, Mphil (Chair)
Michael Bristow, MSc
Rose Kimotho, M.B.S
Patricia N. Wanjama, CPS
Investments and Strategy Committee
The committee oversees and provides strategic
investment direction, including the implementation
and monitoring process. The members are:-
James Maina (Chair)
Antti-Jussi Ahveninen, MSc
Madhav Bhalla, LLB
Edwin H. Dande, MBA
Elizabeth Nkukuu, CFA
Audit, Risk and Compliance Committee
The committee establishes and oversees risk and
compliance, including the implementation and
monitoring process. The members are:-
Madhav Bhalla, LLB (Chair)
Nasser Olwero, Mphil
Madhav Bhandari, MBA
Dr. Nancy Asiko Onyango, DBA
Patricia N. Wanjama, CPS
Overview of TheFirm14
1515
II. Executive Summary
1616
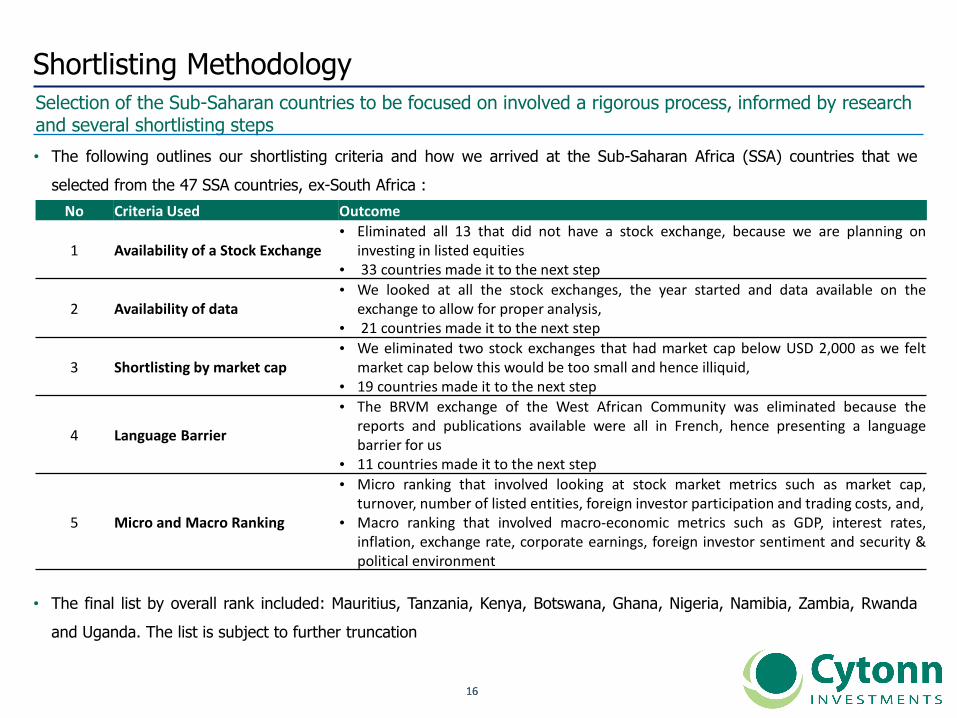
Selection of the Sub-Saharan countries to be focused on involved a rigorous process, informed by research and several shortlisting steps
Shortlisting Methodology
• The following outlines our shortlisting criteria and how we arrived at the Sub-Saharan Africa (SSA) countries that we
selected from the 47 SSA countries, ex-South Africa :
• The final list by overall rank included: Mauritius, Tanzania, Kenya, Botswana, Ghana, Nigeria, Namibia, Zambia, Rwanda
and Uganda. The list is subject to further truncation
No Criteria Used Outcome
1 Availability of a Stock Exchange • Eliminated all 13 that did not have a stock exchange, because we are planning on
investing in listed equities• 33 countries made it to the next step
2 Availability of data • We looked at all the stock exchanges, the year started and data available on the
exchange to allow for proper analysis,• 21 countries made it to the next step
3 Shortlisting by market cap • We eliminated two stock exchanges that had market cap below USD 2,000 as we felt
market cap below this would be too small and hence illiquid,• 19 countries made it to the next step
4 Language Barrier
• The BRVM exchange of the West African Community was eliminated because thereports and publications available were all in French, hence presenting a languagebarrier for us
• 11 countries made it to the next step
5 Micro and Macro Ranking
• Micro ranking that involved looking at stock market metrics such as market cap,turnover, number of listed entities, foreign investor participation and trading costs, and,
• Macro ranking that involved macro-economic metrics such as GDP, interest rates,inflation, exchange rate, corporate earnings, foreign investor sentiment and security &political environment

1717
Sub-Saharan Africa: Economic Review
Fundamental Macro-economic Drivers across SSA are trending positively
Driver Kenya Tanzania Uganda Rwanda Nigeria Ghana Mauritius Zambia Namibia Botswana
GDP Growth
Neutral Positive Neutral Positive Neutral Positive Positive Neutral Negative Neutral
Interest Rates
Neutral Neutral Positive Positive Neutral Positive Positive Positive Negative Neutral
Inflation Neutral Neutral Positive Neutral Negative Positive Neutral Positive Neutral Positive
Currency Stability
Neutral Negative Neutral Neutral Neutral Neutral Neutral Positive Positive Neutral
CorporateEarnings
Neutral Positive Neutral Neutral Positive Positive Neutral Neutral Neutral Neutral
Investor Sentiment
Neutral Positive Neutral Positive Positive Neutral Positive Neutral Neutral Positive
Security Neutral Positive Neutral Neutral Neutral Positive Positive Positive Positive Positive
1818
SSA Financial Services Sector Growth DriversTechnology and innovation set to be key drivers of growth in the sector, in a region with a boomingpopulation
20
12
20
13
1) Technology and Innovation: The critical technological capabilities to drive growth encompass a portfolio of tools,
systems and will focus on online and mobile platforms for (i) efficient loan disbursement in the case of banks, and (ii)
underwriting policy quotations and renewals efficiently in the case of insurance companies
2) Strong GDP Growth: The region continues to experience positive economic growth with GDP projected to grow by
2.7% in 2017 up from 1.5% in 2016, supported by strong fundamentals. Productivity improvements in agriculture,
expanding urban markets, shifts to higher-value exports, investments in giant infrastructure projects, and mobile
technologies to boost trade and commerce are the key drivers set to drive economic growth and the financial services
sector
3) Financial Penetration: Financial penetration remains low in Sub-Saharan Africa, with less than a quarter of the
population having access to a formal bank account, hence limiting the degree to which private individuals can access
financial services, while the average insurance penetration rate in Africa is very low, at 3.5%. Low inclusion presents
ample runway for growth, given the backdrop of increased macroeconomic stability, positive consumer oriented reforms
and financial sector deepening
4) Population Growth: In a region with one of the fastest population and economic growth rates, the rise in disposable
income is a great driver for the sector. Demand for banking services and insurance products has grown over the past
few years
1919
III. Country and Regional review- Banking Sector Overview
2020
Ranking Methodology and Valuation
We undertook this report to offer investors a comprehensive view of Sub-Saharan Africa listed Banks
20
12
20
13
• Select listed banks in the Sub-Saharan market were analysed by the Cytonn Investment Team
• The analysis was brought about by a need to be able to take a view on the banking sector to determine which banks are
the most stable from a franchise value and from a future growth opportunity perspective
• The analysis covers the health and future expected performance of the financial institution, by highlighting their
performance using metrics to measure profitability, efficiency, growth, asset quality, liquidity, revenue diversification,
capitalization and intrinsic valuation
• The analysis was undertaken using H1’2017 results (franchise value) and analyst’s projections of future performance of
the banks (future growth opportunities)
• For banks which are part of a group structure, the financials of the group were utilised to take into consideration the
listed counter which an investor will purchase
• The overall ranking was based on a weighted average ranking of Franchise value (accounting for 40%) and Intrinsic
value (accounting for 60%)

2121
a. Kenya
2222
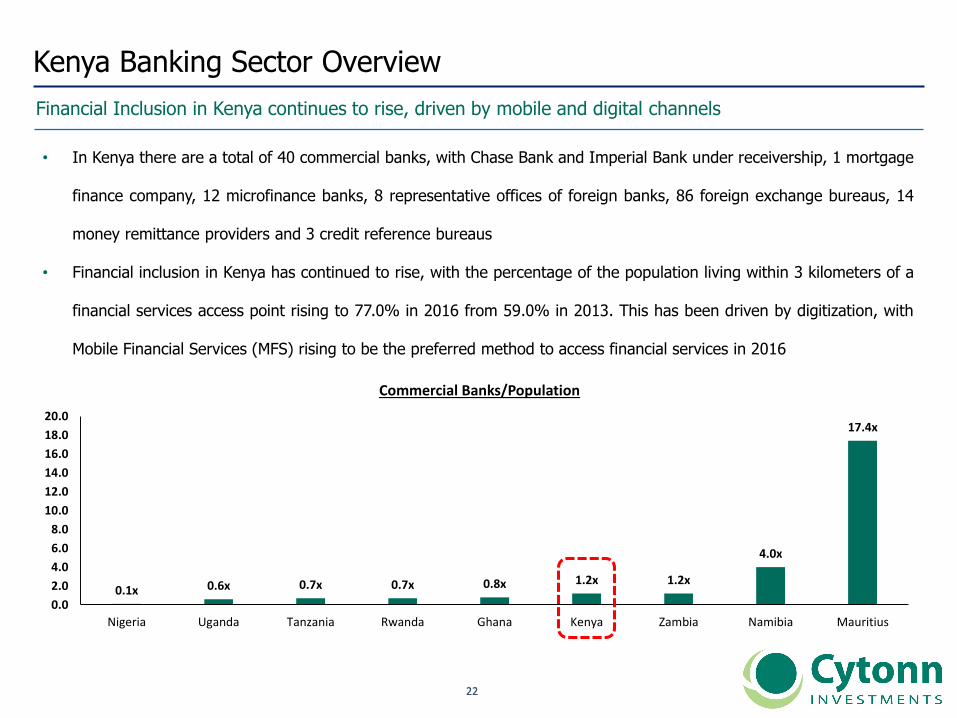
• In Kenya there are a total of 40 commercial banks, with Chase Bank and Imperial Bank under receivership, 1 mortgage
finance company, 12 microfinance banks, 8 representative offices of foreign banks, 86 foreign exchange bureaus, 14
money remittance providers and 3 credit reference bureaus
• Financial inclusion in Kenya has continued to rise, with the percentage of the population living within 3 kilometers of a
financial services access point rising to 77.0% in 2016 from 59.0% in 2013. This has been driven by digitization, with
Mobile Financial Services (MFS) rising to be the preferred method to access financial services in 2016
Kenya Banking Sector Overview
Financial Inclusion in Kenya continues to rise, driven by mobile and digital channels
0.1x 0.6x 0.7x 0.7x 0.8x 1.2x 1.2x
4.0x
17.4x
0.0
2.0
4.0
6.0
8.0
10.0
12.0
14.0
16.0
18.0
20.0
Nigeria Uganda Tanzania Rwanda Ghana Kenya Zambia Namibia Mauritius
Commercial Banks/Population

2323
• Kenya’s banking environment is already going through consolidation as evidenced by heightened M&A activity over the
last 4 years
• Below is a summary of key transactions done over the last few years and their transaction multiples
Kenya Banking Sector Overview
The sector has witnessed several acquisitions over the past 4 years, with the most recent being theacquisition of Habib Bank Ltd by Diamond Trust Bank early this year
• For local bank acquisitions, the average price-to-book multiple is at 1.8x, with an average acquisition stake of 80.3%.
• It is notable that acquisitions are also happening at much cheaper valuations, with earlier bank acquisition
announcements, such as Fina, K-Rep and Equatorial Commercial Bank having been at 3.2x, 1.8x and 2.3x P/B,
respectively, while recent acquisitions are happening at between 0.8x to 1.7x P/B, and hence it is a great time to be an
acquirer
Acquirer Bank AcquiredBook Value at
Acquisition (Kshs bns)Transaction
StakeTransaction Value
(Kshs bns)P/Bv
MultipleDate
Diamond Trust Bank Kenya Habib Bank Limited Kenya 2.38 100.0% 1.82 0.8x Mar-17
SBM Holdings Fidelity Commercial Bank 1.75 100.0% 2.75 1.6x Nov-16
M Bank Oriental Commercial Bank 1.80 51.0% 1.30 1.4x Jun-16
I&M Holdings Giro Commercial Bank 2.95 100.0% 5.00 1.7x Jun-16
Mwalimu SACCO Equatorial Commercial Bank 1.15 75.0% 2.60 2.3x Mar-15
Centum K-Rep Bank 2.08 66.0% 2.50 1.8x Jul-14
GT Bank Fina Bank Group 3.86 70.0% 8.60 3.2x Nov-13
Average 80.3% 1.8x
2424
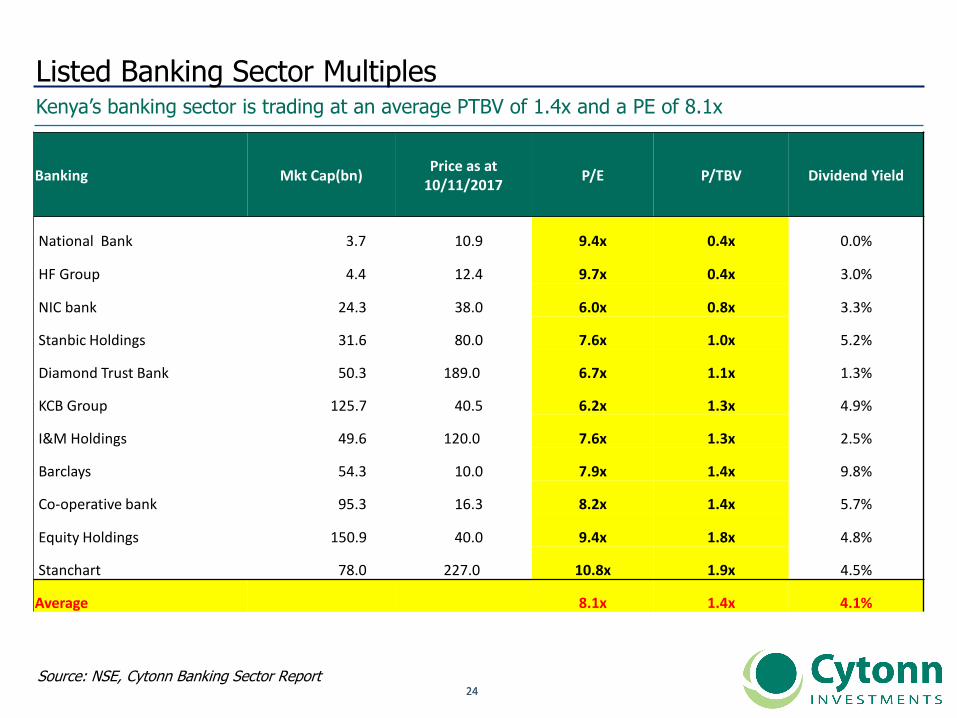
Listed Banking Sector MultiplesKenya’s banking sector is trading at an average PTBV of 1.4x and a PE of 8.1x
Source: NSE, Cytonn Banking Sector Report
Banking Mkt Cap(bn)Price as at
10/11/2017P/E P/TBV Dividend Yield
National Bank 3.7 10.9 9.4x 0.4x 0.0%
HF Group 4.4 12.4 9.7x 0.4x 3.0%
NIC bank 24.3 38.0 6.0x 0.8x 3.3%
Stanbic Holdings 31.6 80.0 7.6x 1.0x 5.2%
Diamond Trust Bank 50.3 189.0 6.7x 1.1x 1.3%
KCB Group 125.7 40.5 6.2x 1.3x 4.9%
I&M Holdings 49.6 120.0 7.6x 1.3x 2.5%
Barclays 54.3 10.0 7.9x 1.4x 9.8%
Co-operative bank 95.3 16.3 8.2x 1.4x 5.7%
Equity Holdings 150.9 40.0 9.4x 1.8x 4.8%
Stanchart 78.0 227.0 10.8x 1.9x 4.5%
Average 8.1x 1.4x 4.1%
2525
Rankings by Franchise Value
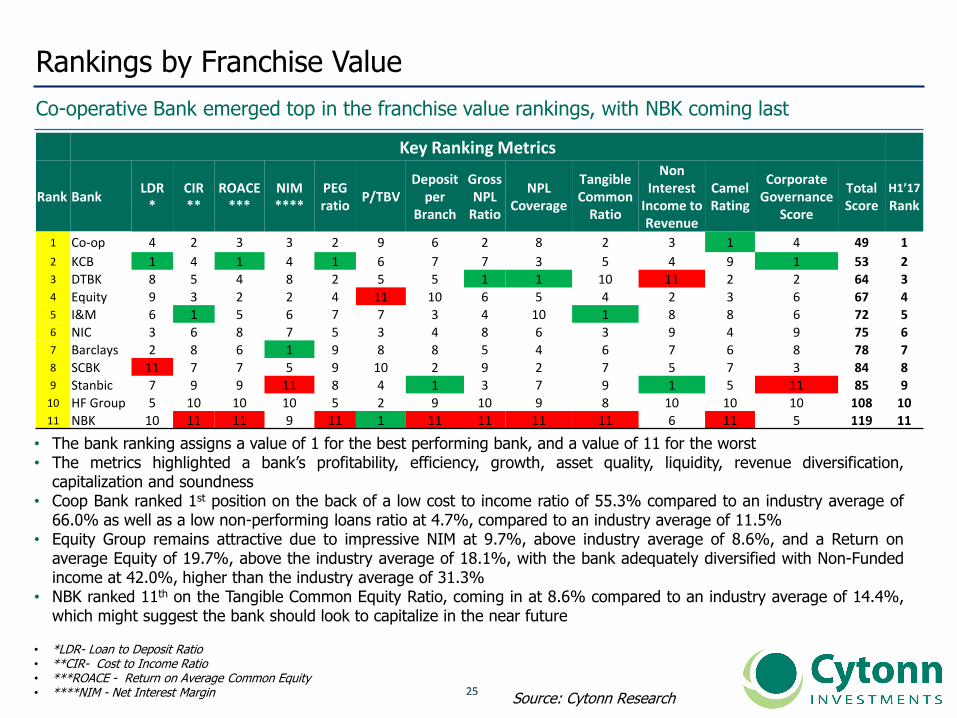
Co-operative Bank emerged top in the franchise value rankings, with NBK coming last
20
12
20
13
Source: Cytonn Research
• The bank ranking assigns a value of 1 for the best performing bank, and a value of 11 for the worst• The metrics highlighted a bank’s profitability, efficiency, growth, asset quality, liquidity, revenue diversification,
capitalization and soundness• Coop Bank ranked 1st position on the back of a low cost to income ratio of 55.3% compared to an industry average of
66.0% as well as a low non-performing loans ratio at 4.7%, compared to an industry average of 11.5%• Equity Group remains attractive due to impressive NIM at 9.7%, above industry average of 8.6%, and a Return on
average Equity of 19.7%, above the industry average of 18.1%, with the bank adequately diversified with Non-Fundedincome at 42.0%, higher than the industry average of 31.3%
• NBK ranked 11th on the Tangible Common Equity Ratio, coming in at 8.6% compared to an industry average of 14.4%,which might suggest the bank should look to capitalize in the near future
• *LDR- Loan to Deposit Ratio • **CIR- Cost to Income Ratio • ***ROACE - Return on Average Common Equity • ****NIM - Net Interest Margin
Key Ranking Metrics
Rank BankLDR
*CIR**
ROACE***
NIM****
PEG ratio
P/TBVDeposit
per Branch
Gross NPL
Ratio
NPL Coverage
Tangible Common
Ratio
Non Interest
Income to Revenue
Camel Rating
Corporate Governance
Score
Total Score
H1’17
Rank
1 Co-op 4 2 3 3 2 9 6 2 8 2 3 1 4 49 1
2 KCB 1 4 1 4 1 6 7 7 3 5 4 9 1 53 23 DTBK 8 5 4 8 2 5 5 1 1 10 11 2 2 64 34 Equity 9 3 2 2 4 11 10 6 5 4 2 3 6 67 45 I&M 6 1 5 6 7 7 3 4 10 1 8 8 6 72 56 NIC 3 6 8 7 5 3 4 8 6 3 9 4 9 75 67 Barclays 2 8 6 1 9 8 8 5 4 6 7 6 8 78 78 SCBK 11 7 7 5 9 10 2 9 2 7 5 7 3 84 89 Stanbic 7 9 9 11 8 4 1 3 7 9 1 5 11 85 9
10 HF Group 5 10 10 10 5 2 9 10 9 8 10 10 10 108 1011 NBK 10 11 11 9 11 1 11 11 11 11 6 11 5 119 11
2626
Rankings by Intrinsic Value
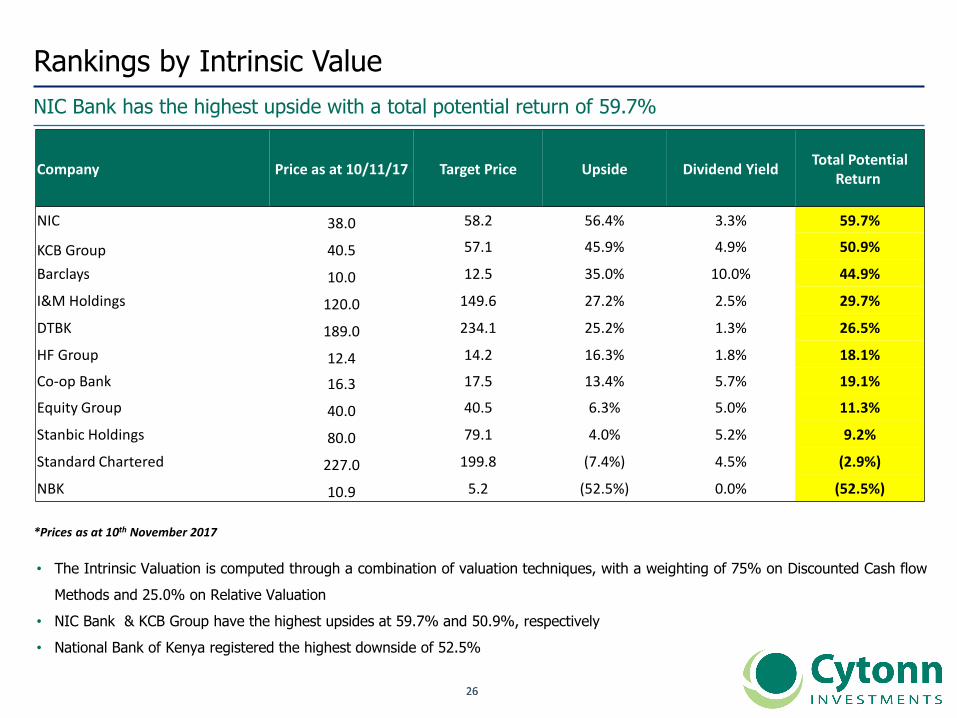
NIC Bank has the highest upside with a total potential return of 59.7%
• The Intrinsic Valuation is computed through a combination of valuation techniques, with a weighting of 75% on Discounted Cash flow
Methods and 25.0% on Relative Valuation
• NIC Bank & KCB Group have the highest upsides at 59.7% and 50.9%, respectively
• National Bank of Kenya registered the highest downside of 52.5%
*Prices as at 10th November 2017
Company Price as at 10/11/17 Target Price Upside Dividend YieldTotal Potential
Return
NIC 38.0 58.2 56.4% 3.3% 59.7%
KCB Group 40.5 57.1 45.9% 4.9% 50.9%
Barclays 10.0 12.5 35.0% 10.0% 44.9%
I&M Holdings 120.0 149.6 27.2% 2.5% 29.7%
DTBK 189.0 234.1 25.2% 1.3% 26.5%
HF Group 12.4 14.2 16.3% 1.8% 18.1%
Co-op Bank 16.3 17.5 13.4% 5.7% 19.1%
Equity Group 40.0 40.5 6.3% 5.0% 11.3%
Stanbic Holdings 80.0 79.1 4.0% 5.2% 9.2%
Standard Chartered 227.0 199.8 (7.4%) 4.5% (2.9%)
NBK 10.9 5.2 (52.5%) 0.0% (52.5%)
2727
Composite Bank Ranking
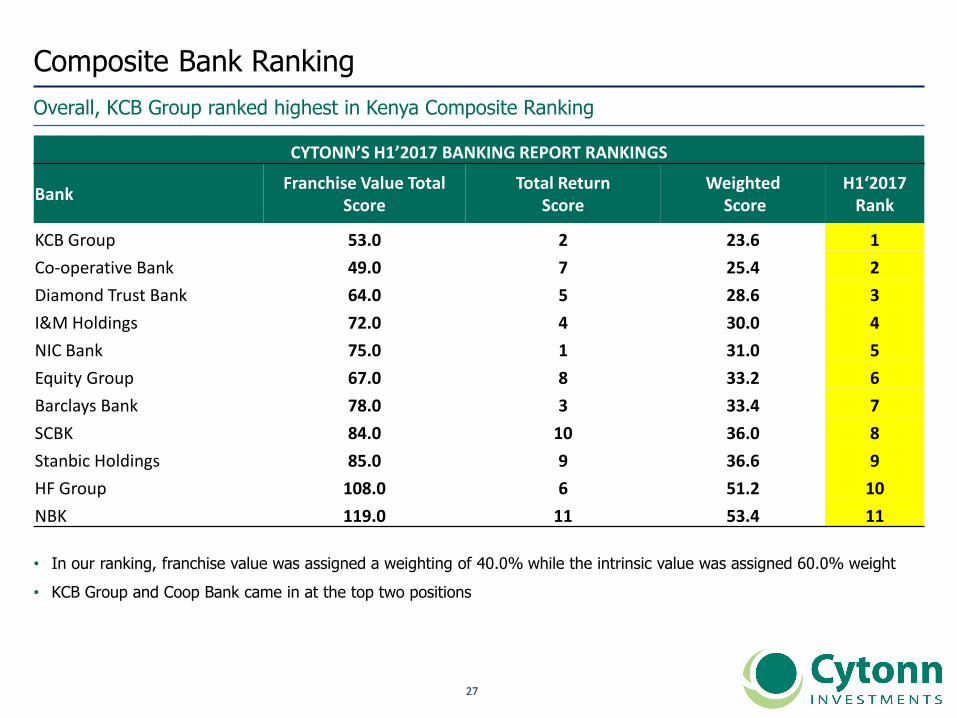
Overall, KCB Group ranked highest in Kenya Composite Ranking
• In our ranking, franchise value was assigned a weighting of 40.0% while the intrinsic value was assigned 60.0% weight
• KCB Group and Coop Bank came in at the top two positions
CYTONN’S H1’2017 BANKING REPORT RANKINGS
BankFranchise Value Total
ScoreTotal Return
ScoreWeighted
ScoreH1‘2017
Rank
KCB Group 53.0 2 23.6 1
Co-operative Bank 49.0 7 25.4 2
Diamond Trust Bank 64.0 5 28.6 3
I&M Holdings 72.0 4 30.0 4
NIC Bank 75.0 1 31.0 5
Equity Group 67.0 8 33.2 6
Barclays Bank 78.0 3 33.4 7
SCBK 84.0 10 36.0 8
Stanbic Holdings 85.0 9 36.6 9
HF Group 108.0 6 51.2 10
NBK 119.0 11 53.4 11
2828
b. Other East African Countries (Tanzania, Uganda, Rwanda)
2929
Overview of the East African Banking SectorIn most countries in East Africa, the markets are dominated by few key players
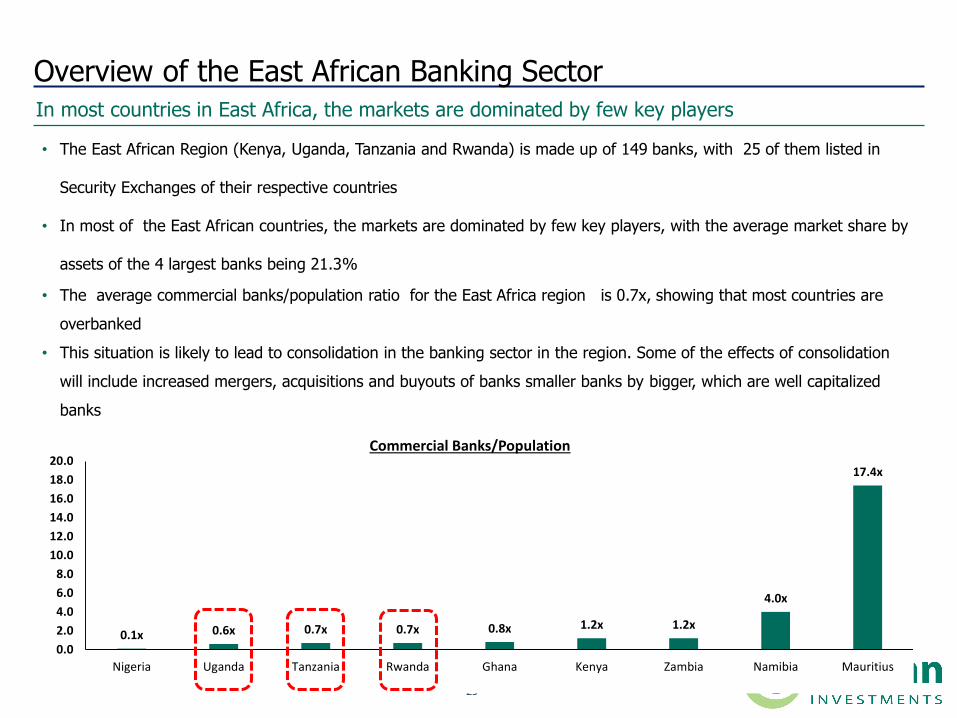
• The East African Region (Kenya, Uganda, Tanzania and Rwanda) is made up of 149 banks, with 25 of them listed in
Security Exchanges of their respective countries
• In most of the East African countries, the markets are dominated by few key players, with the average market share by
assets of the 4 largest banks being 21.3%
• The average commercial banks/population ratio for the East Africa region is 0.7x, showing that most countries are
overbanked
• This situation is likely to lead to consolidation in the banking sector in the region. Some of the effects of consolidation
will include increased mergers, acquisitions and buyouts of banks smaller banks by bigger, which are well capitalized
banks
0.1x 0.6x 0.7x 0.7x 0.8x 1.2x 1.2x
4.0x
17.4x
0.0
2.0
4.0
6.0
8.0
10.0
12.0
14.0
16.0
18.0
20.0
Nigeria Uganda Tanzania Rwanda Ghana Kenya Zambia Namibia Mauritius
Commercial Banks/Population
3030
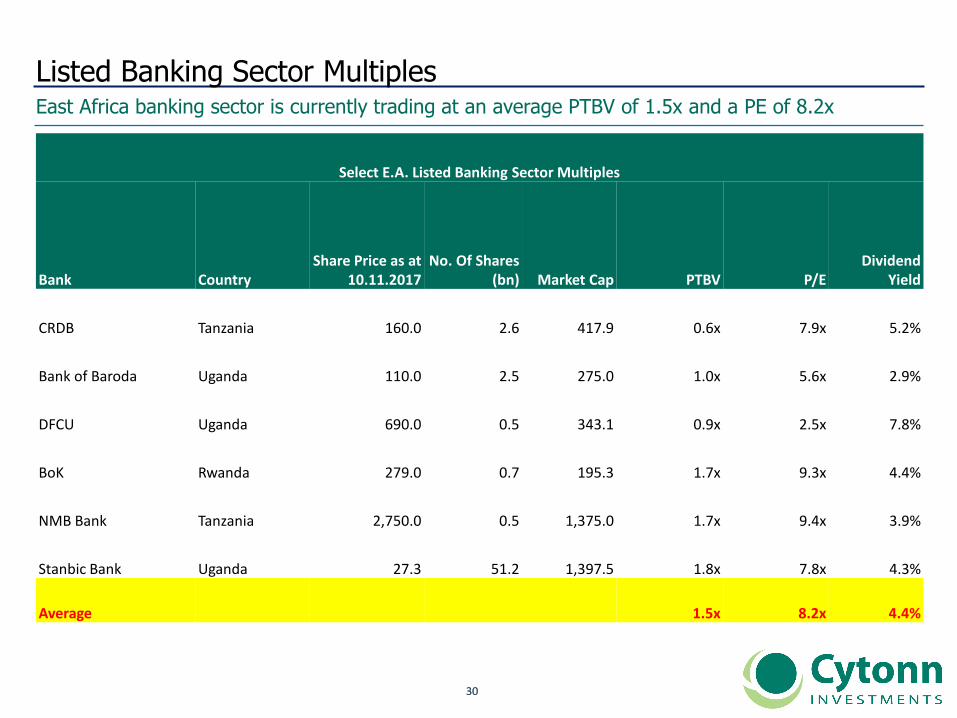
Listed Banking Sector MultiplesEast Africa banking sector is currently trading at an average PTBV of 1.5x and a PE of 8.2x
Select E.A. Listed Banking Sector Multiples
Bank CountryShare Price as at
10.11.2017No. Of Shares
(bn) Market Cap PTBV P/EDividend
Yield
CRDB Tanzania 160.0 2.6 417.9 0.6x 7.9x 5.2%
Bank of Baroda Uganda 110.0 2.5 275.0 1.0x 5.6x 2.9%
DFCU Uganda 690.0 0.5 343.1 0.9x 2.5x 7.8%
BoK Rwanda 279.0 0.7 195.3 1.7x 9.3x 4.4%
NMB Bank Tanzania 2,750.0 0.5 1,375.0 1.7x 9.4x 3.9%
Stanbic Bank Uganda 27.3 51.2 1,397.5 1.8x 7.8x 4.3%
Average 1.5x 8.2x 4.4%
3131
Rankings by Franchise Value
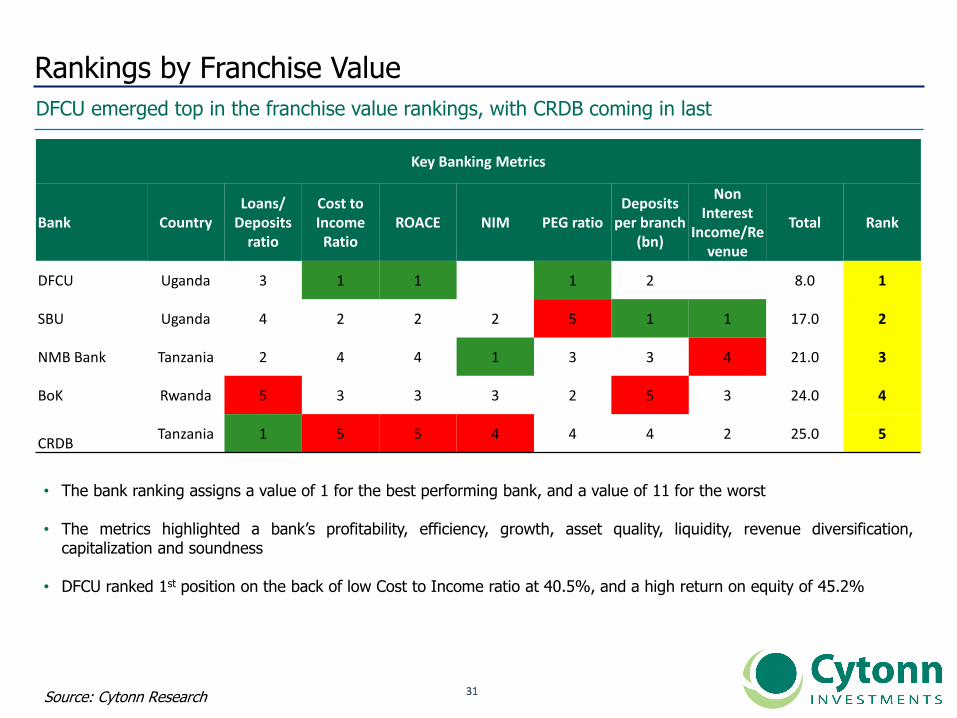
DFCU emerged top in the franchise value rankings, with CRDB coming in last
20
12
20
13
Source: Cytonn Research
• The bank ranking assigns a value of 1 for the best performing bank, and a value of 11 for the worst
• The metrics highlighted a bank’s profitability, efficiency, growth, asset quality, liquidity, revenue diversification,capitalization and soundness
• DFCU ranked 1st position on the back of low Cost to Income ratio at 40.5%, and a high return on equity of 45.2%
Key Banking Metrics
Bank CountryLoans/
Deposits ratio
Cost to Income Ratio
ROACE NIM PEG ratioDeposits
per branch (bn)
Non Interest
Income/Revenue
Total Rank
DFCU Uganda 3 1 1 1 2 8.0 1
SBU Uganda 4 2 2 2 5 1 1 17.0 2
NMB Bank Tanzania 2 4 4 1 3 3 4 21.0 3
BoK Rwanda 5 3 3 3 2 5 3 24.0 4
CRDBTanzania 1 5 5 4 4 4 2 25.0 5
3232
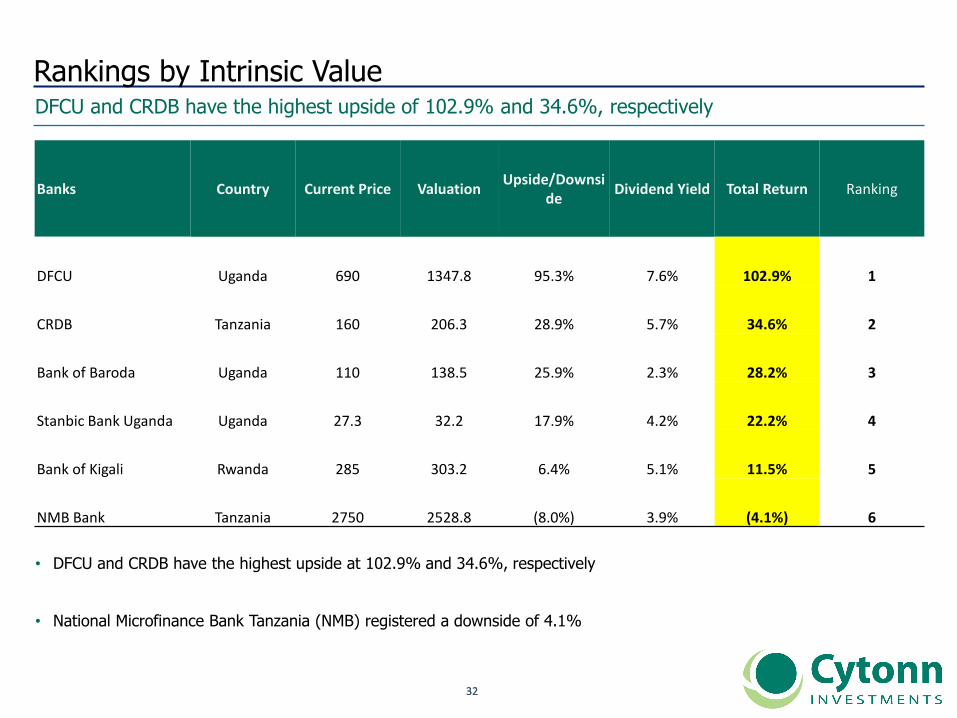
Rankings by Intrinsic ValueDFCU and CRDB have the highest upside of 102.9% and 34.6%, respectively
• DFCU and CRDB have the highest upside at 102.9% and 34.6%, respectively
• National Microfinance Bank Tanzania (NMB) registered a downside of 4.1%
Banks Country Current Price ValuationUpside/Downsi
deDividend Yield Total Return Ranking
DFCU Uganda 690 1347.8 95.3% 7.6% 102.9% 1
CRDB Tanzania 160 206.3 28.9% 5.7% 34.6% 2
Bank of Baroda Uganda 110 138.5 25.9% 2.3% 28.2% 3
Stanbic Bank Uganda Uganda 27.3 32.2 17.9% 4.2% 22.2% 4
Bank of Kigali Rwanda 285 303.2 6.4% 5.1% 11.5% 5
NMB Bank Tanzania 2750 2528.8 (8.0%) 3.9% (4.1%) 6
3333
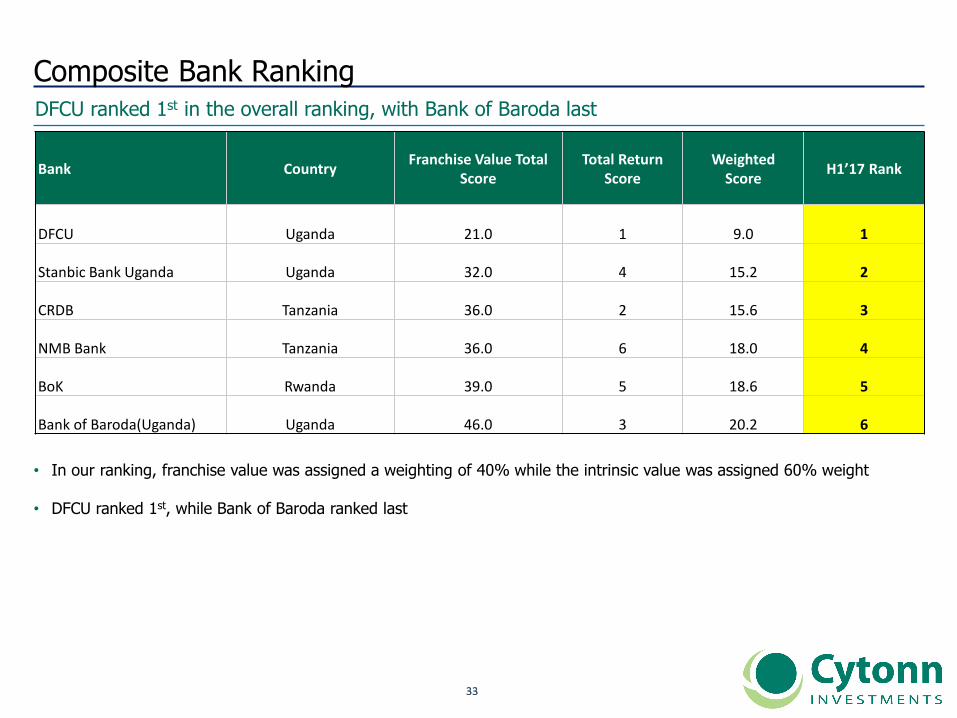
Composite Bank RankingDFCU ranked 1st in the overall ranking, with Bank of Baroda last
• In our ranking, franchise value was assigned a weighting of 40% while the intrinsic value was assigned 60% weight
• DFCU ranked 1st, while Bank of Baroda ranked last
Bank CountryFranchise Value Total
ScoreTotal Return
ScoreWeighted
ScoreH1’17 Rank
DFCU Uganda 21.0 1 9.0 1
Stanbic Bank Uganda Uganda 32.0 4 15.2 2
CRDB Tanzania 36.0 2 15.6 3
NMB Bank Tanzania 36.0 6 18.0 4
BoK Rwanda 39.0 5 18.6 5
Bank of Baroda(Uganda) Uganda 46.0 3 20.2 6
3434
c. Nigeria
3535
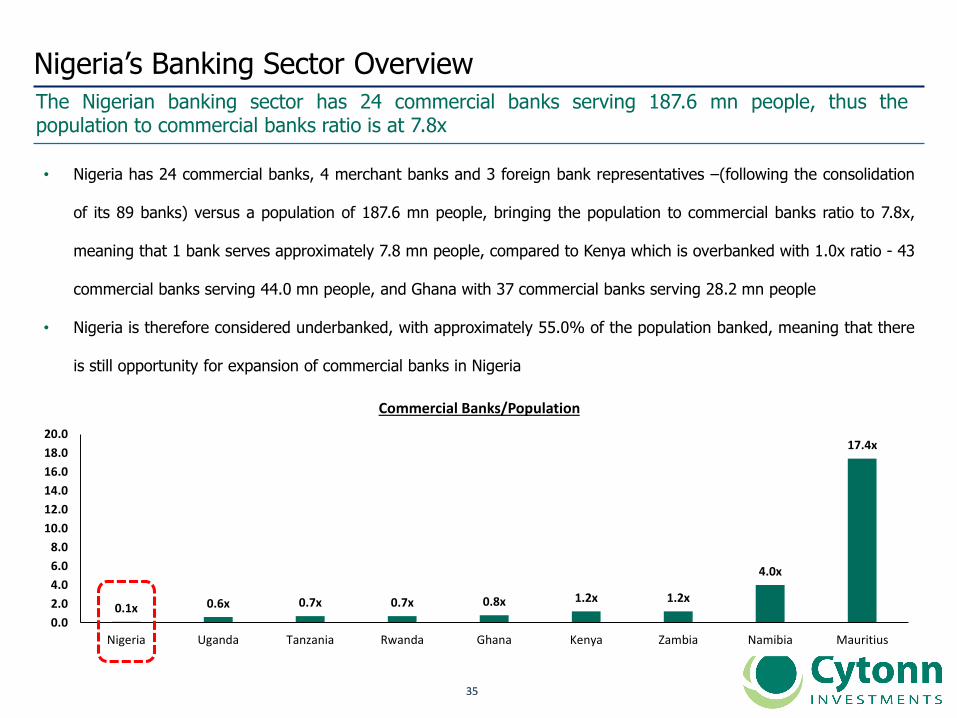
Nigeria’s Banking Sector OverviewThe Nigerian banking sector has 24 commercial banks serving 187.6 mn people, thus thepopulation to commercial banks ratio is at 7.8x
• Nigeria has 24 commercial banks, 4 merchant banks and 3 foreign bank representatives –(following the consolidation
of its 89 banks) versus a population of 187.6 mn people, bringing the population to commercial banks ratio to 7.8x,
meaning that 1 bank serves approximately 7.8 mn people, compared to Kenya which is overbanked with 1.0x ratio - 43
commercial banks serving 44.0 mn people, and Ghana with 37 commercial banks serving 28.2 mn people
• Nigeria is therefore considered underbanked, with approximately 55.0% of the population banked, meaning that there
is still opportunity for expansion of commercial banks in Nigeria
0.1x 0.6x 0.7x 0.7x 0.8x 1.2x 1.2x
4.0x
17.4x
0.0
2.0
4.0
6.0
8.0
10.0
12.0
14.0
16.0
18.0
20.0
Nigeria Uganda Tanzania Rwanda Ghana Kenya Zambia Namibia Mauritius
Commercial Banks/Population
3636
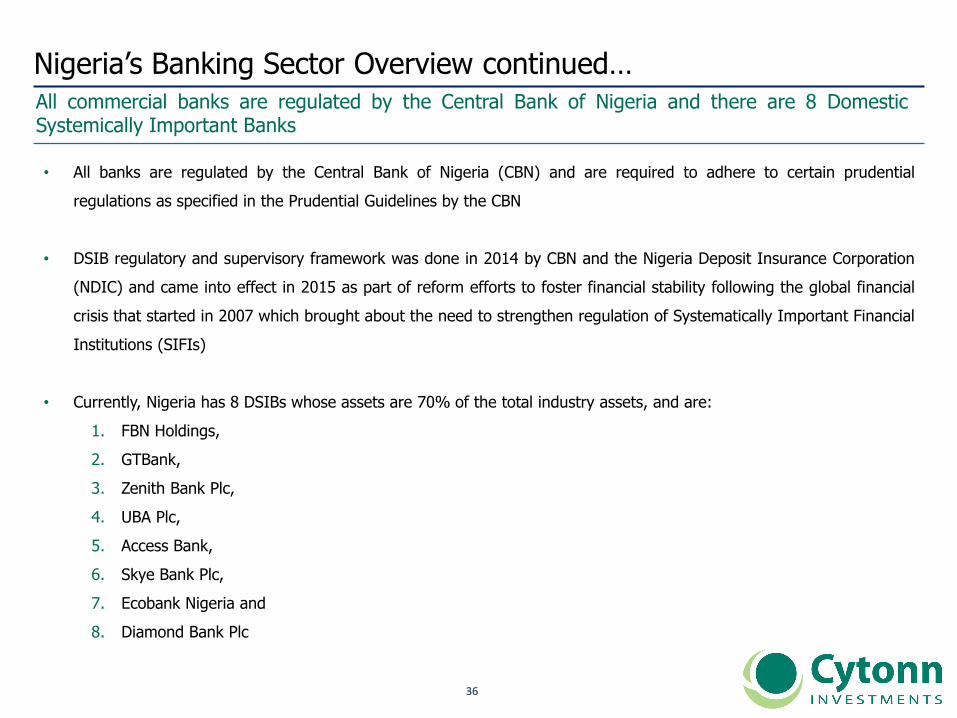
Nigeria’s Banking Sector Overview continued…All commercial banks are regulated by the Central Bank of Nigeria and there are 8 DomesticSystemically Important Banks
• All banks are regulated by the Central Bank of Nigeria (CBN) and are required to adhere to certain prudential
regulations as specified in the Prudential Guidelines by the CBN
• DSIB regulatory and supervisory framework was done in 2014 by CBN and the Nigeria Deposit Insurance Corporation
(NDIC) and came into effect in 2015 as part of reform efforts to foster financial stability following the global financial
crisis that started in 2007 which brought about the need to strengthen regulation of Systematically Important Financial
Institutions (SIFIs)
• Currently, Nigeria has 8 DSIBs whose assets are 70% of the total industry assets, and are:
1. FBN Holdings,
2. GTBank,
3. Zenith Bank Plc,
4. UBA Plc,
5. Access Bank,
6. Skye Bank Plc,
7. Ecobank Nigeria and
8. Diamond Bank Plc
3737
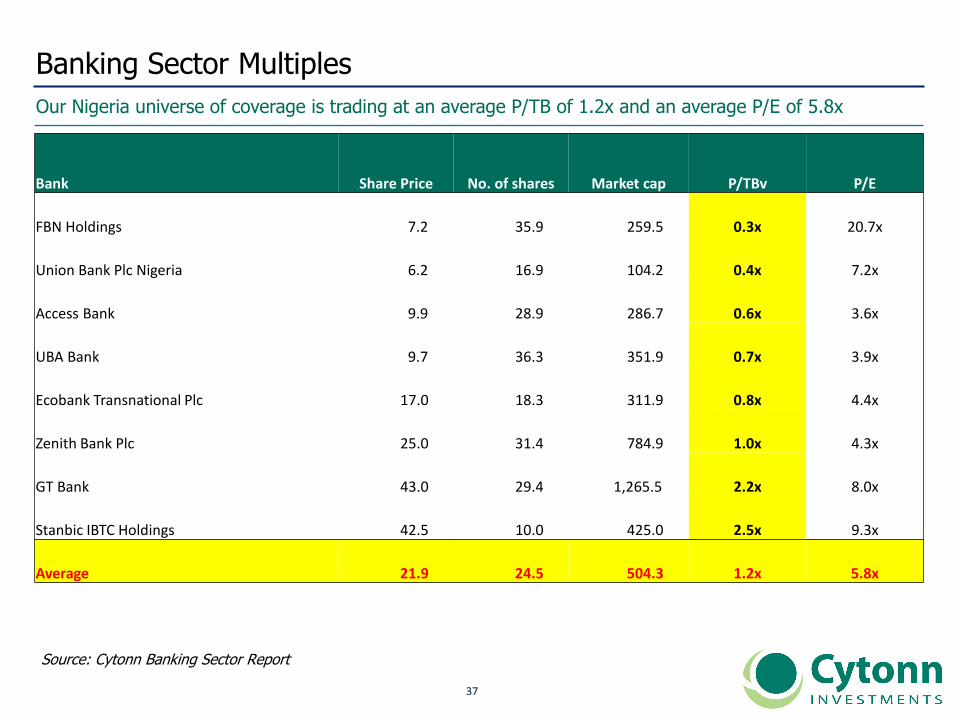
Banking Sector Multiples
Our Nigeria universe of coverage is trading at an average P/TB of 1.2x and an average P/E of 5.8x
Source: Cytonn Banking Sector Report
Bank Share Price No. of shares Market cap P/TBv P/E
FBN Holdings 7.2 35.9 259.5 0.3x 20.7x
Union Bank Plc Nigeria 6.2 16.9 104.2 0.4x 7.2x
Access Bank 9.9 28.9 286.7 0.6x 3.6x
UBA Bank 9.7 36.3 351.9 0.7x 3.9x
Ecobank Transnational Plc 17.0 18.3 311.9 0.8x 4.4x
Zenith Bank Plc 25.0 31.4 784.9 1.0x 4.3x
GT Bank 43.0 29.4 1,265.5 2.2x 8.0x
Stanbic IBTC Holdings 42.5 10.0 425.0 2.5x 9.3x
Average 21.9 24.5 504.3 1.2x 5.8x
3838
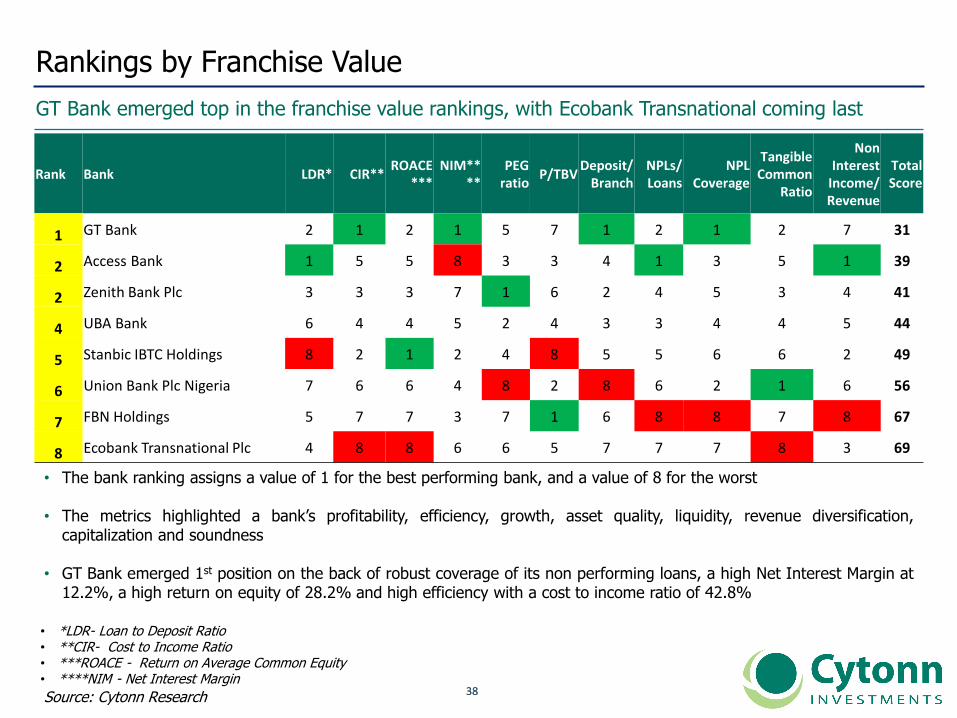
Rankings by Franchise Value
GT Bank emerged top in the franchise value rankings, with Ecobank Transnational coming last
20
12
20
13
Source: Cytonn Research
• The bank ranking assigns a value of 1 for the best performing bank, and a value of 8 for the worst
• The metrics highlighted a bank’s profitability, efficiency, growth, asset quality, liquidity, revenue diversification,capitalization and soundness
• GT Bank emerged 1st position on the back of robust coverage of its non performing loans, a high Net Interest Margin at12.2%, a high return on equity of 28.2% and high efficiency with a cost to income ratio of 42.8%
• *LDR- Loan to Deposit Ratio • **CIR- Cost to Income Ratio • ***ROACE - Return on Average Common Equity • ****NIM - Net Interest Margin
Rank Bank LDR* CIR**ROACE
***NIM**
**PEG
ratioP/TBV
Deposit/ Branch
NPLs/ Loans
NPL Coverage
Tangible Common
Ratio
Non Interest
Income/ Revenue
Total Score
1 GT Bank 2 1 2 1 5 7 1 2 1 2 7 31
2 Access Bank 1 5 5 8 3 3 4 1 3 5 1 39
2 Zenith Bank Plc 3 3 3 7 1 6 2 4 5 3 4 41
4 UBA Bank 6 4 4 5 2 4 3 3 4 4 5 44
5 Stanbic IBTC Holdings 8 2 1 2 4 8 5 5 6 6 2 49
6 Union Bank Plc Nigeria 7 6 6 4 8 2 8 6 2 1 6 56
7 FBN Holdings 5 7 7 3 7 1 6 8 8 7 8 67
8 Ecobank Transnational Plc 4 8 8 6 6 5 7 7 7 8 3 69
3939
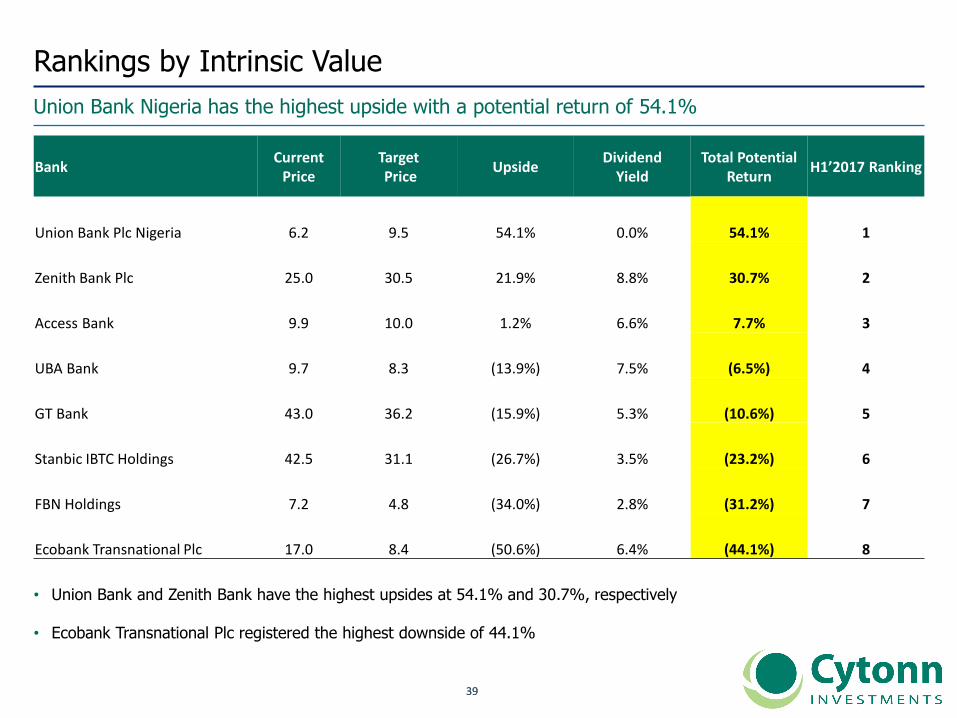
Rankings by Intrinsic Value
Union Bank Nigeria has the highest upside with a potential return of 54.1%
• Union Bank and Zenith Bank have the highest upsides at 54.1% and 30.7%, respectively
• Ecobank Transnational Plc registered the highest downside of 44.1%
BankCurrent
PriceTargetPrice
UpsideDividend
YieldTotal Potential
ReturnH1’2017 Ranking
Union Bank Plc Nigeria 6.2 9.5 54.1% 0.0% 54.1% 1
Zenith Bank Plc 25.0 30.5 21.9% 8.8% 30.7% 2
Access Bank 9.9 10.0 1.2% 6.6% 7.7% 3
UBA Bank 9.7 8.3 (13.9%) 7.5% (6.5%) 4
GT Bank 43.0 36.2 (15.9%) 5.3% (10.6%) 5
Stanbic IBTC Holdings 42.5 31.1 (26.7%) 3.5% (23.2%) 6
FBN Holdings 7.2 4.8 (34.0%) 2.8% (31.2%) 7
Ecobank Transnational Plc 17.0 8.4 (50.6%) 6.4% (44.1%) 8

4040
Composite Bank Ranking
Overall GT Bank ranked highest, while Ecobank Transnational ranked last
• In our ranking, franchise value was assigned a weighting of 40% while the intrinsic value was assigned 60% weight
• GT Bank emerged first while Ecobank Transnational emerged the last in ranking
Cytonn's H1'2017 Banking Report Rankings
BankFranchise Value
Total ScoreTotal Return
ScoreWeighted
ScoreH1’2017 Ranking
GT Bank 31.0 5.0 15.4 1
Access Bank 39.0 3.0 17.4 2
Zenith Bank Plc 41.0 2.0 17.6 3
UBA Bank 44.0 4.0 20.0 4
Union Bank Plc Nigeria 56.0 1.0 23.0 5
Stanbic IBTC Holdings 49.0 6.0 23.2 6
FBN Holdings 67.0 7.0 31.0 7
Ecobank Transnational Plc 69.0 8.0 32.4 8

4141
d. Ghana
4242
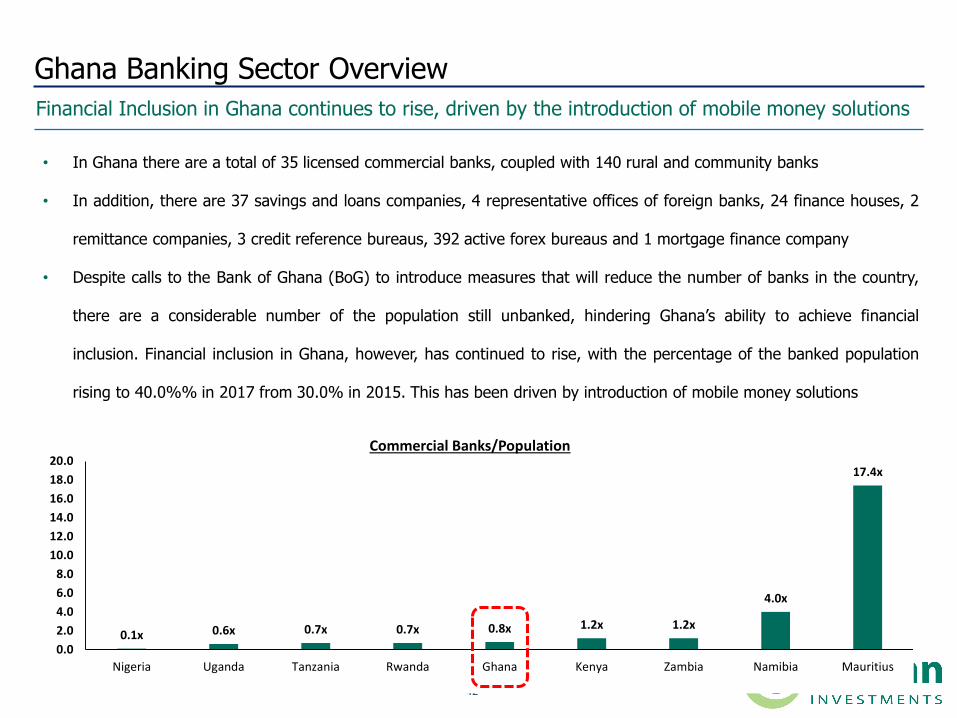
• In Ghana there are a total of 35 licensed commercial banks, coupled with 140 rural and community banks
• In addition, there are 37 savings and loans companies, 4 representative offices of foreign banks, 24 finance houses, 2
remittance companies, 3 credit reference bureaus, 392 active forex bureaus and 1 mortgage finance company
• Despite calls to the Bank of Ghana (BoG) to introduce measures that will reduce the number of banks in the country,
there are a considerable number of the population still unbanked, hindering Ghana’s ability to achieve financial
inclusion. Financial inclusion in Ghana, however, has continued to rise, with the percentage of the banked population
rising to 40.0%% in 2017 from 30.0% in 2015. This has been driven by introduction of mobile money solutions
Ghana Banking Sector Overview
Financial Inclusion in Ghana continues to rise, driven by the introduction of mobile money solutions
0.1x 0.6x 0.7x 0.7x 0.8x 1.2x 1.2x
4.0x
17.4x
0.0
2.0
4.0
6.0
8.0
10.0
12.0
14.0
16.0
18.0
20.0
Nigeria Uganda Tanzania Rwanda Ghana Kenya Zambia Namibia Mauritius
Commercial Banks/Population

4343
Ghana Banking Sector Overview
Basel II implementation is underway and the framework for DSIBs has already been laid out
Implementation of Basel II and IFRS 9
• Basel II compliance is underway (50.0% done) with help from the IMF and is expected to be complete by 1st July 2018
• IFRS 9 is expected to be implemented on 1st January 2018 but banks are yet to carry out a gap analysis with the
guidance of the Bank of Ghana and international audit firms and hence this date may be delayed
Domestic Systematically Important Banks (DSIBs)
• DSIB implementation is underway with methodology for classification having been developed, 5 banks having fit the
role but something that is reviewed regularly and is subject to change, and a mechanism for monitoring them with
more stringent requirements being developed
• These banks are:
Ecobank
Barclays
SCB
GCB
Unibank
4444
Ghana Banking Sector OverviewTreasury single accounts are set to be implemented gradually while the Bank of Ghana hastightened regulation and introduced consumer protection regulations
Treasury Single Accounts
• Treasury Single Accounts (TSA) are also set to be fully implemented requiring about 40.0% of the current government
deposits which constitute government assembly accounts to be remitted to the BoG
• Implementation of TSA is expected to be gradual but eventually the aim is to have all government deposits with the
BoG
Consumer Protection & Tighter Regulation
• The Bank of Ghana has put in place regulations in a bid to protect the integrity of the financial services market as well
as ensure the stability of the financial system, such as the review of the minimum capital requirements, with the
minimum capital requirement increased to GH Cedi 400 mn from the GH Cedi 120 mn, previously
• The Bank of Ghana (BoG) begun the implementation of the Ghana Depository Protection Act, 2016 (Act 931) in the
second quarter of 2017
• The Act, which was passed by Parliament in 2016, is expected to protect depositors from unforeseen circumstances
that may result in loss of funds
• The new Banking Act 2016 has strengthened areas of supervision with no waivers permitted for banks that fall below
minimum statutory capital requirements
• There are also provisions for the base rate model used by banks for loan pricing to be improved upon
4545
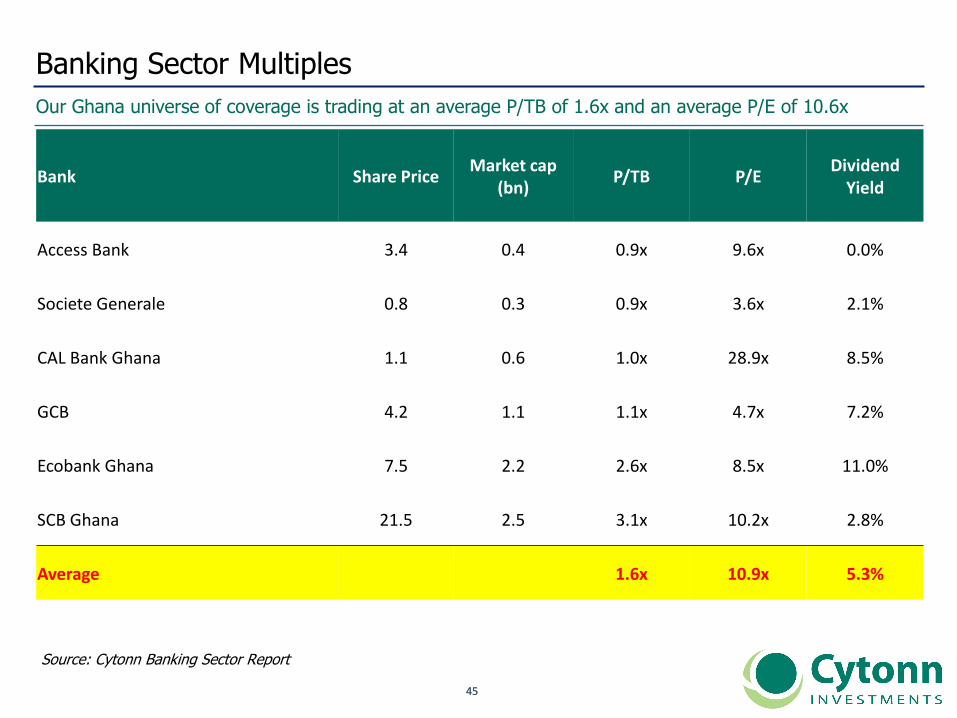
Banking Sector Multiples
Our Ghana universe of coverage is trading at an average P/TB of 1.6x and an average P/E of 10.6x
Source: Cytonn Banking Sector Report
Bank Share PriceMarket cap
(bn)P/TB P/E
DividendYield
Access Bank 3.4 0.4 0.9x 9.6x 0.0%
Societe Generale 0.8 0.3 0.9x 3.6x 2.1%
CAL Bank Ghana 1.1 0.6 1.0x 28.9x 8.5%
GCB 4.2 1.1 1.1x 4.7x 7.2%
Ecobank Ghana 7.5 2.2 2.6x 8.5x 11.0%
SCB Ghana 21.5 2.5 3.1x 10.2x 2.8%
Average 1.6x 10.9x 5.3%
4646
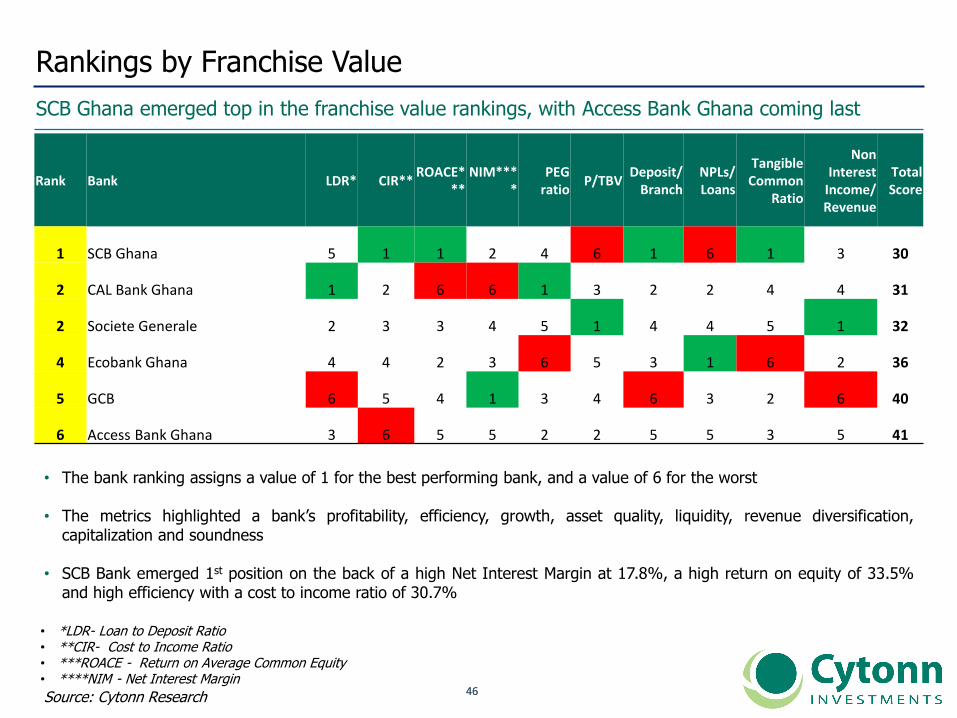
Rankings by Franchise Value
SCB Ghana emerged top in the franchise value rankings, with Access Bank Ghana coming last
20
12
20
13
Source: Cytonn Research
• The bank ranking assigns a value of 1 for the best performing bank, and a value of 6 for the worst
• The metrics highlighted a bank’s profitability, efficiency, growth, asset quality, liquidity, revenue diversification,capitalization and soundness
• SCB Bank emerged 1st position on the back of a high Net Interest Margin at 17.8%, a high return on equity of 33.5%and high efficiency with a cost to income ratio of 30.7%
• *LDR- Loan to Deposit Ratio • **CIR- Cost to Income Ratio • ***ROACE - Return on Average Common Equity • ****NIM - Net Interest Margin
Rank Bank LDR* CIR**ROACE*
**NIM***
*PEG
ratioP/TBV
Deposit/ Branch
NPLs/ Loans
Tangible Common
Ratio
Non Interest
Income/ Revenue
Total Score
1 SCB Ghana 5 1 1 2 4 6 1 6 1 3 30
2 CAL Bank Ghana 1 2 6 6 1 3 2 2 4 4 31
2 Societe Generale 2 3 3 4 5 1 4 4 5 1 32
4 Ecobank Ghana 4 4 2 3 6 5 3 1 6 2 36
5 GCB 6 5 4 1 3 4 6 3 2 6 40
6 Access Bank Ghana 3 6 5 5 2 2 5 5 3 5 41

4747
Rankings by Intrinsic Value
GCB Bank has the highest upside with a potential return of 81.8%
• GCB Bank and Ecobank Ghana have the highest upsides at 81.8% and 53.2%, respectively
• SCB Ghana has the lowest upside of 2.1%
Bank Current Price Target Price Upside Dividend YieldTotal Potential
Return H1'2017 Ranking
GCB 4.2 7.4 74.5% 7.2% 81.8% 1
Ecobank Ghana 7.5 10.7 42.2% 11.0% 53.2% 2
Access Bank 3.4 4.8 42.5% 0.0% 42.5% 3
Societe Generale 0.8 1.0 39.3% 2.1% 41.4% 4
CAL Bank 1.1 1.2 13.6% 8.5% 22.1% 5
SCB Ghana 21.5 21.3 (0.7%) 2.8% 2.1% 6
4848
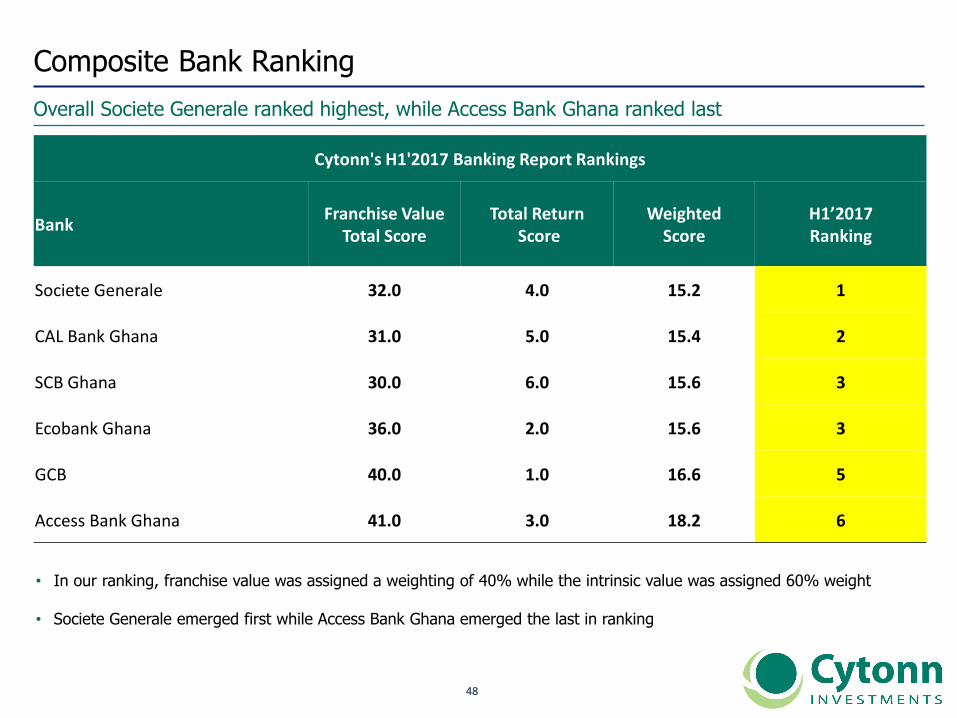
Composite Bank Ranking
Overall Societe Generale ranked highest, while Access Bank Ghana ranked last
• In our ranking, franchise value was assigned a weighting of 40% while the intrinsic value was assigned 60% weight
• Societe Generale emerged first while Access Bank Ghana emerged the last in ranking
Cytonn's H1'2017 Banking Report Rankings
BankFranchise Value
Total ScoreTotal Return
ScoreWeighted
ScoreH1’2017 Ranking
Societe Generale 32.0 4.0 15.2 1
CAL Bank Ghana 31.0 5.0 15.4 2
SCB Ghana 30.0 6.0 15.6 3
Ecobank Ghana 36.0 2.0 15.6 3
GCB 40.0 1.0 16.6 5
Access Bank Ghana 41.0 3.0 18.2 6
4949
e. Other Sub-Saharan Africa Countries (Mauritius, Zambia, Namibia)
5050
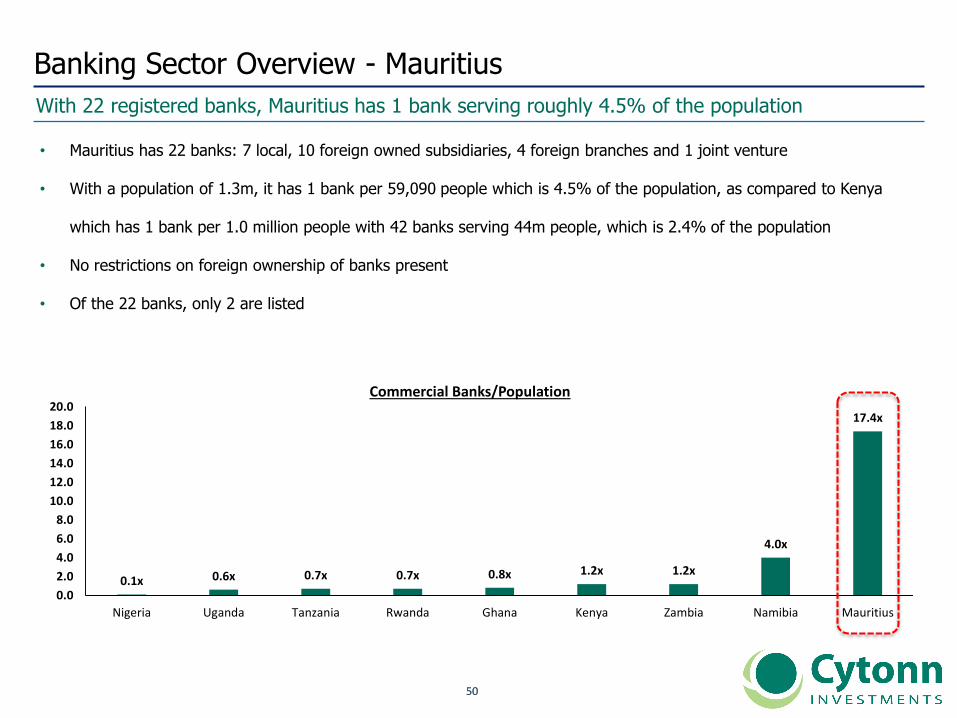
Banking Sector Overview - Mauritius
• Mauritius has 22 banks: 7 local, 10 foreign owned subsidiaries, 4 foreign branches and 1 joint venture
• With a population of 1.3m, it has 1 bank per 59,090 people which is 4.5% of the population, as compared to Kenya
which has 1 bank per 1.0 million people with 42 banks serving 44m people, which is 2.4% of the population
• No restrictions on foreign ownership of banks present
• Of the 22 banks, only 2 are listed
With 22 registered banks, Mauritius has 1 bank serving roughly 4.5% of the population
0.1x 0.6x 0.7x 0.7x 0.8x 1.2x 1.2x
4.0x
17.4x
0.0
2.0
4.0
6.0
8.0
10.0
12.0
14.0
16.0
18.0
20.0
Nigeria Uganda Tanzania Rwanda Ghana Kenya Zambia Namibia Mauritius
Commercial Banks/Population

5151
Banking Sector Overview - ZambiaThe Zambian banking sector has 19 commercial banks serving 15.5 mn people, thus the commercial banks to population ratio is at 1.2x
• Zambia has 19 banks versus a population of 15.5 mn people, bringing the commercial banks to population ratio to
about 1.2x compared to Kenya which is at 1.0x with 42 commercial banks serving 44.0 mn people
• This means Zambia is adequately banked. Of the 19 banks, 8 are subsidiaries of foreign banks, 9 are local privately
owned and 2 are partly owned by the government
• All the banks are regulated by the Bank of Zambia (BOZ)
Source – Bank of Zambia Website
0.1x 0.6x 0.7x 0.7x 0.8x 1.2x 1.2x
4.0x
17.4x
0.0
2.0
4.0
6.0
8.0
10.0
12.0
14.0
16.0
18.0
20.0
Nigeria Uganda Tanzania Rwanda Ghana Kenya Zambia Namibia Mauritius
Commercial Banks/Population
5252
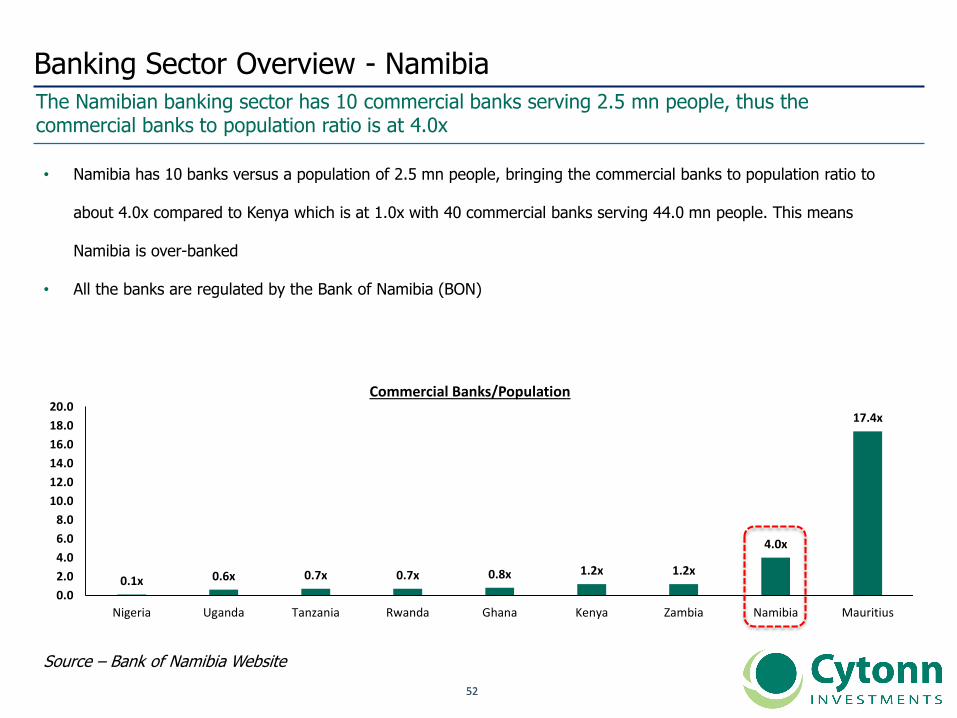
Banking Sector Overview - NamibiaThe Namibian banking sector has 10 commercial banks serving 2.5 mn people, thus the commercial banks to population ratio is at 4.0x
• Namibia has 10 banks versus a population of 2.5 mn people, bringing the commercial banks to population ratio to
about 4.0x compared to Kenya which is at 1.0x with 40 commercial banks serving 44.0 mn people. This means
Namibia is over-banked
• All the banks are regulated by the Bank of Namibia (BON)
Source – Bank of Namibia Website
0.1x 0.6x 0.7x 0.7x 0.8x 1.2x 1.2x
4.0x
17.4x
0.0
2.0
4.0
6.0
8.0
10.0
12.0
14.0
16.0
18.0
20.0
Nigeria Uganda Tanzania Rwanda Ghana Kenya Zambia Namibia Mauritius
Commercial Banks/Population
5353
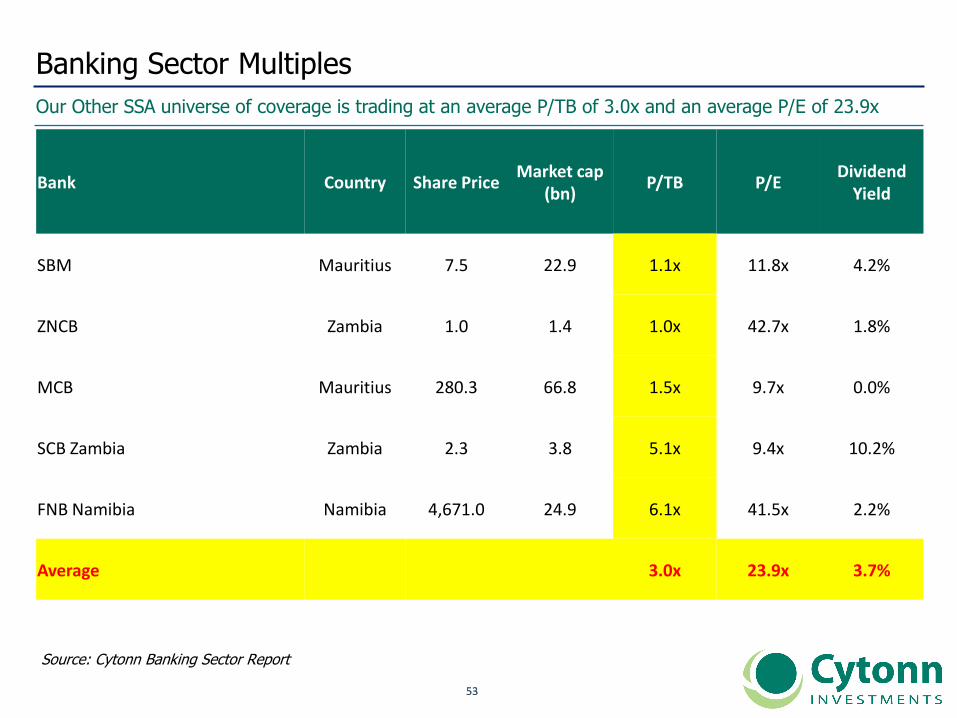
Banking Sector Multiples
Our Other SSA universe of coverage is trading at an average P/TB of 3.0x and an average P/E of 23.9x
Source: Cytonn Banking Sector Report
Bank Country Share PriceMarket cap
(bn)P/TB P/E
DividendYield
SBM Mauritius 7.5 22.9 1.1x 11.8x 4.2%
ZNCB Zambia 1.0 1.4 1.0x 42.7x 1.8%
MCB Mauritius 280.3 66.8 1.5x 9.7x 0.0%
SCB Zambia Zambia 2.3 3.8 5.1x 9.4x 10.2%
FNB Namibia Namibia 4,671.0 24.9 6.1x 41.5x 2.2%
Average 3.0x 23.9x 3.7%
5454
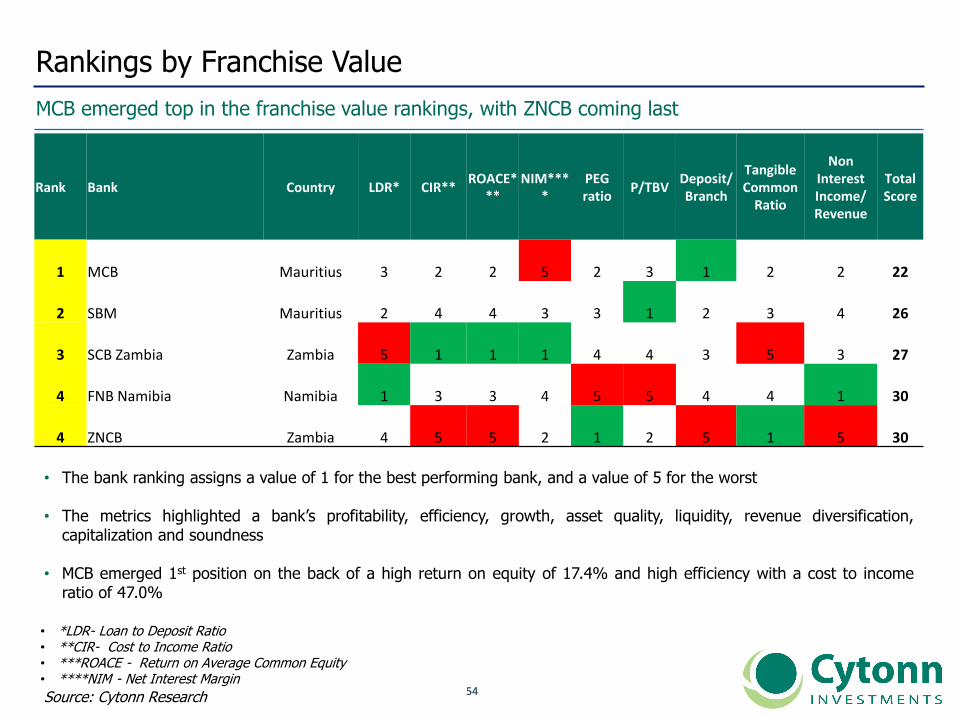
Rankings by Franchise Value
MCB emerged top in the franchise value rankings, with ZNCB coming last
20
12
20
13
Source: Cytonn Research
• The bank ranking assigns a value of 1 for the best performing bank, and a value of 5 for the worst
• The metrics highlighted a bank’s profitability, efficiency, growth, asset quality, liquidity, revenue diversification,capitalization and soundness
• MCB emerged 1st position on the back of a high return on equity of 17.4% and high efficiency with a cost to incomeratio of 47.0%
• *LDR- Loan to Deposit Ratio • **CIR- Cost to Income Ratio • ***ROACE - Return on Average Common Equity • ****NIM - Net Interest Margin
Rank Bank Country LDR* CIR**ROACE*
**NIM***
*PEG ratio
P/TBVDeposit/ Branch
Tangible Common
Ratio
Non Interest Income/ Revenue
Total Score
1 MCB Mauritius 3 2 2 5 2 3 1 2 2 22
2 SBM Mauritius 2 4 4 3 3 1 2 3 4 26
3 SCB Zambia Zambia 5 1 1 1 4 4 3 5 3 27
4 FNB Namibia Namibia 1 3 3 4 5 5 4 4 1 30
4 ZNCB Zambia 4 5 5 2 1 2 5 1 5 30
5555
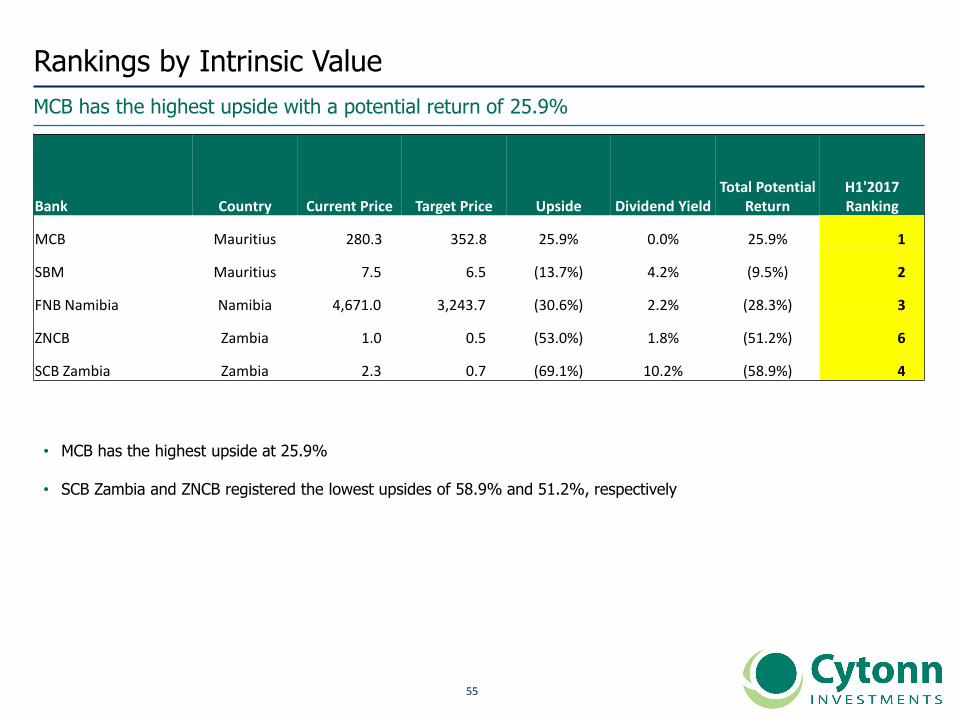
Rankings by Intrinsic Value
MCB has the highest upside with a potential return of 25.9%
• MCB has the highest upside at 25.9%
• SCB Zambia and ZNCB registered the lowest upsides of 58.9% and 51.2%, respectively
Bank Country Current Price Target Price Upside Dividend YieldTotal Potential
ReturnH1'2017 Ranking
MCB Mauritius 280.3 352.8 25.9% 0.0% 25.9% 1
SBM Mauritius 7.5 6.5 (13.7%) 4.2% (9.5%) 2
FNB Namibia Namibia 4,671.0 3,243.7 (30.6%) 2.2% (28.3%) 3
ZNCB Zambia 1.0 0.5 (53.0%) 1.8% (51.2%) 6
SCB Zambia Zambia 2.3 0.7 (69.1%) 10.2% (58.9%) 4
5656
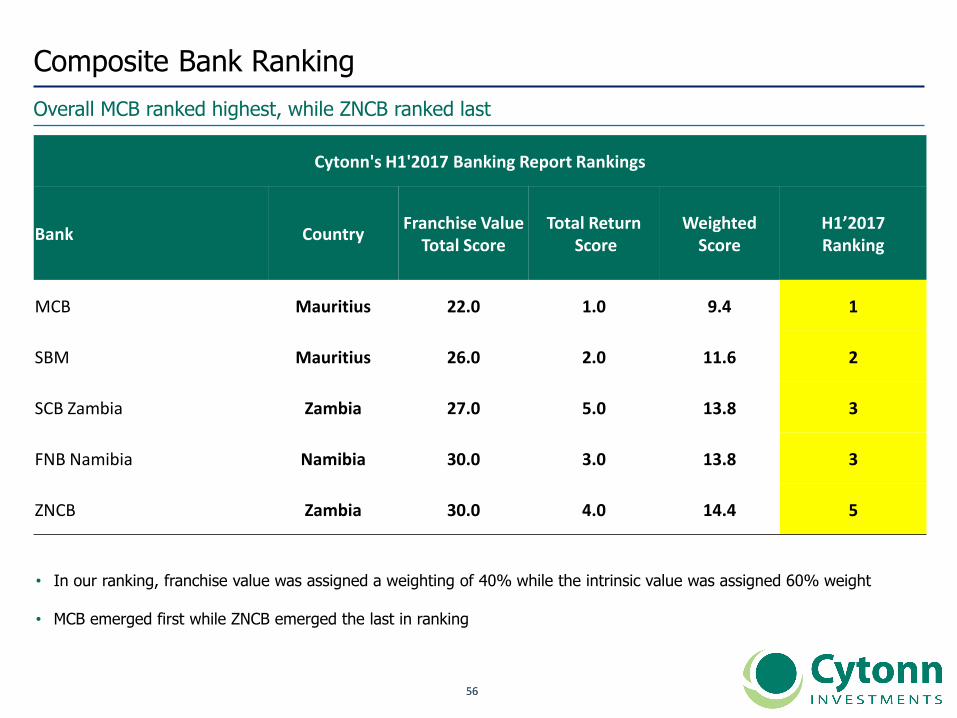
Composite Bank Ranking
Overall MCB ranked highest, while ZNCB ranked last
• In our ranking, franchise value was assigned a weighting of 40% while the intrinsic value was assigned 60% weight
• MCB emerged first while ZNCB emerged the last in ranking
Cytonn's H1'2017 Banking Report Rankings
Bank CountryFranchise Value
Total ScoreTotal Return
ScoreWeighted
ScoreH1’2017 Ranking
MCB Mauritius 22.0 1.0 9.4 1
SBM Mauritius 26.0 2.0 11.6 2
SCB Zambia Zambia 27.0 5.0 13.8 3
FNB Namibia Namibia 30.0 3.0 13.8 3
ZNCB Zambia 30.0 4.0 14.4 5
5757
IV. Summary Cytonn SSA Banking Sector Report
5858
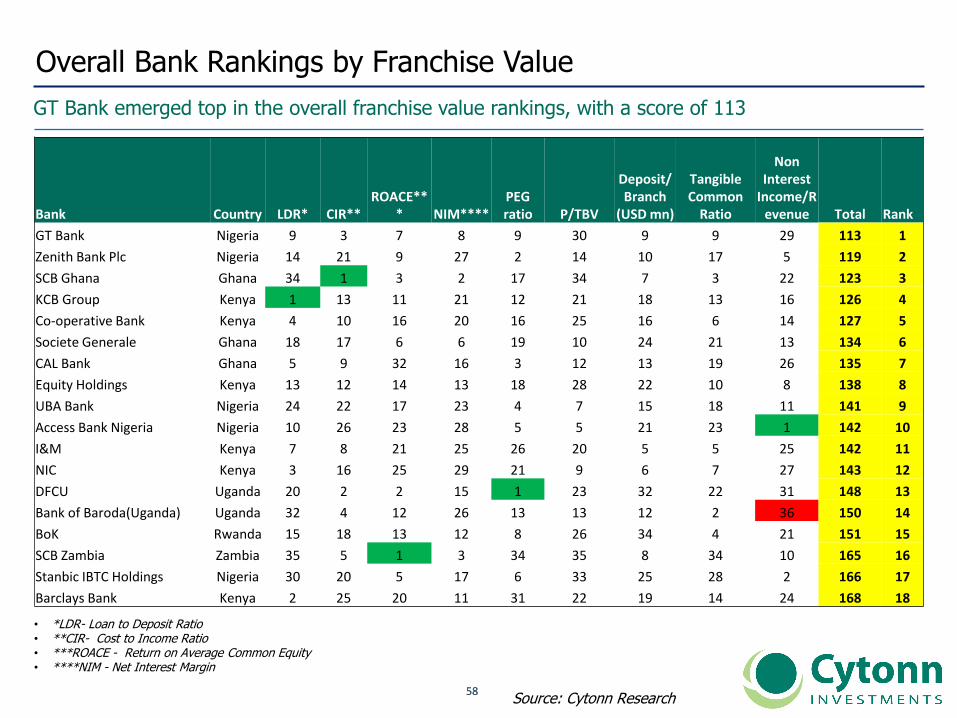
Overall Bank Rankings by Franchise Value
GT Bank emerged top in the overall franchise value rankings, with a score of 113
20
13
Source: Cytonn Research
• *LDR- Loan to Deposit Ratio • **CIR- Cost to Income Ratio • ***ROACE - Return on Average Common Equity • ****NIM - Net Interest Margin
Bank Country LDR* CIR**ROACE**
* NIM****PEG ratio P/TBV
Deposit/Branch
(USD mn)
Tangible Common
Ratio
Non Interest
Income/Revenue Total Rank
GT Bank Nigeria 9 3 7 8 9 30 9 9 29 113 1
Zenith Bank Plc Nigeria 14 21 9 27 2 14 10 17 5 119 2
SCB Ghana Ghana 34 1 3 2 17 34 7 3 22 123 3
KCB Group Kenya 1 13 11 21 12 21 18 13 16 126 4
Co-operative Bank Kenya 4 10 16 20 16 25 16 6 14 127 5
Societe Generale Ghana 18 17 6 6 19 10 24 21 13 134 6
CAL Bank Ghana 5 9 32 16 3 12 13 19 26 135 7
Equity Holdings Kenya 13 12 14 13 18 28 22 10 8 138 8
UBA Bank Nigeria 24 22 17 23 4 7 15 18 11 141 9
Access Bank Nigeria Nigeria 10 26 23 28 5 5 21 23 1 142 10
I&M Kenya 7 8 21 25 26 20 5 5 25 142 11
NIC Kenya 3 16 25 29 21 9 6 7 27 143 12
DFCU Uganda 20 2 2 15 1 23 32 22 31 148 13
Bank of Baroda(Uganda) Uganda 32 4 12 26 13 13 12 2 36 150 14
BoK Rwanda 15 18 13 12 8 26 34 4 21 151 15
SCB Zambia Zambia 35 5 1 3 34 35 8 34 10 165 16
Stanbic IBTC Holdings Nigeria 30 20 5 17 6 33 25 28 2 166 17
Barclays Bank Kenya 2 25 20 11 31 22 19 14 24 168 18
5959
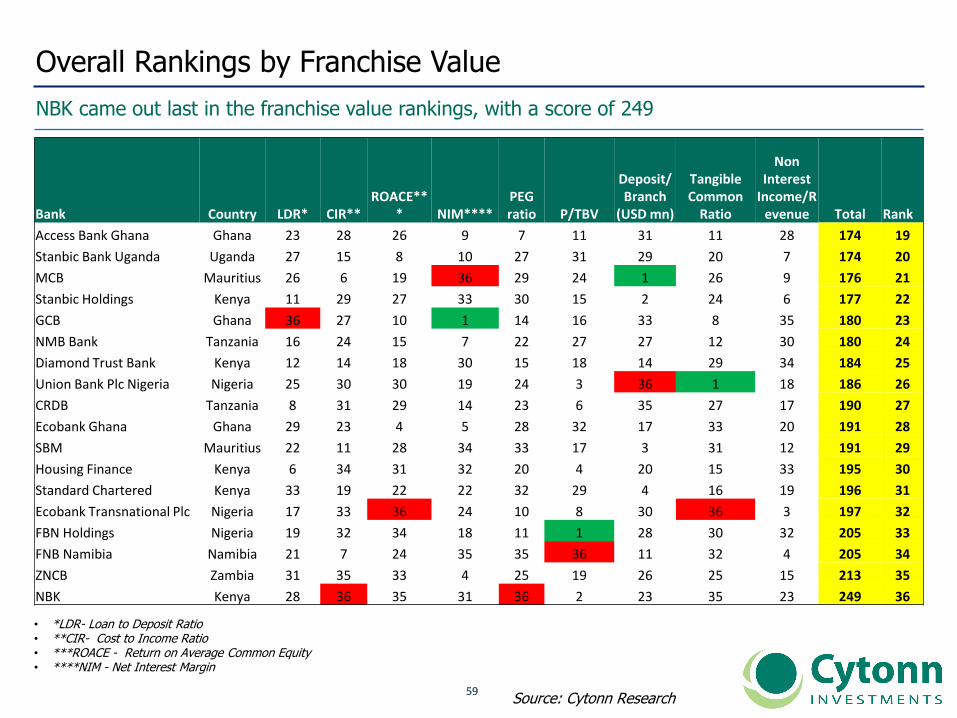
Overall Rankings by Franchise Value
NBK came out last in the franchise value rankings, with a score of 249
20
13
Source: Cytonn Research
• *LDR- Loan to Deposit Ratio • **CIR- Cost to Income Ratio • ***ROACE - Return on Average Common Equity • ****NIM - Net Interest Margin
Bank Country LDR* CIR**ROACE**
* NIM****PEG ratio P/TBV
Deposit/Branch
(USD mn)
Tangible Common
Ratio
Non Interest
Income/Revenue Total Rank
Access Bank Ghana Ghana 23 28 26 9 7 11 31 11 28 174 19
Stanbic Bank Uganda Uganda 27 15 8 10 27 31 29 20 7 174 20
MCB Mauritius 26 6 19 36 29 24 1 26 9 176 21
Stanbic Holdings Kenya 11 29 27 33 30 15 2 24 6 177 22
GCB Ghana 36 27 10 1 14 16 33 8 35 180 23
NMB Bank Tanzania 16 24 15 7 22 27 27 12 30 180 24
Diamond Trust Bank Kenya 12 14 18 30 15 18 14 29 34 184 25
Union Bank Plc Nigeria Nigeria 25 30 30 19 24 3 36 1 18 186 26
CRDB Tanzania 8 31 29 14 23 6 35 27 17 190 27
Ecobank Ghana Ghana 29 23 4 5 28 32 17 33 20 191 28
SBM Mauritius 22 11 28 34 33 17 3 31 12 191 29
Housing Finance Kenya 6 34 31 32 20 4 20 15 33 195 30
Standard Chartered Kenya 33 19 22 22 32 29 4 16 19 196 31
Ecobank Transnational Plc Nigeria 17 33 36 24 10 8 30 36 3 197 32
FBN Holdings Nigeria 19 32 34 18 11 1 28 30 32 205 33
FNB Namibia Namibia 21 7 24 35 35 36 11 32 4 205 34
ZNCB Zambia 31 35 33 4 25 19 26 25 15 213 35
NBK Kenya 28 36 35 31 36 2 23 35 23 249 36
6060
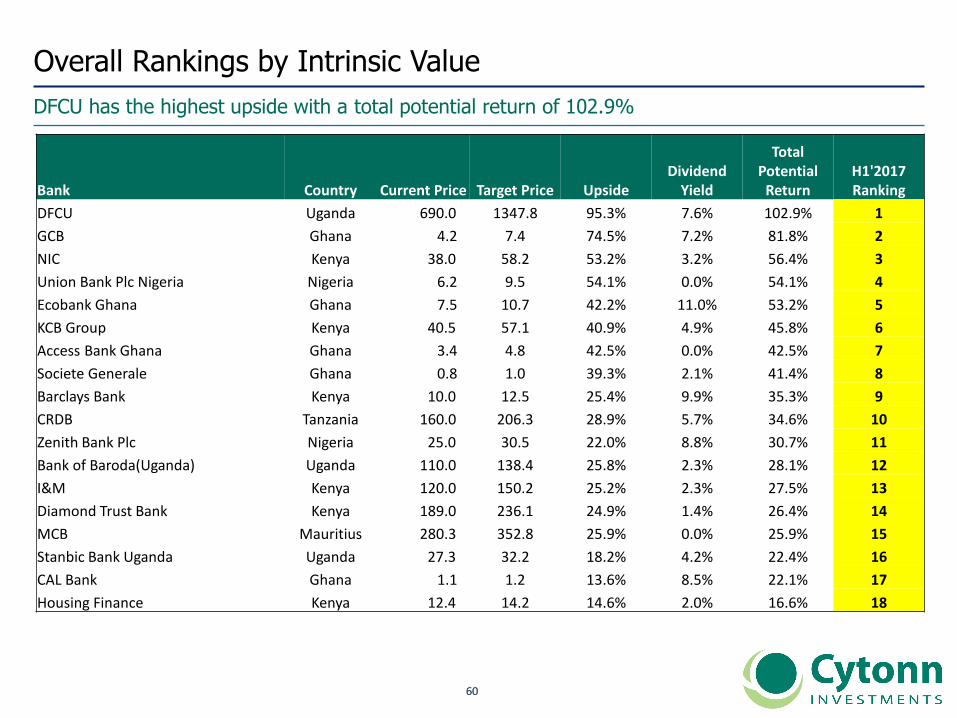
Overall Rankings by Intrinsic Value
DFCU has the highest upside with a total potential return of 102.9%
Bank Country Current Price Target Price UpsideDividend
Yield
Total Potential
ReturnH1'2017 Ranking
DFCU Uganda 690.0 1347.8 95.3% 7.6% 102.9% 1
GCB Ghana 4.2 7.4 74.5% 7.2% 81.8% 2
NIC Kenya 38.0 58.2 53.2% 3.2% 56.4% 3
Union Bank Plc Nigeria Nigeria 6.2 9.5 54.1% 0.0% 54.1% 4
Ecobank Ghana Ghana 7.5 10.7 42.2% 11.0% 53.2% 5
KCB Group Kenya 40.5 57.1 40.9% 4.9% 45.8% 6
Access Bank Ghana Ghana 3.4 4.8 42.5% 0.0% 42.5% 7
Societe Generale Ghana 0.8 1.0 39.3% 2.1% 41.4% 8
Barclays Bank Kenya 10.0 12.5 25.4% 9.9% 35.3% 9
CRDB Tanzania 160.0 206.3 28.9% 5.7% 34.6% 10
Zenith Bank Plc Nigeria 25.0 30.5 22.0% 8.8% 30.7% 11
Bank of Baroda(Uganda) Uganda 110.0 138.4 25.8% 2.3% 28.1% 12
I&M Kenya 120.0 150.2 25.2% 2.3% 27.5% 13
Diamond Trust Bank Kenya 189.0 236.1 24.9% 1.4% 26.4% 14
MCB Mauritius 280.3 352.8 25.9% 0.0% 25.9% 15
Stanbic Bank Uganda Uganda 27.3 32.2 18.2% 4.2% 22.4% 16
CAL Bank Ghana 1.1 1.2 13.6% 8.5% 22.1% 17
Housing Finance Kenya 12.4 14.2 14.6% 2.0% 16.6% 18
6161
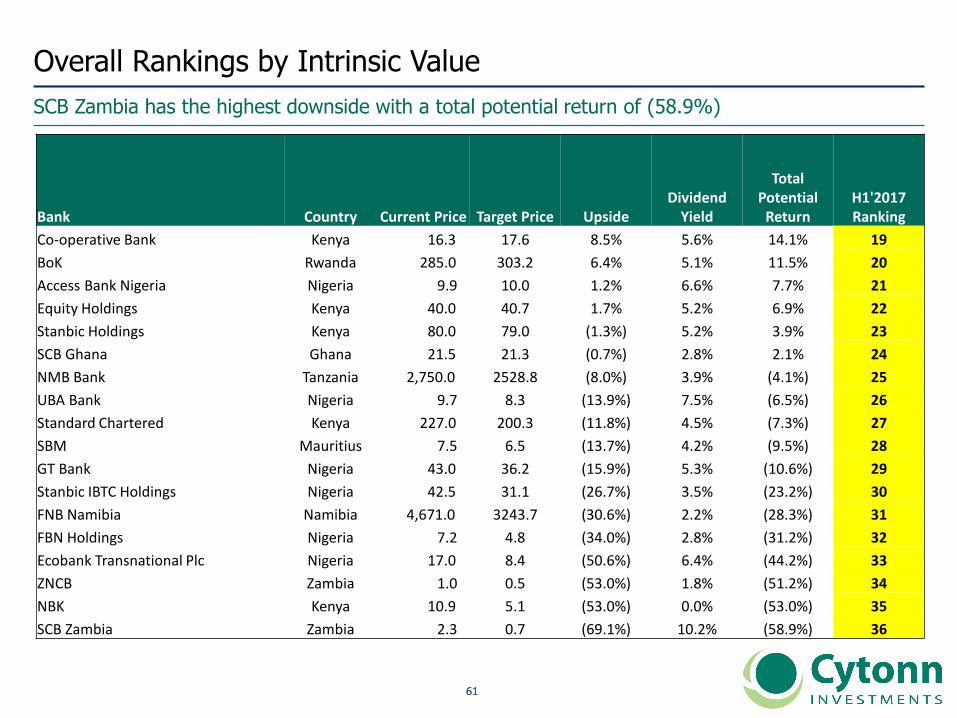
Overall Rankings by Intrinsic Value
SCB Zambia has the highest downside with a total potential return of (58.9%)
Bank Country Current Price Target Price UpsideDividend
Yield
Total Potential
ReturnH1'2017 Ranking
Co-operative Bank Kenya 16.3 17.6 8.5% 5.6% 14.1% 19
BoK Rwanda 285.0 303.2 6.4% 5.1% 11.5% 20
Access Bank Nigeria Nigeria 9.9 10.0 1.2% 6.6% 7.7% 21
Equity Holdings Kenya 40.0 40.7 1.7% 5.2% 6.9% 22
Stanbic Holdings Kenya 80.0 79.0 (1.3%) 5.2% 3.9% 23
SCB Ghana Ghana 21.5 21.3 (0.7%) 2.8% 2.1% 24
NMB Bank Tanzania 2,750.0 2528.8 (8.0%) 3.9% (4.1%) 25
UBA Bank Nigeria 9.7 8.3 (13.9%) 7.5% (6.5%) 26
Standard Chartered Kenya 227.0 200.3 (11.8%) 4.5% (7.3%) 27
SBM Mauritius 7.5 6.5 (13.7%) 4.2% (9.5%) 28
GT Bank Nigeria 43.0 36.2 (15.9%) 5.3% (10.6%) 29
Stanbic IBTC Holdings Nigeria 42.5 31.1 (26.7%) 3.5% (23.2%) 30
FNB Namibia Namibia 4,671.0 3243.7 (30.6%) 2.2% (28.3%) 31
FBN Holdings Nigeria 7.2 4.8 (34.0%) 2.8% (31.2%) 32
Ecobank Transnational Plc Nigeria 17.0 8.4 (50.6%) 6.4% (44.2%) 33
ZNCB Zambia 1.0 0.5 (53.0%) 1.8% (51.2%) 34
NBK Kenya 10.9 5.1 (53.0%) 0.0% (53.0%) 35
SCB Zambia Zambia 2.3 0.7 (69.1%) 10.2% (58.9%) 36
6262
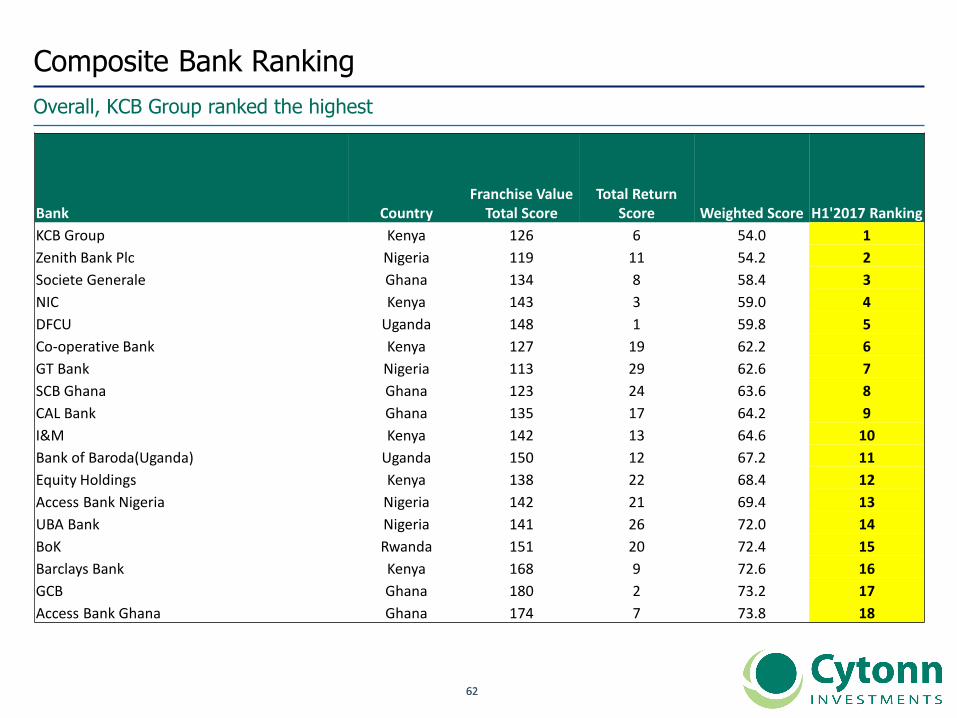
Composite Bank Ranking
Overall, KCB Group ranked the highest
Bank CountryFranchise Value
Total ScoreTotal Return
Score Weighted Score H1'2017 Ranking
KCB Group Kenya 126 6 54.0 1
Zenith Bank Plc Nigeria 119 11 54.2 2
Societe Generale Ghana 134 8 58.4 3
NIC Kenya 143 3 59.0 4
DFCU Uganda 148 1 59.8 5
Co-operative Bank Kenya 127 19 62.2 6
GT Bank Nigeria 113 29 62.6 7
SCB Ghana Ghana 123 24 63.6 8
CAL Bank Ghana 135 17 64.2 9
I&M Kenya 142 13 64.6 10
Bank of Baroda(Uganda) Uganda 150 12 67.2 11
Equity Holdings Kenya 138 22 68.4 12
Access Bank Nigeria Nigeria 142 21 69.4 13
UBA Bank Nigeria 141 26 72.0 14
BoK Rwanda 151 20 72.4 15
Barclays Bank Kenya 168 9 72.6 16
GCB Ghana 180 2 73.2 17
Access Bank Ghana Ghana 174 7 73.8 18
6363
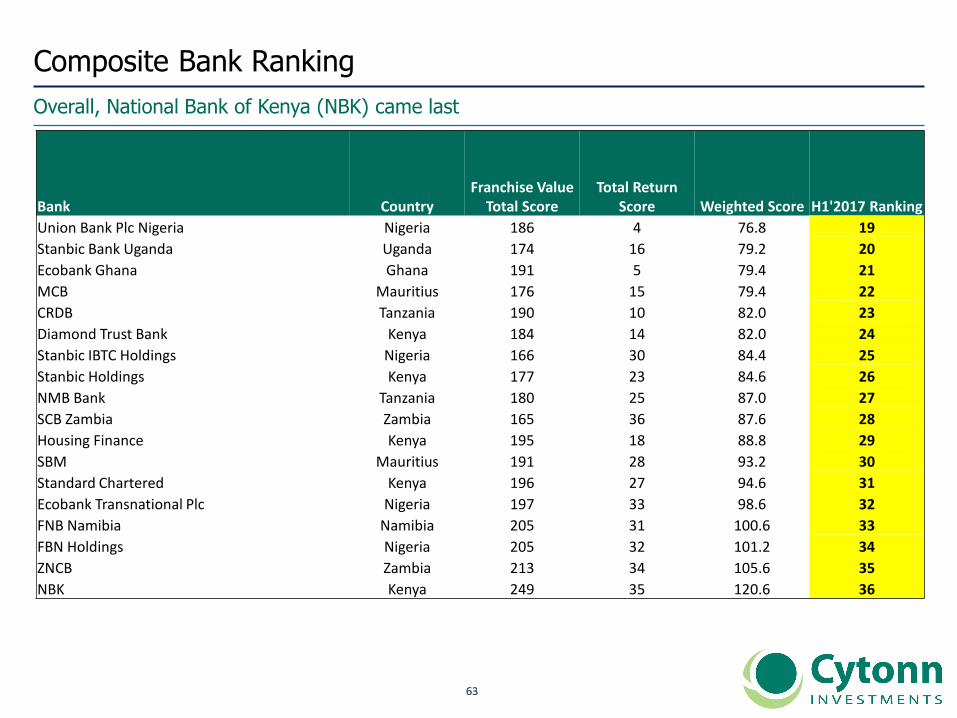
Composite Bank Ranking
Overall, National Bank of Kenya (NBK) came last
Bank CountryFranchise Value
Total ScoreTotal Return
Score Weighted Score H1'2017 Ranking
Union Bank Plc Nigeria Nigeria 186 4 76.8 19
Stanbic Bank Uganda Uganda 174 16 79.2 20
Ecobank Ghana Ghana 191 5 79.4 21
MCB Mauritius 176 15 79.4 22
CRDB Tanzania 190 10 82.0 23
Diamond Trust Bank Kenya 184 14 82.0 24
Stanbic IBTC Holdings Nigeria 166 30 84.4 25
Stanbic Holdings Kenya 177 23 84.6 26
NMB Bank Tanzania 180 25 87.0 27
SCB Zambia Zambia 165 36 87.6 28
Housing Finance Kenya 195 18 88.8 29
SBM Mauritius 191 28 93.2 30
Standard Chartered Kenya 196 27 94.6 31
Ecobank Transnational Plc Nigeria 197 33 98.6 32
FNB Namibia Namibia 205 31 100.6 33
FBN Holdings Nigeria 205 32 101.2 34
ZNCB Zambia 213 34 105.6 35
NBK Kenya 249 35 120.6 36
6464
Insurance Companies
6565
V. SSA Insurance Sector Overview
6666
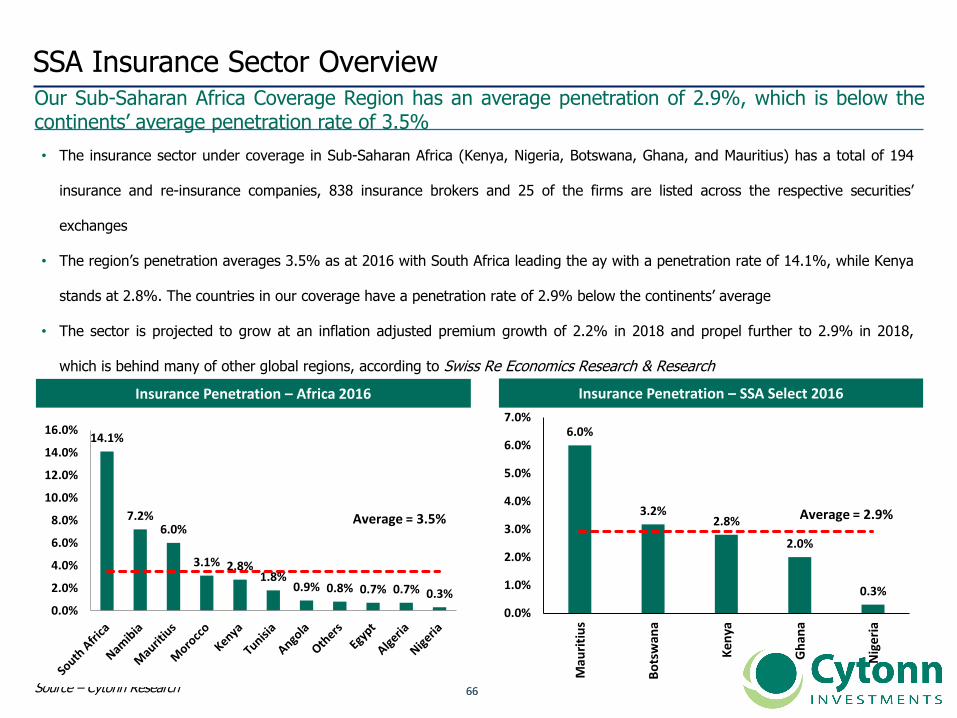
SSA Insurance Sector OverviewOur Sub-Saharan Africa Coverage Region has an average penetration of 2.9%, which is below thecontinents’ average penetration rate of 3.5%
20
12
20
13
• The insurance sector under coverage in Sub-Saharan Africa (Kenya, Nigeria, Botswana, Ghana, and Mauritius) has a total of 194
insurance and re-insurance companies, 838 insurance brokers and 25 of the firms are listed across the respective securities’
exchanges
• The region’s penetration averages 3.5% as at 2016 with South Africa leading the ay with a penetration rate of 14.1%, while Kenya
stands at 2.8%. The countries in our coverage have a penetration rate of 2.9% below the continents’ average
• The sector is projected to grow at an inflation adjusted premium growth of 2.2% in 2018 and propel further to 2.9% in 2018,
which is behind many of other global regions, according to Swiss Re Economics Research & Research
Insurance Penetration – Africa 2016
Source – Cytonn Research
14.1%
7.2%6.0%
3.1% 2.8%1.8%
0.9% 0.8% 0.7% 0.7% 0.3%
0.0%
2.0%
4.0%
6.0%
8.0%
10.0%
12.0%
14.0%
16.0%
Average = 3.5%
6.0%
3.2%2.8%
2.0%
0.3%
0.0%
1.0%
2.0%
3.0%
4.0%
5.0%
6.0%
7.0%
Mau
riti
us
Bo
tsw
ana
Ken
ya
Gh
ana
Nig
eri
a
Average = 2.9%
Insurance Penetration – SSA Select 2016
6767
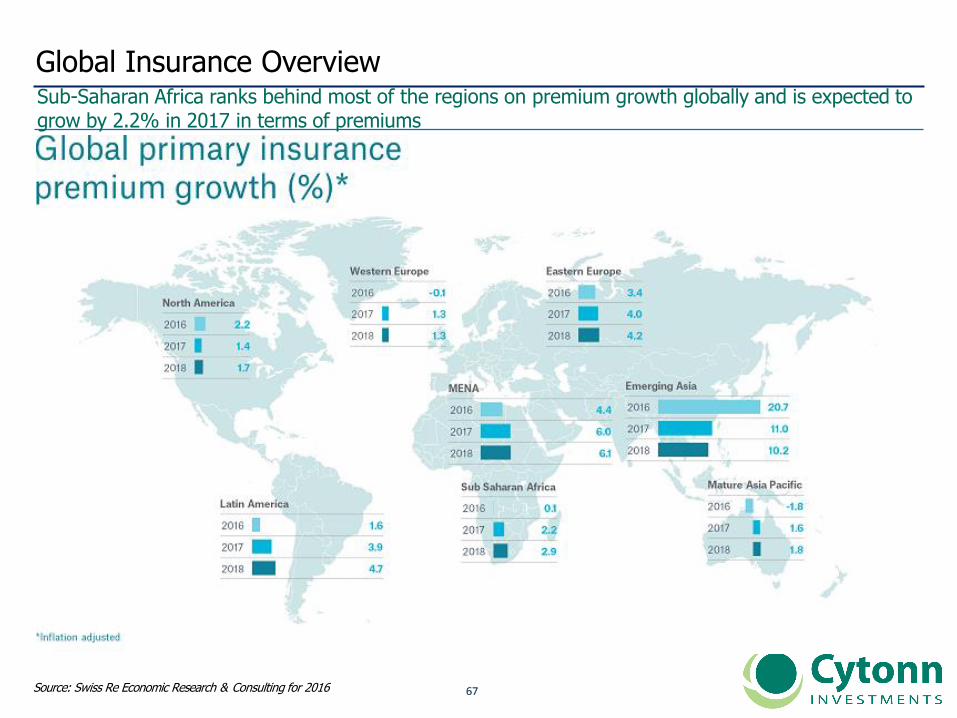
Global Insurance OverviewSub-Saharan Africa ranks behind most of the regions on premium growth globally and is expected to grow by 2.2% in 2017 in terms of premiums
20
12
20
13
Source: Swiss Re Economic Research & Consulting for 2016
6868
SSA Insurance Sector – Global Ranking Comparison
20
12
20
13
* - Metrics for SSA listed insurance companies under Cytonn Research coverage only.
Source: Cytonn Research, Bloomberg
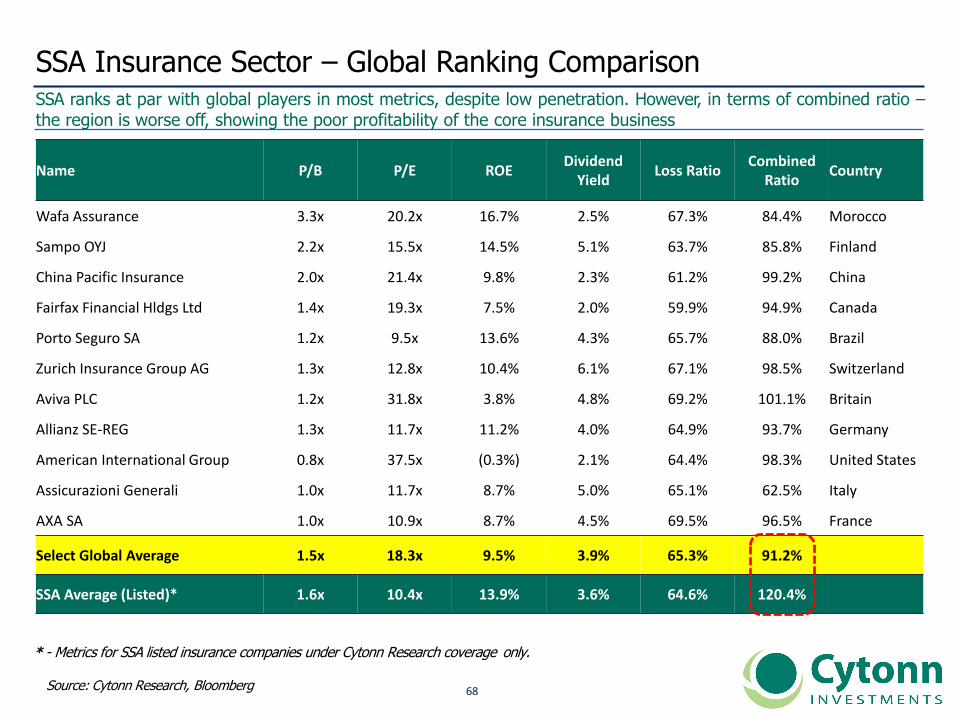
SSA ranks at par with global players in most metrics, despite low penetration. However, in terms of combined ratio –the region is worse off, showing the poor profitability of the core insurance business
Name P/B P/E ROEDividend
YieldLoss Ratio
Combined Ratio
Country
Wafa Assurance 3.3x 20.2x 16.7% 2.5% 67.3% 84.4% Morocco
Sampo OYJ 2.2x 15.5x 14.5% 5.1% 63.7% 85.8% Finland
China Pacific Insurance 2.0x 21.4x 9.8% 2.3% 61.2% 99.2% China
Fairfax Financial Hldgs Ltd 1.4x 19.3x 7.5% 2.0% 59.9% 94.9% Canada
Porto Seguro SA 1.2x 9.5x 13.6% 4.3% 65.7% 88.0% Brazil
Zurich Insurance Group AG 1.3x 12.8x 10.4% 6.1% 67.1% 98.5% Switzerland
Aviva PLC 1.2x 31.8x 3.8% 4.8% 69.2% 101.1% Britain
Allianz SE-REG 1.3x 11.7x 11.2% 4.0% 64.9% 93.7% Germany
American International Group 0.8x 37.5x (0.3%) 2.1% 64.4% 98.3% United States
Assicurazioni Generali 1.0x 11.7x 8.7% 5.0% 65.1% 62.5% Italy
AXA SA 1.0x 10.9x 8.7% 4.5% 69.5% 96.5% France
Select Global Average 1.5x 18.3x 9.5% 3.9% 65.3% 91.2%
SSA Average (Listed)* 1.6x 10.4x 13.9% 3.6% 64.6% 120.4%
6969
SSA Insurance Companies Under Coverage Multiples
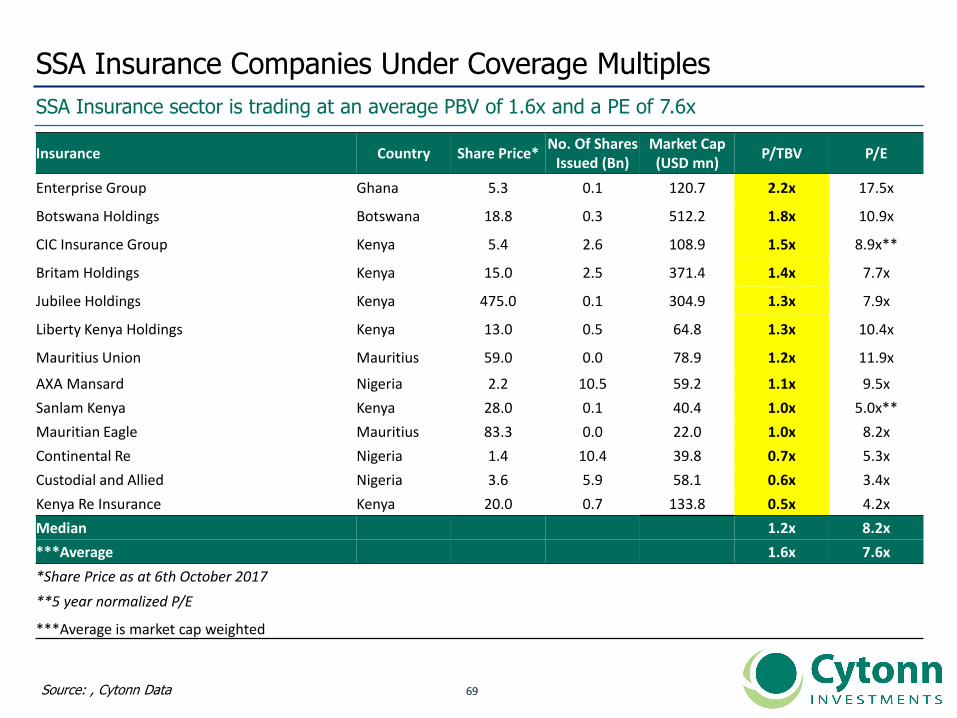
SSA Insurance sector is trading at an average PBV of 1.6x and a PE of 7.6x
Source: , Cytonn Data
Insurance Country Share Price*No. Of Shares
Issued (Bn)Market Cap (USD mn)
P/TBV P/E
Enterprise Group Ghana 5.3 0.1 120.7 2.2x 17.5x
Botswana Holdings Botswana 18.8 0.3 512.2 1.8x 10.9x
CIC Insurance Group Kenya 5.4 2.6 108.9 1.5x 8.9x**
Britam Holdings Kenya 15.0 2.5 371.4 1.4x 7.7x
Jubilee Holdings Kenya 475.0 0.1 304.9 1.3x 7.9x
Liberty Kenya Holdings Kenya 13.0 0.5 64.8 1.3x 10.4x
Mauritius Union Mauritius 59.0 0.0 78.9 1.2x 11.9x
AXA Mansard Nigeria 2.2 10.5 59.2 1.1x 9.5x
Sanlam Kenya Kenya 28.0 0.1 40.4 1.0x 5.0x**
Mauritian Eagle Mauritius 83.3 0.0 22.0 1.0x 8.2x
Continental Re Nigeria 1.4 10.4 39.8 0.7x 5.3x
Custodial and Allied Nigeria 3.6 5.9 58.1 0.6x 3.4x
Kenya Re Insurance Kenya 20.0 0.7 133.8 0.5x 4.2x
Median 1.2x 8.2x
***Average 1.6x 7.6x
*Share Price as at 6th October 2017
**5 year normalized P/E
***Average is market cap weighted
7070
VI. Regional and Country Review- Insurance Sector
7171
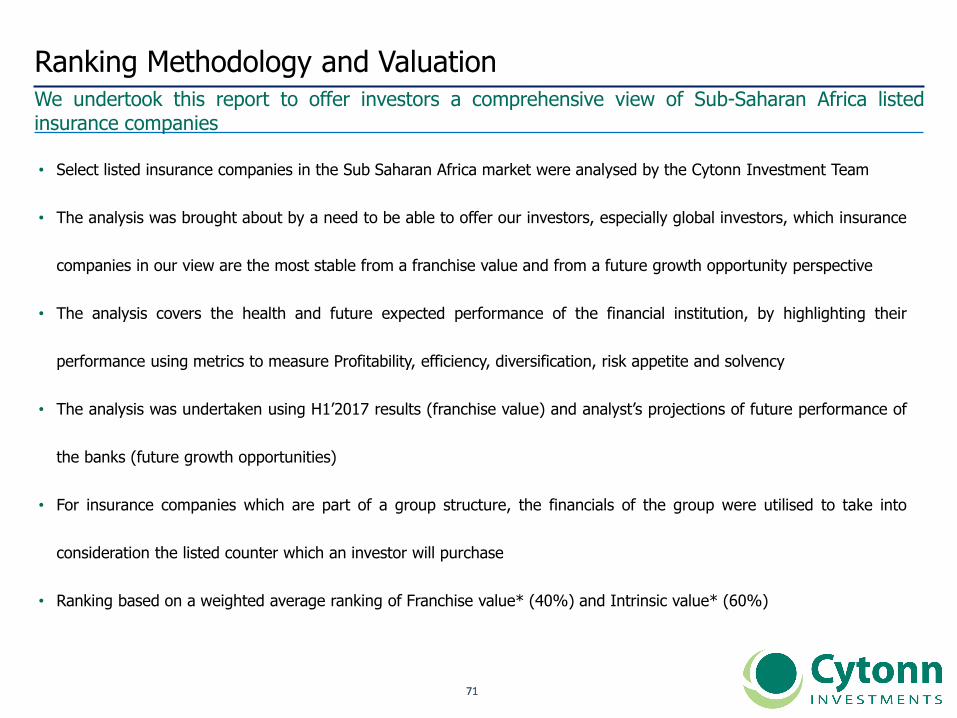
Ranking Methodology and ValuationWe undertook this report to offer investors a comprehensive view of Sub-Saharan Africa listedinsurance companies
20
12
20
13
• Select listed insurance companies in the Sub Saharan Africa market were analysed by the Cytonn Investment Team
• The analysis was brought about by a need to be able to offer our investors, especially global investors, which insurance
companies in our view are the most stable from a franchise value and from a future growth opportunity perspective
• The analysis covers the health and future expected performance of the financial institution, by highlighting their
performance using metrics to measure Profitability, efficiency, diversification, risk appetite and solvency
• The analysis was undertaken using H1’2017 results (franchise value) and analyst’s projections of future performance of
the banks (future growth opportunities)
• For insurance companies which are part of a group structure, the financials of the group were utilised to take into
consideration the listed counter which an investor will purchase
• Ranking based on a weighted average ranking of Franchise value* (40%) and Intrinsic value* (60%)

7272
a. Kenya
7373
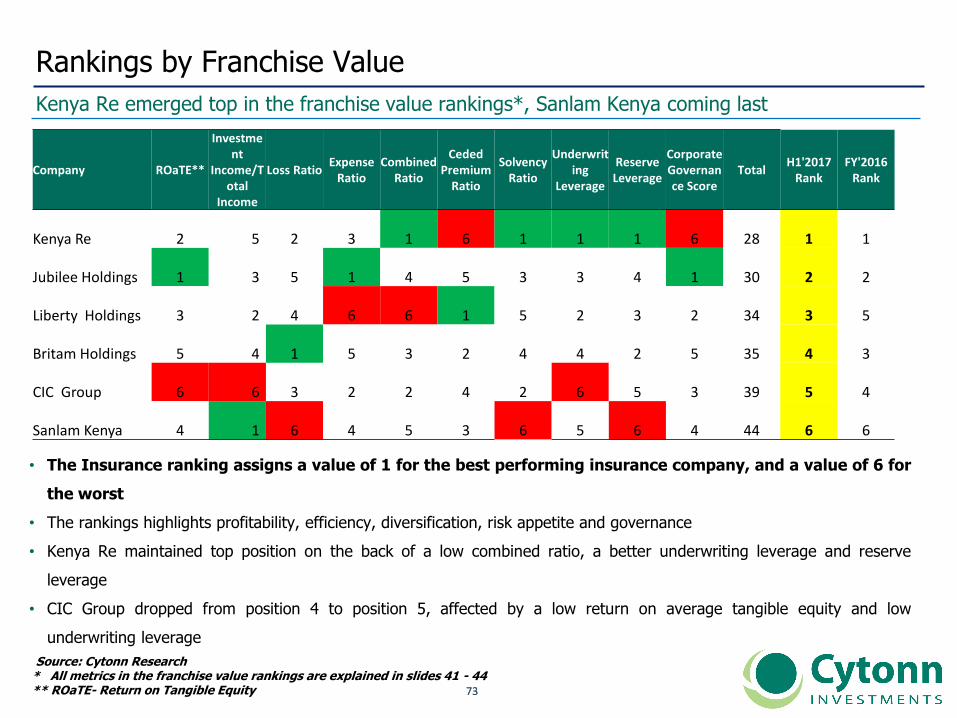
Rankings by Franchise Value
Kenya Re emerged top in the franchise value rankings*, Sanlam Kenya coming last
20
12
20
13
• The Insurance ranking assigns a value of 1 for the best performing insurance company, and a value of 6 for
the worst
• The rankings highlights profitability, efficiency, diversification, risk appetite and governance
• Kenya Re maintained top position on the back of a low combined ratio, a better underwriting leverage and reserve
leverage
• CIC Group dropped from position 4 to position 5, affected by a low return on average tangible equity and low
underwriting leverage
Source: Cytonn Research* All metrics in the franchise value rankings are explained in slides 41 - 44** ROaTE- Return on Tangible Equity
Company ROaTE**
Investment
Income/Total
Income
Loss RatioExpense
RatioCombined
Ratio
Ceded Premium
Ratio
Solvency Ratio
Underwriting
Leverage
Reserve Leverage
Corporate Governance Score
TotalH1'2017
RankFY'2016
Rank
Kenya Re 2 5 2 3 1 6 1 1 1 6 28 1 1
Jubilee Holdings 1 3 5 1 4 5 3 3 4 1 30 2 2
Liberty Holdings 3 2 4 6 6 1 5 2 3 2 34 3 5
Britam Holdings 5 4 1 5 3 2 4 4 2 5 35 4 3
CIC Group 6 6 3 2 2 4 2 6 5 3 39 5 4
Sanlam Kenya 4 1 6 4 5 3 6 5 6 4 44 6 6
7474
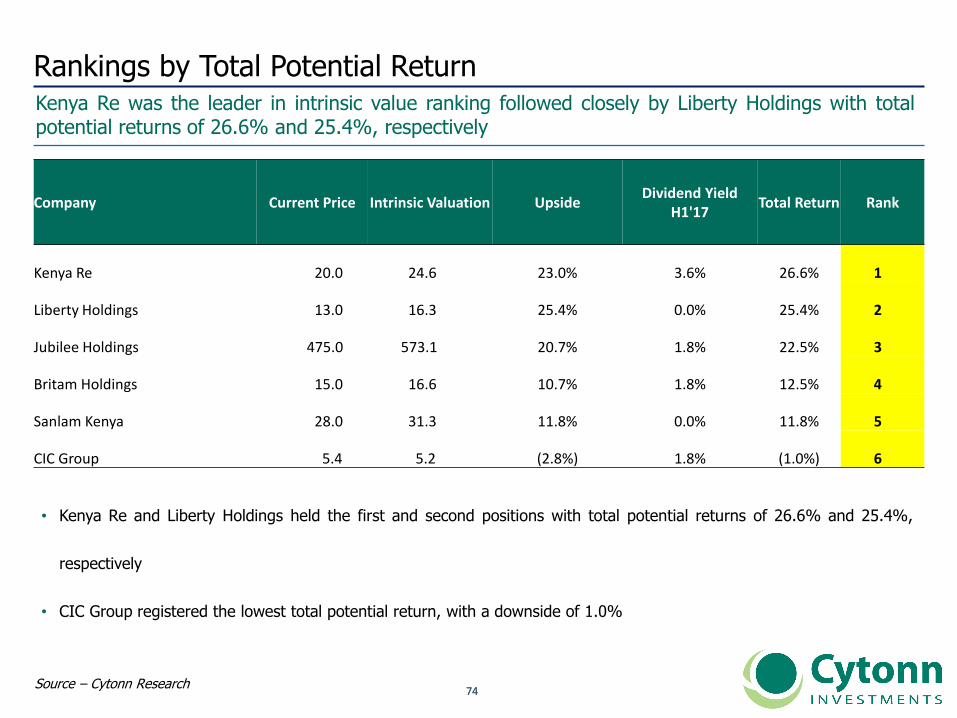
Rankings by Total Potential ReturnKenya Re was the leader in intrinsic value ranking followed closely by Liberty Holdings with totalpotential returns of 26.6% and 25.4%, respectively
• Kenya Re and Liberty Holdings held the first and second positions with total potential returns of 26.6% and 25.4%,
respectively
• CIC Group registered the lowest total potential return, with a downside of 1.0%
Source – Cytonn Research
Company Current Price Intrinsic Valuation UpsideDividend Yield
H1'17Total Return Rank
Kenya Re 20.0 24.6 23.0% 3.6% 26.6% 1
Liberty Holdings 13.0 16.3 25.4% 0.0% 25.4% 2
Jubilee Holdings 475.0 573.1 20.7% 1.8% 22.5% 3
Britam Holdings 15.0 16.6 10.7% 1.8% 12.5% 4
Sanlam Kenya 28.0 31.3 11.8% 0.0% 11.8% 5
CIC Group 5.4 5.2 (2.8%) 1.8% (1.0%) 6
7575
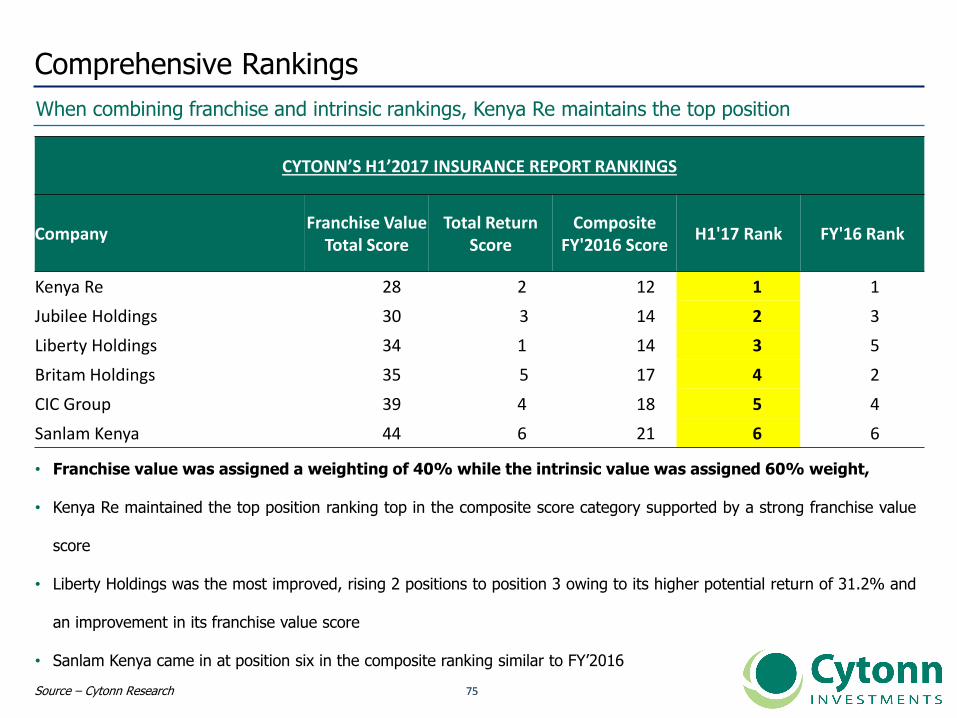
Comprehensive Rankings
When combining franchise and intrinsic rankings, Kenya Re maintains the top position
• Franchise value was assigned a weighting of 40% while the intrinsic value was assigned 60% weight,
• Kenya Re maintained the top position ranking top in the composite score category supported by a strong franchise value
score
• Liberty Holdings was the most improved, rising 2 positions to position 3 owing to its higher potential return of 31.2% and
an improvement in its franchise value score
• Sanlam Kenya came in at position six in the composite ranking similar to FY’2016
Source – Cytonn Research
CYTONN’S H1’2017 INSURANCE REPORT RANKINGS
CompanyFranchise Value
Total ScoreTotal Return
ScoreComposite
FY'2016 ScoreH1'17 Rank FY'16 Rank
Kenya Re 28 2 12 1 1
Jubilee Holdings 30 3 14 2 3
Liberty Holdings 34 1 14 3 5
Britam Holdings 35 5 17 4 2
CIC Group 39 4 18 5 4
Sanlam Kenya 44 6 21 6 6
7676
b. Other SSA Insurance Companies Under Coverage

7777
Rankings by Franchise Value
Botswana Holdings emerged top in the franchise value rankings*, Continental Re coming last
20
12
20
13
• The Insurance ranking assigns a value of 1 for the best performing insurance company, and a value of 7 for
the worst
Source: Cytonn Research* All metrics in the franchise value rankings are explained in slides 41 - 44** ROaTE- Return on Tangible Equity
Company Country ROaTE
Investment
Income/Total
Income
Loss Ratio
Expense Ratio
Combined Ratio
Ceded Premium Ratio
Solvency Ratio
Underwriting
Leverage
Reserve Leverage
TotalH1'2017
Rank
Botswana Holdings Botswana 4 1 1 1 1 7 3 3 1 22 1
Mauritian Eagle Mauritius 6 7 3 3 2 1 2 4 2 30 2
AXA Mansard Nigeria 5 2 4 4 3 2 4 2 4 30 3
Custodial and Allied Nigeria 2 4 6 6 6 3 6 1 3 37 4
Enterprise Group Ghana 1 3 5 2 4 5 5 7 7 39 5
Mauritius Union Mauritius 7 5 6 5 5 4 1 5 6 44 6
Continental Re Nigeria 3 6 1 7 7 6 7 6 5 48 7

7878
Rankings by Total PotentialMauritian Eagle was the leader in intrinsic value ranking followed by Botswana Holdings with totalpotential returns of 52.4% and 37.8%, respectively
• Mauritian Eagle and Botswana Holdings held the first and second positions with total potential returns of 52.4% and
37.8%, respectively
• Enterprise Group registered the lowest total potential return, with a downside of 31.2%
Source – Cytonn Research
Company Country Current PriceIntrinsic
ValuationUpside
Dividend Yield FY'17e
Total ReturnH1'2017
Rank
Mauritian Eagle Mauritius83.30 125.90 51.1% 1.3% 52.4% 1
Botswana Holdings Botswana18.80 22.30 18.6% 19.2% 37.8% 2
Custodial and Allied Nigeria3.60 4.60 27.8% 6.3% 34.1% 3
Mauritius Union Mauritius59.00 59.30 0.5% 3.0% 3.5% 4
AXA Mansard Nigeria2.24 2.22 (0.9%) 1.2% 0.3% 5
Continental Re Nigeria1.43 1.29 (9.8%) 5.8% (4.0%) 6
Enterprise Group Ghana5.30 3.60 (32.1%) 0.9% (31.2%) 7
7979
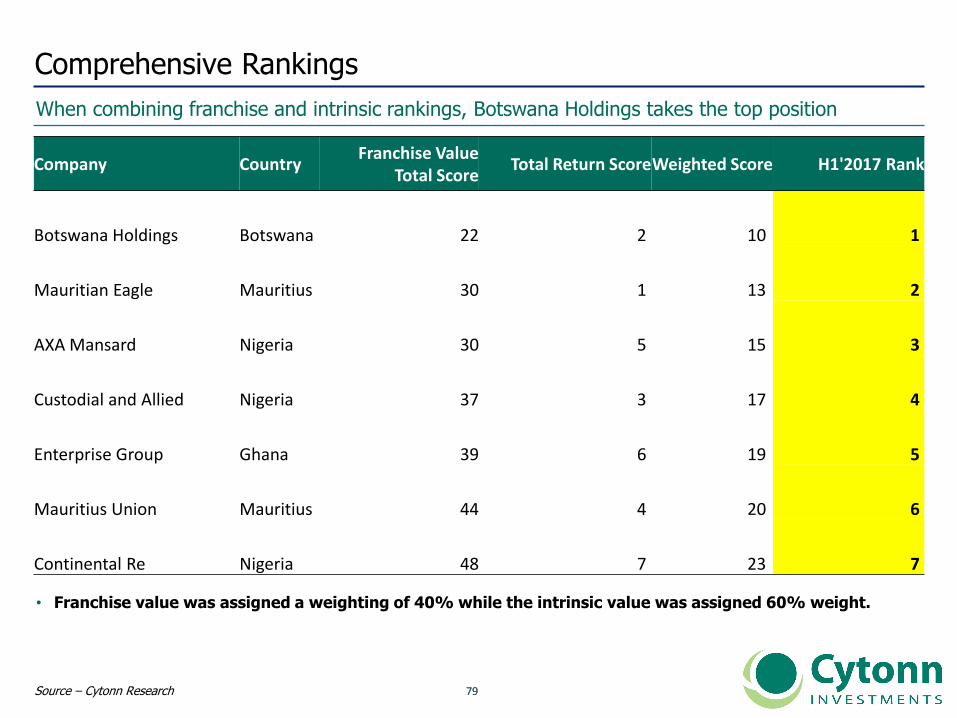
Comprehensive Rankings
When combining franchise and intrinsic rankings, Botswana Holdings takes the top position
• Franchise value was assigned a weighting of 40% while the intrinsic value was assigned 60% weight.
Source – Cytonn Research
Company CountryFranchise Value
Total ScoreTotal Return ScoreWeighted Score H1'2017 Rank
Botswana Holdings Botswana 22 2 10 1
Mauritian Eagle Mauritius 30 1 13 2
AXA Mansard Nigeria 30 5 15 3
Custodial and Allied Nigeria 37 3 17 4
Enterprise Group Ghana 39 6 19 5
Mauritius Union Mauritius 44 4 20 6
Continental Re Nigeria 48 7 23 7

8080
c. SSA Insurance Companies Under Coverage Comprehensive Rankings
8181
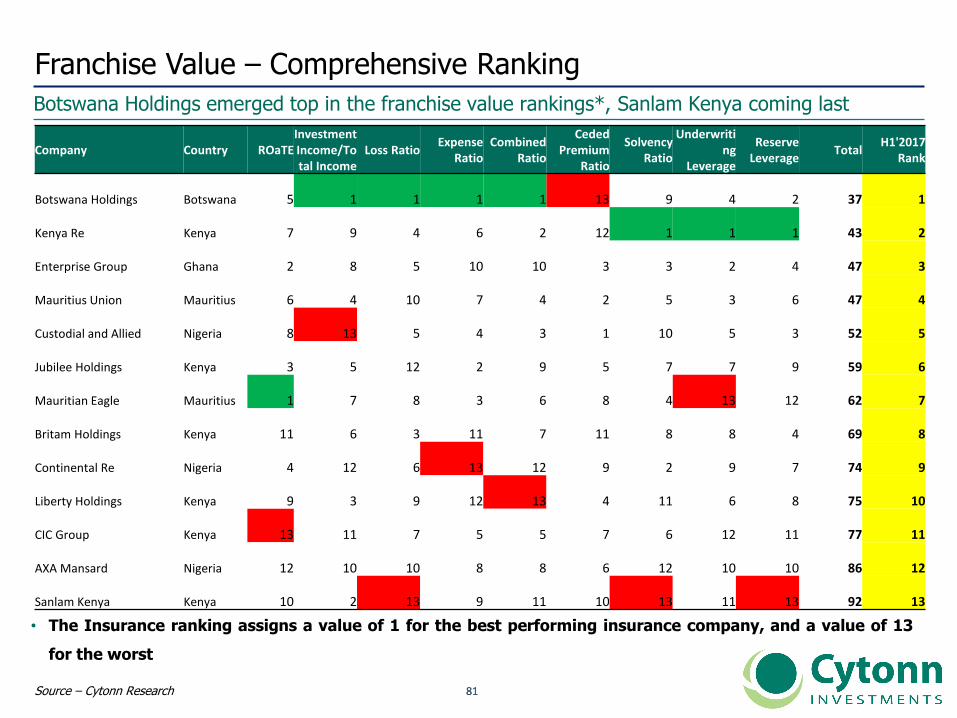
Franchise Value – Comprehensive Ranking
Botswana Holdings emerged top in the franchise value rankings*, Sanlam Kenya coming last
Source – Cytonn Research
• The Insurance ranking assigns a value of 1 for the best performing insurance company, and a value of 13
for the worst
Company Country ROaTEInvestment Income/Total Income
Loss RatioExpense
RatioCombined
Ratio
Ceded Premium
Ratio
Solvency Ratio
Underwriting
Leverage
Reserve Leverage
TotalH1'2017
Rank
Botswana Holdings Botswana 5 1 1 1 1 13 9 4 2 37 1
Kenya Re Kenya 7 9 4 6 2 12 1 1 1 43 2
Enterprise Group Ghana 2 8 5 10 10 3 3 2 4 47 3
Mauritius Union Mauritius 6 4 10 7 4 2 5 3 6 47 4
Custodial and Allied Nigeria 8 13 5 4 3 1 10 5 3 52 5
Jubilee Holdings Kenya 3 5 12 2 9 5 7 7 9 59 6
Mauritian Eagle Mauritius 1 7 8 3 6 8 4 13 12 62 7
Britam Holdings Kenya 11 6 3 11 7 11 8 8 4 69 8
Continental Re Nigeria 4 12 6 13 12 9 2 9 7 74 9
Liberty Holdings Kenya 9 3 9 12 13 4 11 6 8 75 10
CIC Group Kenya 13 11 7 5 5 7 6 12 11 77 11
AXA Mansard Nigeria 12 10 10 8 8 6 12 10 10 86 12
Sanlam Kenya Kenya 10 2 13 9 11 10 13 11 13 92 13
8282
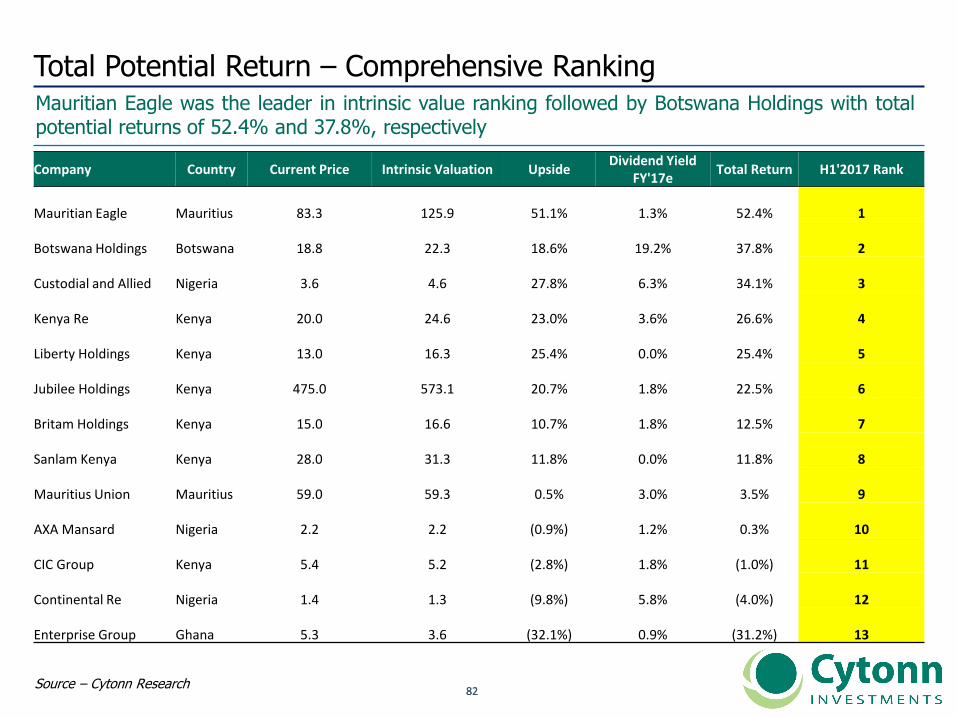
Total Potential Return – Comprehensive RankingMauritian Eagle was the leader in intrinsic value ranking followed by Botswana Holdings with totalpotential returns of 52.4% and 37.8%, respectively
Source – Cytonn Research
Company Country Current Price Intrinsic Valuation UpsideDividend Yield
FY'17eTotal Return H1'2017 Rank
Mauritian Eagle Mauritius 83.3 125.9 51.1% 1.3% 52.4% 1
Botswana Holdings Botswana 18.8 22.3 18.6% 19.2% 37.8% 2
Custodial and Allied Nigeria 3.6 4.6 27.8% 6.3% 34.1% 3
Kenya Re Kenya 20.0 24.6 23.0% 3.6% 26.6% 4
Liberty Holdings Kenya 13.0 16.3 25.4% 0.0% 25.4% 5
Jubilee Holdings Kenya 475.0 573.1 20.7% 1.8% 22.5% 6
Britam Holdings Kenya 15.0 16.6 10.7% 1.8% 12.5% 7
Sanlam Kenya Kenya 28.0 31.3 11.8% 0.0% 11.8% 8
Mauritius Union Mauritius 59.0 59.3 0.5% 3.0% 3.5% 9
AXA Mansard Nigeria 2.2 2.2 (0.9%) 1.2% 0.3% 10
CIC Group Kenya 5.4 5.2 (2.8%) 1.8% (1.0%) 11
Continental Re Nigeria 1.4 1.3 (9.8%) 5.8% (4.0%) 12
Enterprise Group Ghana 5.3 3.6 (32.1%) 0.9% (31.2%) 13
8383
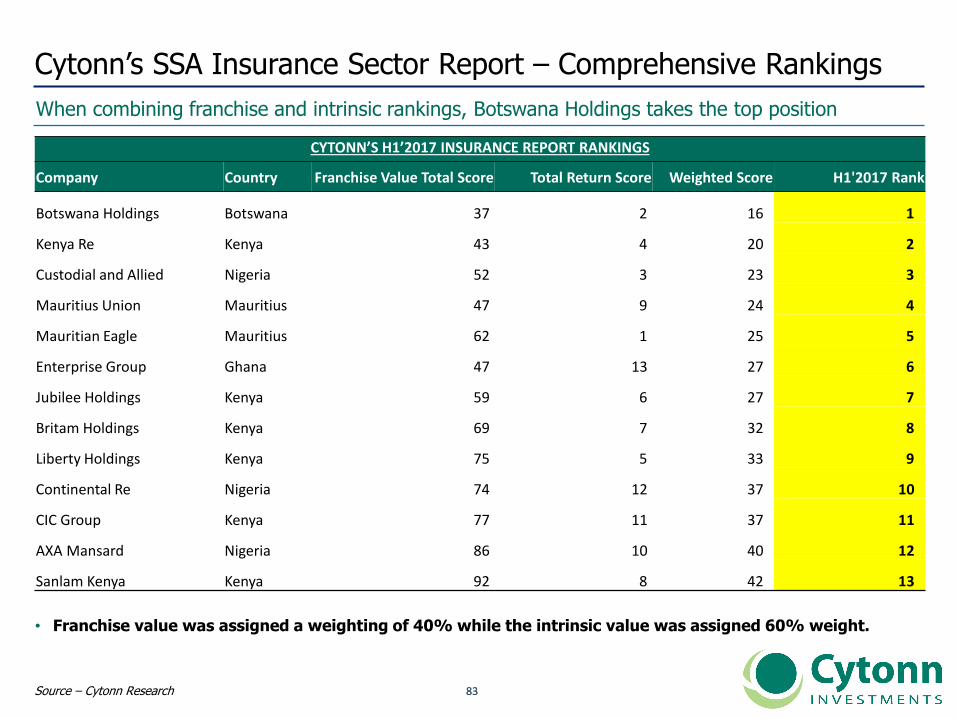
Cytonn’s SSA Insurance Sector Report – Comprehensive Rankings
When combining franchise and intrinsic rankings, Botswana Holdings takes the top position
• Franchise value was assigned a weighting of 40% while the intrinsic value was assigned 60% weight.
Source – Cytonn Research
CYTONN’S H1’2017 INSURANCE REPORT RANKINGS
Company Country Franchise Value Total Score Total Return Score Weighted Score H1'2017 Rank
Botswana Holdings Botswana 37 2 16 1
Kenya Re Kenya 43 4 20 2
Custodial and Allied Nigeria 52 3 23 3
Mauritius Union Mauritius 47 9 24 4
Mauritian Eagle Mauritius 62 1 25 5
Enterprise Group Ghana 47 13 27 6
Jubilee Holdings Kenya 59 6 27 7
Britam Holdings Kenya 69 7 32 8
Liberty Holdings Kenya 75 5 33 9
Continental Re Nigeria 74 12 37 10
CIC Group Kenya 77 11 37 11
AXA Mansard Nigeria 86 10 40 12
Sanlam Kenya Kenya 92 8 42 13
8484
VII. Appendix
8585
A. Metrics Used - Definitions

8686
Banks
8787
Banking Sector Report – Metrics Used
Cytonn has undertaken analysis of the listed banks in Kenya using 13 key metrics
20
12
20
13
1. Net Interest Margin - A bank’s net interest margin (NIM), is the difference between the interest paid on deposits and
the interest earned on loans, relative to the amount of interest-earning assets with higher net interest margins
translating into higher profits
2. Return on Average Common Equity - A bank’s return on average common equity (ROACE), is the amount of profit
the bank earns as a percentage of average common shareholders’ equity. It’s a profitability measure that shows how much a
company generates with the money shareholders have invested
3. Price/Earnings to Growth Ratio - The price/earnings to growth (PEG) ratio is the stock’s market price to earnings
ratio divided by its growth in earnings for a specified period of time. The PEG ratio is used to determine the value of a stock
while taking into account its growth rate, with lower PEG ratios showing the stock is undervalued given the growth in its
earnings
4. Deposits per Branch - A bank’s deposits per branch shows the amount of deposits a bank collects from each of its
branches, hence a measure of efficiency. Banks with higher deposits per branch are preferred, as it shows for each unit cost
of capital expenditure required to open new branches and their subsequent operating costs, a bank receives more in
deposits
8888
Banking Sector Report – Metrics Used, continued…
Cytonn has undertaken analysis of the listed banks in Kenya using 13 key metrics
20
12
20
13
5. Loans to Deposits Ratio - A bank’s loans to deposit ratio (LDR) is a measure of liquidity as it shows how much of a
bank’s loans are being funded by its deposits. Low LDR ratios indicate that the bank may not be earning a lot of interest.
Very high LDR’s indicate that the bank might not have enough liquidity to cover any unforeseen funding requirements, and
ratios above 1 show that the bank supplemented their loan issues with outside borrowing
6. Cost to Income Ratio - The cost to income ratio is a measure of a bank’s efficiency, showing its costs in relation to its
income. A lower ratio is preferred, as it indicates a bank is more profitable. An increase in the ratio often highlights potential
problems as it shows a bank’s costs rose faster than its income; while a fall in the ratio could be brought by management’s
cost cutting measures
7. Price to Tangible Book Value - This is a valuation ratio that expresses the bank’s market price to its tangible book
value. It shows the price an investor would pay for a unit amount in the event of a liquidation. A ratio of less than one
indicates that the bank’s assets are undervalued in the market while a ratio greater than one signifies overvaluation
8. Tangible Common Equity Ratio - This is the ratio of a bank’s common equity less intangible assets to its tangible
assets. It is a common indicator of a bank’s risk and capitalization and measures how much losses a bank can take before
shareholder’s equity is wiped out, hence solvency
8989
Banking Sector Report – Metrics Used, continued…
Cytonn has undertaken analysis of the listed banks in Kenya using 13 key metrics
20
12
20
13
9. Gross non-performing loans ratio - This is a measure of the percentage of a bank’s issued loans that are non-
performing that is, in default, or close to being in default
10. Non-Performing Loans Coverage - This is a credit quality metric that measures the credit risks for banks. It shows
the extent to which the NPLs are covered by provisions hence the degree of stability of the bank’s lending base, with higher
ratios preferred
11. Non-Interest Income to Revenue - The non interest income is the income earned from sources other than loans
and investments. The non-interest income to revenue therefore shows the extent of diversification of a bank’s operations.
High levels are preferred, not exceeding the point where the bank loses focus of its primary business
12. Camel Rating - This is a ranking system that assesses the overall condition of a bank, that is, Capital Adequacy, Asset
Quality, Management Quality, Earnings Quality and Liquidity. We also incorporated a governance score in the ranking
13. Corporate Governance Score –This is a ranking system where we analyse 25 metrics to rank listed companies on
their corporate governance. Main areas of analysis are in the board composition, audit functions, CEO tenor and evaluation,
remuneration and transparency

9090
Insurance
9191
Insurance Sector Report – Metrics Used
Cytonn has undertaken the analysis of listed insurance companies in Kenya using 10 metrics
• Return on Average Tangible Equity – An Insurance Company’s return on average tangible equity (ROaTE), is the amount of
profit the company earns as a percentage of average tangible shareholders’ equity. It’s a profitability measure that shows how much
a company generates with the money shareholders have invested
• Output – Insurance firms with higher ROaTEs are better at utilizing capital to generate profits
• Investment Income/ Total Income Ratio – This ratio indicates the proportion of investment income that makes up total income
generated by the company. It is a measure of revenue diversification that shows how much revenue a company generates away
from its underwriting business
• Output – Insurance firms with higher investment income to total income ratios have more diversified revenue streams, and
are less reliant on their underwriting business
• Loss Ratio – An insurance company’s loss ratio is the ratio of its net claims to the net premiums. It is a measure of the company’s
ability to settle the claims from the premiums generated from policyholders
• Output – A higher loss ratio indicates that the insurance company is using more of its premiums to pay out claims and are
more likely to be less profitable
• Expense Ratio – This is the ratio of a companies operating expenses to its net premiums. It is a measure of efficiency of
management in generating premiums for the business written by the company
• Output – A higher expense ratio indicates that the company is incurring more expenses in mobilizing more premiums, an
indicator of inefficiency of operations
9292
Insurance Sector Report – Metrics Used, continued…
Cytonn has undertaken the analysis of listed insurance companies in Kenya using 10 metrics
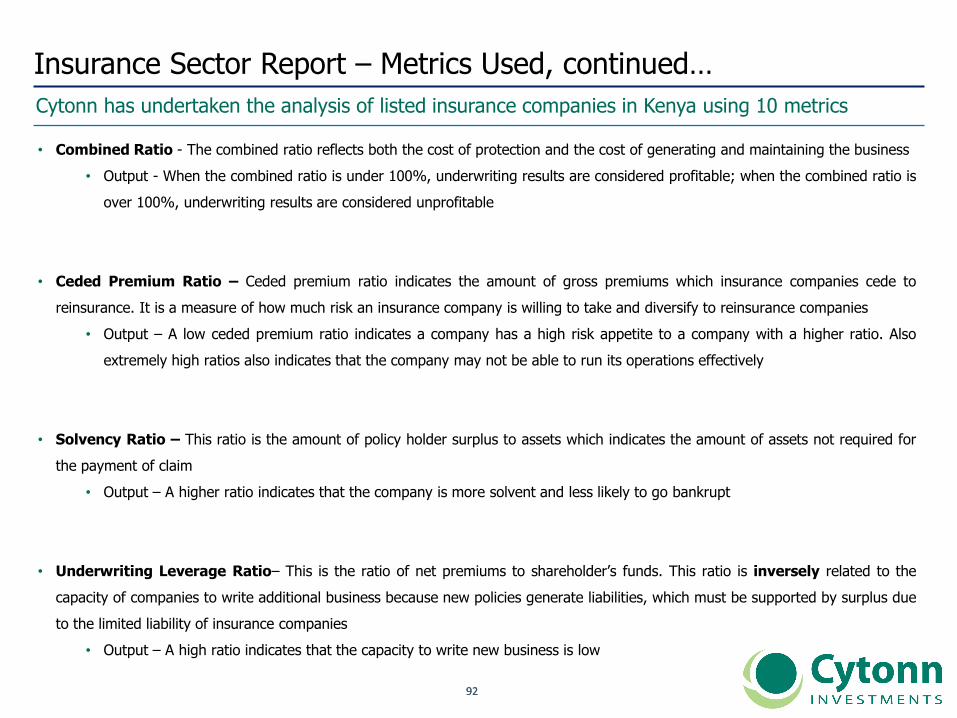
• Combined Ratio - The combined ratio reflects both the cost of protection and the cost of generating and maintaining the business
• Output - When the combined ratio is under 100%, underwriting results are considered profitable; when the combined ratio is
over 100%, underwriting results are considered unprofitable
• Ceded Premium Ratio – Ceded premium ratio indicates the amount of gross premiums which insurance companies cede to
reinsurance. It is a measure of how much risk an insurance company is willing to take and diversify to reinsurance companies
• Output – A low ceded premium ratio indicates a company has a high risk appetite to a company with a higher ratio. Also
extremely high ratios also indicates that the company may not be able to run its operations effectively
• Solvency Ratio – This ratio is the amount of policy holder surplus to assets which indicates the amount of assets not required for
the payment of claim
• Output – A higher ratio indicates that the company is more solvent and less likely to go bankrupt
• Underwriting Leverage Ratio– This is the ratio of net premiums to shareholder’s funds. This ratio is inversely related to the
capacity of companies to write additional business because new policies generate liabilities, which must be supported by surplus due
to the limited liability of insurance companies
• Output – A high ratio indicates that the capacity to write new business is low
9393
Insurance Sector Report – Metrics Used, continued…
20
12
20
13
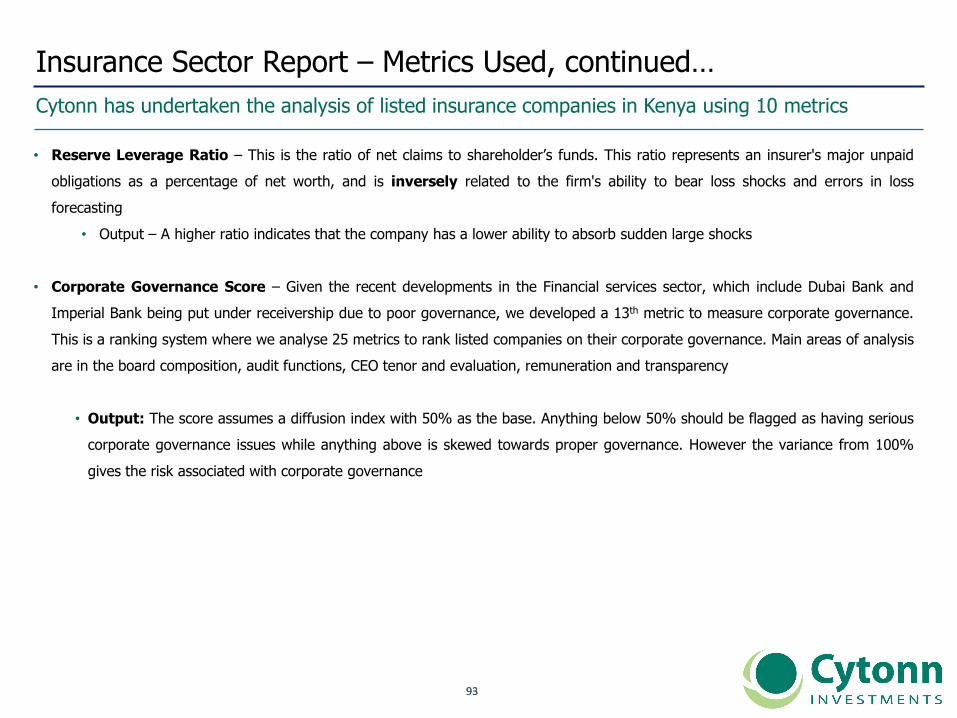
• Reserve Leverage Ratio – This is the ratio of net claims to shareholder’s funds. This ratio represents an insurer's major unpaid
obligations as a percentage of net worth, and is inversely related to the firm's ability to bear loss shocks and errors in loss
forecasting
• Output – A higher ratio indicates that the company has a lower ability to absorb sudden large shocks
• Corporate Governance Score – Given the recent developments in the Financial services sector, which include Dubai Bank and
Imperial Bank being put under receivership due to poor governance, we developed a 13th metric to measure corporate governance.
This is a ranking system where we analyse 25 metrics to rank listed companies on their corporate governance. Main areas of analysis
are in the board composition, audit functions, CEO tenor and evaluation, remuneration and transparency
• Output: The score assumes a diffusion index with 50% as the base. Anything below 50% should be flagged as having serious
corporate governance issues while anything above is skewed towards proper governance. However the variance from 100%
gives the risk associated with corporate governance
Cytonn has undertaken the analysis of listed insurance companies in Kenya using 10 metrics
9494
Insurance Sector Report – Metrics Used, continued…
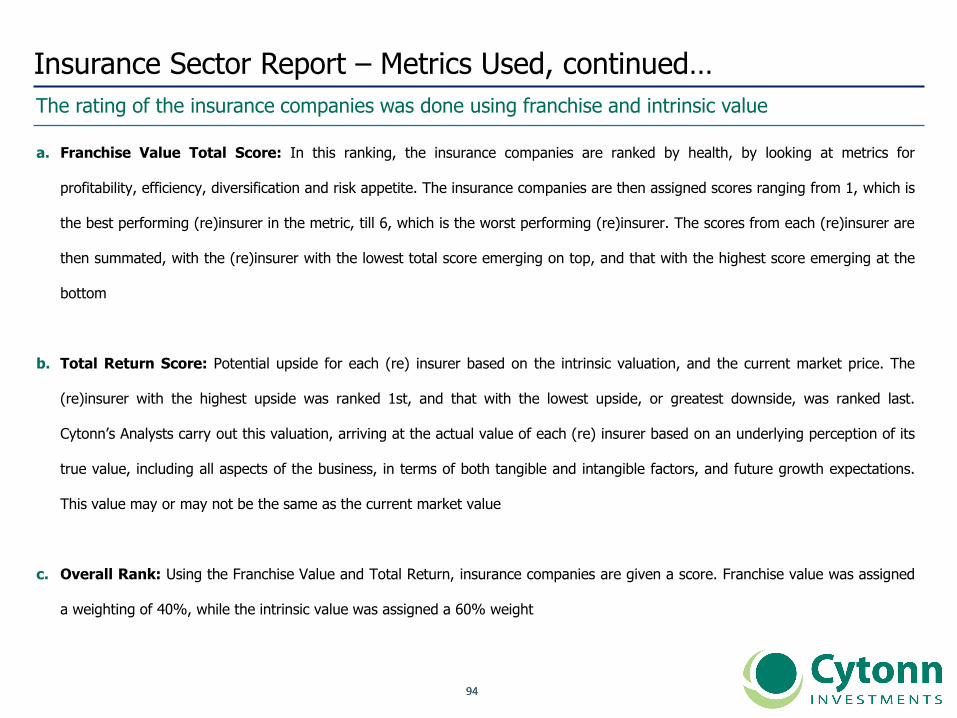
The rating of the insurance companies was done using franchise and intrinsic value
a. Franchise Value Total Score: In this ranking, the insurance companies are ranked by health, by looking at metrics for
profitability, efficiency, diversification and risk appetite. The insurance companies are then assigned scores ranging from 1, which is
the best performing (re)insurer in the metric, till 6, which is the worst performing (re)insurer. The scores from each (re)insurer are
then summated, with the (re)insurer with the lowest total score emerging on top, and that with the highest score emerging at the
bottom
b. Total Return Score: Potential upside for each (re) insurer based on the intrinsic valuation, and the current market price. The
(re)insurer with the highest upside was ranked 1st, and that with the lowest upside, or greatest downside, was ranked last.
Cytonn’s Analysts carry out this valuation, arriving at the actual value of each (re) insurer based on an underlying perception of its
true value, including all aspects of the business, in terms of both tangible and intangible factors, and future growth expectations.
This value may or may not be the same as the current market value
c. Overall Rank: Using the Franchise Value and Total Return, insurance companies are given a score. Franchise value was assigned
a weighting of 40%, while the intrinsic value was assigned a 60% weight

9595
B. Economic Overview

9696
All macro-economic indicators point to a neutral outlook in 2017
Kenya Economic Review
Macro-
Economic
Indicators
2017 Expectations 2017 YTD Experience Going Forward2017
Outlook
GDPGDP growth of
5.4% - 5.7% in
2017
GDP growth for Q2’2017 came in at 5.0%,
compared to 6.3% in Q2’2016, slowed down by a
1.7% decline in growth in agriculture, and financial
intermediation that slowed to a growth of 4.3%
from 8.1% recorded in Q2’2016
GDP growth is expected to stabilize in the remainder
of 2017, from the depressed 4.7% experienced in
Q1’2017, and come in at 4.7% - 5.2%, despite the
depressed rainfall witnessed during the long rains
season between March and May, which has served to
ease the food shortage in the country
Neutral
Interest Rates
A stable outlook
on interest rates
in 2017, with the
CBR maintained at
10.0%
The CBK has maintained the CBR at 10.0%.
Domestic borrowing is expected to pick up in the
coming weeks, with improved liquidity levels in the
market, brought about by heavy maturities of
government securities, and hence we don’t expect
the government to be under pressure to meet its
borrowing targets for the fiscal year 2017/18
The interest rate environment is expected to remain
relatively stable, with the CBK not accepting high
yields on treasury securities and the MPC maintaining
the CBR at 10.0%
Neutral
Inflation
Expected to
average above the
2.5% - 7.5%
government
target
Inflation declined to 5.7% in the month of October from 7.1% in September, on account of a decline in food prices, following improved weather conditions
We expect the inflation rate to stabilize going forward but to average above the 7.5% upper bound
government target in 2017Neutral
Currency
Shilling to
depreciate against
major currencies
The shilling has depreciated by 1.1% against the
dollar YTD, due to speculation in the forex market
and heightened dollar demand from oil and retail
importers
We expect the currency to remain relatively stable
against the dollar due to a weaker USD in the global
markets and It is also important to note that the CBK
has sufficient reserves (USD 7.1 bn - equivalent to 4.7
months of import cover) to support the shilling in the
short term
Neutral
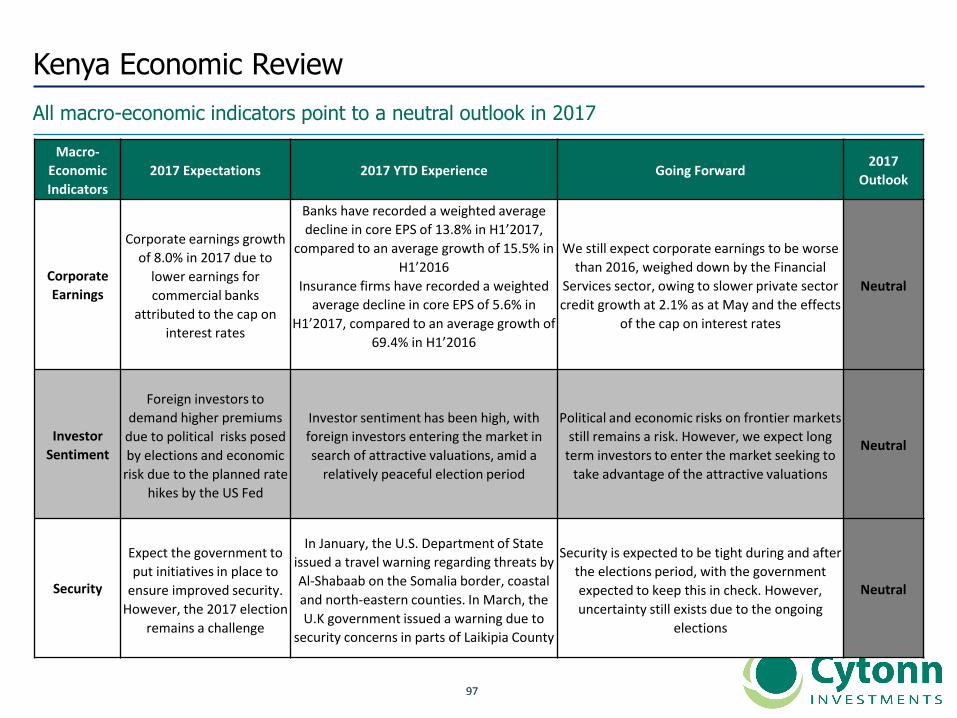
9797
All macro-economic indicators point to a neutral outlook in 2017
Kenya Economic Review
Macro-
Economic
Indicators
2017 Expectations 2017 YTD Experience Going Forward2017
Outlook
Corporate
Earnings
Corporate earnings growth
of 8.0% in 2017 due to
lower earnings for
commercial banks
attributed to the cap on
interest rates
Banks have recorded a weighted average
decline in core EPS of 13.8% in H1’2017,
compared to an average growth of 15.5% in
H1’2016
Insurance firms have recorded a weighted
average decline in core EPS of 5.6% in
H1’2017, compared to an average growth of
69.4% in H1’2016
We still expect corporate earnings to be worse
than 2016, weighed down by the Financial
Services sector, owing to slower private sector
credit growth at 2.1% as at May and the effects
of the cap on interest rates
Neutral
Investor
Sentiment
Foreign investors to
demand higher premiums
due to political risks posed
by elections and economic
risk due to the planned rate
hikes by the US Fed
Investor sentiment has been high, with
foreign investors entering the market in
search of attractive valuations, amid a
relatively peaceful election period
Political and economic risks on frontier markets
still remains a risk. However, we expect long
term investors to enter the market seeking to
take advantage of the attractive valuations
Neutral
Security
Expect the government to
put initiatives in place to
ensure improved security.
However, the 2017 election
remains a challenge
In January, the U.S. Department of State
issued a travel warning regarding threats by
Al-Shabaab on the Somalia border, coastal
and north-eastern counties. In March, the
U.K government issued a warning due to
security concerns in parts of Laikipia County
Security is expected to be tight during and after
the elections period, with the government
expected to keep this in check. However,
uncertainty still exists due to the ongoing
elections
Neutral
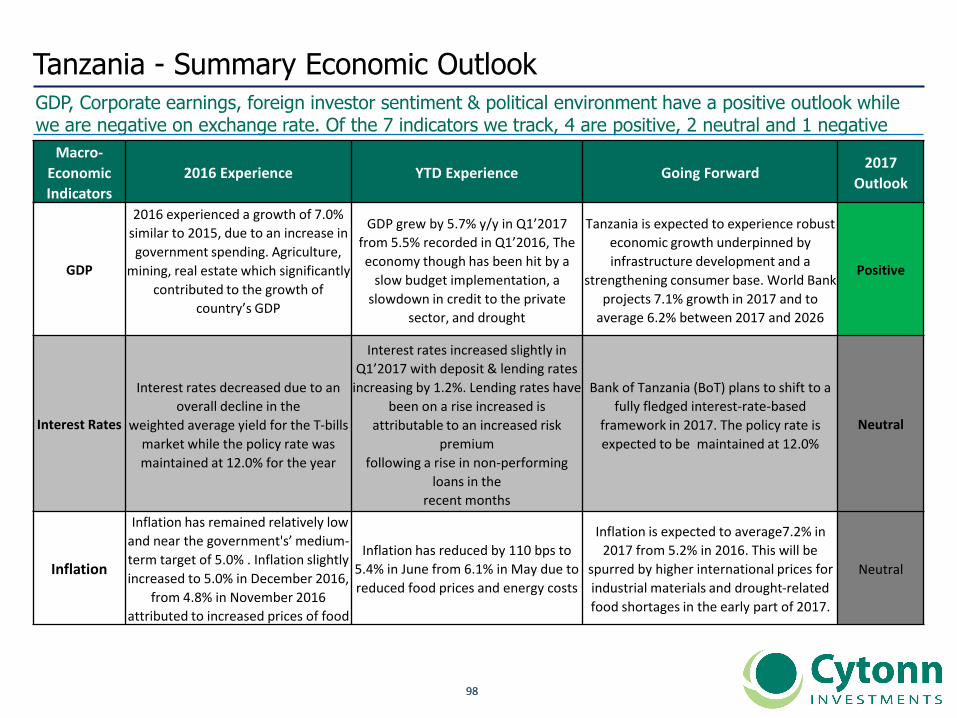
9898
GDP, Corporate earnings, foreign investor sentiment & political environment have a positive outlook while we are negative on exchange rate. Of the 7 indicators we track, 4 are positive, 2 neutral and 1 negative
Tanzania - Summary Economic Outlook
Macro-
Economic
Indicators
2016 Experience YTD Experience Going Forward2017
Outlook
GDP
2016 experienced a growth of 7.0%
similar to 2015, due to an increase in
government spending. Agriculture,
mining, real estate which significantly
contributed to the growth of
country’s GDP
GDP grew by 5.7% y/y in Q1’2017
from 5.5% recorded in Q1’2016, The
economy though has been hit by a
slow budget implementation, a
slowdown in credit to the private
sector, and drought
Tanzania is expected to experience robust
economic growth underpinned by
infrastructure development and a
strengthening consumer base. World Bank
projects 7.1% growth in 2017 and to
average 6.2% between 2017 and 2026
Positive
Interest Rates
Interest rates decreased due to an
overall decline in the
weighted average yield for the T-bills
market while the policy rate was
maintained at 12.0% for the year
Interest rates increased slightly in
Q1’2017 with deposit & lending rates
increasing by 1.2%. Lending rates have
been on a rise increased is
attributable to an increased risk
premium
following a rise in non-performing
loans in the
recent months
Bank of Tanzania (BoT) plans to shift to a
fully fledged interest-rate-based
framework in 2017. The policy rate is
expected to be maintained at 12.0%
Neutral
Inflation
Inflation has remained relatively low
and near the government's’ medium-
term target of 5.0% . Inflation slightly
increased to 5.0% in December 2016,
from 4.8% in November 2016
attributed to increased prices of food
Inflation has reduced by 110 bps to
5.4% in June from 6.1% in May due to
reduced food prices and energy costs
Inflation is expected to average7.2% in
2017 from 5.2% in 2016. This will be
spurred by higher international prices for
industrial materials and drought-related
food shortages in the early part of 2017.
Neutral
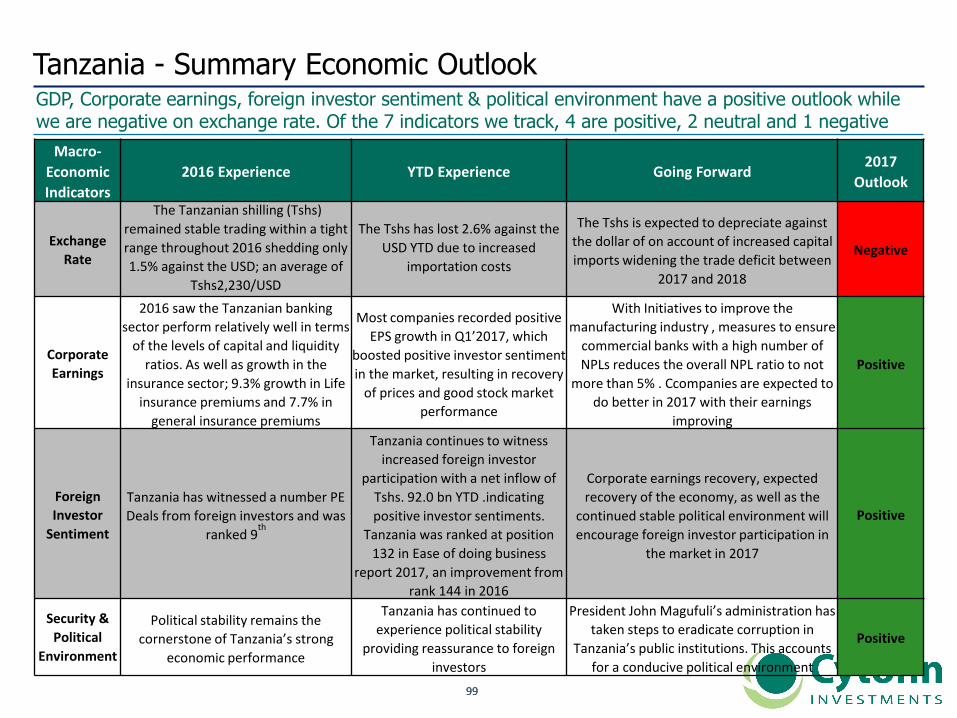
9999
GDP, Corporate earnings, foreign investor sentiment & political environment have a positive outlook while we are negative on exchange rate. Of the 7 indicators we track, 4 are positive, 2 neutral and 1 negative
Tanzania - Summary Economic Outlook
Macro-
Economic
Indicators
2016 Experience YTD Experience Going Forward2017
Outlook
Exchange
Rate
The Tanzanian shilling (Tshs)
remained stable trading within a tight
range throughout 2016 shedding only
1.5% against the USD; an average of
Tshs2,230/USD
The Tshs has lost 2.6% against the
USD YTD due to increased
importation costs
The Tshs is expected to depreciate against
the dollar of on account of increased capital
imports widening the trade deficit between
2017 and 2018
Negative
Corporate
Earnings
2016 saw the Tanzanian banking
sector perform relatively well in terms
of the levels of capital and liquidity
ratios. As well as growth in the
insurance sector; 9.3% growth in Life
insurance premiums and 7.7% in
general insurance premiums
Most companies recorded positive
EPS growth in Q1’2017, which
boosted positive investor sentiment
in the market, resulting in recovery
of prices and good stock market
performance
With Initiatives to improve the
manufacturing industry , measures to ensure
commercial banks with a high number of
NPLs reduces the overall NPL ratio to not
more than 5% . Ccompanies are expected to
do better in 2017 with their earnings
improving
Positive
Foreign
Investor
Sentiment
Tanzania has witnessed a number PE
Deals from foreign investors and was
ranked 9th
Tanzania continues to witness
increased foreign investor
participation with a net inflow of
Tshs. 92.0 bn YTD .indicating
positive investor sentiments.
Tanzania was ranked at position
132 in Ease of doing business
report 2017, an improvement from
rank 144 in 2016
Corporate earnings recovery, expected
recovery of the economy, as well as the
continued stable political environment will
encourage foreign investor participation in
the market in 2017
Positive
Security &
Political
Environment
Political stability remains the
cornerstone of Tanzania’s strong
economic performance
Tanzania has continued to
experience political stability
providing reassurance to foreign
investors
President John Magufuli’s administration has
taken steps to eradicate corruption in
Tanzania’s public institutions. This accounts
for a conducive political environment
Positive
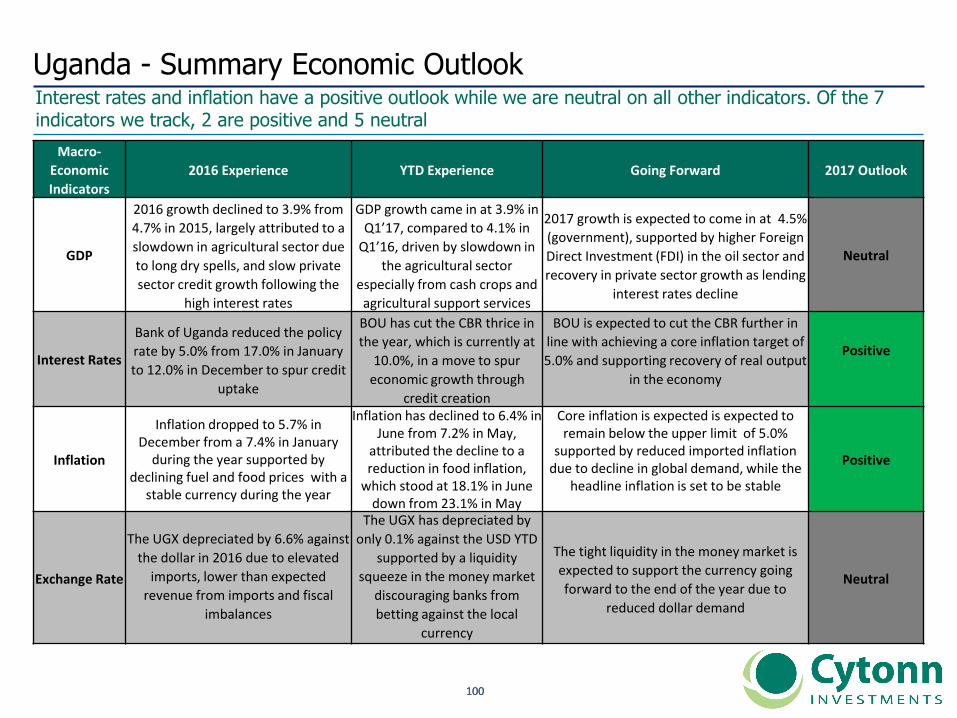
100100
Interest rates and inflation have a positive outlook while we are neutral on all other indicators. Of the 7 indicators we track, 2 are positive and 5 neutral
Uganda - Summary Economic Outlook
Macro-
Economic
Indicators
2016 Experience YTD Experience Going Forward 2017 Outlook
GDP
2016 growth declined to 3.9% from
4.7% in 2015, largely attributed to a
slowdown in agricultural sector due
to long dry spells, and slow private
sector credit growth following the
high interest rates
GDP growth came in at 3.9% in
Q1’17, compared to 4.1% in
Q1’16, driven by slowdown in
the agricultural sector
especially from cash crops and
agricultural support services
2017 growth is expected to come in at 4.5%
(government), supported by higher Foreign
Direct Investment (FDI) in the oil sector and
recovery in private sector growth as lending
interest rates decline
Neutral
Interest Rates
Bank of Uganda reduced the policy
rate by 5.0% from 17.0% in January
to 12.0% in December to spur credit
uptake
BOU has cut the CBR thrice in
the year, which is currently at
10.0%, in a move to spur
economic growth through
credit creation
BOU is expected to cut the CBR further in
line with achieving a core inflation target of
5.0% and supporting recovery of real output
in the economy
Positive
Inflation
Inflation dropped to 5.7% in December from a 7.4% in January
during the year supported by declining fuel and food prices with a
stable currency during the year
Inflation has declined to 6.4% in June from 7.2% in May,
attributed the decline to a reduction in food inflation,
which stood at 18.1% in June down from 23.1% in May
Core inflation is expected is expected to remain below the upper limit of 5.0%
supported by reduced imported inflation due to decline in global demand, while the
headline inflation is set to be stable
Positive
Exchange Rate
The UGX depreciated by 6.6% against
the dollar in 2016 due to elevated
imports, lower than expected
revenue from imports and fiscal
imbalances
The UGX has depreciated by
only 0.1% against the USD YTD
supported by a liquidity
squeeze in the money market
discouraging banks from
betting against the local
currency
The tight liquidity in the money market is
expected to support the currency going
forward to the end of the year due to
reduced dollar demand
Neutral
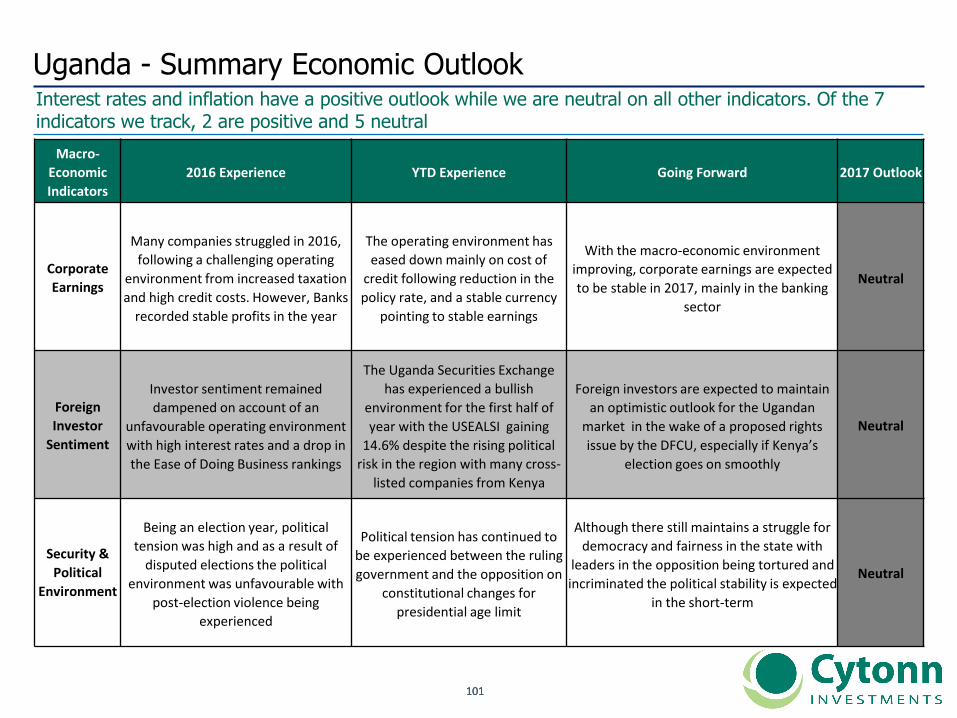
101101
Interest rates and inflation have a positive outlook while we are neutral on all other indicators. Of the 7 indicators we track, 2 are positive and 5 neutral
Uganda - Summary Economic Outlook
Macro-
Economic
Indicators
2016 Experience YTD Experience Going Forward 2017 Outlook
Corporate
Earnings
Many companies struggled in 2016,
following a challenging operating
environment from increased taxation
and high credit costs. However, Banks
recorded stable profits in the year
The operating environment has
eased down mainly on cost of
credit following reduction in the
policy rate, and a stable currency
pointing to stable earnings
With the macro-economic environment
improving, corporate earnings are expected
to be stable in 2017, mainly in the banking
sector
Neutral
Foreign
Investor
Sentiment
Investor sentiment remained
dampened on account of an
unfavourable operating environment
with high interest rates and a drop in
the Ease of Doing Business rankings
The Uganda Securities Exchange
has experienced a bullish
environment for the first half of
year with the USEALSI gaining
14.6% despite the rising political
risk in the region with many cross-
listed companies from Kenya
Foreign investors are expected to maintain
an optimistic outlook for the Ugandan
market in the wake of a proposed rights
issue by the DFCU, especially if Kenya’s
election goes on smoothly
Neutral
Security &
Political
Environment
Being an election year, political
tension was high and as a result of
disputed elections the political
environment was unfavourable with
post-election violence being
experienced
Political tension has continued to
be experienced between the ruling
government and the opposition on
constitutional changes for
presidential age limit
Although there still maintains a struggle for
democracy and fairness in the state with
leaders in the opposition being tortured and
incriminated the political stability is expected
in the short-term
Neutral
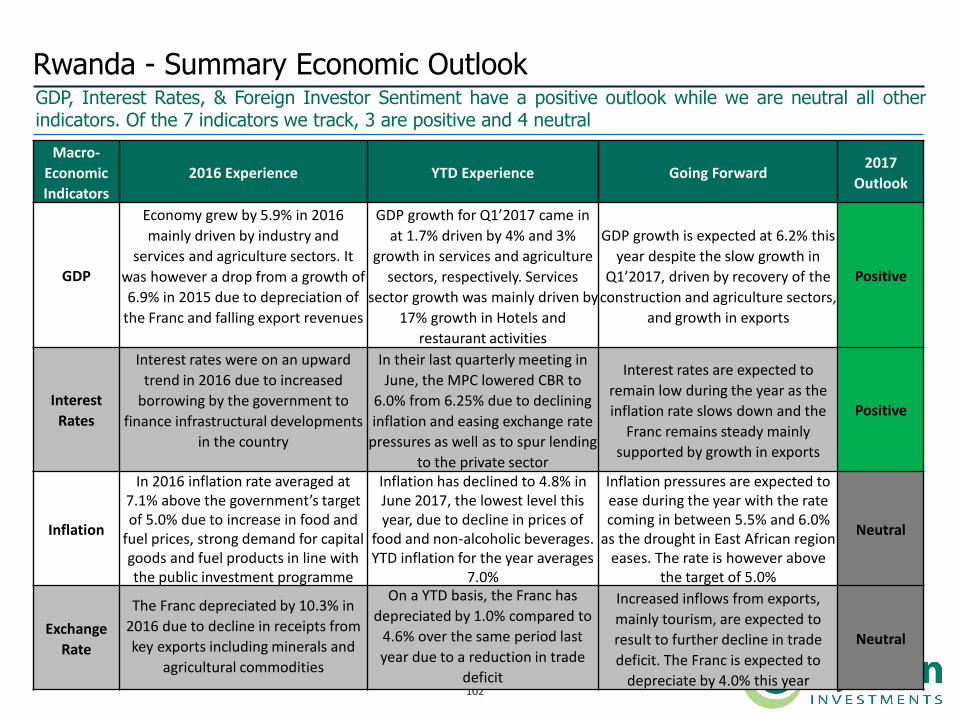
102102
GDP, Interest Rates, & Foreign Investor Sentiment have a positive outlook while we are neutral all otherindicators. Of the 7 indicators we track, 3 are positive and 4 neutral
Rwanda - Summary Economic Outlook
Macro-
Economic
Indicators
2016 Experience YTD Experience Going Forward2017
Outlook
GDP
Economy grew by 5.9% in 2016
mainly driven by industry and
services and agriculture sectors. It
was however a drop from a growth of
6.9% in 2015 due to depreciation of
the Franc and falling export revenues
GDP growth for Q1’2017 came in
at 1.7% driven by 4% and 3%
growth in services and agriculture
sectors, respectively. Services
sector growth was mainly driven by
17% growth in Hotels and
restaurant activities
GDP growth is expected at 6.2% this
year despite the slow growth in
Q1’2017, driven by recovery of the
construction and agriculture sectors,
and growth in exports
Positive
Interest
Rates
Interest rates were on an upward
trend in 2016 due to increased
borrowing by the government to
finance infrastructural developments
in the country
In their last quarterly meeting in
June, the MPC lowered CBR to
6.0% from 6.25% due to declining
inflation and easing exchange rate
pressures as well as to spur lending
to the private sector
Interest rates are expected to
remain low during the year as the
inflation rate slows down and the
Franc remains steady mainly
supported by growth in exports
Positive
Inflation
In 2016 inflation rate averaged at 7.1% above the government’s target of 5.0% due to increase in food and
fuel prices, strong demand for capital goods and fuel products in line with the public investment programme
Inflation has declined to 4.8% in June 2017, the lowest level this year, due to decline in prices of
food and non-alcoholic beverages. YTD inflation for the year averages
7.0%
Inflation pressures are expected to ease during the year with the rate coming in between 5.5% and 6.0%
as the drought in East African region eases. The rate is however above
the target of 5.0%
Neutral
Exchange
Rate
The Franc depreciated by 10.3% in
2016 due to decline in receipts from
key exports including minerals and
agricultural commodities
On a YTD basis, the Franc has
depreciated by 1.0% compared to
4.6% over the same period last
year due to a reduction in trade
deficit
Increased inflows from exports,
mainly tourism, are expected to
result to further decline in trade
deficit. The Franc is expected to
depreciate by 4.0% this year
Neutral
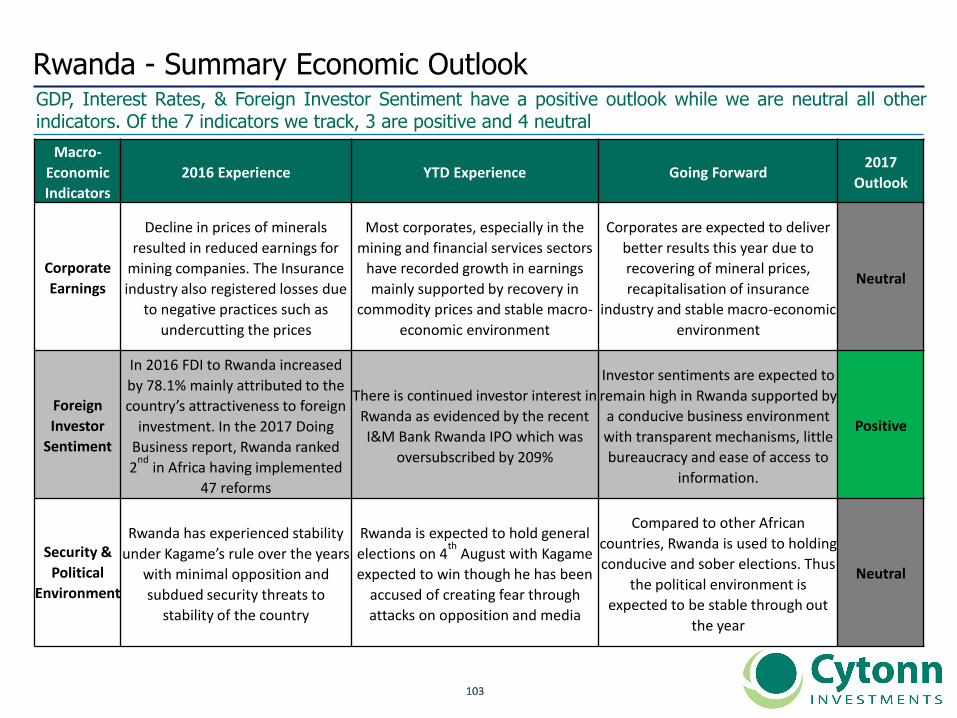
103103
GDP, Interest Rates, & Foreign Investor Sentiment have a positive outlook while we are neutral all otherindicators. Of the 7 indicators we track, 3 are positive and 4 neutral
Rwanda - Summary Economic Outlook
Macro-
Economic
Indicators
2016 Experience YTD Experience Going Forward2017
Outlook
Corporate
Earnings
Decline in prices of minerals
resulted in reduced earnings for
mining companies. The Insurance
industry also registered losses due
to negative practices such as
undercutting the prices
Most corporates, especially in the
mining and financial services sectors
have recorded growth in earnings
mainly supported by recovery in
commodity prices and stable macro-
economic environment
Corporates are expected to deliver
better results this year due to
recovering of mineral prices,
recapitalisation of insurance
industry and stable macro-economic
environment
Neutral
Foreign
Investor
Sentiment
In 2016 FDI to Rwanda increased
by 78.1% mainly attributed to the
country’s attractiveness to foreign
investment. In the 2017 Doing
Business report, Rwanda ranked
2nd
in Africa having implemented
47 reforms
There is continued investor interest in
Rwanda as evidenced by the recent
I&M Bank Rwanda IPO which was
oversubscribed by 209%
Investor sentiments are expected to
remain high in Rwanda supported by
a conducive business environment
with transparent mechanisms, little
bureaucracy and ease of access to
information.
Positive
Security &
Political
Environment
Rwanda has experienced stability
under Kagame’s rule over the years
with minimal opposition and
subdued security threats to
stability of the country
Rwanda is expected to hold general
elections on 4th
August with Kagame
expected to win though he has been
accused of creating fear through
attacks on opposition and media
Compared to other African
countries, Rwanda is used to holding
conducive and sober elections. Thus
the political environment is
expected to be stable through out
the year
Neutral
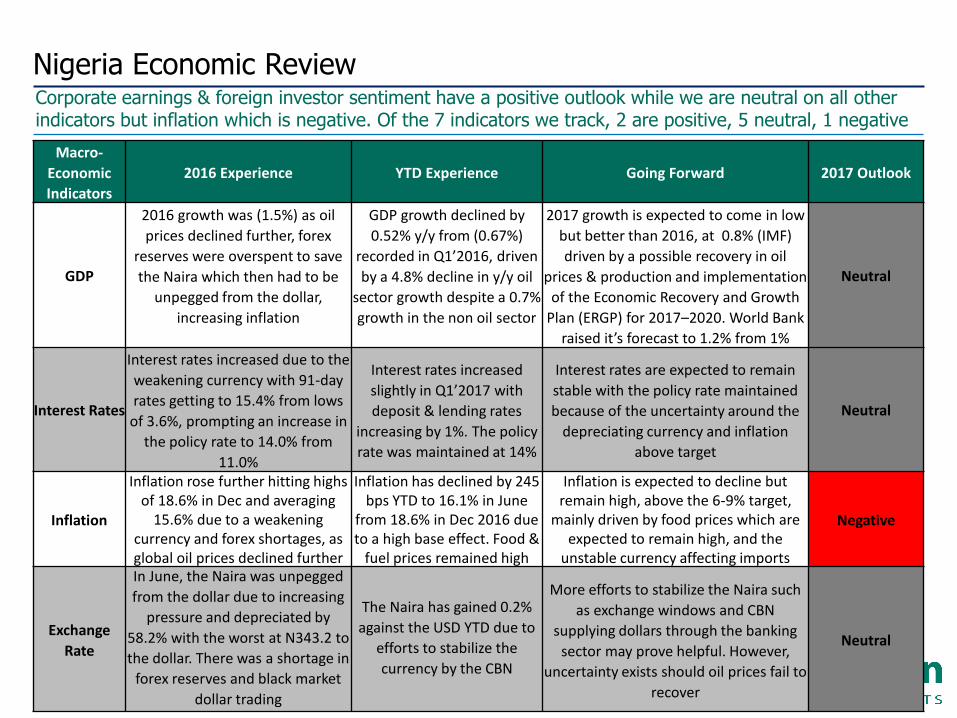
104104
Corporate earnings & foreign investor sentiment have a positive outlook while we are neutral on all other indicators but inflation which is negative. Of the 7 indicators we track, 2 are positive, 5 neutral, 1 negative
Nigeria Economic Review
Macro-
Economic
Indicators
2016 Experience YTD Experience Going Forward 2017 Outlook
GDP
2016 growth was (1.5%) as oil
prices declined further, forex
reserves were overspent to save
the Naira which then had to be
unpegged from the dollar,
increasing inflation
GDP growth declined by
0.52% y/y from (0.67%)
recorded in Q1’2016, driven
by a 4.8% decline in y/y oil
sector growth despite a 0.7%
growth in the non oil sector
2017 growth is expected to come in low
but better than 2016, at 0.8% (IMF)
driven by a possible recovery in oil
prices & production and implementation
of the Economic Recovery and Growth
Plan (ERGP) for 2017–2020. World Bank
raised it’s forecast to 1.2% from 1%
Neutral
Interest Rates
Interest rates increased due to the
weakening currency with 91-day
rates getting to 15.4% from lows
of 3.6%, prompting an increase in
the policy rate to 14.0% from
11.0%
Interest rates increased
slightly in Q1’2017 with
deposit & lending rates
increasing by 1%. The policy
rate was maintained at 14%
Interest rates are expected to remain
stable with the policy rate maintained
because of the uncertainty around the
depreciating currency and inflation
above target
Neutral
Inflation
Inflation rose further hitting highs of 18.6% in Dec and averaging
15.6% due to a weakening currency and forex shortages, as global oil prices declined further
Inflation has declined by 245 bps YTD to 16.1% in June
from 18.6% in Dec 2016 due to a high base effect. Food &
fuel prices remained high
Inflation is expected to decline but remain high, above the 6-9% target,
mainly driven by food prices which are expected to remain high, and the
unstable currency affecting imports
Negative
Exchange
Rate
In June, the Naira was unpegged
from the dollar due to increasing
pressure and depreciated by
58.2% with the worst at N343.2 to
the dollar. There was a shortage in
forex reserves and black market
dollar trading
The Naira has gained 0.2%
against the USD YTD due to
efforts to stabilize the
currency by the CBN
More efforts to stabilize the Naira such
as exchange windows and CBN
supplying dollars through the banking
sector may prove helpful. However,
uncertainty exists should oil prices fail to
recover
Neutral

105105
Corporate earnings & foreign investor sentiment have a positive outlook while we are neutral on all other indicators but inflation which is negative. Of the 7 indicators we track, 2 are positive, 5 neutral, 1 negative
Nigeria Economic Review
Macro-
Economic
Indicators
2016 Experience YTD Experience Going Forward2017
Outlook
Corporate
Earnings
Many companies struggled with
some putting production on hold
due to forex difficulties when
importing material. The sectors
that suffered most were oil and
gas, manufacturing and in turn
financial services
Most companies recorded
positive EPS growth in Q1’2017,
which boosted positive investor
sentiment in the market,
resulting in recovery of prices
and the stock market recovering
With recovery of global oil prices,
government effort on Niger Delta
security, inflation declining and forex
being made available by CBN, companies
are expected to do better in 2017 with
their earnings improving
Positive
Foreign
Investor
Sentiment
Foreign investor sentiment
declined as the year ended with a
15.0% q/q decline in foreign
investment and a 0.5% y/y decline
in the face of falling oil prices and
plummeting reserves
Average YTD foreign investor
participation has increased to
46.0% from 40.4% and there
was a net foreign outflow of
28.6 bn Naira, compared to 31.8
bn Naira, in a similar period last
year
Corporate earnings recovery, expected
recovery of the economy, and steps by
the CBN to stabilize the shilling will
continue to encourage foreign investor
participation in the market in 2017
Positive
Security &
Political
Environment
The ruling party has had internal
squabbles in passing legislation
while suicide attacks increased
despite a decline in Niger delta
attacks in Q4’2016
Nigeria has remained politically
stable since Buhari’s return to
power.
Security threats from Boko
Haram and Niger Delta terror
groups still persist
Niger delta attacks and Boko Haram still
pose a threat.
The political scene is relatively stable
after peaceful elections and Buhari’s war
against corruption and indiscipline
Neutral
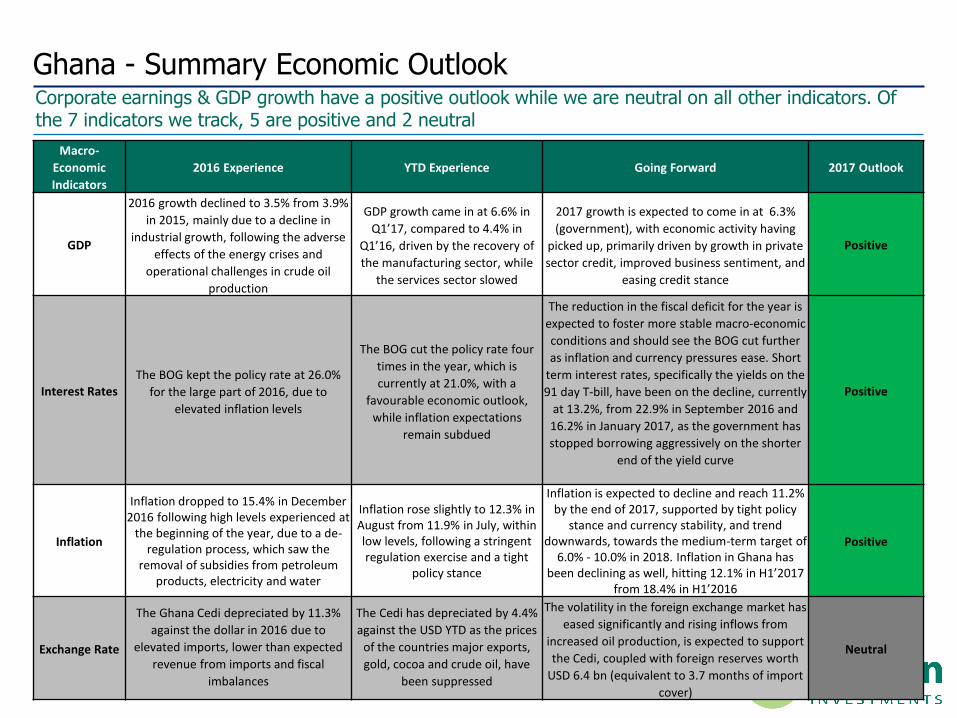
106106
Corporate earnings & GDP growth have a positive outlook while we are neutral on all other indicators. Of the 7 indicators we track, 5 are positive and 2 neutral
Ghana - Summary Economic Outlook
Macro-
Economic
Indicators
2016 Experience YTD Experience Going Forward 2017 Outlook
GDP
2016 growth declined to 3.5% from 3.9%
in 2015, mainly due to a decline in
industrial growth, following the adverse
effects of the energy crises and
operational challenges in crude oil
production
GDP growth came in at 6.6% in
Q1’17, compared to 4.4% in
Q1’16, driven by the recovery of
the manufacturing sector, while
the services sector slowed
2017 growth is expected to come in at 6.3%
(government), with economic activity having
picked up, primarily driven by growth in private
sector credit, improved business sentiment, and
easing credit stance
Positive
Interest Rates
The BOG kept the policy rate at 26.0%
for the large part of 2016, due to
elevated inflation levels
The BOG cut the policy rate four
times in the year, which is
currently at 21.0%, with a
favourable economic outlook,
while inflation expectations
remain subdued
The reduction in the fiscal deficit for the year is
expected to foster more stable macro-economic
conditions and should see the BOG cut further
as inflation and currency pressures ease. Short
term interest rates, specifically the yields on the
91 day T-bill, have been on the decline, currently
at 13.2%, from 22.9% in September 2016 and
16.2% in January 2017, as the government has
stopped borrowing aggressively on the shorter
end of the yield curve
Positive
Inflation
Inflation dropped to 15.4% in December 2016 following high levels experienced at
the beginning of the year, due to a de-regulation process, which saw the
removal of subsidies from petroleum products, electricity and water
Inflation rose slightly to 12.3% in August from 11.9% in July, within low levels, following a stringent regulation exercise and a tight
policy stance
Inflation is expected to decline and reach 11.2% by the end of 2017, supported by tight policy
stance and currency stability, and trend downwards, towards the medium-term target of
6.0% - 10.0% in 2018. Inflation in Ghana has been declining as well, hitting 12.1% in H1’2017
from 18.4% in H1’2016
Positive
Exchange Rate
The Ghana Cedi depreciated by 11.3%
against the dollar in 2016 due to
elevated imports, lower than expected
revenue from imports and fiscal
imbalances
The Cedi has depreciated by 4.4%
against the USD YTD as the prices
of the countries major exports,
gold, cocoa and crude oil, have
been suppressed
The volatility in the foreign exchange market has
eased significantly and rising inflows from
increased oil production, is expected to support
the Cedi, coupled with foreign reserves worth
USD 6.4 bn (equivalent to 3.7 months of import
cover)
Neutral
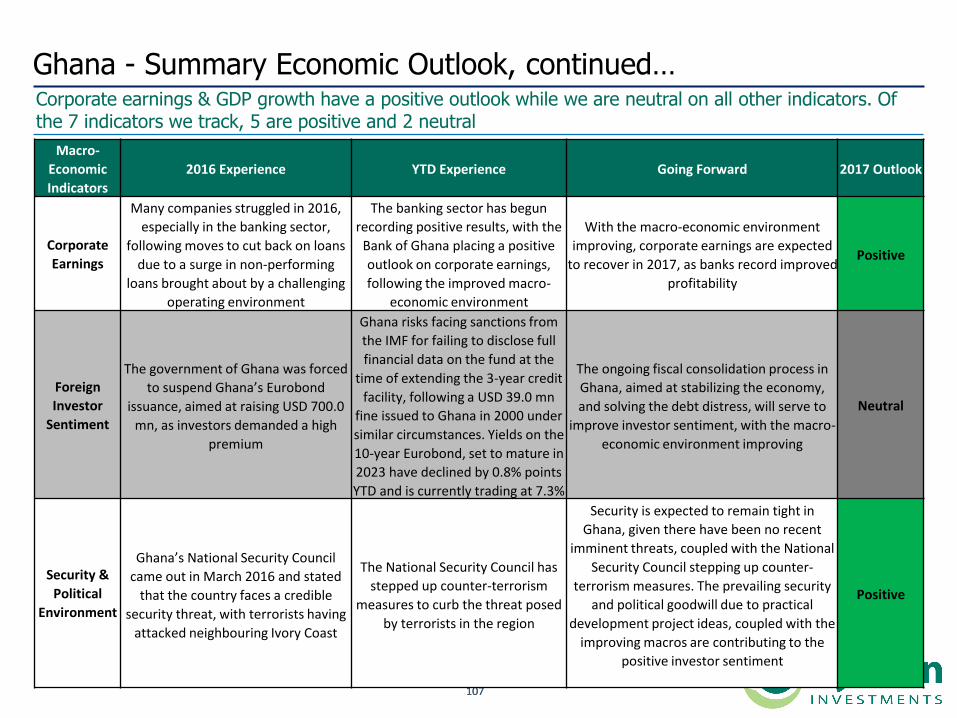
107107
Corporate earnings & GDP growth have a positive outlook while we are neutral on all other indicators. Of the 7 indicators we track, 5 are positive and 2 neutral
Ghana - Summary Economic Outlook, continued…
Macro-
Economic
Indicators
2016 Experience YTD Experience Going Forward 2017 Outlook
Corporate
Earnings
Many companies struggled in 2016,
especially in the banking sector,
following moves to cut back on loans
due to a surge in non-performing
loans brought about by a challenging
operating environment
The banking sector has begun
recording positive results, with the
Bank of Ghana placing a positive
outlook on corporate earnings,
following the improved macro-
economic environment
With the macro-economic environment
improving, corporate earnings are expected
to recover in 2017, as banks record improved
profitability
Positive
Foreign
Investor
Sentiment
The government of Ghana was forced
to suspend Ghana’s Eurobond
issuance, aimed at raising USD 700.0
mn, as investors demanded a high
premium
Ghana risks facing sanctions from
the IMF for failing to disclose full
financial data on the fund at the
time of extending the 3-year credit
facility, following a USD 39.0 mn
fine issued to Ghana in 2000 under
similar circumstances. Yields on the
10-year Eurobond, set to mature in
2023 have declined by 0.8% points
YTD and is currently trading at 7.3%
The ongoing fiscal consolidation process in
Ghana, aimed at stabilizing the economy,
and solving the debt distress, will serve to
improve investor sentiment, with the macro-
economic environment improving
Neutral
Security &
Political
Environment
Ghana’s National Security Council
came out in March 2016 and stated
that the country faces a credible
security threat, with terrorists having
attacked neighbouring Ivory Coast
The National Security Council has
stepped up counter-terrorism
measures to curb the threat posed
by terrorists in the region
Security is expected to remain tight in
Ghana, given there have been no recent
imminent threats, coupled with the National
Security Council stepping up counter-
terrorism measures. The prevailing security
and political goodwill due to practical
development project ideas, coupled with the
improving macros are contributing to the
positive investor sentiment
Positive
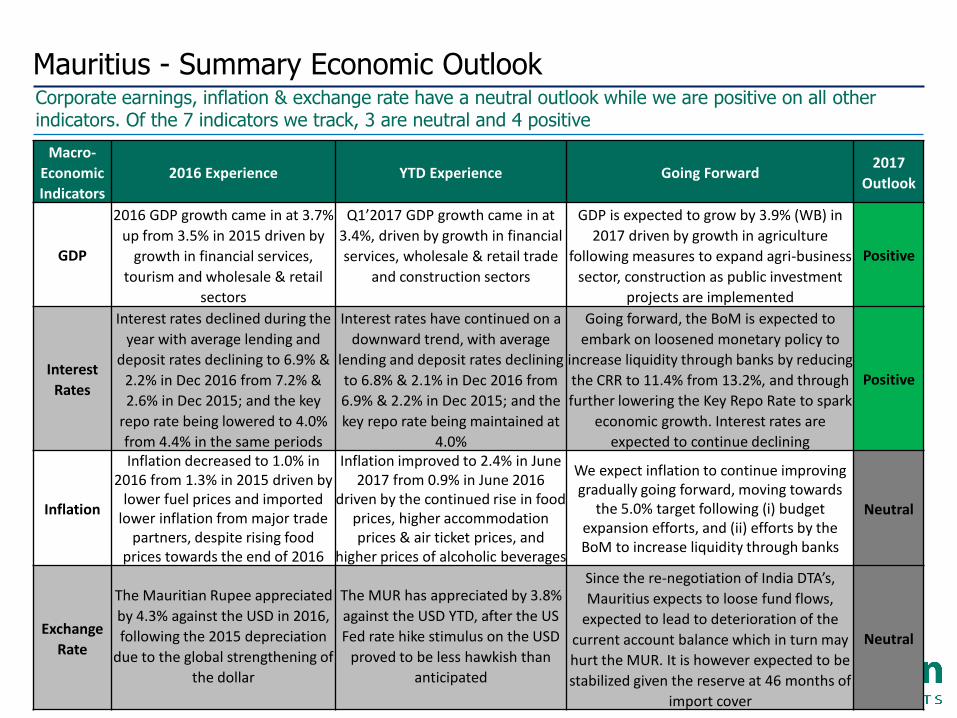
108108
Corporate earnings, inflation & exchange rate have a neutral outlook while we are positive on all other indicators. Of the 7 indicators we track, 3 are neutral and 4 positive
Mauritius - Summary Economic Outlook
Macro-
Economic
Indicators
2016 Experience YTD Experience Going Forward2017
Outlook
GDP
2016 GDP growth came in at 3.7%
up from 3.5% in 2015 driven by
growth in financial services,
tourism and wholesale & retail
sectors
Q1’2017 GDP growth came in at
3.4%, driven by growth in financial
services, wholesale & retail trade
and construction sectors
GDP is expected to grow by 3.9% (WB) in
2017 driven by growth in agriculture
following measures to expand agri-business
sector, construction as public investment
projects are implemented
Positive
Interest
Rates
Interest rates declined during the
year with average lending and
deposit rates declining to 6.9% &
2.2% in Dec 2016 from 7.2% &
2.6% in Dec 2015; and the key
repo rate being lowered to 4.0%
from 4.4% in the same periods
Interest rates have continued on a
downward trend, with average
lending and deposit rates declining
to 6.8% & 2.1% in Dec 2016 from
6.9% & 2.2% in Dec 2015; and the
key repo rate being maintained at
4.0%
Going forward, the BoM is expected to
embark on loosened monetary policy to
increase liquidity through banks by reducing
the CRR to 11.4% from 13.2%, and through
further lowering the Key Repo Rate to spark
economic growth. Interest rates are
expected to continue declining
Positive
Inflation
Inflation decreased to 1.0% in 2016 from 1.3% in 2015 driven by
lower fuel prices and imported lower inflation from major trade
partners, despite rising food prices towards the end of 2016
Inflation improved to 2.4% in June 2017 from 0.9% in June 2016
driven by the continued rise in foodprices, higher accommodation prices & air ticket prices, and
higher prices of alcoholic beverages
We expect inflation to continue improving gradually going forward, moving towards
the 5.0% target following (i) budget expansion efforts, and (ii) efforts by the BoM to increase liquidity through banks
Neutral
Exchange
Rate
The Mauritian Rupee appreciated
by 4.3% against the USD in 2016,
following the 2015 depreciation
due to the global strengthening of
the dollar
The MUR has appreciated by 3.8%
against the USD YTD, after the US
Fed rate hike stimulus on the USD
proved to be less hawkish than
anticipated
Since the re-negotiation of India DTA’s,
Mauritius expects to loose fund flows,
expected to lead to deterioration of the
current account balance which in turn may
hurt the MUR. It is however expected to be
stabilized given the reserve at 46 months of
import cover
Neutral

109109
Corporate earnings, inflation & exchange rate have a neutral outlook while we are positive on all other indicators. Of the 7 indicators we track, 3 are neutral and 4 positive
Mauritius - Summary Economic Outlook
Macro-
Economic
Indicators
2016 Experience YTD Experience Going Forward2017
Outlook
Corporate
Earnings
Mauritius's financial system was
robust and demonstrated its resilience
after the collapse of the BAI group in
2015. Capitalisation was satisfactory,
but the ratio of non-performing loans,
although still quite low, rose to 8% in
2016 compared to 5% in 2015
Most countries
recorded positive EPS
growth with the
banking sector
maintaining positive
growth
The financial sector which is the largest
contributor to corporate earnings is expected to
remain stable, though threatened by a rising NPL
ratio (8% in 2016 compared with 5% in 2015)
and changes to the double taxation agreement
with India
Neutral
Foreign
Investor
Sentiment
FDI in Mauritius grew by 69% y/y in
H1’2016 driven by investments in real
estate, financial services and
manufacturing, mainly from South
Africa and China. Foreign investor
participation in the SEM increased to
43% from 32.3% in 2015
The 2017 World Bank
Ease of Doing Business
Index ranked Mauritius
1st
in Africa and 49th
out
of 190 countries
globally
Foreign investor sentiment is expected to remain
strong as Mauritius continues to attract foreign
direct investment from emerging economies, as
well as courting more traditional markets like
the UK, France and the U.S, engaging more
countries in DTA’s and serving as a gateway for
investment into Africa
Positive
Security &
Political
Environment
Mauritius has maintained it’s political
stability and security since
independence, with the ruling
coalition securing majority
parliamentary seats, and ranked 33
out of 141 countries globally in safety
& security
Security and political
stability were
maintained with no
notable threats to
national security
reported
We expect Mauritius to maintain national
security and political stability going forward as
they have since independence in 1968
Positive
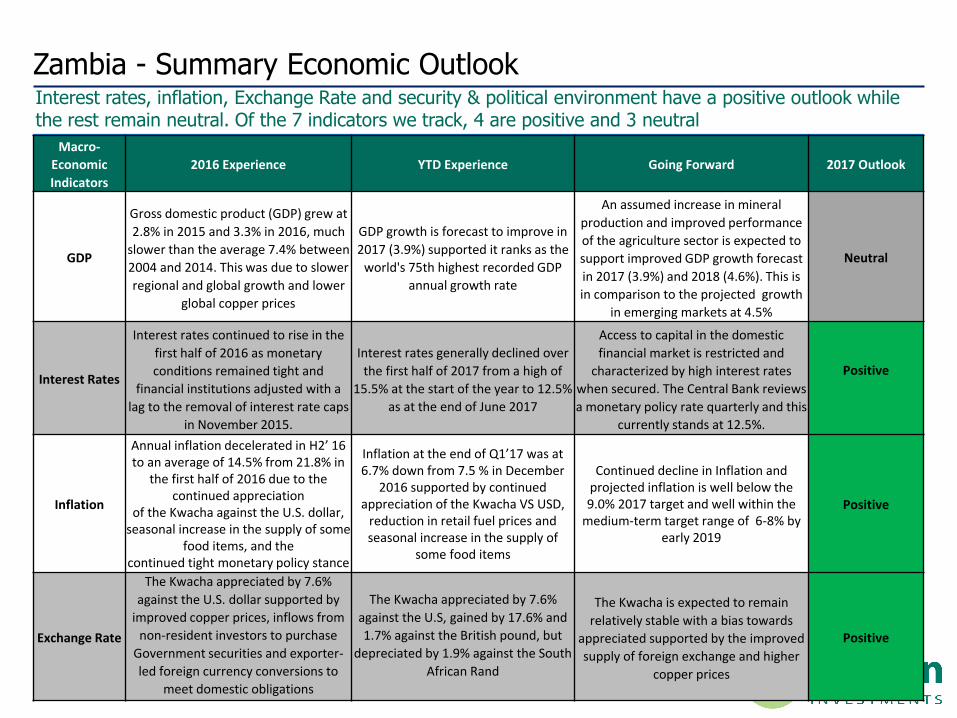
110110
Interest rates, inflation, Exchange Rate and security & political environment have a positive outlook while the rest remain neutral. Of the 7 indicators we track, 4 are positive and 3 neutral
Zambia - Summary Economic Outlook
Macro-
Economic
Indicators
2016 Experience YTD Experience Going Forward 2017 Outlook
GDP
Gross domestic product (GDP) grew at
2.8% in 2015 and 3.3% in 2016, much
slower than the average 7.4% between
2004 and 2014. This was due to slower
regional and global growth and lower
global copper prices
GDP growth is forecast to improve in
2017 (3.9%) supported it ranks as the
world's 75th highest recorded GDP
annual growth rate
An assumed increase in mineral
production and improved performance
of the agriculture sector is expected to
support improved GDP growth forecast
in 2017 (3.9%) and 2018 (4.6%). This is
in comparison to the projected growth
in emerging markets at 4.5%
Neutral
Interest Rates
Interest rates continued to rise in the
first half of 2016 as monetary
conditions remained tight and
financial institutions adjusted with a
lag to the removal of interest rate caps
in November 2015.
Interest rates generally declined over
the first half of 2017 from a high of
15.5% at the start of the year to 12.5%
as at the end of June 2017
Access to capital in the domestic
financial market is restricted and
characterized by high interest rates
when secured. The Central Bank reviews
a monetary policy rate quarterly and this
currently stands at 12.5%.
Positive
Inflation
Annual inflation decelerated in H2’ 16 to an average of 14.5% from 21.8% in
the first half of 2016 due to the continued appreciation
of the Kwacha against the U.S. dollar, seasonal increase in the supply of some
food items, and thecontinued tight monetary policy stance
Inflation at the end of Q1’17 was at 6.7% down from 7.5 % in December
2016 supported by continued appreciation of the Kwacha VS USD,
reduction in retail fuel prices and seasonal increase in the supply of
some food items
Continued decline in Inflation and projected inflation is well below the9.0% 2017 target and well within the
medium-term target range of 6-8% by early 2019
Positive
Exchange Rate
The Kwacha appreciated by 7.6%
against the U.S. dollar supported by
improved copper prices, inflows from
non-resident investors to purchase
Government securities and exporter-
led foreign currency conversions to
meet domestic obligations
The Kwacha appreciated by 7.6%
against the U.S, gained by 17.6% and
1.7% against the British pound, but
depreciated by 1.9% against the South
African Rand
The Kwacha is expected to remain
relatively stable with a bias towards
appreciated supported by the improved
supply of foreign exchange and higher
copper prices
Positive
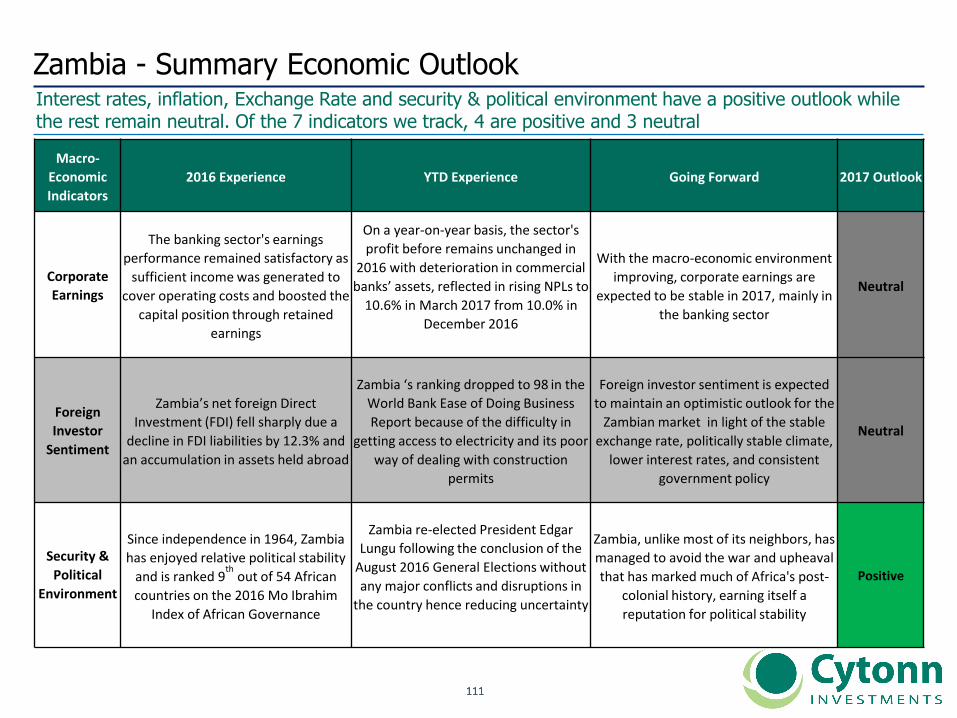
111111
Interest rates, inflation, Exchange Rate and security & political environment have a positive outlook while the rest remain neutral. Of the 7 indicators we track, 4 are positive and 3 neutral
Zambia - Summary Economic Outlook
Macro-
Economic
Indicators
2016 Experience YTD Experience Going Forward 2017 Outlook
Corporate
Earnings
The banking sector's earnings
performance remained satisfactory as
sufficient income was generated to
cover operating costs and boosted the
capital position through retained
earnings
On a year-on-year basis, the sector's
profit before remains unchanged in
2016 with deterioration in commercial
banks’ assets, reflected in rising NPLs to
10.6% in March 2017 from 10.0% in
December 2016
With the macro-economic environment
improving, corporate earnings are
expected to be stable in 2017, mainly in
the banking sector
Neutral
Foreign
Investor
Sentiment
Zambia’s net foreign Direct
Investment (FDI) fell sharply due a
decline in FDI liabilities by 12.3% and
an accumulation in assets held abroad
Zambia ‘s ranking dropped to 98 in the
World Bank Ease of Doing Business
Report because of the difficulty in
getting access to electricity and its poor
way of dealing with construction
permits
Foreign investor sentiment is expected
to maintain an optimistic outlook for the
Zambian market in light of the stable
exchange rate, politically stable climate,
lower interest rates, and consistent
government policy
Neutral
Security &
Political
Environment
Since independence in 1964, Zambia
has enjoyed relative political stability
and is ranked 9th
out of 54 African
countries on the 2016 Mo Ibrahim
Index of African Governance
Zambia re-elected President Edgar
Lungu following the conclusion of the
August 2016 General Elections without
any major conflicts and disruptions in
the country hence reducing uncertainty
Zambia, unlike most of its neighbors, has
managed to avoid the war and upheaval
that has marked much of Africa's post-
colonial history, earning itself a
reputation for political stability
Positive
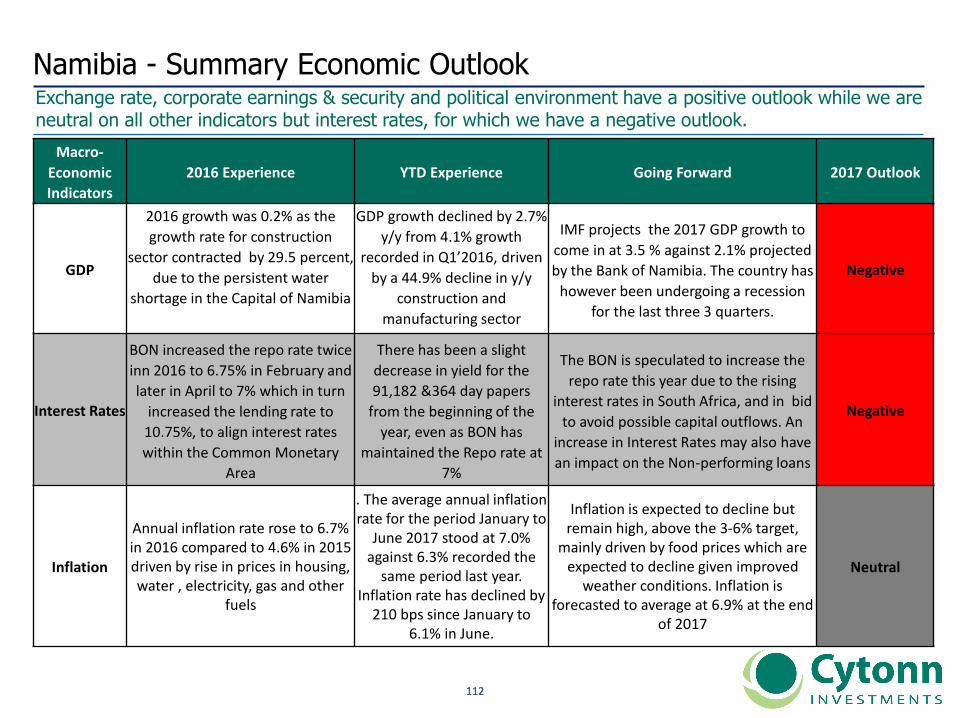
112112
Exchange rate, corporate earnings & security and political environment have a positive outlook while we are neutral on all other indicators but interest rates, for which we have a negative outlook.
Namibia - Summary Economic Outlook
Macro-
Economic
Indicators
2016 Experience YTD Experience Going Forward 2017 Outlook
GDP
2016 growth was 0.2% as the
growth rate for construction
sector contracted by 29.5 percent,
due to the persistent water
shortage in the Capital of Namibia
GDP growth declined by 2.7%
y/y from 4.1% growth
recorded in Q1’2016, driven
by a 44.9% decline in y/y
construction and
manufacturing sector
IMF projects the 2017 GDP growth to
come in at 3.5 % against 2.1% projected
by the Bank of Namibia. The country has
however been undergoing a recession
for the last three 3 quarters.
Negative
Interest Rates
BON increased the repo rate twice
inn 2016 to 6.75% in February and
later in April to 7% which in turn
increased the lending rate to
10.75%, to align interest rates
within the Common Monetary
Area
There has been a slight
decrease in yield for the
91,182 &364 day papers
from the beginning of the
year, even as BON has
maintained the Repo rate at
7%
The BON is speculated to increase the
repo rate this year due to the rising
interest rates in South Africa, and in bid
to avoid possible capital outflows. An
increase in Interest Rates may also have
an impact on the Non-performing loans
Negative
Inflation
Annual inflation rate rose to 6.7% in 2016 compared to 4.6% in 2015 driven by rise in prices in housing, water , electricity, gas and other
fuels
. The average annual inflation rate for the period January to
June 2017 stood at 7.0% against 6.3% recorded the
same period last year. Inflation rate has declined by
210 bps since January to 6.1% in June.
Inflation is expected to decline but remain high, above the 3-6% target,
mainly driven by food prices which are expected to decline given improved
weather conditions. Inflation is forecasted to average at 6.9% at the end
of 2017
Neutral
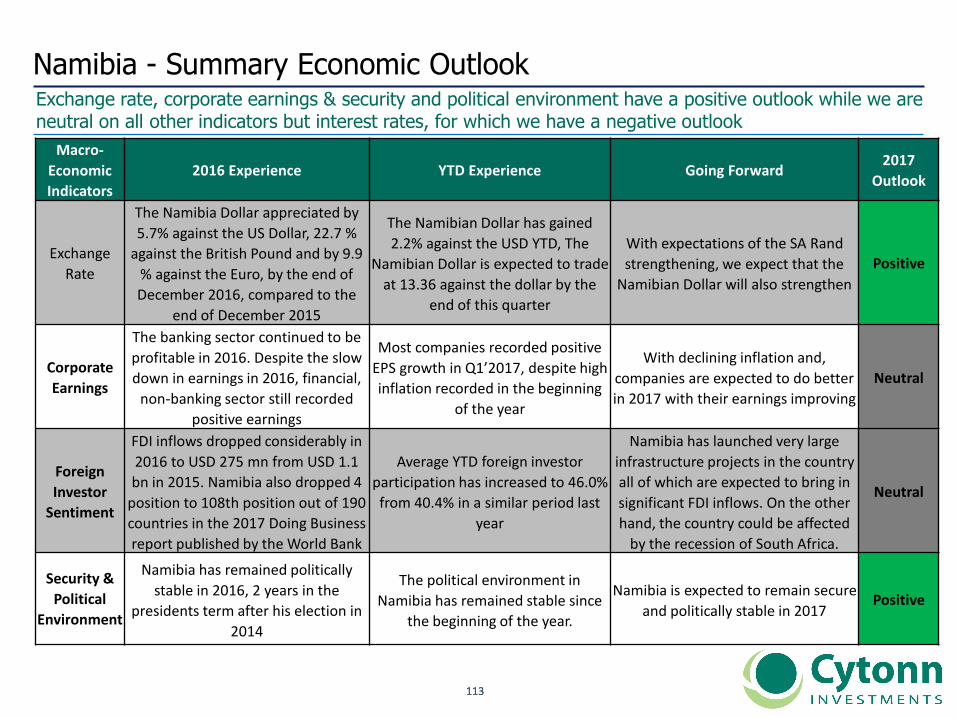
113113
Exchange rate, corporate earnings & security and political environment have a positive outlook while we are neutral on all other indicators but interest rates, for which we have a negative outlook
Namibia - Summary Economic Outlook
Macro-
Economic
Indicators
2016 Experience YTD Experience Going Forward2017
Outlook
Exchange
Rate
The Namibia Dollar appreciated by
5.7% against the US Dollar, 22.7 %
against the British Pound and by 9.9
% against the Euro, by the end of
December 2016, compared to the
end of December 2015
The Namibian Dollar has gained
2.2% against the USD YTD, The
Namibian Dollar is expected to trade
at 13.36 against the dollar by the
end of this quarter
With expectations of the SA Rand
strengthening, we expect that the
Namibian Dollar will also strengthen
Positive
Corporate
Earnings
The banking sector continued to be
profitable in 2016. Despite the slow
down in earnings in 2016, financial,
non-banking sector still recorded
positive earnings
Most companies recorded positive
EPS growth in Q1’2017, despite high
inflation recorded in the beginning
of the year
With declining inflation and,
companies are expected to do better
in 2017 with their earnings improving
Neutral
Foreign
Investor
Sentiment
FDI inflows dropped considerably in
2016 to USD 275 mn from USD 1.1
bn in 2015. Namibia also dropped 4
position to 108th position out of 190
countries in the 2017 Doing Business
report published by the World Bank
Average YTD foreign investor
participation has increased to 46.0%
from 40.4% in a similar period last
year
Namibia has launched very large
infrastructure projects in the country
all of which are expected to bring in
significant FDI inflows. On the other
hand, the country could be affected
by the recession of South Africa.
Neutral
Security &
Political
Environment
Namibia has remained politically
stable in 2016, 2 years in the
presidents term after his election in
2014
The political environment in
Namibia has remained stable since
the beginning of the year.
Namibia is expected to remain secure
and politically stable in 2017Positive
114114
Q&AIn case of any queries or clarifications on this Financial Services Sector
Report, kindly contact the Team at:
E-mail: [email protected]
Tel: +254 (0)709 101 000 / 714 830744