Embed Size (px)
Citation preview

STYX AEE
August 2012
Report No. 0878105590 - 087813714
APPENDIX J Metal Concentrations in the Styx River Catchment 2007-2008 (Golder 2009a)

June 2009
CHRISTCHURCH CITY COUNCIL
Metal Concentrations in the Styx River Catchment 2007-2008
REPO
RT
Report Number: 087813714
Submitted to:Christchurch City Council

METAL CONCENTRATIONS IN THE STYX RIVER CATCHMENT
June 2009 Report No. 087813714 i
Table of Contents
1.0 INTRODUCTION........................................................................................................................................................1 1.1 Background...................................................................................................................................................1 1.2 Report Scope ................................................................................................................................................1
2.0 METHODOLOGY .......................................................................................................................................................2 2.1 Sampling Site Locations................................................................................................................................2 2.2 Analysis.........................................................................................................................................................2
3.0 RESULTS AND DETECTION LIMITS........................................................................................................................4 3.1 Introduction ...................................................................................................................................................4 3.2 Water Level ...................................................................................................................................................4 3.3 Suspended Solids .........................................................................................................................................5 3.4 Cadmium.......................................................................................................................................................6 3.5 Copper ..........................................................................................................................................................6 3.6 Lead..............................................................................................................................................................6 3.7 Mercury .........................................................................................................................................................7 3.8 Zinc ...............................................................................................................................................................9
4.0 HOW DOES THE STYX WATER QUALITY DATA COMPARE ..............................................................................11 4.1 Water Quality Guidelines ............................................................................................................................11 4.1.1 Cadmium...............................................................................................................................................12 4.1.2 Copper...................................................................................................................................................12 4.1.3 Lead ......................................................................................................................................................12 4.1.4 Mercury .................................................................................................................................................12 4.1.5 Zinc........................................................................................................................................................12 4.2 Natural Waters ............................................................................................................................................13 4.3 Urban Stormwater .......................................................................................................................................13
5.0 SUMMARY AND CONCLUSION .............................................................................................................................15 6.0 REFERENCES.........................................................................................................................................................16
TABLES Table 1: CCC sampling sites in the Styx River catchment...................................................................................................2 Table 2: Suspended solids in the Styx River catchment 2007-2008....................................................................................5 Table 3: Summary of sample numbers and detection limits. ...............................................................................................8 Table 4: Summary of zinc concentrations in the Styx River catchment 2007-2008. ............................................................9 Table 5: Comparison of metal concentrations in the Styx River catchment with relevant water quality guidance
values. ..............................................................................................................................................................11 Table 6: Comparison of Styx River catchment metal concentrations with published New Zealand stormwater data. .......13
FIGURES Figure 1: CCC water quality sampling locations in the Styx River catchment......................................................................3

METAL CONCENTRATIONS IN THE STYX RIVER CATCHMENT
June 2009 Report No. 087813714 ii
Figure 2: Water level in Styx River measured at Radcliffe Road (Data source Christchurch City Council). ........................5 Figure 3: TSS and lead in Styx River catchment 2008. .......................................................................................................7 Figure 4: Zinc in the Styx River catchment 2007-2008. .....................................................................................................10 Figure 5: TSS and zinc in the Styx River catchment 2008.................................................................................................10
APPENDICES Appendix A Report Limitations Appendix B Raw Data

METAL CONCENTRATIONS IN THE STYX RIVER CATCHMENT
June 2009 Report No. 087813714 1
1.0 INTRODUCTION 1.1 Background The summary of available water quality data for the greater Christchurch City territorial area (Main 2008) provided by the Christchurch City Council (CCC) to support the development of an Integrated Catchment Management Plan (ICMP) for the Styx River catchment did not include any data on the concentration of metals in water. Metals are commonly present in urban stormwater in elevated concentrations as a consequence of the wide range of activities and emissions in urban environments (Kennedy 2003). Interpretation and analysis of metal concentrations in waterways is therefore an important aspect of stormwater management in urban environments. CCC has routinely monitored water quality at a large number of sites across Christchurch on a monthly basis since 1999. As part of the CCC water quality monitoring strategy, a suite of metals was added to the routine monitoring programme in January 2007. Analysis of water quality samples for metals is expected to continue as part of CCC’s commitment to ongoing monitoring of water quality in Christchurch’s rivers and streams. Routine monitoring occurs at eight sites in the Styx River catchment; one in Smacks Creek, two in Kaputone Stream and five in the main stem of the Styx River. The purpose of this report is to present an interpretation of the metal results from monitoring in the Styx River catchment in 2007 and 2008.
1.2 Report Scope Golder Associates (NZ) Limited (Golder) was engaged by CCC to undertake an analysis of the metal water quality data recorded to date in the Styx River catchment, as an extension of the Styx ICMP project. The scope of this report was detailed in the proposal (dated 7 May 2009) submitted by Golder to CCC and is summarised below:
Calculate summary statistics for each metal and site.
Plot the data to determine any spatial trends.
Compare the data with relevant water quality guidelines.
Compare the data with relevant stormwater event mean concentrations.
Visualise the data using GIS. And in addition, any anomalies in the data collected to date have been noted. The scope of work is intended to align with analyses undertaken for the South-West Christchurch ICMP assessment and also that undertaken by Main (2008). This report is provided subject to the limitations in Appendix A.

METAL CONCENTRATIONS IN THE STYX RIVER CATCHMENT
June 2009 Report No. 087813714 2
2.0 METHODOLOGY 2.1 Sampling Site Locations The eight sampling sites and their respective GPS locations are listed in Table 1 and plotted in Figure 1. Table 1: CCC sampling sites in the Styx River catchment.
Waterway Location Easting Northing
Smacks Creek Gardiners Road 2476819 5749565 Kaputone Stream Blakes Road 2480401 5749663 Kaputone Stream Belfast Road (east) 2482195 5749882 Styx River Gardiners Road 2476786 5748821 Styx River Main North Road 2479035 5748833 Styx River Marshland Road 2482356 5749417 Styx River Richards Bridge1 2484001 5751230 Styx River Harbour Rd Bridge 2485015 5756372
Note: 1 The Richards Bridge site is located on Teapes Rd, and is the same site which is routinely monitored by Environment Canterbury (ECan site known as Teapes Rd). No metals data was available for this site prior to October 2008.
2.2 Analysis Water samples were collected by CCC staff and sent for analysis to the CCC laboratory. In addition to the routine water quality analyses which included total suspended solids, the metals analysed were:
Cadmium;
Copper;
Lead;
Mercury; and
Zinc. The metals were analysed for the total fraction, according to APHA (21st edition 2005) methods 3030e and 3111c (Maxie Prinsloo, CCC Laboratory Manager, Pers. Comm.). It is noted that method 3030e is a nitric acid digestion and therefore the analysis is for a total recoverable fraction, rather than a true total fraction. All raw data received from CCC has been collated and is presented in Appendix B.

!! !!!!
!! !!
!!
!!
!!
Kaputone Stream
Smac
ks C
reek
Styx River at Marshland Road
Styx River at Gardiners Road
Styx River at Richards Bridge
Smacks Creek at Gardiners Road
Styx River at Harbour Rd Bridge
Styx River at Main North Road
Kaputone Stream at Blakes Road
Kaputone Stream at Belfast Road (east)Styx
Rive
r
¯In
form
atio
n co
ntai
ned
in th
is d
raw
ing
is th
e co
pyrig
ht o
f Gol
der A
ssoc
iate
s (N
Z) L
td. U
naut
horis
ed u
se o
r rep
rodu
ctio
n of
this
pla
n ei
ther
who
lly o
r in
part
with
out w
ritte
n pe
rmis
sion
infri
nges
cop
yrig
ht.
©
Gol
der A
ssoc
iate
s (N
Z) L
td.
WATER QUALITY MONITORING SITES IN THE STYX RIVER CATCHMENT. 1JUNE 20090878103714PROJECT
TITLE
0 1 2 3
KilometersDatum: NZGD 1949Projection: New Zealand Map Grid
Legend!! Water Quality Monitoring Sites
Styx ICMP project area
K:\GIS\Projects-Numbered\2008\08781x\03xxx\0878103_714_CCC_StyxRiverICMP\MapDocuments\StyxICMP\Fig1_WaterWualityMonitoringSites.mxd
Note: Background image sourced from LINZ. Crown Copyright Reserved.

METAL CONCENTRATIONS IN THE STYX RIVER CATCHMENT
June 2009 Report No. 087813714 4
3.0 RESULTS AND DETECTION LIMITS 3.1 Introduction Concentrations of metals in fresh waters are often closely associated with suspended solids concentrations in the water column and higher concentrations are often found when suspended solids concentrations rise (e.g., during storms). As a result if suspended solids concentrations are high in urban stormwater, the total metal fraction may also be high while the dissolved, or unbound, fraction could be low. Although, this is dependent on the sources contributing to the suspended solids (geological versus street surface dust) and water chemistry (e.g., pH), it is therefore important to include suspended solids concentrations when undertaking analysis of metal concentrations in freshwater environment as an aid to the interpretation of data obtained. Suspended solids concentrations in the Styx River catchment are discussed below prior to the discussion on metal concentrations. The majority of the metals data provided for the 2007-2008 period was below analytical detection limits (refer to Appendix B for raw data). Consequently there is little value in calculating summary statistics for sites where they may only be two or three data points reported above detection limits. Table 3 identifies the number of data points collected for each site and the number of values reported that were above the detection limits. It should be noted that detection limits have been lowered as the monitoring programme has progressed and the range of detection limits is included in Table 3 for clarity. The preparation of plots to show data that is primarily below detection has little meaning, and thus this task has not been undertaken except for zinc. The zinc data was plotted as this parameter had the largest dataset of values above detection limits.
3.2 Water Level Water level in the Styx River is measured at 15 minute intervals by a water level recorder located at Radcliffe Road. The site is jointly operated by ECan and CCC and has been operational since 1992. The water level record for 2007-2008 is shown in Figure 2. Water levels in the Styx River are strongly affected by weed growth and accumulation in the river channel, particularly over the summer months. This can be clearly seen by the gradual increase in water levels between January and May 2007 before weed cutting dropped the water level significantly (Figure 2). The Styx River is spring-fed and baseflow conditions tend to dominate. Short duration high flow events due to rainfall runoff occur periodically throughout the record. The July 2008 spike coincided with a 52 mm rainfall event (NIWA Cliflo Database Christchurch Airport site).

METAL CONCENTRATIONS IN THE STYX RIVER CATCHMENT
June 2009 Report No. 087813714 5
10.4
10.6
10.8
11.0
11.2
11.4
11.6
11.8
12.0Ja
n-07
Feb-
07M
ar-0
7A
pr-0
7M
ay-0
7Ju
n-07
Jul-0
7A
ug-0
7S
ep-0
7O
ct-0
7N
ov-0
7D
ec-0
7Ja
n-08
Feb-
08M
ar-0
8A
pr-0
8M
ay-0
8Ju
n-08
Jul-0
8A
ug-0
8S
ep-0
8O
ct-0
8N
ov-0
8D
ec-0
8
Wat
er L
evel
(m)
Figure 2: Water level in Styx River measured at Radcliffe Road (Data source Christchurch City Council).
3.3 Suspended Solids Summary statistics for suspended solids (TSS) concentrations in the Styx River catchment sampling sites are shown in Table 2. The data shows that suspended solids concentrations are generally low, with the majority of medians below the detection limit of 5 g/m³. This is not unexpected given that the Styx River and its tributaries are spring-fed. Maximum TSS concentrations indicate that all sites experience occasions when TSS levels are elevated. The majority of the maximum TSS concentrations shown in Table 2 coincided with a 52 mm storm event which occurred on 31 July 2008. Thus, the elevated concentrations were most likely due to run-off and direct discharges of stormwater during the storm event. Over the period of this sampling no maximum TSS concentrations were over 100 g/m3. Table 2: Suspended solids in the Styx River catchment 2007-2008.
n Minimum Median Maximum
Styx River at Gardiners Road 24 <5 <5 25
Smacks Creek at Gardiners Road 24 <5 <5 43
Styx River at Main North Road 24 <5 <5 78
Kaputone Stream at Blakes Road 24 <5 <5 26
Kaputone Stream at Belfast Road 24 <5 9.0 42
Styx River at Marshland Road 24 <5 <5 62
Styx River at Richards Bridge 3 <5 <5 28
Styx River at Harbour Road 24 <5 <5 38
Note: Minimum, median and maximum data is reported as g/m³.

METAL CONCENTRATIONS IN THE STYX RIVER CATCHMENT
June 2009 Report No. 087813714 6
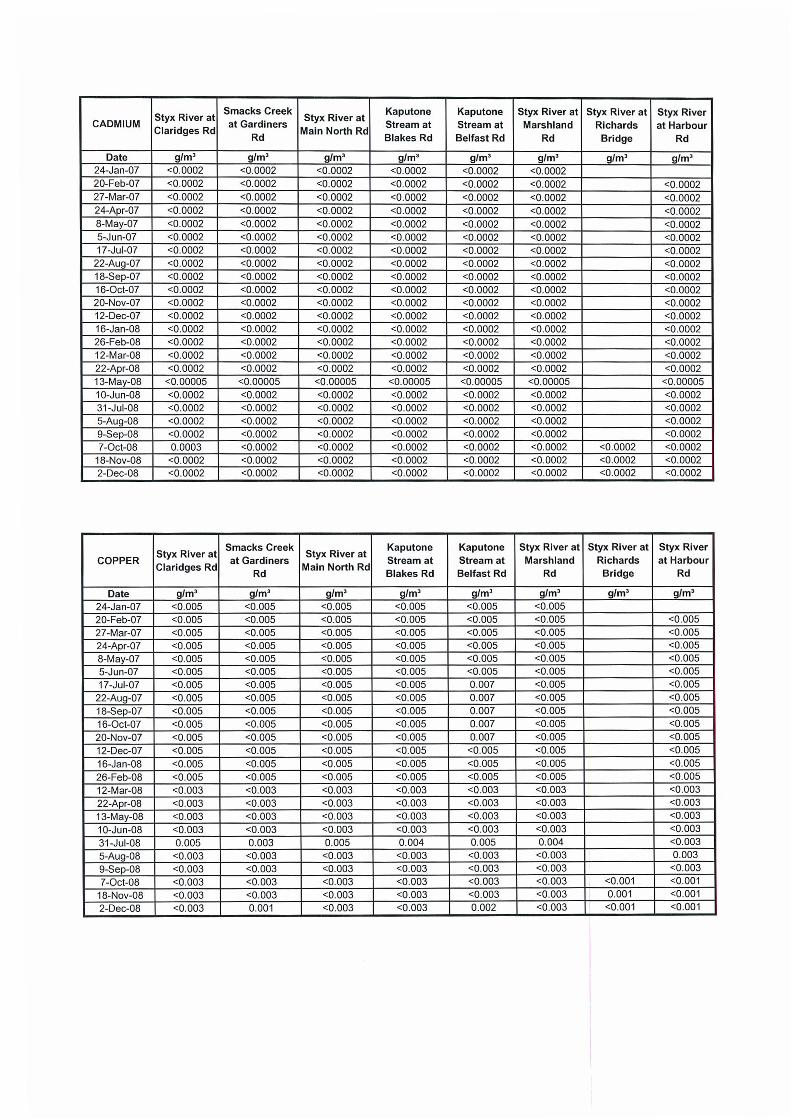
3.4 Cadmium Analytical detection limits for cadmium ranged from <0.00005 to <0.0002 g/m³. All results reported for 2007-08 were below detection limits except for one result in the Styx River at Gardiners Road site where a cadmium concentration of 0.0003 g/m³ was reported for October 2008. The detection limit used in the analysis is typically the lowest detection limit used for cadmium analysis in New Zealand.
3.5 Copper Analytical detection limits for copper ranged from <0.003 to <0.005 g/m³. All sites except the Styx River at Gardiners Road reported results greater than detection limit in July 2008. Kaputone Stream at Belfast Road has recorded concentrations above the detection limit on seven of the 24 sampling occasions. Concentrations at this site were in the range 0.002 – 0.007 g/m³. The detection limits used do not allow measurement of low concentrations that may occur in the Styx River catchment when urban stormwater is not contributing to copper concentrations (refer following section).
3.6 Lead Analytical detection limits for lead ranged from <0.0002 to <0.004 g/m³. A lead concentration of 4.2 g/m³ was reported in January 2007 in the Styx River at Gardiners Road. It is possible that the 4.2 g/m³ result was erroneous, as it is significantly higher than all other results, although this could not be confirmed. All other lead concentrations above the detection limit were in the range 0.00071 to 0.025 g/m³. The majority of sites reported between zero and two results above the detection limit although Kaputone Stream at Belfast Road and the Styx River at Marshland Road reported four and five results above the detection limit, respectively. Lead concentrations above the detection limit and in the range 0.003 – 0.006 g/m³ were recorded at seven of the eight sampling sites in July 2008. This was notable given the large number of data points lower than detection limits. Suspended solids were also elevated on this day (25 – 62 g/m³) and it is likely that the lead present was bound to sediments in the water column. Figure 2 illustrates the variation in lead with increasing TSS concentration. The detection limits used do not allow measurement of low concentrations that may occur in the Styx River catchment when urban stormwater is not contributing to lead concentrations (refer following section).

METAL CONCENTRATIONS IN THE STYX RIVER CATCHMENT
June 2009 Report No. 087813714 7
0.000
0.005
0.010
0.015
0.020
0.025
0.030
0 10 20 30 40 50 60 70
TSS (g/m³)
Lead
(g/m
³)
Figure 3: TSS and lead in Styx River catchment 2008.
3.7 Mercury Analytical detection limits for mercury ranged from <0.0002 to <0.0005 g/m³. Only one result above the detection limit has been recorded from any site. A mercury concentration of 0.0004 g/m³ was reported for the Styx River at Gardiners Road in October 2008. Concentrations of mercury in natural waters have been reported at a detection limit of <0.01 mg/m³ (0.00001 g/m³) in New Zealand (Cyprus 1987). That is 10 times lower than the detection limit used in the CCC monitoring programme. Given the difficulties in measuring mercury at such low concentrations it is likely that the single elevated result is a sampling/analysis anomaly. TSS concentrations on that sampling occasion were below the detection limit of 5 g/m³.

METAL CONCENTRATIONS IN THE STYX RIVER CATCHMENT
June 2009 Report No. 087813714 8
Table 3: Summary of sample numbers and detection limits. Cadmium Copper Lead Mercury Zinc Lowest Detection Limit (g/m³) <0.00005 <0.003 <0.0002 <0.0002 <0.001 Highest Detection Limit (g/m³) <0.0002 <0.005 <0.004 <0.0005 <0.03 n n>detection
limit n n>detection
limit n n>detection
limit n n>detection
limit n n>detection
limit Styx River at Gardiners Road 24 1 24 1 24 2 24 1 24 10 Smacks Creek at Gardiners Road 24 0 24 2 24 0 24 0 24 7 Styx River at Main North Road 24 0 24 1 24 2 24 0 24 9 Kaputone Stream at Blakes Road 24 0 24 1 24 1 24 0 24 12 Kaputone Stream at Belfast Road 24 0 24 7 24 4 24 0 24 11 Styx River at Marshland Road 24 0 24 1 24 5 24 0 24 7 Styx River at Richards Bridge 3 0 3 1 6 2 3 0 3 3 Styx River at Harbour Road 23 0 23 1 23 1 23 0 23 7 Note: n= total number of samples collected in 2007-2008.

METAL CONCENTRATIONS IN THE STYX RIVER CATCHMENT
June 2009 Report No. 087813714 9
3.8 Zinc Analytical detection limits for zinc ranged from <0.001 to <0.03 g/m³. Compared with the other metals discussed above, zinc concentrations above the detection limit were far more common. Summary statistics for zinc concentrations recorded are shown in Table 4. Zinc concentrations reported above detection limits are plotted in Figure 4. Table 4: Summary of zinc concentrations in the Styx River catchment 2007-2008. n Minimum Median Maximum Styx River at Gardiners Road 10 0.003 0.009 0.040 Smacks Creek at Gardiners Road 8 0.005 0.012 0.041 Styx River at Main North Road 9 0.002 0.008 0.025 Kaputone Stream at Blakes Road 11 0.001 0.010 0.058 Kaputone Stream at Belfast Road 11 0.003 0.020 0.059 Styx River at Marshland Road 7 0.003 0.008 0.044 Styx River at Richards Bridge 3 0.003 0.008 0.021 Styx River at Harbour Road 7 0.003 0.012 0.021 Note: Minimum, median and maximum data is reported as g/m³; n = number of samples above detection limit.
Median zinc concentrations ranged from 0.008 g/m³ at three of the Styx River main stem sites to 0.020 g/m³ in Kaputone Stream at Belfast Road. The two highest maximum concentrations were both recorded in Kaputone Stream but despite the highest median zinc concentration also occurring in Kaputone Stream, data in Figure 4 suggests that Kaputone Stream does not consistently record elevated zinc concentrations compared with the Styx River mainstem or Smacks Creek. The detection limits used are higher than the zinc concentrations that might be expected in uncontaminated waters. Zinc concentrations were elevated compared to the remainder of the data set at seven of the eight sampling sites in July 2008. Copper and lead concentrations were also higher than usual on the same sampling occasion. It is likely that this sampling occasion coincided with a recent storm event as suspended solids concentrations were also elevated (range 25 – 62 g/m³) on the same day. The data presented in Figure 4 shows that zinc concentrations are variable at all sites in the Styx River catchment and to date the data does not show any noteworthy spatial or temporal trends. These may emerge with continued monitoring at low detection limits. Figure 5 illustrates the changes in zinc concentration with increasing TSS concentration. The data suggests that increasing TSS is partly responsible for the higher zinc concentrations as measured. The data plotted in Figure 5 includes 2008 data only due to the higher detection limits used in 2007.

METAL CONCENTRATIONS IN THE STYX RIVER CATCHMENT
June 2009 Report No. 087813714 10
0
0.01
0.02
0.03
0.04
0.05
0.06
0.07Ja
n-07
Mar
-07
May
-07
Jul-0
7
Sep-
07
Nov
-07
Jan-
08
Mar
-08
May
-08
Jul-0
8
Sep-
08
Nov
-08
Jan-
09
Zinc
(g/m
³)
Styx @ Gardiners Smacks @ Gardiners
Styx @ Main North Kaputone @ Blakes
Kaputone @ Belfast Styx @ Marshland
Styx @ Richards Bridge Styx @ Harbour Rd
Detection Limits
Figure 4: Zinc in the Styx River catchment 2007-2008.
0
0.01
0.02
0.03
0.04
0.05
0.06
0.07
0 10 20 30 40 50 60 70
Total suspended solids (g/m³)
Zinc
(g/m
³)
Figure 5: TSS and zinc in the Styx River catchment 2008.

METAL CONCENTRATIONS IN THE STYX RIVER CATCHMENT
June 2009 Report No. 087813714 11
4.0 HOW DOES THE STYX WATER QUALITY DATA COMPARE 4.1 Water Quality Guidelines The guidelines selected for comparison of metals data in the Styx River catchment are the same as those used in the South-West Christchurch water quality assessments. Understanding the potential effects of the concentrations measured in the Styx River to date requires comparison with water quality guidelines that have been developed to protect aquatic biota. There are two sets of guideline values that are commonly used in this role. The first are criteria promulgated by USEPA and summarised in USEPA (2006). The second are trigger values developed by ANZECC and presented in ANZECC (2000). No comparison to water quality standards in the Proposed Natural Resources Regional Plan (PNRRP)(ECan 2004a) has been made as the Styx River is not classified under the PNRRP, rather it defers to the Waimakariri River Regional Plan (WRRP) (ECan 2004b). Under the WRRP the Styx River is classed as “WAIM-TRIB” and while this class has numerical standards for a range of physico-chemical parameters, there are no numerical standards for metals. Table 5 summarises the metals data, relevant water quality criteria from USEPA (2006) and the ANZECC (2000) trigger values. The USEPA (2006) criteria shown are for the Criterion Continuous Concentration (chronic criterion) which is defined as an estimate of the highest concentration to which an aquatic community can be exposed indefinitely without resulting in an unacceptable effect (USEPA 2006). The criteria have been calculated based on a hardness concentration of 30 g/m³ calcium carbonate, as no site-specific hardness data was available and this value was used for the South-West Christchurch assessment. The USEPA criteria use a default hardness of 100 g/m³ calcium carbonate however 30 g/m³ provides a more conservative criteria, since the softer the water is (i.e., lower hardness), the lower the criteria value becomes. Table 5: Comparison of metal concentrations in the Styx River catchment with relevant water quality guidance values.
Lowest Detection
Limit
Maximum Concentration
USEPA (2006) a Chronic criteria
ANZECC (2000) 95% trigger
values
Cadmium <0.00005 0.0003 0.0006 0.0002
Copper <0.003 0.007 0.0032 0.0014
Lead <0.0002 0.025b 0.00066 0.0034
Mercury <0.0002 0.0004 0.00077 0.0006
Zinc <0.001 0.059 0.0426 0.0225c
Note: All data g/m³; a Criterion Continuous Concentration based on a hardness of 30 g/m³ CaCO3; b an outlier of 4.2 g/m³ was excluded from this dataset; c Golder Kingett Mitchell (2007).
Many regulators refer to Australian and New Zealand guidelines for fresh and marine water quality (ANZECC 2000) trigger values as water quality guidance values by which to assess effects. There are a number of issues with using the values, namely:
The ANZECC (2000) trigger values were not derived to be used as fixed standards (refer ANZECC (2000) to read the approach ANZEC use in relation to assessments of effects relating to exceedance of trigger values).
There is current debate over the scientific basis for the derivation of some of trigger values (refer Fitzpatrick & Kennedy 2008), particularly those pertaining to metals.

METAL CONCENTRATIONS IN THE STYX RIVER CATCHMENT
June 2009 Report No. 087813714 12
Notwithstanding these limitations the ANZECC (2000) trigger values have been included in Table 5 for comparison, as they are commonly accepted and used in water quality assessments. The trigger values presented for zinc are those that resulted from a re-calculation of the ANZECC values for zinc, undertaken on behalf of CCC (Golder Kingett Mitchell 2007). ANZECC trigger values for cadmium, copper, lead and zinc are hardness dependant. The trigger values for these parameters are based on a hardness of 30 g/m³, as quoted in ANZECC (2000), and have not been adjusted as no site-specific hardness data was available. Trigger values in Table 5 are quoted for the 95% level of protection of aquatic species, which is considered appropriate for the Styx River catchment. The lowest detection limit reported for each metal analysed in 2007-08 has been shown in Table 5 to show whether the detection limit is sufficiently low enough to allow the data to be compared to the respective trigger or criteria. The detection limits shown in Table 5 are not only the lowest but also those that have been used in the more recent i.e., late 2008 data. Comparison of the detection limits with the USEPA (2006) criteria and ANZECC (2000) trigger values shows that a low detection limit is necessary in order to obtain value from the data being collected. It is also noted that the detection limit for copper of <0.003 g/m³ is not low enough to allow comparison of data with the ANZECC (2000) trigger values.
4.1.1 Cadmium All but one concentration recorded was lower than the USEPA criteria and the ANZECC (2000) trigger values. The single maximum concentration of cadmium (0.0003 g/m³ recorded in the Styx River at Gardiners Road) was slightly higher than the ANZECC (2000) trigger value but lower than the USEPA (2006) chronic criterion. However as noted earlier the reliability of this single figure is not known.
4.1.2 Copper As noted above, the detection limit for copper needs to be lowered to allow comparison of data with the ANZECC (2000) trigger value. The maximum copper concentration (0.007 g/m³ on five consecutive occasions in the Kaputone Stream at Belfast Road) exceeded both the USEPA (2006) chronic criterion and ANZECC (2000) trigger value.
4.1.3 Lead The maximum lead concentration, and indeed the majority of all lead data where reported concentrations were greater than detection limits, exceeded both the USEPA (2006) chronic criterion and ANZECC (2000) trigger value.
4.1.4 Mercury The maximum mercury concentration (0.0004 g/m³ recorded in the Styx River at Gardiners Road) did not exceed the ANZECC (2000) trigger value or the USEPA (2006) chronic criterion.
4.1.5 Zinc The maximum zinc concentration (0.059 g/m³ recorded in Kaputone Stream at Belfast Road) exceeded both the USEPA (2006) chronic criterion and revised ANZECC trigger value (Golder Kingett Mitchell 2007). Median zinc concentrations at all eight sampling sites were lower than the USEPA (2006) chronic criterion and the revised ANZECC trigger value (Golder Kingett Mitchell 2007) (refer to Table 4 for median values). The ANZECC trigger values are provided as guidance and in any situation where the values identified are exceeded, the guideline process recommends environmental/ecological investigations be undertaken to assess the consequences of increased toxicant concentrations. The first step in this process is to compare dissolved fractions with the trigger values. If concentrations still exceed guideline values, they then

METAL CONCENTRATIONS IN THE STYX RIVER CATCHMENT
June 2009 Report No. 087813714 13
recommend that site specific trigger values be determined to account for local conditions. Given that the data reported here is for the total fraction, zinc concentrations would be unlikely to be higher even if the dissolved fraction was assessed.
4.2 Natural Waters The Styx River catchment metals data was compared to trace metal data for a number of more remote water ways in New Zealand, including those cited in Cyprus (1987), Tunnicliff & Beaumont (1984) and Ahlers & Hunter (1984). Although the data the Styx River catchment information was compared against appears to be older data it represents some of the best information available where metals were measured using clean techniques. The comparative information can be considered to be representative of clean rural locations. That comparison showed:
Cadmium concentrations were very low and below detection (but the detection limit was higher than natural background concentrations).
Copper concentrations were higher than background indicating some contribution of copper.
Lead concentrations were higher than natural background and this is typical of most waters within urban environments.
Mercury concentrations were elevated and below detection (but the detection limit was higher than natural background concentrations).
Zinc concentrations were elevated and above detection in many samples and above concentrations that would be expected in rural and uncontaminated waters.
4.3 Urban Stormwater Different land uses within a catchment can be expected to generate different contaminant loads in stormwater that may enter the stream system. Land use within the Styx River catchment ranges from urban to rural as determined by Renard et al. (2004). The main urban areas are adjacent to Main North Road between Redwood and Belfast, where there is also some commercial development at Northwood. Much of the remaining area is rural and mixed land use. Waterways within the urban areas are typically piped or are boxed drains. Where land use is rural the channels are generally wider and more open, such as the Styx River main stem sites. Land use is described as mixed where a degree of residential development and e.g., a number of intensive horticultural or rural land use areas exist. Parts of Kaputone Stream are within rural areas but are generally classified as mixed land use because of the influence from the urbanised Belfast area upstream. Table 6 provides a comparison of Styx River water quality data with published metal concentrations in New Zealand urban stormwater. Table 6: Comparison of Styx River catchment metal concentrations with published New Zealand stormwater data. Cadmium Copper Lead Mercury Zinc
Styx River catchmenta
0.3 4 (1 – 5)
4 (0.71 – 25)
0.4 10 (1 – 59)
Williamson (1993)
40 (15 – 110)
260 (90 – 800)
Rotorua City, Residentialb
0.018 (<0.05 - 0.44)
13.3 (5 - 15.3)
18.7 (6.2 - 21.5)
<0.08 (<0.08 - 0.12)
62 (31 - 96)
Rotorua City, Commercialb
0.24 8.9 8 <0.07 137

METAL CONCENTRATIONS IN THE STYX RIVER CATCHMENT
June 2009 Report No. 087813714 14
(0.15-9.8) (7.4-12.3) (4.2-11) (<0.07-0.17) (82-178)
Kaikorai Valley Dunedin, Residentialc
- 21.9 (4.5-56.4)
34 (5.7-94.5)
- 233 (101-883.3)
Pakuranga, Residentiald
0.056 (0.019-0.24)
13 (5.1-155)
- - 330 (170-1,080)
Note: Units mg/m³; a Total recoverable fraction reported as median with range in brackets. Where a single value is reported only one data point above the detection limit was reported; b Dissolved fraction reported as median with range in brackets, source Macaskill et al. (2003); c Mosley & Peake (2001), acid soluble. d ARC (1992), acid soluble, high traffic road within immediate catchment.
The comparison of the Styx River catchment metals data with the urban stormwater quality data in Table 6 shows:
Cadmium in the Styx River catchment appears elevated however the value reported is a single data point and is well below the maximum values reported in Rotorua City residential and commercial stormwater.
The single value for mercury in the Styx River catchment is elevated compared to available stormwater data. Mercury is not typically associated with stormwater and its presence could be due to some other source.
Copper, lead and zinc concentrations are well below those reported for typical stormwater discharges, as expected for a catchment which is still predominantly rural, despite a recent increase in urban residential development.
METAL CONCENTRATIONS IN THE STYX RIVER CATCHMENT
June 2009 Report No. 087813714 15
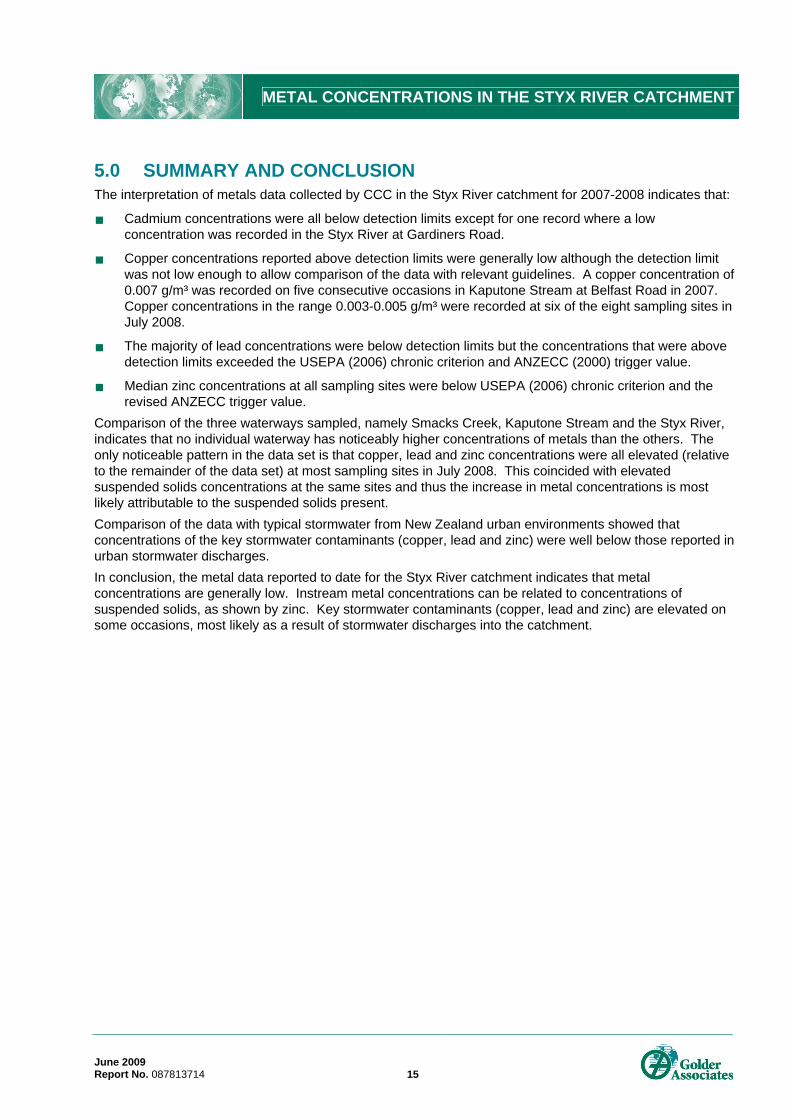
5.0 SUMMARY AND CONCLUSION The interpretation of metals data collected by CCC in the Styx River catchment for 2007-2008 indicates that:
Cadmium concentrations were all below detection limits except for one record where a low concentration was recorded in the Styx River at Gardiners Road.
Copper concentrations reported above detection limits were generally low although the detection limit was not low enough to allow comparison of the data with relevant guidelines. A copper concentration of 0.007 g/m³ was recorded on five consecutive occasions in Kaputone Stream at Belfast Road in 2007. Copper concentrations in the range 0.003-0.005 g/m³ were recorded at six of the eight sampling sites in July 2008.
The majority of lead concentrations were below detection limits but the concentrations that were above detection limits exceeded the USEPA (2006) chronic criterion and ANZECC (2000) trigger value.
Median zinc concentrations at all sampling sites were below USEPA (2006) chronic criterion and the revised ANZECC trigger value.
Comparison of the three waterways sampled, namely Smacks Creek, Kaputone Stream and the Styx River, indicates that no individual waterway has noticeably higher concentrations of metals than the others. The only noticeable pattern in the data set is that copper, lead and zinc concentrations were all elevated (relative to the remainder of the data set) at most sampling sites in July 2008. This coincided with elevated suspended solids concentrations at the same sites and thus the increase in metal concentrations is most likely attributable to the suspended solids present. Comparison of the data with typical stormwater from New Zealand urban environments showed that concentrations of the key stormwater contaminants (copper, lead and zinc) were well below those reported in urban stormwater discharges. In conclusion, the metal data reported to date for the Styx River catchment indicates that metal concentrations are generally low. Instream metal concentrations can be related to concentrations of suspended solids, as shown by zinc. Key stormwater contaminants (copper, lead and zinc) are elevated on some occasions, most likely as a result of stormwater discharges into the catchment.

METAL CONCENTRATIONS IN THE STYX RIVER CATCHMENT
June 2009 Report No. 087813714 16
6.0 REFERENCES Ahlers, W. W.; Hunter, K. A. 1984: A baseline survey of water quality and trace metal levels in the upper Manuherikia River and Idaburn in Central Otago: Final Report, Chemistry Department, University of Otago, September 1984: ARC, 1992: An assessment of stormwater quality and the implications for the treatment of stormwater in the Auckland region. Report prepared by Kingett Mitchell & Associates Limited for Auckland Regional Council. Environment Planning Division Technical Report No 5, April 1992. ARC, 2005: Sources and loads of metals in urban stormwater. Auckland Regional Council Technical Publication No. ARC04104. June 2005. Cyprus. 1987. Golden Cross mining project. Environmental Impact Report. October 1987. ECan, 2004a: Proposed Natural Resources Regional Plan, Chapter 4: Water Quality. Report No. R04/13/1. Canterbury Regional Council. July 2004. ECan, 2004b: Waimakariri River Regional Plan. Report R04/7. Canterbury Regional Council. October 2004. Fitzpatrick, M.; Kennedy, P. 2008: Re-evaluation of ANZECC 2000 trigger values in the New Zealand setting. 5th SETAC World Congress, Sydney Australia 3-7 August 2008. Golder Kingett Mitchell 2007: Re-calculation of the ANZECC trigger values for zinc for Christchurch City Council. November 2007. Kennedy, P. 2003: The effects of road transport on freshwater and marine ecosystems. Prepared by Kingett Mitchell Limited for New Zealand Ministry of Transport. October 2003. Kingett Mitchell. 2006: Assessment of the environmental effects of the discharge of stormwater and wastewater from the proposed Mt Lyford Estates subdivision. Report prepared on behalf of My Lyford Estates Limited. November 2006. Main, M. 2008: An analysis of water quality data for Christchurch City waterways and the standards in the proposed natural resources regional plan. Report prepared by Aquatic Ecology Limited for Christchurch City Council. AEL Report No. 58. April 2008. Mosley, L. M.; Peake, B. 2001: Partitioning of metals in urban runoff from the Kaikorai Valley, Dunedin, New Zealand. New Zealand Journal of Marine and Freshwater Research 35: 615-624. Macaskill, B.; Bowman, E.; Golding, L.; Horrox, J.; Phillips, N. 2003: Rotorua urban stormwater quality and summary of effects. Report to Rotorua District Council. NIWA Client Report No. HAM2002-019. Renard, T.; Meurk, C.; Phillips, C.; Ferriss, S.; Barrabe, A. 2004. Land Cover and Land Use Mapping of the Styx River Catchment, April 2003 – June 2004. Report prepared for Christchurch City Council. Landcare Research, Lincoln. October 2004.
Tunnicliff, C.; Beaumont, H. 1984: Trace metal levels in Coromandel streams. pp24-30. In trace elements in the eighties. Proceedings of the conference of the New Zealand trace element group, 7-8 August, Massey University, Palmerston North. USEPA, 2006: National recommended water quality criteria. United States Environmental Protection Agency. Williamson, R. B. 1993: Urban runoff data book – a manual for preliminary evaluation of stormwater impacts. NIWAR.

METAL CONCENTRATIONS IN THE STYX RIVER CATCHMENT
June 2009 Report No. 087813714
APPENDIX A Report Limitations

APPENDIX A Report Limitations
June 2009 Project No. 0878313714 1/1
REPORT LIMITATIONS This Document has been provided by Golder Associates (NZ) Ltd (“Golder”) subject to the following limitations:
(i). This Document has been prepared for the particular purpose outlined in Golder’s proposal and no responsibility is accepted for the use of this Document, in whole or in part, in other contexts or for any other purpose.
(ii). The scope and the period of Golder’s Services are as described in Golder’s proposal, and are subject to restrictions and limitations. Golder did not perform a complete assessment of all possible conditions or circumstances that may exist at the site referenced in the Document. If a service is not expressly indicated, do not assume it has been provided. If a matter is not addressed, do not assume that any determination has been made by Golder in regards to it.
(iii). Conditions may exist which were undetectable given the limited nature of the enquiry Golder was retained to undertake with respect to the site. Variations in conditions may occur between investigatory locations, and there may be special conditions pertaining to the site which have not been revealed by the investigation and which have not therefore been taken into account in the Document. Accordingly, additional studies and actions may be required.
(iv). In addition, it is recognised that the passage of time affects the information and assessment provided in this Document. Golder’s opinions are based upon information that existed at the time of the production of the Document. It is understood that the Services provided allowed Golder to form no more than an opinion of the actual conditions of the site at the time the site was visited and cannot be used to assess the effect of any subsequent changes in the quality of the site, or its surroundings, or any laws or regulations.
(v). Any assessments made in this Document are based on the conditions indicated from published sources and the investigation described. No warranty is included, either express or implied, that the actual conditions will conform exactly to the assessments contained in this Document.
(vi). Where data supplied by the client or other external sources, including previous site investigation data, have been used, it has been assumed that the information is correct unless otherwise stated. No responsibility is accepted by Golder for incomplete or inaccurate data supplied by others.
(vii). The Client acknowledges that Golder may have retained subconsultants affiliated with Golder to provide Services for the benefit of Golder. Golder will be fully responsible to the Client for the Services and work done by all of its subconsultants and subcontractors. The Client agrees that it will only assert claims against and seek to recover losses, damages or other liabilities from Golder and not Golder’s affiliated companies. To the maximum extent allowed by law, the Client acknowledges and agrees it will not have any legal recourse, and waives any expense, loss, claim, demand, or cause of action, against Golder’s affiliated companies, and their employees, officers and directors.
(viii). This Document is provided for sole use by the Client and is confidential to it and its professional advisers. No responsibility whatsoever for the contents of this Document will be accepted to any person other than the Client. Any use which a third party makes of this Document, or any reliance on or decisions to be made based on it, is the responsibility of such third parties. Golder accepts no responsibility for damages, if any, suffered by any third party as a result of decisions made or actions based on this Document.
i:\projects-numbered\08781x\3xxx\087813714_ccc_styxriver_icmp_chch\styx metals data analysis\reports (golder)\appendices\appendix a - report limitations.doc

METAL CONCENTRATIONS IN THE STYX RIVER CATCHMENT
June 2009 Report No. 087813714
APPENDIX B Raw Data


AfricaAsiaAustralia &New ZealandEuropeNorth AmericaSouth America
+ 27 11 254 4800+ 852 2562 3658
+ 61 7 3721 5400+ 44 356 21 42 30 20+ 1 800 275 3281+ 55 21 3095 9500
At Golder Associates we strive to be the most respected global group specialising in ground engineering and environmental services. Employee owned since our formation in 1960, we have created a unique culture with pride in ownership, resulting in long-term organisational stability. Golder professionals take the time to build an understanding of client needs and of the specific environments in which they operate. We continue to expand our technical capabilities and have experienced steady growth with employees now operating from offices located throughout Africa, Asia, Australasia, Europe, North America and South America.
CHRISTCHURCH
Tel [64] (3) 377 5696Fax [64] (3) 377 9944
Level 4115 Kilmore Street Christchurch 8013
(PO Box 2281Christchurch 8140)
TAKAPUNA
Tel [64] (9) 486 8068Fax [64] (9) 486 8072
Level 2Takapuna Business Park4 Fred Thomas DriveTakapuna 0740Auckland
(PO Box 33-849Takapuna 0622)
DUNEDIN
Tel [64] (3) 479 0390 Fax [64] (3) 474 9642
Level 9AJohn Wickliffe House265 Princes StreetDunedin 9016
(PO Box 1087Dunedin 9054)
TAURANGA
Tel [64] (7) 928 5335 Fax [64] (7) 928 5336
Suite 6, Level 2143 Durham Street Tauranga 3110
(PO Box 13611Tauranga CentralTauranga 3141)
NELSON
Tel [64] (3) 548 1707Fax [64] (3) 548 1727
Level 1Concordia House200 Hardy StreetNelson 7010
(PO Box 1724Nelson 7040)


![Styx y Stygius[1]](https://img.dokumen.tips/doc/110x75/55cf9138550346f57b8ba3c9/styx-y-stygius1.jpg)


