Embed Size (px)
Citation preview
Introduction
There is growing and widespread interest among policymakers at all levelsof government in recent years to promote entrepreneurial-friendly environ-ments and entrepreneurship in terms of both self-employment and businessownership. The interest is motivated by a substantial body of research indi-cating that entrepreneurs spur the diffusion and implementation ofinnovative ideas, thereby creating new products, services, and markets. Inaddition, and perhaps more importantly, entrepreneurs contribute, whetherthrough self-employment or the establishment of small businesses, to jobformation and economic growth and development. Some consider self-employment, moreover, a route out of poverty or off the unemploymentrolls for some individuals, especially those encountering discrimination inthe labor market. Self-employment may even be a way to increase one’searnings, as compared to working for someone else. All these factors play arole in governmental efforts to foster entrepreneurship, in terms of bothself-employment and business ownership, particularly in low- and moder-ate-income (LMI) communities.
While there may be convincing evidence demonstrating the importanceof entrepreneurship for increasing social welfare, there is some uncertaintyabout the most important determinants of entrepreneurship and, hence,
James R. Barth, Glenn Yago, and Betsy Zeidman
Stumbling Blocks to Entrepreneurship inLow- and Moderate-Income Communities
91

those policies that best support entrepreneurial activity. There are at leasttwo levels at which this uncertainty arises. The first is at the level of indi-vidual entrepreneurship itself. It is not fully known why some individualsbecome entrepreneurs, while others become wage or salary workers. Thesecond level of uncertainty pertains to the factors most responsible forenabling or preventing a would-be entrepreneur from becoming self-employed or establishing a business. Both of these issues have been studied,but researchers, so far, have failed to reach enough of a consensus to providea true road map to meaningful policy actions.
The purpose of this paper is to explore several aspects of the variousefforts that have been made in recent years to understand better what worksbest at promoting entrepreneurship throughout the United States, espe-cially in the LMI communities. This is obviously an extremely importantissue but, nonetheless, a difficult challenge for any researcher. Our approachto addressing the topic is to rely mainly on the work of other researchers,but also to make a modest attempt to contribute to the research in the area.
The plan of the remainder of the paper is as follows. In the next section, webriefly discuss the importance of entrepreneurial activity in contribution toeconomic growth and development, and social welfare more broadly. The thirdsection focuses more narrowly on the commitment of financial institutions tochannel loans to businesses in LMI communities. The fourth section focuses ona newly constructed measure indicating the degree of “loan bias” that exists inthese communities. The fifth section focuses on selected databases that are avail-able to study entrepreneurship, various empirical studies that have examinedseveral determinants of different measures of entrepreneurial activity, andpotential stumbling blocks or barriers to entrepreneurship considered by thesestudies. It also identifies inconsistencies in findings and the lack of commondata sources that limit the confidence that one can have in any proposed policyactions to foster greater entrepreneurship. The sixth section discusses the typesof regulatory stumbling blocks that may impede the development of greaterentrepreneurial activity.
The seventh section changes pace and discusses an alternative approachto trying to identify those factors that help explain the differences in
92 James R. Barth, Glenn Yago, and Betsy Zeidman

entrepreneurial activity across geographical regions. The approach is tofocus on the size distribution of businesses in different regions of thecountry, based upon the notion that relatively smaller firms, in contrastto relatively bigger firms, contain the breeding grounds for the initialexpression of the entrepreneurial spirit, no matter where those firms arelocated. The eighth and last section contains a summary and conclusions.
Overview of the importance of entrepreneurship
Economic theory does not provide clear guidance on providing an opera-tional way in which to classify entrepreneurs from nonentrepreneurs. Forexample, Kihlstrom and Laffont (1979, p. 720) develop a theoretical model andfind “that less-risk-averse individuals become entrepreneurs, while the more-risk-averse work as laborers.” As another example, Lucas (1978, p. 510)constructs a model in which “each member of the workforce is endowed witha ‘talent for managing’ which varies across workers.” Thus, either innate differ-ences in attitudes toward risk or talents for managing are used to explain whysome individuals are entrepreneurs and others are paid workers. More generally,as Holtz-Eakin and Rosen (1994a, p. 338) state, “in the nonstatistical litera-ture…entrepreneurs are characterized in terms of their daring, risk-taking,animal spirits, and so on….” Those who study entrepreneurship empirically,however, require a more concrete way in which to identify entrepreneurs that ismore amenable to measurement in order to examine various factors that mayhelp explain differences in the degree of entrepreneurship that exists over timeand across geographical regions.
Thomas Hoenig (2005, p. 2), president of the Federal Reserve Bank ofKansas City, in this regard, suggests that the entrepreneur is someone whorecognizes “the potential of new ideas, designs applications, develops newproducts, and successfully brings these products to markets.” Based on thisdefinition, individuals who are self-employed or own relatively small busi-nesses could be considered entrepreneurs. At the very least, they areentrepreneurial enough to bring products and services to the marketplace.Indeed, among the empirical studies of entrepreneurship, Evans andLeighton (1989), Blanchflower and Oswald (1998), and Fairlie (1999) useself-employment to define entrepreneurs; Gentry and Hubbard (2004) use
Stumbling Blocks to Entrepreneurship in Low- and Moderate-Income Communities 93

business ownership; Meyer (1990) uses both self-employment and businessownership status; and Holtz-Eakin, Joulfaian, and Rosen (1994a, b) usefilers of IRS form 1040 schedule C to define entrepreneurs.
Tables 1 and 2 provide data on the economic impact of entrepreneurship.Table 1 shows that small businesses are extremely important for employ-ment and economic growth. Specifically, it shows that small businesses(that is to say, those with fewer than 500 employees) account for 99 percentof all firms in the United States, 86 percent of all establishments, 50 percentof total employment, 45 percent of annual payroll, and 39 percent of totalreceipts. Enterprises with zero to five employees, moreover, account for 47percent of all firms and 37 percent of all establishments.1 These enterprises,not surprisingly, account for only 5 percent of employment and 4 percentof annual payroll and receipts. But from these small firms, through theprocess of “creative destruction,” come the far bigger firms that help sustainthe dynamic process of job creation and economic development. Indeed,“over the past decade, small firms [in other words, firms with fewer than500 employees] have provided 60 to 80 percent of the net new jobs in theeconomy, and…almost all of these net new jobs stem from startups in thefirst two years of operation” (U.S. Small Business Administration Office ofAdvocacy and the Ewing Marion Kauffman Foundation, 2004). Further-more, Acs and Armington (2004) empirically find that a higher ratio ofentrepreneurial activity is associated strongly with faster growth of localeconomies. It, therefore, is incumbent upon policymakers concerned withgrowth and employment not to erect stumbling blocks or, worse yet, barri-ers to the establishment and operation of small businesses.
Table 2 provides a somewhat broader view of the role of small business inthe economy because it includes the self-employed. But, it also provides anote of caution insofar as it provides information on the race/ethnicity andgender of owners of firms. It is important for social welfare that all races,ethnicities, and genders are provided the opportunity to become self-employed or small business owners. Recent demographic data showing thegrowing importance of different social and ethnic groups in the total popu-lation only underscore this fact. Yet, Table 2 raises the issue as to whetherthis opportunity is indeed available to individuals in all these groups. It
94 James R. Barth, Glenn Yago, and Betsy Zeidman

Stumbling Blocks to Entrepreneurship in Low- and Moderate-Income Communities 95
Table 1Number of Firms, Number of Establishments, Employment, Annual
Payroll, and Receipts by Employment Size of the Enterprise
Table 2Number of Firms, Receipts, Employment, and Annual Payroll by
Race/Ethnicity and Gender
Data Type Total Employment Size of the Enterprise
0 % 1-4 % 5-9 % 10-19 % 20-99 % 100-499 % 500+ %Firms (thousands) 5,698 770 14% 2,696 47% 1,011 18% 614 11% 508 9% 82 1% 17 0%Establishments (thousands) 7,201 771 11% 2,699 37% 1,024 14% 653 9% 693 10% 333 5% 1,028 14%Employment (thousands) 112,401 0 0% 5,698 5% 6,640 6% 8,246 7% 19,874 18% 15,909 14% 56,034 50%Annual payroll (US$ billions) 3,943 38 1% 156 4% 182 5% 241 6% 624 16% 536 14% 2,166 55%Receipts (US$ billions) 22,063 215 1% 938 4% 888 4% 1,086 5% 2,885 13% 2,547 12% 13,504 61%
Source: 2002 County Business Patterns
Population Number of Firms Receipts Number of Employees Annual Payroll(millions) (thousands) (billions) (thousands) (billions)
All U.S. 281 22,977 22,635 110,833 3,815Male 49% 57% 31% 39% 35%Female 51% 28% 4% 7% 5%
Black 35 1,198 93 771 18Male 48% 48% 70% 65% 70%Female 52% 46% 23% 23% 22%
White 211 19,895 8,304 52,209 1,549Male 49% 60% 81% 78% 82%Female 51% 28% 10% 13% 10%
Asian 10 1,105 343 2,294 59Male 48% 58% 73% 68% 73%Female 52% 31% 16% 19% 17%
Hispanic 35 1,574 226 1,546 37Male 51% 59% 76% 72% 76%Female 49% 34% 16% 18% 17%
Source: 2002 Survey of Business OwnersNote: Minimum 50 percent ownership required for gender designation. Percentages may not add to 100 because of firms with equal male-female ownership.

shows the ownership distribution of firms based upon different demographiccharacteristics.2 More importantly, however, is the fact that it compares thedistribution of the ownership of businesses in terms of the population amongthe different races/ethnicities and genders to the distribution of the numberof firms, receipts, employees, and payroll among these same demographicgroups. One finds a striking imbalance in the different distributions.
The percentage of the population accounted for by females, for instance, indi-cates that they are significantly underrepresented as majority owners of firmsand especially so with respect to receipts and employment of firms. Femalesrepresent 51 percent of the population but just 12 percent of receipts and 14percent of employment of firms that are majority-controlled by a single gender.African-Americans and Hispanics also are underrepresented in terms of self-employment or ownership along the various dimensions indicated incomparison to their respective percentages of the total population. African-Americans comprise some 12 percent of the population but a mere 5 percent ofthe number of firms that are majority-controlled by a single race. This disparityis even more striking if one considers receipts and employment, where African-American-owned firms account for just 1 percent of receipts and employment.Hispanics account for 13 percent of the population but just 7 percent of firmsand 3 percent of receipts and employment. Conversely, Asian-Americanscomprise shares of firm employment and receipts in approximate parity to theirshare of the population and comprise a share of firm numbers higher than theirshare of population.
This type of information raises important questions about potentialstumbling blocks, if not downright barriers, to individuals in several differ-ent demographic groups for becoming self-employed or business owners. Italso suggests, however, that these potential hurdles may be less important,if not unimportant, for at least one minority group. The fact that manyindividuals from these demographic groups are also in LMI communitiesonly intensifies the importance of such questions. The reason, of course, isthat to limit the opportunities of these individuals to become self-employedor establish small businesses is to limit the opportunities of a large andincreasing potential portion of the U.S. population to grow and prosperthrough entrepreneurship. One of the limiting factors most frequently
96 James R. Barth, Glenn Yago, and Betsy Zeidman

mentioned is lack of access to capital. We explore this issue further in thenext section.
Some potential stumbling blocks to entrepreneurial activity inLMI communities
Many studies of the determinants of entrepreneurship frequentlymention that a major barrier to entrepreneurship (that is to say, self-employment or establishing a small business) is lack of access to funds, orwhat is referred to as “liquidity constraints.” The enactment of theCommunity Reinvestment Act of 1977 (CRA), however, requires thatbanks channel a portion of their funds to the communities in which theyare located. Appendix 1 shows the percentage of the population in each ofthe 280 metropolitan statistical areas (MSAs) that is accounted for by LMI3
individuals and the percentage of the total amount of loans made to busi-nesses in these communities by banks under CRA4 in 2000. It is importantto note, however, that only banks with assets of greater than $250 millionwere required to report under CRA in 2000 (this minimum was increasedto $1 billion in 2005). Reporting banks, moreover, are required to reportdata only on loans of $1 million in size or less. For these reasons, CRA datacan be viewed as data on the small business lending of banks that accountedfor more than 90 percent of total bank assets and business loans in 2000.5
Additionally, for our analysis in this section, we assume that LMI individ-uals live mainly in LMI census tracts, rather than being located randomlythroughout the census tracts in MSAs. This assumption seems plausiblegiven that the U.S. Census Bureau notes that census tracts are “designed tobe relatively homogeneous units with respect to population characteristics,economic status, and living conditions.”
It is quite clear that the distribution of the LMI population as a percent-age of an MSA’s total population varies substantially across the MSAs—themean is 40 percent, and the standard deviation is 0.03 percent. The sharesrange from a high of 49 percent in Yolo, Calif., to a low of 34 percent inJacksonville, N.C. Bank loans made by reporting banks to businesses in theLMI communities as a percentage of the total amount of bank loans made
Stumbling Blocks to Entrepreneurship in Low- and Moderate-Income Communities 97

in these MSAs varies even more widely—the mean is 23 percent, and thestandard deviation is 0.10 percent. These figures range from a high of 54percent in Des Moines, Iowa, to a low of 0.2 percent in Dover, Del. Inter-estingly, the mean share of loans made to businesses in LMI communitiesis substantially lower than the mean of the LMI population as a share of thetotal population. Indeed, it is more than 40 percent lower.
When one focuses on just low-income (LI) communities, one finds thatthe share of the total population in MSAs accounted for by the LI segmentranges from a high of 32 percent in Yolo, Calif., to a low of 16 percent inJacksonville, N.C. The mean is 23 percent, and the standard deviation is0.03 percent. At the same time, the share of the total amount of loans madeby reporting banks to businesses in LI communities ranges from a high of28 percent in Sioux City, Iowa-Neb. to a low of 0 percent in each of 45MSAs. The mean share of loans made to businesses in LI communities is amere 6 percent (in other words, 75 percent lower than the mean of the LIpopulation as a share of the total population), and the standard deviation is0.05 percent—the latter figure quite lower than the variation of the share ofloans made to businesses in LMI communities.
The idea of parity between share of population and share of business activityis one which seems to hold appeal for some commentators on entrepreneurship,particularly with respect to entrepreneurship in minority populations. This canbe seen in The State of Minority Business (Minority Business DevelopmentAgency, 2001), which notes that “minority-owned business activity…continuesto be significantly smaller than minority representation of the nation’s popula-tion.” It describes this deviation from parity, moreover, as an “opportunity gap.”In the next section, we construct a measure that reflects this view—perhapsnaïve to an economist—of the relationship between share of population andshare of business activity, the latter taken here to be business loans from banksreporting under CRA.
In this naïve view, the ideal world is one in which the shares of the totalamount of loans made to businesses in the LMI communities in each andevery MSA would match one-for-one the shares of the total population inthe MSAs accounted for by LMI individuals. The world is far from perfect
98 James R. Barth, Glenn Yago, and Betsy Zeidman

based upon such a view. The difference between the LMI share of popula-tion and share of loans made to businesses in LMI communities varies froma high of 42 percentage points for Dover, Del. (an MSA with 42 percentLMI individuals and 0 percent of total loans going to businesses in LMIcommunities), to a low of -18 percentage points for Des Moines, Iowa (anMSA with 36 percent LMI individuals and 54 percent of total loans goingto businesses in LMI communities). Moreover, there are only 19 MSAs outof a total of 280 for which we have data (only 7 percent) where the differ-ence is zero or less. The difference between the LI share of population andshare of loans to businesses in LI communities varies from a high of 31percentage points for Yolo, Calif. (an MSA with 31 percent LI individualsand 0 percent of total loans going to businesses in LMI communities), to alow of -5 percentage points for Sioux City, Iowa-Neb. (an MSA with 22percent LI individuals and 27 percent of total loans going to businesses inLI communities).
Table 3 shows the pairwise correlations between the LI and LMI sharesof population and the LI and LMI shares of loans, both in terms of numbersand amounts. The LI share of the population is correlated significantly andpositively with the LI shares of numbers and amounts of loans. The corre-lations, however, are quite low. With regard to the LMI share of populationand the LMI share of loans, either in terms of numbers or amounts, thecorrelation is also positive and significant, although quite low. According tothe naïve view described previously, all the correlations would have beenpositive and one.
A measure of LMI ‘loan bias’
Another way to view the data in the previous section is in terms of an LIand LMI community “loan bias” based on the naïve view of an ideal worldnoted previously, where the share of total loans to businesses in LI/LMIcommunities would be equal to the share of the total population that iscomprised by LI/LMI individuals for each and every MSA. We choose to usethe term “loan bias” not in a pejorative sense but, rather, to demonstrate thatwhat initially may appear to be a bias to some may require closer inspectionto determine whether this is indeed the case. Appendix 1 presents a measure
Stumbling Blocks to Entrepreneurship in Low- and Moderate-Income Communities 99

LI S
hare
LI S
hare
LI S
hare
LMI S
hare
LMI S
hare
LMI S
hare
LM
I Loa
nLM
I Loa
nLI
Loa
nLI
Loa
nLM
I Loa
nLM
I Loa
n LI
Loa
nLI
Loa
nof
of L
oan
of L
oan
ofof
Loa
nof
Loa
nBi
as (N
umbe
rBi
as (A
mou
ntBi
as (N
umbe
rBi
as (A
mou
ntBi
as (N
umbe
rBi
as (A
mou
ntBi
as (A
mou
ntBi
as (N
umbe
rPo
pulat
ion
Num
ber
Amou
ntPo
pulat
ion
Num
ber
Amou
ntof
Loa
ns/
of L
oans
/of
Loa
ns/
of L
oans
/of
Loa
ns/
of L
oans
/of
Loa
ns/
of L
oans
/Po
pulat
ion)
Popu
latio
n)Po
pulat
ion)
Popu
latio
n)In
com
e)In
com
e)In
com
e)In
com
e)LI
Sha
re of
Pop
ulati
on1
LI S
hare
of
Loan
Num
ber
0.17
***
1
LI S
hare
of
Loan
Am
ount
0.15
**0.
92**
*1
LMI S
hare
of P
opul
ation
0.45
***
0.1
0.1
1
LMI S
hare
of L
oan
Num
ber
0.17
***
0.37
***
0.35
***
0.11
*1
LMI S
hare
of L
oan
Amou
nt0.
15**
0.35
***
0.39
***
0.11
*0.
93**
*1
LMI L
oan
Bias
(Num
ber o
f Loa
ns/
Popu
latio
n)- 0
.1*
- 0.3
5***
- 0.3
4***
0.05
- 0.9
8***
- 0.9
1***
1
LMI L
oan
Bias
(Am
ount
of L
oans
/Po
pulat
ion)
- 0.0
8- 0
.33*
**- 0
.37*
**0.
05- 0
.91*
**- 0
.99*
**0.
93**
*1
LI L
oan
Bias
(Num
ber o
f Loa
ns/
Popu
latio
n)- 0
.04
- 0.9
8***
- 0.9
2***
- 0.0
5- 0
.36*
**- 0
.34*
**0.
35**
*0.
33**
*1
LI L
oan
Bias
(Am
ount
of L
oans
/Po
pulat
ion)
- 0.0
2- 0
.9**
*- 0
.98*
**- 0
.05
- 0.3
4***
- 0.3
8***
0.33
***
0.37
***
0.92
***
1
Tabl
e 3
Pair
wis
e C
orre
latio
ns
100 James R. Barth, Glenn Yago, and Betsy Zeidman

Tabl
e 3
(con
t.)
Stumbling Blocks to Entrepreneurship in Low- and Moderate-Income Communities 101
LI S
hare
LI S
hare
LI S
hare
LMI S
hare
LMI S
hare
LMI S
hare
LM
I Loa
nLM
I Loa
nLI
Loa
nLI
Loa
nLM
I Loa
nLM
I Loa
n LI
Loa
nLI
Loa
nof
of L
oan
of L
oan
ofof
Loa
nof
Loa
nBi
as (N
umbe
rBi
as (A
mou
ntBi
as (N
umbe
rBi
as (A
mou
ntBi
as (N
umbe
rBi
as (A
mou
ntBi
as (A
mou
ntBi
as (N
umbe
rPo
pulat
ion
Num
ber
Amou
ntPo
pulat
ion
Num
ber
Amou
ntof
Loa
ns/
of L
oans
/of
Loa
ns/
of L
oans
/of
Loa
ns/
of L
oans
/of
Loa
ns/
of L
oans
/Po
pulat
ion)
Popu
latio
n)Po
pulat
ion)
Popu
latio
n)In
com
e)In
com
e)In
com
e)In
com
e)LM
I Loa
n Bi
as (N
umbe
r of L
oans
/In
com
e)- 0
.13*
*- 0
.27*
**- 0
.26*
**0.
03- 0
.81*
**- 0
.75*
**0.
82**
*0.
76**
*0.
26**
*0.
24**
*1
LMI L
oan
Bias
(Am
ount
of L
oans
/In
com
e)- 0
.11*
- 0.2
5***
- 0.2
9***
0.03
- 0.7
6***
- 0.8
2***
0.77
***
0.84
***
0.24
***
0.28
***
0.95
***
1
LI L
oan
Bias
(Am
ount
of L
oans
/In
com
e)- 0
.01
- 0.8
7***
- 0.9
6***
- 0.0
8- 0
.33*
**- 0
.37*
**0.
32**
*0.
36**
*0.
9***
0.98
***
0.25
***
0.29
***
1
LI L
oan
Bias
(Num
ber o
f Loa
ns/
Inco
me)
- 0.0
2- 0
.96*
**- 0
.9**
*- 0
.09
- 0.3
6***
- 0.3
4***
0.35
***
0.33
***
0.98
***
0.91
***
0.27
***
0.26
***
0.92
***
1
Bran
ches
0.01
0.01
0.01
0.07
0.07
0.06
- 0.0
6- 0
.05
- 0.0
1- 0
.01
- 0.0
2- 0
.01
00

of the LI and LMI loan bias for each of the MSAs. It is calculated as 1 minusthe ratio of the LI/LMI share of the total amount of loans in an MSA to theLI/LMI share of the total population in that MSA. A value of 0 would indi-cate no loan bias, while a value of 1 would indicate maximum loan bias. TheLI loan bias ranges from 1 to -0.26. Forty-three MSAs have an LI score of 1,meaning businesses in the LI communities received none of the loans banksmade under CRA in these MSAs. Four MSAs, on the other hand, havescores less than 0, meaning businesses in the LI communities received alarger percentage of the total amount of loans made in these MSAs than theLI share of total population. The degree of LMI loan bias is only marginallybetter. While no MSA has a score of 1, many, nonetheless, have relativelyhigh scores. Twenty MSAs have LMI loan bias scores of 0.75 or more. Thismeans that for businesses in the LMI communities, their share of the totalloans to all businesses in these MSAs is less than one-fourth of the LMIcommunities’ share of the total population.
Table 3 indicates that the LI share of the population of an MSA is notcorrelated with LI loan bias, whereas LI share of the amount of loans iscorrelated significantly and negatively with LI loan bias. The same resultshold for the correlations involving LMI shares. This means that loan bias isless with a greater share of loans to businesses in LI/LMI communities butis not related to the share of the population comprised by LI/LMI individ-uals. Interestingly, the table also shows that the number of branches perfinancial institution is correlated significantly and negatively with LMI loanbias but not correlated with LI loan bias. Thus, for LMI loan bias, thedegree of financial development in the MSA, as measured by branches perinstitution, matters.
The measure of LMI loan bias obviously is based upon a naïve view of theworld and, thus, simply a statistical construct. Yet, as seen previously, sucha naïve view may not be uninfluential, and our construct, therefore, may beuseful as a sort of benchmark by which to try to understand the reasons forthe substantial variation in the distributions of LMI loans and LMI popu-lations across MSAs. Since the measure reflects smaller loans to businessesby reporting banks, it is clear that businesses in LMI communities in some
102 James R. Barth, Glenn Yago, and Betsy Zeidman

MSAs receive a substantial portion of the total smaller loans to all businessesin these MSAs compared to the LMI communities’ share of the total popu-lation. Businesses located in still other LMI communities fare far worse inthis respect, however. Whether these differences in loan bias across thevarious MSAs can be explained fully by focusing on the world of econom-ics is the issue to which we turn next. For in free and competitive markets,one would expect differences in loan bias across regions, but differences thatreflect economic factors, like the creditworthiness of businesses.
We now consider a slightly less naïve view of the world in which dispro-portionately fewer funds may flow to businesses in LMI communities inpart because the incomes in those areas also are disproportionately lowerthan in other areas of MSAs. We, therefore, recalculated our measure ofloan bias, but this time, we based it on income rather than population.Specifically, this measure of loan bias is calculated as 1 minus the ratio ofthe LI/LMI share of the total amount of loans to businesses in an MSA tothe LI/LMI community share of the total income of that MSA. Interest-ingly, the LI and LMI loan bias measures based upon population arecorrelated positively and significantly with the same two respective loan biasmeasures when based upon income, with correlations of 0.98 and 0.84,respectively. However, the average LI/LMI loan bias figure based uponpopulation is 0.75/0.41, whereas the average LI/LMI loan bias figure basedupon income is -0.22/-0.85. This means that when one calculates the loanbias based upon population, the share of total loans made to businesses inLI/LMI communities, on average, is less than the LI/LMI community shareof total population in the 275 MSAs. But, when one calculates loan biasbased upon income, the share of the total amount of loans made to busi-nesses, on average, is greater than the LI/LMI community share of totalincome in the MSAs. Yet, beyond the averages, one still finds that 51percent of the LI communities and 13 percent of the LMI communitieshave positive loan bias figures based upon income. This exercise suggeststhat, to the extent that income of an area correlates with the amount ofloans to businesses one might expect to be made, economic factors indeeddo help explain the reason more funds flow to some areas as compared toothers within MSAs.
Stumbling Blocks to Entrepreneurship in Low- and Moderate-Income Communities 103

104 James R. Barth, Glenn Yago, and Betsy Zeidman
Clearly, the naïve view of the world reflected in the ideal of parity and of“opportunity gaps” is not compelling insofar as when one considers justincome (ignoring other factors, such as the presence of collateral, that mayaffect lending decisions), much of the loan bias we noted above disappears.Yet, there still remains substantial variation in the income-based measure ofloan bias, and an assessment of the reasons for this variation may be a fruit-ful subject for future work. In any event, whether these measures of loan biashave any explanatory power in explaining the number and size compositionof establishments in LMI communities within MSAs is assessed below.
Selected databases and studies of entrepreneurship
There is a rapidly growing literature pertaining to entrepreneurship. Thefocus here is on selected empirical studies that examine why some individ-uals become entrepreneurs, while others do not. The focus is also on studiesthat examine factors that explain the entrepreneurial process of starting orowning a small business or becoming self-employed. Given our interest inmainly empirical studies rather than theoretical studies, it seems useful tobegin with a brief overview of the different datasets that are typically usedby researchers when studying entrepreneurship.
Table 4 provides information on what seem to be the most widely used data-bases for studies focusing on the United States. The table shows that there aresubstantial differences in the datasets in terms of the issues that can be exam-ined. Some are longitudinal datasets that allow researchers to study the sameindividuals or cohorts of the same individuals over time to determine the factorsthat help explain why some individuals choose self-employment over paidemployment. Others allow researchers to focus on examining new businessstartups over time, or small businesses over time or across geographical regionsrather than the choice individuals make between self-employment and wageand salary work. Despite the different types of studies, all of these studies usuallytry to include as much information as available on the characteristics of the self-employed, the characteristics of business owners, the characteristics of thebusiness, and the sources of funding for becoming self-employed or establishingor owning a business.

Tabl
e 4
Sele
cted
Inf
orm
atio
n on
Dat
abas
es U
sed
in S
tudi
es o
f Ent
repr
eneu
rshi
pStumbling Blocks to Entrepreneurship in Low- and Moderate-Income Communities 105
Dat
a So
urce
Dat
abas
e O
verv
iew
Cha
ract
eris
tics
of B
usin
ess
Ow
ners
Spon
sor
Avai
labi
lity
Earl
iest
Yea
rSu
rvey
Uni
tR
ace/
G
ende
rM
arit
al S
tatu
sA
geEd
ucat
ion
Wor
k Se
lf-an
d Fr
eque
ncy
Ethn
icit
yEx
peri
ence
Empl
oyed
Cha
ract
erist
ics o
f Bus
ines
s U
.S. C
ensu
sAv
aila
ble
onlin
e19
82, e
very
Esta
blish
men
tsN
YY
YY
YY
Ow
ners
(CBO
) Bu
reau
for d
ownl
oad
5 ye
ars,
last
ww
w.c
ensu
s.gov
/csd
/cbo
/or
ord
er C
D
surv
ey fo
r on
line
1992
(now
disc
ontin
ued)
Nat
iona
l Lon
gitu
dina
l U
.S. D
epar
tmen
t D
ata
avai
labl
e 19
69, 1
979,
199
7Ag
e an
d ge
nder
YY
YY
YY
YSu
rvey
s (N
LS)
of L
abor
onlin
e fo
r fre
e,co
hort
ssta
ts.bl
s.gov
/nls
or o
rder
ed o
n C
D
for s
mal
l fee
Ven
ture
One
V
entu
reO
neBy
subs
crip
tion
1982
, V
entu
re-b
acke
d N
YN
NN
YN
ww
w.v
entu
reon
e.co
mon
lyqu
arte
rlyfir
ms
Surv
ey o
f Inc
ome
and
U.S
. Cen
sus
Dat
a av
aila
ble
1984
, fre
quen
cyAl
l hou
seho
ldY
YY
YY
YY
Prog
ram
Par
ticip
atio
n (S
IPP)
Bure
aufo
r dow
nloa
dva
ries
mem
bers
15+
w
ww
.sipp
.cen
sus.g
ov/si
ppfre
e on
Web
site
year
s old
Non
-Em
ploy
er S
tatis
tics
U.S
. Cen
sus
Dat
a av
aila
ble
1997
, ann
ual
Firm
s with
no
NN
NN
NN
Yw
ww
.cen
sus.g
ov/e
pcd/
Bure
aufo
r dow
nloa
dem
ploy
ees,
$1,0
00+
none
mpl
oyer
free
on W
eb si
tesa
les,
file
sche
dule
C
(106
5, 1
120
serie
s)
Nat
iona
l Fed
erat
ion
NFI
BN
ot a
vaila
ble
1973
, qua
rter
ly
Mem
bers
of N
FIB
NN
NN
NN
Yof
Inde
pend
ent B
usin
ess
to p
ublic
an
d m
onth
lyor
gani
zatio
n on
ly(N
FIB)
ww
w.n
fib.c
om(6
00,0
00 m
embe
rs)
Surv
ey o
f Min
ority
-Ow
ned
U.S
. Cen
sus
Free
onl
ine
1992
, eve
ryFi
rms a
ndY
YN
NN
NY
Busin
ess E
nter
prise
s
Bure
au5
year
s;es
tabl
ishm
ents
(SM
OBE
)be
cam
e SB
O
ww
w.c
ensu
s.gov
/csd
/mw
baf
ter 1
997
Surv
ey o
f Sm
all
Fede
ral R
eser
veFr
ee o
nlin
e;19
87, a
bout
eve
ry
Firm
s with
few
erY
YN
YY
YY
Busin
ess F
inan
ces (
SSBF
) an
d Sm
all
2003
5 ye
ars (
1987
,th
an 5
00fe
dera
lrese
rve.
gov/
pubs
/oss/
Busin
ess
not a
vaila
ble
as o
f19
93, 1
998,
fu
ll-tim
e em
ploy
ees
oss3
/nssb
ftoc.
htm
Adm
inist
ratio
nAp
ril 2
006
2003

106 James R. Barth, Glenn Yago, and Betsy Zeidman
Tabl
e 4
(con
t.)D
ata
Sour
ceD
atab
ase
Ove
rvie
wC
hara
cter
isti
cs o
f Bus
ines
s O
wne
rs
Spon
sor
Avai
labi
lity
Earl
iest
Yea
rSu
rvey
Uni
tR
ace/
G
ende
rM
arit
al S
tatu
sA
geEd
ucat
ion
Wor
k Se
lf-
and
Freq
uenc
yEt
hnic
ity
Expe
rien
ceEm
ploy
ed
Dun
and
D
un a
ndFo
r pur
chas
e—18
41; 1
969
Com
pany
Y - i
f offe
red
Y - i
f offe
red
NY
- if o
ffere
dY
- if o
ffere
dY
- if o
ffere
dY
Brad
stree
t Br
adstr
eet
base
d on
the
elec
tron
ic re
cord
s,by
ow
ner
by o
wne
rby
ow
ner
by o
wne
rby
ow
ner
(D&
B)
num
ber o
fm
onth
lyw
ww
.dnb
.com
reco
rds
Com
mun
ity
Fede
ral F
inan
cial
Free
onl
ine—
1996
, ann
ual
Stat
e ba
nks,
NN
NN
NN
NR
einv
estm
ent A
ct
Insti
tutio
nsda
ta a
ggre
gate
dna
tiona
l ban
ks,
(CR
A)
Exam
inat
ion
by c
ensu
san
d la
rge
ww
w.ff
iec.
gov
Cou
ncil
trac
t lev
elsa
ving
ass
ocia
tions
($
250+
mill
ion)
Surv
ey o
f Bus
ines
s Ow
ners
U
.S. C
ensu
s Bur
eau
Part
ial r
epor
t 20
02; s
uper
cede
dPr
oprie
tors
hips
,Y
YN
YY
NY
and
Self-
Empl
oyed
Per
sons
av
aila
ble
onlin
e,
SMO
BE, e
very
part
ners
hips
, (S
BO)
com
plet
e re
leas
e5
year
sco
rpor
atio
ns w
ithw
ww
.cen
sus.g
ov/c
sd/sb
oin
200
6re
ceip
ts of
$1,
000+
Pane
l Stu
dy o
f D
epar
tmen
t of
Avai
labl
e fo
r19
688,
000
YY
YY
YY
YIn
com
e D
ynam
ics (
PSID
) C
omm
erce
and
do
wnl
oad
U.S
. hou
seho
lds
psid
onlin
e.isr
.um
ich.
edu/
Uni
vers
ity o
f Mic
higa
n fre
e on
line
Surv
ey o
f Con
sum
er
Fede
ral R
eser
veAv
aila
ble
for
1983
, eve
ry th
ree
4,50
0 U
.S. f
amili
es
YY
YY
YY
YFi
nanc
es (C
SF)
Boar
ddo
wnl
oad
free
year
sw
ww
.fede
ralre
serv
e.go
v/on
line
pubs
/oss/
oss2
/scfin
dex.
htm
l
Busin
ess I
nfor
mat
ion
U.S
. Cen
sus B
urea
uAv
aila
ble
for
1988
, ann
ual
Esta
blish
men
tsN
NN
NN
NY
Tra
ckin
g Se
ries (
BIT
S)do
wnl
oad
(long
itudi
nal)
free
onlin
e
Pane
l Stu
dy o
f U
nive
rsity
of
Avai
labl
e fo
r 19
98 o
nly
U.S
. adu
ltsY
YY
YY
YY
Entr
epre
neur
ial D
ynam
ics
Mic
higa
n an
ddo
wnl
oad
(PSE
D)
K
auffm
an C
ente
rfre
e on
line
ww
w.p
sed.
isr.u
mic
h.ed
u

Tabl
e 4
(con
t.)
Stumbling Blocks to Entrepreneurship in Low- and Moderate-Income Communities 107
Dat
a So
urce
Cha
ract
eris
tics
of B
usin
esse
sSo
urce
s of
Fun
ding
Geo
grap
hic
Age
of
Empl
oym
ent
Fina
ncia
lSt
artu
pLo
ans
(pub
lic,
Vent
ure
Cap
ital
Loca
tion
Bus
ines
sSi
zeIn
form
atio
nC
apit
alpr
ivat
e)
Cha
ract
erist
ics o
f Bus
ines
s Ow
ners
(CBO
) w
ww
.cen
sus.g
ov/c
sd/c
bo/
YY
YR
ecei
pts a
nd p
rofit
s Y
YY
Nat
iona
l Lon
gitu
dina
l Sur
veys
(NLS
)
sta
ts.bl
s.gov
/nls
Y - r
egio
ns o
nly
YN
NN
NN
Ven
ture
One
ww
w.v
entu
reon
e.co
mY
- city
leve
lY
YY
NY
Surv
ey o
f Inc
ome
and
Prog
ram
Pa
rtic
ipat
ion
(SIP
P)
w
ww
.sipp
.cen
sus.g
ov/si
ppY
- met
ro a
nd st
ate
leve
lsN
YN
NN
N
Non
-Em
ploy
er S
tatis
tics
ww
w.c
ensu
s.gov
/epc
d/no
nem
ploy
er
Y - M
SA, c
ount
y, st
ate
leve
lsN
YY
- rec
eipt
s and
pay
roll
NN
N
Nat
iona
l Fed
erat
ion
of
Inde
pend
ent B
usin
ess (
NFI
B)w
ww
.nfib
.com
YY
YY
NY
N
Surv
ey o
f Min
ority
-Ow
ned
Busin
ess
Ente
rpris
es (S
MO
BE)
ww
w.c
ensu
s.gov
/csd
/mw
bY
- sta
te, c
ount
y, M
SA, o
r city
NY
Y - s
ales
and
pay
roll
NN
N
Surv
ey o
f Sm
all B
usin
ess
Fina
nces
(SSB
F)
fede
ralre
serv
e.go
v/pu
bs/o
ss/os
s3/n
ssbfto
c.ht
mY
YY
YY
YY
Dun
and
Bra
dstr
eet (
D&
B)
w
ww
.dnb
.com
YY
YY
NN
N
Com
mun
ity R
einv
estm
ent A
ct (C
RA)
ww
w.ff
iec.
gov
Y - s
tate
, cou
nty,
and
MSA
NN
Y - c
ensu
s tra
ctN
YN

108 James R. Barth, Glenn Yago, and Betsy ZeidmanTa
ble
4 (c
ont.)
Dat
a So
urce
Cha
ract
eris
tics
of B
usin
esse
sSo
urce
s of
Fun
ding
Geo
grap
hic
Age
of
Empl
oym
ent
Fina
ncia
lSt
artu
pLo
ans
(pub
lic,
Vent
ure
Cap
ital
Loca
tion
Bus
ines
sSi
zeIn
form
atio
nC
apit
alpr
ivat
e)
Su
rvey
of B
usin
ess O
wne
rs a
nd
Self-
Empl
oyed
Per
sons
(SBO
) w
ww
.cen
sus.g
ov/c
sd/sb
oY
YY
Y - s
ales
YY
Y
Pane
l Stu
dy o
f Inc
ome
Dyn
amic
s (PS
ID)
psid
onlin
e.isr
.um
ich.
edu/
YY
NN
NN
N
Surv
ey o
f Con
sum
er F
inan
ces (
CSF
) w
ww
.fede
ralre
serv
e.go
v/pu
bs/o
ss/o
ss2/sc
finde
x.ht
ml
NY
YY
- net
inco
me
and
sale
sY
YY
Busin
ess I
nfor
mat
ion
Tra
ckin
g Se
ries (
BIT
S)Y
NY
YN
NN
Pane
l Stu
dy o
f Ent
repr
eneu
rial
Dyn
amic
s (PS
ED)
YY
YY
YY
Yw
ww
.pse
d.isr
.um
ich.
edu

Table 4 shows that it is quite difficult to compare the results of studiesusing these different datasets. Apart from trying to explain different meas-ures of entrepreneurship, the various factors that one can control for in anysingle study clearly are constrained by the dataset that is chosen. Thus,different studies using different datasets necessarily cannot control for acommon and broad set of factors that might better enable one to explainwhatever measure of entrepreneurship that is employed. Yet, the omissionof any important factors may bias whatever results one obtains from a singledataset. This is not to disparage the considerable and costly efforts tocompile all these datasets. Instead, the point is that more effort should bemade to reach a consensus on what information contained in the differentdatasets can be combined and what additional information is needed toanswer the pressing issues about how policymakers can decide upon the bestactions to take to promote entrepreneurship.
To illustrate the importance of the use of different datasets, in trying to reacha discussion on what works best to promote entrepreneurship, Table 5provides information about several studies that have employed some of thedatasets in Table 4. There are several comments based upon these studies. First,Blanchflower and Oswald (1998) and Holtz-Eakin, Joulfarian, and Rosan(1994a, b) find that liquidity constraints are a barrier to entrepreneurship,whereas Vos, Yeh, Carter, and Tagg (2005); Hurst and Lusardi (2003); andMoore (2004) do not. Second, Mitchell and Pearce (2005) find there is prej-udicial loan discrimination against African-American and Hispanic owners ofsmall businesses, whereas Bostic and Lampani (1999) find loan racial disparityfor African-American-owned but not Hispanic-owned businesses, and Meyer(1990) finds that liquidity constraints do not seem to explain the low African-American self-employment rate. Third, Puri and Robinson (2004) find thatentrepreneurs differ from nonentrepreneurs insofar as being innately moreoptimistic and risk-loving, whereas Guiso and Schivardi (2004) argue thatentrepreneurship can be acquired through learning, irrespective of such differ-ences in attitudes. Fourth, Black and Strahan (2002) find that more bankbranches and greater consolidation in the banking industry foster entrepre-neurship, whereas Mitchell and Pearce (2005) argue that the move by largerbanks to transactional lending through credit scores and “harder” informationmay lead to greater loan discrimination against small businesses. Fifth,
Stumbling Blocks to Entrepreneurship in Low- and Moderate-Income Communities 109

110 James R. Barth, Glenn Yago, and Betsy Zeidman
Aut
hor(
s)Pu
rpos
eEn
trep
rene
uria
l Foc
usD
ata
Res
ults
Polic
y Im
plic
atio
nsB
arth
, Cor
des,
E
stim
ate
the
bene
fits
and
cost
s In
divi
dual
bor
row
ers,
incl
udin
g bo
thIn
divi
dual
per
sona
l loa
nR
estr
icti
ng t
he u
se o
f cr
edit
or r
emed
ies
Cre
dito
r re
med
ies
and
Yeze
r (19
86)
of re
stric
ting
cred
itor r
emed
ies
self-
empl
oyed
and
non
self-
empl
oyed
.tr
ansa
ctio
ns fr
om n
atio
nal
does
not
con
fer n
et b
enef
its o
n th
e af
fect
acc
ess t
o cr
edit
to lo
ans.
on p
erso
nal l
oan
tran
sact
ions
.co
nsum
er fi
nanc
e co
mpa
nies
ty
pica
l bor
row
er b
ut, r
athe
r, im
pose
s op
erat
ing
in 4
5 sta
tes.
net c
osts.
Barth
, Got
ur, M
anag
e,Ex
amin
es th
e ef
fect
of s
elec
ted
Indi
vidu
al b
orro
wer
s, in
clud
ing
both
Indi
vidu
al p
erso
nal l
oan
Borr
ower
cha
ract
erist
ics,
colla
tera
l,Le
gal a
nd re
gula
tory
var
iabl
es c
an
and
Yeze
r (19
83)
gove
rnm
ent r
egul
atio
ns o
n a
self-
empl
oyed
and
non
self-
empl
oyed
.tr
ansa
ctio
ns fr
om n
atio
nal
and
cred
itor r
emed
ies a
ll m
atte
r in
affe
ct a
cces
s to
cred
it.hi
gh-r
isk p
erso
nal l
oan
mar
ket.
cons
umer
fina
nce
com
pani
es
the
pric
e an
d lo
an a
mou
nt g
rant
ed.
oper
atin
g in
45
state
s.
Berg
er a
nd U
dell
Exam
ine
the
role
of r
elat
ions
hip
Smal
l, un
trad
ed fi
rms.
Nat
iona
l Sur
vey
of S
mal
l Bus
ines
s Bo
rrow
ers w
ith lo
nger
ban
king
Bank
-bor
row
er re
latio
nshi
p is
likel
y (1
994)
lend
ing,
esp
ecia
lly p
rice
and
Fina
nces
(198
8-89
).re
latio
nshi
ps te
nd to
pay
low
er in
tere
stto
be
an im
port
ant m
echa
nism
for
nonp
rice
term
s of c
omm
erci
al
rate
s and
are
less
like
ly to
ple
dge
colla
tera
l.so
lvin
g as
ymm
etric
info
rmat
ion
bank
line
s of c
redi
t ext
ende
d to
pr
oble
ms a
ssoc
iate
d w
ith sm
all
smal
l firm
s.bu
sines
ses.
Blac
k an
d St
raha
nT
est w
heth
er m
ore
com
petit
ion
and
Entr
epre
neur
ial a
ctiv
ity is
mea
sure
d as
the
1976
-199
4, D
un a
nd B
rads
tree
t.R
ate
of n
ew in
corp
orat
ions
incr
ease
s M
ore
com
petit
ion
thro
ugh
bran
chin
g (2
002)
cons
olid
atio
n in
the
bank
ing
sect
or
log
of n
ew b
usin
ess i
ncor
pora
tions
fo
llow
ing
dere
gula
tion
of b
ranc
hing
and
an
d gr
eate
r con
solid
atio
nhe
lps o
r hin
ders
ent
repr
eneu
rshi
p pe
r cap
ita d
urin
g a
year
.in
crea
ses a
s the
dep
osit
shar
e of
smal
l he
lps e
ntre
pren
eurs
hip.
by li
miti
ng th
e av
aila
bilit
y of
cre
dit
bank
s dec
lines
.to
smal
l and
you
ng fi
rms.
Blan
chflo
wer
and
Ex
plor
e th
e fa
ctor
s tha
t may
be
Self-
empl
oyed
.Br
itish
long
itudi
nal d
ata
on c
hild
ren
The
rece
ipt o
f an
inhe
ritan
ce o
r gift
seem
sPo
tent
ial e
ntre
pren
eurs
face
Osw
ald
(199
8)im
port
ant i
n de
term
inin
g w
ho
born
in 1
958
and
follo
wed
thro
ugh
to in
crea
se a
typi
cal i
ndiv
idua
l's p
roba
bilit
ybo
rrow
ing
cons
trai
nts.
beco
mes
and
rem
ains a
n en
trepr
eneu
r.19
91, a
mon
g ot
her d
ata.
of b
eing
self-
empl
oyed
. Also
, inf
orm
atio
nin
dica
tes i
ndiv
idua
ls pr
efer
to b
e se
lf-em
ploy
ed b
ut la
ck c
apita
l and
mon
ey.
Bosti
c an
d Ex
amin
es w
heth
er sm
all b
usin
esse
s'Bu
sines
ses w
ith fe
wer
19
93 N
atio
nal S
urve
y of
Sm
all
No
statis
tical
ly si
gnifi
cant
diff
eren
ces i
n th
eEc
onom
ics a
nd d
emog
raph
icLa
mpa
ni (1
999)
loca
l geo
grap
hy h
as b
een
omitt
edth
an 5
00 e
mpl
oyee
s.Bu
sines
s Fin
ance
. ap
prov
al ra
tes b
etw
een
whi
te-o
wne
d fir
ms
char
acte
ristic
s of a
firm
's lo
cal
inap
porp
riate
ly fr
om a
naly
ses o
fan
d fir
ms o
wne
d by
Asia
ns, H
ispan
ics,
and
geog
raph
y sh
ould
be
cons
ider
ed in
diffe
renc
es in
the
cred
it m
arke
t w
omen
, but
diff
eren
ces e
xist
betw
een
orde
r to
unde
rsta
nd ra
cial
disp
ariti
esex
perie
nces
of w
hite
-ow
ned
whi
te-o
wne
d an
d bl
ack-
owne
d fir
ms.
of sm
all b
usin
ess f
inan
ce.
and
min
ority
-ow
ned
firm
s.
Tabl
e 5
Stud
ies
Exam
inin
g D
iffer
ent L
evel
s of
Ent
repr
eneu
rial
Act
ivit
y ov
er T
ime
and
Geo
grap
hica
l Are
as

Stumbling Blocks to Entrepreneurship in Low- and Moderate-Income Communities 111
Aut
hor(
s)Pu
rpos
eEn
trep
rene
uria
l Foc
usD
ata
Res
ults
Polic
y Im
plic
atio
ns
Bre
voor
t an
d E
xam
ine
the
rela
tion
ship
bet
wee
n Sm
all b
usin
esse
s.C
RA
ann
ual d
ata
from
199
7 to
200
1.D
ista
nce
is a
ssoc
iate
d ne
gati
vely
wit
h th
eD
ista
nce
may
be
of in
crea
sing
Han
nan
(200
4)di
stan
ce a
nd c
omm
erci
al le
ndin
g lik
elih
ood
of a
loca
l com
mer
cial
loan
bei
ngim
port
ance
in lo
cal m
arke
t le
ndin
g.an
d ho
w it
has
evo
lved
ove
r ti
me.
mad
e an
d th
at t
he d
eter
rent
eff
ect
of
dist
ance
is c
onsi
sten
tly m
ore
impo
rtan
t th
e sm
alle
r th
e ba
nk.
Cav
allu
zzo
and
Exa
min
e th
e im
pact
of
pers
onal
Bus
ines
ses
wit
h fe
wer
19
98 S
urve
y of
Sm
all B
usin
ess
Subs
tant
ial u
nexp
lain
ed d
iffer
ence
s in
den
ial
Rac
ial d
ispa
riti
es e
xist
eve
n af
ter
Wol
ken
(200
2)w
ealth
on
smal
l bus
ines
s lo
an
than
500
em
ploy
ees.
Fina
nces
, Dun
and
Bra
dstr
eet,
rate
s be
twee
n A
fric
an-A
mer
ican
-,co
ntro
lling
for
var
ious
con
stra
ints
.tu
rndo
wns
acr
oss
and
Fede
ral R
eser
ve S
yste
m d
ata
His
pani
c-, A
sian
-, a
nd w
hite
-ow
ned
firm
s.de
mog
raph
ic g
roup
s.G
reat
er p
erso
nal w
ealth
is a
ssoc
iate
d w
ith
low
er p
roba
bilty
of
loan
den
ial.
DeY
oung
, E
xam
ine
how
incr
ease
dSm
all b
usin
ess
loan
s m
ade
toR
ando
m s
ampl
e of
35,
999
On
aver
age,
lend
ers
that
use
cre
dit
scor
ing
Mor
e ge
nero
us g
over
nmen
t lo
anG
lenn
on, a
nd
borr
ower
-len
der
dist
ance
firm
s un
der
SBA
7(a
)SB
A 7
(a)
guar
ante
edm
odel
s ex
peri
ence
hig
her
defa
ult
rate
sgu
aran
tees
may
not
gen
erat
e N
igro
(20
04)
wor
sens
the
per
form
ance
of
loan
pro
gram
.lo
ans
orig
inat
ed b
y 5,
552
than
tho
se t
hat
do n
ot. L
oan
defa
ults
de
sire
d re
sults
.sm
all b
usin
ess
loan
s, a
nd h
owqu
alifi
ed S
BA
pro
gram
incr
ease
wit
h bo
rrow
er-l
ende
r di
stan
ce,
new
lend
ing
tech
nolo
gies
and
le
nder
s be
twee
n 19
83 a
nd 2
001.
and
high
er lo
an g
uara
ntee
s ar
e as
soci
ated
exis
ting
gov
ernm
ent
subs
idie
s w
ith
high
er d
efau
lt ra
tes.
may
mit
igat
e or
exa
cerb
ate
thes
e ef
fect
s.
Dun
n an
d E
xam
ine
the
impa
cts
of in
divi
dual
'sSe
lf-em
ploy
ed.
Nat
iona
l Lon
gitu
dina
l Sur
veys
.T
he f
inan
cial
ass
ets
of y
oung
men
exe
rt a
T
hese
dat
a su
gges
t st
rong
rol
es f
orH
oltz
-Eak
in (
2000
)ow
n w
ealth
and
hum
an c
apit
al, a
nd
Spec
ifica
lly, s
ampl
es o
f yo
ung
men
stat
isti
cally
sig
nific
ant
but
quan
tita
tive
ly
fam
ily-s
peci
fic c
apit
al a
nd
pare
ntal
wea
lth, a
nd s
elf-
empl
oym
ent
who
wer
e ag
e 14
-24
in 1
966,
mat
ure
mod
est
effe
ct o
n th
e tr
ansi
tion
into
tran
smis
sion
of
thes
e sk
ills
wit
hin
expe
rien
ce o
n th
e pr
obab
ility
tha
t an
w
omen
who
wer
e ag
e 30
-44
in 1
967,
self-
empl
oym
ent.
Usi
ng t
his
as o
ur m
etic
,fa
mili
es in
enh
anci
ng t
he p
roba
bilit
yin
divi
dual
tra
nsit
s fr
om w
age/
and
olde
r m
en w
ho w
ere
age
45-5
9w
e fin
d a
rela
tive
ly s
mal
l im
pact
of
capi
tal
of m
akin
g a
trans
ition
to e
ntre
pren
eurs
hip.
sala
ry t
o se
lf-em
ploy
men
t.in
196
6.m
arke
t co
nstr
aint
s in
the
NLS
.
Evan
s an
d E
xam
ine
the
proc
ess
of s
elec
tion
into
Self-
empl
oyed
.N
atio
nal L
ongi
tudi
nal S
urve
y, s
ampl
ePr
obab
ility
is h
ighe
r of
bei
ng s
elf-
empl
oyed
U
nem
ploy
ed w
orke
rs w
ith
the
poor
est
Leig
hton
(19
89)
self-
empl
oym
ent
over
the
life
cyc
le
of m
en f
ollo
wed
fro
m 1
966
to 1
981.
for
unem
ploy
ed a
nd h
ighl
y ed
ucat
ed, b
utop
port
unit
ies
in t
he w
age
sect
or s
wit
ch
and
the
dete
rmin
ants
of
not
rela
ted
to a
ge o
r ex
peri
ence
for
fir
st
to a
nd r
emai
n in
sel
f-em
ploy
men
t.se
lf-em
ploy
men
t ea
rnin
gs.
20 y
ears
of
expe
rien
ce. A
lso,
ret
urn
to w
age
expe
rien
ce in
sel
f-em
ploy
men
t is
low
er t
han
the
retu
rn t
o w
age
expe
rien
ce in
wag
e w
ork.
Tabl
e 5
(con
t.)

Aut
hor(
s)Pu
rpos
eEn
trep
rene
uria
l Foc
usD
ata
Res
ults
Polic
y Im
plic
atio
ns
Fair
lie (
1999
)E
xam
ine
raci
al p
atte
rns
in
Self-
empl
oyed
.22
yea
rs o
f da
ta f
rom
the
Pan
el S
tudy
Rac
ial d
iffer
ence
s in
ass
et le
vels
and
Exi
stin
g po
licie
s th
at p
rom
ote
min
orit
y tr
ansi
tion
s be
twee
n se
lf-em
ploy
men
tof
Inc
ome
Dyn
amic
s (P
SID
).pr
obab
ilitie
s of
hav
ing
self-
empl
oyed
bu
sine
ss o
wne
rshi
p ne
ed t
o be
mod
ified
an
d w
age/
sala
ry w
ork
amon
g pr
ime-
fath
ers
expl
ain
a la
rge
part
of
the
gap
inor
red
esig
ned
to r
efle
ct t
he r
acia
lag
e m
en.
blac
k/w
hite
ent
ry r
ate,
but
non
e of
the
di
ffer
ence
s in
tra
nsit
ion
rate
s in
to a
nd
gap
in t
he e
xit
rate
.ou
t of
sel
f-em
ploy
men
t.
Fair
lie a
nd
Exa
min
e th
e ca
uses
of
Smal
l bus
ines
ses
base
d on
fili
ng19
92 C
hara
cter
isti
cs o
f Pr
ior
wor
k ex
peri
ence
in a
fam
ily
Mos
t di
sadv
anta
ged
busi
ness
Rob
b (2
003)
inte
rgen
erat
iona
l lin
ks in
bus
ines
s IR
S fo
rm 1
040
sche
dule
C.
Bus
ines
s O
wne
rs.
busi
ness
has
a p
osit
ive
effe
ct o
n bu
sine
ss
deve
lopm
ent
polic
ies
curr
ently
in p
lace
, ow
ners
hip
and
the
rela
ted
issu
e of
ou
tcom
es. A
lso,
inhe
rite
d bu
sine
sses
are
such
as
set-
asid
es a
nd lo
an a
ssis
tanc
e ho
w h
avin
g a
fam
ily b
usin
ess
mor
e su
cces
sful
than
non
inhe
rited
bus
ines
ses.
prog
ram
s, ar
e ta
rget
ed to
war
d al
levi
atin
gba
ckgr
ound
aff
ects
sm
all
finan
cial
con
stra
ints
, not
tow
ard
busi
ness
out
com
es.
prov
idin
g op
port
unit
ies
for
wor
k ex
peri
ence
in s
mal
l bus
ines
s.
Gen
try
and
Exa
min
e th
e im
port
ance
of
savi
ng b
y H
ouse
hold
s re
port
ing
owni
ng
1983
and
198
9 Su
rvey
s of
Ent
repr
eneu
rial
hou
seho
lds
own
a St
udie
s of
the
sav
ing
deci
sion
sH
ubba
rd (
2004
)en
trep
rene
uria
l hou
seho
lds
and
the
one
or m
ore
busi
ness
es w
ith
a C
onsu
mer
Fin
ance
s.su
bsta
ntia
l sha
re o
f ho
useh
old
of w
ealth
y ho
useh
olds
sho
uld
pay
mor
epo
ssib
le in
terd
epen
denc
e be
twee
n to
tal m
arke
t va
lue
of >
$5,0
00.
wea
lth a
nd in
com
e, a
nd t
his
atte
ntio
n to
the
rol
e of
ent
repr
eneu
rial
entr
epre
neur
s' in
vest
men
t an
d sh
are
incr
ease
s th
roug
hout
the
deci
sion
s an
d th
eir
role
in w
ealth
savi
ng d
ecis
ions
.w
ealth
/inc
ome
dist
ribu
tion
; ac
cum
ulat
ion.
thei
r po
rtfo
lios
are
very
und
iver
sifie
d;
thei
r in
com
e ra
tios
and
sav
ing
rate
s ar
e hi
gher
.
Gom
pers
, Ler
ner,
Exa
min
e fa
ctor
s th
at le
ad t
o cr
eati
onE
ntre
pren
eurs
are
em
ploy
ees
who
1986
-199
9, u
sing
Fi
ndin
gs in
dica
te t
he b
reed
ing
Polic
ies
that
see
k to
fost
er e
ntre
pren
euria
lan
d Sc
harf
stei
n (2
003)
of v
entu
re c
apit
al-b
acke
d st
artu
p le
ave
publ
ic c
ompa
nies
to
star
tV
entu
reO
ne d
atab
ase.
grou
nds
for
entr
epre
neur
ial
vent
ure
capi
tal a
ctiv
ity
by p
rovi
ding
fir
ms,
a pr
oces
s ca
lled
“ent
repr
eneu
rial
new
ven
ture
cap
ital
-bac
ked
firm
s.fir
ms
are
othe
r en
trep
rene
uria
l fir
ms.
capi
tal o
r in
vest
men
t in
cent
ives
may
not
spaw
ning
”(th
at is
to sa
y, th
e pr
open
sity
be e
noug
h. I
nste
ad, r
egio
ns m
ay n
eed
publ
icly
tra
ded
com
pani
es t
o sp
awn
to a
ttra
ct f
irm
s w
ith
exis
ting
poo
ls o
f ne
w v
entu
re c
apit
al-b
acke
d fir
ms)
.w
orke
rs w
ho h
ave
the
“tra
inin
g an
d co
nditi
onin
g” to
bec
ome
entr
epre
neur
s. St
imul
atin
g en
trep
rene
ursh
ip in
a r
egio
n w
ith fe
w e
xist
ing
entr
epre
neur
s is
diffi
cult.
Gui
so a
nd
Test
whe
ther
the
tal
ent
to b
ecom
e an
Ent
repr
eneu
rs a
re a
ssum
ed t
o ge
tIt
alia
n fir
m d
ata
from
198
2 to
199
0.G
eogr
aphi
cal a
gglo
mer
atio
n of
Po
licy
acti
ons
shou
ld p
rom
ote
the
Schi
vard
i (20
04)
entr
epre
neur
is le
arna
ble.
mor
e ou
tput
from
any
com
bina
tion
Num
ber
of f
irm
s in
a g
iven
indu
stry
firm
s is
due
to
diff
eren
ces
in le
arni
ng
lear
ning
pro
cess
to
incr
ease
of
inpu
ts s
o th
at e
ntre
pren
euri
al
in a
giv
en a
rea
is a
pro
xy f
or le
arni
ngop
port
unit
ies,
not
diff
eren
ces
in
entr
epre
neur
ial a
ctiv
ity.
abili
ty is
equ
ival
ent
to a
fir
m’s
exte
rnal
itie
s an
d kn
owle
dge
spill
over
s.st
artu
p co
sts.
tota
l fac
tor
prod
ucti
vity
.
112 James R. Barth, Glenn Yago, and Betsy Zeidman
Tabl
e 5
(con
t.)

Stumbling Blocks to Entrepreneurship in Low- and Moderate-Income Communities 113
Aut
hor(
s)Pu
rpos
eEn
trep
rene
uria
l Foc
usD
ata
Res
ults
Polic
y Im
plic
atio
ns
Gui
so, S
upie
nza,
Te
st w
heth
er lo
cal f
inan
cial
Pr
obab
ility
a p
erso
n be
com
es19
92-1
998,
Ita
lian
data
on
Fina
ncia
l dev
elop
men
t in
crea
ses
the
prob
abili
tyLo
cal f
inan
cial
dev
elop
men
t is
and
Zin
gale
s de
velo
pmen
t m
atte
rs f
or
self-
empl
oyed
. Als
o us
es t
heho
useh
olds
, fir
ms,
and
fin
anci
ala
pers
on b
ecom
es s
elf-
empl
oyed
, and
dec
reas
esim
port
ant
for
self-
empl
oyed
and
(200
4)va
riou
s ou
tcom
es.
aver
age
age
of t
he s
elf-
empl
oyed
.in
stit
utio
ns. C
reat
e a
mea
sure
of
the
aver
age
age
of e
ntre
pren
eurs
. It a
lso in
crea
ses
smal
l firm
s.fin
anci
al u
nder
deve
lopm
ent
that
th
e ra
tio
of n
ew f
irm
s to
the
pop
ulat
ion.
is t
he p
roba
bilit
y a
hous
ehol
d is
sh
ut o
ff f
rom
the
cre
dit
mar
ket.
Ham
ilton
(20
00)
Exa
min
e th
e ea
rnin
gs d
iffer
enti
als
in
Self-
empl
oyed
.19
84 S
urve
y of
Inc
ome
and
Ent
repr
eneu
rs h
ave
not
only
low
er in
itia
lLi
ttle
evi
denc
e is
fou
nd t
hat
the
earn
ings
self-
empl
oym
ent a
nd p
aid
empl
oym
ent.
Prog
ram
Par
tici
pati
on. S
ampl
e of
ea
rnin
gs t
han
empl
oyee
s w
ith
the
sam
edi
ffer
enti
al r
efle
cts
the
sele
ctio
n of
8,77
1 m
ale
scho
ol le
aver
s age
d 18
-65
char
acte
rist
ics
but
also
low
er e
arni
ngs
grow
th.
low
-abi
lity
paid
em
ploy
ees
into
wor
king
in t
he n
onfa
rm s
ecto
r.se
lf-em
ploy
men
t.
Hol
tz-E
akin
, E
xam
ine
to w
hat
exte
nt li
quid
ity
Indi
vidu
als
who
file
d IR
S fo
rmFe
dera
l tax
dat
a fo
r 19
81 a
nd 1
985.
Liqu
idit
y co
nstr
aint
s ex
ert
a no
tice
able
Sole
pro
prie
tors
hips
are
und
erca
pita
lized
.Jo
ulfa
ian,
and
co
nstr
aint
s in
crea
se t
he li
kelih
ood
of10
40 s
ched
ule
C in
198
1 an
din
fluen
ce o
n th
e vi
abili
ty o
f en
trep
rene
uria
lR
osen
(19
94a)
entr
epre
neur
ial f
ailu
re.
1985
, and
hav
e a
cash
flo
w g
reat
er
ente
rpri
ses.
than
$5,
000.
Hol
tz-E
akin
, E
xam
ine
how
the
rec
eipt
of
Tran
siti
on t
o fil
ing
IRS
form
104
0Fe
dera
l tax
dat
a fo
r 19
81 a
nd 1
985.
The
siz
e of
the
inhe
rita
nce
has
aLi
quid
ity
cons
trai
nts
can
Joul
faia
n, a
nd
an in
heri
tanc
e af
fect
ssc
hedu
le C
(fr
om 1
981
to 1
985)
.su
bsta
ntia
l eff
ect
on b
oth
the
prob
abili
tyha
ve a
sub
stan
tial
influ
ence
on
Ros
en(1
994b
)en
trep
rene
ursh
ip.
of b
ecom
ing
an e
ntre
pren
eur
and
the
entr
epre
neur
ship
dec
isio
n.
amou
nt o
f ca
pita
l em
ploy
ed in
the
ne
w e
nter
pris
e.
Hur
st a
nd
Exa
min
e w
heth
er t
he
Bus
ines
s ow
ners
(w
ith
resu
lts t
hePa
nel S
tudy
of
Inco
me
Dyn
amic
s T
hrou
ghou
t m
ost
of t
he w
ealth
dis
trib
utio
nLi
quid
ity
cons
trai
nts
do n
ot p
reve
nt
Lusa
rdi (
2003
)in
abili
ty o
f w
ould
-be
sam
e fo
r se
lf-em
ploy
ed).
and
Nat
iona
l Sur
vey
of S
mal
l (u
p th
roug
h $2
00,0
00 in
hou
seho
ld w
ealth
),
entr
epre
neur
s fr
om s
tart
ing
a bu
sine
ss.
entr
epre
neur
s to
acq
uire
the
B
usin
ess
Fina
nces
.th
ere
is n
o di
scer
nabl
e re
lati
onsh
ip b
etw
een
capi
tal n
eces
sary
to
star
t a
hous
ehol
d w
ealth
and
the
prob
abili
ty o
f sta
rtin
gbu
sines
s is
an o
bsta
cle
to n
ewa
busi
ness
. Onl
y fo
r ho
useh
olds
at
the
top
ofbu
sine
ss f
orm
atio
n.th
e w
ealth
dis
trib
utio
n is
a p
osit
ive
rela
tion
ship
fou
nd.
Mey
er (
1990
)E
xam
ine
expl
anat
ions
for
Se
lf-em
ploy
ed.
1984
Sur
vey
of I
ncom
e an
d Pr
ogra
mT
he e
vide
nce
does
not
sup
port
liqu
idit
y-C
ultu
ral d
iffer
ence
s m
ay e
xpla
in
diffe
renc
es in
sel
f-em
ploy
men
t, Pa
rtic
ipat
ion;
198
2 C
hara
cter
isti
csco
nstr
aint
/low
-ass
ets
expl
anat
ion
for
the
low
blac
k/w
hite
diff
eren
ces i
n se
lf-em
ploy
men
t.ne
t in
com
e, n
umbe
r of
of
Bus
ines
s O
wne
rs.
blac
k se
lf-em
ploy
men
t ra
te; c
ultu
ral d
iffer
ence
sem
ploy
ees,
and
for
m o
f m
ay e
xpla
in b
lack
/whi
te d
iffer
ence
s in
orga
niza
tion
bet
wee
n bl
acks
se
lf-em
ploy
men
t.an
d w
hite
s, w
ith
spec
ial f
ocus
on li
quid
ity
cons
trai
nts
and
cons
umer
dis
crim
inat
ion.
Tabl
e 5
(con
t.)

114 James R. Barth, Glenn Yago, and Betsy Zeidman
Aut
hor(
s)Pu
rpos
eEn
trep
rene
uria
l Foc
usD
ata
Res
ults
Polic
y Im
plic
atio
ns
Mit
chel
l and
Te
st o
f disc
rimin
atio
n in
lend
ing
Bus
ines
ses w
ith fe
wer
than
500
em
ploy
ees.
1998
Sur
vey
of S
mal
l Bus
ines
s Fin
ance
s,T
he p
repo
nder
ance
of
evid
ence
is c
onsi
sten
tD
iscr
imin
atio
n is
a p
robl
em in
acc
ess
toPe
arce
(20
05)
to s
mal
l bus
ines
ses.
uses
mod
els
of t
he p
roba
bilit
y th
atw
ith
prej
udic
ial d
iscr
imin
atio
n ag
ains
tcr
edit
for
som
e m
inor
ity-
owne
d fir
ms,
sm
all b
usin
ess
owne
rs h
ave
Afr
ican
-Am
eric
an a
nd H
ispa
nic
firm
ow
ners
.an
d th
e m
ove
by la
rger
ban
ks t
oou
tstan
ding
loan
s and
hav
e ap
plic
atio
nsA
lso,
pre
fere
ntia
l pra
ctic
es c
hara
cter
ize
the
tran
sact
iona
l len
ding
thr
ough
cre
dit
for
new
rel
atio
nshi
p an
d tr
ansa
ctio
nal
gran
ting
of
tran
sact
ion
loan
s to
a s
igni
fican
tlysc
ores
and
oth
er “
hard
er”
info
rmat
ion
loan
s de
nied
by
bank
s an
d no
nban
ks.
grea
ter
degr
ee t
han
the
gran
ting
of
may
lead
to
grea
ter
disc
rim
inat
ion
than
rela
tion
ship
loan
s.w
ith
rela
tion
ship
lend
ing.
Moo
re (
2004
)Te
st w
heth
er w
ealth
aff
ects
“N
ew”
entr
epre
neur
s ar
e ho
useh
olds
1995
, 199
8, a
nd 2
001
Surv
ey o
f A
pos
itiv
e re
lati
onsh
ip b
etw
een
wea
lth a
ndFo
r the
maj
ority
of p
oten
tial e
ntre
pren
eurs
, th
e de
cisi
on t
o be
th
at s
tart
ed a
bus
ines
s in
the
last
thr
eeC
onsu
mer
Fin
ance
s. H
ome
equi
tyst
arti
ng a
bus
ines
s is
onl
y si
gnifi
cant
for
liqui
dity
con
stra
ints
are
not
bin
ding
.an
ent
repr
eneu
r.ye
ars
and
have
no
prio
r bu
sine
sses
.va
lue
is u
sed
as a
pro
xy f
or w
ealth
.ho
useh
olds
in t
he t
op q
uart
ile o
f th
e ho
me
equi
ty d
istr
ibut
ion.
Pete
rsen
and
E
xam
ine
whe
ther
the
dis
tanc
eB
usin
esse
s with
few
er th
an 5
00 e
mpl
oyee
s.19
93 N
atio
nal S
urve
y of
Sm
all B
usin
ess
Find
tha
t in
form
atio
nally
opa
que
firm
s ha
veG
reat
er in
form
atio
n av
aila
bilit
y an
dR
ajan
(20
02)
of f
irm
s fr
om t
heir
lend
er is
a
Fina
nce.
Inf
orm
atio
n on
dis
tanc
e of
clos
er le
nder
s, a
nd t
hat
bank
s ar
e cl
oser
tha
nre
duce
d co
sts
of p
roce
ssin
g m
eans
go
od p
redi
ctor
of
cred
it q
ualit
y,
firm
fro
m le
nder
and
met
hod
of
othe
r le
nder
s. A
lso,
ban
k tr
ansa
ctio
ns a
reac
cess
of
smal
l fir
ms
to c
redi
t ca
n be
and
whe
ther
dis
tanc
e ha
s co
mm
unic
atio
n (p
erso
n, p
hone
, or
mor
e lik
ely
to b
e co
nduc
ted
in p
erso
n th
anpr
ovid
ed b
y fin
anci
al in
stit
utio
ns a
t be
com
e a
less
-use
ful p
redi
ctor
m
ail)
use
d.tr
ansa
ctio
ns w
ith
othe
r le
nder
s.gr
eate
r di
stan
ce.
of c
redi
t qu
alit
y.
Puri
and
Ex
amin
e w
heth
er e
ntre
pren
eurs
An
entr
epre
neur
is a
res
pond
ent
who
Surv
ey o
f Con
sum
er F
inan
ces,
mai
nly
Ent
repr
eneu
rs a
re s
igni
fican
tly m
ore
likel
y to
Ent
repr
eneu
rs a
re o
ptim
istic
and
risk
-lovi
ng,
Rob
inso
n (2
004)
diff
er f
rom
non
entr
epre
neur
s m
ust
own
som
e or
all
of a
t le
ast
one
1995
, 199
8, a
nd 2
001,
but
som
eth
ink
they
will
live
long
er, s
ugge
stin
g th
ey a
rebu
t th
e w
illin
gnes
s to
tak
e ri
sk is
in t
erm
s of
fun
dam
enta
l pr
ivat
ely
owne
d bu
sine
ss, a
nd t
heda
ta g
oing
bac
k to
199
2.m
ore
opti
mis
tic
abou
t lif
e pr
ospe
cts.
Als
o,te
mpe
red
by s
tron
g fa
mily
tie
s, g
ood
atti
tude
s, s
uch
as o
ptim
ism
re
spon
dent
mus
t be
ful
l-ti
me
they
are
mor
e ri
sk-l
ovin
g th
an t
hehe
alth
pra
ctic
es, a
nd lo
ng p
lann
ing
and
risk
-tak
ing.
self-
empl
oyed
.no
nent
repr
eneu
r po
pula
tion
.ho
rizo
ns.
Vos
, Yeh
, Car
ter,
Test
whe
ther
sm
all b
usin
esse
sB
usin
esse
s w
ith
few
er t
han
500
U.K
. and
U.S
., 19
98 S
urve
y of
Sm
all
Smal
l bus
ines
ses
that
see
k ex
tern
al f
undi
ngSm
all b
usin
esse
s ar
e no
t su
bjec
t to
fia
ncin
g an
d Ta
gg (
2005
)ar
e co
nstr
aine
d in
the
ir a
cces
s em
ploy
ees.
Bus
ines
s Fi
nanc
es f
or U
.S. a
nd 2
004
usua
lly g
et w
hat
they
wan
t.co
nstr
aint
s.to
fin
anci
ng.
Fede
ratio
n of
Sm
all B
usin
esse
s for
U.K
.
Tabl
e 5
(con
t.)

Peterson and Rajan (2002) find that small businesses that are distant fromlenders no longer have to be the highest-quality credits, indicating they havegreater access to credit, whereas Brevoort and Hannan (2004) find noevidence that distance is becoming less important, but, instead, find thatdistance is associated negatively with the likelihood of a local commercial loanbeing made. Sixth, and last, DeYoung, Glennon, and Nigro (2004) find thatlenders making loans made to small businesses under the SBA 7(a) loan guar-antee program experience higher default rates with greater borrower-lenderdistance and higher loan guarantees. The question that immediately arisesbased upon these findings is whether one confidently can suggest ways toimprove entrepreneurship, especially in LMI communities. Table 6 providesa slightly different view of the same issue. In this table, different potentialstumbling blocks to entrepreneurship are listed across the top, while differentmeasures of entrepreneurship are listed down the side. In the middle of thetable are various studies of entrepreneurship that are linked to both the differ-ent stumbling blocks and the different entrepreneurship measure. For each ofthe studies, moreover, we indicate whether stumbling blocks to entrepreneur-ial activity indeed exist.
It is clear that there are differences among the studies as to whether or notstumbling blocks or barriers to entrepreneurship actually exist or, even ifsome do, whether they are significant. Unfortunately, differences in entre-preneurship measures and differences in datasets make it difficult to decideupon which results should be the best guide to policy wherever there arecontrary findings. This is certainly the case with respect to the existence ofliquidity constraints. However, there does appear to be agreement amongthe studies reviewed that discrimination, particularly involving African-Americans, is a barrier to entrepreneurship. Also, there seems to beagreement that the existence of entrepreneurial firms in a region helps spurthe establishment of still more such firms. Furthermore, as the next sectionshows, there appears to be a consensus that governmental regulations can bestumbling blocks to entrepreneurship. Finally, there appears to be agree-ment that individuals can learn or be taught to become entrepreneurs. Atthe very least, agreement that there are indeed these types of stumblingblocks or barriers to entrepreneurship should provide better guidance as to
Stumbling Blocks to Entrepreneurship in Low- and Moderate-Income Communities 115

116 James R. Barth, Glenn Yago, and Betsy Zeidman
Mea
sure
of
Not
Am
enab
le to
Pol
icy
Amen
able
to P
olic
yEn
trep
rene
ursh
ipEx
ogen
ous C
hara
cter
istic
s of E
ntre
pren
eurs
Tale
nt o
r Abi
lity
Agg
lom
erat
ion
Fina
ncin
g or
D
iscri
min
atio
nR
egul
atio
nis
Lear
nabl
eof
Ent
repr
eneu
rsLi
quid
ity C
onst
rain
tsO
ptim
istic
Low
Risk
Ave
rsio
nTa
lent
or
Abi
lity
Indi
vidu
al Ye
s: Pu
ri Ye
s: K
nigh
t Ye
s: Lu
cas
Yes:
Dun
n an
dYe
s: G
ompe
rs,N
o: H
urst
and
Lusa
rdi
Yes:
Bate
s (19
91);
Yes:
Barth
, Se
lf-Em
ploy
men
tan
d Ro
bins
on
(192
1); Y
es: P
uri a
nd
(197
8);
Hol
tz-Ea
kin
Lern
er, a
nd S
char
fstein
(200
3); N
o: M
oore
(200
4);
Yes:
Blan
chflo
wer,
Levi
ne,
Cor
des,
and
(200
4)Ro
bins
on (2
004)
;Ye
s: Sc
hum
pete
r(2
000)
; Yes
:(2
003)
; Yes
: Gui
soYe
s: G
entry
and
Hub
bard
(200
4);
and
Zim
mer
man
(199
8);
Yeze
r (19
86);
Yes:
Kih
lstro
m an
d (1
911)
Gui
so an
dan
d Sc
hiva
rdi (
2004
)Ye
s: G
uiso
, Sup
ienza
, and
Ye
s: M
itche
ll an
d Pe
arce
Yes:
Berk
owitz
La
ffont
(197
9)Sc
hiva
rdi (
2004
)Zi
ngale
s (20
04);
Yes:
(200
5)an
d W
hite
(200
1);
Blan
chflo
wer a
nd O
swald
(199
8);
Yes:
Persa
d (2
004)
Yes:
Fairl
ie (1
999)
; Yes
: Blac
k an
d St
raha
n (2
002)
; Yes
: Im
mer
gluc
kan
d Sm
ith (2
001)
Indi
vidu
al Ye
s: Pu
riYe
s: K
nigh
t (19
21);
Yes:
Luca
sYe
s: D
unn
and
Yes:
Gom
pers,
Ler
ner,
No:
Hur
st an
d Lu
sard
i (20
03);
Yes:
Bate
s (19
91);
Yes:
Barth
, Cor
des,
Busin
ess
and
Robi
nson
Ye
s: Pu
ri an
d (1
978)
; Yes
: H
oltz-
Eaki
nan
d Sc
harfs
tein
(200
3);
No:
Moo
re (2
004)
; Yes
: Gen
tryYe
s: Bl
anch
flowe
r, an
d Ye
zer (
1986
); O
wner
ship
(200
4)Ro
bins
on (2
004)
;Sc
hum
pete
r (2
000)
; Yes
:Ye
s: G
uiso
and
and
Hub
bard
(200
4); Y
es: G
uiso
, Le
vine
, and
Zim
mer
man
Yes:
Berk
owitz
and
Yes:
Kih
lstro
m an
d (1
911)
Gui
so an
d Sc
hiva
rdi (
2004
)Su
pien
za, a
nd Z
inga
les (2
004)
; (1
998)
; Yes
: Mitc
hell
Whi
te (2
001)
; Yes
: La
ffont
(197
9)Sc
hiva
rdi (
2004
)Ye
s: Bl
anch
flowe
r and
Osw
ald
and
Pear
ce (2
005)
Persa
d (2
004)
(199
8); Y
es: F
airlie
(199
9);
Yes:
Blac
k an
d St
raha
n (2
002)
; Ye
s: Im
mer
gluc
k an
d Sm
ith (2
001)
New
Firm
Ye
s: Pu
ri an
d Ye
s: K
nigh
t (19
21);
Yes:
Luca
s (19
78);
Yes:
Dun
n an
dYe
s: G
ompe
rs, L
erne
r, N
o: H
urst
and
Lusa
rdi (
2003
); Ye
s: Ba
tes (
1991
);Ye
s: Ba
rth, C
orde
s,St
artu
psRo
bins
on
Yes:
Puri
and
Robi
nson
Yes:
Schu
mpe
ter
Hol
tz-Ea
kin
and
Scha
rfste
in (2
003)
;N
o: M
oore
(200
4); Y
es: G
entry
Yes:
Blan
chflo
wer,
and
Yeze
r (19
86);
(200
4)(2
004)
; Yes
: Kih
lstro
m
(191
1)(2
000)
; Yes
:Ye
s: G
uiso
and
and
Hub
bard
(200
4); Y
es: G
uiso
,Le
vine
, and
Zim
mer
man
Yes:
Berk
owitz
and
and
Laffo
nt (1
979)
Gui
so an
d Sc
hiva
rdi (
2004
)Su
pien
za, a
nd Z
inga
les (2
004)
; (1
998)
; Yes
: Mitc
hell
Whi
te (2
001)
; Yes
: Sc
hiva
rdi (
2004
)Ye
s: Bl
anch
flowe
r and
Osw
ald
and
Pear
ce (2
005)
Persa
d (2
004)
(199
8); Y
es: F
airlie
(199
9); Y
es:
Blac
k an
d St
raha
n (2
002)
; Yes
: Im
mer
gluc
k an
d Sm
ith (2
001)
Firm
s by
Yes:
Puri
and
Yes:
Kni
ght (
1921
); Ye
s: Lu
cas (
1978
); Ye
s: D
unn
and
No
Stud
iesN
o: V
os, Y
eh, C
arte
r, an
d Ta
gg
Yes:
Bate
s (19
91);
Yes:
Barth
, Cor
des,
Num
ber o
f Ro
bins
on
Yes:
Puri
and
Ye
s: Sc
hum
pete
rH
oltz-
Eaki
n(2
005)
; No:
Pet
erse
n an
d Ra
janYe
s: Bl
anch
flowe
r, an
d Ye
zer (
1986
);Em
ploy
ees
(200
4)Ro
bins
on (2
004)
; (1
911)
(200
0); Y
es:
(200
2); Y
es: I
mm
ergl
uck
and
Levi
ne, a
nd Z
imm
erm
an
Yes:
Berk
owitz
and
Yes:
Kih
lstro
m an
d G
uiso
and
Smith
(200
1)
(199
8); Y
es: M
itche
llW
hite
(200
1); Y
es:
Laffo
nt (1
979)
Schi
vard
i (20
04)
and
Pear
ce (2
005)
; Pe
rsad
(200
4)O
nly
betw
een
white
an
d bl
ack
busin
ess
owne
rs: B
ostic
and
Lam
pani
(199
9)
Tabl
e 6
Stum
blin
g B
lock
s to
Ent
repr
eneu
rshi
p

how to allocate available resources to the benefit of all communities, butespecially LMI communities.
Regulatory stumbling blocks to entrepreneurship
An additional way of identifying stumbling blocks to entrepreneurship isto ask entrepreneurs directly what they perceive to be barriers to startingand operating a business. Every four years, the National Federation of Inde-pendent Business conducts a nationwide survey of small business ownersknown as Small Business Problems and Priorities. Table 7 includes selectedproblems identified as critical by respondents to the 2004 survey. Interest-ingly, few of the barriers studied in the empirical literature are identified ascritical by survey respondents. For instance, liquidity constraints are thetopic of numerous studies, as noted earlier—many of which find them tobe binding—yet the difficulty of obtaining long-term loans is ranked 68th,and the difficulty of obtaining short-term loans is ranked 70th of 75 prob-lems. Additionally, just 7 percent of respondents rated these two problemsas being of “critical” importance. Instead, business owners tended to stressthree broad groups of problems: those that are not amenable to policyactions (such as earnings), those that typically are beyond the scope of smallbusiness policy (such as health care costs) and those problems that are asso-ciated with governmental tax or regulatory policies. Indeed, as Table 7shows, the cost of workers’ compensation insurance is ranked the third-most important problem; business taxes are ranked fifth (see Table 8 fordifference in sales taxes across states); property taxes are ranked sixth; and“unreasonable” government regulation is ranked the ninth-most importantstumbling block.
Anecdotal evidence for the importance of governmental regulations asstumbling blocks to entrepreneurship is substantial. For instance, Cleve-land, Ohio, requires any new taxicab company to have a fleet of at least 25cars—all of which must be three years old or newer. Akron, Canton, andDayton, Ohio, all require potential taxicab operators to convince govern-ment officials that their firms will meet so-called public convenience andnecessity requirements before they can begin operation. Licensing is also apotential stumbling block to entrepreneurship. The state of California
Stumbling Blocks to Entrepreneurship in Low- and Moderate-Income Communities 117

118 James R. Barth, Glenn Yago, and Betsy Zeidman
Problem Rank Percent of RespondentsIdentifying as “Critical”
EmployeesCost of health insurance 1 65.6Workers’ compensation costs 3 32.8Locating qualified employees 11 14FICA (Social Security) taxes 13 14.3Unemployment compensation (UC) 19 14.4Keeping skilled employees 28 12.4Health/safety regulations 30 10.4
FinanceCash flow 7 21.6Poor earnings (profits) 12 18.6Highly variable earnings (profits) 23 10.6Obtaining long-term (5 years or more)
business loans 68 6.7Obtaining short-term
(12 months or revolving) business loans 70 6.7
RegulationUnreasonable government regulation 9 19.5Frequent changes in federal
tax laws and rules 15 12.7State/local paperwork 17 11.6Federal paperwork 18 12.2Health/safety regulations 30 10.4
TaxesFederal taxes on business income 5 23.2Property taxes (real, personal, or inventory) 6 22.7State taxes on business income 8 20.2FICA (Social Security) taxes 13 14.3Estate (death) taxes 36 17.3
Source: “Small Business Problems and Priorities,” National Federation of Independent Business
requires professions, such as landscape architects and interior decorators, tobe licensed. Furthermore, nationally, there are some 500 occupations(including fence installers and courtroom shorthand reporters) that havelicensing requirements. Table 8 shows that there are still other stumblingblocks, such as fees to incorporate and fees to establish limited liabilitycompanies, which exist and vary widely across states. All these stumblingblocks undoubtedly contribute to variation in entrepreneurial activity acrossgeographical regions.
Table 7Selected Problems Identified by Small Business Owners

Stumbling Blocks to Entrepreneurship in Low- and Moderate-Income Communities 119
State Name State Sales Tax (Percent) Fees to Incorporate Fees to Establish LimitedLiability Companies
Alabama 4 $40 $40 Alaska none $250 $250 Arizona 5.6 $60 $50 Arkansas 6 $40 $40 California 7.25 $100 $70 Colorado 2.9 $50 $50 Connecticut 6 $50 $60 Delaware none $15 min $90 Florida 6 $35 $100 Georgia 4 $100 $100 Hawaii 4 $100 $100 Idaho 6 $100 $100 Illinois 6.25 $150 $500 Indiana 6 $90 $90 Iowa 5 $50 $50 Kansas 5.3 $90 $165 Kentucky 6 $40 $40 Louisiana 4 $60 $60 Maine 5 $125 $125 Maryland 5 $100 $100 Massachusetts 5 $275 $500 Michigan 6 $10 $50 Minnesota 6.5 $135 $135 Mississippi 7 $50 $50 Missouri 4.225 $25 $105 Montana none $70 $70 Nebraska 5.5 $25 $135 Nevada 6.5 $175 $75 New Hampshire none $35 $35 New Jersey 6 $125 $125 New Mexico 5 $100 $50 New York 4.25 $125 $200 North Carolina 4.5 $125 $125 North Dakota 5 $30 $125 Ohio 6 $125 $125 Oklahoma 4.5 $50 $100 Oregon none $50 $50 Pennsylvania 6 $125 $125 Rhode Island 7 $230 $150 South Carolina 5 $135 $110 South Dakota 4 $125 $125 Tennessee 7 $100 $300 Texas 6.25 $300 $200 Utah 4.75 $52 $52 Vermont 6 $75 $75 Virginia 5 $25 $100 Washington 6.5 $175 $175 Washington, D.C. 5.75 $150 $150 West Virginia 6 $50 $100 Wisconsin 5 $100 $170 Wyoming 4 $100 $100
Source: AT&T Small Business Resources
Table 8State Sales Tax, Initial Fees to Establish Domestic Corporations
and Limited Liability Companies

Other regulations that may act as stumbling blocks are those that applyto lending. While intended to benefit borrowers, these regulations can havethe perverse effect of decreasing the availability of loans to businesses. Bank-ruptcy exemption regulations are one such group of regulations that maypresent a barrier to entrepreneurship. The liabilities of unincorporated firmsare personal liabilities of the firms’ owners, and, thus, an increase inpersonal bankruptcy exemptions decreases the recovery value of defaultedloans and, therefore, may increase the cost of loans and decrease their avail-ability. Berkowitz and White (2000) study the impact of personalbankruptcy exemption levels on the probability of small firms being deniedcredit, using data from the 1993 “Survey of Small Business Finances,” andthey find that high exemption levels “are associated with an increase in theprobability of noncorporate firms being denied credit” (p. 446). Persad(2004), using SBA 7(a) data, finds that personal bankruptcy exemptionlevels are associated positively with default rates and also with interest rateson loans. In addition, Barth, Cordes, and Yezer (1983 and 1986) find thatrestrictions on creditor remedies (such as wage garnishment, wage assign-ment, and deficiency judgments) have net costs to borrowers in the personalloan market, a result that is applicable to small business finance, as the“Survey of Small Business Finances” suggests that many small businessowners fund their operations with personal liabilities.
An indirect approach to assessing determinants of entrepreneurship
The initial approach taken here to examining factors that may help toexplain cross-sectional variation in entrepreneurship across geographicregions is based on the size of businesses as measured by number of employ-ees. The analysis is based on the total number and size composition ofestablishments in 204 MSAs. We examine establishments grouped into fourdifferent size categories (zero, one to 10, 11-100, and more than 100employees), as well as all establishments combined. To the extent that theintensity of entrepreneurial activity is greater in smaller than bigger busi-nesses, an examination of the determinants of the relative importance ofsmaller versus bigger businesses represents an indirect approach to studyingdifferences in entrepreneurship across geographical regions.6
120 James R. Barth, Glenn Yago, and Betsy Zeidman

The basic model is as follows:
(1) ESTij = α + β1’Dij + β2’ Pj + β3’ Fij + β4’ Bij + εij ,
where EST is either all establishments or the share of establishments asrepresented by one of the four different size categories. D includes the race,ethnic, gender, age, and educational level (four-year college degree or higherand high school diploma or lower) composition of the population, as wellas average household income, homeownership rate, the poverty level,unemployment rate, and number of establishments per square mile (exceptin the total number of establishment regressions, in which case, only theland area is used). P is the state sales tax rate. F is the measures of availablefinancial resources, about which more will be said momentarily. B is themeasures of loan bias discussed earlier (that is to say, BLMIPB = loan biasfor LMI communities based on income; BLIPB = loan bias for LI commu-nities based on population; BLMIIB = loan bias for LMI communitiesbased on income; BLIIB = loan bias for LI communities based on income).ε is a random error term, and i is a subscript for MSA, while j is a subscriptfor state.
The variables included in F are the total number of financial institutions; thenumber of branches per institution; the total deposits per institution; the totalnumber and average size of loans to businesses made by banks under CRA; theproportion of the number and amount of loans to businesses in LI and moder-ate-income (MI) communities to the total number and amount of loans to allbusinesses in an MSA; the proportion of the number and amount of loans madeto businesses in LMI communities to all businesses in an MSA; and the propor-tion of the number and amount of loans made to those businesses with receiptsless than $1 million to the total number and amount of loans to all businesses.A list of all the variables, their definitions, data sources, and summary of statis-tics are provided in Table 9a, while Table 9b contains the pairwise correlationsfor the variables. There are five basic models, one for total establishments andfour representing each of the establishment size categories (zero, one to 10, 11-100, and more than 100 employees), with six specifications provided for eachmodel, with the different specifications reflecting mainly the inclusion or
Stumbling Blocks to Entrepreneurship in Low- and Moderate-Income Communities 121

Vari
able
Def
inti
onSo
urce
Sum
mar
y St
atis
tics
M
ean
Med
ian
Max
imum
Min
imum
Std.
Dev
.D
ALLE
STAl
l esta
blish
men
ts (th
ousa
nds)
U.S
. Cen
sus,
2000
16.8
37.
1424
5.79
1.60
29.6
7L0
ESH
Esta
blish
men
ts w
ith 0
em
ploy
ees,
as a
shar
e of
all
esta
blish
men
ts (%
)U
.S. C
ensu
s, 20
009.
49.
318
.15.
91.
8L1
0ESH
Esta
blish
men
ts w
ith 1
-10
empl
oyee
s, as
a sh
are
of a
ll es
tabl
ishm
ents
(%)
U.S
. Cen
sus,
2000
51.1
50.8
59.9
44.0
3.0
L100
ESH
Esta
blish
men
ts w
ith 1
1-20
em
ploy
ees,
as a
shar
e of
all
esta
blish
men
ts (%
)U
.S. C
ensu
s, 20
0019
.719
.824
.913
.71.
9L1
00PE
SHEs
tabl
ishm
ents
with
100
+ em
ploy
ees,
as a
shar
e of
all
esta
blish
men
ts (%
)U
.S. C
ensu
s, 20
0019
.820
.328
.111
.53.
0D
POP
Tot
al p
opul
atio
n (m
illio
ns)
U.S
. Cen
sus,
2000
0.67
0.28
9.52
0.05
1.18
DAG
E254
4Po
pula
tion,
age
25-
44, a
s a sh
are
of to
tal p
opul
atio
nU
.S. C
ensu
s, 20
0029
.3%
29.2
%36
.1%
18.8
%2.
2%D
HIN
CM
edia
n ho
useh
old
inco
me
(thou
sand
s of d
olla
rs)
U.S
. Cen
sus,
2000
40.8
339
.30
76.5
524
.86
7.69
DH
OM
EOH
ome
owne
rs, a
s a sh
are
of to
tal p
opul
atio
nU
.S. C
ensu
s, 20
0069
.7%
70.8
%82
.9%
37.5
%6.
1%D
CG
RAD
Popu
latio
n ab
ove
age
25, w
ith h
igh
scho
ol d
egre
e or
bel
ow, a
s a sh
are
of >
25 a
ge p
opul
atio
nU
.S. C
ensu
s, 20
0023
.5%
22.5
%52
.4%
11.0
%7.
5%D
HG
RAD
Popu
latio
n ab
ove
age
25, w
ith c
olle
ge e
duca
tion
or a
bove
, as a
shar
e of
>25
age
pop
ulat
ion
U.S
. Cen
sus,
2000
48.1
%48
.6%
70.1
%22
.2%
8.8%
DW
HIT
EN
on-H
ispan
ic W
hite
s, as
a sh
are
of to
tal p
opul
atio
nU
.S. C
ensu
s, 20
0077
.7%
82.1
%97
.7%
6.0%
16.3
%D
BLAC
KAf
rican
-Am
eric
an, a
s a sh
are
of to
tal p
opul
atio
nU
.S. C
ensu
s, 20
009.
3%5.
8%45
.2%
0.1%
9.6%
DAS
IAN
Asia
n, a
s a sh
are
of to
tal p
opul
atio
nU
.S. C
ensu
s, 20
003.
0%1.
8%64
.5%
0.3%
4.9%
DH
ISP
Hisp
anic
, as a
shar
e of
tota
l pop
ulat
ion
U.S
. Cen
sus,
2000
8.8%
3.7%
93.1
%0.
3%13
.9%
DPO
VPo
vert
y po
pula
tion,
as a
shar
e of
tota
l pop
ulat
ion
U.S
. Cen
sus,
2000
12.1
%11
.4%
35.4
%4.
6%4.
3%D
UN
MP
Une
mpl
oym
ent r
ate
U.S
. Cen
sus,
2000
5.8%
5.5%
13.1
%2.
6%1.
8%D
AREA
Land
are
a, sq
uare
mile
sU
.S. C
ensu
s, 20
002,
228
1,53
039
,369
473,
308
PTAX
Stat
e Pe
rson
al T
ax R
ate
CR
A, 2
001
5.34
6.00
7.25
0.00
1.45
FIN
STI
No.
of f
inan
cial
insti
tutio
ns (t
hous
ands
)FD
IC, 2
001
0.20
0.08
4.72
0.02
0.39
FBR
ANC
H/F
INST
IN
o. o
f ban
k br
anch
es p
er fi
nanc
ial i
nstit
utio
nFD
IC, 2
001
0.24
0.21
0.56
0.06
0.11
FDEP
O/F
INST
IT
otal
dep
osit
per i
nstit
utio
n (th
ousa
nds o
f dol
lars
)FD
IC, 2
001
38.7
934
.81
169.
0017
.26
16.6
4FA
LNAl
l loa
ns, n
umbe
r (th
ousa
nds)
CR
A, 2
001
12.1
75.
4819
8.65
0.77
21.6
4FA
LAV
EAl
l loa
ns, a
vera
ge a
mou
nt (F
ALA/
FALN
) (m
illio
ns o
f dol
lars
)C
RA,
200
10.
040.
040.
090.
020.
01FA
LMIA
/FAL
ALo
ans t
o bu
sines
ses i
n LM
I com
mun
ities
, am
ount
, as a
shar
e of
all
loan
sC
RA,
200
10.
260.
224.
990.
000.
32FA
LMIN
/FAL
NLo
ans t
o bu
sines
ses i
n LM
I com
mun
ities
, num
ber,
as a
shar
e of
all
loan
sC
RA,
200
10.
230.
195.
390.
010.
33FA
LIA/
FALA
Loan
s to
busin
esse
s in
LI c
omm
uniti
es, a
mou
nt, a
s a sh
are
of a
ll lo
ans
CR
A, 2
001
0.06
0.05
0.28
0.00
0.05
FALI
N/F
ALN
Loan
s to
busin
esse
s in
LI c
omm
uniti
es, n
umbe
r, as
a sh
are
of a
ll lo
ans
CR
A, 2
001
0.04
0.04
0.19
0.00
0.04
FAM
IA/F
ALA
Loan
s to
busin
esse
s in
MI c
omm
uniti
es, a
mou
nt, a
s a sh
are
of a
ll lo
ans
CR
A, 2
001
0.20
0.16
4.85
0.00
0.31
FAM
IN/F
ALN
Loan
s to
busin
esse
s in
MI c
omm
uniti
es, n
umbe
r, as
a sh
are
of a
ll lo
ans
CR
A, 2
001
0.18
0.14
5.31
0.01
0.33
FLSM
A/FA
LALo
ans t
o bu
sines
ses w
ith le
ss th
an $
1 m
illio
n in
rece
ipts,
am
ount
, as a
shar
e of
all
loan
sC
RA,
200
10.
500.
480.
770.
230.
09FL
SMN
/FAL
NLo
ans t
o bu
sines
ses w
ith le
ss th
an $
1 m
illio
n in
rece
ipts,
num
ber,
as a
shar
e of
all
loan
sC
RA,
200
10.
430.
410.
690.
280.
07BL
MIP
BLo
an b
ias f
or L
MI c
omm
uniti
es b
ased
on
popu
latio
nM
ilken
Insti
tute
0.41
0.43
0.99
-0.5
10.
25BL
MII
BLo
an b
ias f
or L
MI c
omm
uniti
es b
ased
on
inco
me
Milk
en In
stitu
te0.
750.
801.
00-0
.26
0.24
BLIP
BLo
an b
ias f
or L
I com
mun
ities
bas
ed o
n po
pula
tion
Milk
en In
stitu
te-0
.85
-0.7
30.
99-7
.40
0.88
BLII
BLo
an b
ias f
or L
I com
mun
ities
bas
ed o
n in
com
eM
ilken
Insti
tute
-0.2
20.
021.
00-5
.84
1.18
122 James R. Barth, Glenn Yago, and Betsy ZeidmanTa
ble
9aVa
riab
les,
Def
init
ions
, Sou
rces
, and
Sum
mar
y St
atis
tics
Not
es: N
umbe
r of O
bser
vatio
ns: 3
04. T
he o
rigin
al n
umbe
r of M
SAs w
as 3
31 b
ut so
me
wer
e de
lete
d fo
r lac
k of
dat
a. A
ll da
ta a
re in
Yea
r 200
0.

Stumbling Blocks to Entrepreneurship in Low- and Moderate-Income Communities 123
Tabl
e 9b
Cor
rela
tion
sL1
0ESH
L20E
SHL1
00ES
HL1
00PE
SHD
POP
DAG
E254
4D
HIN
CD
HO
MEO
DC
GR
ADD
HG
RAD
DW
HIT
ED
BLAC
KL1
0ESH
0.36
***
1L2
0ESH
-0.4
2***
-0.3
8***
1L1
00ES
H-0
.57*
**-0
.66*
**0.
68**
*1
L100
PESH
-0.5
9***
-0.8
4***
0.08
0.4*
**1
DPO
P0.
22**
*-0
.03
-0.2
1***
-0.1
1*0
1D
AGE2
544
0.15
***
-0.1
8***
-0.1
1**
0.03
0.11
*0.
36**
*1
DH
INC
0.34
***
0.11
**-0
.11*
*-0
.11*
-0.2
3***
0.33
***
0.53
***
1D
HO
MEO
-0.1
1**
-0.0
1-0
.02
0.06
0.05
-0.2
4***
-0.2
4***
0.03
1D
CG
RAD
0.39
***
0.04
-0.0
5-0
.1*
-0.2
1***
0.2*
**0.
42**
*0.
47**
*-0
.24*
**1
DH
GR
AD-0
.49*
**0.
010.
030.
12**
0.22
***
-0.1
5***
-0.3
8***
-0.4
1***
0.26
***
-0.8
7***
1D
WH
ITE
-0.1
3**
-0.0
70.
17**
*0.
21**
*0.
02-0
.27*
**-0
.23*
**-0
.02
0.4*
**0.
04-0
.07
1D
BLAC
K-0
.22*
**-0
.17*
**-0
.18*
**-0
.09
0.38
***
0.13
**0.
17**
*-0
.08
-0.0
6-0
.08
0.13
**-0
.39*
**D
ASIA
N0.
19**
*0.
12**
-0.0
4-0
.08
-0.1
9***
0.27
***
0.34
***
0.41
***
-0.4
***
0.31
***
-0.2
9***
-0.4
***
DH
ISP
0.23
***
0.15
***
-0.0
7-0
.14*
**-0
.2**
*0.
15**
*0.
04-0
.05
-0.2
8***
-0.1
*0.
1*-0
.78*
**D
POV
-0.1
5***
-0.0
10.
1*0
0.07
-0.0
6-0
.3**
*-0
.68*
**-0
.39*
**-0
.25*
**0.
28**
*-0
.5**
*D
UN
MP
-0.0
80.
09*
0.08
-0.0
2-0
.06
0-0
.26*
**-0
.46*
**-0
.37*
**-0
.34*
**0.
33**
*-0
.47*
**D
ALLE
ST/D
AREA
0.19
***
0.3*
**-0
.28*
**-0
.2**
*-0
.26*
**0.
28**
*0.
34**
*0.
43**
*-0
.02
0.24
***
-0.0
8-0
.24*
**PT
AX-0
.08
-0.0
30.
030.
050.
050.
1*-0
.07
0.02
-0.0
8-0
.12*
*0.
11**
-0.1
9***
FIN
STI
0.21
***
0.11
*-0
.25*
**-0
.14*
*-0
.1*
0.59
***
0.36
***
0.39
***
-0.0
40.
23**
*-0
.11*
*-0
.24*
**FB
RAN
CH
/FIN
STI
-0.1
2**
00.
32**
*0.
21**
*-0
.1*
-0.3
2***
-0.3
1***
-0.2
1***
0.04
-0.0
9-0
.03
0.15
**FD
EPO
/FIN
STI
0.17
***
0.07
-0.1
*-0
.06
-0.1
2**
0.36
***
0.29
***
0.31
***
-0.1
3**
0.17
***
-0.1
5***
-0.3
2***
FALN
0.31
***
0.09
-0.3
1***
-0.1
9***
-0.1
1**
0.76
***
0.42
***
0.36
***
-0.1
4**
0.25
***
-0.1
8***
-0.3
2***
FALA
VE
-0.3
4***
-0.5
5***
0.46
***
0.61
***
0.37
***
-0.1
1*0.
03-0
.02
0.23
***
0.01
0.04
0.36
***
FALM
IA/F
ALA
-0.0
5-0
.07
00.
010.
09*
-0.0
40.
02-0
.05
-0.0
7-0
.01
0-0
.08
FALM
IN/F
ALN
-0.0
6-0
.08
00.
010.
11**
-0.0
40.
02-0
.05
-0.0
6-0
.02
0.01
-0.0
7FA
LIA/
FALA
-0.2
***
-0.1
8***
0.04
0.19
***
0.21
***
-0.0
10
-0.0
40
-0.0
20.
040.
03FA
LIN
/FAL
N-0
.24*
**-0
.24*
**0.
11**
0.23
***
0.25
***
-0.0
1-0
.01
-0.0
50.
02-0
.01
0.03
0.04
FAM
IA/F
ALA
-0.0
2-0
.04
-0.0
1-0
.02
0.06
-0.0
40.
02-0
.05
-0.0
8-0
.01
-0.0
1-0
.09
FAM
IN/F
ALN
-0.0
3-0
.06
-0.0
1-0
.01
0.08
-0.0
40.
02-0
.05
-0.0
6-0
.01
0-0
.08
FLSM
A/FA
LA-0
.19*
**-0
.05
0.11
**-0
.01
0.13
**-0
.36*
**-0
.2**
*-0
.37*
**0.
06-0
.13*
*0.
11*
0.05
FLSM
N/F
ALN
-0.2
1***
-0.1
7***
0.31
***
0.27
***
0.1*
-0.2
6***
-0.1
*-0
.23*
**0.
04-0
.03
00.
16**
*BL
MIP
B0.
030.
1-0
.09
-0.0
7-0
.06
0.02
-0.1
3**
-0.0
40.
21**
*-0
.16*
**0.
23**
*0.
18**
*BL
MII
B0.
18**
*0.
22**
*-0
.04
-0.2
***
-0.2
2***
-0.0
2-0
.04
-0.0
20
-0.0
20
-0.0
4BL
IPB
0.02
-0.0
2-0
.15*
*-0
.03
0.06
0.01
-0.0
7-0
.01
0.27
***
-0.1
7***
0.24
***
0.23
***
BLII
B0.
18**
*0.
19**
*-0
.02
-0.1
8***
-0.2
1***
-0.0
7-0
.06
-0.0
10.
06-0
.03
00.
03

124 James R. Barth, Glenn Yago, and Betsy Zeidman
Tabl
e 9b
(co
nt.)
DAS
IAN
DH
ISP
DPO
VD
UN
MP
DAL
LEST
/DAR
EAPT
AXFI
NST
IFB
RAN
CH
/FIN
STI
FDEP
O/F
INST
IFA
LNFA
LAV
EFA
LMIA
/FAL
AL1
0ESH
L20E
SHL1
00ES
HL1
00PE
SHD
POP
DAG
E254
4D
HIN
CD
HO
MEO
DC
GR
ADD
HG
RAD
DW
HIT
ED
BLAC
K1
DAS
IAN
-0.0
71
DH
ISP
-0.1
9***
0.17
***
1D
POV
0.16
***
-0.0
80.
51**
*1
DU
NM
P0.
050.
030.
51**
*0.
77**
*1
DAL
LEST
/DAR
EA0.
060.
37**
*0.
14**
-0.2
1***
-0.1
1*1
PTAX
-0.0
50.
14**
*0.
24**
*0.
090.
2***
0.05
1FI
NST
I0.
16**
*0.
27**
*0.
1*-0
.15*
**-0
.09
0.56
***
0.08
1FB
RAN
CH
/FIN
STI
-0.2
1***
-0.1
7***
0.02
0.07
0.03
-0.2
1***
-0.1
1*-0
.39*
**1
FDEP
O/F
INST
I-0
.04
0.39
***
0.29
***
-0.0
20
0.3*
**0.
12**
0.47
***
-0.2
2***
1FA
LN0.
16**
*0.
34**
*0.
17**
*-0
.11*
*-0
.06
0.47
***
0.13
**0.
89**
*-0
.39*
**0.
48**
*1
FALA
VE
-0.0
3-0
.21*
**-0
.32*
**-0
.19*
**-0
.22*
**-0
.12*
*-0
.07
-0.1
*0.
15**
*-0
.09
-0.1
7***
1FA
LMIA
/FAL
A0.
11*
0.01
0.01
0.09
0.05
-0.0
4-0
.02
-0.0
40.
030.
01-0
.03
-0.0
1FA
LMIN
/FAL
N0.
12**
-0.0
10
0.08
0.05
-0.0
4-0
.03
-0.0
30.
020
-0.0
30.
01FA
LIA/
FALA
0.12
**-0
.03
-0.1
*0
0-0
.01
0.01
0.01
0.03
0.09
-0.0
10.
12**
FALI
N/F
ALN
0.15
***
-0.0
5-0
.13*
*0
0-0
.02
-0.0
30.
010.
020.
1*-0
.03
0.17
***
FAM
IA/F
ALA
0.09
0.02
0.03
0.09
0.06
-0.0
4-0
.03
-0.0
40.
03-0
.01
-0.0
3-0
.03
FAM
IN/F
ALN
0.11
*0
0.02
0.09
0.05
-0.0
3-0
.03
-0.0
30.
02-0
.02
-0.0
3-0
.01
FLSM
A/FA
LA0.
24**
*-0
.23*
**-0
.15*
**0.
23**
*0.
04-0
.24*
**-0
.12*
*-0
.32*
**0.
24**
*-0
.22*
**-0
.36*
**0.
07FL
SMN
/FAL
N0.
05-0
.11*
*-0
.18*
**0.
11**
-0.0
2-0
.15*
**-0
.13*
*-0
.2**
*0.
32**
*-0
.16*
**-0
.26*
**0.
5***
BLM
IPB
0.04
-0.1
4**
-0.1
8***
-0.0
8-0
.06
-0.0
50.
010
-0.1
5**
-0.1
4**
-0.0
20.
02BL
MII
B-0
.11*
0.03
0.1
0.07
0.05
-0.0
90
-0.0
3-0
.04
-0.0
8-0
.01
-0.1
7***
BLIP
B0.
01-0
.15*
*-0
.21*
**-0
.16*
**-0
.1*
-0.0
6-0
.06
-0.0
1-0
.11*
-0.1
4**
-0.0
30.
11*
BLII
B-0
.16*
**-0
.02
0.06
0.01
0.01
-0.1
3**
-0.0
2-0
.08
-0.0
2-0
.1*
-0.0
7-0
.12*
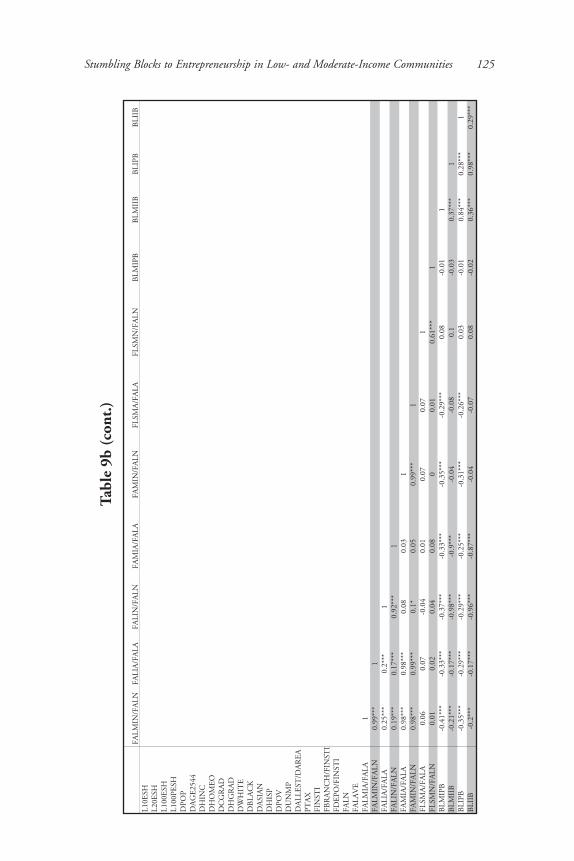
Stumbling Blocks to Entrepreneurship in Low- and Moderate-Income Communities 125
FALM
IN/F
ALN
FALI
A/FA
LAFA
LIN
/FAL
NFA
MIA
/FAL
AFA
MIN
/FAL
NFL
SMA/
FALA
FLSM
N/F
ALN
BLM
IPB
BLM
IIB
BLIP
BBL
IIB
L10E
SHL2
0ESH
L100
ESH
L100
PESH
DPO
PD
AGE2
544
DH
INC
DH
OM
EOD
CG
RAD
DH
GR
ADD
WH
ITE
DBL
ACK
DAS
IAN
DH
ISP
DPO
VD
UN
MP
DAL
LEST
/DAR
EAPT
AXFI
NST
IFB
RAN
CH
/FIN
STI
FDEP
O/F
INST
IFA
LNFA
LAV
EFA
LMIA
/FAL
A1
FALM
IN/F
ALN
0.99
***
1FA
LIA/
FALA
0.25
***
0.2*
**1
FALI
N/F
ALN
0.19
***
0.17
***
0.92
***
1FA
MIA
/FAL
A0.
98**
*0.
98**
*0.
080.
031
FAM
IN/F
ALN
0.98
***
0.99
***
0.1*
0.05
0.99
***
1FL
SMA/
FALA
0.06
0.07
-0.0
40.
010.
070.
071
FLSM
N/F
ALN
0.01
0.02
0.04
0.08
00.
010.
61**
*1
BLM
IPB
-0.4
1***
-0.3
3***
-0.3
7***
-0.3
3***
-0.3
5***
-0.2
9***
0.08
-0.0
11
BLM
IIB
-0.2
1***
-0.1
7***
-0.9
8***
-0.9
***
-0.0
4-0
.08
0.1
-0.0
30.
37**
*1
BLIP
B-0
.35*
**-0
.29*
**-0
.29*
**-0
.25*
**-0
.31*
**-0
.26*
**0.
03-0
.01
0.84
***
0.28
***
1BL
IIB
-0.2
***
-0.1
7***
-0.9
6***
-0.8
7***
-0.0
4-0
.07
0.08
-0.0
20.
36**
*0.
98**
*0.
29**
*
Tabl
e 9b
(co
nt.)

exclusion of different combinations of the LI and MI loan variables, as willbe discussed in the next paragraph.
Tables 10 through 14 present the empirical results of our exercise. Theseresults may be summarized as follows:
Population
• Total population is not a significant factor in explaining the total levelor the shares of those establishments with either zero or 11-100 employ-ees in MSAs. However, population is related positively with a largershare of establishments with more than 100 employees, while associatednegatively with the share of establishments with one to 10 employees.
• MSAs with larger shares of the population in the 25-44 age grouptend to have more establishments. At the same time, this segment ofthe population is correlated negatively with a larger share of smallestablishments (in other words, those with zero and one to 10employees), while correlated positively with the share of establish-ments with more than 10 employees.
Household income
• There is no evidence of any relationship between household incomeand the total number of establishments in MSAs. However, the levelof household income is associated positively with the share of smallestablishments (zero to 10 employees) with the coefficients in 11 ofthe 12 regressions being significant at the 10 percent level or better.It also is correlated negatively with the share of establishments with100 or more employees.
Homeownership
• Homeownership is correlated positively but marginally with totalestablishments in five of the six regressions. The results do not indi-cate any relationship between homeownership percentage and the sizecomposition of establishments.
Education
• We do not find any significant relationships between either totalestablishments or the share of establishments with at least one
126 James R. Barth, Glenn Yago, and Betsy Zeidman

Stumbling Blocks to Entrepreneurship in Low- and Moderate-Income Communities 127
Table 10Determinants of the Total Number of Establishments in MSAs
(1) (2) (3) (4) (5) (6) (7) (8) (9) (10)C -52.35 -17.4971 -18.169 -19.3771 -17.8355 -15.104 -58.0395* -57.4187* -58.2001* -57.5618*
(0.13) (0.35) (0.33) (0.32) (0.34) (0.42) (0.07) (0.07) (0.07) (0.07)DPOP 6.9919*** 0.7933 0.8025 0.8182 0.7941 0.7341 4.7605* 4.7646* 4.7656* 4.7647*
(0.00) (0.21) (0.2) (0.2) (0.21) (0.25) (0.05) (0.05) (0.05) (0.05)DAGE2544 89.4948*** 36.5161** 36.887** 36.2153** 36.6461** 37.2844*** 56.6351** 56.194** 56.3769** 56.2983**
(0.00) (0.01) (0.01) (0.01) (0.01) (0.01) (0.03) (0.03) (0.03) (0.03)DHINC -0.2693 0.0307 0.0354 0.0292 0.0318 0.0238 0.0678 0.0713 0.0687 0.0721
(0.2) (0.72) (0.68) (0.74) (0.71) (0.78) (0.64) (0.62) (0.63) (0.62)DHOMEO 25.1614 15.0137* 15.4675* 15.716* 15.1018* 14.9274* 32.5734** 32.7334** 32.641** 32.884**
(0.2) (0.07) (0.06) (0.06) (0.07) (0.07) (0.02) (0.02) (0.02) (0.02)DCGRAD -17.8901 -1.6203 -0.9965 -2.2475 -1.3086 -1.9156 -19.1231 -19.3292 -18.9967 -19.5014
(0.35) (0.86) (0.92) (0.8) (0.89) (0.83) (0.13) (0.13) (0.13) (0.13)DHGRAD -30.979*** -8.2244 -7.5181 -9.3567 -7.8851 -8.6132 -27.6072*** -27.6173*** -27.3728*** -27.7399***
(0.01) (0.2) (0.25) (0.14) (0.22) (0.17) (0.00) (0.00) (0.00) (0.00)DWHITE 37.3751 -1.8691 -2.709 0.4799 -2.0379 -2.0295 26.8032 26.6357 26.8973 26.3373
(0.18) (0.89) (0.84) (0.97) (0.88) (0.88) (0.21) (0.21) (0.21) (0.22)DBLACK 35.5407 -7.6439 -8.2912 -4.6843 -7.7413 -7.1919 25.1725 24.8345 25.2457 24.3809
(0.19) (0.56) (0.51) (0.73) (0.55) (0.59) (0.21) (0.22) (0.21) (0.22)DASIAN 57.9889* -2.1364 -3.6306 0.2821 -2.5474 -1.6941 44.9694 44.9436 45.0031 44.6178
(0.09) (0.88) (0.8) (0.98) (0.86) (0.91) (0.1) (0.11) (0.1) (0.11)DHISP 40.2164 -5.3202 -6.307 -2.9899 -5.5578 -5.8122 26.7493 26.5794 26.7759 26.3059
(0.15) (0.7) (0.63) (0.83) (0.68) (0.67) (0.18) (0.18) (0.18) (0.19)DPOV -2.2796 11.2356 11.723 10.5979 11.3069 13.996 35.5476 36.418 35.5795 36.4716
(0.94) (0.44) (0.43) (0.47) (0.44) (0.33) (0.23) (0.23) (0.23) (0.23)DUNMP -38.6361 -0.0459 0.8192 4.1101 0.2486 -3.487 -21.7382 -22.6779 -21.7235 -22.7742
(0.26) (1) (0.97) (0.83) (0.99) (0.86) (0.46) (0.44) (0.46) (0.44)DAREA 0.0005* 0.0001 0.0001 0.0001 0.0001 0.0001 0.0004** 0.0004** 0.0004** 0.0004**
(0.05) (0.22) (0.23) (0.21) (0.22) (0.24) (0.03) (0.03) (0.03) (0.03)PTAX 0.4053 0.064 0.0598 0.0125 0.0659 0.0509 0.1419 0.1398 0.1416 0.138
(0.24) (0.76) (0.77) (0.94) (0.75) (0.81) (0.64) (0.64) (0.65) (0.65)FINSTI 54.2215*** 19.7425*** 19.706*** 19.8558*** 19.7332*** 19.7511*** 71.0229*** 71.0204*** 71.0165*** 70.9787***
(0.00) (0.00) (0.00) (0.00) (0.00) (0.00) (0.00) (0.00) (0.00) (0.00)FBRANCH/ -1.5591 -0.0292 -0.154 -0.3516 -0.0387 0.6351 7.1136 6.9617 7.0515 6.8936FINSTI (0.77) (1) (0.98) (0.95) (0.99) (0.91) (0.24) (0.24) (0.24) (0.25)
FDEPO/FINSTI -1.5591 0.0177 6.9617 7.0515 6.8936(0.77) (0.58) (0.24) (0.24) (0.25)
FALN 0.9722*** 0.9726*** 0.9679*** 0.9725*** 0.9717***(0.00) (0.00) (0.00) (0.00) (0.00)
FALAVE 17.5219 19.1437 22.6161 18.2856 25.3088(0.4) (0.38) (0.34) (0.39) (0.37)
FALMIA/FALA 7.0293(0.27)
FALMIN/FALN -6.6582(0.27)
FALIA/FALA 28.6861(0.26)
FALIN/FALN -41.2395(0.25)
FAMIA/FALA 2.4595(0.49)
FAMIN/FALN -2.3066(0.48)
FLSMA/FALA -2.197(0.51)
FLSMN/FALN -2.9871(0.56)
BLMIPB 0.1719(0.87)
BLMIIB 0.0162(0.6)
BLIPB 0.0175(0.58)
BLIIB 0.0157(0.61)
Adjusted R2 0.91 0.96 0.96 0.96 0.96 0.96 0.88 0.88 0.88 0.88F-statistic 187.24 448.94 402.63 406.22 401.34 402.44 108.85 108.89 108.85 108.93Prob(F-statistic) 0.00 0.00 0.00 0.00 0.00 0.00 0.00 0.00 0.00 0.00Number of
Observations 304 304 304 304 304 304 263 263 263 263
Note: White heteroskedasticity-consistent standard errors and covariance, and p-values in parentheses. “*,”“**,” and “***” denote significance at 10, 5, and 1 percent level, respectively.

128 James R. Barth, Glenn Yago, and Betsy Zeidman
Table 11Determinants of the Proportion of All Establishments
with Zero Employees in MSAs
Adjusted R2 0.45 0.51 0.51 0.52 0.51 0.51 0.52 0.51 0.52 0.51F-statistic 15.52 18.38 16.64 17.66 16.47 16.69 16.80 15.94 17.05 15.95Prob(F-statistic) 0.00 0.00 0.00 0.00 0.00 0.00 0.00 0.00 0.00 0.00Number of 304 304 304 304 304 304 263 263 263 263
ObservationsNote: White heteroskedasticity-consistent standard errors and covariance, and p-values in parentheses. “*,”“**,” and “***” denote significance at 10, 5, and 1 percent level, respectively.
(11) (12) (13) (14) (15) (16) (17) (18) (19) (20)C 30.8829*** 29.2656*** 29.43*** 27.8883*** 29.4023*** 28.6697*** 33.1876*** 31.6319*** 34.5476***32.3549***
(0.00) (0.00) (0.00) (0.00) (0.00) (0.00) (0.00) (0.00) (0.00) (0.00)DPOP 0.1408* -0.136 -0.1407 -0.1378 -0.1364 -0.1109 0.0407 0.0732 0.0229 0.0744
(0.09) (0.12) (0.11) (0.11) (0.12) (0.2) (0.74) (0.56) (0.85) (0.56)DAGE2544 -19.7088*** -17.9906*** -18.0376***-18.0403***-18.0329*** -18.2297*** -18.8713*** -20.3811*** -20.8687***-20.6081***
(0.00) (0.00) (0.00) (0.00) (0.00) (0.00) (0.00) (0.00) (0.00) (0.00)DHINC 0.0591** 0.0638** 0.0624** 0.0603** 0.0633** 0.067** 0.0352 0.0364 0.0375 0.0372
(0.04) (0.02) (0.02) (0.03) (0.02) (0.02) (0.18) (0.19) (0.15) (0.18)DHOMEO 0.798 0.8918 0.7458 0.8654 0.8547 0.8727 0.6195 0.7023 0.1854 0.5789
(0.6) (0.53) (0.6) (0.54) (0.54) (0.54) (0.69) (0.65) (0.91) (0.71)DCGRAD -6.8144*** -4.1744* -4.369* -4.0379* -4.3048* -4.2408* -8.4136*** -7.2291*** -8.4427*** -7.2441***
(0.01) (0.09) (0.07) (0.1) (0.08) (0.09) (0.00) (0.01) (0.00) (0.01)DHGRAD -14.8809*** -12.1151*** -12.3388***-12.2407***-12.2593*** -12.0993*** -17.5918*** -15.9514*** -17.7986***-15.9402***
(0.00) (0.00) (0.00) (0.00) (0.00) (0.00) (0.00) (0.00) (0.00) (0.00)DWHITE -8.2744** -8.576** -8.2787** -6.8336* -8.4957** -8.7224** -9.2084** -8.5682** -8.8726** -8.4037**
(0.03) (0.02) (0.03) (0.06) (0.02) (0.02) (0.02) (0.04) (0.03) (0.04)DBLACK -9.955*** -10.8093*** -10.5301***-8.6809*** -10.7582*** -11.2594*** -10.992*** -10.1465*** -10.5447***-9.8809***
(0.00) (0.00) (0.00) (0.01) (0.00) (0.00) (0.00) (0.01) (0.00) (0.01)DASIAN -10.0449** -12.9886*** -12.47*** -11.2739*** -12.7854*** -13.2606*** -11.6905*** -11.9891*** -11.401***-11.7154***
(0.01) (0.00) (0.00) (0.00) (0.00) (0.00) (0.01) (0.01) (0.01) (0.01)DHISP -3.723 -5.4441 -5.0977 -3.7956 -5.3289 -5.464 -4.9681 -4.835 -4.651 -4.6695
(0.32) (0.12) (0.15) (0.26) (0.13) (0.12) (0.21) (0.21) (0.24) (0.23)DPOV -1.6707 -2.0844 -2.2035 -2.8781 -2.1236 -3.0137 -1.475 -2.5819 -0.3912 -2.1022
(0.72) (0.65) (0.63) (0.54) (0.65) (0.53) (0.76) (0.61) (0.94) (0.68)DUNMP 1.8673 5.3184 5.0948 7.4732 5.1864 6.6717 6.9156 8.6337 5.237 8.2132
(0.83) (0.52) (0.54) (0.36) (0.53) (0.42) (0.42) (0.34) (0.54) (0.36)DALLEST/ 3.7939 5.8303** 5.6273** 5.6892** 5.6909** 5.6316** 17.7425 21.3137 16.2277 22.493DAREA (0.18) (0.03) (0.04) (0.04) (0.03) (0.03) (0.31) (0.21) (0.35) (0.2)PTAX -0.19*** -0.1982*** -0.1976*** -0.2069*** -0.1992*** -0.1941*** -0.2221*** -0.2156*** -0.2056*** -0.215***
(0.00) (0.00) (0.00) (0.00) (0.00) (0.00) (0.00) (0.00) (0.00) (0.00)FINSTI 0.3346 -1.4087*** -1.3929*** -1.3381*** -1.399*** -1.3822*** 1.3681* 1.2787* 1.4472* 1.3137*
(0.11) (0.00) (0.00) (0.00) (0.00) (0.00) (0.07) (0.1) (0.06) (0.09)FBRANCH/ -3.0738*** -2.255*** -2.2069*** -2.2312*** -2.2485*** -2.4762*** -2.6224*** -2.8274*** -2.7862*** -2.7961***FINSTI (0.00) (0.01) (0.01) (0.01) (0.01) (0.00) (0.00) (0.00) (0.00) (0.00)FDEPO/FINSTI -3.0738*** -0.0036 -2.8274*** -2.7862*** -2.7961***
(0.00) (0.37) (0.00) (0.00) (0.00)FALN 0.0425*** 0.0423*** 0.0413*** 0.0423*** 0.0426***
(0.00) (0.00) (0.00) (0.00) (0.00)FALAVE -29.752*** -30.2232***-26.0908***-30.1226*** -30.6803***
(0.00) (0.00) (0.00) (0.00) (0.00)FALMIA/FALA -2.1754*
(0.08)FALMIN/FALN 1.9719*
(0.09)FALIA/FALA 1.6983
(0.55)FALIN/FALN -8.9101**
(0.03)FAMIA/FALA -1.1306
(0.43)FAMIN/FALN 1.0553
(0.42)FLSMA/FALA 1.2357
(0.34)FLSMN/FALN 0.4453
(0.78)BLMIPB 1.3474***
(0.00)BLMIIB -0.0027
(0.52)BLIPB -0.0034
(0.41)BLIIB -0.003
(0.47)

Stumbling Blocks to Entrepreneurship in Low- and Moderate-Income Communities 129
Table 12Determinants of the Proportion of All Establishments
with One to 10 Employees in MSAs
Adjusted R2 0.22 0.45 0.45 0.47 0.46 0.48 0.21 0.24 0.20 0.23F-statistic 6.12 14.95 13.55 14.42 13.73 15.17 4.92 5.66 4.53 5.43Prob(F-statistic) 0.00 0.00 0.00 0.00 0.00 0.00 0.00 0.00 0.00 0.00Number of 304 304 304 304 304 304 263 263 263 263
ObservationsNote: White heteroskedasticity-consistent standard errors and covariance, and p-values in parentheses. “*,”“**,” and “***” denote significance at 10, 5, and 1 percent level, respectively.
(21) (22) (23) (24) (25) (26) (27) (28) (29) (30)C 93.1138*** 77.6937*** 77.3634***75.3165*** 76.9685*** 74.1037*** 98.0181*** 94.4051*** 98.2193*** 96.409***
(0.00) (0.00) (0.00) (0.00) (0.00) (0.00) (0.00) (0.00) (0.00) (0.00)DPOP -0.2336** -0.2445 -0.2489 -0.2459 -0.2462 -0.186 -0.4361** -0.3977** -0.4131** -0.3949**
(0.04) (0.13) (0.13) (0.12) (0.13) (0.25) (0.03) (0.04) (0.04) (0.04)DAGE2544 -64.0189*** -41.7806*** -41.4877***-41.871*** -41.471*** -42.361*** -62.8361*** -64.0091*** -65.2091***-64.6551***
(0.00) (0.00) (0.00) (0.00) (0.00) (0.00) (0.00) (0.00) (0.00) (0.00)DHINC 0.0837* 0.0685* 0.0705* 0.0626 0.0711* 0.0726* -0.0052 -0.011 0.0013 -0.0079
(0.06) (0.09) (0.08) (0.12) (0.07) (0.06) (0.92) (0.83) (0.98) (0.88)DHOMEO -5.1658 -1.2687 -1.1446 -1.2697 -1.0955 -0.4928 -7.7863** -8.0406** -7.6305** -8.2559**
(0.14) (0.67) (0.7) (0.66) (0.71) (0.87) (0.04) (0.03) (0.05) (0.03)DCGRAD 1.0725 7.3529 7.4891 7.5467 7.9867* 9.7572** -4.6631 -2.6662 -4.0077 -2.8131
(0.84) (0.11) (0.1) (0.1) (0.08) (0.04) (0.44) (0.64) (0.5) (0.63)DHGRAD 0.5533 6.6116 6.7724* 6.3432 7.3187* 8.6924** -4.2323 -1.9095 -3.0972 -1.9531
(0.91) (0.1) (0.09) (0.12) (0.06) (0.03) (0.43) (0.69) (0.55) (0.69)DWHITE -23.0425* -15.6057 -15.7591 -12.6056 -15.9846 -16.336 -20.0117* -18.6537* -19.7203* -18.3901*
(0.06) (0.23) (0.21) (0.29) (0.19) (0.13) (0.09) (0.06) (0.07) (0.07)DBLACK -25.1313** -19.9986 -19.9302 -16.3247 -20.1597* -20.663** -21.687* -19.6609** -21.4489** -19.2468**
(0.04) (0.11) (0.11) (0.16) (0.09) (0.05) (0.05) (0.04) (0.04) (0.04)DASIAN -20.4272 -16.7767 -17.1874 -13.8139 -17.7875 -19.211* -16.1942 -16.7962 -16.2046 -16.1189
(0.11) (0.19) (0.17) (0.25) (0.15) (0.08) (0.19) (0.12) (0.17) (0.14)DHISP -20.1849 -16.4755 -16.6959 -13.6295 -17.0359 -16.6043 -16.8538 -16.249 -16.9178 -15.9548
(0.11) (0.2) (0.18) (0.25) (0.16) (0.12) (0.15) (0.1) (0.12) (0.11)DPOV -2.0024 -2.515 -2.1387 -3.8674 -2.2049 -7.4542 -3.9417 -7.3362 -3.2361 -5.8301
(0.85) (0.78) (0.82) (0.68) (0.81) (0.42) (0.71) (0.47) (0.75) (0.57)DUNMP 5.8645 9.1675 9.6465 12.9711 9.8801 13.2707 -1.5469 3.1452 -2.2737 1.6654
(0.71) (0.5) (0.47) (0.34) (0.47) (0.31) (0.92) (0.84) (0.88) (0.91)DALLEST/ 37.0554*** 31.8127*** 32.0151*** 31.515*** 32.5208*** 29.8309*** 61.002* 72.7755** 58.8491* 74.0312**DAREA (0.00) (0.00) (0.00) (0.00) (0.00) (0.00) (0.06) (0.03) (0.08) (0.03)
PTAX -0.1909* -0.1514* -0.1556* -0.1686* -0.1476* -0.1169 -0.2106* -0.1992* -0.2018* -0.1984*(0.05) (0.08) (0.08) (0.06) (0.1) (0.15) (0.06) (0.07) (0.06) (0.07)
FINSTI 0.5794 0.3086 0.2737 0.4338 0.2509 0.0146 1.7491 1.5085 1.7819 1.615(0.22) (0.74) (0.77) (0.65) (0.79) (0.99) (0.24) (0.31) (0.23) (0.27)
FBRANCH/ -1.9647 1.1295 1.1058 1.1507 1.1079 -0.0222 -1.5584 -1.4913 -1.9898 -1.4802FINSTI (0.24) (0.41) (0.42) (0.39) (0.42) (0.99) (0.38) (0.37) (0.27) (0.38)
FDEPO/FINSTI -1.9647 0.0075 -1.4913 -1.9898 -1.4802(0.24) (0.47) (0.37) (0.27) (0.38)
FALN 0.0055 0.006 0.0033 0.0066 0.0093(0.76) (0.74) (0.86) (0.72) (0.58)
FALAVE -137.4752***-136.5849***-131.1443***-135.5213***-170.9063***(0.00) (0.00) (0.00) (0.00) (0.00)
FALMIA/FALA 2.6911(0.31)
FALMIN/FALN -2.8907(0.24)
FALIA/FALA 4.473(0.53)
FALIN/FALN -17.1149(0.12)
FAMIA/FALA 5.8771**(0.04)
FAMIN/FALN -5.6563**(0.03)
FLSMA/FALA -1.8321(0.32)
FLSMN/FALN 11.3279***(0.00)
BLMIPB 1.6144**(0.02)
BLMIIB 0.0116(0.32)
BLIPB 0.0063(0.55)
BLIIB 0.0103(0.36)

130 James R. Barth, Glenn Yago, and Betsy Zeidman
Table 13Determinants of the Proportion of All Establishments with
11-100 Employees in MSAs(31) (32) (33) (34) (35) (36) (37) (38) (39) (40)
C -7.1981 2.0116 1.9568 3.4213 2.0365 2.9359 -12.287** -10.5271* -13.3226** -11.4774**(0.19) (0.71) (0.72) (0.5) (0.71) (0.58) (0.03) (0.05) (0.02) (0.03)
DPOP -0.1168 -0.0183 -0.0197 -0.0202 -0.022 -0.0545 0.0057 -0.0112 0.0249 -0.0126(0.12) (0.89) (0.88) (0.87) (0.86) (0.67) (0.96) (0.92) (0.83) (0.91)
DAGE2544 32.0876*** 18.6097*** 18.6675*** 18.6708*** 18.6845*** 18.9548*** 35.3272*** 35.788*** 36.3909*** 36.0906***(0.00) (0.00) (0.00) (0.00) (0.00) (0.00) (0.00) (0.00) (0.00) (0.00)
DHINC 0.0078 0.0164 0.0167 0.0196 0.0165 0.012 0.0537* 0.057* 0.0533* 0.0558*(0.76) (0.45) (0.44) (0.38) (0.45) (0.58) (0.07) (0.05) (0.07) (0.06)
DHOMEO 1.9593 -0.2729 -0.2601 -0.3436 -0.3023 -0.27 2.7789 2.924 3.1579 3.0539(0.34) (0.88) (0.88) (0.85) (0.87) (0.88) (0.2) (0.17) (0.15) (0.15)
DCGRAD 4.8999 0.0983 0.1091 0.0502 0.0189 0.1172 6.7583* 5.8213 6.9256* 5.8679*(0.12) (0.97) (0.97) (0.99) (0.99) (0.97) (0.06) (0.1) (0.05) (0.1)
DHGRAD 7.2376*** 2.5526 2.566 2.7943 2.4711 2.4685 8.9938*** 7.9328*** 9.4078*** 7.9371***(0.01) (0.24) (0.24) (0.2) (0.25) (0.27) (0.00) (0.01) (0.00) (0.01)
DWHITE 8.4366* 4.6491 4.6441 2.8819 4.7088 4.8717 9.4899** 8.8345** 9.2874* 8.6674**(0.05) (0.35) (0.36) (0.52) (0.34) (0.3) (0.05) (0.04) (0.06) (0.04)
DBLACK 3.5434 1.2417 1.2821 -0.9368 1.357 1.8785 3.8717 2.8819 3.569 2.6151(0.39) (0.8) (0.79) (0.83) (0.78) (0.68) (0.38) (0.46) (0.43) (0.51)
DASIAN 9.1397** 8.692* 8.6531* 6.9299 8.7936* 9.138* 9.4123* 9.7012** 9.1802* 9.3622**(0.05) (0.09) (0.09) (0.14) (0.08) (0.06) (0.07) (0.04) (0.08) (0.05)
DHISP 3.4735 2.416 2.4014 0.7275 2.4858 2.4472 4.7315 4.4229 4.4656 4.2474(0.42) (0.62) (0.63) (0.87) (0.61) (0.6) (0.3) (0.28) (0.34) (0.3)
DPOV 9.5649* 10.3635** 10.4323** 11.1373** 10.4551** 11.7852** 13.7282** 15.4207*** 13.023** 14.7452***(0.08) (0.04) (0.04) (0.03) (0.04) (0.02) (0.02) (0.01) (0.02) (0.01)
DUNMP 10.3572 6.854 6.9349 4.4638 6.8419 4.8765 6.028 3.7092 7.2009 4.3421(0.33) (0.45) (0.45) (0.62) (0.46) (0.6) (0.57) (0.73) (0.5) (0.69)
DALLEST/DAREA -17.6569*** -15.3258*** -15.3017*** -15.0627*** -15.3812***-14.9941*** -6.8599 -12.7596 -6.1309 -13.7956
(0.00) (0.00) (0.00) (0.00) (0.00) (0.00) (0.7) (0.47) (0.73) (0.44)PTAX 0.1365** 0.1157** 0.1149** 0.1296** 0.1143** 0.109** 0.1274** 0.1221** 0.1162* 0.1215**
(0.01) (0.04) (0.04) (0.03) (0.04) (0.05) (0.04) (0.04) (0.06) (0.04)FINSTI -0.0253 0.7539 0.7479 0.6742 0.7494 0.7264 -1.6041** -1.4853* -1.6596** -1.5337**
(0.91) (0.17) (0.18) (0.21) (0.18) (0.21) (0.04) (0.05) (0.03) (0.04)FBRANCH/ 5.5478*** 3.431*** 3.4304*** 3.4502*** 3.4448*** 3.7687*** 5.6606*** 5.6022*** 5.6958*** 5.5803***FINSTI (0.00) (0.00) (0.00) (0.00) (0.00) (0.00) (0.00) (0.00) (0.00) (0.00)
FDEPO/ 5.5478*** -0.0027 5.6022*** 5.6958*** 5.5803***FINSTI (0.00) (0.62) (0.00) (0.00) (0.00)
FALN -0.0172 -0.0171 -0.0156 -0.0171 -0.0174(0.22) (0.23) (0.25) (0.23) (0.24)
FALAVE 90.8097*** 90.9548*** 87.0376*** 90.7309*** 93.0853***(0.00) (0.00) (0.00) (0.00) (0.00)
FALMIA/FALA 0.3689(0.78)
FALMIN/FALN -0.4302(0.72)
FALIA/FALA -5.1177(0.12)
FALIN/FALN 12.9234**(0.02)
FAMIA/FALA -0.3203(0.84)
FAMIN/FALN 0.1343(0.92)
FLSMA/FALA -1.6383(0.2)
FLSMN/FALN -0.9503(0.59)
BLMIPB -0.7146(0.11)
BLMIIB -0.0048(0.42)
BLIPB -0.0031(0.56)
BLIIB -0.0043(0.46)
Adjusted R2 0.21 0.46 0.46 0.48 0.46 0.47 0.25 0.27 0.26 0.26F-statistic 5.77 15.61 13.96 14.88 13.99 14.37 5.80 6.29 6.02 6.21Prob(F-statistic) 0.00 0.00 0.00 0.00 0.00 0.00 0.00 0.00 0.00 0.00Number of
Observations 304 304 304 304 304 304 263 263 263 263
Note: White heteroskedasticity-consistent standard errors and covariance, and p-values in parentheses. “*,”“**,” and “***” denote significance at 10, 5, and 1 percent level, respectively.

Table 14Determinants of the proportion of All Establishments with 100
or More Employees in MSAs
Stumbling Blocks to Entrepreneurship in Low- and Moderate-Income Communities 131
(41) (42) (43) (44) (45)C -16.7986* -8.9709 -8.7502 -6.6261 -8.4072
(0.1) (0.39) (0.4) (0.49) (0.4)DPOP 0.2096 0.3988*** 0.4093*** 0.4038*** 0.4047***
(0.18) (0.01) (0.01) (0.00) (0.01)DAGE2544 51.6401*** 41.1614*** 40.8578*** 41.2405*** 40.8194***
(0.00) (0.00) (0.00) (0.00) (0.00)DHINC -0.1506*** -0.1487*** -0.1497*** -0.1425*** -0.151***
(0.00) (0.00) (0.00) (0.00) (0.00)DHOMEO 2.4085 0.6499 0.659 0.7478 0.543
(0.46) (0.83) (0.83) (0.81) (0.86)DCGRAD 0.842 -3.2768 -3.2292 -3.5589 -3.7009
(0.86) (0.45) (0.46) (0.41) (0.4)DHGRAD 7.09* 2.9509 3.0004 3.1032 2.4695
(0.07) (0.42) (0.42) (0.4) (0.5)DWHITE 22.8803** 19.5326* 19.3937* 16.5573* 19.7715**
(0.02) (0.06) (0.06) (0.08) (0.05)DBLACK 31.5429*** 29.5662*** 29.1783*** 25.9424*** 29.5609***
(0.00) (0.00) (0.00) (0.00) (0.00)DASIAN 21.3324** 21.0732** 21.0044** 18.1579* 21.7793**
(0.04) (0.05) (0.05) (0.06) (0.03)DHISP 20.4344** 19.5036* 19.3922* 16.6976* 19.879**
(0.04) (0.06) (0.06) (0.07) (0.05)DPOV -5.8919 -5.7641 -6.0902 -4.3918 -6.1267
(0.56) (0.56) (0.54) (0.66) (0.54)DUNMP -18.089 -21.34 -21.6762 -24.9081* -21.9085
(0.25) (0.15) (0.14) (0.09) (0.14)DALLEST/DAREA -23.1924*** -22.3171*** -22.3407*** -22.1415** -22.8306***
(0.00) (0.01) (0.01) (0.01) (0.00)PTAX 0.2444** 0.234** 0.2383** 0.2459** 0.2325**
(0.02) (0.02) (0.02) (0.01) (0.02)FINSTI -0.8887** 0.3463 0.3712 0.2301 0.3987
(0.05) (0.72) (0.71) (0.82) (0.69)FBRANCH/FINSTI -0.5093 -2.3054 -2.3293 -2.3698* -2.3042
(0.74) (0.1) (0.1) (0.08) (0.11)FDEPO/FINSTI -0.5093
(0.74)FALN -0.0308 -0.0313 -0.029 -0.0318
(0.14) (0.13) (0.19) (0.13)FALAVE 76.4174*** 75.8533*** 70.1975*** 74.913***
(0.00) (0.00) (0.00) (0.00)FALMIA/FALA -0.8847
(0.78)FALMIN/FALN 1.349
(0.64)FALIA/FALA -1.0536
(0.88)FALIN/FALN 13.1016
(0.19)FAMIA/FALA -4.4263
(0.13)FAMIN/FALN 4.4668*
(0.1)FLSMA/FALA
FLSMN/FALN
BLMIPB
BLMIIB
BLIPB
BLIIB
Adjusted R2 0.36 0.44 0.44 0.46 0.44F-statistic 11.17 14.18 12.84 13.68 12.93Prob(F-statistic) 0.00 0.00 0.00 0.00 0.00Number of Observations 304 304 304 304 304

132 James R. Barth, Glenn Yago, and Betsy Zeidman
Table 14 (cont.)(46) (47) (48) (49) (50)
C -5.7093 -18.9187* -15.5099* -19.4443** -17.2865*(0.53) (0.06) (0.08) (0.04) (0.05)
DPOP 0.3514** 0.3896* 0.3357 0.3653* 0.3331(0.02) (0.06) (0.12) (0.09) (0.12)
DAGE2544 41.6359*** 46.3802*** 48.6022*** 49.687*** 49.1726***(0.00) (0.00) (0.00) (0.00) (0.00)
DHINC -0.1515*** -0.0838 -0.0824 -0.0922* -0.085*(0.00) (0.11) (0.11) (0.08) (0.1)
DHOMEO -0.1098 4.3878 4.4143 4.2873 4.6232(0.97) (0.21) (0.2) (0.22) (0.18)
DCGRAD -5.6336 6.3184 4.074 5.5248 4.1893(0.22) (0.23) (0.43) (0.29) (0.42)
DHGRAD 0.9385 12.8303*** 9.9281** 11.488*** 9.9562**(0.8) (0.00) (0.01) (0.01) (0.01)
DWHITE 20.1868** 19.7302* 18.3874** 19.3055** 18.1264**(0.02) (0.05) (0.03) (0.04) (0.03)
DBLACK 30.0439*** 28.8072*** 26.9255*** 28.4246*** 26.5126***(0.00) (0.00) (0.00) (0.00) (0.00)
DASIAN 23.3336** 18.4724* 19.0841** 18.4255* 18.4721**(0.01) (0.09) (0.04) (0.07) (0.05)
DHISP 19.6211** 17.0904* 16.6611** 17.1032* 16.3769**(0.03) (0.09) (0.04) (0.07) (0.05)
DPOV -1.3173 -8.3115 -5.5027 -9.3957 -6.8129(0.9) (0.42) (0.58) (0.35) (0.49)
DUNMP -24.8188* -11.3967 -15.4881 -10.1642 -14.2208(0.09) (0.45) (0.33) (0.51) (0.37)
DALLEST/DAREA -20.4685** -71.8846* -81.3296** -68.9459* -82.7286**(0.01) (0.06) (0.03) (0.07) (0.03)
PTAX 0.202** 0.3053*** 0.2928*** 0.2912*** 0.292***(0.04) (0.01) (0.01) (0.01) (0.01)
FINSTI 0.6412 -1.5131 -1.3019 -1.5695 -1.395(0.49) (0.34) (0.42) (0.33) (0.39)
FBRANCH/FINSTI -1.2703 -1.4798 -1.2834 -0.9197 -1.304(0.38) (0.38) (0.43) (0.6) (0.43)
FDEPO/FINSTI -0.0012 -1.2834 -0.9197 -1.304(0.89) (0.43) (0.6) (0.43)
FALN -0.0345*(0.07)
FALAVE 108.5013***(0.00)
FALMIA/FALA
FALMIN/FALN
FALIA/FALA
FALN/FALN
FAMIA/FALA
FAMIN/FALN
FLSMA/FALA 2.2348(0.25)
FLSMN/FALN -10.823***(0.00)
BLMIPB -2.2472***(0.00)
BLMIIB -0.0041(0.67)
BLIPB 0.0002(0.99)
BLIIB -0.003(0.75)
Adjusted R2 0.46 0.38 0.38 0.35 0.38F-statistic 14.05 9.94 10.09 8.91 9.86Prob(F-statistic) 0.00 0.00 0.00 0.00 0.00Number of Observations 304 263 263 263 263
Note: White heteroskedasticity-consistent standard errors and covariance, and p-values in parentheses. “*,”“**,” and “***” denote significance at 10, 5, and 1 percent level, respectively.

Stumbling Blocks to Entrepreneurship in Low- and Moderate-Income Communities 133
employee and educational level. But the share of the population withat least a college degree or no more than a high school diploma tendto be associated negatively with the share of establishments with noemployees. This negative relationship is particularly strong in the caseof the high school variable.
Race/ethnicity
• We generally do not find any consistent relationships between therace/ethnic variables and the total number of establishments. The relation-ships between these variables and the size composition of establishmentsare more interesting. The regression results indicate that MSAs with alarger share of the population being Hispanic are also those with a largershare of establishments with 100 or more employees. On the other hand,MSAs with a larger mix of white, African-American, and Asian-Americanpopulations tend to be associated positively with a larger share of big estab-lishments and associated negatively with a larger share of the smallestestablishments. There is also some modest evidence that MSAs with largerAsian-American populations tend to have a larger share of establishmentswith 11-100 employees.
Poverty
• We did not find any relationships between the degree of poverty andthe number of establishments. There is also no evidence suggesting arelationship between poverty and the share of either the smallest orbiggest establishments in MSAs. Instead, the data indicate that MSAswith lower poverty rates tend to have a smaller proportion ofmedium-sized (11-100 employees) establishments.
Unemployment
• We do not find a relationship between unemployment rates withinMSAs and the total number of establishments or the size compositionof establishments. Only in two of the six regressions for the share ofestablishments with more than 100 employees are the coefficients forthe unemployment rate negative and marginally significant.
Land area
• Although we find no relationship between the number of establish-ments and the land area in the MSAs, we do find a negativerelationship between establishments per square mile and the share of

134 James R. Barth, Glenn Yago, and Betsy Zeidman
establishments with more than 10 employees. This relationship,however, is positive in the regressions for the share of establishmentswith fewer than 10 employees.
Sales tax rate
• We find no relationship between the state sales tax rate and the numberof total establishments in MSAs. However, we do find that a higher taxrate tends to have a negative correlation with the share of zero-to-10-employee establishments, whereas it tends to have a positive associationwith the share of establishments with 10 or more employees.
Financial institutions
• After controlling for branches per institution, MSAs with more finan-cial institutions tend to have more total establishments, but a smallershare of zero-employee establishments.
• Though we do not find a relationship between branches per financialinstitution within an MSA and the total number of establishments,we find the number of branches per financial institution tends to havea negative relationship with the share of zero-employee establish-ments, a positive relationship with the share of 11-to-100-employeeestablishments and a negative but marginally significant relationshipwith the share of 100+-employee establishments.
• After controlling for the number of institutions, deposits per institu-tion is correlated negatively with the share of zero-employeeestablishments, positively associated with the proportion of 11-to-100-employee establishments, and has no relationship to the othersize or total establishment variables.
Loan activity in LMI communities
• MSAs with larger numbers of loans tend to have not only more estab-lishments, but also a larger share of zero-employee establishments.
• We do not find a relationship between the average size of loans withinan MSA and the total number of establishments. However, we dofind that MSAs with higher-average-size loans tend to have a smallershare of zero-to-10-employee establishments and a larger share of11+-employee establishments.

Stumbling Blocks to Entrepreneurship in Low- and Moderate-Income Communities 135
• We find marginal evidence that the higher the share of loan amountsto businesses in LMI communities, the smaller the share of zero-employee establishments. Yet, the marginal evidence indicates thatthe higher the share of number of loans to businesses in LMI commu-nities, the larger the share of zero-employee establishments. We donot find that the share of the amount or number of loans to LMIcommunities provides any explanatory power with respect to othersize categories of establishments.
• We do not find any significant relationship between the share of loanamounts to businesses in LI communities and the total number ofestablishments or the size composition of establishments. However,the share of loan numbers to businesses in LI communities has a nega-tive and significant relationship to the share of zero-employeeestablishments, a negative but not significant relationship with theshare of one-to-10-employee establishments, a positive and significantrelationship with the share of 11-to-100-employee establishments, anda positive but not significant relationship with the share of 100+-employee establishments.
• The share of the total amount of loans to MI communities is relatedpositively to only the share of establishments with one to 10 employ-ees, while the share of the number of loans to MI communities isrelated negatively to the same-size establishments. The share of thetotal number of loans to MI communities also is associated positivelywith a larger share of establishments with more than 100 employees.
• While the share of total amount of loans to establishments with lessthan $1 million of receipts does not have a significant relationshipwith the total number or size composition of establishments, theshare of the total number of loans to such establishments tends tohave a positive correlation with the share of establishments with oneto 10 employees. At the same time, the share of the total number ofloans to establishments with less than $1 million in receipts tends tohave a negative association with the share of establishments with 100or more employees.

136 James R. Barth, Glenn Yago, and Betsy Zeidman
Loan bias
• None of the four measures of loan bias has a significant association withthe total number of establishments. However, the loan bias measure forLMI communities based upon population is associated positively withestablishments with zero employees and those with one to 10 employ-ees, while associated negatively with establishments with 100 or moreemployees. But these significant results disappear when the loan biasmeasure is based on income rather than population.
In summary, the results indicate that several factors matter for entrepre-neurship, as measured indirectly by the size composition of establishmentsin MSAs throughout the United States. The way in which these factors arerelated to entrepreneurship, however, varies depending on the size measureused. It is useful, therefore, to summarize the findings by establishment size.
Establishments with zero employees
One finds in MSAs that the greater the share of total establishments thatare zero-employee establishments, the lower the share of the populationaged 25 to 44, the higher the household income, the smaller the percentageof the labor force with a college degree, and the smaller the share of thelabor force that has a high school diploma or less. In addition, one finds thatthe greater the share of establishments that are zero-employee establish-ments, the greater the race/ethnic mix of the population; the lower the statesales tax rate; the larger the number of financial institutions; the lower thenumber of branches per institution; the lower the deposits per institution;the greater the number of loans; the lower the average loan size; the lowerthe share of the total amount of loans to businesses in LMI communities inMSAs; the larger the share of the total number of loans to businesses in LMIcommunities in MSAs; and the lower the share of the total number of loansmade to businesses in LI communities.
Establishments with one to 10 employees
Our work suggests that the greater the share of total establishments thatare one-to-10-employee establishments, the lower the share of the popula-tion aged 25 to 44, the higher the household income, the higher the

percentage of the labor force with a college degree (in two of six regressions),and the higher the share of the labor force that has a high school diplomaor less (in three of six regressions). In addition, one finds that the greater theshare of establishments that are one-to-10-employee establishments, thelower the state sales tax rate; the lower the average loan size; the greater theshare of the total amount of loans to businesses in MI communities inMSAs; the lower the share of the total number of loans to businesses in MIcommunities in MSAs; and the greater the share of the total number ofloans made to establishments with receipts of less than $1 million.
Establishments with 11 to 100 employees
The greater the share of total establishments that are 11-to-100-employeeestablishments, the greater the share of the population aged 25 to 44; thehigher the poverty rate; the higher the state sales tax rate; the higher thenumber of branches per institution; the higher the amount of deposits perinstitution; the higher the average loan size; and the larger the share of thetotal number of loans to businesses in LI communities in MSAs.
Establishments with 100 or more employees
One finds in MSAs that the greater the share of total establishments thatare 100+-employee establishments, the higher the population of the MSA; thehigher the share of the population aged 25 to 44; the lower the householdincome; the lower the race/ethnic mix of the population; the lower the unem-ployment rate (this is a marginal result in two of six regressions); the higherthe state sales tax rate; the larger the average loan size; the higher the share ofthe total number of the loans to businesses in MI communities in MSAs; andthe lower the share of the total number of loans made to establishments withreceipts of less than $1 million.
All establishments
The findings for all establishments are important because, to the extent thata factor increases this variable, any tradeoff between that factor’s effect on thesize composition of establishments and the number of establishments
Stumbling Blocks to Entrepreneurship in Low- and Moderate-Income Communities 137

becomes less important. The reason, of course, is that with more establish-ments, a smaller share of the total for any size category can experience,nonetheless, an absolute increase in the number of establishments. In the caseof other factors that are not significant for total establishments, but are notsignificant in explaining the size composition of establishments, there arenecessarily tradeoffs (that is to say, an increase in the share of one size categorywithin an MSA at the expense of a decrease in both the number and the shareof one or more other size categories). In this respect, only four factors seem tomatter for the total number of establishments. These factors are the share ofpopulation in the 25-44 age group, the homeownership rate, the number offinancial institutions, and the total number of loans made in an MSA. All fourare correlated positively with the total number of establishments.
Clearly, the empirical results presented here emphasize the need todevelop a more general microeconomic model and to assemble better microdata (preferably panels) to understand more fully the key determinants ofentrepreneurial activity in different geographical regions. Unfortunately, asdiscussed earlier with respect to the existing literature, there is an insuffi-cient database and no widely accepted microeconomic model yet availableto accomplish this task. This situation, however, should provide the moti-vation for researchers and policymakers to remedy the deficiency so thatmore progress can be made in identifying what works best at eliminatingstumbling blocks to entrepreneurship in LMI communities.
Policy recommendations
This paper conducts a selected review of the economic literature on entrepre-neurship and provides some tentative empirical analyses of the determinants ofentrepreneurship across MSAs. We find that the conclusions of previousresearchers, and even our findings, are consistent in some instances with oneanother and, in other instances, contradictory. Nevertheless, based on the liter-ature review, other papers not reviewed directly here, and our empirical analysis,we find sufficient agreement to draw several conclusions and potential policyrecommendations aimed at increasing entrepreneurial activity, particularly inLMI communities. These findings are as follows.
138 James R. Barth, Glenn Yago, and Betsy Zeidman

First, researchers frequently use different measures of entrepreneurship anddifferent datasets, limiting the ability to compare the work of different scholars andhampering an understanding of the factors that influence entrepreneurship and,thus, the development of effective policies. As noted previously, the term “entre-preneur” means different things in different studies. For example, a recentpaper published by the Federal Reserve Bank of Kansas City (Low, Hender-son, and Weiler, 2005) identifies entrepreneurs as the self-employed, whereasthe Kauffman Foundation’s “Index of Entrepreneurial Activity” (Fairlie,2005) identifies entrepreneurs as business owners (as reported in the “CurrentPopulation Survey” performed by the U.S. Bureau of the Census for theBureau of Labor Statistics).
One approach to addressing the problem for policymakers when researchersuse different definitions and control variables would be the construction of asingle, multiuse dataset through the creation of a data consortium that poolsinformation from different public and private datasets. Consortium partici-pants might contribute data on a blind basis, with researchers and participantsgaining access to the full pool of contributed information. This wouldimprove upon the information that is needed to better understand the bestway to promote or to facilitate entrepreneurship.
Second, our calculations of LI and LMI “loan bias” suggest that the financingreceived by businesses in many LI and LMI communities diverges from what some,perhaps naïvely, might consider appropriate, even when accounting for incomedisparity. In general, our first measure of loan bias (based on population) indi-cates that businesses in LI and LMI communities receive a significantlysmaller share of the total amount of loans than some might expect, given theLI and LMI shares of population. Our second measure of loan bias (based onincome) suggests that, in a large number of MSAs, this same type of lendinggap holds. To the extent that this “bias” is not explainable by economicfactors or is the result of regulatory barriers, incentives provided throughcapital access programs (in which lenders, borrowers, and the governmenteach contribute to a reserve fund to cover loan losses), and other credit-enhancement programs may be appropriate to help decrease this loan bias.7
Stumbling Blocks to Entrepreneurship in Low- and Moderate-Income Communities 139

Third, we and others find that financial variables are important to entrepreneur-ship. We specifically find that those MSAs with fewer financial institutions andlarger average loan sizes tend to have a smaller share of total establishmentswith less than 10 employees (potentially the most entrepreneurial establish-ments or those most associated with new startups). One potential way toincrease small business loan origination across MSAs is to increase the securi-tization of such loans. This would allow small business lenders to sell portionsof their loan portfolios and use the proceeds to originate more loans, as well aslower their capital requirements.8
Fourth, discrimination appears to persist, particularly as it relates to capitalaccess by African-American entrepreneurs. The continued difficulty ofAfrican-American-owned firms to gain financing, the smaller size of thesefirms, and the higher concentration of larger firms in MSAs that have largeAfrican-American populations suggest the continuing need for efforts toextend capital and other forms of support to African-American entrepre-neurs. This is particularly important when one considers that the numberof these firms is growing faster than the rate of all firms, and the growth (orlack thereof) has an increasingly significant effect on local communities.
Fifth, taxes and government regulations clearly are potentially importantimpediments to entrepreneurship. Indeed, they rank very high among thebarriers to entrepreneurship that are cited by entrepreneurs themselves.Workers’ compensation costs, health insurance costs, taxes, and a numberof government regulations are all factors which state and federal govern-ments could modify to promote entrepreneurship. Often well-meaningregulations have unanticipated consequences. For instance, high bank-ruptcy exemptions are intended to benefit borrowers, but have been foundto actually hurt borrowers by decreasing lenders’ willingness to providecapital. The relationship found between lower sales taxes and greater entre-preneurship suggests one approach to mitigating this adverse effect wouldbe decreased taxes. Of course, one must take account of the fact that taxrevenues help finance the infrastructure that is essential for the successfuloperation of businesses.
140 James R. Barth, Glenn Yago, and Betsy Zeidman

Sixth, and last, there does appear to be consensus in the literature that individualscan learn to become entrepreneurs. Well-developed training programs, withtargeted outreach, particularly to LI and LMI communities, can extend entre-preneurship to a wider population. Unfortunately, data currently reflectsbusinesses located in LI and LMI communities, but tells us little about theactual entrepreneur. Yet, the existence of entrepreneurial firms in a region spursthe growth of more such firms in a cluster effect. Programs such as thosesupported by the Kauffman Foundation should produce greater understandingof entrepreneurship in communities and, hence, increase the likelihood of morenew businesses being established throughout the country.
In summary, more work needs to be done to understand better the deter-minants of entrepreneurial activity. This includes developing bettermicroeconomic models that capture the different tradeoffs associated withspecific policy actions affecting entrepreneurial activity and additional empir-ical analysis to help decide which actions work best to promote such activity.
Stumbling Blocks to Entrepreneurship in Low- and Moderate-Income Communities 141
Authors’ note: The authors are very grateful for the helpful comments and assistance provided by
Donald McCarthy, Triphon Phumiwasana, Tong Li, and Sangeetha Malaiyandi, and to constructive
comments from our discussant, Richard M. Todd.

142 James R. Barth, Glenn Yago, and Betsy Zeidman
MSA LMI Share LMI Share LMI Loan LI Share LI Share LI Loanof of Amount Bias: Amount of of Amount Bias:
Population of Loans of Loans Population of Loans Amount ofLoans
Yolo, Calif. 49.1% 41.8% 0.15 31.5% 0.1% 1.00Dutchess County, N.Y. 46.2% 18.8% 0.59 26.0% 8.8% 0.66Vallejo-Fairfield-Napa, Calif. 46.1% 34.8% 0.25 24.7% 1.5% 0.94New York, N.Y. 45.9% 19.2% 0.58 31.0% 4.8% 0.84Oakland, Calif. 45.3% 25.4% 0.44 28.3% 13.5% 0.52Bryan-College Station, Texas 45.1% 16.3% 0.64 29.5% 2.8% 0.90Sacramento, Calif. 45.1% 29.6% 0.34 26.4% 7.2% 0.73San Francisco, Calif. 44.9% 35.6% 0.21 27.2% 16.0% 0.41Albany, Ga. 44.6% 29.9% 0.33 23.0% 15.1% 0.34Tuscaloosa, Ala. 44.2% 18.8% 0.57 23.6% 2.6% 0.89Riverside-San Bernardino, Calif. 43.8% 24.0% 0.45 28.4% 5.7% 0.80Columbus, Ga.-Ala. 43.7% 37.7% 0.14 20.7% 12.0% 0.42Yuba City, Calif. 43.6% 18.0% 0.59 19.5% 0.0% 1.00Springfield, Mass. 43.5% 24.2% 0.44 24.6% 8.5% 0.66Florence, S.C. 43.5% 22.5% 0.48 29.0% 8.1% 0.72Muncie, Ind. 43.4% 21.8% 0.50 19.8% 2.7% 0.87Huntington-Ashland,
W. Va-Ky.-Ohio 43.4% 28.8% 0.34 26.5% 7.6% 0.71Rocky Mount, N.C. 43.4% 8.4% 0.81 21.5% 1.2% 0.94Missoula, Mont. 43.3% 37.2% 0.14 19.6% 0.0% 1.00Auburn-Opelika, Ala. 43.2% 21.0% 0.51 29.6% 7.4% 0.75Odessa-Midland, Texas 43.1% 46.5% -0.08 19.8% 5.6% 0.72New Orleans, La. 43.1% 26.5% 0.38 29.0% 6.3% 0.78Charleston, W. Va. 43.1% 31.6% 0.27 28.0% 15.2% 0.46Houma, La. 43.0% 39.7% 0.08 29.3% 0.0% 1.00Fresno, Calif. 42.9% 27.4% 0.36 19.8% 3.4% 0.83Utica-Rome, N.Y. 42.9% 19.1% 0.55 27.5% 2.9% 0.89Yakima, Wash. 42.9% 34.3% 0.20 18.4% 13.4% 0.27Nassau-Suffolk, N.Y. 42.9% 12.7% 0.70 24.2% 0.1% 1.00Bakersfield, Calif. 42.8% 21.7% 0.49 28.2% 6.5% 0.77Louisville, Ky.-Ind. 42.8% 29.0% 0.32 22.5% 7.0% 0.69Lake Charles, La. 42.7% 21.5% 0.50 29.1% 2.0% 0.93Lewiston-Auburn, Maine 42.7% 20.4% 0.52 26.9% 8.3% 0.69Kalamazoo-Battle Creek, Mich. 42.7% 23.1% 0.46 22.5% 7.3% 0.68Springfield, Mo. 42.6% 15.3% 0.64 17.6% 2.9% 0.84Las Cruces, N.M. 42.6% 29.8% 0.30 25.3% 0.1% 1.00Alexandria, La. 42.6% 22.0% 0.48 25.9% 5.1% 0.80Sarasota-Bradenton, Fla. 42.6% 19.8% 0.53 20.4% 0.6% 0.97Mobile, Ala. 42.5% 12.9% 0.70 28.5% 5.7% 0.80Beaumont-Port Arthur, Texas 42.5% 21.8% 0.49 28.3% 5.6% 0.80Sharon, Pa. 42.5% 15.6% 0.63 17.3% 12.5% 0.28Stockton-Lodi, Calif. 42.5% 33.6% 0.21 23.5% 6.5% 0.72Greensboro/Winston-Salem/
High Point, N.C. 42.5% 18.4% 0.57 21.5% 1.6% 0.93Greenville, N.C. 42.5% 24.2% 0.43 21.5% 4.5% 0.79Corvallis, Ore. 42.4% 23.3% 0.45 23.4% 0.0% 1.00Providence-Fall River-
Warwick, R.I.-Mass. 42.4% 21.7% 0.49 24.5% 4.7% 0.81San Diego, Calif. 42.4% 25.1% 0.41 24.3% 1.9% 0.92Corpus Christi, Texas 42.3% 43.1% -0.02 27.8% 6.1% 0.78Bloomington-Normal, Ill. 42.3% 24.3% 0.43 24.7% 8.5% 0.65
Appendix 1Loans to Businesses in Low- and Moderate-Income
Communities: LI and LMI Shares of Population, Businesses’Share of Loans, and LI and LMI Loan Biases

Stumbling Blocks to Entrepreneurship in Low- and Moderate-Income Communities 143
Bangor, Maine 42.2% 14.1% 0.67 27.5% 0.0% 1.00Tallahassee, Fla. 42.2% 26.9% 0.36 28.3% 3.4% 0.88Merced, Calif. 42.1% 24.5% 0.42 26.1% 0.0% 1.00Dover, Del. 42.1% 0.2% 0.99 21.5% 0.0% 1.00Topeka, Kan. 42.1% 37.9% 0.10 21.0% 13.8% 0.34Amarillo, Texas 42.0% 25.3% 0.40 26.0% 8.8% 0.66St. Joseph, Mo. 42.0% 25.9% 0.38 26.3% 19.0% 0.28Wheeling, W. Va.-Ohio 42.0% 23.9% 0.43 24.6% 2.3% 0.91Orange County, Calif. 41.9% 34.8% 0.17 22.1% 4.6% 0.79Los Angeles-Long Beach, Calif. 41.9% 31.5% 0.25 29.7% 12.5% 0.58Decatur, Ala. 41.8% 11.1% 0.73 26.9% 2.0% 0.92Dallas, Texas 41.7% 21.4% 0.49 23.0% 4.6% 0.80Lafayette, La. 41.6% 12.3% 0.71 26.8% 3.7% 0.86Dayton-Springfield, Ohio 41.6% 27.2% 0.35 21.2% 10.1% 0.52Pine Bluff, Ark. 41.5% 22.9% 0.45 24.7% 9.3% 0.62Columbia, S.C. 41.5% 30.6% 0.26 21.2% 8.7% 0.59Duluth-Superior, Minn.-Wis. 41.5% 34.4% 0.17 26.8% 21.3% 0.21Grand Forks, N.D.-Minn. 41.5% 7.6% 0.82 25.0% 0.0% 1.00Daytona Beach, Fla. 41.3% 20.5% 0.50 24.5% 4.6% 0.81Hattiesburg, Miss. 41.3% 12.1% 0.71 24.5% 10.7% 0.57Cumberland, Md.-W. Va. 41.2% 14.6% 0.65 23.8% 4.7% 0.80McAllen-Edinburg-
Mission, Texas 41.2% 20.6% 0.50 19.1% 0.0% 1.00State College, Pa. 41.2% 18.2% 0.56 27.6% 7.9% 0.71Binghamton, N.Y. 41.2% 25.7% 0.38 26.2% 6.2% 0.77Gainesville, Fla. 41.2% 35.1% 0.15 25.9% 3.6% 0.86Asheville, N.C. 41.1% 30.3% 0.26 25.2% 1.0% 0.96Youngstown-Warren, Ohio 41.1% 13.9% 0.66 26.0% 6.5% 0.75Lincoln, Neb. 41.1% 19.4% 0.53 19.7% 4.0% 0.80Cleveland-Lorain-Elyria, Ohio 41.1% 16.1% 0.61 21.5% 7.5% 0.65Panama City, Fla. 41.0% 18.6% 0.55 25.5% 9.3% 0.64Ventura, Calif. 41.0% 33.2% 0.19 26.6% 3.9% 0.85San Luis Obispo-Atasc.-
Paso Robles, Calif. 41.0% 12.2% 0.70 21.7% 0.0% 1.00Erie, Pa. 40.9% 22.2% 0.46 25.5% 13.2% 0.48Lakeland-Winter Haven, Fla. 40.8% 24.6% 0.40 24.4% 3.7% 0.85Raleigh-Durham-
Chapel Hill, N.C. 40.8% 17.2% 0.58 23.3% 1.5% 0.94Johnstown, Pa. 40.7% 7.8% 0.81 22.0% 0.2% 0.99Elmira, N.Y. 40.7% 30.3% 0.26 25.8% 8.6% 0.67Salinas, Calif. 40.7% 26.7% 0.34 22.5% 9.6% 0.57Knoxville, Tenn. 40.7% 24.3% 0.40 25.8% 5.9% 0.77Owensboro, Ky. 40.6% 39.4% 0.03 26.7% 18.3% 0.31Pocatello, Idaho 40.6% 27.3% 0.33 25.9% 0.0% 1.00Orlando, Fla. 40.6% 22.3% 0.45 19.4% 3.7% 0.81Grand Junction, Colo. 40.5% 19.7% 0.52 24.6% 0.0% 1.00Austin-San Marcos, Texas 40.5% 16.8% 0.59 22.9% 4.0% 0.83Peoria-Pekin, Ill. 40.5% 20.8% 0.49 20.5% 4.7% 0.77El Paso, Texas 40.4% 37.7% 0.07 22.9% 15.6% 0.32Danville, Va. 40.4% 20.3% 0.50 22.8% 7.0% 0.69Medford-Ashland, Ore. 40.4% 16.5% 0.59 25.0% 11.4% 0.54Billings, Mont. 40.4% 23.3% 0.42 25.9% 10.4% 0.60Huntsville, Ala. 40.4% 18.1% 0.55 21.8% 5.5% 0.75Clarksville-Hopkinsville,
Tenn.-Ky. 40.3% 27.1% 0.33 23.1% 4.1% 0.82
MSA LMI Share of LMI Share LMI Loan LI Share LI Share LI LoanPopulation of Amount Bias: Amount of of Bias:
of Loans of Loans Population Amount of Amount ofLoans Loans
Appendix 1 (cont.)

144 James R. Barth, Glenn Yago, and Betsy Zeidman
Jackson, Tenn. 40.3% 26.2% 0.35 26.5% 18.5% 0.30Gadsden, Ala 40.3% 26.4% 0.34 23.5% 0.0% 1.00Pittsburgh, Pa. 40.3% 19.7% 0.51 25.7% 2.0% 0.92Tucson, Ariz. 40.2% 30.9% 0.23 24.9% 5.0% 0.80Minneapolis-
St. Paul, Minn.-Wis. 40.2% 12.3% 0.69 18.4% 3.8% 0.79Naples, Fla. 40.2% 3.0% 0.93 21.6% 0.4% 0.98Oklahoma City, Okla. 40.2% 27.6% 0.31 25.1% 4.7% 0.81Albany-Schenectady-
Troy, N.Y. 40.2% 19.8% 0.51 20.7% 7.3% 0.65Jacksonville, Fla. 40.2% 22.0% 0.45 19.9% 4.7% 0.76Sherman-Denison, Texas 40.2% 35.1% 0.13 25.1% 16.2% 0.36Columbia, Mo. 40.1% 29.9% 0.26 25.1% 18.2% 0.28Appleton-Oshkosh-
Neenah, Wis. 40.1% 7.9% 0.80 21.1% 2.1% 0.90Wichita, Kan. 40.1% 29.0% 0.28 19.6% 7.4% 0.62Fort Collins-Loveland, Colo. 40.1% 28.3% 0.29 22.9% 13.0% 0.43Lawrence, Kan. 40.0% 15.5% 0.61 25.8% 0.7% 0.97Champaign-Urbana, Ill. 40.0% 33.3% 0.17 26.6% 9.3% 0.65St. Cloud, Minn. 40.0% 6.7% 0.83 19.6% 6.1% 0.69Eugene-Springfield, Ore. 39.9% 35.1% 0.12 25.6% 11.6% 0.55Madison, Wis. 39.9% 29.9% 0.25 21.9% 5.5% 0.75Anniston, Ala. 39.9% 18.4% 0.54 23.7% 1.6% 0.93Norfolk-Virginia Beach-
Newport News, Va.-N.C. 39.9% 18.4% 0.54 19.4% 4.5% 0.77Biloxi-Gulfport-
Pascagoula, Miss. 39.9% 10.8% 0.73 24.9% 4.2% 0.83Waterloo-Cedar Falls, Iowa 39.9% 27.9% 0.30 24.2% 9.0% 0.63Chattanooga, Tenn.-Ga. 39.9% 19.0% 0.52 25.0% 14.7% 0.41Texarkana, Texas-Ark. 39.8% 19.9% 0.50 23.7% 1.9% 0.92Allentown-Bethlehem-
Easton, Pa. 39.8% 10.4% 0.74 20.3% 2.3% 0.89Las Vegas, Nev.-Ariz. 39.8% 20.0% 0.50 19.1% 2.2% 0.89Pensacola, Fla. 39.8% 24.2% 0.39 24.4% 10.2% 0.58Tyler, Texas 39.7% 18.4% 0.54 25.3% 12.9% 0.49Boise City, Idaho 39.7% 23.2% 0.42 18.4% 11.8% 0.36Mansfield, Ohio 39.7% 25.7% 0.35 24.3% 4.9% 0.80Chico-Paradise, Calif. 39.6% 20.4% 0.48 22.4% 0.0% 1.00Spokane, Wash. 39.6% 49.1% -0.24 24.5% 20.2% 0.18Harrisburg-Lebanon-
Carlisle, Pa. 39.6% 11.8% 0.70 18.9% 1.4% 0.93Punta Gorda, Fla. 39.6% 6.3% 0.84 22.9% 0.0% 1.00New London-
Norwich, Conn.-R.I. 39.6% 15.4% 0.61 22.2% 3.1% 0.86Baton Rouge, La. 39.6% 13.6% 0.66 26.3% 4.5% 0.83Decatur, Ill. 39.6% 46.4% -0.17 24.8% 25.2% -0.02Lynchburg, Va. 39.6% 12.8% 0.68 24.7% 4.6% 0.81Buffalo-Niagara Falls, N.Y. 39.5% 23.3% 0.41 25.7% 6.6% 0.74Augusta-Aiken, Ga.-S.C. 39.5% 21.4% 0.46 25.6% 5.9% 0.77Myrtle Beach, S.C. 39.5% 12.1% 0.69 22.5% 0.7% 0.97Casper, Wyo. 39.5% 29.3% 0.26 24.5% 18.5% 0.24Springfield, Ill. 39.5% 25.1% 0.36 19.4% 10.1% 0.48Johnson City-Kingsport-
Bristol, Tenn.-Va. 39.5% 16.7% 0.58 22.6% 2.2% 0.90Montgomery, Ala. 39.4% 25.2% 0.36 25.4% 14.1% 0.45
MSA LMI Share of LMI Share LMI Loan LI Share LI Share LI LoanPopulation of Amount Bias: Amount of of Bias:
of Loans of Loans Population Amount of Amount ofLoans Loans
Appendix 1 (cont.)

Stumbling Blocks to Entrepreneurship in Low- and Moderate-Income Communities 145
Rochester, N.Y. 39.4% 18.4% 0.53 20.5% 5.5% 0.73Lubbock, Texas 39.4% 35.6% 0.10 22.5% 16.0% 0.29Monroe, La. 39.3% 22.5% 0.43 24.6% 13.9% 0.44Flagstaff, Utah-Ariz. 39.3% 17.4% 0.56 24.3% 4.7% 0.81Rapid City, S.D. 39.3% 35.0% 0.11 22.5% 0.0% 1.00Macon, Ga. 39.3% 49.9% -0.27 25.8% 14.0% 0.46Tampa-St. Petersburg-
Clearwater, Fla. 39.3% 21.6% 0.45 23.6% 0.8% 0.96Kokomo, Ind. 39.3% 25.5% 0.35 19.9% 9.7% 0.51Jackson, Mich. 39.2% 24.2% 0.38 20.5% 6.1% 0.70Anchorage, Alaska 39.2% 29.6% 0.25 23.2% 7.4% 0.68Salt Lake City-Ogden, Utah 39.2% 37.2% 0.05 20.4% 8.0% 0.61Fort Wayne, Ind. 39.2% 17.1% 0.56 18.5% 7.0% 0.62Miami, Fla. 39.2% 28.4% 0.27 25.5% 9.3% 0.64Athens, Ga. 39.2% 22.3% 0.43 24.4% 12.3% 0.50San Jose, Calif. 39.2% 34.8% 0.11 24.0% 8.5% 0.65Savannah, Ga. 39.0% 17.7% 0.55 24.9% 4.9% 0.80Brownsville-Harlingen-
San Benito, Texas 39.0% 21.5% 0.45 29.6% 1.0% 0.97Fayetteville-Springdale-
Rogers, Ark. 38.9% 8.9% 0.77 23.4% 0.0% 1.00Nashville, Tenn. 38.9% 27.6% 0.29 19.2% 5.3% 0.72St. Louis, Mo.-Ill. 38.8% 15.1% 0.61 19.8% 4.8% 0.76Killeen-Temple, Texas 38.8% 21.4% 0.45 21.6% 0.7% 0.97Lafayette, Ind. 38.8% 40.6% -0.05 24.2% 8.3% 0.66Florence, Ala. 38.8% 16.0% 0.59 22.7% 2.2% 0.90Benton Harbor, Mich. 38.8% 17.1% 0.56 25.0% 8.3% 0.67Lansing-East Lansing, Mich. 38.7% 23.3% 0.40 19.9% 10.9% 0.45Shreveport-Bossier City, La. 38.7% 36.7% 0.05 22.8% 20.1% 0.12Victoria, Texas 38.7% 38.2% 0.01 23.7% 0.9% 0.96Greenville-Spartanburg-
Anderson, S.C. 38.7% 15.5% 0.60 24.2% 5.2% 0.79Jackson, Miss. 38.6% 22.1% 0.43 25.0% 13.0% 0.48Jonesboro, Ark. 38.6% 9.0% 0.77 22.0% 0.0% 1.00West Palm Beach-
Boca Raton, Fla. 38.6% 19.9% 0.48 25.9% 2.7% 0.90Pittsfield, Mass. 38.6% 31.0% 0.20 24.9% 13.8% 0.45Wilmington, N.C. 38.6% 15.3% 0.60 24.2% 8.0% 0.67Tulsa, Okla. 38.5% 24.0% 0.38 23.8% 2.0% 0.92Fargo-Moorhead, N.D.-Minn. 38.5% 46.6% -0.21 23.7% 0.0% 1.00Cincinnati, Ohio-Ky.-Ind. 38.5% 17.8% 0.54 19.8% 6.8% 0.66Charlottesville, Va. 38.5% 23.9% 0.38 20.3% 2.5% 0.87Reading, Pa. 38.5% 12.1% 0.69 19.3% 3.7% 0.81Sioux Falls, S.D. 38.4% 37.6% 0.02 17.0% 0.0% 1.00Bloomington, Ind. 38.4% 41.4% -0.08 22.8% 0.6% 0.98Columbus, Ohio 38.4% 22.9% 0.40 19.0% 10.0% 0.47Lexington, Ky. 38.3% 28.8% 0.25 24.3% 3.9% 0.84Hickory-Morganton, N.C. 38.2% 12.1% 0.68 22.6% 0.0% 1.00Seattle-Bellevue-Everett, Wash. 38.2% 26.5% 0.31 20.8% 2.3% 0.89Fayetteville, N.C. 38.2% 20.5% 0.46 23.1% 8.0% 0.65Birmingham, Ala. 38.1% 25.7% 0.33 24.7% 9.4% 0.62Richland-Kennewick-
Pasco, Wash. 38.1% 26.6% 0.30 19.3% 0.0% 1.00Phoenix-Mesa, Ariz. 38.0% 30.0% 0.21 18.3% 8.5% 0.53
MSA LMI Share of LMI Share LMI Loan LI Share LI Share LI LoanPopulation of Amount Bias: Amount of of Bias:
of Loans of Loans Population Amount of Amount ofLoans Loans
Appendix 1 (cont.)

146 James R. Barth, Glenn Yago, and Betsy Zeidman
Hartford, Conn. 37.9% 15.6% 0.59 22.2% 4.0% 0.82Omaha, Neb.-Iowa 37.9% 16.3% 0.57 17.9% 3.6% 0.80Evansville-Henderson, Ind.-Ky. 37.9% 22.9% 0.40 23.7% 1.2% 0.95Fort Smith, Ark.-Okla. 37.9% 18.1% 0.52 21.2% 4.3% 0.80Dothan, Ala. 37.7% 28.4% 0.25 22.5% 2.2% 0.90Rockford, Ill. 37.7% 16.6% 0.56 18.8% 6.7% 0.65Portland, Maine 37.7% 25.2% 0.33 18.9% 5.3% 0.72Waco, Texas 37.7% 24.7% 0.34 22.6% 4.9% 0.78Honolulu, Hawaii 37.7% 29.7% 0.21 21.3% 2.5% 0.88Santa Fe, N.M. 37.6% 40.1% -0.06 25.5% 0.0% 1.00Sioux City, Iowa-Neb. 37.6% 38.6% -0.02 22.2% 27.5% -0.24Great Falls, Mont. 37.6% 32.3% 0.14 20.2% 6.6% 0.67Toledo, Ohio 37.6% 19.2% 0.49 23.9% 9.9% 0.58Albuquerque, N.M. 37.6% 30.1% 0.20 23.3% 2.5% 0.89Syracuse, N.Y. 37.6% 22.2% 0.41 24.0% 8.5% 0.65Charleston-
North Charleston, S.C. 37.6% 18.3% 0.51 23.7% 4.1% 0.83Charlotte-Gastonia-
Rock Hill, N.C.-S.C. 37.6% 24.5% 0.35 23.7% 8.5% 0.64Ocala, Fla. 37.6% 6.7% 0.82 19.1% 0.8% 0.96
Saginaw-Bay City-Midland, Mich. 37.6% 24.1% 0.36 23.2% 8.2% 0.65Glens Falls, N.Y. 37.5% 6.4% 0.83 22.2% 0.0% 1.00Indianapolis, Ind. 37.5% 20.5% 0.45 24.7% 6.2% 0.75Little Rock-North
Little Rock, Ark. 37.5% 20.9% 0.44 23.2% 1.6% 0.93Pueblo, Colo. 37.5% 24.6% 0.34 20.4% 10.8% 0.47Roanoke, Va. 37.4% 19.5% 0.48 22.7% 9.8% 0.57Elkhart-Goshen, Ind. 37.4% 8.9% 0.76 17.1% 2.9% 0.83Sumter, S.C. 37.4% 42.6% -0.14 21.1% 0.0% 1.00Altoona, Pa. 37.4% 15.2% 0.59 21.0% 10.1% 0.52Lima, Ohio 37.3% 15.3% 0.59 22.8% 7.3% 0.68Rochester, Minn. 37.3% 4.9% 0.87 19.9% 0.0% 1.00Memphis, Tenn.-Ark.-Miss. 37.3% 14.6% 0.61 24.1% 5.7% 0.76Milwaukee-Waukesha, Wis. 37.3% 11.7% 0.69 25.0% 5.0% 0.80San Angelo, Texas 37.3% 33.3% 0.11 20.6% 20.6% 0.00San Antonio, Texas 37.3% 21.4% 0.43 20.6% 4.2% 0.79Barnstable-Yarmouth, Mass. 37.2% 13.7% 0.63 24.5% 0.0% 1.00Yuma, Ariz. 37.1% 29.0% 0.22 18.8% 0.0% 1.00Joplin, Mo. 37.1% 16.7% 0.55 19.8% 0.0% 1.00Iowa City, Iowa 37.1% 25.4% 0.32 24.3% 9.9% 0.59Santa Barbara-Santa
Maria-Lompoc, Calif. 37.1% 45.3% -0.22 24.7% 0.1% 0.99Santa Cruz-
Watsonville, Calif. 37.1% 25.2% 0.32 24.7% 0.0% 1.00Santa Rosa, Calif. 37.1% 18.2% 0.51 24.7% 0.0% 1.00Bellingham, Wash. 37.1% 20.2% 0.45 23.2% 0.0% 1.00Jamestown, N.Y. 36.9% 18.8% 0.49 20.0% 8.2% 0.59Janesville-Beloit, Wis. 36.9% 14.5% 0.61 23.4% 2.9% 0.88Modesto, Calif. 36.8% 21.2% 0.42 23.2% 0.7% 0.97Atlanta, Ga. 36.8% 18.3% 0.50 20.1% 2.9% 0.86Bismarck, N.D. 36.8% 26.6% 0.28 22.2% 0.0% 1.00Reno, Nev. 36.7% 40.0% -0.09 24.1% 0.4% 0.99York, Pa. 36.7% 13.5% 0.63 23.4% 4.9% 0.79
MSA LMI Share of LMI Share LMI Loan LI Share LI Share LI LoanPopulation of Amount Bias: Amount of of Bias:
of Loans of Loans Population Amount of Amount ofLoans Loans
Appendix 1 (cont.)

Stumbling Blocks to Entrepreneurship in Low- and Moderate-Income Communities 147
MSA LMI Share of LMI Share LMI Loan LI Share LI Share LI LoanPopulation of Amount Bias: Amount of of Bias:
of Loans of Loans Population Amount of Amount ofLoans Loans
Appendix 1 (cont.)
Scranton-Wilkes-Barre-Hazleton, Pa. 36.7% 12.0% 0.67 20.7% 3.2% 0.85
Wausau, Wis. 36.7% 7.2% 0.80 23.6% 0.0% 1.00Redding, Calif. 36.7% 10.6% 0.71 20.1% 0.0% 1.00Enid, Okla. 36.7% 21.2% 0.42 20.1% 0.0% 1.00Eau Claire, Wis. 36.7% 9.3% 0.75 21.3% 0.0% 1.00Kansas City, Mo.-Kan. 36.6% 20.4% 0.44 23.6% 5.0% 0.79Visalia-Tulare-
Porterville, Calif. 36.6% 18.3% 0.50 20.1% 0.0% 1.00Cheyenne, Wyo. 36.6% 42.6% -0.17 21.2% 0.0% 1.00La Crosse, Wis.-Minn. 36.6% 53.2% -0.45 21.6% 16.3% 0.24Portland-
Vancouver, Ore.-Wash. 36.5% 20.7% 0.43 23.6% 1.3% 0.94Canton-Massillon, Ohio 36.5% 13.3% 0.64 22.1% 4.0% 0.82Richmond-Petersburg, Va. 36.5% 24.3% 0.33 23.8% 8.7% 0.63Longview-Marshall, Texas 36.4% 26.8% 0.26 20.9% 6.4% 0.69Terre Haute, Ind. 36.4% 29.6% 0.19 19.9% 4.7% 0.76Parkersburg-Marietta,
W. Va.-Ohio 36.4% 26.5% 0.27 19.3% 0.0% 1.00Laredo, Texas 36.3% 20.3% 0.44 27.0% 0.0% 1.00Davenport-Moline-
Rock Island, Iowa-Ill. 36.2% 27.8% 0.23 21.8% 6.7% 0.69Melbourne-Titusville-
Palm Bay, Fla. 36.2% 30.8% 0.15 21.4% 0.4% 0.98Grand Rapids-
Muskegon- Holland, Mich. 36.1% 21.8% 0.40 23.6% 7.9% 0.66South Bend, Ind. 36.1% 25.6% 0.29 21.7% 7.8% 0.64Green Bay, Wis. 36.0% 19.0% 0.47 23.2% 8.5% 0.63Lawton, Okla. 35.8% 47.4% -0.32 20.4% 3.5% 0.83Cedar Rapids, Iowa 35.8% 20.1% 0.44 22.9% 9.4% 0.59Des Moines, Iowa 35.8% 54.2% -0.51 22.9% 12.2% 0.47Abilene, Texas 35.8% 29.3% 0.18 19.1% 0.2% 0.99Williamsport, Pa. 35.8% 14.9% 0.58 18.7% 0.0% 1.00Lancaster, Pa. 35.7% 7.2% 0.80 22.6% 0.6% 0.97Dubuque, Iowa 35.7% 23.6% 0.34 20.1% 17.9% 0.11Fort Lauderdale, Fla. 35.5% 21.5% 0.39 20.0% 7.4% 0.63Fort Myers-Cape Coral, Fla. 35.5% 10.4% 0.71 20.0% 0.1% 0.99Fort Pierce-
Port St. Lucie, Fla. 35.5% 22.3% 0.37 20.0% 3.0% 0.85Fort Walton Beach, Fla. 35.5% 11.4% 0.68 20.0% 0.0% 1.00Provo-Orem, Utah 35.4% 7.7% 0.78 22.2% 1.7% 0.92Burlington, Vt. 35.4% 16.7% 0.53 23.1% 8.4% 0.64Sheboygan, Wis. 35.3% 7.5% 0.79 22.1% 0.0% 1.00Colorado Springs, Colo. 35.2% 39.8% -0.13 22.2% 3.0% 0.87Goldsboro, N.C. 35.1% 15.9% 0.55 19.2% 1.0% 0.95Wichita Falls, Texas 34.6% 36.5% -0.05 18.7% 23.6% -0.26Jacksonville, N.C. 33.6% 8.1% 0.76 15.8% 0.0% 1.00
Source: Milken Institute, based on U.S. Census 2000, CRA 2001, and FDIC 2001

148 James R. Barth, Glenn Yago, and Betsy Zeidman
Establishment: A single physical location where business is conducted orwhere services or industrial operations are performed.
Employment: Paid employment consists of full- and part-time employ-ees, including salaried officers and executives of corporations, who wereon the payroll in the pay period including March 12. Included areemployees on sick leave, holidays, and vacations; not included are propri-etors and partners of unincorporated businesses.
Annual payroll: Total annual payroll includes all forms of compensation,such as salaries, wages, commissions, bonuses, vacation allowances, sick-leave pay, and the value of payments in-kind (for example, free meals andlodgings) paid during the year to all employees.
Receipts: (Net taxes) the revenue for goods produced, goods distributed,or services provided, including revenue earned from premiums, commis-sions and fees, rents, interest, dividends, and royalties. Receipts excludeall revenue collected for local, state, and federal taxes. Receipts areacquired from the Economic Census data for establishments in industriesthat are in-scope to the Economic Census; receipts are acquired from IRStax data for single-establishment businesses in industries that are out-of-scope to the Economic Census; payroll-to-receipts ratios are used toestimate receipts for multiestablishment businesses in industries that areout-of-scope to the Economic Census. Statistics of U.S. Businesses hasreceipts for 1997 only.
Enterprise: A business organization consisting of one or more domes-tic establishments that were specified under common ownership orcontrol. The enterprise and the establishment are the same for single-establishment firms. Each multiestablishment company forms oneenterprise—the enterprise employment and annual payroll are summedfrom the associated establishments.
Appendix 2Explanation of Terms Used in Entrepreneurship Studies
(See http://www.censv/csd/susb/defterm.html )
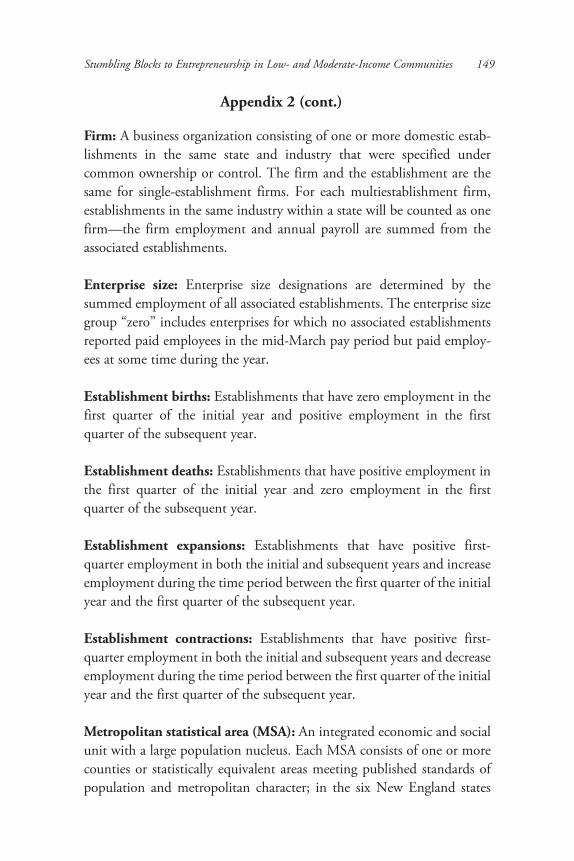
Stumbling Blocks to Entrepreneurship in Low- and Moderate-Income Communities 149
Firm: A business organization consisting of one or more domestic estab-lishments in the same state and industry that were specified undercommon ownership or control. The firm and the establishment are thesame for single-establishment firms. For each multiestablishment firm,establishments in the same industry within a state will be counted as onefirm—the firm employment and annual payroll are summed from theassociated establishments.
Enterprise size: Enterprise size designations are determined by thesummed employment of all associated establishments. The enterprise sizegroup “zero” includes enterprises for which no associated establishmentsreported paid employees in the mid-March pay period but paid employ-ees at some time during the year.
Establishment births: Establishments that have zero employment in thefirst quarter of the initial year and positive employment in the firstquarter of the subsequent year.
Establishment deaths: Establishments that have positive employment inthe first quarter of the initial year and zero employment in the firstquarter of the subsequent year.
Establishment expansions: Establishments that have positive first-quarter employment in both the initial and subsequent years and increaseemployment during the time period between the first quarter of the initialyear and the first quarter of the subsequent year.
Establishment contractions: Establishments that have positive first-quarter employment in both the initial and subsequent years and decreaseemployment during the time period between the first quarter of the initialyear and the first quarter of the subsequent year.
Metropolitan statistical area (MSA): An integrated economic and socialunit with a large population nucleus. Each MSA consists of one or morecounties or statistically equivalent areas meeting published standards ofpopulation and metropolitan character; in the six New England states
Appendix 2 (cont.)

150 James R. Barth, Glenn Yago, and Betsy Zeidman
(Connecticut, Maine, Massachusetts, New Hampshire, Rhode Island,and Vermont), cities and towns (rather than counties) are used as thecomponent geographic units.
Legal Form of Organization (LFO):a. Corporations: Enterprises legally incorporated under state laws.b. Partnerships: Unincorporated enterprises owned by two or more
persons having financial interest in the business. c. Sole proprietorships: Unincorporated enterprises owned by one person. d. Nonprofit organizations: Enterprises with nonprofit status (tax-exempt). e. Other (associations, trust, joint ventures, estates, etc.): Enterprises
that are formed by other legal form of organization. f. Unknown: Enterprises with unknown legal form of organization.
Appendix 2 (cont.)

Endnotes1Firms can contain multiple establishments that are defined by the U.S. Census
Bureau as a “single physical location at which business is conducted.” See Appendix 2for definitions of these and other terms frequently used in studies of entrepreneurship.
2However, unlike Table 1, this table goes beyond simply the number of firmswith paid employees. As Davis, Haltiwanger, Jarmin, Krizan, Miranda, and Nucci(2005) carefully explain, the data sources for the two tables are quite different.Table 2 includes those firms in Table 1, but also adds all sole proprietorshipswithout employees and other corporations, partnerships, and other nonemployerbusiness entities, of which there were more than 17,000 in 2002.
3According to the U.S. Census Bureau, LI individuals in a given MSA are indi-viduals with annual income of 50 percent or less of that MSA’s median income,and LMI individuals are those with incomes that are 80 percent or less of themedian income in that MSA.
4LI communities consist of census tracts where the median family income of thatcensus tract is less than 50 percent of the MSA median family income. The LMIcategory consists of census tracts where the median family income of the censustract is less than 80 percent of the MSA median family income.
5However, the CRA data are not without limitations, including the fact thatloans may be made to a firm with an address in an LMI community, but theproceeds are used to fund operations—in the case of a firm with multiple establish-ments—outside LMI communities.
6However, Lucas (1978) argues that smaller businesses have less managerialtalent, and, therefore, one would expect to find that smaller businesses likely are tobe located in regions with lower levels of income per capita.
7For further discussion of credit enhancement as a potential alleviator of the capitalaccess “gaps” facing LMI businesses, see Yago, Zeidman, and Schmidt (2003).
8For further discussion of the role of securitization, see Yago, Zeidman, andSchmidt (2003).
Stumbling Blocks to Entrepreneurship in Low- and Moderate-Income Communities 151

References
Acs, Zoltan, and Catherine Armington. “Employment Growth and EntrepreneurialActivity in Cities.” Working Paper for the Discussion Papers on Entrepreneurship,Growth, and Public Policy, March 2004.
Barth, James R., Joseph Cordes, and Anthony Yezer. “Benefits and Costs of LegalRestrictions on Personal Loan Markets.” Journal of Law and Economics 29, no.2 (1986): 357-380.
Barth, James R., Padma Gotour, Neela Manage, and Anthony Yezer. “The Effectof Government Regulations on Personal Loan Markets: A Tobit Estimation ofa Microeconomic Model.” The Journal of Finance 38, no. 4 (1983): 1233-1251.
Bates, Timothy. “Commercial Bank Financing of White- and Black-Owned SmallBusiness Startups.” Quarterly Review of Economics and Business 31, no. 1 (1991):64-80.
Berger, Allen, and Scott Frame. “Small Business Credit Scoring and Credit Availabil-ity.” Working Paper No. 2005-10 for the Federal Reserve Bank of Atlanta, 2005.
Berger, Allen, and Gregory Udell. “Lines of Credit and Relationship: Lending inSmall Firm Finance.” Working Paper No. 113 of the Jerome Levy EconomicsInstitute, 1994.
Black, Sandra, and Philip Strahan. “Entrepreneurship and Bank Credit Availabil-ity.” The Journal of Finance 58, no. 6 (2002): 2807-2833.
Blanchflower, David, and Andrew Oswald. “What Makes an Entrepreneur?” Journal ofLabor Economics 16, no. 1 (1998): 26-60.
Blanchflower, David, Phillip Levine, and David Zimmerman. “Discrimination inthe Small-Business Credit Market.” Review of Economics and Statistics 85, no. 4(2003): 930-943.
Bostic, Raphael, and Parick Lampani. “Racial Differences in Patterns of Small BusinessFinance: The Importance of Local Geography.” Presented at the Federal SystemResearch Conference on Business Access to Capital and Credit, Arlington, Va.,March 8, 1999.
Brevoort, Kenneth, and Timothy Hannan. “Commercial Lending and Distance:Evidence from Community Reinvestment Act Data.” Working Paper No. 2004-24of the Federal Reserve Finance and Economics Discussion Series, 2004.
Cavaluzzo, Ken, and John Wolken. “Small Business Loan Turndowns, PersonalWealth, and Discrimination.” Working Paper No. 2002-35 of the FederalReserve Finance and Economics Discussion Series, 2002.
152 James R. Barth, Glenn Yago, and Betsy Zeidman

Davis, Steven, John Haltiwanger, Ron Jarmin, and others. “Measuring theDynamics of Young and Small Businesses: Integrating the Employer andNonemployer Universes.” Working Paper by the Kauffman Foundation and theU.S. Census Bureau, 2005.
DeYoung, Robert, Dennis Glennon, and Peter Nigro. “Borrower-LenderDistance, Credit Scoring, and the Performance of Small Business Loans.”Presented at the FDIC Fifth Annual Banking Research Conference: FinancialSector Integrity and Emerging Risks in Banking, Arlington, Va. Sept. 22, 2005.
Dunn, Thomas, and Douglas Holtz-Eakin. “Financial Capital, Human Capital, andthe Transition to Self-Employment: Evidence from Intergenerational Links.” Journalof Labor Economics 18, no. 2 (2000): 282-305.
Evans, David, and Linda Leighton. “Some Empirical Aspects of Entrepreneur-ship.” The American Economic Review 79, no. 3 (1989): 519-535.
Fairlie, Robert. “The Absence of the African-American-Owned Business: AnAnalysis of the Dynamics of Self-Employment.” Journal of Labor Economics 17,no. 1 (1999): 80-108.
__________. “Kauffman Index of Entrepreneurial Activity.” The Ewing MarionKauffman Foundation, 2005.
Fairlie, Robert, and Alicia Robb. “Families, Human Capital, and Small Business:Evidence from the Characteristics of Business Owners Survey.” Working PaperNo. 1296 for the Institute for the Study of Labor IZA and No. 871 for theEconomic Growth Center, Yale University, 2004.
Feldman, Maryann, and Johanna Francis. “Homegrown Solutions: Fostering ClusterFormation.” Economic Development Quarterly 18, no. 2 (2004): 127-137.
Gentry, William, and Robert Glenn Hubbard. “Entrepreneurship and HouseholdSaving.” Journal of Advances in Economic Analysis & Policy 4, no. 1 (2004):Article 8.
Gompers, Paul, Joshua Lerner, and David Sharfstein. “Entrepreneurial Spawning:Public Corporations and the Genesis of New Ventures, 1986-1999.” WorkingPaper No. 4317-03 of the Sloane School of Management at the MassachusettsInstitute of Technology and No. 03-37 of Negotiation, Organization, andMarkets at Harvard University, 2003.
Guiso, Luigi, and Fabiano Schivardi. “Learning to be an Entrepreneur.” WorkingPaper, 2004.
Guiso, Luigi, Paola Sapienza, and Luigi Zingales. “Does Local Financial Develop-ment Matter?” The Quarterly Journal of Economics 119, no. 3 (2004): 929-969.
Stumbling Blocks to Entrepreneurship in Low- and Moderate-Income Communities 153

Hamilton, Barton. “Does Entrepreneurship Pay? An Empirical Analysis ofReturns of Self-Employment.” The Journal of Political Economy 108, no. 3(2000): 604-631.
Henderson, Vernon. “Marshall’s Scale Economies.” Journal of Urban Economics53, (2003): 1-28.
Hoenig, Thomas. “Entrepreneurship and Growth.” Entrepreneur’s Experiences: ATown Hall Meeting, Entrepreneur’s Exchange, Kansas City, Mo. April 28, 2005.
Holtz-Eakin, Douglas, David Joulfaian, and Harvey Rosen. “EntrepreneurialDecisions and Liquidity Constraints.” The RAND Journal of Economics 25, no.2 (1994a): 334-347.
__________. “Sticking It Out: Entrepreneurial Survival and LiquidityConstraints.” The Journal of Political Economy 102, no. 1 (1994b): 53-75.
Hurst, Erik, and Annamaria Lusardi. “Liquidity Constraints, Household Wealth, andEntrepreneurship,” The Journal of Political Economy 112, no. 2 (2004): 319-347.
Immergluck, Dan, and Geoff Smith. “Bigger, Faster…But Better? How Changesin the Financial Services Industry Affect Small Business Lending in UrbanAreas.” Prepared for the Brookings Institution Center on Urban and Metropol-itan Policy by the Woodstock Institute, 2001.
Kihlstrom, Richard, and Jean-Jacques Laffont. “A General Equilibrium Theory ofFirm Formation Based on Risk Aversion.” The Journal of Political Economy 87,no. 4 (1979): 719-48.
Knight, Frank. Risk, Uncertainty, and Profit. New York: Houghton Mifflin, 1921.
Low, Sarah, Jason Henderson, and Stephan Weiler. “Gauging a Region’s Entre-preneurial Potential.” Federal Reserve Bank of Kansas City Economic Review.Third Quarter 2005: 61-89.
Lowrey, Ying. “The Entrepreneur and Entrepreneurship: A Neoclassical Approach.”Prepared by the Office of Advocacy, U.S. Small Business Administration for theASSA Annual Meetings, 2003.
Lucas, Robert. “On the Size Distribution of Business Firms.” Bell Journal ofEconomics 9, no. 2 (1978): 508-523.
Meyer, Bruce. “Why Are There So Few Black Entrepreneurs?” Working PaperNo. 3537 for the National Bureau of Economic Research, 1990.
Minority Business Development Agency. “The State of Minority Business.” 2001.
154 James R. Barth, Glenn Yago, and Betsy Zeidman

Mitchell, Karlyn, and Douglas Pearce. “Discrimination, Competition, and Rela-tionship vs. Transaction Lending to Small Businesses: Evidence from the 1998Survey of Small Business Finances.” Preliminary Draft, November 2004.
Moore, Kevin. “Do Liquidity Constraints Matter for New Entrepreneurs?” WorkingPaper No. 2004-42 of the Federal Reserve System Finance and Economics Discus-sion Series, 2004.
Petersen, Mitchell, and Raghuram Rajan. “Does Distance Still Matter? The Infor-mation Revolution in Small Business Lending.” The Journal of Finance 57, no.6 (2002): 2533-2570.
Phillips, Bruce. “Small Business Problems and Priorities.” National Federation ofIndependent Business Research Foundation, 2004.
Puri, Manju, and David Robinson. “Optimism and Economic Choice.” Preparedfor the AFA 2006 Boston Meetings Papers, 2005.
Schumpeter, Joseph. The Theory of Economic Development. Cambridge: HarvardUniversity Press, 1911.
U.S. Small Business Administration Office of Advocacy and The Ewing MarionKauffman Foundation. Entrepreneurship in the 21st Century. Conferenceproceedings from March 26, 2004.
Vos, Ed, Andrew Jia-Yuh Yeh, Sara Carter, and Stephen Tagg. “The Happy Storyof Small Business Financing.” Working Paper, 2005.
Yago, Glenn, Betsy Zeidman, and Bill Schmidt. Creating Capital, Jobs, and Wealthin Emerging Domestic Markets: Financial Technology Transfer to Low-IncomeCommunities. Milken Institute, 2003.
Stumbling Blocks to Entrepreneurship in Low- and Moderate-Income Communities 155