Embed Size (px)
Citation preview

TRITA-LWR Degree Project ISSN 1651-064X LWR-EX-2016:01
STUDY ON PROCESS PERFORMANCE AND EVALUATION OF DALA VATTEN’S TWO
MUNICIPAL WASTEWATER TREATMENT PLANTS
Anjali Amatya
December 2015

Anjali Amatya TRITA LWR Degree Project 2016:01
© Anjali Amatya 2015 Degree Project Environmental Engineering and Sustainable Infrastructure Done in association with the SWECO, Dala Vatten Avfall AB Division of Land and Water Resources Engineering Royal Institute of Technology (KTH) SE-100 44 STOCKHOLM, Sweden Reference should be written as: Amatya, A (2015) “Study on Process Performance and Evaluation of Dala Vatten’s Two Municipal Wastewater Treatment Plants” TRITA-LWR Degree Project 2016:01 38 p.
ii

Study on Process Performance and Evaluation of Two Municipal Wastewater Treatment Plants.
SUMMARY With the development of living standards of people, the need of proper wastewater treatment has become evident in order to protect the people health, society and environment. In 1980’s, traditional biological treatment methods such as activated sludge and trickling filter have been challenged by new technology called Moving Bed Biofilm Reactor (MBBR). In 2007 and 2012, intermittent and continuous aerated MBBR facilities have been installed for treating municipal wastewater at the plants in Sweden, respectively. This study was performed in two wastewater treatment plants: continuously aerated Gagnef wastewater treatment plant (WWTP) and intermittently aerated Tällberg WWTP located in Dalarna with the focus on process performance and identify the opportunities to reduce the energy consumption, chemical saving, possibilities in reducing excess sludge the and potential optimization of process. The experiment data (grab samples and flow proportional samples) were collected from both plants from the following samples stations: inlet, outlet of the treatment plant and upstream and downstream of MBBR reactor during May and August month. The analyses of selected parameters (BOD7, COD, TOC, NH4-N, and TN) were made in Övermo and Alcontrol Laboratory. The result show that both WWTP are currently running with a very low inlet loads in comparison with the design load i.e. both in flows and the major related loads. The concentration of organic loads (COD and TOC) and loading value of BOD7 and TP in the treated wastewater of both treatment plants show far better result than the ruling consent levels. The dose of poly-aluminum chloride has succeeded in removing total phosphorous probably due to coagulation and flocculation in both treatment plants. The Gagnef WWTP demonstrated an excessive use of chemical and sludge production as well as a high-energy consumption during the studied periods (May, 2015 and August, 2015). By contrast, Tällberg WWTP has proved to be successful in terms of lower energy consumption by the blower serving the MBBR. However, it failed to show improved specific energy efficiency for each pollutant load in the same following experiment periods. In conclusion, both treatment plants have shown satisfying results with a sustained biological performance with respect to organic matter (BOD7 and COD) and also with regard to TP removal. Further studies recommend more online measurements to improve the energy savings, investigation for the Gagnef WWTP whether it could be operated with an alternative: intermittent aeration mode and additional research is suggested for Tällberg WWTP to understand how the low incoming load or no load during night hours would influence further improvement of the treatment plant.
iii

Anjali Amatya TRITA LWR Degree Project 2016:01
iv

Study on Process Performance and Evaluation of Two Municipal Wastewater Treatment Plants.
SUMMARY IN SWEDISH Med utvecklingen av levnadsstandarden för människor, har behovet av ordentlig rening av avloppsvatten blivit uppenbart i syfte att skydda människors hälsa, samhälle och miljö. På 1980-talet, har traditionella biologiska behandlingsmetoder, såsom aktivt slam och trickling filter ifrågasatts av ny teknik som kallas Moving Bed Biofilm Reactor (MBBR). I Sverige, har år 2007 och 2012, intermittenta och kontinuerliga kolsyrat MBBR anläggningar installerats för att behandla kommunalt avloppsvatten vid anläggningarna. Denna studie genomfördes i två avloppsreningsverk: kontinuerligt luftas Gagnef avloppsreningsverk (ARV) och intermittent luftas Tällberg reningsverk ligger i Dalarna med fokus på processprestanda och att identifiera möjligheter att minska energiförbrukningen, kemisk sparande, möjligheter att minska överskott slam den och potentiell optimering av processen. De experiment data (grab och flödes proportionella prov) samlades från båda anläggningarna från följande prov stationer: inlopp, utlopp reningsverket och uppströms och nedströms MBBR, reaktorn under maj och augusti månader. Analyserna av utvalda parametrar (BOD7, COD, TOC, NH4-N, TN) gjordes i Övermo och Alcontrol Laboratory. Resultatet visar att båda reningsverk körs för närvarande med en mycket låg inlopps lmängd i jämförelse med konstruktionslasten dvs. både flöden och de stora relaterade mängder. Koncentrationen av organisk belastning (COD och TOC) och värdet på BOD7 och TP i det renade avloppsvattnet båda reningsverken visar mycket bättre resultat än de nuvarande samtycken nivåer. Mängden poly-aluminiumklorid har lyckats tas bort fosfor förmodligen på grund av koagulering och flockning i båda reningsverken. Gagnef reningsverket visade en överdriven användning av kemikalier och slamproduktion samt en hög energiförbrukning under de studerade perioderna (maj 2015 och augusti 2015). Däremot har Tällberg reningsverk visat sig vara framgångsrika när det gäller lägre energiförbrukning genom att fläkten betjänar MBBR. Men har inte lyckats åstadkomma förbättrad energieffektivitet för varje föroreningsbelastning i samma följande experimentperioder. Sammanfattningsvis har båda reningsverk visat tillfredsställande resultat med en bibehållen biologisk prestanda avseende, organiskt material (BOD7 och COD) och även med hänsyn till TP borttagning. Ytterligare studier rekommenderar mer online mätningar för att förbättra energibesparingar, utredning för Gagnef reningsverket om det skulle drivas med ett alternativ: är intermittent luftningsläge och ytterligare forskning föreslås för Tällberg reningsverk att förstå hur låg inkommande belastning eller ingen belastning (nattetid), skulle påverka ytterligare förbättring av reningsverket.
v

Anjali Amatya TRITA LWR Degree Project 2016:01
vi

Study on Process Performance and Evaluation of Two Municipal Wastewater Treatment Plants.
ACKNOWLEDGEMENT Firstly, I would like to thank my supervisor at KTH, Elzbieta Plaza, and my supervisors at SWECO, Stig Morling and Niclas Åstrand for their supervision, advices and immense knowledge during the project. Their guidance and inspiration helped me in all the time of research and writing this thesis. I would also like to thank Dala Vatten AB and Anna Danielsson in providing this opportunity to work in this project and for their support, patience and trust that they have shown to me. Finally, I would like to thank people from Gagnef WWTP, Tällberg WWTP and Alcontrol for helping me in the laboratory and making those months more pleasant. Last but not the least I would like to thank my family: my parents (K.G Amatya and Kalyani Amatya), husband, sisters and brother for supporting me throughout these two years as master student at KTH and during writing this thesis.
Stockholm, December 2015 Anjali Amatya
vii

Anjali Amatya TRITA LWR Degree Project 2016:01
viii

Study on Process Performance and Evaluation of Two Municipal Wastewater Treatment Plants.
TABLE OF CONTENT SUMMARY iii
SUMMARY IN SWEDISH v
ACKNOWLEDGEMENT vii
TABLE OF CONTENT ix
TABLE OF FIGURE xi
LIST OF SYMBOLS AND ABBREVIATIONS xiii
ABSTRACT 1
1. INTRODUCTION 1
1.1 Objectives 2
1.2 Limitations 2
2. BIOLOGICAL TREATMENT PROCESS 3
2.1 Principle of organic matter removal 4
2.2 Principle of Phosphorous removal 4
2.3 Principle of Nitrogen removal 5
3. VARIATION OF WASTEWATER FLOW WITH RESPECT TO HYDRAULICRETENTION TIME 6
4. MOVING BED BIOFILM REACTOR (MBBR) 7
4.1 Design Principles of MBBR 7
4.2 Parameters and variables controlling MBBR 9
4.3 Operation modes of MBBR 9
4.4 Application of MBBR in municipal wastewater 9
5. DALA VATTEN WASTEWATER TREATMENT FACILITIES 9
5.1 Gagnef Wastewater treatment plant 10
5.2 Process Description of Gagnef WWTP 11
5.2.1 Pre-treatment 11
5.2.2 Biological Treatment (MBBR) 11
5.2.3 Chemical Precipitation 12
5.2.4 Secondary Sedimentation 13
5.2.5 Sludge handling 13
5.3 Tällberg Wastewater treatment plant 13
5.4 Process Description of Tällberg WWTP 14
5.4.1 Pre-treatment 14
5.4.2 Primary Treatment 14
5.4.3 Biological (Secondary) Treatment 15
5.4.4 Chemical Precipitation 16
ix

Anjali Amatya TRITA LWR Degree Project 2016:01
5.4.5 Secondary Sedimentation 16
5.4.6 Sludge handling 16
5.5 Energy consumption of past five years’ time period of both WWTP 17
6. MATERIAL AND METHODS 17
6.1 Collection of regular data 17
6.2 On site sampling and analysis methods 19
6.3 Importance of Hydraulic Retention time (HRT) in both treatment plants 21
6.4 Quality of treated wastewater, and downstream effects in the receiving water body. 22
7. RESULTS 22
7.1 Analysis result of Gagnef WWTP 22
7.1.1 Pollution loading of Gagnef WWTP 25
7.1.2 Removal efficiency of analysed parameters 26
7.1.3 Variation of TP in Gagnef WWTP with respect to flow 27
7.2 Analysis result of Tällberg WWTP 28
7.2.1 Pollution loading of Tällberg WWTP 30
7.2.2 Removal efficiency of analysed parameters 32
7.2.3 Variation of TP in Tällberg WWTP with respect to flow 33
7.3 Chemical dose consumption of both WWTP 34
7.4 Sludge production of both WWTP 34
8. DISCUSSION AND RECOMMENDATION 34
9. CONCLUSION 36
REFERENCE 37
APPENDIX I: RUNTIME OF BLOWER AND PUMPS IN GAGNEF WWTP IN MAY,2015 I
APPENDIX II: RUNTIME OF BLOWER AND PUMPS IN GAGNEF WWTP INAUGUST, 2015 II
APPENDIX III: RUNTIME OF BLOWER AND PUMPS IN TÄLLBERG WWTP INMAY, 2015 III
APPENDIX IV: RUNTIME OF BLOWER AND PUMPS IN TÄLLBERG WWTP INAUGUST, 2015 IV
x
Study on Process Performance and Evaluation of Two Municipal Wastewater Treatment Plants.
TABLE OF FIGURE Fig. 1: Basic mechanism of biological treatment process. 4
Fig. 2: Principle of Phosphorous removal. 5
Fig. 3: Variation of sewage discharge with water consumption discharge in 24 hours. 6
Fig. 4: MBBR showing (a) aerobic, (b) anoxic/anaerobic reactor. 7
Fig. 5: MBBR reactor (a and b) under construction showing different components of it . 8
Fig. 6: Network of pipes lying at the bottom of tank for aeration. 8
Fig. 7: Horizontal cylindrical sieve to prevent carriers to flow out of the reactor. 8
Fig. 9: Shape of biofilm carrier (K3). 8
Fig. 8: Freely moving biofilm carriers within MBBR. 8
Fig. 10: Map of Dalarna with Dala Vatten Avfall AB and its two-wastewater treatment plants. 10
Fig. 11: Overview of Gagnef WWTP, simplified flow scheme. 10
Fig. 13: Equalization tank along with pipes connecting into MBBR reactor. 11
Fig. 12: Screening step. 11
Fig. 14: MBBR reactor in Gagnef WWTP. 11
Fig. 15: Hach Lange recorder. 11
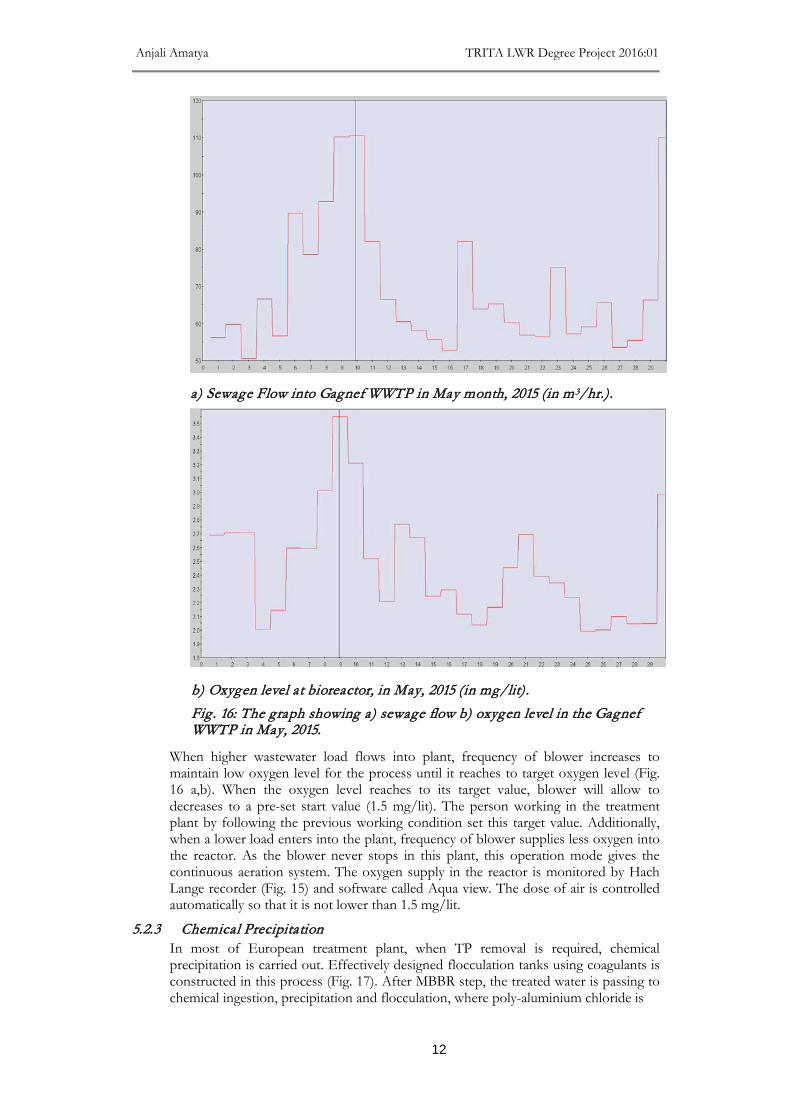
b) Oxygen level at bioreactor, in May, 2015 (in mg/lit). 12
Fig. 16: The graph showing a) sewage flow b) oxygen level in the Gagnef WWTP in May, 2015. 12
a) Sewage Flow into Gagnef WWTP in May month, 2015 (in m3/hr.). 12
Fig. 18: Secondary Sedimentation tank. 13
Fig. 17: 20m3 storage tank for Ekoflock 90. 13
Fig. 19: Overview of Tällberg WWTP, simplified flow scheme. 14
Fig. 20: Screening step. 14
Fig. 21: Collection of floating material after screening. 14
Fig. 22: A graph showing a) sewage flow and b) oxygen level in Tällberg WWTP in May month, 2015. 15
Fig. 23: 10m3 storage tank for Ekoflock 90. 16
Fig. 24: Secondary sedimentation tank. 16
Fig. 25: Flocs floating in the beginning of secondary sedimentation tank. 16
Fig. 26: Location of sampling stations in both treatment plants. 18
Fig. 27: Location of sampling stations in both treatment plants (second session). 18
Fig. 28: Hach Lange cuvettes used in a, b and c analysation methods. 19
xi

Anjali Amatya TRITA LWR Degree Project 2016:01
Fig. 29: Hach Lange Spectrometer for COD, TOC and NH4-N analysis method. 20
Fig. 30: Old Hach Lange method for TP with phosphorus reagent. 20
Fig. 31: The rule showing which pollutant should be controlled with respect to population equivalent while discharging it into a water body. 22
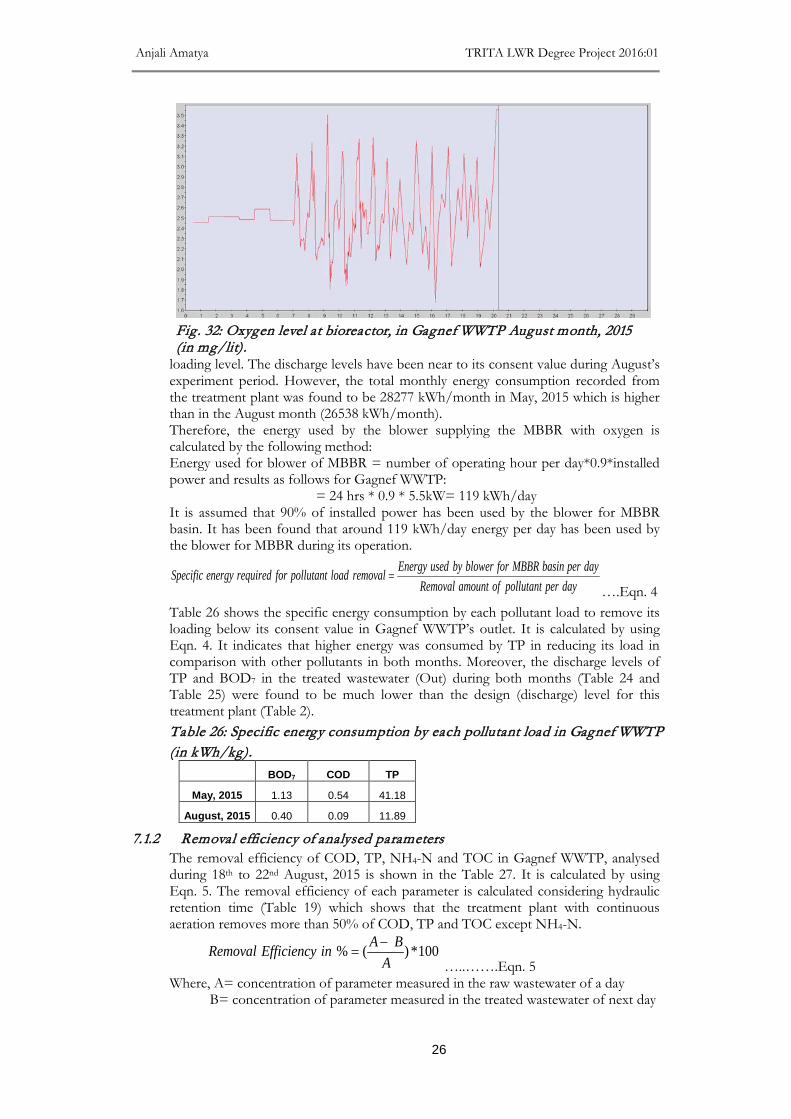
Fig. 32: Oxygen level at bioreactor, in Gagnef WWTP August month, 2015 (in mg/lit). 26
Fig. 33: Variation of TP with respect to flow in 2015/08/17 (in mg/lit). 27
Fig. 34: Variation of TP with respect to flow in 2015/08/18 (in mg/lit). 28
Fig. 35: Oxygen level at bioreactor, in Tällberg WWTP in August month, 2015. 32
Fig. 36: Variation of TP with respect to flow in 2015/08/20 (in mg/lit). 33
Fig. 37: Variation of TP with respect to flow in 2015/08/21 (in mg/lit). 33
xii

Study on Process Performance and Evaluation of Two Municipal Wastewater Treatment Plants.
LIST OF SYMBOLS AND ABBREVIATIONS
Symbols Description MBBR Moving bed biofilm reactor WWTP Wastewater treatment plant PE Population Equivalent (1 PE= 70 g BOD7/day) BOD7 Biological oxygen demand COD Chemical oxygen demand TOC Total organic carbon TP Total Phosphorous TN Total Nitrogen NH4-N Ammonium-Nitrogen VFA Volatile fatty acid PO43- Ortho-Phosphate RBC: s Rotating biological contactors EU European Union HRT Hydraulic retention time TS Total solids BM Blow machine FBM Fan of Blow machine
xiii

Anjali Amatya TRITA LWR Degree Project 2016:01
xiv

Study on Process Performance and Evaluation of Two Municipal Wastewater Treatment Plants.
ABSTRACT Dala Vatten AB has been operating two municipal wastewater treatment plant namely Gagnef wastewater treatment plant and Tällberg wastewater treatment plant since 1970’s and 1950’s respectively in Dalarna, middle of Sweden. These both traditional treatment plants have been updated with continuous and intermittent aerated biological treatment facilities: Moving bed biofilm reactor (MBBR) in 2012 and 2007 respectively. Recently, more detailed process performance and evaluation of both plants is required focusing on energy consumption. The objective of this master thesis is thus to investigate the opportunities in reducing energy consumption from both plants to save operation cost, identify the opportunities for chemical saving, if possible reduce the excess sludge so produced from the plant and potential optimization of the process for its plant’s sustainability. The laboratory study was made in May and August, 2015 with grab sampling and flow proportional sampling method. The analysation was carried out with several wastewater parameters: BOD7, COD, TOC, TP, NH4-N and TN with Hach Lange analysing method. Results showed that both continue and intermittent aerated plants have higher process performance with lower effluent organic (BOD7, COD) and TP loading to the recipient. Gagnef WWTP with continuous aeration has demonstrated an excessive use of chemical, sludge production and high-energy consumption by the blower serving MBBR during the studied period. By contrast, Tällberg WWTP with intermittent aeration has proved to be successful in terms of lower energy consumption by the blower serving the MBBR but failed to show improved specific energy efficiency for each pollutant load during the studied period. The recommendation in improvising energy saving and saving operation cost at both treatment plants was put forward.
Key words: Moving bed biofilm reactor, intermittent aeration, continuous aeration, Gagnef WWTP, Tällberg WWTP
1. INTRODUCTION
Wastewater treatment is a vast term, which is applied to processes and operation toreduce the intolerable properties of wastewater so as to make it less dangerous to humankind and nature (Punmia et al., 2003). In the past, the wastewater treatment method was simply disposed of waste material into a nearby water body and to rely on natural self-purification. With the spreading of transferable disease like cholera caused by pathogenic organisms in the sewage and pollution of surface and groundwater, the need of wastewater treatment has become evident. The proper treatments methods of wastewater have been further developed from physical treatment to engineered advanced treatment models, based on biological and chemical methods and applied in the field. The intensive use of artificial fertilization especially in the agriculture field, causing eutrophication in water body and development of modern civilization has made updated wastewater treatment facilities needed, thus following strict Environmental guidelines in order to protect the people health, society and environment. In Sweden, people have recognized the problem with wastewater around 1940 (Naturvårdsverket, 2006). Though, in Stockholm the crucial decision on wastewater treatment facilities were made in 1930. As the development and living standards in the country has risen significantly since those years, more wastewater treatment plants have been installed all-round the country and now serving around 90% of the Swedish
1

Anjali Amatya TRITA LWR Degree Project 2016:01
population. The treatment of different wastewater streams, whether it comes from municipal or industrial, depends on its composition, extent of purification, funds availability and environment demands. The traditional biological treatment methods such as activated sludge, trickling filter dominated mostly in the field. But in 1980’s, the traditional methods have been challenged by new technology called Moving Bed Biofilm Reactor (MBBR) due to its efficiency, compactness and flexibility (Lustig, 2012). It is different from activated sludge due to retained biomass, attached to media. The process has been used for treatment of both municipal and industrial wastewater. Today there are around 600 MBBR’s that has been installed in 50 different countries throughout the world. Installations are implemented for various treatment purposes such as organic removal, nitrification and denitrification for both municipal and industrial wastewater (McQuarrie et al., 2011); (Ødegaard, 2000). In Sweden, by 2007 and 2012, intermittent and continuous aerated MBBR facilities have been installed for treating municipal wastewater at the plants. In the following two plants in middle part of Sweden, in Dalarna are examined. More detailed performance knowledge of MBBR operation has recently focused on studies of energy requirements and energy efficiency. The total energy consumption at any biological treatment plant is dependent on chemical and electrical energy demand (Owen, 1982). Pumping, blowers and mixers characterize the electrical energy consumption unit, whereas the chemical energy requirement is represented by the addition of chemicals during the treatment process (Karlsson et al.). The reduction of this total energy would imply the reduction of total operation cost of the treatment plant. Since mass and energy flows at different treatment stages of/within the treatment plant are dependent with each other, analysis of mass balances would be the better step to reflect the energy consumption of treatment plant (Karlsson & Tovar).
1.1 Objectives The objectives of this thesis are to study two different wastewater treatment plants, located in Dalarna with focus on process performance and evaluate them. The two plants are operated by Dala Vatten AB: Gagnef wastewater treatment plant and Tällberg wastewater treatment plant. The following objectives for this thesis are identified.
• Describe process performances of continuous and intermittent aeratedMBBR, and investigate opportunities to reduce the energy consumption inboth plants, thus saving operation cost;
• Identify the opportunities for chemical savings;• Identify the possible way in reducing excess sludge so produced;• Identify the potential optimization of the process.
1.2 Limitations The experiment instruments such as Hach Lange cuvettes and Hach Lange Spectrometer used during the analysation of different parameters are restricted to its own specification ranges and limitation. So if the result crosses these ranges, it is difficult to predict whether the result is acceptable or unacceptable. Under such circumstances, the analysing method by using Hach Lange cuvettes for total phosphorous (TP) was needed to change into traditional Hach Lange method with phosphorous reagent. Therefore results so obtained during the experiments period are truly restricted to laboratory conditions and instructions. Moreover, in Övermo laboratory which is located in the main treatment plant of Dala Vatten, it was difficult to analyses Biological oxygen demand (BOD7) and Total Nitrogen (TN) due to limitation of instruments. Due to which, some of the samples were send to Alcontrol laboratory, in Linköping for further analysation. The samples are usually sent at the end of the week, meaning samples need to be freezing for certain days to protect its quality. The maintenance of sample quality is further limited to how the sample is handled during its transportation, storage time period in
2

Study on Process Performance and Evaluation of Two Municipal Wastewater Treatment Plants.
Alcontrol laboratory and their analysing methods.
2. BIOLOGICAL TREATMENT PROCESS
In general, physical, chemical or biological means are applied for wastewatertreatment. These technical methods have been used in most classical wastewater treatment plants. It comprises preliminary, primary, biological and/or tertiary methods. The pre-treated wastewater still contains colloidal and soluble dissolved organic matter, as well as nutrients. Organic compounds are degraded by bacteria into insoluble matter in biological treatment step. The process is represented by the following equation (Eqn.1).
Organic Matter + Bacteria + O2 →Cell biomass + CO2, H2O, NH3……….Eqn. 1 The suspended solids matters in the biological process contain inter alia cell biomass, which is then removed by particle separation step by sedimentation or dissolved air flotation (Templeton et al, 2011). In general, oxygen is supplied to wastewater through compressed air (bottom aeration) or through mixing (surface aeration) (Templeton et al, 2011). If the quality of biologically treated wastewater does not meet final disposal requirement and still contain high level of nutrient concentrations (nitrogen and phosphorous), then it is further treated into tertiary treatment systems (Soni, 2013). Ultrafiltration, biological nitrification/denitirfication, ion exchange, reverse osmosis and post chemical precipitation are some of the examples of tertiary treatment methods. Over the past century, the biological treatment process works under either suspended growth or attached growth (also called fixed film) process. These two basic processes have both achieved a high level of acceptance. During suspended growth process, wastewater flows through free-floating bacteria (Fig. 1a). The dissolved oxygen is supplied by compressed air for mixing action between bacteria and wastewater. As there is sufficient organic matter (food) and dissolved oxygen, these bacteria absorb organic matter and nutrients in the wastewater, thus increasing flocs of biomass. The flocs will settle down in a downstream clarifier (sedimentation tank). As the settled flocs retain the bacteria, the major part is recycled into aeration tank to keep the biological activity at the needed efficiency level (Westerling, 2014). The processes such as activated sludge processes, sequencing batch reactor are typical processes for this concept. The aerated lagoon is to some extent a member of this treatment model, however with a somewhat different operation mode. By contrast, in attached growth process, wastewater flows through bed of media where group of bacteria are attached to the media, and the bacteria mass is then labelled biofilm (Fig. 1b). The media would be fixed bed of plastic, gravel, ceramic, rocks or peat moss, which helps in retaining and growing of bacteria. As the biofilm becomes thicker with more wastewater flows, eventually it falls off. These biofilms remain heterogeneous through the process. The treatment method such as rotating biological contactors (RBC: s) and trickling filters are based on it. Both suspended growth and attached growth has their own advantage and disadvantage in the process. The attached growth method has been considered as most satisfactory due to small footprint, minimum equipment maintenance and simpler operation than suspended growth method (Ødegaard et al., 1994; Westerling, 2014). Additionally, fixed film is not only absence of sludge return but they also facilities higher organic pollutant removal rate per unit apparatus volume comparing to suspended growth method (Chaudhry et al., 1998; Hu et al., 1994). However, the problem in fixed film is due to uneven distribution of wastewater over carrier surface in fixed media, breakdown of continuity process for backwashing of filter bed and hydraulic instability (Ødegaard, 2006).
3
Anjali Amatya TRITA LWR Degree Project 2016:01
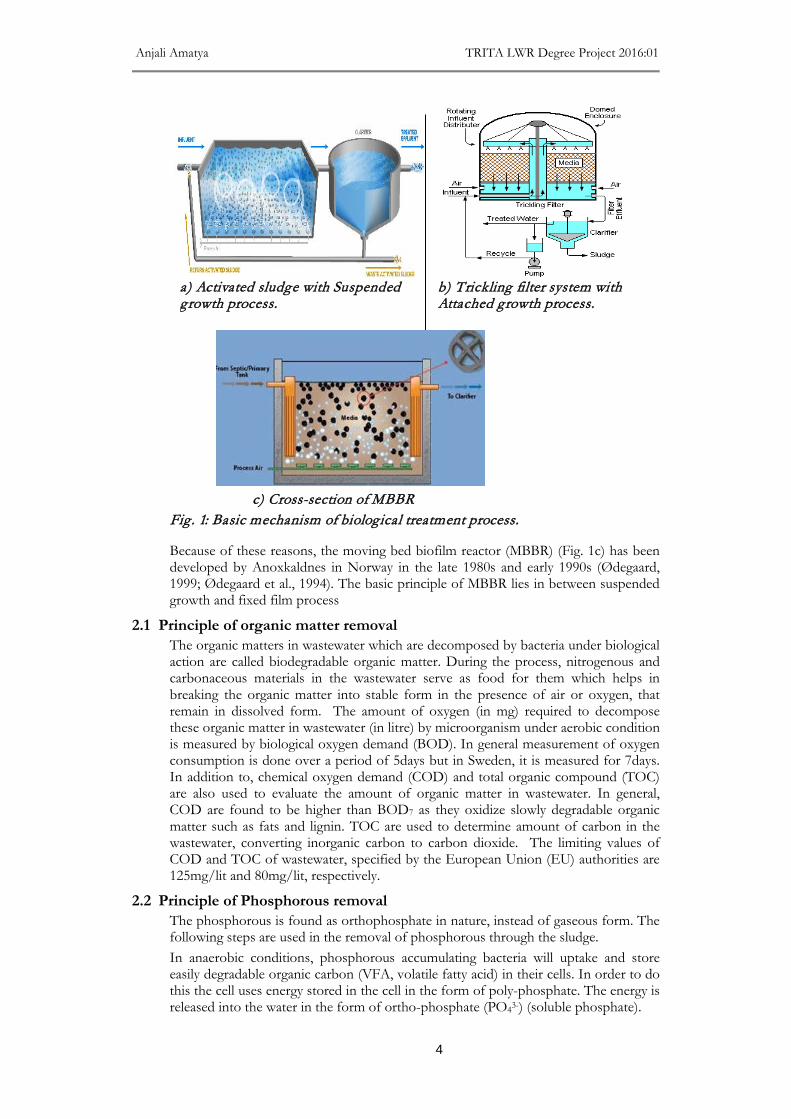
Because of these reasons, the moving bed biofilm reactor (MBBR) (Fig. 1c) has been developed by Anoxkaldnes in Norway in the late 1980s and early 1990s (Ødegaard, 1999; Ødegaard et al., 1994). The basic principle of MBBR lies in between suspended growth and fixed film process
2.1 Principle of organic matter removal The organic matters in wastewater which are decomposed by bacteria under biological action are called biodegradable organic matter. During the process, nitrogenous and carbonaceous materials in the wastewater serve as food for them which helps in breaking the organic matter into stable form in the presence of air or oxygen, that remain in dissolved form. The amount of oxygen (in mg) required to decompose these organic matter in wastewater (in litre) by microorganism under aerobic condition is measured by biological oxygen demand (BOD). In general measurement of oxygen consumption is done over a period of 5days but in Sweden, it is measured for 7days. In addition to, chemical oxygen demand (COD) and total organic compound (TOC) are also used to evaluate the amount of organic matter in wastewater. In general, COD are found to be higher than BOD7 as they oxidize slowly degradable organic matter such as fats and lignin. TOC are used to determine amount of carbon in the wastewater, converting inorganic carbon to carbon dioxide. The limiting values of COD and TOC of wastewater, specified by the European Union (EU) authorities are 125mg/lit and 80mg/lit, respectively.
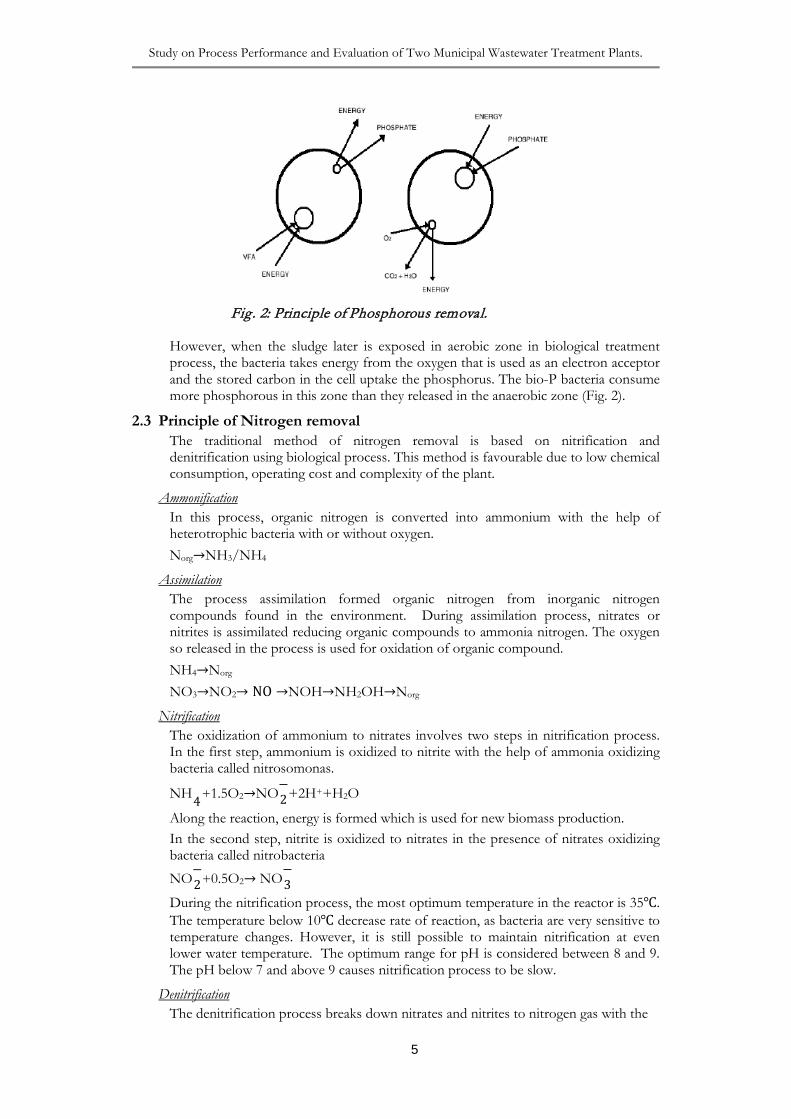
2.2 Principle of Phosphorous removal The phosphorous is found as orthophosphate in nature, instead of gaseous form. The following steps are used in the removal of phosphorous through the sludge. In anaerobic conditions, phosphorous accumulating bacteria will uptake and store easily degradable organic carbon (VFA, volatile fatty acid) in their cells. In order to do this the cell uses energy stored in the cell in the form of poly-phosphate. The energy is released into the water in the form of ortho-phosphate (PO43-) (soluble phosphate).
Fig . 1: Basic mechanism of biological treatment process.
a) Activated sludge with Suspended growth process.
b) Trickling filter system with Attached growth process.
c) Cross-section of MBBR
4
Study on Process Performance and Evaluation of Two Municipal Wastewater Treatment Plants.
However, when the sludge later is exposed in aerobic zone in biological treatment process, the bacteria takes energy from the oxygen that is used as an electron acceptor and the stored carbon in the cell uptake the phosphorus. The bio-P bacteria consume more phosphorous in this zone than they released in the anaerobic zone (Fig. 2).
2.3 Principle of Nitrogen removal The traditional method of nitrogen removal is based on nitrification and denitrification using biological process. This method is favourable due to low chemical consumption, operating cost and complexity of the plant.
Ammonification In this process, organic nitrogen is converted into ammonium with the help of heterotrophic bacteria with or without oxygen. Norg→NH3/NH4
Assimilation The process assimilation formed organic nitrogen from inorganic nitrogen compounds found in the environment. During assimilation process, nitrates or nitrites is assimilated reducing organic compounds to ammonia nitrogen. The oxygen so released in the process is used for oxidation of organic compound. NH4→Norg NO3→NO2→ NO →NOH→NH2OH→Norg
Nitrification The oxidization of ammonium to nitrates involves two steps in nitrification process. In the first step, ammonium is oxidized to nitrite with the help of ammonia oxidizing bacteria called nitrosomonas.
NH+4+1.5O2→NO
−2+2H++H2O
Along the reaction, energy is formed which is used for new biomass production. In the second step, nitrite is oxidized to nitrates in the presence of nitrates oxidizing bacteria called nitrobacteria
NO−2+0.5O2→ NO
−3
During the nitrification process, the most optimum temperature in the reactor is 35℃. The temperature below 10℃ decrease rate of reaction, as bacteria are very sensitive to temperature changes. However, it is still possible to maintain nitrification at even lower water temperature. The optimum range for pH is considered between 8 and 9. The pH below 7 and above 9 causes nitrification process to be slow.
Denitrification The denitrification process breaks down nitrates and nitrites to nitrogen gas with the
Fig . 2: Principle of Phosphorous removal.
5
Anjali Amatya TRITA LWR Degree Project 2016:01
help of heterotrophic bacteria using carbon compound as energy and nitrates as electron acceptor. The process takes place in anaerobic condition. NO3→NO2→ NO →N2O→N2
In this process, the optimum temperature should be 20℃ as these bacteria are less sensitive towards temperature. Again, in most Nordic countries the prevailing water temperature is found to be 6-18℃ and still very stable and good denitrification capacities are found. The pH is considered to be optimum in the range of 6.5-7.5.
3. VARIATION OF WASTEWATER FLOW WITH RESPECT TO HYDRAULIC RETENTION TIME
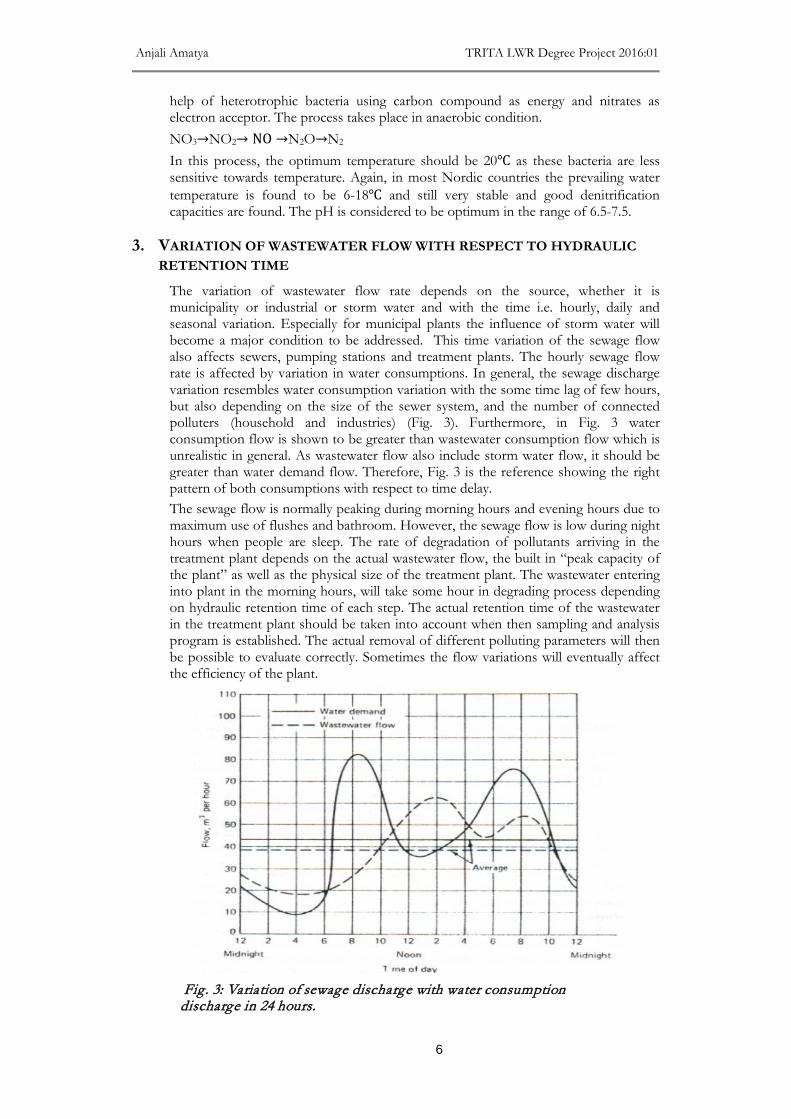
The variation of wastewater flow rate depends on the source, whether it is municipality or industrial or storm water and with the time i.e. hourly, daily and seasonal variation. Especially for municipal plants the influence of storm water will become a major condition to be addressed. This time variation of the sewage flow also affects sewers, pumping stations and treatment plants. The hourly sewage flow rate is affected by variation in water consumptions. In general, the sewage discharge variation resembles water consumption variation with the some time lag of few hours, but also depending on the size of the sewer system, and the number of connected polluters (household and industries) (Fig. 3). Furthermore, in Fig. 3 water consumption flow is shown to be greater than wastewater consumption flow which is unrealistic in general. As wastewater flow also include storm water flow, it should be greater than water demand flow. Therefore, Fig. 3 is the reference showing the right pattern of both consumptions with respect to time delay. The sewage flow is normally peaking during morning hours and evening hours due to maximum use of flushes and bathroom. However, the sewage flow is low during night hours when people are sleep. The rate of degradation of pollutants arriving in the treatment plant depends on the actual wastewater flow, the built in “peak capacity of the plant” as well as the physical size of the treatment plant. The wastewater entering into plant in the morning hours, will take some hour in degrading process depending on hydraulic retention time of each step. The actual retention time of the wastewater in the treatment plant should be taken into account when then sampling and analysis program is established. The actual removal of different polluting parameters will then be possible to evaluate correctly. Sometimes the flow variations will eventually affect the efficiency of the plant.
Fig . 3: Variation of sewage discharge with water consumption discharge in 24 hours.
6

Study on Process Performance and Evaluation of Two Municipal Wastewater Treatment Plants.
4. MOVING BED BIOFILM REACTOR (MBBR) Moving bed biofilm reactor (MBBR) (Fig. 1c) is continuously operated, non- cloaggable reactor containing biofilm carriers of specific gravities (less than water) and high specific surface area (Ødegaard et al., 1994). The bacteria (biofilm/biomass) are attached to these biofilm carriers, which travel freely along with water, in the reactor (Ødegaard et al., 1994). Unlike the biofilter (fixed film) process, carriers utilize whole tank volume for biomass growth. Further, the sludge recirculation is absent in this process which is found in activated sludge process. Therefore, MBBR adopt the best features from both activated sludge process and biofilter process excluding their disadvantages. The major components of MBBR are
a) Reactor/Tank b) Biofilm carrier/media c) Aeration system (aerobic/anaerobic) d) Sieve assemblies e) Blowers f) Mixers g) On-line sensors to control the process
All the MBBR components are submerged in the reactor, with the obvious exception for the blowers.
4.1 Design Principles of MBBR In general, MBBR has length to width ratio within the range of 0.5:1 to 1.5:1 (McQuarrie & Boltz, 2011). This reactor works either in aerobic or in anaerobic/anoxic environment. In aerobic processes, carriers containing bacteria are allowed to move freely by aeration (Fig. 4a) while in anoxic/anaerobic processes, they are agitated by mechanical mixing (Fig. 4b), but still allowed to move freely within the reactor volume. The carriers remain within the reactor with the help of sieve arrangement at the reactor outlet (Fig. 7). This sieve may be rectangular mesh sieve mounted vertically or cylindrical bar sieve mounted vertically or horizontally (Fig. 5). There is no need of backwashing due to fully dynamic bed of MBBR and the headloss through reactor is insignificant due to turbulent mixing, however the hydraulic losses through the serving facility have to be calculated and taken into consideration (Maurer et al., 2001). In addition to aeration and mechanical mixing, distribution mechanism also includes liquid recirculation. The low-pressure air supply to safeguard the needed oxygen capacity is given into aerobic reactor through the network of pipes, attached at the bottom of it (Fig. 6 and Fig. 5a, b). The flow control valves are installed in the reactor, which helps in re-circulation of water distributing carriers uniformly. These mechanisms i.e. aeration or mechanical mixing and flow control valves would require energy to maintain the MBBR process performance throughout the operation and maintenance of the plant. Fig . 4: MBBR showing (a) aerobic, (b) anoxic/anaerobic reactor.
7

Anjali Amatya TRITA LWR Degree Project 2016:01
Biofilm Carriers The Anoxkaldnes biofilm carriers (Fig. 8) are made of polyethylene and ring shaped in structure (nominal diameter of 25mm and nominal depth of 10mm) with cross inside the cylinder and longitudinal fins on the outside (Fig. 9). It has large specific surface area of 500m2/m3 and has a slightly lower density than water (0.95g/cm3). The filling fraction of carrier element in the reactor is subject to preference. In general, effective specific surface area of 335 m2/m3 at 67% filling fraction is calculated since the bacteria grows inside of carriers. In order to move carrier freely in suspension, the possible filling fraction is recommended to be 70% corresponding to 335 m2/m3 of effective specific surface area for K3 (Ødegaard, 2006) However, the plant can use below this number (<50 %) depending on suitability of the plant (Ødegaard, 2006, 2014). The study made by Ødegaard et al. (1999) shows that biofilm area plays a vital role in design and thus design rate of the process is purely based on effective surface area.
Fig. 6: Network of pipes lying at the bottom of tank for aeration.
Fig . 7: Horizontal cylindrical sieve to prevent carriers to flow out of the reactor.
Fig . 9: Shape of biofilm carrier (K3).
Fig . 8: Freely moving biofilm carriers within MBBR.
b) Anoxic reactor with horizontally mounted shaft mixers and rectangular mesh. sieves
a) Aerobic reactor with aeration system and vertically mounted cylindrical bar sieves. Fig . 5: MBBR reactor (a and b) under construction showing different components of it .
8

Study on Process Performance and Evaluation of Two Municipal Wastewater Treatment Plants.
4.2 Parameters and variables controlling MBBR The typical operating parameters for MBBR are shown in the following Table 1. Table 1: Operating Parameters of MBBR.
No. Parameter Range Source 1. Carrier (K1, K2, K3) a. Diameter (mm) 5-48 (McQuarrie & Boltz, 2011)
b. Depth (mm) 3-15 c. Specific surface area (m2/m3) 400-850 2. Contact time 2-5 (Ødegaard, 2000; Ødegaard et al.,
2000) 3. BOD loading rate (kg BOD7/m3.day)
4-5
4. Backwashing Do not require 5. Head loss Insignificant
The hydraulic retention time (HRT, θ) shows the average times it takes for the water to move from start point to end point of any process
Where, θ= hydraulic retention time, days V = treatment tank volume, m3 Q= influent flow rate, m3/days
4.3 Operation modes of MBBR The carriers are feed into the reactor before operation of system depending on filing percentage. The wastewater is feed into reactor after pre-treatment and primary treatment facilities. In order to maintain the oxygen level and growth of bacteria, air is injected through network of pipes to create ideal operating conditions (Fig. 6). The treated water is discharged from through outlet.
4.4 Application of MBBR in municipal wastewater The MBBR process has been used for many different applications for industrial and municipal wastewater treatment. The process was developed when removing nitrogen concentration in wastewater was the prioritized. Later, the research on removal of organic matter, removal of phosphate and upgrading of activated sludge process were conducted. Ødegaard et al (2004) studies show the higher rate secondary treatment with regards to MBBR combing coagulation and flocculation with less than 1hr. retention time. Further, Ødegaard (2006) illustrated on his research paper regarding the four Norwegian plants based on MBBR followed by coagulation and sedimentation. The result on these plants shows high removal efficiencies with low effluent concentration in BOD7, COD and TP Depending on the compactness of MBBR, organic loading and strength of wastewater, the resident time required for carboneous matter removal was found to be 15-90 min (Ødegaard, 2006). This shows that biodegradable, soluble organic matter can be degraded in much less time in MBBR. Furthermore, the process is tested in pilot and full scale plants for the municipal and food industry wastewater treatment since 1989 (Broch-Due et al., 1994) and its popularity has been continued in more than 100 plants around the world for the above mention treatment purposes in both municipal and industrial wastewater (Ødegaard et al., 2000)
5. DALA VATTEN WASTEWATER TREATMENT FACILITIES Dala vatten wastewater treatment plant (WWTP) is located in middle of Sweden, North West from Stockholm (Fig. 10) in Dalarna. It is municipality based company that takes the responsibility of public water supply and wastewater plants in the
VQ
θ =
9

Anjali Amatya TRITA LWR Degree Project 2016:01
municipalities of Rättvik, Leksand, Gagnef and Vansbro municipality within Dalarna (Dala Vatten och Avfall AB, 2014a). This thesis is mainly focused in two wastewater treatment plants: Gagnef wastewater treatment plant and Tällberg wastewater treatment plant located in Gagnef and Leksand municipality, respectively.
5.1 Gagnef Wastewater treatment plant Gagnef WWTP has been in operation since 1970 for treating wastewater collected from Gagnef, Djurås, Bäsna, Djurmo, Sifferbo, Moje, Backhoe and Ålkilen (Dala Vatten och Avfall AB, 2014a). The plant was designed for mechanical treatment with screening directly followed by chemical precipitation and secondary sedimentation. It was in 2012 when additional biological treatment step based on MBBR was added to the plant (Fig. 11). The plant is operated under continuous aeration system and it is not designed for treating industrial wastewater. The total length of sewers in Gagnef treatment plant is 144 km with 58 units of larger pumping stations and 15 units of small pumping stations. Storm water is collected in same pipeline network as household wastewater i.e. a combined sewer system. The treated wastewater is discharged into Dalälven River.
Fig . 10: Map of Dalarna with Dala Vatten Avfall AB and its two-wastewater treatment plants.
Fig . 11: Overview of Gagnef WWTP, simplified flow scheme.
10

Study on Process Performance and Evaluation of Two Municipal Wastewater Treatment Plants.
Table 2: The design load of Gagnef WWTP. Parameter Value
PE 6000 pe Flow 2100 m3/day, Design flow= 112 m3/hr. BOD7 420 kg/day
Total Phosphorous 15 kg/day The treatment plant has been designed for the following loads, shown in the Table 2.
5.2 Process Description of Gagnef WWTP 5.2.1 Pre-treatment
In this WWTP, municipal wastewater is passed into screening of 2mm bar screen for pre-treatment (Fig. 12). The large solid materials that are removed from the wastewater are then collected into separate collecting bin. This pre-treated wastewater is then passed into an equalization tank. The pump so installed in the equalization tank (Fig. 13), lifts the wastewater into MBBR reactor. Thus, there is no primary sedimentation tank in this treatment plant.
5.2.2 Biological Treatment (MBBR) After screening, the wastewater is flowed into MBBR reactor. It is cylindrically closed reactor, built separately out of the treatment plant (Fig. 14). In this process, degradable substances are captured and converted by bacteria, carried by K3 carriers in the present of oxygen. The system is continuously aerated; thus air is supplied continuously by blowers through the network of pipes located on the bottom of the reactor.
Fig . 12: Screening step.
Fig . 13: Equalization tank along with pipes connecting into MBBR reactor.
Fig . 14: MBBR reactor in Gagnef WWTP.
Fig . 15: Hach Lange recorder.
11
Anjali Amatya TRITA LWR Degree Project 2016:01
When higher wastewater load flows into plant, frequency of blower increases to maintain low oxygen level for the process until it reaches to target oxygen level (Fig. 16 a,b). When the oxygen level reaches to its target value, blower will allow to decreases to a pre-set start value (1.5 mg/lit). The person working in the treatment plant by following the previous working condition set this target value. Additionally, when a lower load enters into the plant, frequency of blower supplies less oxygen into the reactor. As the blower never stops in this plant, this operation mode gives the continuous aeration system. The oxygen supply in the reactor is monitored by Hach Lange recorder (Fig. 15) and software called Aqua view. The dose of air is controlled automatically so that it is not lower than 1.5 mg/lit.
5.2.3 Chemical Precipitation In most of European treatment plant, when TP removal is required, chemical precipitation is carried out. Effectively designed flocculation tanks using coagulants is constructed in this process (Fig. 17). After MBBR step, the treated water is passing to chemical ingestion, precipitation and flocculation, where poly-aluminium chloride is
b) Oxygen level at bioreactor, in May, 2015 (in mg/lit). Fig . 16: The graph showing a) sewage flow b) oxygen level in the Gagnef WWTP in May, 2015.
a) Sewage Flow into Gagnef WWTP in May month, 2015 (in m3/hr.).
12

Study on Process Performance and Evaluation of Two Municipal Wastewater Treatment Plants.
added into it. The floc is produced as result of this process.
5.2.4 Secondary Sedimentation After flocculation, the treated wastewater is allowed to sediment for the last time to settle the flocs at the bottom of secondary sedimentation tank (Fig. 18) and is flowed out into the recipient.
5.2.5 Sludge handling The sludge so produced during the various treatment processes is then pumped into two sludge thickeners, where polymer is added. The sludge further undergoes to dewatering process by means of centrifuge. It is dewatered to approximately (18-20) % TS which is then transported to Forsbacka, inside the community of Gävle, where it is used as plant soil. The flow of wastewater entered into the treatment plant, different types of chemical added and energy required during the treatment process and the sludge so produced in Gagnef WWTP in the period of five years (2010-2014) is shown in the Table 3. Table 3: The flow, sludge and chemical added of Gagnef WWTP in five years time period.
Table 4: Size of each treatment step in Gagnef WWTP.
5.3 Tällberg Wastewater treatment plant Tällberg WWTP has been in operation since 1950 for treating wastewater collected from Tällberg, Laknäs and Plintsberg. The plant has been updated in 1976 and 1990 (Dala Vatten och Avfall AB, 2014b). It was designed for mechanical treatment with screening followed by primary sedimentation, chemical precipitation and secondary sedimentation. As number of people increased during holidays, high wastewater load has been flowed into plant.Therefore an additional biological treatment step based on MBBR was added to the plant in 2007 (Fig. 19). The plant is operated under intermittent aeration system and it collects only municipality wastewater along
Gagnef WWTP Chemicals added
Sludge (Total volume of sludge with
water content)
Year Flow
(m3/yr.) Ekoflock 90
(Ton/yr.) Superfloc C-492HMW
(Ton/yr.)
(m3/yr.)
2010 553 959 92 0.87 1 000
2011 462983 78 0.90 1543
2012 541 845 62 0.68 1 990
2013 394 030 46 0.8 2 620
2014 437 826 92 1.1 2 276
Volume of MBBR reactor (m3) 402
Volume of Flocculent tank (m3) 57
Volume of Secondary sedimentation tank (m3) 550
Fig. 18: Secondary Sedimentation tank.
Fig . 17: 20m3 storage tank for Ekoflock 90.
13

Anjali Amatya TRITA LWR Degree Project 2016:01
together with storm water, without considering any industrial wastewater. The total length of sewers in Tällberg treatment plant is 26 km with 3 units of pumping stations. The treated wastewater is discharged into Siljan Sea. The treatment plant has been designed for the following loads, shown in the Table 5. Table 5: The design load of Tällberg WWTP.
Parameter Value PE 5000 pe
Flow 2000 m3/day, Design flow=100 m3/hr. BOD7 350 kg/day
Total Phosphorous 12.5 kg/day
5.4 Process Description of Tällberg WWTP 5.4.1 Pre-treatment
The pre-treatment is the first step in treatment work, where, the municipal wastewater is passed into screening of 2mm bar screen (Fig. 20). The large solid materials that are removed from the wastewater are then collected into separate collecting bin (Fig. 21).
5.4.2 Primary Treatment After pre-treatment, the wastewater is passed into primary sedimentation tank, where the particles are allowed to separate by sedimentation. The settled wastewater will contain dissolved substances are sent to a pumping station upstream the MBBR unit.
Fig . 19: Overview of Tällberg WWTP, simplified flow scheme.
Fig . 20: Screening step.
Fig . 21: Collection of floating material after screening.
14

Study on Process Performance and Evaluation of Two Municipal Wastewater Treatment Plants.
5.4.3 Biological (Secondary) Treatment As the wastewater enters into MBBR, dissolved organic substances present in wastewater are degraded by biofilms growing in K3 carriers. The MBBR reactor is closed reactor, inbuilt within the treatment plant building. In this process, air is supplied by blower through network of pipes installed at bottom of reactor, which works intermittently. In this treatment plant, two blowers are used for the aeration of MBBR. But only one blower runs at a time and the total runtime of both blowers are read as BM1 in the computer software: aquaview. The blowers of MBBR work at different frequency. The oxygen level controls the start and stop of blowers. The blower starts when the oxygen level is at pre-set start value (1.5 mg/lit) and then continues to work until it reached a target value. When the oxygen level reaches to its target value, the blower stops and is stopped until the oxygen value reaches to pre-set start value. The person working in the treatment plant following the previous working condition set this target value. When the load of wastewater coming into the plant is high, due to decrease in oxygen level in it, promote the frequency of blower to increase (Fig. 22 a, b). Thus the reactor has sufficient amount of oxygen for the process at all time. However, when the load is low, frequency of blower stops with no air supply to the tank, considering that oxygen is present within the reactor and has not consumed fully by bacteria. With the time, if oxygen is consumed, blower will start again supplying air into reactor. This operation mode gives the intermittent system and is carried out to enhance the energy saving. The dose of air is controlled automatically so that it is not lower than 1.5 mg/lit.
a) Sewage Flow into Tällberg WWTP in May month, 2015 (in m3/hr.).
Fig . 22: A graph showing a) sewage flow and b) oxygen level in Tällberg WWTP in May month, 2015.
b) Oxygen level at bioreactor, in May, 2015 (in mg/lit).
15

Anjali Amatya TRITA LWR Degree Project 2016:01
Fig. 23: 10m3 storage tank for Ekoflock 90.
5.4.4 Chemical Precipitation After biological treatment in MBBR, this treated wastewater is passing to chemical ingestion, precipitation and flocculation, where poly-aluminium chloride is added into it. The flocs are produced by this process as end product and can be seen floated on the surface of the secondary sedimentation tank (Fig. 25). Then this treated water is sent to secondary sedimentation step.
5.4.5 Secondary Sedimentation In this process, the flocs so produced by flocculation step are allowed to settle at the bottom of secondary sedimentation tank. Then the treated water is finally flowed out and disposed into recipient.
Table 6: Size of each treatment steps in Tällberg WWTP. Volume of Primary Sedimentation tank (m3) 130
Volume of MBBR reactor (m3) 190
Volume of flocculent tank (m3) 31
Volume of secondary sedimentation tank (m3) 400
5.4.6 Sludge handling The sludge so produced during the various treatment steps is pumped to sludge mixing tank. It is then pumped to two sludge storage tanks where it is thickened to approximately 3% TS. The dewatered sludge is then transported into Rättvik sewage treatment plant for digestion and final dewatering together with the sludge produced from this treatment plant. The flow of wastewater enters into the treatment plant, different types of chemical added and energy required during the treatment process and the sludge so produced in Tällberg WWTP in the period of five years (2010-2014) is shown in the Table 7.
Fig . 24: Secondary sedimentation tank.
Fig . 25: Flocs floating in the beginning of secondary sedimentation tank.
16

Study on Process Performance and Evaluation of Two Municipal Wastewater Treatment Plants.
Table 7: Flow to the plant, Sludge and Chemical added of Tällberg WWTP in five years’ time period.
Tällberg WWTP Chemicals added
Sludge (Total volume of sludge with
water content)
Year Flow (m3/yr.)
PAX XL 100 (Ton/yr.)
Ekoflock 90 (Ton/yr.)
Superfloc C-1596 (Ton/yr.) (m3/yr.)
2010 256 939 18 0 0.4 734 2011 216 901 15 0 0.24 978 2012 267 612 0 19 0.20 1 131 2013 149 930 0 12.7 0.16 1 068 2014 221 583 0 12.7 0.20 742
5.5 Energy consumption of past five years’ time period of both WWTP As the pumps and blowers of MBBR are frequency controlled which makes difficult to identify actual power consumption by it during the operation period. Therefore to calculate the energy consumption, installed rated power (kW) of each blower and pump and the operating time per year or month has to be known or make certain assumption to monitor the power for pumps or blowers with frequency converter. Besides the operating time of pump to MBBR and blower, the operating time of chemical addition and sludge pump are recorded from electricity meter. Since there is only one electricity meter for the whole plant, the energy consumption so calculated is for the entire plant. The energy consumption has been increased significantly after the biological purification step (i.e. MBBR) which was introduced in 2012 in Gagnef WWTP with continuous aeration. On the opposite, the energy consumption has been decreased significantly in Tällberg WWTP with intermittent aeration. Table 8: Rated power of blowers and pumps used for MBBR in Gagnef WWTP (in kW).
Gagnef WWTP Rated power (kW) Blower 22
Feeding pump to MBBR, 5.5
Table 9: Rated power of blowers and pumps used for MBBR in Tällberg WWTP (in kW).
Tällberg WWTP Rated power (kW) Blower 7.5
Feeding pump to MBBR, 4.9
Table 10: Energy consumption in five years’ time period of both WWTP (in kWh/yr.).
Gagnef WWTP Tällberg WWTP Year Energy Consumption (kWh/yr.) Energy Consumption (kWh/yr.) 2010 236 715 225 000 2011 231 136 183 000 2012 343 295 194 000 2013 349 574 178 000 2014 355197 182000
6. MATERIAL AND METHODS 6.1 Collection of regular data
The samples were collected on (6-15) May, 2015 for Tällberg WWTP and (18-22) May, 2015 for Gagnef WWTP. The location from where the samples were taken, are shown in the Table 11 and Fig. 26 a, b. The six samples were collected in the bottle from
17

Anjali Amatya TRITA LWR Degree Project 2016:01
sample stations 1, 2, 3 and 4 each day from both treatment plants. From six samples, four grab samples were collected from sampling stations 2 and 3, two in the morning and two in the afternoon. The remaining two samples were from sampling stations 1 and 4 (flow proportional of 24 hours) and collected in the morning. In addition to these samples, four additional grab samples were collected from each sample stations at both treatment plants, at the same morning time for one day only. Further, to study the variation of phosphorus, grab samples were collected on 17th, 18th of August from Gagnef WWTP and on 20th and 21st of August from Tällberg WWTP. Grab samples were taken every half an hour. The sampling locations were near to inlet and outlet of both treatment plants but different from previous sampling location (i.e. Point 1 and 2 of both treatment plants). The new sampling locations are shown in the Table 12 and Fig. 27 a, b.
Table 11: Sampling stations with its location, date and time in both WWTP.
Fig. 26: Location of sampling stations in both treatment plants.
Fig . 27: Location of sampling stations in both treatment plants (second session).
18
Study on Process Performance and Evaluation of Two Municipal Wastewater Treatment Plants.
19
c) NH4-N cuvettes.
b)TOC cuvettes. a) COD cuvettes.
Fig . 28: Hach Lange cuvettes used in a, b and c analysation methods.
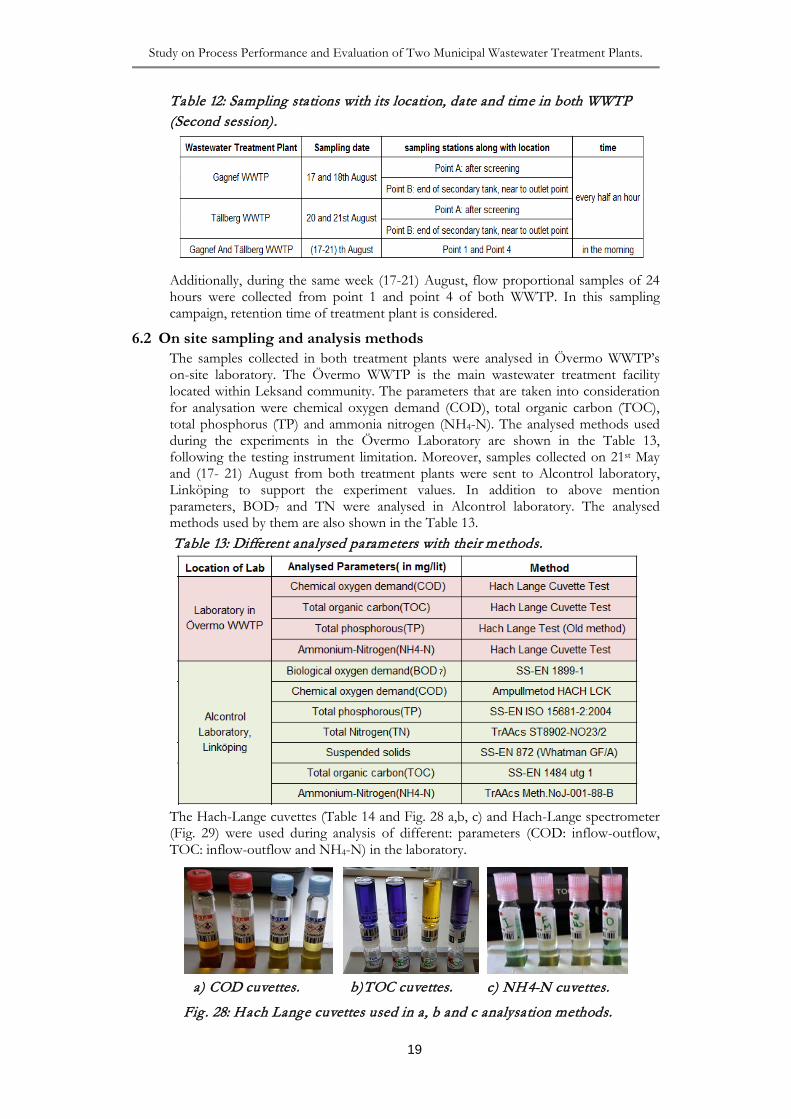
Table 12: Sampling stations with its location, date and time in both WWTP (Second session).
Additionally, during the same week (17-21) August, flow proportional samples of 24 hours were collected from point 1 and point 4 of both WWTP. In this sampling campaign, retention time of treatment plant is considered.
6.2 On site sampling and analysis methods The samples collected in both treatment plants were analysed in Övermo WWTP’s on-site laboratory. The Övermo WWTP is the main wastewater treatment facility located within Leksand community. The parameters that are taken into consideration for analysation were chemical oxygen demand (COD), total organic carbon (TOC), total phosphorus (TP) and ammonia nitrogen (NH4-N). The analysed methods used during the experiments in the Övermo Laboratory are shown in the Table 13, following the testing instrument limitation. Moreover, samples collected on 21st May and (17- 21) August from both treatment plants were sent to Alcontrol laboratory, Linköping to support the experiment values. In addition to above mention parameters, BOD7 and TN were analysed in Alcontrol laboratory. The analysed methods used by them are also shown in the Table 13. Table 13: Different analysed parameters with their methods.
The Hach-Lange cuvettes (Table 14 and Fig. 28 a,b, c) and Hach-Lange spectrometer (Fig. 29) were used during analysis of different: parameters (COD: inflow-outflow, TOC: inflow-outflow and NH4-N) in the laboratory.

Anjali Amatya TRITA LWR Degree Project 2016:01
For the analysis of TP, old Hach Lange method was used without using cuvettes (Fig. 30). Moreover, to the control of these parameters, onsite measurements were taken of the following parameters in both treatment plants (Table 15, Table 16, Table 17 and Table 18);
• Flow of wastewater entering into plant in m3/hr. and m3/day; • Oxygen level supply by blower to MBBR (in mg O2 /lit) • Temperature of wastewater (in ℃) • Dosage of chemical added into coagulation step (in g chemical agent/ m3)
Table 15: Onsite measurements in Gagnef WWTP in May, 2015. Date Time Flow
(m3/day) Flow
(m3/hr) Temp (℃) Chemicals
dose (ml/m3) O2 (mg/lit)
2015-05-18 9am 70 6 59 2.11
1.15pm 70 59 2.35
2015-05-19 6.15am 1502 45 6 131 2.48
12.45pm 82 59 1.78
2015-05-20 6.15am 1590 40 6 129 2.92
12.40pm 85 59 2.04
2015-05-21 6.20am 1418 34 6 135 3.27
11.50am 84 59 2.74
2015-05-22 6.45am 1374 37 6 143 2.7
10.35am 72 59 1.92
Table 16: Onsite measurement in Gagnef WWTP in August, 2015 (second session).
Date Time Flow (m3/day) Chemical dose (ml/m3) 2015-08-17 10am 1440 129 2015-08-18 10am 1493 128 2015-08-19 10am 1558 127 2015-08-20 7am 1462 127
Parameters Cuvettes
COD on influent LCK 514
COD on effluent LCK 314
TOC on influent LCK 386
TOC on effluent LCK 385
NH4-N LCK 303
Table 14: Hach Lange cuvettes.
Fig . 29: Hach Lange Spectrometer for COD, TOC and NH 4-N analysis method.
Fig . 30: Old Hach Lange method for TP with phosphorus reagent.
20

Study on Process Performance and Evaluation of Two Municipal Wastewater Treatment Plants.
Table 17: Onsite measurement in Tällberg WWTP in May, 2015. Date Time Flow
(m3/day) Flow
(m3/hr) Temp (℃) Chemical dose
(ml/m3) O2 (mg/lit)
2015-05-06 7.30am
694
6 37 1.7
2pm 86.7 1.85
2015-05-07 8am
1036 62.0
6 35 2.1
1.20pm 65.5 3.63
2015-05-08 7.30am
1014 76.0
6 35 1.77
12.15pm 79.0 1.63
2015-05-11 8am
891 41.7
6 32 1.65
12.45pm 38.9 1.59
2015-05-12 7.25am
828 65.0
6 31 3
1.45pm 86.0 1.56
2015-05-13 7.30am
870 42.0
6 31 2.9
11.32am 44.0 3.6
Table 18: Onsite measurement in Tällberg WWTP in August, 2015 (second session).
Date Time Flow (m3/day) Chemical dose (ml/m3) 2015-08-17 7 am 491 48 2015-08-18 7.30 am 421 48 2015-08-19 9.30 am 418 50 2015-08-20 8 am 402 45 2015-08-21 8 am 394 42
6.3 Importance of Hydraulic Retention time (HRT) in both treatment plants For all the analysis of four parameters (COD, TP, NH4-N and TOC), all the samples were collected at the same time both in the morning and in afternoon which is mentioned in the section 6.1. This represents that the concentration of sample collected at inlet point does not resemble the concentration of sample collected at outlet point of the same time of the same day. As the treatment facilities required certain time to undergo treatment process depending on its size and flow of incoming wastewater, hydraulic retention time of each treatment facilities would play an important role in measuring the average length of time that the concentration of these parameters remains in the different treatment facilities and release at the outlet point. The hydraulic retention time of each treatment facilities for both treatment plants is calculated by Eqn. 2 and shown in the Table 19 and Table 20.
( )( )
3
3
/
Volume of the tank m
Influent flowH
m rRT
h=
……………..Eqn. 2 Table 19: nominal HRT in hr of Gagnef WWTP.
2015-05-18 2015-05-19 2015-05-20 2015-05-21 2015-05-22
MBBR reactor 5.7 6.4 6.1 6.8 7.0
Flocculent Tank 0.8 0.9 0.9 1.0 1.0
Secondary Sedimentation Tank 7.9 8.8 8.3 9.3 9.6
Total nominal HRT(hr) 14 16 15 17 18
21

Anjali Amatya TRITA LWR Degree Project 2016:01
Table 20: nominal HRT in hr of Tällberg WWTP. 2015-05-06 2015-05-07 2015-05-08 2015-05-11 2015-05-12 2015-05-13
Primary sedimentation
tank 4.5 3.0 3.1 3.5 3.8 3.6
MBBR reactor 6.6 4.4 4.5 5.1 5.5 5.2
Flocculent Tank 1.1 0.7 0.7 0.8 0.9 0.9
Secondary Sedimentation
Tank 13.8 9.3 9.5 10.8 11.6 11.0
Total nominal HRT(hr) 26 17 18 20 22 21
6.4 Quality of treated wastewater, and downstream effects in the receiving water body.
If any organic matter is found in the effluent of treated wastewater, bacteria present naturally in receiving water bodies further consume these matters. This will reduce dissolved oxygen levels in water bodies, thus promoting negative effect to aquatic life. Therefore strict permissible discharge values regarding key pollutants are set by Naturvårdsverket (Swedish Environmental Protection Agency) for all wastewater treatment plants in Sweden in order to control its concentration at the outlet. The ruling consent values are, inter alia, related to the plant size, expressed as the design value expressed as population equivalent. For example both Tällberg and Gagnef treatment plants are not designed for Nitrogen control and the formal consent values are limited only to BOD and TP in the discharge. The analysis of TN has to be done to estimate how much nitrogen is discharged into recipient from the treatment plants, considering that the design population equivalent for both plants is less than 10,000 (Fig. 31), even though there is no limitation regulation for it.
7. RESULTS 7.1 Analysis result of Gagnef WWTP
The result of four parameters which were analysed in Övermo WWTP Laboratory and the result of other parameters that were analysed in Alcontrol Laboratory are shown in the Table 21 and Table 22 respectively. The samples analysed at Övermo Laboratory are all grab samples. The sample time is given in the Table 21. On the other hand, the samples analysed at Alcontrol Laboratory are all flow proportional, 24 hour mixed samples. As it is mentioned above that the samples collected from four sampling point were from the same time in each day and as grab samples. It is important to observe that the nominal hydraulic retention time at Gagnef WWTP is at average of 16 hours. Therefore, when addressing these results (Table 21), it is important to understand that the concentration of particular parameters in the treated wastewater of next day by large represent the concentration of that parameter in the raw wastewater of previous
Fig . 31: The rule showing which pollutant should be controlled with respect to population equivalent while discharging it into a water body.
22

Study on Process Performance and Evaluation of Two Municipal Wastewater Treatment Plants.
Table 21: Concentration of four parameters analysed at Övermo Laboratory of Gagnef WWTP (in mg/lit, May, 2015). Date: 2015-05- 18 18 19 19 20 20 21 21 22 22
Time: 9am 1.15pm 6.15am 12.45pm 6.15am 12.40pm 6.20am 11.50am 6.45am 10.35am
COD
Inlet 202 203 221 216
Upstream MBBR 276 230 228 199 207 206 225 158 211 217
Downstream MBBR 66.1 98 96 102 110 105 118 55.7 105 126
Outlet 59 62 63.3 56.6
TP
Inlet 3.03 1.98 3.49 3.06
Upstream MBBR 2.41 3.62 2.31 2.44 1.53 0.91 4.56 1.11 2.15 1.07
Downstream MBBR 1.70 1.53 0.88 0.75 0.72 0.62 1.34 0.98 1.21 0.52
Outlet 0.55 0.95 1.14 0.98
NH4-N
Inlet 38.8 38.7 44.1 33.9
Upstream MBBR 30 42.6 29.6 35 31.4 46.2 37.6 36.3 34.4 34.6
Downstream MBBR 27.8 32.3 37.1 28.4 30.2 31.6 33.8 33.2 35.9 33.6
Outlet 32.8 30.3 35.2 34.5
TOC
Inlet 64.7 63.6 51.8 55.5
Upstream MBBR 66.7 56.5 56.7 100 55.8 56.1 55.4 67.6 52.8 77.7
Downstream MBBR 25.5 27.2 38.8 37.7 36.6 32.6 37.8 38.7 39.3 38.6
Outlet 33.7 20.6 20 22.4
Note: Colour representation Inlet of 19th May and Outlet of 20th May: Inlet of 20th May and Outlet of 21st May: Inlet of 21st May and Outlet of 22nd May:
23
Anjali Amatya TRITA LWR Degree Project 2016:01
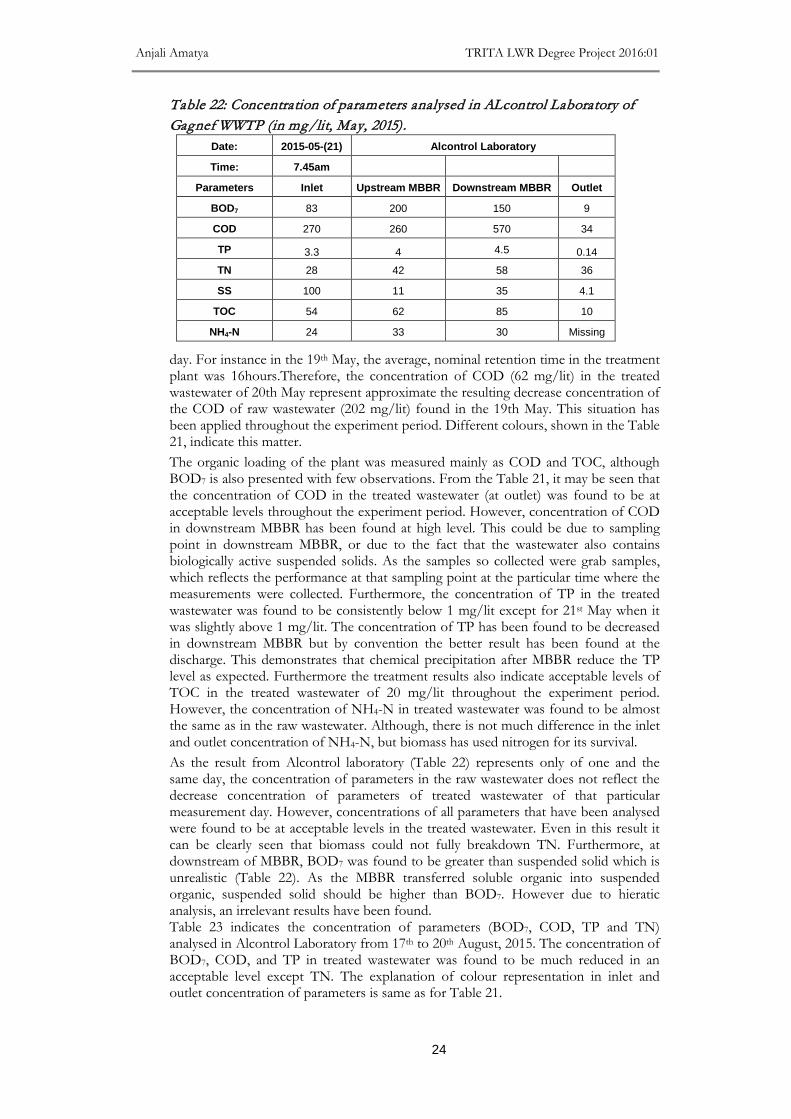
Table 22: Concentration of parameters analysed in ALcontrol Laboratory of Gagnef WWTP (in mg/lit, May, 2015).
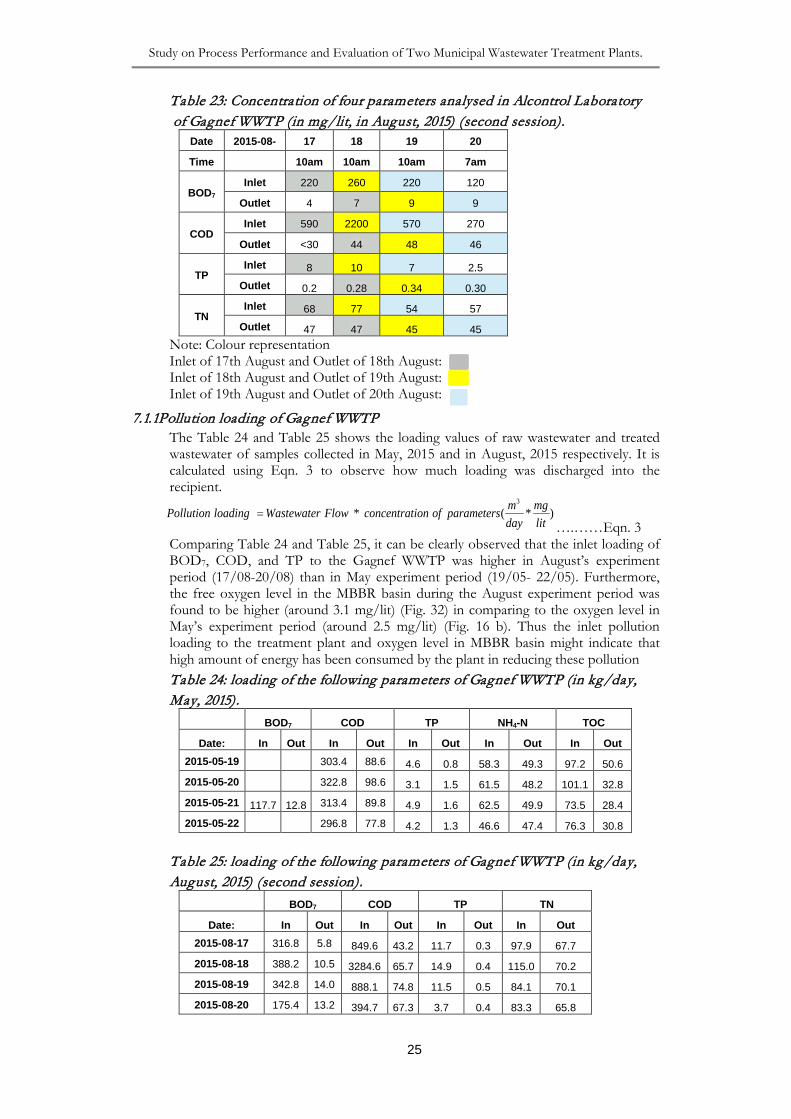
day. For instance in the 19th May, the average, nominal retention time in the treatment plant was 16hours.Therefore, the concentration of COD (62 mg/lit) in the treated wastewater of 20th May represent approximate the resulting decrease concentration of the COD of raw wastewater (202 mg/lit) found in the 19th May. This situation has been applied throughout the experiment period. Different colours, shown in the Table 21, indicate this matter. The organic loading of the plant was measured mainly as COD and TOC, although BOD7 is also presented with few observations. From the Table 21, it may be seen that the concentration of COD in the treated wastewater (at outlet) was found to be at acceptable levels throughout the experiment period. However, concentration of COD in downstream MBBR has been found at high level. This could be due to sampling point in downstream MBBR, or due to the fact that the wastewater also contains biologically active suspended solids. As the samples so collected were grab samples, which reflects the performance at that sampling point at the particular time where the measurements were collected. Furthermore, the concentration of TP in the treated wastewater was found to be consistently below 1 mg/lit except for 21st May when it was slightly above 1 mg/lit. The concentration of TP has been found to be decreased in downstream MBBR but by convention the better result has been found at the discharge. This demonstrates that chemical precipitation after MBBR reduce the TP level as expected. Furthermore the treatment results also indicate acceptable levels of TOC in the treated wastewater of 20 mg/lit throughout the experiment period. However, the concentration of NH4-N in treated wastewater was found to be almost the same as in the raw wastewater. Although, there is not much difference in the inlet and outlet concentration of NH4-N, but biomass has used nitrogen for its survival. As the result from Alcontrol laboratory (Table 22) represents only of one and the same day, the concentration of parameters in the raw wastewater does not reflect the decrease concentration of parameters of treated wastewater of that particular measurement day. However, concentrations of all parameters that have been analysed were found to be at acceptable levels in the treated wastewater. Even in this result it can be clearly seen that biomass could not fully breakdown TN. Furthermore, at downstream of MBBR, BOD7 was found to be greater than suspended solid which is unrealistic (Table 22). As the MBBR transferred soluble organic into suspended organic, suspended solid should be higher than BOD7. However due to hieratic analysis, an irrelevant results have been found. Table 23 indicates the concentration of parameters (BOD7, COD, TP and TN) analysed in Alcontrol Laboratory from 17th to 20th August, 2015. The concentration of BOD7, COD, and TP in treated wastewater was found to be much reduced in an acceptable level except TN. The explanation of colour representation in inlet and outlet concentration of parameters is same as for Table 21.
Date: 2015-05-(21) Alcontrol Laboratory
Time: 7.45am
Parameters Inlet Upstream MBBR Downstream MBBR Outlet
BOD7 83 200 150 9
COD 270 260 570 34
TP 3.3 4 4.5 0.14
TN 28 42 58 36
SS 100 11 35 4.1
TOC 54 62 85 10
NH4-N 24 33 30 Missing
24
Study on Process Performance and Evaluation of Two Municipal Wastewater Treatment Plants.
Table 23: Concentration of four parameters analysed in Alcontrol Laboratory of Gagnef WWTP (in mg/lit, in August, 2015) (second session).
Date 2015-08- 17 18 19 20
Time 10am 10am 10am 7am
BOD7 Inlet 220 260 220 120
Outlet 4 7 9 9
COD Inlet 590 2200 570 270
Outlet <30 44 48 46
TP Inlet 8 10 7 2.5
Outlet 0.2 0.28 0.34 0.30
TN Inlet 68 77 54 57
Outlet 47 47 45 45 Note: Colour representation Inlet of 17th August and Outlet of 18th August: Inlet of 18th August and Outlet of 19th August: Inlet of 19th August and Outlet of 20th August:
7.1.1 Pollution loading of Gagnef WWTP The Table 24 and Table 25 shows the loading values of raw wastewater and treated wastewater of samples collected in May, 2015 and in August, 2015 respectively. It is calculated using Eqn. 3 to observe how much loading was discharged into the recipient.
3
* ( * )m mgPollution loading Wastewater Flow concentration of parametersday lit
=….……Eqn. 3
Comparing Table 24 and Table 25, it can be clearly observed that the inlet loading of BOD7, COD, and TP to the Gagnef WWTP was higher in August’s experiment period (17/08-20/08) than in May experiment period (19/05- 22/05). Furthermore, the free oxygen level in the MBBR basin during the August experiment period was found to be higher (around 3.1 mg/lit) (Fig. 32) in comparing to the oxygen level in May’s experiment period (around 2.5 mg/lit) (Fig. 16 b). Thus the inlet pollution loading to the treatment plant and oxygen level in MBBR basin might indicate that high amount of energy has been consumed by the plant in reducing these pollution Table 24: loading of the following parameters of Gagnef WWTP (in kg/day, May, 2015).
BOD7 COD TP NH4-N TOC
Date: In Out In Out In Out In Out In Out 2015-05-19 303.4 88.6 4.6 0.8 58.3 49.3 97.2 50.6
2015-05-20 322.8 98.6 3.1 1.5 61.5 48.2 101.1 32.8
2015-05-21 117.7 12.8 313.4 89.8 4.9 1.6 62.5 49.9 73.5 28.4
2015-05-22 296.8 77.8 4.2 1.3 46.6 47.4 76.3 30.8 Table 25: loading of the following parameters of Gagnef WWTP (in kg/day, August, 2015) (second session).
BOD7 COD TP TN
Date: In Out In Out In Out In Out 2015-08-17 316.8 5.8 849.6 43.2 11.7 0.3 97.9 67.7
2015-08-18 388.2 10.5 3284.6 65.7 14.9 0.4 115.0 70.2
2015-08-19 342.8 14.0 888.1 74.8 11.5 0.5 84.1 70.1
2015-08-20 175.4 13.2 394.7 67.3 3.7 0.4 83.3 65.8
25
Anjali Amatya TRITA LWR Degree Project 2016:01
loading level. The discharge levels have been near to its consent value during August’s experiment period. However, the total monthly energy consumption recorded from the treatment plant was found to be 28277 kWh/month in May, 2015 which is higher than in the August month (26538 kWh/month). Therefore, the energy used by the blower supplying the MBBR with oxygen is calculated by the following method: Energy used for blower of MBBR = number of operating hour per day*0.9*installed power and results as follows for Gagnef WWTP: = 24 hrs * 0.9 * 5.5kW= 119 kWh/day It is assumed that 90% of installed power has been used by the blower for MBBR basin. It has been found that around 119 kWh/day energy per day has been used by the blower for MBBR during its operation.
Energy used by blower for MBBR basin per daySpecific energy required for pollutant load removalRemoval amount of pollutant per day
=….Eqn. 4
Table 26 shows the specific energy consumption by each pollutant load to remove its loading below its consent value in Gagnef WWTP’s outlet. It is calculated by using Eqn. 4. It indicates that higher energy was consumed by TP in reducing its load in comparison with other pollutants in both months. Moreover, the discharge levels of TP and BOD7 in the treated wastewater (Out) during both months (Table 24 and Table 25) were found to be much lower than the design (discharge) level for this treatment plant (Table 2). Table 26: Specific energy consumption by each pollutant load in Gagnef WWTP (in kWh/kg).
BOD7 COD TP
May, 2015 1.13 0.54 41.18
August, 2015 0.40 0.09 11.89
7.1.2 Removal efficiency of analysed parameters The removal efficiency of COD, TP, NH4-N and TOC in Gagnef WWTP, analysed during 18th to 22nd August, 2015 is shown in the Table 27. It is calculated by using Eqn. 5. The removal efficiency of each parameter is calculated considering hydraulic retention time (Table 19) which shows that the treatment plant with continuous aeration removes more than 50% of COD, TP and TOC except NH4-N.
% ( ) *100A BRemoval Efficiency inA−
= …..…….Eqn. 5
Where, A= concentration of parameter measured in the raw wastewater of a day B= concentration of parameter measured in the treated wastewater of next day
Fig . 32: Oxygen level at bioreactor, in Gagnef WWTP August month, 2015 (in mg/lit).
26

Study on Process Performance and Evaluation of Two Municipal Wastewater Treatment Plants.
Table 27: Removal Efficiency of COD, TP, NH 4-N and TOC of Gagnef WWTP (in %, May, 2015).
Table 28: Removal efficiency of BOD7, COD, TP and TN of Gagnef WWTP (in %, August, 2015).
Date: BOD7 COD TP TN
2015-08-17 97 93 97 31
2015-08-18 97 98 97 42
2015-08-19 96 92 96 17
Table 28 indicates the removal efficiency of parameters (BOD7, COD, TP and TN) analysed during 17th to 20th August, 2015. They are calculated same as above using Eqn. 5. It is very interesting to understand that removal efficiency of BOD7, COD and TP is higher than 95% except TN in comparing to Table 27. Although the inlet and outlet samples were collected from same sampling point 1 and 4 in both May and August, the flow proportional samples collected in the May did not consider 24 hours’ time duration, rather hydraulic retention time was consider during removal efficiency calculation. On the opposite, the flow proportional samples collected in August were collected almost exactly in 24 hours’ time differences. Further, the analysed method used in Övermo laboratory and Alcontrol laboratory were different to each other. Therefore, the different sampling and analysing method might the reason of this interesting result.
7.1.3 Variation of TP in Gagnef WWTP with respect to flow Fig. 33 and Fig. 34 show the variation of TP in raw wastewater and treated wastewater with respect to their flow, analysed during 17th and 18th August, 2015, respectively. It shows that the concentration of TP in raw wastewater was high around 9-10 am and then decreases during the daytime, which again increased slightly after 2 pm regardless their flow. The fluctuation of flow remained between 60 to 90 m3/hr throughout these days except in the morning hour with the low flow of 45 m3/hr. However, the
Date: COD TP NH4-N TOC 2015-05-18 - - - - 2015-05-19 69 69 22 68 2015-05-20 69 42 9 69 2015-05-21 74 72 22 57 2015-05-22 - - - -
Fig. 33: Variation of TP with respect to flow in 2015/08/17 (in mg/lit).
27

Anjali Amatya TRITA LWR Degree Project 2016:01
variation of TP in treated wastewater was found to be around 0.5 mg/lit or below it, which is quite different result than previous concentration of TP in treated wastewater (Table 21).
7.2 Analysis result of Tällberg WWTP The results of four parameters which were analysed in Övermo WWTP Laboratory and the result of other parameters that were analysed in Alcontrol Laboratory are shown in the Table 29 and Table 30 respectively. Similar to Gagnef WWTP, the samples analysed at Övermo Laboratory are all grab samples and the samples analysed at Alcontrol are all flow proportional, 24 hours mixed samples. The nominal hydraulic retention time for Tällberg WWTP was found to be at average of 20hrs (Table 20). Therefore when addressing these results (Table 29), it is important to understand that the concentration of particular parameters in the treated wastewater of next day by large represent the concentration of that parameter in the raw wastewater of previous day. For instance in the 6th May, the average, nominal retention time in the treatment plant 26 hours. Therefore, the concentration of COD (16 mg/lit) in the treated wastewater of 7th May represent approximate decrease concentration of the COD of raw wastewater (55.2 mg/lit) collected in the 6th May. This situation has been applied throughout the experiment period which is indicated by different colours, shown in the Table 29. From the Table 29, it may be seen that the concentration of COD in the treated wastewater (at outlet) was found to be in acceptable level throughout the experiment period. Additionally, the concentration of TP in the treated wastewater was found to be consistently below 1mg/lit except for 8th and 13th May when it was near to 2 mg/lit. The concentration of TP has been found to be decreased after MBBR, but by convention the better result has been found at the discharge. This demonstrates that chemical precipitation after MBBR reduce the TP level as expected. Furthermore the treatment results also indicate acceptable levels of TOC in the treated wastewater of 10 mg/l throughout the experiment period. However, the concentration of NH4-N in treated wastewater was found to be almost the same as in the raw wastewater, indicating that biomass has used certain concentration of nitrogen for its survival. The concentration of all parameters after MBBR has shown much unexpected result. The results were almost same in upstream and downstream MBBR. This could be due to sampling point after MBBR. The samples were collected from the bottom of outlet box of MBBR where sludge was accumulated. Even though the samples were collected after letting out enough sludge, the results from downstream MBBR still indicate high value.
Fig . 34: Variation of TP with respect to flow in 2015/08/18 (in mg/lit).
28
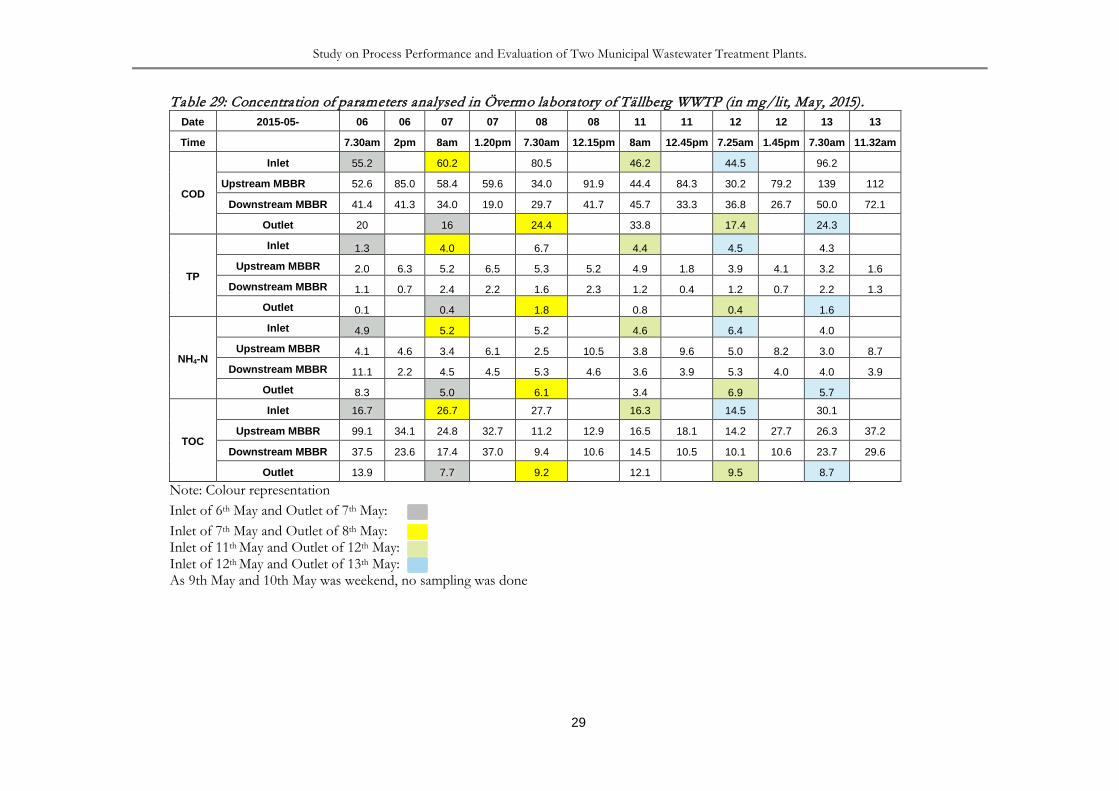
Study on Process Performance and Evaluation of Two Municipal Wastewater Treatment Plants.
Table 29: Concentration of parameters analysed in Övermo laboratory of Tällberg WWTP (in mg/lit, May, 2015). Date 2015-05- 06 06 07 07 08 08 11 11 12 12 13 13
Time 7.30am 2pm 8am 1.20pm 7.30am 12.15pm 8am 12.45pm 7.25am 1.45pm 7.30am 11.32am
COD
Inlet 55.2 60.2 80.5 46.2 44.5 96.2
Upstream MBBR 52.6 85.0 58.4 59.6 34.0 91.9 44.4 84.3 30.2 79.2 139 112
Downstream MBBR 41.4 41.3 34.0 19.0 29.7 41.7 45.7 33.3 36.8 26.7 50.0 72.1
Outlet 20 16 24.4 33.8 17.4 24.3
TP
Inlet 1.3 4.0 6.7 4.4 4.5 4.3
Upstream MBBR 2.0 6.3 5.2 6.5 5.3 5.2 4.9 1.8 3.9 4.1 3.2 1.6
Downstream MBBR 1.1 0.7 2.4 2.2 1.6 2.3 1.2 0.4 1.2 0.7 2.2 1.3
Outlet 0.1 0.4 1.8 0.8 0.4 1.6
NH4-N
Inlet 4.9 5.2 5.2 4.6 6.4 4.0
Upstream MBBR 4.1 4.6 3.4 6.1 2.5 10.5 3.8 9.6 5.0 8.2 3.0 8.7
Downstream MBBR 11.1 2.2 4.5 4.5 5.3 4.6 3.6 3.9 5.3 4.0 4.0 3.9
Outlet 8.3 5.0 6.1 3.4 6.9 5.7
TOC
Inlet 16.7 26.7 27.7 16.3 14.5 30.1
Upstream MBBR 99.1 34.1 24.8 32.7 11.2 12.9 16.5 18.1 14.2 27.7 26.3 37.2
Downstream MBBR 37.5 23.6 17.4 37.0 9.4 10.6 14.5 10.5 10.1 10.6 23.7 29.6
Outlet 13.9 7.7 9.2 12.1 9.5 8.7
Note: Colour representation Inlet of 6th May and Outlet of 7th May: Inlet of 7th May and Outlet of 8th May: Inlet of 11th May and Outlet of 12th May: Inlet of 12th May and Outlet of 13th May: As 9th May and 10th May was weekend, no sampling was done
29

Anjali Amatya TRITA LWR Degree Project 2016:01
Table 30: Concentration of parameters analysed at ALcontrol Laboratory of Tällberg WWTP (in mg/lit, May month).
Table 31: Concentration of parameters analysed in Alcontrol Laboratory of Tällberg WWTP (in mg/lit, during August, 2015) (second session).
Date 2015-08- 17 18 19 20 21
Time 8am 7.30am 9.30am 8am 8am
BOD7 Inlet 67 58 80 46 46
Outlet 14 10 12 16 7
COD Inlet 280 180 280 100 120
Outlet 61 65 45 67 54
TP Inlet 3 2.8 3 2 2.5
Outlet 1 0.87 0.44 0.73 0.54
TN Inlet 20 20 24 18 21
Outlet 21 23 18 19 19
Note: Colour representation Inlet of 17th August and Outlet of 18th August: Inlet of 18th August and Outlet of 19th August: Inlet of 19th August and Outlet of 20th August: Inlet of 19th August and Outlet of 20th August: As the result so obtained from Alcontrol laboratory (Table 30) represents only of one and the same day, the concentration of parameters in the raw wastewater does not reflect the decrease concentration of parameters of treated wastewater of that particular measurement day. However, concentrations of all parameters that have been analysed at outlet were found to be at acceptable levels. Furthermore, at downstream of MBBR, BOD7 was found to be greater than suspended solid which is unrealistic (Table 30). As the MBBR transferred soluble organic into suspended organic, suspended solid should be higher than BOD7. However due to hieratic analysis, an irrelevant results have been found. Table 31 indicates the concentration of parameters (BOD7, COD, TP and TN) analysed in Alcontrol laboratory from 17th to 21st August, 2015. The concentration of BOD7, COD, and TP in treated wastewater was found to be much reduced level except TN. The explanation of colour representation in inlet and outlet concentration of parameters is same as for Table 21.
7.2.1 Pollution loading of Tällberg WWTP The Table 32 and Table 33 shows the loading values of raw wastewater and treated wastewater of samples collected in May, 2015 and in August, 2015 respectively. It is calculated using above Eqn. 3 to observe how much loading was discharged into the recipient.
Date: 2015-05-(21) Alcontrol Laboratory
Time: 7.45am
Parameters Inlet Upstream MBBR Downstream MBBR Outlet
BOD7 27 19 440 6
COD 71 67 2000 34
TP 2.7 0.91 25 0.28
TN 7.7 9.3 60 8
SS 37 17 130 14
TOC 22 16 340 9.5
NH4-N 4.3 5.4 4.6 7.1
30
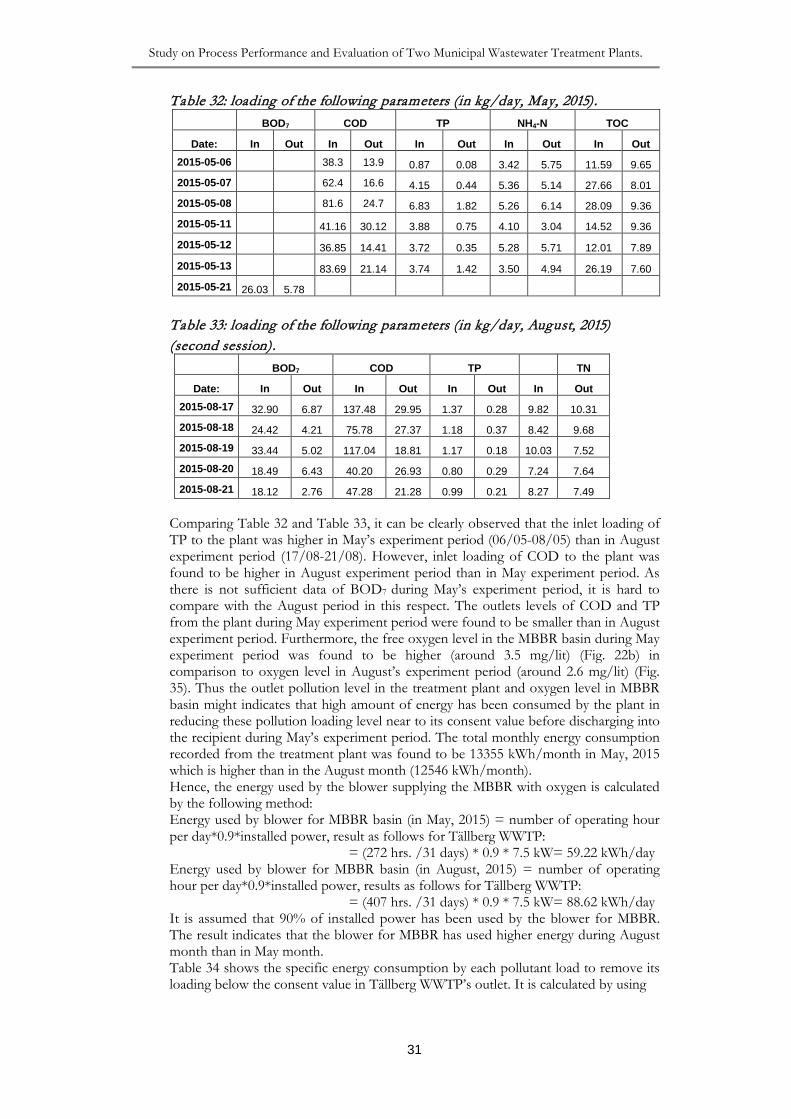
Study on Process Performance and Evaluation of Two Municipal Wastewater Treatment Plants.
Table 32: loading of the following parameters (in kg/day, May, 2015). BOD7 COD TP NH4-N TOC
Date: In Out In Out In Out In Out In Out 2015-05-06 38.3 13.9 0.87 0.08 3.42 5.75 11.59 9.65
2015-05-07 62.4 16.6 4.15 0.44 5.36 5.14 27.66 8.01
2015-05-08 81.6 24.7 6.83 1.82 5.26 6.14 28.09 9.36
2015-05-11 41.16 30.12 3.88 0.75 4.10 3.04 14.52 9.36
2015-05-12 36.85 14.41 3.72 0.35 5.28 5.71 12.01 7.89
2015-05-13 83.69 21.14 3.74 1.42 3.50 4.94 26.19 7.60
2015-05-21 26.03 5.78 Table 33: loading of the following parameters (in kg/day, August, 2015) (second session).
BOD7 COD TP TN
Date: In Out In Out In Out In Out 2015-08-17 32.90 6.87 137.48 29.95 1.37 0.28 9.82 10.31
2015-08-18 24.42 4.21 75.78 27.37 1.18 0.37 8.42 9.68
2015-08-19 33.44 5.02 117.04 18.81 1.17 0.18 10.03 7.52
2015-08-20 18.49 6.43 40.20 26.93 0.80 0.29 7.24 7.64
2015-08-21 18.12 2.76 47.28 21.28 0.99 0.21 8.27 7.49 Comparing Table 32 and Table 33, it can be clearly observed that the inlet loading of TP to the plant was higher in May’s experiment period (06/05-08/05) than in August experiment period (17/08-21/08). However, inlet loading of COD to the plant was found to be higher in August experiment period than in May experiment period. As there is not sufficient data of BOD7 during May’s experiment period, it is hard to compare with the August period in this respect. The outlets levels of COD and TP from the plant during May experiment period were found to be smaller than in August experiment period. Furthermore, the free oxygen level in the MBBR basin during May experiment period was found to be higher (around 3.5 mg/lit) (Fig. 22b) in comparison to oxygen level in August’s experiment period (around 2.6 mg/lit) (Fig. 35). Thus the outlet pollution level in the treatment plant and oxygen level in MBBR basin might indicates that high amount of energy has been consumed by the plant in reducing these pollution loading level near to its consent value before discharging into the recipient during May’s experiment period. The total monthly energy consumption recorded from the treatment plant was found to be 13355 kWh/month in May, 2015 which is higher than in the August month (12546 kWh/month). Hence, the energy used by the blower supplying the MBBR with oxygen is calculated by the following method: Energy used by blower for MBBR basin (in May, 2015) = number of operating hour per day*0.9*installed power, result as follows for Tällberg WWTP: = (272 hrs. /31 days) * 0.9 * 7.5 kW= 59.22 kWh/day Energy used by blower for MBBR basin (in August, 2015) = number of operating hour per day*0.9*installed power, results as follows for Tällberg WWTP: = (407 hrs. /31 days) * 0.9 * 7.5 kW= 88.62 kWh/day It is assumed that 90% of installed power has been used by the blower for MBBR. The result indicates that the blower for MBBR has used higher energy during August month than in May month. Table 34 shows the specific energy consumption by each pollutant load to remove its loading below the consent value in Tällberg WWTP’s outlet. It is calculated by using
31

Anjali Amatya TRITA LWR Degree Project 2016:01
Table 34: Specific energy consumption by each pollutant load in Tällberg WWTP (in kWh/kg).
BOD7 COD TP
May, 2015 2.92 1.46 15.85
August, 2015 4.34 1.51 106.09 above Eqn. 4. It indicates that higher energy was consumed by TP in reducing its load in comparison with other pollutants in both months. Moreover, it has been observed that the discharge levels of TP and BOD in the treated wastewater during both months (Table 32 and Table 33) were found to be much lower than the design (discharge) load for this treatment plant (Table 5).
7.2.2 Removal efficiency of analysed parameters The removal efficiency of COD, TP, NH4-N and TOC of Tällberg WWTP, analysed during 6th to 12th May, 2015 is shown in the Table 35. It is calculated by using above Eqn. 5. The removal efficiency of each parameter is calculated considering hydraulic retention time (Table 20) which shows that the treatment plant with intermittent aeration removes more than 60% of COD, TP and TOC except NH4-N which shows negative removal efficiency. This negative figure might be due to time lapse between inlet and outlet point and might be due to conversion of substantial organic nitrogen to ammonia nitrogen by hydrolysis. Table 36 indicates the removal efficiency of parameters (BOD7, COD, TP and TN), analysed during 17th to 20th August, 2015. They are calculated same as above using Table 35: Removal Efficiency of COD, TP, NH 4-N and TOC in % of Tällberg WWTP (May, 2015).
Table 36: Removal efficiency of BOD7, COD, TP and TN in % of Tällberg WWTP (August, 2015) (second session).
Date: BOD7 COD TP TN
2015-08-17 85 77 69 – 15
2015-08-18 79 75 84 10
2015-08-19 80 76 74 21
2015-08-20 85 46 73 – 6
Date: COD TP NH4-N TOC 2015-05-06 71 66 – 1 54
2015-05-07 59 55 – 17 65
2015-05-11 62 90 – 50 42
2015-05-12 45 64 11 40
Fig. 35: Oxygen level at bioreactor, in Tällberg WWTP in August month, 2015.
32

Study on Process Performance and Evaluation of Two Municipal Wastewater Treatment Plants.
Eqn. 5. It is very interesting to understand that removal efficiency of BOD7, COD and TP is higher than 70% except TN indicating negative efficiency. Although the inlet and outlet samples were collected from same sampling point 1 and 4 in both May and August, the flow proportional samples collected in the May did not consider 24 hours’ time duration, rather hydraulic retention time was consider during removal efficiency calculation. On the contrast, the flow proportional samples collected in August were collected almost exactly in 24 hours’ time differences. Further, the analysed methods used in Övermo and Alcontrol laboratories were different to each other. Therefore, the different sampling and analysing method might the reason of this interesting result.
7.2.3 Variation of TP in Tällberg WWTP with respect to flow Fig. 36 and Fig. 37 show the variation of TP in raw wastewater and treated wastewater with respect to their flow, analysed during 20th and 21st August, 2015, respectively. It shows that the concentration of TP in raw wastewater is high in the morning 8-10 am and then decrease during the day time, which again increased slightly after 2pm regardless their flow in 20th of August. However, the concentration of TP in raw wastewater remains high above 2 mg/lit throughout the day on 21th of August. During August, tourism increases in Tällberg for their summer holidays which make concentration of TP different in each and every day. As 21st of August was on Friday and all the hotels in Tällberg were fully booked, this might be the reason of high concentration of TP on that day. However, the fluctuation of flow remained between 20 to 55 m3/hr throughout these days. On the opposite, the variation of TP in treated wastewater was found to be around 0.5 mg/lit or below it, which is quite different result than previous concentration of TP in treated wastewater (Table 29).
Fig . 36: Variation of TP with respect to flow in 2015/08/20 (in mg/lit).
Fig . 37: Variation of TP with respect to flow in 2015/08/21 (in mg/lit).
33

Anjali Amatya TRITA LWR Degree Project 2016:01
7.3 Chemical dose consumption of both WWTP The chemical dose (Ekoflock 90) added for flocculation in Gagnef WWTP during May and August was around (50-145) ml/m3. It is clearly noted that the high amount of chemical was added in this treatment plant in both months, regardless the temperature changes. By contrast to Tällberg WWTP, the addition of chemical dose was around (30-50) ml/m3 during May and August month. During the summer month where the tourism increases sharply in Tällberg, dose of chemical has been increased to control the phosphorous loading in the plant. However, if the comparison of both plants is made in chemical dose amount, large amount of chemical is added in continues aerated MBBR treatment plant. But there is no evidence to prove that amount of chemical dose is linked to oxygen supply to the plant.
7.4 Sludge production of both WWTP Table 37 and Table 38 show the sludge production along with solids amount in May and August month from Gagnef WWTP and Tällberg WWTP respectively. Table 37: Sludge production of Gagnef WWTP.
Month Sludge Production (m3/month) Total solids (Ton/month) May, 2015 790 0.18*790=142
August, 2015 913 0.18*923=166
Table 38: Sludge production of Tällberg WWTP. Month Sludge Production (m3/month) Total solids (Ton/month)
May, 2015 48 0.03*48=1.44
August, 2015 96 0.03*96=2.88
The sludge so produced during August month from both WWTP has found to be higher than in May month. However, comparing the sludge production from Gagnef WWTP, it is 10 times higher than the sludge production from Tällberg WWTP.
8. DISCUSSION AND RECOMMENDATION The Gagnef WWTP and Tällberg WWTP are currently running with a very low inlet loads in comparison with the design load i.e. both in flows and the major related loads. The concentration of organic loads (COD and TOC,) (Table 21 and Table 29) and loading value of BOD7 and TP in the treated wastewater of both treatment plants show far better result than the ruling consent levels. The dose of poly-aluminium chloride has been at sufficiently high to remove total phosphorous thanks to adequate coagulation and flocculation in both treatment plants. Comparing the energy used by the blower for MBBR facility in both treatment plants, Table 39: Energy used by the blower for MBBR facility in both treatment plants (in kWh/day).
Month Energy used by the blower for MBBR facility (kWh/day)
Gagnef WWTP May, 2015 119 August, 2015 119
Tällberg WWTP May, 2015 59.2 August, 2015 88.62
Table 40: Specific Energy consumption by each pollutant load in both treatment plants (in kWh/kg).
BOD7 COD TP Gagnef WWTP May, 2015 1.13 0.54 41.18
August, 2015 0.40 0.09 11.89 Tällberg WWTP May, 2015 2.92 1.46 15.85
August, 2015 4.34 1.51 106.09
34

Study on Process Performance and Evaluation of Two Municipal Wastewater Treatment Plants.
the blower for MBBR facility in Gagnef WWTP have consumed higher energy than in Tällberg WWTP (Table 39). This shows that the performance of the intermittent aeration in Tällberg WWTP has been better in terms of energy utilization by blower than in the continuous aeration at Gagnef WWTP Furthermore, comparing the specific energy consumption by each pollutant load of both treatment plants, Tällberg WWTP has shown higher specific energy consumption in removing each pollutant load than Gagnef WWTP (Table 40). It indicates that the intermittent operation in Tällberg WWTP does not result in improved specific energy efficiency. Even though, the incoming pollutant loads in Tällberg WWTP is also much lower than the design load, the low loaded MBBR with intermittent strategy has not shown the better specific energy efficiency. Moreover, in order to improve the removal efficiency of organic matter (COD and BOD7) and TP, oxygen is supplied continuously to MBBR basin causing more consumption of energy in Gagnef WWTP. On the contrast, Tällberg WWTP has achieved similar high removal efficiency of organic matter and TP but with limited supplied of oxygen that eventually saved the energy of the plant. In general it is the fact that due to less operation time of aeration, the intermittent aeration will save energy in comparison with continuous aeration in the plant. However, it is also important to understand that how the biological process is affected during its operation along with its energy consumption as it is entirely dependent on the design of the plant, its incoming load and flow into the plant affecting the biomass growth, sludge maintenance and nutrient removal (Berg, 2014). Regardless the design load of both plants, if comparison is made between incoming loading of all parameters in both plants, Gagnef WWTP (Table 24 and Table 25) has very high incoming loads compared with Tällberg WWTP (Table 32 and Table 33). To control such high incoming load, the Gagnef WWTP has used high chemical and electrical energy. As a consequences, the wasted out product i.e. sludge production in this plant is really high (10 times) compared to Tällberg treatment plant. As it is stated above that both treatment plants shows far better effluent results lower than consent values, however comparing effluent loading of both plants, Tällberg WWTP has much lowered effluent loading of all analysed parameter (Table 32 and Table 33) than Gagnef WWTP (Table 24 and Table 25). Additionally, from the recorded runtime for intermittent aerated blower available from the treatment plant, it has been notified that an average of 8 hours running time per day is required during May month (Appendix III) and 13 hours running time per day in August month (Appendix IV) in comparison with 24 hours/day runtime for the blower in Gagnef WWTP (Appendix I and II). This indicates that saving energy by means of the intermittent aeration method would the best option for both treatment plants. Therefore, to limit the aeration utilization of Gagnef WWTP, a modification of plant to intermittent aerated system would be effective in lowering energy consumption. However, it is difficult to conclude how an operating intermittent scheme would be best suited at Gagnef WWTP. There was no major difference in adding flocculent dose at Tällberg WWTP, when the data for May and August month are compared. However, in Gagnef WWTP, there was a noticeable variation in adding the flocculent for TP removal to safety reach consent value (0.5mg/lit). The modification of continuous aeration to intermittent aeration might be the solution in reducing this chemical dose to the Gagnef WWTP. From the variation of TP graph (Fig. 36 and Fig. 37) in Tällberg WWTP, it can be concluded that the incoming loading to the plant per day is very uncertain due to tourism peak time. If the tourism increases every year in Tällberg municipality in future, prediction of incoming load would be difficult. Therefore, deeper research should be conduct with other parameters to understand how these fluctuating loading might affect the treatment plant performance to maintain its sustainability while reducing its operating cost at the same time. During the experiment period, it has been observed that the floc was floating in secondary clarifier in both treatment plants. Even from the previous experimental
35

Anjali Amatya TRITA LWR Degree Project 2016:01
studies, it has shown the problem of MBBR is the struggle of floc separation in secondary sedimentation (Liao et al., 2003). The coagulant so added during chemical precipitation process couldn’t maintain enough to increase the size of floc, which creates difficulty in settling of floc. The alternative for this problem is the installation of filtration process with the proper media and filter bed configuration after chemical precipitation instead of secondary clarifier. There were many uncertainties arise during sampling, handling of samples and analysing steps. The grab sampling method was studied for the first time in both treatment plants. So the sampler must choose sampling point very wisely in order to understand how each treatment facilities are functioning in reducing the incoming load to the plant. The handling of samples in the laboratory also plays the vital role in affecting the analysing outcome. During the analysing period in Övermo Laboratory, due to limitation of Hach Lange cuvettes, the samples that were collected from the both plants, were need to save in freezer for some days until the required facilities arrived in the Laboratory. Furthermore, the samples that were collected for Alcontrol Laboratory were save in the freezer box in the treatment plant until they were transported to Linköping for analysis. These samples might have changed their character during their waiting period which will definitely affect the analysed outcome. It is also unknown how the analyser in the Alcontrol laboratory handled these samples. Moreover, there were instruments limitation and instruction which the analyser has to follow. So it is difficult to understand whether the final analysed result represent true value or not.
9. CONCLUSION This thesis has examined the process performance at two of Dala Vatten’s treatment plants: Gagnef WWTP and Tällberg WWTP. The two plants run under the continuous and intermittent aerated mode of the MBBR steps, respectively. The outcome of operation from both treatment plants has shown satisfying results with a sustained biological performance with respect to organic matter (BOD7 and COD) and also with regard to TP removal. Nevertheless, the continuously aerated Gagnef WWTP demonstrated an excessive use of chemical and sludge production as well as a high-energy consumption during the studied periods (May, 2015 and August, 2015). By contrast, the low loaded MBBR facility at Tällberg WWTP operated with an intermittent aeration has proved to be successful in terms of lower energy consumption by the blower serving the MBBR. However, it failed to show improved specific energy efficiency for each pollutant load. Therefore it is recommended more online measurements to further improve the energy savings. In addition to, in order to further save operation costs at both treatment plants some observations would be addressed:
• For the Gagnef WWTP it is recommended to investigate whether it could be operated with an alternative, intermittent aeration mode;
• For the Tällberg WWTP some additional research may be useful to understand the how the low incoming load or no load during night hours would influence further improvement of the treatment plant
36

Study on Process Performance and Evaluation of Two Municipal Wastewater Treatment Plants.
REFERENCE Berg, J. (2014). Reduced energy consumption and improved treatment
using intermittent aeration at the Ja-Ela/Ekala wastewater treatment plant in Sri Lanka. Uppsala University.
Broch-Due, A., Andersen, R., Kristoffersen, O. (1994). Pilot Plant Experience with an Aerobic Moving Bed Biofilm Reactor for Treatment of NSSC Wastewater. Water Science and Technology, 29(5-6), 283-294.
Chaudhry, M. A. S., Beg, S. A. (1998). A review on the mathematical modeling of biofilm processes: advances in fundamentals of biofilm modeling. Chemical engineering and technology, 21(9), 701-710.
Dala Vatten och Avfall AB. (2014a). Miljörapport 2014: Avloppsreningsverket Gagnef: Gagnefs Teknik AB.
Dala Vatten och Avfall AB. (2014b). Miljörapport 2014: Avloppsreningsverket Tällberg: Leksand Teknik AB.
Hu, H. Y., Fujie, K., Ikeda, Y., Urano, K., Yushina, Y. (1994). Oxygen Uptake Characteristics of Microbial Film for Aerobic Wastewater Treatments. Journal of chemical engineering of Japan, 27(5), 585-589.
Karlsson, C., Tovar, C. Energy optimisation of Sjölunda wastewater treatment plant: Lund Institution of Technology,.
Liao, Z., Rasmussen, V., Ødegaard, H. (2003). A high-rate secondary treatment based on a moving bed bioreactor and multimedia filters for small wastewater treatment plants. Journal of Environmental Science and Health, Part A, 38(10), 2349-2358.
Lustig, G. (2012). Moving bed biofilm reactors (MBBR) i Sverige. Dimensionering och funktion. Lunds Tekniska Högskola.
Maurer, M., Fux, M., Graff, H., Siegrist, H. (2001). Moving-Bed Biological Treatment (MBBT) of Municipal Wastewater: Denitrification. Water Science and Technology, 43(11), 337-344.
McQuarrie, J. P., Boltz, J. P. (2011). Moving bed biofilm reactor technology: process applications, design, and performance. Water Environment Research, 83(6), 560-575.
Naturvårdsverket. (2006). Rening av avloppsvatten i Sverige – 2006. Ødegaard, H. (1999). The moving bed biofim reactor. Water
Environmental Engineering and Reuse of Water, (250-305), 12. Ødegaard, H. (2000). Advanced compact wastewater treatment based on
coagulation and moving bed biofilm processes. Water Science and Technology, 42(12), 33-48.
Ødegaard, H. (2006). Innovations in wastewater treatment: –the moving bed biofilm process. Water Science and Technology, 53(9), 17.
Ødegaard, H. (2014). Compact wastewater treatment with MBBR. Paper presented at the DSD International Conference, Hong Kong.
Ødegaard, H., Gisvold, B., Strickland, J. (2000). The influence of carrier size and shape in the moving bed biofilm process. Water Science and Technology, 41(4-5), 383-391.
Ødegaard, H., Rusten, B., Westrum, T. (1994). A new moving bed biofilm reactor- applications and results. Water Science and Technology, 29(10-11), 157-165.
Owen, W. F. (1982). Energy in Wastewater treatment. Prentice Hall, New Jersey.
37

Anjali Amatya TRITA LWR Degree Project 2016:01
Punmia, B. C., Jain, A. (2003). Wastewater Engineering: Laxmi Publications (P) LTD.
Soni, S. K. (2013). Environmental Engineering-II: S.K. Kataria and Sons. Westerling, K. (2014). Biological treatment 101: suspended growth vs.
attached growth. Retrieved 22 July, 2015, from http://www.wateronline.com/doc/biological-treatment-suspended-growth-vs-attached-growth-0001
38

Study on Process Performance and Evaluation of Two Municipal Wastewater Treatment Plants.
APPENDIX I: RUNTIME OF BLOWER AND PUMPS IN GAGNEF WWTP IN MAY, 2015
Bodarnas ARV
Bodarnas ARV
Bodarnas ARV
Bodarnas ARV
Bodarnas ARV
Bodarnas ARVBodarnas ARV
Bodarnas ARV
Driftstid BM1 h
Driftstid DP1 h
Driftstid UP1 h
Driftstid UP2 h
Driftstid UP3 h
Driftstid SK1 hDriftstid SP1 h
Driftstid SP2 h
2015-05-01 24:00:00 2015-05-01 24:00:00 2015-05-01 24:00:00 01:23 01:03 2015-05-01 08:37 06:28 00:00
2015-05-02 24:00:00 2015-05-02 24:00:00 2015-05-02 24:00:00 02:08 01:05 2015-05-02 06:44 06:26 00:00
2015-05-03 24:01:00 2015-05-03 24:01:00 2015-05-03 24:01:00 00:00 00:00 2015-05-03 06:45 06:18 00:00
2015-05-04 24:00:00 2015-05-04 24:00:00 2015-05-04 24:00:00 03:56 02:55 2015-05-04 08:49 06:18 09:01
2015-05-05 24:01:00 2015-05-05 24:01:00 2015-05-05 24:01:00 00:07 00:00 2015-05-05 06:54 06:18 08:32
2015-05-06 24:00:00 2015-05-06 24:00:00 2015-05-06 24:00:00 08:21 05:08 2015-05-06 06:42 06:21 06:43
2015-05-07 24:00:00 2015-05-07 24:00:00 2015-05-07 24:00:00 07:26 01:51 2015-05-07 08:20 06:30 08:26
2015-05-08 24:00:00 2015-05-08 24:00:00 2015-05-08 24:00:00 14:55 05:00 2015-05-08 07:17 06:20 06:30
2015-05-09 24:00:00 2015-05-09 24:00:00 2015-05-09 24:00:00 23:36 08:58 2015-05-09 06:44 06:18 00:00
2015-05-10 24:00:00 2015-05-10 24:00:00 2015-05-10 24:00:00 23:24 09:03 2015-05-10 07:55 06:18 00:00
2015-05-11 24:00:00 2015-05-11 24:00:00 2015-05-11 24:00:00 09:19 02:11 2015-05-11 08:00 06:18 08:47
2015-05-12 24:05:00 2015-05-12 24:05:00 2015-05-12 24:05:00 01:35 00:24 2015-05-12 06:49 06:31 08:45
2015-05-13 23:55 2015-05-13 23:55 2015-05-13 23:55 00:00 00:00 2015-05-13 07:07 06:22 05:30
2015-05-14 24:00:00 2015-05-14 24:00:00 2015-05-14 24:00:00 00:22 00:00 2015-05-14 08:44 06:18 01:17
2015-05-15 24:00:00 2015-05-15 24:00:00 2015-05-15 24:00:00 00:18 00:00 2015-05-15 06:47 06:18 06:01
2015-05-16 24:00:00 2015-05-16 24:00:00 2015-05-16 24:00:00 00:00 00:00 2015-05-16 06:48 06:18 00:00
2015-05-17 24:00:00 2015-05-17 24:00:00 2015-05-17 24:00:00 11:52 03:55 2015-05-17 08:36 06:19 00:00
2015-05-18 24:00:00 2015-05-18 24:00:00 2015-05-18 24:00:00 00:36 00:00 2015-05-18 07:13 06:30 08:15
2015-05-19 24:00:00 2015-05-19 24:00:00 2015-05-19 24:00:00 02:19 00:28 2015-05-19 06:48 06:22 08:19
2015-05-20 24:00:00 2015-05-20 24:00:00 2015-05-20 24:00:00 00:00 00:00 2015-05-20 07:54 06:18 08:16
2015-05-21 24:00:00 2015-05-21 24:00:00 2015-05-21 24:00:00 00:00 00:00 2015-05-21 07:55 06:18 07:21
2015-05-22 24:00:00 2015-05-22 24:00:00 2015-05-22 24:00:00 00:00 00:00 2015-05-22 06:47 06:18 06:13
2015-05-23 24:00:00 2015-05-23 24:00:00 2015-05-23 24:00:00 09:20 03:23 2015-05-23 07:15 06:24 00:00
2015-05-24 24:00:00 2015-05-24 24:00:00 2015-05-24 24:00:00 10:43 02:02 2015-05-24 08:35 06:29 00:00
2015-05-25 24:00:00 2015-05-25 24:00:00 2015-05-25 24:00:00 14:46 04:24 2015-05-25 06:48 06:18 08:38
2015-05-26 24:00:00 2015-05-26 24:00:00 2015-05-26 24:00:00 15:44 07:52 2015-05-26 06:46 06:18 07:56
2015-05-27 24:00:00 2015-05-27 24:00:00 2015-05-27 24:00:00 22:49 05:15 2015-05-27 08:45 06:18 08:32
2015-05-28 24:00:00 2015-05-28 24:00:00 2015-05-28 24:00:00 20:21 05:42 2015-05-28 07:06 06:18 08:33
2015-05-29 24:00:00 2015-05-29 24:00:00 2015-05-29 24:00:00 20:00 09:10 2015-05-29 06:48 06:30 06:18
2015-05-30 24:00:00 2015-05-30 24:00:00 2015-05-30 24:00:00 24:00:00 19:33 2015-05-30 08:02 06:24 00:00
2015-05-31 24:00:00 2015-05-31 24:00:00 2015-05-31 24:00:00 24:00:00 24:00:00 2015-05-31 07:51 06:18 00:00
Summa 744:26:00 Summa 744:26:00 Summa 744:26:00 273:32:00 123:34:00 Summa 232:24:00 197:09:00 148:04:00Medel 24:00:00 Medel 24:00:00 Medel 24:00:00 08:49 03:59 Medel 07:29 06:21 04:46
Min23:55 (05-
13)Min
23:55 (05-13)
Min23:55 (05-
13)00:00 (05-
03)00:00 (05-
03)Min 06:42 (05-06) 06:18 (05-20) 00:00 (05-01)
Max24:05 (05-
12)Max
24:05 (05-12)
Max24:05 (05-
12)24:00 (05-
30)24:00 (05-
31)Max 08:49 (05-04) 06:31 (05-12) 09:01 (05-04
Sludgescraper Sludgepump SludgepumpRuntime pump for chemical addition Runtime pumps to MBBRRuntime blower
I

Anjali Amatya TRITA LWR Degree Project 2016:01
APPENDIX II: RUNTIME OF BLOWER AND PUMPS IN GAGNEF WWTP IN AUGUST, 2015
II
Sludgescraper Sludgepump SludgepumpBodarnas ARV
Bodarnas ARV
Bodarnas ARV
Bodarnas ARV
Bodarnas ARV
Bodarnas ARVBodarnas ARV
Bodarnas ARV
Driftstid BM1 h
Driftstid DP1 h
Driftstid UP1 h
Driftstid UP2 h
Driftstid UP3 h
Driftstid SK1 hDriftstid SP1 h
Driftstid SP2 h
2015-08-01 24:00:00 2015-08-01 24:00:00 2015-08-01 24:00:00 06:39 01:39 2015-08-01 08:52 06:18 00:00
2015-08-02 24:00:00 2015-08-02 24:00:00 2015-08-02 24:00:00 05:15 01:05 2015-08-02 06:46 06:18 00:00
2015-08-03 24:00:00 2015-08-03 24:00:00 2015-08-03 24:00:00 00:15 00:00 2015-08-03 07:24 06:20 09:01
2015-08-04 24:00:00 2015-08-04 24:00:00 2015-08-04 24:00:00 00:00 00:00 2015-08-04 08:20 06:30 07:47
2015-08-05 24:00:00 2015-08-05 24:00:00 2015-08-05 24:00:00 04:46 03:33 2015-08-05 06:45 06:21 07:38
2015-08-06 24:00:00 2015-08-06 24:00:00 2015-08-06 24:00:00 00:42 00:00 2015-08-06 06:53 06:18 08:16
2015-08-07 24:00:00 2015-08-07 24:00:00 2015-08-07 24:00:00 00:00 00:00 2015-08-07 08:59 06:18 06:00
2015-08-08 24:05:00 2015-08-08 24:05:00 2015-08-08 24:05:00 00:00 00:00 2015-08-08 06:47 06:18 00:00
2015-08-09 23:56 2015-08-09 23:56 2015-08-09 23:56 00:42 00:00 2015-08-09 06:47 06:25 00:00
2015-08-10 24:00:00 2015-08-10 24:00:00 2015-08-10 24:00:00 01:01 00:11 2015-08-10 08:25 06:28 08:21
2015-08-11 24:00:00 2015-08-11 24:00:00 2015-08-11 24:00:00 01:10 00:12 2015-08-11 07:26 06:18 08:28
2015-08-12 24:00:00 2015-08-12 24:00:00 2015-08-12 24:00:00 00:00 00:00 2015-08-12 06:46 06:18 08:45
2015-08-13 24:00:00 2015-08-13 24:00:00 2015-08-13 24:00:00 00:00 00:00 2015-08-13 07:45 06:18 08:34
2015-08-14 24:00:00 2015-08-14 24:00:00 2015-08-14 24:00:00 00:25 00:00 2015-08-14 08:04 06:18 05:39
2015-08-15 24:00:00 2015-08-15 24:00:00 2015-08-15 24:00:00 00:38 00:11 2015-08-15 06:45 06:30 00:00
2015-08-16 24:01:00 2015-08-16 24:01:00 2015-08-16 24:01:00 00:57 00:27 2015-08-16 07:07 06:23 00:00
2015-08-17 24:00:00 2015-08-17 24:00:00 2015-08-17 24:00:00 01:04 00:00 2015-08-17 08:40 06:18 08:25
2015-08-18 24:00:00 2015-08-18 24:00:00 2015-08-18 24:00:00 01:08 00:24 2015-08-18 06:47 06:18 09:00
2015-08-19 24:00:00 2015-08-19 24:00:00 2015-08-19 24:00:00 00:16 00:07 2015-08-19 06:46 06:18 09:01
2015-08-20 24:00:00 2015-08-20 24:00:00 2015-08-20 24:00:00 00:00 00:00 2015-08-20 08:42 06:23 08:52
2015-08-21 24:00:00 2015-08-21 24:00:00 2015-08-21 24:00:00 00:00 00:00 2015-08-21 07:07 06:30 08:35
2015-08-22 24:05:00 2015-08-22 24:05:00 2015-08-22 24:05:00 00:00 00:00 2015-08-22 06:46 06:18 00:00
2015-08-23 23:56 2015-08-23 23:56 2015-08-23 23:56 00:11 00:00 2015-08-23 08:03 06:18 00:00
2015-08-24 24:00:00 2015-08-24 24:00:00 2015-08-24 24:00:00 00:28 00:00 2015-08-24 07:45 06:18 08:41
2015-08-25 24:00:00 2015-08-25 24:00:00 2015-08-25 24:00:00 00:00 00:00 2015-08-25 06:46 06:18 08:50
2015-08-26 24:00:00 2015-08-26 24:00:00 2015-08-26 24:00:00 02:36 02:24 2015-08-26 07:27 06:29 08:28
2015-08-27 24:01:00 2015-08-27 24:01:00 2015-08-27 24:01:00 06:53 03:48 2015-08-27 06:06 06:25 08:25
2015-08-28 24:00:00 2015-08-28 24:00:00 2015-08-28 24:00:00 00:00 00:00 2015-08-28 06:46 06:18 06:09
2015-08-29 24:00:00 2015-08-29 24:00:00 2015-08-29 24:00:00 00:35 00:00 2015-08-29 06:46 06:18 00:00
2015-08-30 24:00:00 2015-08-30 24:00:00 2015-08-30 24:00:00 00:00 00:00 2015-08-30 06:47 06:17 00:00
2015-08-31 24:00:00 2015-08-31 24:00:00 2015-08-31 24:00:00 00:00 00:00 2015-08-31 08:45 06:22 08:29
Summa 744:27:00 Summa 744:27:00 Summa 744:27:00 35:51:00 14:06 Summa 230:05:00 196:55:00 171:34:00Medel 24:00:00 Medel 24:00:00 Medel 24:00:00 01:09 00:27 Medel 07:25 06:21 05:32
Min23:56 (08-
23)Min
23:56 (08-23)
Min23:56 (08-
23)00:00 (08-
04)00:00 (08-
03)Min 06:06 (08-27) 06:17 (08-30) 00:00 (08-01)
Max24:05 (08-
08)Max
24:05 (08-08)
Max24:05 (08-
08)06:53 (08-
27)03:48 (08-
27)Max 08:59 (08-07) 06:30 (08-15) 09:01 (08-19)
Runtime pump for chemical addition Runtime pumps to MBBRRuntime blower

Study on Process Performance and Evaluation of Two Municipal Wastewater Treatment Plants.
APPENDIX III: RUNTIME OF BLOWER AND PUMPS IN TÄLLBERG WWTP IN MAY, 2015
Tällberg ARV
Tällberg ARV
Tällberg ARV
Tällberg ARV
Tällberg ARV Tällberg ARVTällberg ARV
Drifttid BM1 h
Drifttid FBM h
Drifttid RP1 h
Drifttid RP2 h
Drifttid SP5 h
Drifttid SP4 h
Drifttid Slamskrapa1 h
2015-05-01 9.96 24.00 24.00 24.00 2015-05-01 5.95 4.45 15.94
2015-05-02 8.05 24.00 24.00 24.00 2015-05-02 5.94 4.45 15.87
2015-05-03 9.69 24.01 24.01 24.01 2015-05-03 5.97 4.45 16.06
2015-05-04 7.29 24.01 24.01 24.01 2015-05-04 5.96 4.45 15.93
2015-05-05 6.24 24.00 24.00 24.00 2015-05-05 5.96 4.45 15.87
2015-05-06 4.97 24.00 24.00 24.00 2015-05-06 5.97 4.45 16.05
2015-05-07 3.96 24.01 24.01 24.01 2015-05-07 5.98 4.45 15.86
2015-05-08 5.83 24.01 24.01 24.01 2015-05-08 5.98 4.45 15.91
2015-05-09 6.26 24.00 24.00 24.00 2015-05-09 5.97 4.45 15.99
2015-05-10 6.23 24.00 24.00 24.00 2015-05-10 5.91 4.45 15.93
2015-05-11 4.33 24.00 24.00 24.00 2015-05-11 5.92 4.45 15.93
2015-05-12 3.36 24.00 24.00 24.00 2015-05-12 5.93 4.45 15.84
2015-05-13 5.68 24.00 24.00 24.00 2015-05-13 5.96 4.45 16.12
2015-05-14 4.79 24.01 24.01 24.01 2015-05-14 5.93 4.45 15.90
2015-05-15 7.40 24.00 24.00 24.00 2015-05-15 5.92 4.45 17.11
2015-05-16 8.34 24.00 24.00 24.00 2015-05-16 5.97 4.45 20.06
2015-05-17 10.38 24.01 24.01 24.01 2015-05-17 5.89 4.45 16.04
2015-05-18 7.28 24.00 24.00 24.00 2015-05-18 5.95 4.45 16.18
2015-05-19 8.36 24.00 24.00 24.00 2015-05-19 5.99 4.45 16.87
2015-05-20 6.60 24.01 24.01 24.01 2015-05-20 5.95 4.45 17.64
2015-05-21 6.04 24.00 24.00 24.00 2015-05-21 5.93 4.45 15.85
2015-05-22 7.62 24.00 24.00 24.00 2015-05-22 5.97 4.45 16.08
2015-05-23 7.38 24.01 24.01 24.01 2015-05-23 5.97 4.45 15.84
2015-05-24 8.16 24.02 24.02 24.02 2015-05-24 5.98 4.45 15.94
2015-05-25 6.48 24.00 24.00 24.00 2015-05-25 5.97 4.45 15.84
2015-05-26 11.54 24.01 24.01 24.01 2015-05-26 5.98 4.45 16.09
2015-05-27 19.66 24.00 24.00 24.00 2015-05-27 5.99 4.45 15.84
2015-05-28 7.33 24.00 24.00 24.00 2015-05-28 5.93 4.45 15.93
2015-05-29 17.39 24.01 24.01 24.01 2015-05-29 5.97 4.45 15.95
2015-05-30 24.00 24.00 24.00 24.00 2015-05-30 5.96 4.45 16.07
2015-05-31 20.22 24.01 24.01 24.01 2015-05-31 5.96 4.45 18.30
Summa 270.83 744.16 744.16 744.16 Summa 184.64 137.91 504.82Medel 8.74 24.01 24.01 24.01 Medel 5.96 4.45 16.28
Min3.36 (05-
12)24.00 (05-
18)24.00 (05-
18)24.00 (05-
18)Min 5.89 (05-17) 4.45 (05-01)
15.84 (05-12)
Max24.00 (05-
30)24.02 (05-
24)24.02 (05-
24)24.02 (05-
24)Max 5.99 (05-19) 4.45 (05-09)
20.06 (05-16)
III

Anjali Amatya TRITA LWR Degree Project 2016:01
IV
APPENDIX IV: RUNTIME OF BLOWER AND PUMPS IN TÄLLBERG WWTP IN AUGUST, 2015