Embed Size (px)
Citation preview
Student Volunteers:
A National Profile
By Clare Holdsworth

2
Executive summary
15.3% of undergraduates reported volunteering with a charity in their first year of studies during the 2006-7 academic year.
Volunteering rates were highest among students studying medicine/dentistry and social sciences. They were lowest for those in the broad subject grouping of physical sciences (including maths, computing and engineering), architecture and planning and some arts programmes.
Students at higher ranking universities (ranked by entry tariff points) reported higher volunteering rates than those at other universities. Students at middle ranking universities reported lowest volunteering rates.
Volunteering rates were higher among some minority groups: ethnic minority students, students with a disability, and those with caring responsibilities.
While gender and socio-economic background were associated with variation in volunteering rates, the differences were small.
Students who volunteer were more likely to take part in other extracurricular activities, both on and off campus. Working during term time had very little impact on reported volunteering.
The influence of the type of Higher Education Institution (HEI) on volunteering rates cannot be fully explained by the characteristics of students. For example, students from middle class backgrounds were more likely to report volunteering at highest tariff HEIs compared to students from the same background at medium or lower tariff institutions.
The higher rates of volunteering among students from minority ethnic groups appears to be associated with both religious identity and the fact that these students were more likely to get involved in other forms of student extracurricular activities.
Student volunteering can be separated into activities associated with students’ courses or future careers and those activities that are unrelated. Roughly one-third of volunteering activities were course or career related compared to two-thirds that were unrelated. Study or career related volunteering was more common among medical and social science students, and among non-traditional students (i.e. mature students from less advantaged backgrounds and studying at lower tariff HEIs).
Students were asked about reasons for volunteering. The most common reason given was “volunteering to help someone or their community”, with more than two-thirds of students agreeing with this statement. Employment-related reasons were more important for students from non-traditional backgrounds. Younger students, those studying physical sciences, and men were more likely to agree that meeting people was a reason for getting involved.
Student Volunteers: A National Profile
3
Introduction
Futuretrack is a major study that is tracking students from the point of application to a Higher Education Institution (HEI) until they leave and enter the graduate labour market or continue into postgraduate study. The study covers applicants to higher education in 2006, who will be surveyed while at university and as they move into the employment market. It was funded by the Higher Education Careers Services Unit and was carried out by an interdisciplinary research team at the Institute for Employment Research at the University of Warwick. This analysis of student volunteering was carried out with respondents to wave two of the survey who were full-time students at UK HEIs enrolled on an undergraduate degree programme, for which students were surveyed during summer and autumn 2007 to record their experiences of their first year at university or college. This gave a sample size of 33,303 respondents1.
Who volunteers?
In the 2006-7 academic year, 15.3% of students carried out volunteering work with a charity during their first year of studies. A number of key characteristics of volunteers can be discerned (see table A1 in the appendix). Starting with students’ socio-demographic profile, women reported a higher rate of volunteering than men, though the difference is small (2.3%). There is more variation in the uptake of volunteering by ethnic group, as students from all Asian backgrounds, Black-African and Black-Other backgrounds report a higher level of volunteering compared to White students, while the profile for Black-Caribbean students is similar to their White counterparts. Disability was also an important variable, with 22.2% of students who declared a disability being engaged in volunteering. Likewise, students with a caring responsibility were more likely to volunteer. It is important to remember that the proportion of ethnic minority students and students with a disability and caring responsibility are relatively small across the student population. In most HEIs the visibility of these minority groups in volunteering activities will not be apparent due to their small numbers.
Variables that capture students’ socio-economic background, that is parental socio-economic group and experience of HE, were associated with much smaller differentials in volunteering. Though there was an increase in volunteering activities among students from less disadvantaged backgrounds, the overall impact is small as the difference in volunteering rates for students from managerial class backgrounds was 1.7 percentage points higher than that for students from routine and manual occupational backgrounds.
The survey also asked students about aspects of self-identity and the extent to which they felt that social identities relating to class, gender, religion, ethnicity and region were important to them. For volunteering, religious identity stands out as one-fifth of students who reported that religion was either important or very important also took part in volunteering activities.
The next set of variables relate to the type of university and course that students attend. Here important differentials in the uptake of volunteering emerge. Taking HE region first, volunteering rates were higher among Northern Irish students and lower among Welsh and Scottish students compared to students at English HEIs. Type of HEI is compared using a variable that distinguishes HEIs by tariff points of undergraduate entrants2. Volunteering rates were highest at the highest tariff universities and lowest at the medium tariff institutions with a differential of 4% in volunteering rates among students at these two types of HEIs.
Subject studied revealed the largest diversity in volunteering rates. Students studying medicine and dentistry reported the highest volunteering rates, with one-quarter of all these students
4
volunteering. Other subject areas with above average volunteering rates included biology and related life science subjects, social sciences, law and historical and philosophical studies. Students enrolled on programmes in the physical sciences, maths, engineering, architecture, business and administration, languages, linguistics and creative arts had below average levels of volunteering. This strong relationship between subject studied and volunteering will reflect the orientation of students who choose to study subjects such as medicine and social sciences, as these students may be more motivated to work with others. Students on more ‘people’ orientated courses might also have more opportunity to volunteer during their studies. This dimension is discussed in more detail below.
Students were also surveyed on other activities that they took part in while at university, including membership of other societies and organisations (both on and off campus) as well as undertaking paid employment. Membership of extracurricular clubs and societies was associated with higher rates of volunteering. This suggests that student volunteers were more willing to sign up to other activities compared to non-volunteers. Though this finding holds for all kinds of activities, it is more strongly associated with particular activities. Not surprisingly students who took part in charity/community orientated organisations had the highest rate of volunteering, with over half of students who join these societies volunteering. Students who took part in political, student union and religious societies also reported high volunteering rates. The survey also included a question on being an office holder or student representative in a university club or society, to distinguish students who had a more intensive level of involvement: one-quarter of all these students also reported volunteering. More surprisingly, there was no substantial difference in volunteering rates for students who worked during term time; work does not appear to be a barrier to volunteering. Rather, it would appear that volunteers were generally ‘busy’ students who took part in a range of activities.
These broad characteristics of student volunteers can be considered in more detail by comparing relationships between different variables. The following analysis highlights some of the main findings.
Type of HEI and socio-economic background
Analysis of students’ characteristics reveals that type of HEI was associated with a greater divergence in volunteering rates compared to socio-economic background. However, both of these variables are clearly related, as higher tariff HEIs are dominated by students from more advantaged backgrounds. Figure 1 illustrates how volunteering rates were differentiated by socio-economic background and type of HEI. This analysis reveals that type of HEI was more important than socio-economic group, in that the differential within groups across the different types of HEI was greater than that within each type of HEI. For example, for students from professional and managerial backgrounds, there was a five percentage point difference in volunteering rates for students at highest tariff universities compared to medium tariff institutions. Yet within the highest tariff HEIs the differential between volunteering rates by students’ socio-economic background was three percentage points.
Student Volunteers: A National Profile

5
Figure 1: Volunteering by type of HEI and parental socio-economic group
Subject studied and type of HEI
The relationship between subject studied and type of HEI reveals some contrasting results (figure 2)3. For most subject areas, the relationship between type of HEI demonstrated higher rates of volunteering at highest tariff universities, and lowest rates at medium tariff institutions. For social sciences the relationship is reversed, as volunteering rates were highest among students from medium and lower tariff institutions, with just under one-third of social sciences students at lower tariff HEIs engaged in volunteering activities. This analysis highlights how experiences of HEI type were not universal and there was diversity of volunteering uptake within different groups at similar institutions.
Figure 2: Volunteering by type of HEI and subject studied
Ethnicity
Ethnic identity appears to be important in influencing students’ decisions about volunteering. This finding for student volunteering can be corroborated by data on informal and formal volunteering in the general population. For example, analysis of the 2003 Home Office Citizenship Survey of England and Wales found that young Asians had one of the highest rates of formal volunteering of any group4 Further analysis of volunteering by ethnic group illustrates that the relationship was intensified, especially for Asian students, by type of HEI5. Just under one-quarter of all Asian students at highest tariff HEIs took part in volunteering activities. It should be noted that a larger proportion (over one-third) of Asian students attended highest tariff HEIs compared to all other ethnic group, while the profile of Black students was very different, as these students were more likely to be studying at lower tariff institutions.

6 Student Volunteers: A National Profile
Figure 3: Volunteering by type of HEI and ethnicity
Another important distinguishing characteristic of students from ethnic minority backgrounds is that they were more likely to state that their religious identity was important or very important to them: 56.2% and 69% of Asian and Black students stated that their religious identity was important, compared to 20.5% of White students. This differential will be associated with the greater uptake of volunteering among ethnic minority students. However, it is interesting to note that religious identity had a much smaller impact on volunteering rates among Asian students compared to all other ethnic groups, as illustrated in figure 4. Hence, we should be cautious in assuming that the higher uptake of volunteering among ethnic minority students can be explained by religious identity alone.
Figure 4: Volunteering by ethnic group and religious identity
Modelling the profile of student volunteers
Logistic regression modelling was used to develop a profile of student volunteers and to explore in more depth the relationship between different characteristics. The appendix contains more details on the modelling and the results. The modelling confirms the findings discussed above. For example, it confirms that students from all minority ethnic groups, except those from mixed backgrounds, were more likely to volunteer than their White counterparts. However, the influence of ethnicity is reduced when we consider religious identity and membership of other organisations. This tentatively suggests that higher volunteering rates among minority ethnic students reflect their religious identity and that they are ‘joiners’. The type of HEI a student attends is also confirmed as a significant factor in influencing volunteering, although the difference between highest tariff and other HEIs becomes smaller once all of characteristics are added in.

7
Volunteering associated with course or career
The survey included information on the type of volunteering undertaken. We can distinguish between students whose volunteering was in activities associated with their course or future career and those whose volunteering was not. Overall, 38.5% of students who volunteered did so in activities associated with their course or future career, while 68.5% of students volunteered in activities that were not related to studies or future employment. Some students took part in both types of volunteering.
In the following analysis we distinguish those who volunteered exclusively in activities relating to their course or career, which accounted for 31.5% of student volunteers. Further analysis of how this varies by student characteristics revealed two important relationships (see table A3). First subject studied is important, as students who studied medicine/dentistry, other life sciences and social sciences were more likely to have volunteered in activities associated with their course or career. For students studying these subjects it will be easier to find volunteering opportunities associated with their course and students might regard volunteering as a more obvious addition to their studies or intended career. In contrast students studying physical sciences and engineering had a lower rate of volunteering associated with their studies. The second observation is that non-traditional students reported a higher rate of study or employment-related volunteering compared to traditional students. That is, students from routine and manual occupational backgrounds, those with no parental experience of HE, mature students and those with live at home all reported higher rates of course-related volunteering. Moreover, students at medium and lower tariff HEIs were also more likely to volunteer through their course. However, analysis by ethnic group illustrates that Asian and Black students were less likely to take part in this kind of volunteering.
This analysis was extended to consider relationships between these variables. For example, if we consider subject studied and type of HEI (figure 5), for most subjects course-related volunteering was most common among students at medium and lower tariff HEIs, but this was most marked for students studying social sciences and of less importance for arts students.
Figure 5: Course or career-related volunteering by subject studied and type of HEI

8
Finally, there was an interesting relationship between socio-economic group and type of HEI (figure 6). Type of HEI was more important among students from managerial/professional and intermediate backgrounds, as students in this group at lower tariff HEIs were more directed towards course-related volunteering. However, students from routine and manual occupational backgrounds had higher rates of course-related volunteering regardless of type of HEI.
Figure 6: Course or career-related volunteering by parental socio-economic group and type of HEI
This analysis suggests that with the exception of students studying degrees such as medicine, where course-related volunteering is more practicable, students from more marginal backgrounds and at newer universities were more likely to take up volunteering through their studies or because of career aspirations. In contrast, volunteering that is independent of course or career was more favoured by traditional, or more advantaged, students.
Reasons for volunteering
The survey asked about students’ reasons for volunteering, distinguishing between community, personal and employment-related motivations. Table 1 summarises the results.
Table 1: Reasons for volunteering
Reasons for volunteering % of volunteers in agreement
I wanted to help someone/the community 69.2 To learn new skills 55.9 It connected with my needs/interests 46.3 To gain experience for my future career 44.5 To meet people 44.4 I had spare time on my hands 30.9 I had experience in that area 28.2 Someone asked me to 22.3 It was part of my university college/course 6.9
Student Volunteers: A National Profile

9
Table 2: Reasons for volunteering by type of volunteering
Reasons for volunteering Related to Not related to studies/career studies/career
% of volunteers in agreement
I wanted to help someone/the community 57.8 74.5 To learn new skills 73.2 47.9 It connected with my needs/interests 61.5 39.3 To gain experience for my future career 80.7 27.8 To meet people 39.8 46.6 I had spare time on my hands 22.8 34.6 I had experience in that area 26.8 28.8 Someone asked me to 14.7 25.8 It was part of my university college/course 15.9 2.8
Students who were engaged in volunteering activities associated with their course or career were more likely to confirm that their motivation was primarily associated with either learning new skills or gaining work experience. However, this group of students were not exclusively motivated by employability reasons, as over half volunteered because it connected with their needs and interests or because they wanted to help someone or their local community.
Turning to consider motivation by student characteristics and focussing on the five most commonly cited reasons for volunteering (new skills, meeting people, connecting with needs, helping the community and work experience) a number of themes emerge (see table A4 in the appendix). First, volunteering to help the community was the most popular reason cited for all groups. Looking at the other reasons, students from lower socio-economic groups and those studying at lower tariff HEIs were more likely to volunteer for work experience and also to gain new skills, while those at higher tariff HEIs were more likely to cite community reasons for volunteering. Students enrolled on life sciences degrees and social sciences were more likely than those enrolled in other courses to cite employability reasons (both skills and work experience), though medical students also reported the highest agreement with helping the community. Students studying the physical sciences were more likely to identify with the opportunity to make new friends. Meeting new friends was also recognised by younger and male students as well as those studying at higher ranking HEIs and who were not living in their family home. Finally, students from ethnic minority backgrounds were more likely to identity with both gaining new skills and helping the community, while White students generally had lower agreement with the five main reasons, with the exception of meeting own interests.
Brief conclusions
In conclusion, analysis of Futuretrack 2006 reveals that though a minority of students reported volunteering activities in their first year of study, volunteering was a more popular choice for some minority groups, students studying medicine and social sciences and those at higher ranking universities. Most volunteers were engaged in activities that were not directly associated with their course or future career, and got involved because they wanted to help in their local communities. Employability reasons were also important and tended to be favoured by students from non-traditional backgrounds.
10
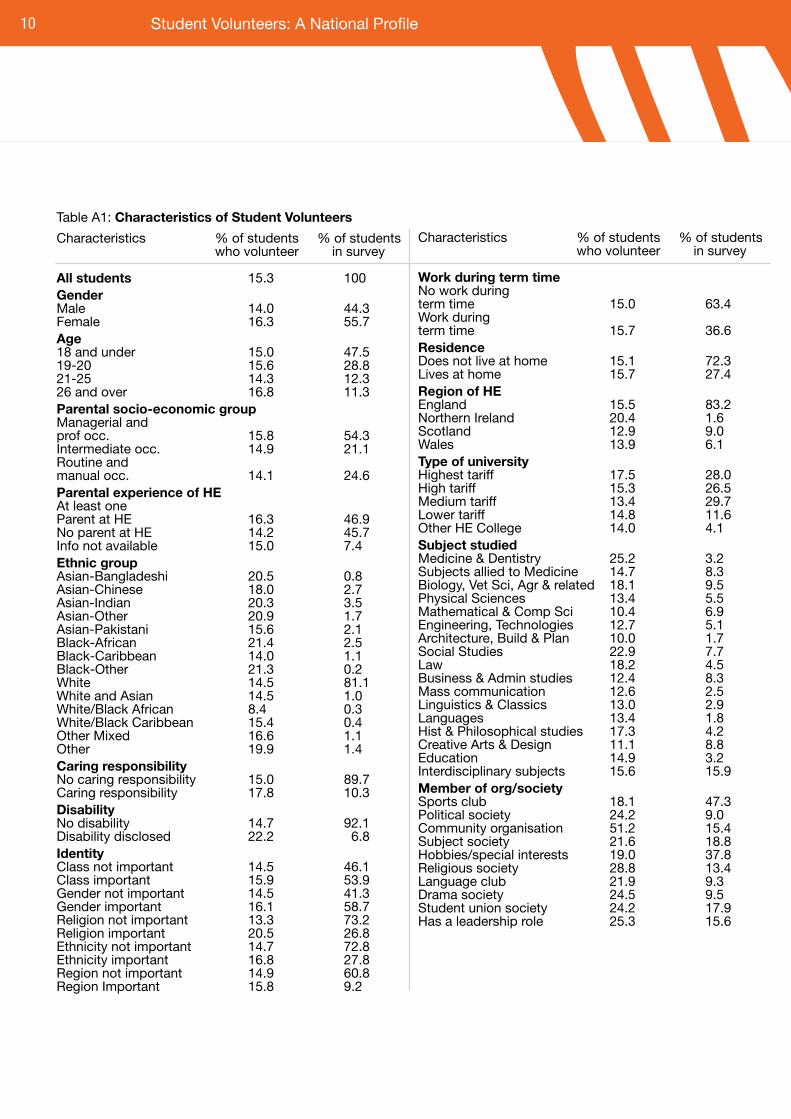
Table A1: Characteristics of Student Volunteers
Characteristics % of students % of students who volunteer in survey All students 15.3 100 Gender Male 14.0 44.3 Female 16.3 55.7Age 18 and under 15.0 47.5 19-20 15.6 28.8 21-25 14.3 12.3 26 and over 16.8 11.3Parental socio-economic group Managerial and prof occ. 15.8 54.3 Intermediate occ. 14.9 21.1 Routine and manual occ. 14.1 24.6Parental experience of HE At least one Parent at HE 16.3 46.9 No parent at HE 14.2 45.7 Info not available 15.0 7.4Ethnic group Asian-Bangladeshi 20.5 0.8 Asian-Chinese 18.0 2.7 Asian-Indian 20.3 3.5 Asian-Other 20.9 1.7 Asian-Pakistani 15.6 2.1 Black-African 21.4 2.5 Black-Caribbean 14.0 1.1 Black-Other 21.3 0.2 White 14.5 81.1 White and Asian 14.5 1.0 White/Black African 8.4 0.3 White/Black Caribbean 15.4 0.4 Other Mixed 16.6 1.1 Other 19.9 1.4Caring responsibility No caring responsibility 15.0 89.7 Caring responsibility 17.8 10.3Disability No disability 14.7 92.1 Disability disclosed 22.2 6.8Identity Class not important 14.5 46.1 Class important 15.9 53.9 Gender not important 14.5 41.3 Gender important 16.1 58.7 Religion not important 13.3 73.2 Religion important 20.5 26.8 Ethnicity not important 14.7 72.8 Ethnicity important 16.8 27.8 Region not important 14.9 60.8 Region Important 15.8 9.2
Characteristics % of students % of students who volunteer in survey Work during term time No work during term time 15.0 63.4 Work during term time 15.7 36.6Residence Does not live at home 15.1 72.3 Lives at home 15.7 27.4Region of HE England 15.5 83.2 Northern Ireland 20.4 1.6 Scotland 12.9 9.0 Wales 13.9 6.1Type of university Highest tariff 17.5 28.0 High tariff 15.3 26.5 Medium tariff 13.4 29.7 Lower tariff 14.8 11.6 Other HE College 14.0 4.1Subject studied Medicine & Dentistry 25.2 3.2 Subjects allied to Medicine 14.7 8.3 Biology, Vet Sci, Agr & related 18.1 9.5 Physical Sciences 13.4 5.5 Mathematical & Comp Sci 10.4 6.9 Engineering, Technologies 12.7 5.1 Architecture, Build & Plan 10.0 1.7 Social Studies 22.9 7.7 Law 18.2 4.5 Business & Admin studies 12.4 8.3 Mass communication 12.6 2.5 Linguistics & Classics 13.0 2.9 Languages 13.4 1.8 Hist & Philosophical studies 17.3 4.2 Creative Arts & Design 11.1 8.8 Education 14.9 3.2 Interdisciplinary subjects 15.6 15.9Member of org/society Sports club 18.1 47.3 Political society 24.2 9.0 Community organisation 51.2 15.4 Subject society 21.6 18.8 Hobbies/special interests 19.0 37.8 Religious society 28.8 13.4 Language club 21.9 9.3 Drama society 24.5 9.5 Student union society 24.2 17.9 Has a leadership role 25.3 15.6
Student Volunteers: A National Profile

11
Characteristics % of students % of students who volunteer in survey Work during term time No work during term time 15.0 63.4 Work during term time 15.7 36.6Residence Does not live at home 15.1 72.3 Lives at home 15.7 27.4Region of HE England 15.5 83.2 Northern Ireland 20.4 1.6 Scotland 12.9 9.0 Wales 13.9 6.1Type of university Highest tariff 17.5 28.0 High tariff 15.3 26.5 Medium tariff 13.4 29.7 Lower tariff 14.8 11.6 Other HE College 14.0 4.1Subject studied Medicine & Dentistry 25.2 3.2 Subjects allied to Medicine 14.7 8.3 Biology, Vet Sci, Agr & related 18.1 9.5 Physical Sciences 13.4 5.5 Mathematical & Comp Sci 10.4 6.9 Engineering, Technologies 12.7 5.1 Architecture, Build & Plan 10.0 1.7 Social Studies 22.9 7.7 Law 18.2 4.5 Business & Admin studies 12.4 8.3 Mass communication 12.6 2.5 Linguistics & Classics 13.0 2.9 Languages 13.4 1.8 Hist & Philosophical studies 17.3 4.2 Creative Arts & Design 11.1 8.8 Education 14.9 3.2 Interdisciplinary subjects 15.6 15.9Member of org/society Sports club 18.1 47.3 Political society 24.2 9.0 Community organisation 51.2 15.4 Subject society 21.6 18.8 Hobbies/special interests 19.0 37.8 Religious society 28.8 13.4 Language club 21.9 9.3 Drama society 24.5 9.5 Student union society 24.2 17.9 Has a leadership role 25.3 15.6
Table A2: Logistic regression model of student volunteering
Variable Model I Model II Model III Model IVFemalea 1.194** 1.203** 1.197** 1.298**
Type of HEI: Ref Highest Tariff High Tariff 0.841** 0.846** 0.832** 0.897** Medium Tariff 0.695** 0.714** 0.701** 0.813** Lower Tariff 0.796** 0.794** 0.767** 0.878**
HE region: Ref England Northern Ireland 1.450** 1.532** 1.326** 1.376** Scotland 0.748** 0.769** 0.755** 0.800** Wales 0.895 0.930 0.941 0.957
Subject: Ref Physical sc/engineering Medicine 2.049** 2.002** 1.938** 1.987** Other Life sciences 1.380** 1.397** 1.387** 1.421** Social Science 1.777** 1.755** 1.745** 1.683** Other social sciences 1.140** 1.134** 1.121* 1.093 Arts 1.090 1.108* 1.099* 1.061 Interdisciplinary 1.258** 1.271** 1.255** 1.220**
Parental; Socio-economic Ref Managerial and Prof Intermediate 0.951 0.944 0.961 Routine and Manual 0.916** 0.913** 0.941 No parent at HEa 0.893** 0.901** 0.950 Has a caring responsibility 1.176** 1.156** 1.139** Disability discloseda 1.784** 1.774** 1.631**
Ethnic group: Ref White Asian 1.338** 1.171** 0.947 Black 1.290** 1.059 0.863* Mixed 0.938 0.908 0.863 Other 1.398** 1.262* 1.106 Work during term timea 1.120** 1.106** Lives at homea 0.996 1.132** Religious Identity importanta 1.527** 1.206** Leadership role in university cluba 1.653**
Member of: Sports cluba 1.211** Drama societya 1.175** Political societya 1.038 Student union societya 1.468** Hobby/interest cluba 1.318** Religious societya 1.838** Subject societya 1.147**
Source: Futuretrack 2006 Wave two, un-weighted sample a For binary variables the reference category is the opposite group * Significant at 90% level ** Significant at 95% level

12
The logistical regression modelling described in table A2 above predicts the odds of being a volunteer against not being a volunteer. The modelling was carried out in four stages: model 1 included variables on gender and age (not significant and not included in the model output), type of HEI, subject studied and region of HEI; model two was extended to include variables on students’ socio-economic background; in model three variables were added on religious identity, living at home and paid employment during term time; and the final model four included variables on membership of other activities and societies. Results of the four models are presented in table A2 which give the ratio for each of the categorical variables fitted. Odds give the ratio of the probability that a student volunteers compared to the probability that a student does not. An odds ratio compares the odds for each sub-group of a particular variable against the reference group. An odds ratio of 1 indicates that the probability of volunteering compared to not volunteering is the same in both groups. An odds ratio above 1 indicates that volunteering is more likely than not volunteering for the sub-group of interest. For example, in model 1 the odds for women are 1.194 indicating that women are 20% more likely to volunteer than not volunteer compared to men. Odds ratios below 1 indicate that volunteering is less likely in the sub-group than the reference group.
The modelling confirms the initial cross-sectional analysis, but also extends understanding of causal factors that influence student volunteering. In particular it is interesting to see how the odds ratios for different variables change as new variables are added to the model. Taking ethnic group, model two confirms the cross-sectional analysis that students from all ethnic groups, except those from mixed backgrounds, are more likely to volunteer. However, when religious identity was included in the model these ratios are reduced, especially for Black students. Moreover, in the final model inclusion of variables on membership of other organisations reduced these odds ratios even further. We can therefore tentatively conclude that the higher volunteering rates among ethnic minority students reflect their religious identity, but also that these students had a greater inclination to join other organisations; in other words students from ethnic minority backgrounds were ‘joiners’ and this explains some of their volunteering. For socio-economic background and parental experiences of HE, the odds ratios are very small and insignificant in the final model suggesting a somewhat muted relationship with class. In contrast, odds ratios for type of HEI remain significant in all models, though the differences between highest tariff HEIs and all other HEIs is quite small in the final model. The results for students who live at home also reveal a slightly different interpretation. Cross-sectional analysis suggested that this is not an important variable in explaining volunteering, and model three would confirm this. However, once membership of other societies is included (which students who live at home were less likely to join) their odds of volunteering increased.
Student Volunteers: A National Profile

13
Table A3: Type of volunteering by selected characteristics
% of volunteers engaged in activities exclusively associated with course or career All students 31.5 Gender Male 27.0 Female 34.6
Age <18 27.0 19-20 29.2 21-25 40.3 26+ 45.8
Type of HEI Highest Tariff 27.2 High Tariff 29.6 Medium Tariff 33.3 Lower Tariff 39.6
Subject studied Medicine/Dentistry 52.4 Other Life Sciences 39.8 Physical Sc/Engineering 15.2 Social Science 45.3 Other Social Sciences 29.2 Arts 25.0 Interdisciplinary 28
% of volunteers engaged in activities exclusively associated with course or career Parental socio-economic group Managerial and Professional 29.4 Intermediate 30.0 Routine and Manual 36.8
Parental experience of HE Parent at HE 29.8 No parent at HE 33.0
Ethnic group Asian 23.0 Black 27.6 White 33.3 Mixed 33.5 Other 25.1
Live at home Lives away 29.8 Lives at home 38.1

14
Tab
le A
4: R
easo
ns f
or
volu
ntee
ring
by
sele
cted
cha
ract
eris
tics
% o
f stu
den
t vo
lunt
eers
in a
gree
men
t
To le
arn
T
o m
eet
It
conn
ecte
d
I
wan
ted
to
To
gai
n
ne
w
peo
ple
w
ith m
y ne
eds
he
lp s
omeo
ne
exp
erie
nce
s
kills
/in
tere
sts
/
the
com
mun
ity
for
my
futu
re
car
eer
All
stud
ents
55.9
44.4
41.
3
6
9.2
44.
5
Gen
der
Mal
e
52.
3
4
6.5
4
5.3
67.6
39.
9 Fe
mal
e
58
.4
43.
0
47.
0
70
.3
4
7.7
Ag
e <
18
56.8
4
7.3
4
4.8
69.7
42.
1 19
-20
57.3
4
7.9
4
6.6
69.3
44.
2 21
-25
56.2
3
9.0
4
7.1
66.1
48.
9 26
+
49.0
3
0.4
5
0.4
69.7
50.
2
Typ
e o
f H
EI
H
ighe
st T
ariff
54.5
4
6.2
4
5.9
72.7
39.
0 H
igh
Tarif
f
56.9
4
5.7
4
2.9
71.3
44.
2 M
ediu
m T
ariff
54.6
4
3.5
4
7.2
64.1
45.
6 Lo
wer
Tar
iff
60
.1
39.
0
51.
1
65
.7
5
4.4
Sub
ject
st
udie
d
Med
icin
e/
Den
tistr
y
56.5
4
4.9
4
7.8
74.3
54.
9 O
ther
Life
S
cien
ces
59
.5
42.
6
51.
2
67
.7
5
2.1
Phy
sica
l Sc/
E
ngin
eerin
g
47.0
5
0.1
3
7.5
68.4
28.
4 S
ocia
l Sci
ence
59.0
3
9.7
5
0.3
69.1
55.
2 O
ther
Soc
ial
Sci
ence
s
60.7
4
4.2
4
3.1
6
9.7
45.
2 A
rts
48.8
4
4.8
4
5.3
6
9.9
38.
1 In
terd
isci
plin
ary
59
.2
45.
0
49.
2
68.
9
4
4.3
% o
f stu
den
t vo
lunt
eers
in a
gree
men
t
To le
arn
T
o m
eet
It
conn
ecte
d
I
wan
ted
to
To
gain
ne
w
peo
ple
w
ith m
y ne
eds
he
lp s
omeo
ne
exp
erie
nce
s
kills
/
inte
rest
s
/th
e co
mm
unity
fo
r m
y fu
ture
c
aree
r
Par
enta
l so
cio
-
eco
nom
ic
gro
up
Man
ager
ial
& p
rof
5
3.3
43
.6
4
5.7
70.
2
4
2.1
Inte
rmed
iate
5
3.5
43
.9
4
3.9
70.
6
4
3.6
Rou
tine
and
M
anua
l 6
1.2
46
.5
5
0.6
67.
6
4
8.5
Dis
abili
ty
No
dis
abili
ty
56.
4
45.9
44.
3
6
9.2
44.
7 D
isab
ility
d
iscl
osed
5
1.6
41
.8
4
9.5
70.
6
4
5.2
Eth
nic
gro
up
A
sian
66.
4
51.9
43.
1
7
4.6
46.
9 B
lack
63.
5
42.3
37.
8
7
1.2
42.
6 W
hite
53.
2
43.1
47.
3
6
7.9
44.
1 M
ixed
58.
7
46.6
48.
7
7
1.5
46.
9 O
ther
66.
7
49.0
47.
7
7
5.5
46.
3
Live
at
hom
e
Li
ves
away
5
5.4
47
.9
4
5.1
68.
7
4
2.5
Live
s at
hom
e 5
7.0
35
.7
4
9.2
70.
4
4
9.4
15
Acknowledgements
I am very grateful to HESCU for granting permission to analyse the Futuretrack data and to the Warwick Institute for Employment Research in facilitating this. Particular thanks to Kate Purcell, Heike Behle, Ritva Ellison and Deborah Ranger at IER for their support and assistance. Thank you also to Angela Ellis Paine at the Institute for Volunteering Research.
Notes1 These data have been weighted by the Warwick team to correct for gender and students’ entry qualification tariff points. The author of this report was given secure access to an anonymised version of these data. For more information see Purcell, K, et al (2009) Plans, aspirations and realities: taking stock of higher education and career choices one year on Warwick, Warwick Institute for Employment Research. Available at: http://www2.warwick.ac.uk/fac/soc/ier/research/glmf/futuretrack/futuretrack_stage_2_report_final_november_09.pdf
2 This variable was derived by the Institute of Employment Research. The highest tariff group includes the majority of Russell Group universities, five ‘old’ universities, four medical schools, a veterinary school and an institute focused on languages. The high tariff consists of the remaining Russell group HEIs, the majority of ‘old’ (i.e. pre-1992) universities, 4 former polytechnics and specialist colleges. The medium tariff group is quite varied, though mainly includes the former polytechnics, along with 4 pre-1992 HEIs, and 10 new HEIs that are not former polytechnics. Finally, the lower tariff group is made up mainly of the newer HEIs that are not former polytechnics.
3 For this analysis, subjects have been grouped into broad subject areas, though medicine and social sciences are distinguished from other life and social sciences respectively. It should also be noted that the analysis by type of HEI for medical students is limited as medicine is only offered in highest or high tariff universities.
4 Home Office Research (2004) Home Office Research Study 289 2003 Home Office Citizenship Survey: People, Families and Communities, Home Office. Available at: http://www.communities.gov.uk/documents/communities/pdf/452470.pdf
5 The analysis of ethnic background reveals important differences in volunteering among Asian and Black communities, however due to small numbers in these groups more detailed analysis of ethnicity is carried out using a broad 5-way classification.
Written by Clare Holdsworth, Keele University. Published by Volunteering England, and the Institute for Volunteering Research, February 2010
Student Volunteers: A National Profile
February 2010

Regent’s Wharf 8 All Saints Street London N1 9RL
Tel 0845 305 6979 Fax 020 7520 8910
www.volunteering.org.uk