Embed Size (px)
Citation preview

Student Entrepreneurship 2016:Insights From 50 Countries
International Report of the GUESSS Project 2016
Philipp Sieger / Urs Fueglistaller / Thomas Zellweger

International GUESSS Report 2016
1
Preface
Entrepreneurship is one of the most powerful economic forces in modern societies. Our future well-being thus critically depends on current and future entrepreneurial activities.
Young individuals, and particularly students, represent the entrepreneurs of tomorrow. It is thus imperative to know how many students intend to pursue an entrepreneurial career, why, why not, and how many are in the founding process or have already created a business.
The GUESSS Project (Global University Entrepreneurial Spirit Students' Survey) is dedicated to investigate this topic since 2003. This report provides detailed insights into the corresponding findings from the 7th data collection wave in the history of GUESSS. It was conducted in Spring/Summer 2016 in 50 countries, at more than 1’000 universities, and generated more than 122’000 completed responses.
The 2016 edition of GUESSS would not have been possible without the invaluable effort and support of all country teams, university partners, EY as the international project partner, and of course the students who responded to our survey invitation. Thank you!
We are already looking forward to the next GUESSS edition in 2018!
Yours sincerely,
Prof. Philipp Sieger University of Bern / GUESSS Project Manager Prof. Urs Fueglistaller Prof. Thomas Zellweger University of St.Gallen (KMU-HSG / CFB-HSG) Members of the GUESSS Supervisory Board
Citation: Sieger, P., Fueglistaller, U., & Zellweger, T. (2016). Student Entrepreneurship 2016: Insights
From 50 Countries. St.Gallen/Bern: KMU-HSG/IMU.

International GUESSS Report 2016
2
Table of Content
Executive Summary ................................................................................................................... 3
1 Students’ Career Choice Intentions ..................................................................................... 4
1.1 Specific Intentions and Career Groups ......................................................................... 4 1.2 Across Countries ........................................................................................................... 5
2 Influencing Factors .............................................................................................................. 7
2.1 Field of Study ................................................................................................................ 7 2.2 Gender ........................................................................................................................... 9 2.3 The University Context ............................................................................................... 12 2.4 Personal Skills ............................................................................................................. 13 2.5 The Family Context .................................................................................................... 13
3 Entrepreneurial Intentions Across Time ............................................................................ 15
4 Nascent Entrepreneurs ....................................................................................................... 17
4.1 Prevalence ................................................................................................................... 17 4.2 The Planned New Ventures ........................................................................................ 18 4.3 The Founder Social Identities of Nascent Entrepreneurs ........................................... 20
5 Active Entrepreneurs ......................................................................................................... 23
5.1 Prevalence ................................................................................................................... 23 5.2 The Existing Businesses ............................................................................................. 24 5.3 The Founder Social Identities of Active Entrepreneurs .............................................. 26
6 Recommendations ............................................................................................................. 28
7 GUESSS: Further Information .......................................................................................... 29
7.1 The Project .................................................................................................................. 29 7.2 Country Teams of the 2016 Edition ............................................................................ 30 7.3 Sample and Participants .............................................................................................. 31
7.3.1 Countries, Universities, and Respondents ....................................................................... 31 7.3.2 Student Demographics..................................................................................................... 32
8 References ......................................................................................................................... 32

International GUESSS Report 2016
3
Executive Summary
What are students’ entrepreneurial intentions across the globe, how many students are in the process of creating a business, and how many do already have an own business? And what are the drivers and characteristics of students’ entrepreneurial intentions and activities?
The international report of the GUESSS Project 2016 provides answers to these questions based more than 122’000 completed responses from 50 countries and more than 1’000 universities.
Selected key findings are:
80.3% of all students intend to become employees directly after studies.
8.8% of all students intend to work in their own business directly after studies.
38.2% intend to work in their own business 5 years after completion of their studies.
The share of intentional founders in developing countries is considerably higher than in developed countries.
There is a “gender gap”: females have weaker entrepreneurial intentions than males. o The relative gender gap is 36.6% directly after studies but only 10.8% 5 years later. o The gender gap varies across field of study and countries.
55.4% of all students have not attended any entrepreneurship offerings at university so far.
Students with entrepreneurial parents are more likely to intend to become entrepreneurs than students without entrepreneurial parents.
o The relative difference is 33.6% directly after studies and 17.6% 5 years later. o This effect depends on the parents’ entrepreneurial performance.
In the 18 countries that took part in the GUESSS editions 2011, 2013/2014, and 2016, the share of intentional founders (5 years after studies) dropped from 34.8% in 2011 to 29.0% in 2013/2014 and raised to 30.1% again in 2016. This is a decrease by 16.7% followed by an increase of 3.7%.
21.9% of all students are in the process of creating their own business. o 34.9% of them plan to complete the business creation process within 1 year. o 18.6% intend to create the business alone; all others plan to have co-founders. o The founder social identities of nascent entrepreneurs (Darwinians, Communitarians,
Missionaries) vary considerably across countries. “Pure Darwinians” seem to be particularly prevalent in Eastern Europe.
8.8% of all students already run their own business. o 28.7% of them have created the business alone, all others with at least one co-founder. o On average, these businesses employ 6.3 employees (full-time equivalents). o The entrepreneurs seem quite happy with their life as an entrepreneur (5.28 satisfaction
on a 1-7 scale); 18.4% exhibit the highest possible level of satisfaction.
Taken together, the 2016 edition of GUESSS provides novel and unique insights into various
important aspects of student entrepreneurship for numerous stakeholders.

International GUESSS Report 2016
4
1 Students’ Career Choice Intentions
1.1 Specific Intentions and Career Groups
All students were asked which career path they intend to pursue directly after completion of their studies and 5 years later.
Taking a detailed look at all the specific career options, we see that seeking organizational employment in small, medium-sized, or large businesses are the most preferred options right after studies.
Entrepreneurial intentions (meaning the intention to create a new business)1 increase more than fourfold between the two points in time. Almost 40% of all students that took part in the survey want to be an entrepreneur 5 years after completion of studies.
Figure 1: Career choice intentions in detail
1 We use the terms “entrepreneurial intentions” and “founding intentions” synonymously. Strictly speaking, also
becoming a successor in the parents’ firm or in another firm represents a type of entrepreneurial career; we do not refer to these options unless noted otherwise.
8.2
0.7
1.9
8.8
10.9
6.9
3.5
23.8
20.3
14.9
10.3
2.5
2.4
38.2
9.5
6.1
3
17.6
7
3.4
0 5 10 15 20 25 30 35 40 45
Other / do not know yet
A successor in a business currently not controlled by myfamily
A successor in my parents' / family's business
A founder (entrepreneur) working in my own business
An employee in public service
An employee in Academia (academic career path)
An employee in a non-profit organization
An employee in a large business (250 or moreemployees)
An employee in a medium-sized business (50-249employees)
An employee in a small business (1-49 employees)
5 years after completion of studies Directly after studies
%

International GUESSS Report 2016
5
For a more general picture, we form three main career groups. Obviously, most students prefer organizational employment directly after studies, and many then plan to swing to an entrepreneurial career path within the next 5 years.
Figure 2: Career groups directly and 5 years after studies
1.2 Across Countries
Below, we look at the share of intentional founders (i.e., students who want to work in their own business) in the 50 countries of GUESSS 2016.2
While one has to be careful in interpreting these numbers because the country subsamples differ in terms of size, number and types of participating universities, and student demographics, we nevertheless conclude that intentional founders are particularly prominent in developing countries (and in particular, in Latin American countries).
Developed industrial countries tend to appear at the bottom of the list, which is a phenomenon already revealed in previous GUESSS editions (Sieger, Fueglistaller and Zellweger 2014).
The general pattern of “first employee, then entrepreneur”, however, appears in all countries independent of the level of economic development.
2 For the meanings of the different nationality codes please refer to section 7.2.
46.6
80.3
38.2
8.8
4.8
2.7
10.3
8.2
0% 10% 20% 30% 40% 50% 60% 70% 80% 90% 100%
5 years later
Direct
Employee Founder Successor Other / Do not know yet

International GUESSS Report 2016
6
Figure 3: Share of intentional founders across countries
0.9
2.0
9.0
3.4
5.7
0.0
5.3
4.4
7.4
4.2
6.5
6.4
6.5
5.4
3.9
5.0
3.8
9.8
11.4
4.0
5.4
3.8
7.1
9.5
5.7
7.3
5.0
9.8
9.1
7.3
7.3
6.9
8.8
6.6
14.5
17.7
9.1
10.7
8.2
15.0
24.3
8.9
10.4
21.0
21.0
8.2
17.6
23.6
12.1
17.8
13.6
11.717.017.2
21.121.422.022.422.522.9
27.427.828.129.029.229.629.830.330.8
32.132.732.833.033.2
34.335.136.136.1
37.437.537.837.838.038.2
40.245.245.646.1
51.352.3
53.856.856.856.957.8
61.661.661.7
64.265.9
67.469.3
0.0 10.0 20.0 30.0 40.0 50.0 60.0 70.0 80.0
JPNGERCHNSUI
ALBNORSWEAUTKORIRL
USACZEENGPORBELESPITAFIN
PAKGREAUSHUNSLO
MYSCANHRVFRABRAESTLTULUXMAR
AVERAGEPOL
MKDLIE
SVKRUSCHI
KAZINDBLRURYESAARGUKRPANECUMEXCOLPER
Intentional founders 5 years later Intentional founders directly after studies
%

International GUESSS Report 2016
7
2 Influencing Factors
2.1 Field of Study
Entrepreneurial intentions clearly differ depending on field of study. Interestingly, science of art students have the strongest ones, which might be due to the specific job profiles in this field (e.g., working as an independent freelancer).
Figure 4: Entrepreneurial intentions depending on field of study
To compare countries without a potential field of study-related bias we now only look at “Law & Economics (incl. business sciences)” students (labeled LEBS) because they constitute the largest student group in our sample. We find obvious differences between countries when assessing the share of intentional founders 5 years after completion of studies.
The pattern found above is largely confirmed: the share of intentional founders is highest in developing countries (especially in Latin American countries), whereby industrialized countries tend to exhibit the lowest shares.
4.8
6.8
6.2
6.2
9.5
8.8
9.1
10.5
15.3
23.6
25.4
29.3
31.6
37.8
38.2
41.6
44.6
45.6
0.0 5.0 10.0 15.0 20.0 25.0 30.0 35.0 40.0 45.0 50.0
Mathematics and natural sciences
Arts / Humanities (e.g., linguistics, culturalstudies, religion, philosophy, history)
Social sciences (e.g., psychology, politics,educational science)
Human medicine / health sciences
Other
AVERAGE
Engineering (incl. computer sciences andarchitecture)
Law & Economics (incl. business sciences)
Science of art (e.g., art, design, dramatics, music)
Intentional founders 5 years later Intentional founders directly after studies
%

International GUESSS Report 2016
8
Figure 5: Intentional founders (LEBS students) 5 years after studies across countries
11.9
18.7
19.9
22.7
24.3
25.0
28.6
29.1
29.7
30.2
31.4
32.1
33.9
34.9
35.0
35.2
35.7
35.8
37.1
37.2
37.3
37.5
38.5
38.8
38.9
39.2
39.4
41.6
44.5
44.6
44.6
44.9
45.5
45.7
48.3
54.5
54.9
55.5
57.6
58.2
58.9
60.0
61.5
63.4
64.1
66.1
68.0
68.7
69.2
70.8
71.1
0.0 10.0 20.0 30.0 40.0 50.0 60.0 70.0 80.0
JPN
GER
CHN
AUT
SUI
NOR
ALB
SWE
CZE
KOR
POR
ITA
ENG
IRL
MYS
GRE
FRA
ESP
PAK
HUN
AUS
BEL
BRA
CAN
SLO
MAR
FIN
USA
POL
Average
LTU
HRV
LUX
MKD
LIE
IND
SVK
RUS
CHI
EST
URY
BLR
ESA
KAZ
ARG
UKR
PAN
ECU
MEX
PER
COL
%

International GUESSS Report 2016
9
2.2 Gender
Both directly after studies and 5 years later, the share of intentional founders is considerably smaller among females than among males. Interestingly, the relative difference directly after studies is 36.6%; referring to 5 years later, it decreases to 10.8%.
Figure 6: Gender differences in entrepreneurial intentions
Splitting the analysis by field of study and time horizon reveals that the share of intentional founders is always lower among females; however, the “gender gap” varies considerably.
Figure 7: Gender differences in entrepreneurial intentions across fields of study and time
Comparing the shares of intentional female and male founders (5 years after studies) among LEBS students across countries reveals important differences. Interestingly, females exhibit higher values than males in some countries.3
3 India, Malaysia, and Norway have been excluded because there were less than 10 cases per gender.
7.1
36.4
11.2
40.8
0 5 10 15 20 25 30 35 40 45
Intentional founders (directly)
Intentional founders (5 years later)Male
Female
5.7
8.3
5.1
8.2
3.1
12.6
5.1
9.8
9.6
9.0
14.2
6.9
21.8
9.6
25.4
41.4
30.3
43.3
21.9
45.5
28.3
25.5
41.8
35.1
46.8
25.9
46.6
32.4
0.0 10.0 20.0 30.0 40.0 50.0
Arts / Humanities (e.g., linguistics, culturalstudies, religion, philosophy, history)
Engineering (incl. computer sciences andarchitecture)
Human medicine / health sciences
Law & Economics (incl. businesssciences)
Mathematics and natural sciences
Science of art (e.g., art, design, dramatics,music)
Social sciences (e.g., psychology, politics,educational science)
Males (5 years later)
Females (5 years later)
Males (directly)
Females (directly)
%
%

International GUESSS Report 2016
10
Figure 8: Gender gap among LEBS intentional founders across countries (5 years after studies)
9.2
16.5
14.2
30.3
18.9
16.9
29.6
35.4
40.0
34.9
20.9
39.4
46.2
36.0
38.9
38.8
26.5
42.6
30.3
37.1
30.5
31.6
32.9
33.9
18.8
24.0
43.3
43.7
42.2
44.0
27.9
40.9
40.0
65.0
57.4
54.1
58.0
51.8
63.2
70.2
73.5
55.1
68.1
61.0
69.5
71.5
56.5
64.0
13.7
24.7
25.8
26.5
29.8
33.0
34.7
35.2
35.4
36.8
37.8
38.1
38.1
39.0
39.6
40.0
40.1
40.4
40.5
40.7
41.8
42.0
43.5
45.2
45.5
46.7
46.8
49.0
49.8
50.0
51.4
52.8
53.8
56.9
57.6
59.5
60.1
61.9
64.3
66.0
66.9
67.6
67.9
68.7
68.8
70.4
71.6
75.0
0.0 10.0 20.0 30.0 40.0 50.0 60.0 70.0 80.0
JPN
CHN
GER
SWE
SUI
AUT
POR
GRE
PAK
FRA
KOR
SLO
LTU
AUS
MAR
FIN
ITA
USA
ENG
BRA
IRL
ESP
BEL
HUN
ALB
CZE
Average
HRV
POL
MKD
CAN
LIE
LUX
ESA
CHI
RUS
URY
SVK
KAZ
ECU
PER
EST
PAN
ARG
MEX
COL
BLR
UKR
Males Females
%
International GUESSS Report 2016
11
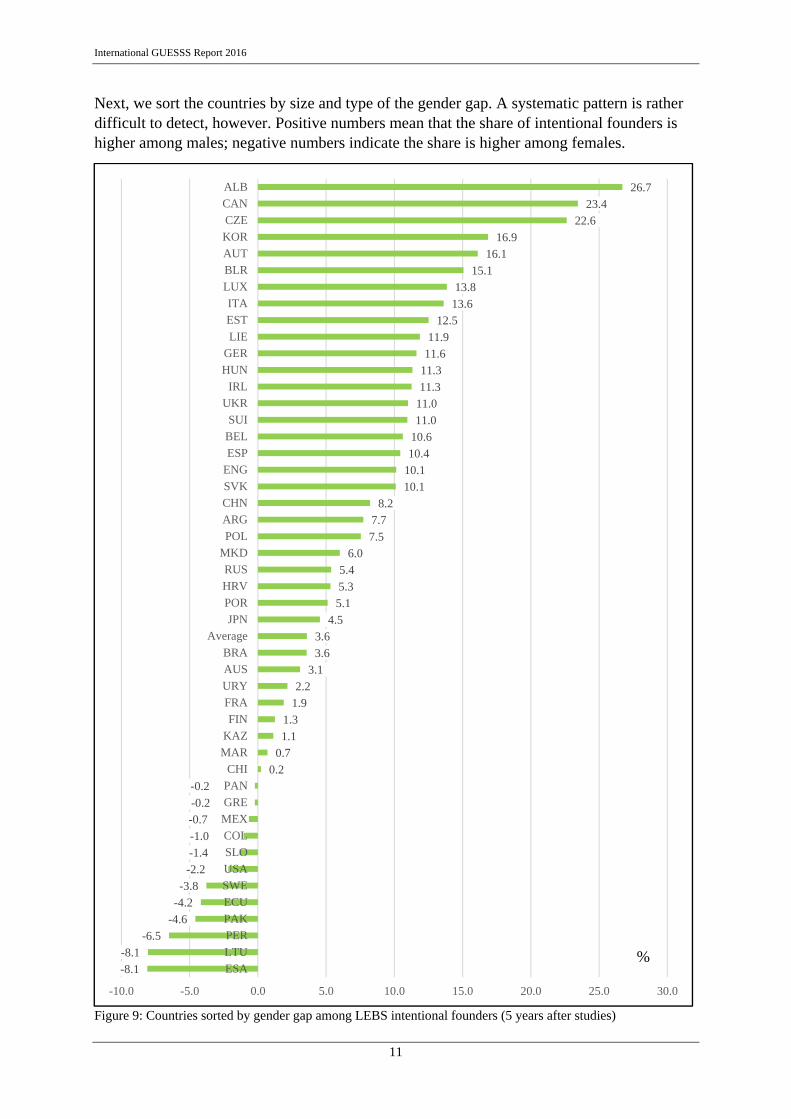
Next, we sort the countries by size and type of the gender gap. A systematic pattern is rather difficult to detect, however. Positive numbers mean that the share of intentional founders is higher among males; negative numbers indicate the share is higher among females.
Figure 9: Countries sorted by gender gap among LEBS intentional founders (5 years after studies)
-8.1
-8.1
-6.5
-4.6
-4.2
-3.8
-2.2
-1.4
-1.0
-0.7
-0.2
-0.2
0.2
0.7
1.1
1.3
1.9
2.2
3.1
3.6
3.6
4.5
5.1
5.3
5.4
6.0
7.5
7.7
8.2
10.1
10.1
10.4
10.6
11.0
11.0
11.3
11.3
11.6
11.9
12.5
13.6
13.8
15.1
16.1
16.9
22.6
23.4
26.7
-10.0 -5.0 0.0 5.0 10.0 15.0 20.0 25.0 30.0
ESA
LTU
PER
PAK
ECU
SWE
USA
SLO
COL
MEX
GRE
PAN
CHI
MAR
KAZ
FIN
FRA
URY
AUS
BRA
Average
JPN
POR
HRV
RUS
MKD
POL
ARG
CHN
SVK
ENG
ESP
BEL
SUI
UKR
IRL
HUN
GER
LIE
EST
ITA
LUX
BLR
AUT
KOR
CZE
CAN
ALB
%

International GUESSS Report 2016
12
2.3 The University Context
How is student entrepreneurship affected by universities? To start with, more than half of all students in our sample have not attended any course on entrepreneurship yet. The others, however, seem to be quite intensively involved in entrepreneurship-related university offerings.
Figure 10: Attendance of entrepreneurship offerings
To check for the effect of entrepreneurship education, we calculated the share of intentional founders (5 years after studies) among students who ticked the respective options (multiple answers were possible).
The more intensive students’ involvement in entrepreneurship classes and offerings, the stronger their entrepreneurial intentions. While we cannot exclude reverse causality (meaning that students with entrepreneurial intentions decide to attend entrepreneurship classes), this nevertheless points to the positive and important role of universities in forming students’ entrepreneurial intentions.
Figure 11: Share of intentional founders (5 years after studies) depending on entrepreneurship education
55.4
23.2
22.4
7.2
0 10 20 30 40 50 60
I have not attended a course on entrepreneurship so far.
I have attended at least one entrepreneurship course aselective.
I have attended at least one entrepreneurship course ascompulsory part of my studies.
I am studying in a specific program on entrepreneurship.
32.3
45.8
44.6
49.4
0 10 20 30 40 50 60
I have not attended a course on entrepreneurship so far.
I have attended at least one entrepreneurship course aselective.
I have attended at least one entrepreneurship course ascompulsory part of my studies.
I am studying in a specific program onentrepreneurship.
%
%

International GUESSS Report 2016
13
2.4 Personal Skills
Students were asked to indicate their level of competence in performing several different entrepreneurship-related tasks (1=very low competence, 7=very high competence).
Comparing intentional founders and intentional employees reveals that intentional founders indeed feel more confident in performing all of these tasks, in particular when it comes to identifying new opportunities and successfully managing a firm. Thus, building up these skills seems to be an appropriate way to enhance students’ entrepreneurial intentions.
Figure 12: Skills among intentional founders and intentional employees (1-7 scale)
2.5 The Family Context
Scholars have long been interested in the question whether children of entrepreneurs have a higher propensity to become entrepreneurs themselves. 17.5% of all students have entrepreneurial parents (21’386), meaning that they indicated that at least one parent (father or mother) is self-employed and is a majority owner of a private business.4
Comparing the shares of intentional founders among children with and without entrepreneurial parents leads us to confirm the notion that there is a positive relationship between parents’ and children’s entrepreneurship (see the figure below).
The relative difference in entrepreneurial intentions is 8.5% (5 years after studies) and 33.6% (directly after studies). This means that the positive effect of parents’ entrepreneurship is stronger in the shorter than in the longer run.
4 We use both of these criteria to exclude cases where parents are self-employed but not business owners per se
(e.g., independent journalists, artists, doctors, lawyers, etc.).
3.99
4
4.37
4.18
4.26
4.28
4.84
4.91
5.06
5.11
5.13
5.17
5.36
5.6
0 1 2 3 4 5 6
Creating new products and services
Identifying new business opportunities
Building up a professional network
Managing innovation within a firm
Commercializing a new idea or development
Successfully managing a business
Being a leader and communicator
Founder Employee

International GUESSS Report 2016
14
Figure 13: Share of intentional founders depending on parents‘ entrepreneurship
How does this effect depend on the parents’ performance as entrepreneurs? Students with entrepreneurial parents were asked to assess their parents’ firm’s performance compared to its competitors over the last three years regarding sales growth, market share growth, profit growth, job creation, and innovativeness (from 1=much worse to 7=much better).
We took the average of the five indicated values and compared the share of intentional founders in different performance groups. Entrepreneurial intentions increase significantly when the performance of the parents’ firm is assessed with better than 4 (i.e., better than equal to competitors). Interestingly, it does not make too much of a difference for entrepreneurial intentions whether the performance is only slightly or considerably below 4.
As a whole, these findings demonstrate the crucial relevance of parents as entrepreneurial role models.
Figure 14: Share of intentional founders and parents‘ entrepreneurial performance (in ranges)
10.4
41.1
8.5
37.6
0.0 5.0 10.0 15.0 20.0 25.0 30.0 35.0 40.0 45.0
Directly after studies
5 years after studies
No entrepreneurial parents Entrepreneurial parents
37.8
38.4
38.8
43.4
50.0
52.4
0.0 10.0 20.0 30.0 40.0 50.0 60.0
1-2
>2-3
>3-4
>4-5
>5-6
>6-7
%
%

International GUESSS Report 2016
15
3 Entrepreneurial Intentions Across Time
How have entrepreneurial intentions developed over time? We compared data from the three previous GUESSS editions in 2011, 2013/2014, and 2016 by using only those 18 countries which participated in all three data collection waves.5
We see that entrepreneurial intentions (5 years after studies) have decreased quite considerably between 2011 and 2013/2014 (from 34.8% to 29.0%, which corresponds to a relative decrease by 16.7%). Afterwards, a slight increase can be observed (to 30.1%, a relative increase by 3.7%). However, the level of 2011 has not been reached again yet.
Figure 15: Career choice intentions in groups across time
A reason for the decline between 2011 and 2013/2014 could be that the overall economic environment in many countries has been more favorable in 2013/2014 (Sieger et al. 2014). It has thus been easier for students in 2013/2014 to find attractive job opportunities in the regular job market. Also, more and better entrepreneurship education offerings might have led to “less quantity but more quality”: students get better insights into what it actually means to become an entrepreneur, and some might then consciously choose not to create a new business; those who do intend to do so, however, are better prepared and motivated.
The slight increase between 2013/2014 and 2016, in turn, might be due to various factors like again changing economic conditions, raising awareness and appreciation of entrepreneurship in many countries, and so forth. Clearly, more research is necessary here.
In the 18 investigated countries, there are very different patterns of increasing and decreasing shares of intentional founders that call for further in-depth investigation on the country level.
5 Argentina, Austria, Belgium, Brazil, England, Estonia, Finland, France, Germany, Greece, Hungary, Japan,
Liechtenstein, Luxembourg, Mexico, Portugal, Russia, and Switzerland. 2011: 73’442 cases; 2013/2014: 54’394 cases; 2016: 54’204 cases. The number and types of participating universities within each country may vary, as does the number of responding students per university and country. However, the GUESSS country teams remained stable, so we do not assume that there is a systematic variation with regard to the data collection procedure and in particular with regard to the university recruitment strategy. Thus, we believe that our longitudinal findings are reliable and valid. Nevertheless, they have to be interpreted with great care.
12.2
14.2
18.4
3.8
4.2
9.2
54.0
52.6
37.6
30.1
29.0
34.8
0.0 10.0 20.0 30.0 40.0 50.0 60.0
2016
2013
2011
Founder
Employee
Successor
Other / Do not know yet
%

International GUESSS Report 2016
16
Figure 16: Shares of intentional founders (5 years after studies) across countries and time
21.1
51.3
29.2
65.9
37.8
45.6
11.7
33.0
32.7
17.0
36.1
30.8
37.5
29.0
37.4
29.6
22.5
61.6
17.7
52.6
35.7
66.6
28.8
41.4
10.4
35.4
27.0
17.6
27.7
24.7
36.2
33.5
33.5
33.3
18.4
63.2
27.2
47.1
32.1
60.4
28.2
41.4
30.7
37.5
27.1
24.7
36.7
30.3
36.1
39.7
39.1
33.0
28.6
53.5
0.0 10.0 20.0 30.0 40.0 50.0 60.0 70.0
SUI
RUS
POR
MEX
LUX
LIE
JPN
HUN
GRE
GER
FRA
FIN
EST
ENG
BRA
BEL
AUT
ARG
2011
2013
2016
%

International GUESSS Report 2016
17
4 Nascent Entrepreneurs
4.1 Prevalence
GUESSS is also interested in students who are already in the process of creating a business (nascent entrepreneurs). To identify them, all students were asked: “Are you currently trying to start your own business / to become self-employed?” 26’807 students answered with “yes” (21.9%). The share of nascent entrepreneurs per country is shown below.6
Figure 17: Share of nascent entrepreneurs per country
6 Norway has been excluded due to a too small number of nascent entrepreneurs (<10).
6.36.97.1
8.18.7
9.69.910.210.510.5
12.812.913.3
15.116.216.917.017.518.318.619.0
20.120.520.820.9
21.922.222.622.9
25.826.0
27.127.7
29.130.1
32.032.1
33.333.6
34.536.436.637.137.1
38.239.7
42.856.1
56.959.5
0.0 10.0 20.0 30.0 40.0 50.0 60.0 70.0
SWEGERSUI
AUTITABELESP
HRVPORIRLJPN
LTUFRAENGGRESVKUSACANLUXAUSFINCHICZE
HUNSLO
AverageEST
URYBLR
MKDUKRRUSLIE
PANBRAMARPOLECUKORPERKAZARGESAALBCOLMEXPAKCHNMYSIND
%

International GUESSS Report 2016
18
As with entrepreneurial intentions, developing countries tend to be found at the top of the list; developed countries rather at the bottom.
4.2 The Planned New Ventures
Only around every sixth nascent entrepreneur wants to complete business creation within the next 1-6 months. Slightly more than half of all nascent entrepreneurs plan to do so within the next 18 months.
63.8% of the nascent entrepreneurs indicated that their business is planned to be their main occupation after completion of studies. 86% have not created a business before.
Figure 18: Time horizon of completing business creation (in months)
Looking at the industries where the new ventures will be active in, we see a very fragmented picture. Wholesale/ retail trade seems to be most attractive, with several others following closely.
Figure 19: Industry sectors of planned new ventures
15.3
19.6
18.7
46.4
1-6
7-12
13-18
19-24 or more
13.7
11.4
11.3
10.2
8.5
7.5
7.1
6.5
6.2
5.8
5.1
3.8
2.8 Trade (wholesale/retail)
Other
Advertising / Design / Marketing
Information technology (IT) andcommunication (incl. software & IT services)Tourism and leisure
Consulting (HR, law, management, tax)
Architecture and Engineering
Manufacturing
Human health and social work activities
Education and training
Financial services (incl. banking, insurance,investment, real estate)Other services (e.g., transportation)
Construction
%
%

International GUESSS Report 2016
19
To assess how far the nascent entrepreneurs have already progressed in the founding process, they were asked to indicate which so-called “gestation activities” they had already executed (multiple answers possible). As shown below, most nascent entrepreneurs seem to be in quite early stages of the founding process.
Figure 20: Gestation activities of nascent entrepreneurs
New venture creation more and more happens in teams; this is also visible in our sample where not even every fifth nascent entrepreneur indicated that he or she will create the business alone. Most common are one or two co-founders.
Figure 21: Number of planned co-founders
Where do the nascent entrepreneurs have their business idea from? Good news for universities is that in most cases, the idea was developed in the university context. Taken together, university studies, discussions with other students, and university-related projects are frequently mentioned (multiple answers possible).
5.3
6.6
10.8
14.2
14.4
15.5
20.1
25.2
30.5
35.4
51.3
0 10 20 30 40 50 60
Applied for a patent, copyright or trademark
Registered the business
Sold product or service
Purchased material, equipment or machinery for the business
Started marketing or promotion efforts
Attempted to obtain external funding
Nothing of the above done so far
Started product/service development
Written a business plan
Discussed product or business idea with potential customers
Collected information about markets or competitors
18.6
27.8
28
15.9
9.6
0 co-founders
1 co-founder
2 co-founders
3 co-founders
>3 co-founders
%
%

International GUESSS Report 2016
20
Figure 22: Origins of ideas of nascent entrepreneurs
4.3 The Founder Social Identities of Nascent Entrepreneurs
What are the motives and goals of the nascent entrepreneurs, meaning why and for what purpose do they create their business? This will crucially affect the new ventures’ behavior for instance in terms of products and services offered, customer segments served, innovativeness, growth, and performance.
To assess this, we refer to three main types of founders that have been identified according to their respective “social identity” (Fauchart and Gruber 2011; Sieger, Gruber, Fauchart and Zellweger 2016): Darwinians, Communitarians, and Missionaries.
Darwinians are generally motivated by self-interest, want to be evaluated in terms of being a competent professional, and see competitors as the primary frame of reference. Their firms thus resemble a classic profit-maximizing and performance-oriented business.
Communitarians create a business out of mutual concern for the interests of known others, they want to be true to similar others, and see a specific group as frame of reference. An example is an entrepreneur whose business develops new skiing technology to enhance the skiing experience of fellow ski drivers.
Missionaries, in turn, want the business to advance a cause for unknown others, they want to contribute to make the world a better place, and see society-at-large as frame of reference. These firms often follow a political or ideological mission such as curing hunger or helping immigrants to find jobs.
In addition, “hybrid” identities may exist, meaning that founders exhibit two or more identities at the same time. We analyzed the share of Darwinians, Communitarians, Missionaries, and hybrids among the nascent entrepreneurs in the different countries by using a recently established 15-item measurement instrument (Sieger et al. 2016).7
7 For the main identity types we used “pure identities”. Respondents were regarded as having a “pure identity”
when their agreement to all five items that measure one specific identity was at 5 or higher (on a 1-7 scale), with no such agreement to other identity types. Hybrids are respondents who exhibit the corresponding “>5” agreement for all items that belong to the same identity type for at least two different identity types. This logic has been adopted from Fauchart and Gruber (2011); see also Sieger et al. (2016). The gap to 100 percent is due to founders who neither exhibit a pure identity nor a hybrid identity.
9.3
13.0
13.2
13.8
16.9
18.3
22.2
25.7
31.5
36.9
0.0 5.0 10.0 15.0 20.0 25.0 30.0 35.0 40.0
Other / previous self-employment
Other
Research project at the university
Media (television, internet, etc.)
Friends outside the university
Discussion with other students
Family members
Work activity outside the university
Hobby or recreational pastime
University studies
%

International GUESSS Report 2016
21
We excluded countries with less than 50 nascent entrepreneurs to improve the validity and reliability of our findings.8 The two figures below show the results sorted by the total percentage of identified identities.
Figure 23: Founder social identities among nascent entrepreneurs (part 1)
Interestingly, most of the countries where the share of «Pure Darwinians» is higher than 10 percent are Eastern European countries (Slovenia, Hungary, Poland, and Slovakia).
A double-digit share of «Pure Communitarians» can only be found in Japan; for «Pure Missionaries», this applies to Slovenia, France, Switzerland, and South Korea.
8 Excluded: Albania, India, Liechtenstein, Luxembourg, Macedonia, Norway, Sweden, and Ukraine.
6.8
7.6
5.8
8.5
6.1
9.5
6.7
3.0
4.3
7.7
4.4
7.1
7.7
5.0
14.9
2.9
8.5
8.9
8.1
19.1
12.0
6.9
12.5
2.4
5.7
3.4
0.6
2.1
1.1
6.7
0.9
3.3
4.7
2.3
4.7
3.6
3.9
1.4
0.4
2.3
3.2
3.2
1.9
6.0
1.2
2.5
5.4
9.5
7.0
9.1
6.2
10.5
8.3
4.9
7.6
6.3
4.8
5.9
9.8
4.8
8.1
4.7
8.7
7.6
6.3
5.0
4.8
6.0
10.0
3.1
4.8
2.3
2.4
3.4
1.1
1.7
3.7
1.1
3.9
3.3
7.1
3.6
7.1
4.1
2.0
4.6
3.8
4.3
3.2
7.2
3.6
5.8
7.2
7.6
11.5
10.4
9.1
10.5
3.3
7.2
12.0
7.1
12.1
7.1
7.6
6.4
6.8
12.3
8.7
7.6
10.2
12.3
5.9
8.1
5.8
4.8
8.6
5.0
6.1
7.1
6.3
5.0
4.8
7.6
8.8
2.5
9.4
8.4
5.5
5.4
5.8
6.9
10.8
5.0
2.8
9.7
8.1
7.5
22.4
9.5
18.3
16.5
20.6
15.8
23.3
30.8
20.7
18.9
28.4
17.6
18.7
26.9
18.9
33.8
22.4
20.9
26.0
19.7
19.8
35.5
25.8
0.0 10.0 20.0 30.0 40.0 50.0 60.0 70.0 80.0
AVERAGE
GRE
MAR
BLR
CHI
FRA
USA
PAN
KAZ
POR
MEX
IRL
ESP
AUS
BEL
PER
ITA
HRV
BRA
POL
HUN
PAK
SLO
Pure Darwinians Pure Communitarians Pure Missionaries DC Hybrids
DM Hybrids CM Hybrids DCM Hybrids
%

International GUESSS Report 2016
22
Generally, the share of DCM Hybrids (meaning founders who exhibit all three identities at the same time) is relatively high. In some countries, around half of all founders where any identity can be identified exhibit a DCM Hybrid identity (e.g., Peru, Panama, and Colombia): In others, the clear majority of all founders are DCM Hybrids (e.g., Ecuador, El Salvador, Canada, China, and Malaysia). Hence, DCM Hybrids seem to be particularly prevalent in Latin American and Asian countries (with Canada as the exception).
Clearly, these insights just scratch the surface of potentially unique and novel insights. More in-depth research is necessary here.
Figure 24: Founder social identities among nascent entrepreneurs (part 2)
0.0
5.2
0.9
9.1
5.9
5.7
6.9
12.5
8.0
4.7
8.3
1.9
7.1
2.4
8.2
5.6
4.9
6.7
10.4
2.4
6.8
0.0
2.1
1.1
3.6
3.0
2.5
6.2
2.2
2.3
10.0
2.8
1.9
1.9
0.6
6.1
4.9
1.4
3.8
2.8
0.8
2.4
0.0
3.9
1.0
3.6
7.9
11.5
6.5
5.3
6.2
8.4
6.7
0.0
7.5
2.9
8.9
3.7
3.1
13.0
9.8
2.4
5.4
0.0
3.4
1.8
1.8
4.0
2.4
2.9
2.0
2.4
5.8
3.9
9.6
2.0
2.0
3.7
1.9
2.6
3.4
4.4
1.8
3.1
2.6
3.9
1.0
3.6
1.0
6.2
5.6
5.4
5.4
4.7
6.7
1.9
9.1
6.5
3.7
3.7
9.0
5.8
8.5
4.8
7.2
3.8
4.3
1.1
3.6
5.9
5.3
7.8
3.6
4.1
3.7
4.4
1.9
5.4
3.1
7.6
8.0
3.8
9.1
2.5
3.1
4.8
23.1
9.0
26.0
9.1
11.9
9.6
7.5
13.9
16.6
7.9
12.8
28.8
14.1
29.8
9.7
21.0
24.6
8.2
11.4
35.0
22.4
0.0 10.0 20.0 30.0 40.0 50.0 60.0
MYS
CZE
CHN
LTU
FIN
KOR
AUT
SVK
RUS
JPN
EST
CAN
ARG
ESA
GER
ENG
COL
SUI
URY
ECU
AVERAGE
Pure Darwinians Pure Communitarians Pure Missionaries DC Hybrids
DM Hybrids CM Hybrids DCM Hybrids
%

International GUESSS Report 2016
23
5 Active Entrepreneurs
5.1 Prevalence
Active entrepreneurs are students who have completed firm creation and are actually running their own business. We identified them with the question “Are you already running your own business / are you already self-employed?”. 10’820 students answered with yes (8.8%).
Also here, their prevalence varies across countries, with the same “developed versus developing country" pattern as with nascent and intentional founders.9
Figure 25: Share of active entrepreneurs across countries
9 Due to a too low number of cases (<10), Luxembourg, Norway, India, and Ukraine were excluded.
1.33.03.33.43.53.73.83.9
4.64.84.9
5.65.85.86.26.66.86.97.07.07.2
7.77.88.08.38.38.68.8
9.610.110.310.4
11.011.3
12.712.913.0
14.315.7
16.717.5
18.119.2
20.025.7
30.535.0
0.0 5.0 10.0 15.0 20.0 25.0 30.0 35.0 40.0
JPNBELHRVESPSUIIRL
POLGERFRAPORITA
HUNSWEAUTGREENGSLOSVKBLR
MARPAKLTUAUSRUSCHI
KAZBRA
AVERAGEUSACZEKORCANURYPANEST
MKDPERFINLIE
MEXECUESACOLARGALBCHNMYS
%

International GUESSS Report 2016
24
5.2 The Existing Businesses
The average age of the existing ventures is around 4 years. Most of the businesses have been created in 2016 (see below). 55% of the active entrepreneurs plan that their firm will be their main occupation after graduation, which signals that these firms are not “fun” or “pet” projects in the majority of cases.
Figure 26: Year of foundation of the existing firms
While 18.6% of the nascent entrepreneurs indicated that they want to create their business without partners, 28.7% of the active entrepreneurs have actually created the firm without co-founders. Thus, some potential co-founders tend to drop out during the founding process.
Figure 27: Number of co-founders among active entrepreneurs
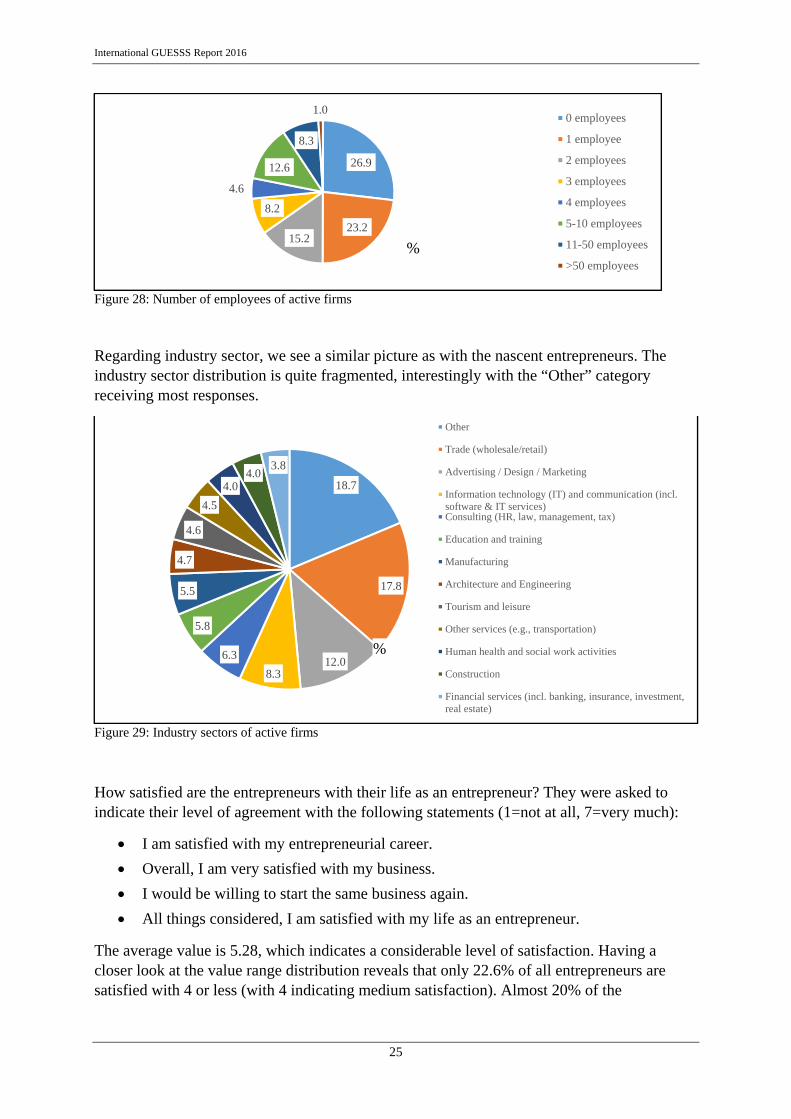
On average, the firms have 6.3 employees (full-time equivalents); only 26.9% do not have any employees at all. These numbers illustrate the economic and also social impact that students’ new ventures are obviously making.
7.1
1.2 2.8
4.1
8
6.2
8.3
14.2
23.3
24.8
Earlier
2008
2009
2010
2011
2012
2013
2014
2015
2016
28.7
24.5
24.7
12.8
9.30 co-founders
1 co-founder
2 co-founders
3 co-founders
>3 co-founders
%
%
International GUESSS Report 2016
25
Figure 28: Number of employees of active firms
Regarding industry sector, we see a similar picture as with the nascent entrepreneurs. The industry sector distribution is quite fragmented, interestingly with the “Other” category receiving most responses.
Figure 29: Industry sectors of active firms
How satisfied are the entrepreneurs with their life as an entrepreneur? They were asked to indicate their level of agreement with the following statements (1=not at all, 7=very much):
I am satisfied with my entrepreneurial career.
Overall, I am very satisfied with my business.
I would be willing to start the same business again.
All things considered, I am satisfied with my life as an entrepreneur.
The average value is 5.28, which indicates a considerable level of satisfaction. Having a closer look at the value range distribution reveals that only 22.6% of all entrepreneurs are satisfied with 4 or less (with 4 indicating medium satisfaction). Almost 20% of the
26.9
23.215.2
8.2
4.6
12.6
8.3
1.00 employees
1 employee
2 employees
3 employees
4 employees
5-10 employees
11-50 employees
>50 employees
18.7
17.8
12.08.3
6.3
5.8
5.5
4.7
4.6
4.5
4.04.0
3.8
Other
Trade (wholesale/retail)
Advertising / Design / Marketing
Information technology (IT) and communication (incl.software & IT services)Consulting (HR, law, management, tax)
Education and training
Manufacturing
Architecture and Engineering
Tourism and leisure
Other services (e.g., transportation)
Human health and social work activities
Construction
Financial services (incl. banking, insurance, investment,real estate)
%
%

International GUESSS Report 2016
26
entrepreneurs exhibit the highest possible level of satisfaction. As a whole, we regard this as good news and encouragement for potential entrepreneurs.
Figure 30: Satisfaction of active entrepreneurs in ranges
5.3 The Founder Social Identities of Active Entrepreneurs
Also for the active entrepreneurs we assessed the prevalence of the different social identities of their founders. As we have much less active entrepreneurs than nascent entrepreneurs, more countries had to be excluded due to having less than 50 valid cases.10
We see that the seven countries with the highest total share of identified identities are all Latin American countries. In most of them, the share of DCM Hybrids is relatively high.
While double-digit shares of “Pure Darwinians” can be found in many countries, double-digit “Pure Communitarians” can only be observed in Hungary and Switzerland. “Pure Missionaries” with more than 10% share can be found in several countries (e.g., Argentina, Portugal, Italy, and Uruguay). China exhibits an interesting identity profile because the vast majority of all active entrepreneurs where an identity can be identified are DCM Hybrids.
Also here, there is a pressing need for further research about the determinants and outcomes of founder social identity across countries and cultures.
10 The excluded countries are Belgium, Canada, France, Greece, India, Ireland, Japan, Kazakhstan, Liechtenstein,
Lithuania, Luxembourg, Macedonia, Malaysia, Norway, Pakistan, Slovenia, Sweden, Ukraine, and the US.
3.6 5.2
13.8
19.5
26.1
13.3
18.4Range 1-2
Range >2-3
Range >3-4
Range >4-5
Range >5-6
Range >6-<7
Exactly 7%

International GUESSS Report 2016
27
Figure 31: Shares of founder social identities among active entrepreneurs
7.0
13.2
14.8
8.7
10.1
14.0
7.0
9.6
9.6
11.9
17.6
1.5
7.5
11.0
10.6
20.4
23.0
8.1
12.9
9.0
11.9
11.6
11.0
11.8
6.0
11.6
5.7
6.5
5.2
8.4
11.4
7.5
3.9
5.2
3.9
6.0
6.0
2.8
4.8
12.5
2.8
10.3
0.8
4.9
2.6
4.2
3.7
3.5
7.6
4.5
3.5
7.1
3.8
5.3
2.0
1.3
4.0
1.6
1.8
1.3
0.0
2.3
6.0
5.3
6.1
8.7
7.4
12.0
4.2
7.8
12.5
3.5
3.4
2.9
13.4
11.0
10.6
6.9
5.3
4.3
12.1
6.3
7.1
8.8
9.1
9.8
4.6
10.1
5.4
5.4
3.5
5.9
4.5
1.3
2.6
3.5
1.9
0.5
0.0
4.2
3.3
0.0
4.2
3.4
1.7
3.7
4.5
2.3
5.3
6.6
1.1
3.6
3.4
3.6
4.8
4.4
7.8
2.3
3.4
3.8
5.4
4.0
7.9
4.6
0.8
2.6
3.5
2.9
0.5
0.0
2.8
5.4
3.8
7.0
5.2
2.9
8.2
6.5
5.6
9.0
4.4
7.0
7.6
7.2
8.7
8.4
9.1
11.8
10.0
9.7
10.3
7.7
8.5
10.9
12.2
4.1
0.0
1.7
2.9
9.7
0.0
4.2
3.0
2.9
2.8
6.6
2.9
6.3
7.1
8.3
1.6
4.4
8.6
5.8
5.1
8.7
6.8
6.0
3.9
4.0
8.8
6.0
5.4
4.2
3.5
6.5
2.6
3.9
1.7
7.8
4.6
10.0
16.9
9.9
4.8
16.8
9.0
43.3
12.7
14.3
16.2
11.0
10.6
22.7
13.4
25.9
14.7
18.9
18.7
17.6
37.7
19.1
36.9
41.1
46.6
36.6
37.7
0.0 10.0 20.0 30.0 40.0 50.0 60.0 70.0 80.0 90.0
GER
FIN
CZE
EST
AUT
BLR
ENG
RUS
SUI
MAR
HUN
CHN
KOR
URY
ITA
POL
SVK
AUS
POR
Average
ESP
CHI
BRA
HRV
ESA
ARG
PAN
PER
ECU
MEX
COL
Pure Darwinians Pure Communitarians Pure Missionaries DC Hybrids
DM Hybrids CM Hybrids DCM Hybrids
%

International GUESSS Report 2016
28
6 Recommendations
Based on the above findings, we derive a few key recommendations for different stakeholders.
Public and private institutions should further enhance and improve entrepreneurship education offerings. The overall aim should be to sensitize as many students as possible for entrepreneurship. These students should then make a conscious decision whether to become entrepreneurs or not. Entrepreneurship education has to provide them with the tools, skills, and capabilities not only to become entrepreneurs but to become successful entrepreneurs.
Many students want to gain professional experience before creating a business. This can be a challenge as they might become “locked in” in the corporate world. Thus, becoming an entrepreneur should be facilitated as good as possible by policy makers and regulatory authorities, such as by reducing administrative and legal barriers, facilitating access to financial resources, and supporting networking opportunities in general. Otherwise the opportunity costs of leaving organizational employment will become too high.
Gender is an important issue. Policy makers should focus even more on enabling women to start entrepreneurial careers, be it through tailored offerings like networking events, specific mentoring and counseling, or facilitating the combination of family and entrepreneurship.
Parents, and particularly entrepreneurial parents, have to be aware that they are important role models. They should not paint a too rosy or too bad picture of being an entrepreneur (particularly when the business is not running well). A realistic picture is most helpful so that offspring can decide themselves whether they want to become entrepreneurs or not.
Most of the students intend to or have already created a business with partners. Finding the right co-founders is a key to success. Thus, it is imperative to help with this endeavor, for instance by providing co-founder matching platforms by universities or other institutions.
Universities in general play an essential and extremely important role. Their tasks are manifold, such as providing high-quality entrepreneurship courses, events like start-up evenings or business plan contests, and creating an entrepreneurial atmosphere. This is to sensitize students for entrepreneurship, to provide them with the necessary tools and skills, and to support them in their entrepreneurial activities also in the longer run. Universities should be aware of this role and should try to fulfill all the high expectations in these regards.
A truly important question is why or for what purpose a business is actually created. Students should be aware of their underlying motivational drivers (e.g., in terms of their founder social identity), and think and act accordingly.
Lastly, students should be aware that becoming an entrepreneur is not a “must”; but it is a very attractive and viable option that is worth considering. In addition, there are many ways of being an entrepreneur; examples are creating a business, taking over one (e.g., the parents’ one), or being a corporate entrepreneur inside an existing business.
To conclude, student entrepreneurship is an important and fascinating field that deserves further attention of scholars, practitioners, and policy makers in order to enhance and foster
the creation of successful new ventures.

International GUESSS Report 2016
29
7 GUESSS: Further Information
7.1 The Project
GUESSS (Global University Entrepreneurial Spirit Students´ Survey) has been founded at the Swiss Research Institute of Small Business and Entrepreneurship at the University of St.Gallen (KMU-HSG) in 2003. Its research focus is on students’ entrepreneurial intentions
and activities.
Since 2016, the GUESSS project is jointly organized by the University of St.Gallen
(Switzerland, KMU-HSG/CFB-HSG) and the University of Bern (Switzerland, IMU).
The GUESSS Project Manager is Prof. Dr. Philipp Sieger (University of Bern). The supervisory board consists of Prof. Urs Fueglistaller (University of St.Gallen), Prof. Thomas Zellweger (University of St.Gallen), Prof. Norris Krueger, and Dr. Frank Halter (University
of St.Gallen).
GUESSS is one of the largest entrepreneurship research projects in the world. With every data collection wave, GUESSS has grown and has become more internationally, culminating in the
7th edition in 2016 with 50 participating countries.
For every data collection wave, the GUESSS core team develops a comprehensive survey that meets the highest academic standards. The link to the online survey is then sent out to the different country teams (every participating country is represented by one responsible country team). These country teams then forward the survey invitation to their own students and to the
university partners they have recruited (who then also forward it to their respective students).
GUESSS data have been used for numerous studies, reports, practitioner-oriented articles, and
academic publications (e.g., in renowned journals such as JBV, ETP, SBE, and JSBM).
For more information about GUESSS, please visit http://www.guesssurvey.org or follow GUESSS on Research Gate (http://www.researchgate.net). Both on the GUESSS website and
on Research Gate, we will regularly post updates, news, reports, and other publications.
If you are interested in participating in the next GUESSS edition in 2018 or if you have any general questions, please contact Prof. Dr. Philipp Sieger directly
GUESSS 2016 was generously supported by Ernst & Young (EY) as the international project partner. We cordially thank EY for their support. Without it, GUESSS in the current form would not have been possible.

International GUESSS Report 2016
30
7.2 Country Teams of the 2016 Edition
# Country University Team Leader(s) 1 Albania / Kosovo (ALB) AAB College Malush Tullumi 2 Argentina (ARG) Austral University / IAE Business School Prof. Silvia Carbonell 3 Australia (AUS) Curtin University of Technology Prof. Paull Weber 4 Austria (AUT) Johannes Kepler University Linz Prof. Norbert Kailer 5 Belgium (BEL) Antwerp Management School Prof. Eddy Laveren 6 Belarus (BLR) Belarusian State University Dr. Radzivon Marozau 7 Brazil (BRA) UNINOVE - Universidade Nove de Julho Prof. Edmilson Lima 8 Canada (CAN) Concordia University Prof. Alexandra Dawson 9 Chile (CHI) Universidad Catolica del Norte Prof. Gianni Romaní 10 China (CHN) Shanghai Finance University Su Jing 11 Colombia (COL) Universidad EAFIT Prof. Claudia Alvarez 12 Croatia (CRO) University of Zadar Gabrijela Vidic 13 Czech Republic (CZE) Technical University of Liberec Prof. Klara Antlova 14 Ecuador (ECU) Universidad Católica de Santiago de Guayaquil Prof. Mariella Jácome Ortega 15 England (ENG) Kingston University Prof. Robert Blackburn 16 El Salvador Universidad Dr. Jose Matias Delgado Prof. Manuel Sifontes 17 Estonia (EST) Tallinn University of Technology Prof. Urve Venesaar 18 Finland (FIN) Lappeenranta University of Technology Prof. Timo Pihkala 19 France (FRA) EM Lyon Business School Prof. Alain Fayolle
20 Germany (GER) University of St.Gallen (CH) FH Fulda
Dr. Heiko Bergmann Prof. Stephan Golla
21 Greece (GRE) University of Macedonia Prof. Katerina Sarri
22 Hungary (HUN) Budapest Business School University of Miskolc
Dr. Szilveszter Farkas Andrea S. Gubik
23 India (IND) The Entrepreneurship School Sanjeeva Shivesh 24 Ireland (IRL) Dublin City University Dr. Eric Clinton 25 Italy (ITA) University of Bergamo Prof. Tommaso Minola 26 Japan (JAP) Hosei University Prof. Noriko Taji 27 Kazakhstan (KAZ) Turan University Prof. Olga Sudibor 28 Korea (KOR) Korea Entrepreneurship Foundation (KEF) Kim Jong Sung 29 Liechtenstein (LIE) University of Liechtenstein Prof. Dr. Urs Baldegger 30 Lithuania (LTU) Aleksandras Stulginskis University Virginija Kargyte 31 Luxembourg (LUX) Institut Universitaire International Luxembourg Prof. Pol Wagner 32 Malaysia (MAL) Universiti Malaysia Kelantan Prof. Raja Suzana Kasim 33 Macedonia (MAC) University American College Skopje Dr. Makedonka Dimitrova 34 Mexico (MEX) EGADE Business School Prof. José Ernesto Amorós 35 Morocco (MAR) Abdelmalek Essaâdi University Prof. Hassan Ezbalehe 36 Norway (NOR) Stord/Haugesund University College Prof. Marina Solesvik 37 Pakistan (PAK) Sukkur Institute of Business Administration Dr. Altaf Hussain Samo
38 Panama (PAN) Universidad de Panama Omaris Vergara Dr. Maria Angeles Frende
39 Peru (PER) Universidad Esan Prof. Jaime Serida 40 Poland (POL) Family Business Institute Poland Prof. Adrianna Lewandowska 41 Portugal (POR) Universidade de Lisboa Prof. Miguel Amaral 42 Russia (RUS) St.Petersburg University - GSOM Prof. Galina Shirokova 43 Slovakia (SVK) Comenius University Bratislava Dr. Marian Holienka 44 Slovenia (SLO) GEA College Prof. Katja Kraskovic
45 Spain (ESP) ESADE Business School Dr. Joan Batista-Foguet Dr. Maika Valencia
46 Sweden (SWE) University of Skövde Prof. Susanne Durst
47 Switzerland (SUI) University of Bern University of St.Gallen HEG Fribourg
Prof. Philipp Sieger Prof. Rico Baldegger
48 Ukraine (UKR) Stord/Haugesund University College Prof. Marina Solesvik 49 Uruguay (URY) Universidad Catolica del Uruguay Prof. Catherine Krauss
50 USA Stetson University University of Vermont (UVM)
Prof. Isabel Botero Prof. Erik Monsen
Table 1: List of country teams

International GUESSS Report 2016
31
7.3 Sample and Participants
7.3.1 Countries, Universities, and Respondents
Number Country (code) Number of universities Completed responses Valid percent 1 Albania (ALB) 6 70 0.1 2 Argentina (ARG) 45 2625 2.1 3 Australia (AUS) 18 2359 1.9 4 Austria (AUT) 51 3755 3.1 5 Belarus (BLR) 16 716 0.6 6 Belgium (BEL) 6 771 0.6 7 Brazil (BRA) 83 7417 6.1 8 Canada (CAN) 2 297 0.2 9 Chile (CHI) 32 6077 5.0 10 China (CHN) 97 3274 2.7 11 Colombia (COL) 13 3832 3.1 12 Croatia (HRV) 26 1555 1.3 13 Czech Republic (CZE) 10 1135 0.9 14 Ecuador (ECU) 5 8211 6.7 15 El Salvador (ESA) 14 4653 3.8 16 England (ENG) 16 1074 0.9 17 Estonia (EST) 25 811 0.7 18 Finland (FIN) 16 532 0.4 19 France (FRA) 16 714 0.6 20 Germany (GER) 50 15984 13.0 21 Greece (GRE) 12 649 0.5 22 Hungary (HUN) 23 5182 4.2 23 India (IND) 11 37 0.0 24 Ireland (IRL) 17 807 0.7 25 Italy (ITA) 39 4446 3.6 26 Japan (JPN) 25 1490 1.2 27 Kazakhstan (KAZ) 22 253 0.2 28 Korea (KOR) 52 2603 2.1 29 Liechtenstein (LIE) 2 159 0.1 30 Lithuania (LTU) 36 426 0.3 31 Luxembourg (LUX) 5 82 0.1 32 Macedonia (MKD) 3 124 0.1 33 Malaysia (MYS) 20 137 0.1 34 Mexico (MEX) 4 1207 1.0 35 Morocco (MAR) 11 2044 1.7 36 Norway (NOR) 4 41 0.0 37 Pakistan (PAK) 12 580 0.5 38 Panama (PAN) 5 3273 2.7 39 Peru (PER) 12 1297 1.1 40 Poland (POL) 58 6388 5.2 41 Portugal (POR) 11 4685 3.8 42 Russia (RUS) 34 4152 3.4 43 Slovakia (SVK) 17 3266 2.7 44 Slovenia (SLO) 5 575 0.5 45 Spain (ESP) 19 7373 6.0 46 Sweden (SWE) 10 606 0.5 47 Switzerland (SUI) 40 2943 2.4 48 Ukraine (UKR) 4 73 0.1 49 Uruguay (URY) 7 1396 1.1 50 USA (USA) 15 353 0.3 TOTAL 1082 122509 100
Table 2: Countries, universities, and respondents11
11 It is becoming more difficult with every edition to calculate a reliable response rate because it is extremely hard to know how many students
actually received a personal invitation to participate. This is because students are less and less often contacted via university email (which is also not always used regularly). Rather, the GUESSS survey is increasingly announced on Facebook pages, websites, learning portals, newsletters, blogs, and so on. Using the number of enrolled students at each university is also not appropriate as participating universities often did not contact the whole student population but only subgroups (students of specific faculties, departments, study fields, or classes). Using reliable data of a subset of the total university population in the 2016 GUESSS sample, our calculations show a response rate of 5%. This is in the same range as in previous GUESSS editions in 2011 and 2013/2014 (Sieger, Fueglistaller and Zellweger 2011; Sieger et al. 2014) and constitutes the most accurate possible estimation. Still, it is very conservative and thus likely an underestimation.

International GUESSS Report 2016
32
7.3.2 Student Demographics
The average age of the students in our sample is 24 years. The majority of students (52.4%) is between 21 and 25 years old. 58.5% are female. 79.2% are undergraduate (Bachelor) students. These numbers are very similar to those in previous GUESSS editions.
The main study fields are shown in the figure below. The distribution is again similar to the GUESSS editions in 2013/14 and 2011.12
Figure 32: Main study fields of the respondents
8 References
Fauchart, E., & Gruber, M. (2011). Darwinians, Communitarians, and Missionaries: The Role
of Founder Identity in Entrepreneurship. Academy of Management Journal, 54(5), 935-957.
Sieger, P., Fueglistaller, U., & Zellweger, T. (2011). Entrepreneurial Intentions and Activities of Students across the World: International Report of GUESSS 2011. KMU-HSG: St.Gallen.
Sieger, P., Fueglistaller, U., & Zellweger, T. (2014). Student Entrepreneurship Across the Globe: A Look at Intentions and Activities. KMU-HSG: St.Gallen.
Sieger, P., Gruber, M., Fauchart, E., & Zellweger, T. (2016). Measuring the Social Identity of Entrepreneurs: Scale Development and International Validation. Journal of Business Venturing, 31(5), 542-572.
12 The “Law & Economics (incl. business sciences)” category corresponds to the “BECL” category that has been
used in previous editions.
32.8
25.410.3
8.9
8.4
7.54.9 1.8
Law & Economics (incl. business sciences)
Engineering (incl. computer sciences and architecture)
Other
Social sciences (e.g., psychology, politics, educational science)
Human medicine / health sciences
Arts / Humanities (e.g., linguistics, cultural studies, religion, philosophy, history)
Mathematics and natural sciences
Science of art (e.g., art, design, dramatics, music)%