Embed Size (px)
Citation preview

Structure, Vol. 12, 1763–1774, October, 2004, 2004 Elsevier Ltd. All rights reserved. DOI 10.1016/j .str .2004.07.022
Ways & MeansMethods for GeneratingHigh-Resolution Structural Modelsfrom Electron Microscope Tomography Data
1996; Li et al., 1997; Marko and Leith, 1996; Perkins etal., 1997). Although this method reveals the generalshape and organization of logically distinct cellular com-ponents, the tedious and subjective nature of manualtracing makes it difficult to generate models that reliably
David B. Ress,* Mark L. Harlow,Robert M. Marshall, and Uel J. McMahanDepartment of NeurobiologyStanford University School of MedicineStanford, California 94305
represent the components at the full spatial resolutionof the reconstructed volume.
More sophisticated model-generation methods areSummaryalso available for EMT. One EMT software package,IMOD (Kremer et al., 1996), permits the creation of aReconstructed volumes generated by tilt-image elec-model contour at a particular isodensity level on a seriestron-microscope tomography offer the best spatialof virtual slices. General purpose commercial softwareresolution currently available for studying cell struc-applications such as Amira (ZIB, Indeed-Visual Con-tures in situ. Analysis is often accomplished by creat-cepts GmbH, Berlin, Germany) and AVS (Advanced Vi-ing surface models that delineate grayscale contrastsual Systems Inc., Waltham, MA) offer a plethora ofboundaries. Here, we introduce a specialized and con-alternative segmentation, visualization, and analysisvenient sequence of segmentation operations formethods. While these software packages each havemaking such models that greatly improves their relia-their advantages and limitations, there remains a sub-bility and spatial resolution as compared to currentstantial need for additional approaches that offer im-approaches, providing a basis for making accurateprovements in speed, convenience, and accuracy.measurements. To assess the reliability of the surface
Here, we present a set of 3D image processing ways-models, we introduce a spatial uncertainty measure-and-means, specifically designed for EMT data vol-ment based on grayscale gradient scale length. Theumes, which provide convenient and reliable generationmodel generation and measurement methods are vali-of full-resolution surface models. Independently control-dated by applying them to synthetic data, and theirlable, 3D surface models of distinct structural compo-utility is demonstrated by using them to characterizenents are created using a two-step, dual-resolution iso-macromolecular architecture of active zone materialdensity volume-of-interest (IVOI) approach. The firstat the frog’s neuromuscular junction.step is a low-resolution slice-by-slice segmentation thatproduces small volumes-of-interest (VOIs) that enclose,
Introduction but do not precisely delineate, individual components.The second step forms an isodensity surface as a full-
Tilt-image electron-microscope tomography (EMT) can resolution model of the structural component enclosedbe used to generate 3D reconstructions of sections from by each VOI. Because the initial IVOI segmentation stepstained, plastic-embedded biological tissue samples is error tolerant, it can be performed manually, or by(Frank, 1992; Harlow et al., 2001; He et al., 2003; Horo- using interactive, semiautomatic methods. To assistwitz et al., 1994; Ladinsky et al., 1999; Lenzi et al., 1999; both manual and automatic segmentation, we describeMartone et al., 1999; McEwen et al., 1986, 1993; Sedzik a parametric-spline path generation method. We alsoet al., 1992; Taylor et al., 1999; Woodcock et al., 1991). introduce an active-contour method designed to auto-The volume reconstructions make it possible to study matically segment the membranous structures that arethe structure of cellular components within the depth of common in tissues imaged using EMT. Finally, we intro-the sections, acquiring information about sizes, shapes, duce a measurement, spatial uncertainty, which quanti-and relationships that cannot be obtained in any other fies the spatial reliability of a surface model based onway. However, analysis is often hindered by the abun- the local grayscale noise and gradient scale length.dance of structures, the complexity of their shapes and Our methods were validated using a synthetic volumerelationships, staining inhomogeneity, and noise. To al- that simulated a typical EMT reconstructed tissue sec-leviate these problems, it is useful to form 3D models of tion. The simulated volume contained cylinders, spher-the components-of-interest within the reconstructions. oids, and a folded sheet which represent the mostSurface models, which represent the boundary between common shapes of cellular components: for examplecomponents and the space surrounding them, are com- filaments, vesicles, and a plasma membrane, respec-monly used. tively. Surface texture was added to these simulated
Because of the complexity and noise, most research structures to assess the accuracy of the model genera-in EMT has made use of manual surface-model genera- tion and measurement methods. Various amounts oftion methods. Typically, virtual slices are formed through noise were also added to the volume to assess thea reconstruction and the boundary of each component- performance of the segmentation methods for a rangeof-interest is traced in the slices in which it appears. of experimental data quality, and to quantify the accu-The traces are then interpolated to create a 3D surface racy of the spatial uncertainty measurement. We also(Frank et al., 1996; Hessler et al., 1992; Kremer et al., show how our methods were used to generate and ana-
lyze surface models from EMT reconstructions of tissuesections. The sections were from fixed, stained, and*Correspondence: [email protected]; [email protected]
Structure1764
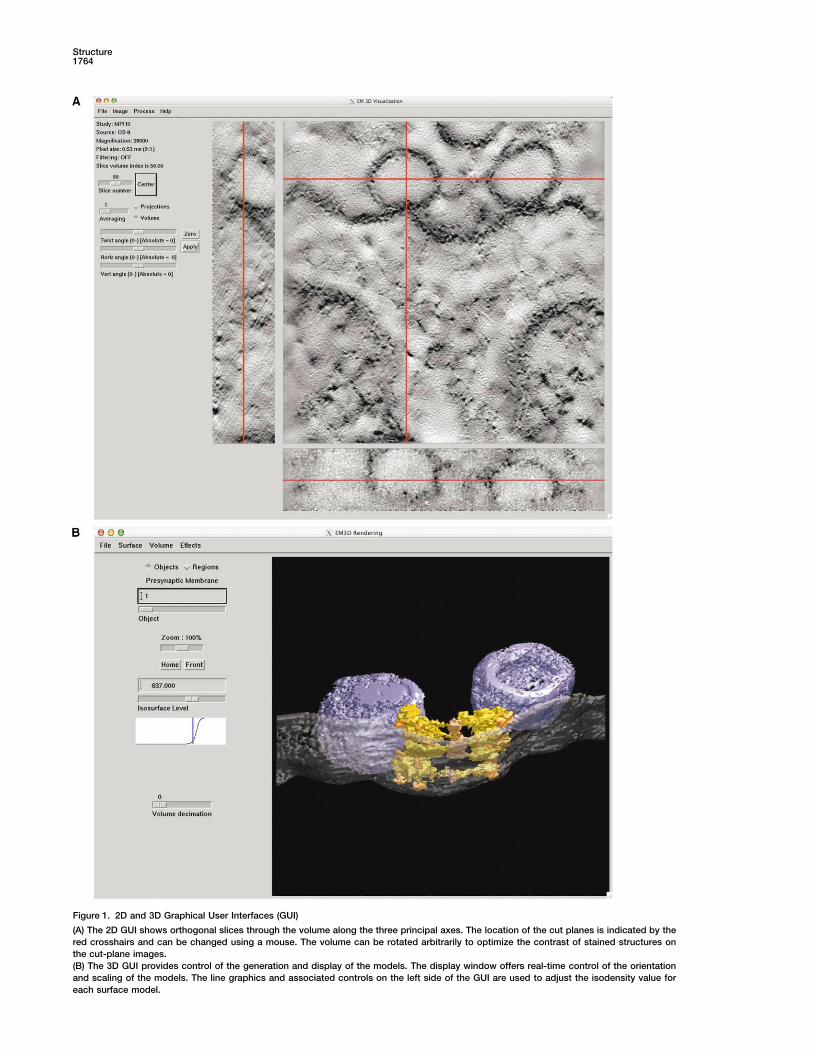
Figure 1. 2D and 3D Graphical User Interfaces (GUI)
(A) The 2D GUI shows orthogonal slices through the volume along the three principal axes. The location of the cut planes is indicated by thered crosshairs and can be changed using a mouse. The volume can be rotated arbitrarily to optimize the contrast of stained structures onthe cut-plane images.(B) The 3D GUI provides control of the generation and display of the models. The display window offers real-time control of the orientationand scaling of the models. The line graphics and associated controls on the left side of the GUI are used to adjust the isodensity value foreach surface model.

Ways & Means1765
Figure 2. Steps in the Generation of a Surface Model Using a Semiautomatic IVOI Approach
(A) A user chooses a slice where a structural component-of-interest is clearly distinguished (here the presynaptic plasma membrane of a frogneuromuscular junction). Points are marked along its length and interpolated together to form a continuous path (green points and line).(B) The blue region shows the pixels corresponding to the user-defined grayscale range within the search-region width of the anchor path;the red line shows the calculated segmentation path.(C) The complete segmentation is a 3D ensemble of points produced by propagating the segmentation path through the volume.(D) The volume-of-interest (VOI) is produced by dilation of these points.(E) An isodensity surface model is created from the stained structure within the VOI.
plastic-embedded active zones, i.e., neurotransmitter tation and slice display are provided by a 2D GUI (Fig-release sites, in axon terminals of the frog’s neuromus- ure 1A).cular junction. The active zones are composed of fila- Membranes are segmented using an interactive, par-mentous cytoplasmic macromolecules, vesicles, and tially automated method that is a novel form of active-plasma membrane. We have briefly described elsewhere contour (“snake”) segmentation combining grayscale(Harlow et al., 2001) the use of our methods for model morphology, thinning, and path formation using para-generation in the analysis of active zone structures in metric splines. Segmentation is initiated by choosing athese sections. Here, we provide a full account of the slice and slice-orientation that most clearly shows themodel-generation methods, use the spatial-uncertainty structure of interest as a contrast boundary. Two topolo-metric to verify the reliability of our models, and apply gies of membranes are permitted: open (extending be-some example measurements to IVOI models of active yond the slice boundaries, e.g., plasma membranes)zone components that confirm our understanding of and closed (e.g., synaptic vesicle membranes). The usersynaptic structure. marks points along the membrane using a mouse or
trackball (Figure 2A). As each point is marked by clickingthe input device button, a cubic-spline path is interpo-Methods and Resultslated parametrically between the points, that is, the xand y coordinates of the path are separately interpolatedSegmentationtogether with single-pixel precision. This anchor pathIn the dual-resolution IVOI approach, the goal of seg-can be edited by adding or deleting points. Open-topol-mentation is to create VOIs that enclose distinct struc-ogy anchor paths are completed by extending them totures, including both stained structures and adjacentthe closest image boundary. Closed-topology anchorbackground to facilitate subsequent boundary detec-paths are completed by replicating the initial point astion. All segmentation is performed using virtual slicesthe end-point.through the reconstructed volume at various user-
defined positions and orientations. Controls for segmen- In the next stage of segmentation, the user selects a

Structure1766
grayscale range and a search-region width. For conve- union or intersection between or among any numberof previously created VOIs. These operations enablenience, the code sets default values for the grayscale
range based on the mean and standard deviation of the analysis of relationships among structures containedwithin the VOIs. Specifically, union allows the combina-grayscale values along the anchor path. A search is then
performed in the vicinity of the anchor path for pixels tion of multiple structures to form groups or wholes,and intersection facilitates identification of portions ofthat are within the specified width; pixels within the
range are shown graphically using a false-color overlay structures that meet or contact one another.(Figure 2B). The grayscale range and search-width areset so that the well-stained, high-confidence regions of Surface-Model Generationthe entire membrane are selected. To create a representation of the surface of a stained
Next, the selected-pixel regions of the membrane are object within a VOI, vertex points and a connectivitythinned to find the image vertices that lie along their graph are calculated at a particular gray level. This sur-median axis. To create a new path, we now identify each face provides a grayscale driven representation of theof the anchor path vertices with its nearest neighbor stained structure that maximizes spatial resolution,within the set of thinned vertices. If multiple thinned completing the IVOI approach to model generation.vertices correspond to a single anchor-point vertex, the The default choice of gray level is obtained using themean thinned-vertex position is chosen. If multiple an- VOI’s grayscale cumulative-distribution function. Thechor-path vertices correspond to a single thinned ver- cumulative-distribution function, normalized to unity,tex, only that correspondence that occurs first along represents the fraction of VOI voxels that will be interiorthe anchor path is retained, and the others are dis- to the corresponding interpolated surface. By default,carded. The same parametric cubic-spline method de- we choose a surface that encloses 60% of the VOI vol-scribed above is then used to interpolate this new set ume (Figure 2E).of points into the segmentation path. To enforce a de- The surface gray level can also be adjusted usinggree of stiffness in the segmentation, this path is graphical controls. In general, there is a plainly visiblesmoothed parametrically by convolution with a smooth- range of appropriate values for the stain density: if theing kernel applied independently to the x and y vertex level is too high (too light), the surface becomes clippedcoordinate values; the degree of smoothing can be ad- at the edges of the VOI; too low, and the surface appearsjusted by the user (Figure 2B). to disintegrate. The most accurate representation of the
The user now initiates automatic propagation of the biological structure is somewhere between these twosegmentation. Starting with the slice containing the ini- extremes. The surface gray level is usually adjusted totial segmentation, the segmentation path becomes the minimize the spatial uncertainty, as described below.anchor path on an adjacent slice, and the subsequentpixel search and path movement described above are
Visualizationrepeated to produce a new segmentation path for thatThe IVOI surface models can be visually analyzed usingslice. The process is repeated in both directions to deter-an extensive collection of tools provided by the 3D GUImine segmentation paths for all slices in the volume.(Figure 1B). For example, models can be interactivelyThe propagation in either direction is terminated whenrotated, scaled, and translated. Moreover, each modelthe pixel search fails. The results of the propagation cancan be assigned a different name, color, and opacity.be subsequently edited by trimming segmented slicesTo make their spatial relationships more obvious, thefrom either direction of propagation, and by setting addi-user can choose to render all or only a subset of thetional anchor paths and repropagating the new pathsmodels. The GUI also provides a flexible lighting modelalong a new range of orthogonal slices.and spin animation about an arbitrary axis to assist inThe resulting set of segmentation paths is a collectionvisual analysis, and the results of appropriate quantita-of points that define a smoothed representation of thetive analysis steps can be superimposed on the ren-geometric center of the membrane (Figure 2C). This isdered surfaces (Figures 3B–3D).converted to a VOI by dilating all these points using a
spherical 3D structuring element with a user-definableMeasurementdiameter (default value is the search-region width forTo quantify the accuracy of surface models, we calcu-the segmentation). Thus, the VOI encloses both the well-late the spatial uncertainty at each vertex. Our approachstained membrane and some adjacent unstained ortakes the view that uncertainty in the grayscale valuelightly stained background (Figure 2D).drives a spatial uncertainty in the physical position ofFor lightly stained objects exhibiting complex topolo-each isodensity surface model vertex. For example, ifgies, such as macromolecular filaments, we use a seg-noise were to make the gray values larger near somementation method in which a closed path is manuallyvertex of a surface model, that vertex would move in-created to define the VOI on each slice. The path canward, and vice versa. The sensitivity of each vertex loca-be marked by parametric cubic-spline interpolation, astion to the noise is proportional to the normal componentbefore, or by piecewise-linear interpolation. The user’sof the local spatial gradient. If the gradient is large, agoal is to enclose both the stained structure and somenoise-induced shift in position will be relatively small,amount of the adjacent background around it. The pathand vice versa. The calculation therefore begins by de-on the first slice can be propagated without modificationtermining the grayscale spatial gradients, �
→S, in theto an adjacent slice where it can be edited by adding
neighborhood of each vertex location, x→. �
→S is calculatedor deleting points. The VOI is literally defined by combin-
by convolving three 3�3�3 kernels, each containinging the interior regions of all marked slices.Segmentations can also be created from the logical nine replicas of the vector {�0.5 1 �0.5} oriented along

Ways & Means1767
Figure 3. IVOI Surface Models with Measurements for Biological Data
(A) Schematic of the active zone at the frog’s neuromuscular junction showing the presynaptic membrane (gray), docked synaptic vesicles(blue), and the most superficial 15 nm of the AZM, consisting of beams (brown gold), ribs (yellow gold), and pegs (orange gold). Cationchannels in the presynaptic membrane are shown in green.(B) Spatial uncertainty of ribs and beams. An ensemble of models of ribs and beams in UC-1, showing the spatial uncertainties as a coloroverlay.(C) Spatial uncertainty of ribs and pegs. A portion of the active zone in MPI-10 is shown in the transverse plane to reveal the spatial relationshipsamong a single rib (yellow gold), its pair of associated pegs (orange gold), and the vesicle and presynaptic membranes (blue and gray,respectively). Inset shows spatial uncertainty overlay of the rib-peg assembly (same scale as Figure 3B).(D) Spatial proximity of rib-vesicle contacts with the presynaptic membrane. Models for the pair of docked vesicle in MPI-9 are marked witha vertex color overlay indicating spatial proximity to the presynaptic membrane. Gold patches show contact regions among the vesicles andthe ribs. About three-fourths of each vesicle was included in the tissue section.(E) Method used to determine the longitudinal and transverse spacings of the pegs. Horizontal view of the of the pegs (orange gold) uponthe cytoplasmic surface of presynaptic membrane (gray) in MPI-9. The red spots indicate the peg centroids. Black line segments illustratethe longitudinal distances between each pair of pegs; blue segments illustrate the transverse distances.
the x, y, and z axes, to generate the respective compo- The isodensity surface calculation produces the out-ward vector normal, n
→(x→), at every vertex. Altogether,nents of the vector gradient. This is the smallest sym-
metric kernel available to calculate the gradient; larger we define the spatial uncertainty as:kernels did not perform as well, tending to underesti-mate the magnitude of the local gradient. The grayscale
�n (x→) �
�g
n→
(x→) • �
→S(x
→).
noise, �g, is estimated by calculating the standard devia-tion in a relatively blank (transmissive) portion of volume,and this noise is assumed to be stationary throughout. This equation can be rewritten to emphasize its geomet-

Structure1768
Figure 4. Qualitative Performance of the IVOI Approach with Synthetic Data
Models were generated from an artificial volume simulating components at the active zone of a neuromuscular junction. The volume containeda folded sheet (presynaptic membrane), four spheroids (vesicles), and several lower-contrast cylinders (AZM). Membrane surface texture was2–4 nm. Left images (A, C, and E) show an oblique 3D rendering of the IVOI surface models; right images (B, D, and F) show a 2D cross-section of the grayscale volume with a red overlay marking vertices of the surface models. The noise-free panels (A and B) show all of thesimulated structures and surface texture. The panels corresponding to 20% noise (C and D), an upper limit for most biological data, are similarto the noise free case, although the surface texture and lightly stained AZM are somewhat distorted. The panels corresponding to 50% noise(E and F), an unusually large value for biological data, continue to show the gross structures, but the surface texture and some of the AZMare obscured.
rical interpretation. The denominator term is related to subset of the vertices span a region of the volume wherethe gradient points inward rather than outwards be-the gradient scale length of the grayscale density along
the normal to the surface model, ln � S/(n→
• �→
S). If we cause of noise or structural complexity. These verticesare marked with a user-definable color.combine this relationship with the signal-to-noise ratio,
R � S/�g, we get the form, �n � ln/R. Thus, our spatial To quantify the spatial relationships among surfacemodels, we calculate the nearest-neighbor distancesuncertainty measure is simply the normal component of
the gradient scale length divided by the signal-to-noise between their vertices. This calculation begins by defin-ing one object as a reference and one or more otherratio.
To visualize the spatial uncertainty, the uncertainty objects as destinations. For every vertex on a destina-tion object, we calculate the distance to all of the refer-values are scaled onto a user-selectable color map and
displayed as an overlay on the surface (Figures 3B and ence-object vertices; the smallest distance is then asso-ciated with that destination vertex. The ensemble of3C). The user can choose different color tables and scaling
parameters, so that only a subset range of uncertainty vertex distances are then scaled onto a color table andoverlaid onto the destination object (Figure 3D).values is spanned by the overlay. Generally, a small

Ways & Means1769
To measure the positions, surface areas, and volumesof stained structures, we calculate various geometricmoments. Specifically, the position of the model is de-fined as the centroid of its vertices (Figure 3E). The areaof a surface model is calculated by summing the areaof each of its constituent polygons. For closed surfaces,the volume is calculated by counting the number ofinterior voxels.
To understand the capabilities of our modeling meth-ods, we made estimates of spatial resolution and noisefor the experimental data. The resolution of the recon-structed volume was measured by characterizing thecontrast profile of relatively continuous segments of tri-laminar membrane measured along a surface normalobtained from its corresponding IVOI model. By treatingthe outer leaflets of the membranes as a pair of sharpedges, we could calculate an upper limit for the full-width-at-half-maximum resolution by measuring theirseparation and the contrast between the edge and cen-ter regions and assuming a Gaussian form for the localline-spread function. Specifically, if we define the unat-tenuated gray value as S0, the gray value correspondingto the leaflet as S1, the gray value between the twoleaflets as S2, and the measured spacing along the nor-mal between the two leaflets as d, the resolution is
r � dln2
√ln(2S1/[S0 � S2])
(data not shown). Resolution varied depending uponorientation, ranging from �1 nm in the plane of the tiltaxis to 2–4 nm perpendicular to the tilt axis, as expectedfrom the theory of tilt-image tomography (Frank, 1992).In our recent data sets, where 141 tilt images are typi-cally taken for a 50–60 nm thick sample, the spatialresolution was at least 2 nm throughout the volume. Toestimate the noise in the sample, we chose a small VOIwithin a fully reconstructed portion of the volume thatis as bright and featureless as possible, and within thisVOI we calculated the mean, Gbright, and standard devia-tion, �g of the gray values. We also obtained a measureof minimum gray value, Gdark, by picking off the valuecorresponding to 1% on the cumulative distributionfunction of the volume. The noise-to-contrast ratio wasthen defined as NCR � �g/(Gbright � Gdark). Using thismethod, we observe NCR levels in the range of 5–20%.
SimulationsWe created a simulated volume containing representa-tions of synaptic vesicles, a plasma membrane, andmacromolecular filaments (see Figure 4A). Voxel sizewas set to 1 nm, a reasonable value for actual recon-structed EMT volumes. Vesicles were simulated by cre-ating isodensity surfaces from the sum of a few low-order spherical harmonics to create a spheroidal shapeFigure 5. Quantitative Performance of the IVOI Approach with Syn-
thetic Data with roughly 50 nm diameter. To assess the ability ofour surface models to delineate fine-scale structure,(A) Proximity map showing errors of a surface model obtained from
a noisy (20%) simulated volume. surface texture was added by summing additional high-(B) Spatial uncertainty map on the same object. order spherical harmonics with amplitudes in the range(C) The dependence of mean proximity error and median uncertainty of 2–4 nm. Superposing two such spheroids with radiias a function of noise level. The median uncertainty tracks and
offset by 5 nm simulated the trilaminar character ofsomewhat exceeds the actual mean error, confirming its utility asstained membranes. A plasma membrane was simu-a reliability metric.lated using very similar methods but with Fourier rather

Structure1770
than spherical harmonics. Macromolecular filaments To quantify the errors in the IVOI surface models pro-duced by the additive noise, we used the proximity-were simulated using simple, homogeneous solid cylin-
ders. The gray level of each vesicle and the membrane mapping method to calculate the nearest-neighbor sep-aration between vertices in a noisy surface model andwere set to a small value (e.g., 10% of maximum) to
simulate the dark stain typically observed in tissue vol- the corresponding noise-free surface model. For oneobject, the upper left vesicle in Figure 4, the errors pro-umes. In typical reconstructed EMT volumes, stain lev-
els vary significantly from object-to-object. Accordingly, duced by 20% additive noise are shown as a vertexcolor map overlay in Figure 5A. The root-mean-squaregray values were randomly varied for the vesicle and
plasma membranes over a range of �20%. The filamen- (rms) errors are shown as a function of NCR in Figure5C. At a noise level of 20%, the error is 0.6 pixels, lowtous components were given lighter gray value (e.g.,
40% of maximum), with 50% component-to-component enough to resolve some of the fine-scale detail. At anoise level of 50%, the rms error rises to 1.5 pixels,random variability. The entire simulated volume was
smoothed slightly (3�3�3 boxcar, repeated twice) to obscuring all of the fine-scale detail.We also applied the spatial uncertainty calculation toreduce quantization artifacts. For clarity, we did not pro-
ject and then reconstruct this volume before applying the upper left vesicle in the simulated volume (Figure4). At 20% noise levels, the spatial uncertainties showour analysis procedures. This was necessary to permit
the quantitative interpretation of the segmentation re- the same spatial pattern as the actual errors, lower nearthe poles and larger near the equators (Figure 5B). Thesults, avoiding confusion between segmentation errors
and reconstruction artifacts. greater uncertainty and error near the equator arecaused by the larger amount of fine surface detail thatVarious amounts of normally distributed noise were
added to simulate different reconstructed volume quali- was imposed in this region, thus reducing the localgrayscale spatial gradients. The spatial uncertainty cal-ties. We chose to model the noise as white, although
actual noise in tomographic reconstructions of EMT culation inevitably produces a few very large valueswhere the surface model is interpolated through a regiondata has a more complex character. In projection im-
aging methods, the sampling density varies linearly with of small grayscale gradients, and some negative valueswhere the gradients point inward. Consequently, we usespatial frequency, so we expect noise levels to increase
with spatial frequency. However, other noise mecha- the median of the positive values as a more robust metricfor the error across the entire surface model. As ex-nisms have different spectral properties; for example,
stain inhomogeneity would have a dominantly low spa- pected, the median spatial uncertainty increases withthe noise level (Figure 5C). The median uncertainty istial-frequency character. In general, these mechanisms
do not have well-characterized statistics, but white always somewhat greater than the mean error. Thus,the median spatial uncertainty provides a conservativenoise is a reasonable choice to reflect the statistical
character of a superposition of many noise processes. measure of the reliability of a surface model.To test the effects of user subjectivity on the semiauto-
matic version of the IVOI approach, we had three usersModels of Simulated Structures independently generate surface models of the vesiclesThe synthetic volume contained a plasma membrane, and plasma membrane in two of the noisy simulatedfour synaptic vesicles, and two pairs of solid, cylindrical volumes (10% and 20% NCR). All of the resulting sur-connecting rods that simulated macromolecular fila- face models were remarkably similar. Using the proxim-ments (Figure 4). When we applied the IVOI approach ity mapping method to quantify the differences be-to create surface models of these various elements, the tween the surfaces, we found them to be very low, ��1simulated structures were accurately modeled (Figures pixel rms.4A and 4B). Each surface model followed the contrastboundary at the edges of each object, e.g., the darklystained laminae of the simulated membranes. Models of the Active Zone Components
The active zone of the frog’s neuromuscular junction,We added a controlled amount of noise to the simu-lated volume and repeated the segmentations. In our when viewed in aldehyde-fixed, heavy-metal stained tis-
sue sections, is composed of three gross structuressimulated data with a NCR of 20%, the largest valuegenerally observed in experimental data, all of the gross (Figure 3A): the presynaptic plasma membrane of the
axon terminal; a 100 � 1000 nm patch of filamentousstructure and some of the fine surface texture were stillevident on the membranous structures (Figures 4C and macromolecules (active-zone material, AZM), which is
attached to the cytoplasmic surface of the plasma mem-4D). Because the various elements within the volumewere assigned different “stain” values, their correspond- brane and extends about 75 nm into the cytoplasm; and
a row of 50 nm diam synaptic vesicles docked on (i.e.,ing surface models are affected differently by the noise.Two of the manually segmented connecting rods were held at) the presynaptic membrane on each side of the
active zone material. Freeze-fracture replicas from thegiven very low contrast, so they are particularly distortedby the noise. At an unusually high noise level (NCR � portion of the plasma membrane adjacent to the AZM
reveal linear arrays of macromolecules, which include50%), the segmented surface models of the membra-nous structures reveal only their gross features, while cation (calcium and calcium-activated potassium) chan-
nels paralleling the rows of docked vesicles (Figure 3A)the superimposed fine structure is no longer evident(Figures 4E and 4F). The two lightly stained connecting (Heuser and Reese, 1981; Heuser et al., 1979; Robitaille
et al., 1993). All of the above structures are believedrods were completely obscured by the noise and couldno longer be segmented from the volume. to be essential for synaptic transmission of the nerve

Ways & Means1771
impulse, and they are typically found at synapses and the mean value recorded. The mean value for allthe rib-vesicle contact regions was 7.5 � 3.0 nm (SD).throughout the nervous system, although their configu-
rations vary (Harlow et al., 2001; Heuser and Reese, Thus, the proximity calculation demonstrated that forMPI-9 and MPI-10, the ribs contacted each vesicle in a1977; Katz, 1969).
In our previous study (Harlow et al., 2001), we used narrow band paralleling the presynaptic membrane, andthe separation of the band from the membrane wasthe modeling methods described above to examine the
macromolecular architecture of the first 15 nm of AZM nearly the same from vesicle-to-vesicle.In our earlier work (Harlow et al., 2001), we suggestedinternal to the presynaptic membrane in three recon-
structed active zones designated MPI-9, MPI-10, and that pegs are linked to the linear arrays of cation chan-nels in the presynaptic membrane based on visual in-UC-1. By applying the semiautomatic IVOI method for
individually segmenting the presynaptic membrane and spection of the models from MPI-9 and MPI-10. Thepeg-membrane contacts were arranged in linear arrayssynaptic vesicles, and the manual IVOI method for indi-
vidually segmenting the more complicated macromole- having a particular longitudinal (parallel to the beams)and transverse (perpendicular to the beams) spacings,cules in the AZM, we determined from the resulting
surface models that there are three classes of AZM and the overall configuration of these contacts was simi-lar to that of the macromolecules observed in freeze-macromolecular components based on their position
and orientation; we termed these beams, ribs, and pegs fracture replicas from the active-zone’s presynapticmembrane. We have now performed moment calcula-(Figure 3A). We also learned that the beams, ribs, and
pegs have specific connections. Beams are connected tions to test this hypothesis, measuring the center-to-center spacings of the peg centroids in the longitudinalto each other and to ribs, ribs are connected to docked
vesicles and pegs, and pegs are connected to the pre- and transverse directions for data sets MPI-9 and MPI-10 (Figure 3E). These data were compared to similarsynaptic membrane in a way suggesting they are linked
to the cation channels within the membrane. These measurements made on the presynaptic membranemacromolecules in images of freeze-fracture replicasstructures are evident in the schematic of Figure 3A and
in the ensemble of IVOI models in Figure 1B (horizontal from muscles fixed in the same way as those used forEMT (McMahan and Slater, 1984). The mean longitudinalview of the active zone: presynaptic membrane, gray;
synaptic vesicles, blue; beam, brown gold; ribs, yellow spacing for the 28 pegs was 19.8 � 5.0 nm, while themean transverse spacing was 17.3 � 6.2 nm (SD). De-gold; pegs, orange gold).
The manual segmentations in our earlier work (Harlow spite the small sample size, these values are in goodagreement with our measurements on a much largeret al., 2001) were tedious and difficult because the edges
of structures were highly irregular and there was signifi- sample of presynaptic-membrane macromolecules:17.2 � 3.6 and 17.3 � 2.5 nm, respectively.cant noise. These factors could have led to significant
errors in the models. To obtain an objective measure ofthe models’ reliability, we have now calculated the spa-
Discussiontial uncertainty for the same models using the methoddescribed above. The color-map overlay in Figure 3B
We described two methods within a dual-resolution IVOIshows the spatial uncertainty obtained for the 19 ribsapproach to segmentation. The first was the use of para-and four beams in UC-1. The median uncertainty for allmetric cubic splines to create a smooth interpolation ofof these components was 0.8 nm, and 90% of the verti-a sparse set of points. Application of this well-knownces had spatial uncertainties � 2.0 nm. The spatial un-method provided two advantages: first, as a convenientcertainties in MPI-9 and MPI-10 were higher becausescheme to interactively define a path, and second, astheir contrast-to-noise ratio was lower, typically �5 asa critical component of the active-contour segmentationcompared to �20 in UC-1. Figure 3C shows a rib andscheme. The second method was a novel approachthe two pegs linked to it from MPI-10; the median uncer-to membrane segmentation that combines an active-tainty for the three structures was 1.4 nm, and 90% ofcontour concept with thinning. In addition, we describedthe vertices had spatial uncertainties � 3.3 nm. Mediana spatial uncertainty calculation that quantifies the relia-spatial uncertainties for the assemblies of beams, ribs,bility of isodensity surface models generated from theseand pegs were 1.9 nm for MPI-9 (2 beams, 8 ribs, 16segmentations. Altogether, these methods offer a con-pegs), and 1.6 nm for MPI-10 (2 beams, 8 ribs, 14 pegs).venient means to reliably generate high-resolution mod-Thus, the spatial uncertainty in all three data sets wasels of structure from reconstructed EMT volumes.sufficiently low to validate the existence of the beam-
Previous segmentation approaches have not beenrib-peg assemblies reported previously.satisfactory for high resolution studies of EMT volumes.In our earlier work (Harlow et al., 2001), we observedActive-contour segmentation (or, more generally, level-that each rib contacted the vesicle membrane near theset segmentation) has seen extensive use in biomedicalpresynaptic membrane, but the curvature of the vesiclesimage segmentation (Klemencic et al., 1998; Kozerke etand undulations in the presynaptic membrane made ital., 1999; Suri et al., 2002; Yezzi et al., 1997), but it tendsdifficult to precisely quantify their separation. We haveto fail in EMT volumes because of complexity and noise;now performed proximity calculations to measure thisthe segmentation contours are driven from the targetseparation for the 12 rib-vesicle contact regions in thesurface by the many actual interconnections or by noise.four docked vesicles in MPI-9 and MPI-10 (Figure 3D).Watershed schemes have also been used extensivelyIVOI models of the contact regions were obtained fromto find contours in biomedical images (Grau et al., 2004;the intersections of the rib and vesicle VOIs. For each
model, proximity values were obtained at every vertex, Lin et al., 2003; Ortiz de Solorzano et al., 1999; Volkmann,
Structure1772
2002), but these schemes fail in EMT data for similar spatial uncertainty may be useful in the analysis of 3Dstructural data other than that produced by EMT. Forreasons; complex structure and noise cause overseg-
mentation or poor boundary detection. The success of example, in single-particle analysis of isolated macro-molecules a model volume is generated that includesour hybrid scheme suggests that it may be possible to
devise a level-set method that incorporates a particular both a mean gray scale density and its uncertainty.These data could be combined to calculate spatial un-topological preference (e.g., 50 nm diam spheroidal ves-
icles) into the artificial forces that guide the contour’s certainty for a surface model constructed from the volu-metric data. The spatial reliability method could be alsotrajectory. Another useful direction may be the develop-
ment of 3D skeletonization algorithms (Bajaj et al., 2003; useful in evaluating the similarity of models producedby different 3D structural analysis methods (OfverstedtCooper et al., 2003; Wu and Bourland, 2000). Both of
these approaches could be effective for the error-toler- et al., 1997; Wriggers and Chacon, 2001). For instance,one could evaluate the spatial reliability of an EMT modelant segmentation step of the IVOI approach.
Models can also be generated from reconstructed of a particular macromolecule that appears to be a bestvisual fit to a model obtained by X-ray crystallographyEMT volumes using various methods available in com-
mercial 3D image processing software packages such (He et al., 2003). Indeed, the spatial uncertainty calcula-tion may provide a general method to quantify spatialas Amira (ZIB, Indeed-Visual Concepts GmbH, Berlin,
Germany) or AVS/Express (Advanced Visual Systems resolution at a contrast boundary in 3D structuralbiology.Inc., Waltham, MA). These packages are capable of gen-
erating dual-resolution IVOI models, but only by manual Application of our methods to make models of compo-nents of the active zone of the frog’s neuromuscularmeans. They also provide interactive automatic seg-
mentation tools designed to find grayscale boundaries. junction has shown its ability to reveal unique in situstructural information. Our earlier work, published else-There are several reasons why these tools are often
unsatisfactory for high-resolution EMT analysis. Most where without full methodological details (Harlow et al.,2001), revealed macromolecular components and asso-important, they are not designed to operate in the dual-
resolution fashion described above. They attempt to ciations that had not been detected by any other imagingmethod. The discovery of beams, ribs, and pegs andfind a boundary based on grayscale level and gradient
operations, thus creating VOIs that define structural their connections to each other, synaptic vesicles andthe presynaptic membrane is now significantly strength-components rather than enclose them. Consequently,
the models generated from these VOIs do not precisely ened by this full exposition. Our demonstration here thatthe spatial uncertainty at the large majority of the modeldelineate surface boundaries in high-resolution data.
Also, the packages are designed for general-purpose vertices was �2 nm shows that the models representedthe AZM’s structure at the full 2 nm resolution of the3D image processing. They offer tools optimized for
quick visualization and measurement using proprietary reconstructed volumes.Our surface models of the AZM components led tomethods. By comparison, high-resolution structural
analysis of EMT data requires precise, standardized, specific hypotheses as to its structure and function (Har-low et al., 2001). Comprehensive tests of these hypothe-and extensive metrology of structural features. In gen-
eral, specific, high-precision segmentation and 3D mea- ses will rely on the precise measurement of structuralrelationships of models from preparations of normalsurement problems concerning biological systems have
required specialized software packages; examples in- AZM and after its exposure to various experimental con-ditions. We show here that these accurate models pro-clude the segmentation of brain structures from mag-
netic-resonance images (Teo et al., 1997; Van Essen et vide a basis for making such measurements. Centroidmeasurements on the transverse and longitudinal spac-al., 2001; Zavaljevski et al., 2000) and cytometry (Bocker
et al., 1999; van Vliet et al., 1990). We devised our dual- ings between the pegs in the two data sets that wereanalyzed were similar to those on the transverse andresolution IVOI approach as a standardized and repeat-
able method to generate full-resolution structural mod- longitudinal spacings of macromolecules in the presyn-aptic membrane as observed in freeze fracture replicas,els from EMT data.
Application of our methods to simulated data demon- consistent with our hypothesis that the pegs are con-nected to the macromolecules. Proximity measure-strated their performance. The resulting IVOI models
accurately delineated the contrast boundaries of struc- ments on the separation of the presynaptic membranefrom the contact points between ribs and synaptic vesi-tural components. Noise distorted the boundaries, but
both gross structure and 2–4 nm surface texture were cles in the same two data sets revealed that the contactpoints on each of the four synaptic vesicles were notevident at noise levels typically observed in our biologi-
cal EMT data. Virtually identical models were formed by only very near the presynaptic membrane but that therewas also little variability in such separation from onethree different users, showing the power of the IVOI
approach. Using the simulations, we also demonstrated contact point to the next. Thus, our model-generationmethods can provide a quantitative map of the macro-that the spatial uncertainty metric could effectively as-
sess the reliability of the surface models, providing a molecular architecture of the normal active zone.Our methods are designed to generate surface mod-conservative estimate that tracks the actual errors. We
now routinely use a form of the spatial uncertainty mea- els at contrast boundaries regardless of the contrastmechanism. In this report, we have presented IVOI mod-surement as an automatic optimization metric during
segmentation and model generation of biological data els of cellular components where contrast was obtainedby conventional heavy metal staining. However, there(Ress et al., 2003).
The conversion of local values of uncertainty into is also limited contrast in unstained cells imaged by

Ways & Means1773
Hessler, D., Young, S.J., Carragher, B.O., Martone, M.E., Lamont,cryo-EM techniques (Hsieh et al., 2002; Medalia et al.,S., Whittaker, M., Milligan, R.A., Masliah, E., Hinshaw, J.E., and2002). Accordingly, the methods described here shouldEllisman, M.H. (1992). Programs for visualization in three-dimen-be effective in generating surface models of such un-sional microscopy. Neuroimage 1, 55–67.
stained components in cryosamples at the full resolutionHeuser, J.E., and Reese, T.S. (1977). Handbook of Physiology
of the reconstructed volume, and the spatial uncertainty (Bethseda, MD: American Physiological Society), pp. 261–294.metric should provide a measure of their reliability.
Heuser, J.E., and Reese, T.S. (1981). Structural changes after trans-Most structures detected in cells by conventional 2D mitter release at the frog neuromuscular junction. J. Cell Biol. 88,
electron microscopy have dimensions smaller than the 564–580.thinnest tissue sections that can be routinely cut as Heuser, J.E., Reese, T.S., Dennis, M.J., Jan, Y., Jan, L., and Evans,do the beams, ribs, and pegs of the AZM. Our current L. (1979). Synaptic vesicle exocytosis captured by quick freezing
and correlated with quantal transmitter release. J. Cell Biol. 81,understanding of cell biology leads to the prediction275–300.that such structures in general are components of anHorowitz, R.A., Agard, D.A., Sedat, J.W., and Woodcock, C.L. (1994).extensive network of macromolecules distributed through-The three-dimensional architecture of chromatin in situ: electronout a cell’s interior, and that the functions of each com-tomography reveals fibers composed of a continuously variable zig-ponent is partially dependent on its position and associ-zag nucleosomal ribbon. J. Cell Biol. 125, 1–10.
ations within the network. Accordingly, making accurateHsieh, C.E., Marko, M., Frank, J., and Mannella, C.A. (2002). Electron3D maps of the configuration of macromolecules in cellstomographic analysis of frozen-hydrated tissue sections. J. Struct.
using EMT is an essential step toward understanding Biol. 138, 63–73.the molecular basis of cell function and disease. Our Katz, S.B. (1969). The Release of Neural Transmitter Substancesmethods, which generate surface models at the full reso- (Springfield, IL.: CC Thomas).lution of EMT reconstructions, together with the mea- Klemencic, A., Kovacic, S., and Pernus, F. (1998). Automated seg-surement methods enabled by these accurate models, mentation of muscle fiber images using active contour models. Cy-provide the opportunity for structural biologists to take tometry 32, 317–326.a systematic and standardized approach to mapping the Kozerke, S., Botnar, R., Oyre, S., Scheidegger, M.B., Pedersen, E.M.,
and Boesiger, P. (1999). Automatic vessel segmentation using activeconformation and organization of cellular componentscontours in cine phase contrast flow measurements. J. Magn. Re-with macromolecular spatial resolution.son. Imaging 10, 41–51.The methods presented here are part of an integratedKremer, J.R., Mastronarde, D.N., and McIntosh, J.R. (1996). Com-EMT software package called EM3D, available free-puter visualization of three-dimensional image data using IMOD. J.of-charge at http://em3d.stanford.edu. It also containsStruct. Biol. 116, 71–76.
projection-alignment, reconstruction, and extensive 3D-Ladinsky, M.S., Mastronarde, D.N., McIntosh, J.R., Howell, K.E., andvisualization and measurement tools that allow com-Staehelin, L.A. (1999). Golgi structure in three dimensions: functional
plete and efficient analysis of EMT data from raw data insights from the normal rat kidney cell. J. Cell Biol. 144, 1135–1149.to quantitative structural models. Lenzi, D., Runyeon, J.W., Crum, J., Ellisman, M.H., and Roberts,
W.M. (1999). Synaptic vesicle populations in saccular hair cells re-Acknowledgments constructed by electron tomography. J. Neurosci. 19, 119–132.
Li, Y., Leith, A., and Frank, J. (1997). Tinkerbell–a tool for interactiveThis research was funded by the National Institute of Mental Healthsegmentation of 3D data. J. Struct. Biol. 120, 266–275.(Human Brain Project/Neuroinformatics, MH068065), and the Na-Lin, G., Adiga, U., Olson, K., Guzowski, J.F., Barnes, C.A., and Roy-tional Institute of Neurological Disorders and Stroke (NS014506 andsam, B. (2003). A hybrid 3D watershed algorithm incorporating gradi-NS007158).ent cues and object models for automatic segmentation of nucleiin confocal image stacks. Cytometry 56A, 23–36.ReferencesMarko, M., and Leith, A. (1996). Sterecon–three-dimensional recon-
Bajaj, C., Yu, Z., and Auer, M. (2003). Volumetric feature extraction structions from stereoscopic contouring. J. Struct. Biol. 116, 93–98.and visualization of tomographic molecular imaging. J. Struct. Biol. Martone, M.E., Jones, Y.Z., Young, S.J., Ellisman, M.H., Zivin, J.A.,144, 132–143. and Hu, B.R. (1999). Modification of postsynaptic densities afterBocker, W., Rolf, W., Bauch, T., Muller, W.U., and Streffer, C. (1999). transient cerebral ischemia: a quantitative and three-dimensionalAutomated comet assay analysis. Cytometry 35, 134–144. ultrastructural study. J. Neurosci. 19, 1988–1997.Cooper, D.M., Turinsky, A.L., Sensen, C.W., and Hallgrimsson, B. McEwen, B.F., Radermacher, M., Rieder, C.L., and Frank, J. (1986).(2003). Quantitative 3D analysis of the canal network in cortical bone Tomographic three-dimensional reconstruction of cilia ultrastruc-by micro-computed tomography. Anat. Rec. 274B, 169–179. ture from thick sections. Proc. Natl. Acad. Sci. USA 83, 9040–9044.Frank, J. (1992). Electron Tomography: Three-Dimensional Imaging McEwen, B.F., Arena, J.T., Frank, J., and Rieder, C.L. (1993). Struc-with the Transmission Electron Microscope (New York: Plenum ture of the colcemid-treated PtK1 kinetochore outer plate as deter-Press). mined by high voltage electron microscopic tomography. J. Cell
Biol. 120, 301–312.Frank, J., Radermacher, M., Penczek, P., Zhu, J., Li, Y., Ladjadj, M.,and Leith, A. (1996). SPIDER and WEB: processing and visualization McMahan, U.J., and Slater, C.R. (1984). The influence of basal laminaof images in 3D electron microscopy and related fields. J. Struct. on the accumulation of acetylcholine receptors at synaptic sites inBiol. 116, 190–199. regenerating muscle. J. Cell Biol. 98, 1453–1473.Grau, V., Mewes, A.U., Alcaniz, M., Kikinis, R., and Warfield, S.K. Medalia, O., Weber, I., Frangakis, A.S., Nicastro, D., Gerisch, G.,(2004). Improved watershed transform for medical image segmenta- and Baumeister, W. (2002). Macromolecular architecture in eukary-tion using prior information. IEEE Trans. Med. Imaging 23, 447–458. otic cells visualized by cryoelectron tomography. Science 298,
1209–1213.Harlow, M.L., Ress, D., Stoschek, A., Marshall, R.M., and McMahan,U.J. (2001). The architecture of active zone material at the frog’s Ofverstedt, L.G., Zhang, K., Isaksson, L.A., Bricogne, G., and Skog-neuromuscular junction. Nature 409, 479–484. lund, U. (1997). Automated correlation and averaging of three-
dimensional reconstructions obtained by electron tomography. J.He, W., Cowin, P., and Stokes, D.L. (2003). Untangling desmosomalknots with electron tomography. Science 302, 109–113. Struct. Biol. 120, 329–342.

Structure1774
Ortiz de Solorzano, C., Garcia Rodriguez, E., Jones, A., Pinkel, D.,Gray, J.W., Sudar, D., and Lockett, S.J. (1999). Segmentation ofconfocal microscope images of cell nuclei in thick tissue sections.J. Microsc. 193, 212–226.
Perkins, G.A., Renken, C.W., Song, J.Y., Frey, T.G., Young, S.J.,Lamont, S., Martone, M.E., Lindsey, S., and Ellisman, M.H. (1997).Electron tomography of large, multicomponent biological struc-tures. J. Struct. Biol. 120, 219–227.
Ress, D., Harlow, M.L., Marshall, R.A., and McMahan, U.J. (2003).Optimization Method for Isodensity Surface Models Obtained withElectron Microscope Tomography Data. Paper presented at: Engi-neering in Medicine and Biology Society, 2003. Proceedings of the25th Annual International Conference of the IEEE.
Robitaille, R., Garcia, M.L., Kaczorowski, G.J., and Charlton, M.P.(1993). Functional colocalization of calcium and calcium-gated po-tassium channels in control of transmitter release. Neuron 11,645–655.
Sedzik, J., Ofverstedt, L.G., and Skoglund, U. (1992). Three-dimen-sional reconstruction of bovine intradural spinal root myelin by elec-tron microscope tomography. J. Neurosci. Res. 31, 387–393.
Suri, J.S., Liu, K., Singh, S., Laxminarayan, S.N., Zeng, X., and Reden,L. (2002). Shape recovery algorithms using level sets in 2-D/3-Dmedical imagery: a state-of-the-art review. IEEE Trans. Inf. Technol.Biomed. 6, 8–28.
Taylor, K.A., Schmitz, H., Reedy, M.C., Goldman, Y.E., Franzini-Armstrong, C., Sasaki, H., Tregear, R.T., Poole, K., Lucaveche, C.,Edwards, R.J., et al. (1999). Tomographic 3D reconstruction ofquick-frozen, Ca2�-activated contracting insect flight muscle. Cell99, 421–431.
Teo, P.C., Sapiro, G., and Wandell, B.A. (1997). Creating connectedrepresentations of cortical gray matter for functional MRI visualiza-tion. IEEE Trans. Med. Imaging 16, 852–863.
Van Essen, D.C., Drury, H.A., Dickson, J., Harwell, J., Hanlon, D.,and Anderson, C.H. (2001). An integrated software suite for surface-based analyses of cerebral cortex. J. Am. Med. Inform. Assoc. 8,443–459.
van Vliet, L.J., Young, I.T., and Mayall, B.H. (1990). The Athena semi-automated karyotyping system. Cytometry 11, 51–58.
Volkmann, N. (2002). A novel three-dimensional variant of the water-shed transform for segmentation of electron density maps. J. Struct.Biol. 138, 123–129.
Woodcock, C.L., McEwen, B.F., and Frank, J. (1991). Ultrastructureof chromatin. II. Three-dimensional reconstruction of isolated fibers.J. Cell Sci. 99, 107–114.
Wriggers, W., and Chacon, P. (2001). Modeling tricks and fittingtechniques for multiresolution structures. Structure 9, 779–788.
Wu, Q.J., and Bourland, J.D. (2000). Three-dimensional skeletoniza-tion for computer-assisted treatment planning in radiosurgery. Com-put. Med. Imaging Graph. 24, 243–251.
Yezzi, A., Jr., Kichenassamy, S., Kumar, A., Olver, P., and Tannen-baum, A. (1997). A geometric snake model for segmentation of medi-cal imagery. IEEE Trans. Med. Imaging 16, 199–209.
Zavaljevski, A., Dhawan, A.P., Gaskil, M., Ball, W., and Johnson,J.D. (2000). Multi-level adaptive segmentation of multi-parameterMR brain images. Comput. Med. Imaging Graph. 24, 87–98.