Embed Size (px)
Citation preview

STRUCTURE-PROPERTY RELATIONSHIPS OF
MULTIFEORRIC MATERIALS
–A NANO PERSPECTIVE
by
Feiming Bai
Dissertation submitted to the faculty of the
Virginia Polytechnic Institute and State University
in partial fulfillment of the requirement for the degree of
Doctor of Philosophy
in
Materials Science and Engineering
Dr. Dwight D. Viehland, Chair
Dr. Jie-Fang Li
Dr. William T. Reynolds, Jr.
Dr. David Clark
Dr. Robert Hendricks
April 2006
Blacksburg, Virginia
Keywords: multiferroic, functional materials, ferroelectricity, magnetostriciton, domain-
engineering, piezoresponse force microscopy, magnetic force microcopy
Copyright 2006, Feiming Bai

STRUCTURE-PROPERTY RELATIONSHIPS OF
MULTIFEORRIC MATERIALS
–A NANO PERSPECTIVE
Feiming Bai
ABSTRACT
The integration of sensors, actuators, and control systems is an ongoing process in a
wide range of applications covering automotive, medical, military, and consumer
electronic markets. Four major families of ceramic and metallic actuators are under
development: piezoelectrics, electrostrictors, magnetostrictors, and shape-memory alloys.
All of these materials undergo at least two phase transformations with coupled
thermodynamic order parameters. These transformations lead to complex domain wall
behaviors, which are driven by electric fields (ferroelectrics), magnetic fields
(ferromagnetics), or mechanical stress (ferroelastics) as they transform from nonferroic to
ferroic states, contributing to the sensing and actuating capabilities.
This research focuses on two multiferroic crystals, Pb(Mg1/3Nb2/3)O3-PbTiO3 and
Fe-Ga, which are characterized by the co-existence and coupling of ferroelectric
polarization and ferroelastic strain, or ferro-magnetization and ferroelastic strain. These
materials break the conventional boundary between piezoelectric and electrostrictors, or
magnetostrictors and shape-memory alloys. Upon applying field or in a poled condition,
they yield not only a large strain but also a large strain over field ratio, which is desired
and much benefits for advanced actuator and sensor applications. In this thesis, particular
attention has been given to understand the structure-property relationships of these two
types of materials from atomic to the nano/macro scale. X-ray and neutron diffraction
were used to obtain the lattice structure and phase transformation characteristics.
Piezoresponse and magnetic force microscopy were performed to establish the
dependence of domain configurations on composition, thermal history and applied fields.

iii
It has been found that polar nano regions (PNRs) make significant contributions to
the enhanced electromechanical properties of PMN-x%PT crystals via assisting
intermediate phase transformation. With increasing PT concentration, an evolution of
PNR PND (polar nano domains) micron-domains macro-domains was found. In
addition, a domain hierarchy was observed for the compositions near a morphotropic
phase boundary (MPB) on various length scales ranging from nanometer to millimeter.
The existence of a domain hierarchy down to the nm scale fulfills the requirement of low
domain wall energy, which is necessary for polarization rotation. Thus, upon applying an
E-field along <001> direction(s) in a composition near the MPB, low symmetry phase
transitions (monoclinic or orthorhombic) can easily be induced. For PMN-30%PT, a
complete E-T (electric field vs temperature) diagram has been established.
As for Fe-x at.% Ga alloys, short-range Ga-pairs serve as both magnetic and
magnetoelastic defects, coupling magnetic domains with bulk elastic strain, and
contributing to enhanced magnetostriction. Such short-range ordering was evidenced by a
clear 2θ peak broadening on neutron scattering profiles near A2-DO3 phase boundary. In
addition, a strong degree of preferred [100] orientation was found in the magnetic
domains of Fe-12 at.%Ga and Fe-20 at.%Ga alloys with the A2 or A2+DO3 structures,
which clearly indicates a deviation from cubic symmetry; however, no domain alignment
was found in Fe-25 at.%Ga with the DO3 structure. Furthermore, an increasing degree of
domain fluctuations was found during magnetization rotation, which may be related to
short-range Ga-pairs cluster with a large local anisotropy constant, due to a lower-
symmetry structure.

iv
To my parents and wife,

v
ACKNOWLEDGMENTS
I would like to express my sincere gratitude to my advisors, Prof. Dwight Viehland
and Prof. Jiefang Li, for their faith, guidance and support throughout the course of my
Ph.D research.
I have tremendous respect to Prof. Dwight Viehland for his knowledge, wisdom and
passion for research. I benefited from his guidance in every aspect and step during my
Ph.D study, including his class of “Advanced Functional Materials”, the discussions we
held and all those sparking suggestions he made regarding my research, his patience
when correcting my papers, proposals and thesis, and his assistance on my preparation for
seminar and conference talks. I deeply appreciate all these invaluable help. In addition, he
has been always excited about every small step forward I have made. He always makes
me and other group members feel that we could do anything. This is the exact feeling I
have been dreaming to be a materials scientist.
Also, Prof. Jiefang has given me great helps in almost all equipment and facilities set-
up. She generously shared all her knowledge and experience in experimental techniques.
Without her help, my research would not be so successful.
I would like to thank Prof. William Reynolds for all the valuable discussion we held
on magnetostrictive materials and shape memory alloys as related to this project.
I would like to thank Prof. David Clark and Prof. Robert Hendricks for serving in my
committee and taking time out of their busy schedules to evaluate my work.
I would like to give my special acknowledgements to Dr. Peter Gehring at Neutron
Center of National Institute of Standards and Technologies, Dr. Guangyong Xu and Dr.

vi
Gen Shirane at Brookhaven National Laboratory, who greatly helped me to develop
expertise in X-ray diffraction and neutron scattering and revised my first important
science publication.
I would like to thank Dr. Tom Lograsso at Ames Laboratory for supplying Fe-Ga
crystals and giving valuable suggestions on the interpretation of XRD and MFM results.
I would like to thank Hu Cao and Naigang Wang. We have had very close
cooperation on the structure studies of PMN-PT and Fe-Ga crystals.
I would like to thank Dr. Shuxiang Dong for all the discussion we held in the view of
real application of current project.
I would like to thank Dr. Carlos Suchicital and David Berry for all the technical
support.
I thank John Bai and all other group members, Yan Li, Junyi Zai and Zengping Xing.
It will be always a good memory to work with these guys.
The most important acknowledgment was saved for last. I would like to express my
gratitude to my parents and my wife, Carol Li. They have been constantly providing faith,
encourage and enjoyment during my Ph.D study.

vii
TABLE OF CONTENTS ABSTRACT....................................................................................................................... ii
ACKNOWLEDGEMENTS ............................................................................................. v
TABLE OF CONTENTS ............................................................................................... vii
ACRONYMS..................................................................................................................... x
LIST OF TABLES ........................................................................................................... xi
LIST OF FIGURES ........................................................................................................ xii
1 INTRODUCTION................................................................................................. 1
1.1 Ferroics and multiferroics .............................................................................. 1
1.2 Ferroelectric and ferroelastic biferroics ......................................................... 4
1.2.1 Origin of ferroelectricity and piezoelectricity....................................... 5
1.2.2 Ferroelectric phase transformations...................................................... 7
1.2.3 Prior investigations of relaxor ferroelectrics....................................... 10
1.2.4 Domain engineering in relaxor-normal ferroelectric solutions........... 18
1.3 Ferromagnetic and ferroelastic-like biferrorics ........................................... 27
1.3.1 Origin of magnetostriction.................................................................. 28
1.3.2 Large magnetostriction in binary alloys ............................................. 30
1.3.3 Prior investigations of Fe-Ga (Al) alloys ........................................... 34
2 PURPOSE OF THIS THESIS ........................................................................... 38
3 EXPERIMENT TECHNIQUES........................................................................ 41
3.1 Preparation of samples................................................................................. 41
3.1.1 Pb(Mg1/3Nb2/3)O3-PbTiO3 single crystals ........................................... 41
3.1.2 Fe-Ga single crystals........................................................................... 43
3.2 Characterization methods............................................................................. 45
3.2.1 X-ray diffraction ................................................................................. 45
3.2.2 Triple-axis neutron scattering ............................................................. 47
3.2.3 Scanning force microscope (SFM) ..................................................... 50
3.2.4 Piezoresponse force microscopy (PFM) ............................................. 52
3.2.5 Magnetic force microscopy (MFM).................................................... 57
4 ROLE OF PNR IN DOMAIN-ENGINEERED PMN-PT CRYSTALS......... 61
4.1 Introduction.................................................................................................. 61

viii
4.2 Phase transformation sequence of PMN-30%PT under E-field .................. 65
4.2.1 XRD investigations............................................................................. 67
4.2.2 Neutron scattering investigations........................................................ 78
4.2.3 Discussion and summary .................................................................... 80
4.3 Domain hierarchy in PMN-x%PT crystals .................................................. 86
4.3.1 Domain evolution with various compositions .................................... 86
4.3.2 Characterization of domain structures over various length scales...... 90
4.3.3 Evolution from PNR to macro domain ............................................... 95
4.4 Domain configurations of after-poled PMN-x%PT..................................... 99
4.4.1 Domain structures in the field-cooled condition................................. 99
4.4.2 Comparison of domain structures in the ZFC and FC conditions .... 106
4.4.3 Origin of domain-engineered state.................................................... 107
4.5 Polarization switching in (001)_oriented PMN-x%PT.............................. 112
4.6 Summary .................................................................................................... 118
5 ROLE OF INHOMOGENETIES IN FE-GA CRYSTALS .......................... 120
5.1 Introduction................................................................................................ 120
5.2 Structural investigations by neutron scattering.......................................... 124
5.3 Magnetic domain structures of Fe-x at.% Ga ............................................ 135
5.3.1 MFM images..................................................................................... 135
5.3.2 Fast Fourier Transformation analysis of MFM images .................... 141
5.3.3 Discussion and summary .................................................................. 144
5.4 Magnetic domain rotation in Fe-x at.% Ga................................................ 149
5.5 Summary .................................................................................................... 157
6 CONCLUSION AND FUTURE WORK ........................................................ 159
6.1 Conclusion ................................................................................................. 159
6.2 Recommendations on future work ............................................................. 161
6.2.1 What is the stable phase of poled PZN-8%PT at low temperature... 161
6.2.2 Can “PNRs” be created by strain engineering? ............................... 162
6.2.3 Neutron scattering of Fe-Ga crystals under magnetic fields............. 163
6.2.4 Magnetic domain structures of Fe-Ga alloys under stress ................ 163

ix
REFERENCE................................................................................................................ 165
VITA............................................................................................................................... 174

x
ACRONYMS AC Alternative Current
AFM Atomic Force Microscopy
DC Direct Current
FFT Fast Fourier Transformation
FC Field cooling
M Monoclinic
MFM Magnetic force microscopy
MPB Morphotropic phase boundary
MT Martensitic transition
O Orthorhombic
R Rhombohedral
PA Post Annealing
PFM Piezo-response force microscopy
SFM Scanning Force Microscopy
SPM Scanning Probe Microscopy
T Tetragonal
XRD X-ray Diffraction
ZFC Zero Field Cooling

xi
LIST OF TABLES
Table 1-1. Magnetostriction of some materials at room temperature .............................. 29
Table 3-1. MFM cantilevers used in this thesis (standard data sheet by Veeco) ............. 60
Table 4-1. Lattice parameter for the PMN-30%PT at 350K with increasing electric filed, measured by XRD. Errors = +0.002Å ........................................................... 77
Table 4-2. Lattice parameters of PMN-30%PT under zero-field, measured by neutron scattering. Errors= +0.001Å............................................................................ 77

xii
LIST OF FIGURES
Fig.1-1. Schematic illustrate of a hysteresis loop showing the coercive field, remnant and saturation strain, polarization and magnetization. ............................................... 2
Fig.1-2. Schematic illustration of functional ferroic and multi-ferroic materials............... 3
Fig.1-3. A BaTiO3 unit cell in an isometric projection and viewed looking along one face, which shows the displacement of Ti4+ and O2- ions from the center of the face. 6
Fig.1-4. Polarization vs. temperature plot for: (a). 2nd order phase transition; (b). 1st order phase transition .................................................................................................... 8
Fig.1-5. Dielectric permittivity of BaTiO3 single crystals as a function of temperature under weak E-field. All phase transitions from high to low temperature are the first order.............................................................................................................. 9
Fig.1-6. (a) Dielectric constant of PMN-10%PT as a function of temperature at measurement frequencies of 0.1, 0.2, 0.4, 1, 2, 4, 10, 20, 40 and 100 KHz. The highest dielectric response is the 0.1 KHz curve, the loest is the 100 KHz curve, and the other curves between are in order of increasing frequency. (b)-(d): Polarization curves at various temperatures. The solid points are the experimental data measured at -50, 10, 50 and 110oC, respectively ................. 11
Fig.1-7. Logarithmic color contour plot of the neutron inelastic scattering intensity measured in PZN at 500 K in the (200) Brillouin zone. Yellow represents the highest intensity. The vertical red region around k = 0.14 r.l.u. corresponds to the waterfall anomaly in which the TO phonon branch appears to plummet into the TA branch .................................................................................................... 14
Fig.1-8. Bright-field images for various PMN-PT compositions: (a) 90/10, (b) 80/20, (c) 65/35, and (d) 40/60. For PMN-PT 90/10, polar nanodomains are clearly evident. The average size of these polar nanodomains was 50 Å. .................................. 15
Fig.1-9. (a) The PZT phase diagram; and (b) the corresponding dielectric constant and electromechanical coupling factor kp dependence on composition ................... 17
Fig.1-10. The piezoelectric coefficient d33 dependence on PT concentration, (a) PZN-x%PT and (b) PMN-x%PT ................................................................................ 19
Fig.1-11. Strain vs. electric field of several piezoelectric ceramics and single crystals... 20
Fig.1-12. (a) Phase diagram of the PMN-PT solid solution system. The data points come from published results by Noheda et al.9 (b) Polarization rotation path in the perovskite MA and MC unit cell. C, R, T, O and M refer to cubic, rhombohedral, tetragonal, orthorhombic and monoclinic regions, respectively........................ 22

xiii
Fig.1-13. Schematic representation of the martensitic phase plate composed of twin-related lamellae of two orientation variants of the martensitic phase. The appropriate d1-to-d2 ratio completely accommodates the martensite-toparent phase macroscopic transformation strain mismatch along the habit plane........ 25
Fig.1-14. Magnetostrictive elongation as a function of applied magnetic field ............... 27
Fig.1-15. Saturation magnetostriction measured at room temperature for FexGa1-x and FexAl1-x. (b) Recent updated data by A. E. Clark et al....................................... 32
Fig.1-16. Phase equilibrium between the A2 and DO3 or B2 phases in Fe-x at.%Ga in comparison of Fe-x at.%Al alloys ..................................................................... 33
Fig.1-17. Shear elastic constants ½ (C11–C12), circles, and C44 , squares, of bcc Fe–Ga solid solutions, full symbols, determined in this study. The open symbols represent the elastic constants of bcc Fe–Al solid solutions.............................. 35
Fig.1-18. Schematic illustration of modified DO3 and B2-like lattice structure. ............. 37
Fig.3-1. Phase diagram of PMN-x%PT crystalline solutions. Of particular interests are 10PT (Cubic), 20PT (Rhombohedral), 30PT (Rhombohedral), 35PT (Monoclinic+Tetragonal) and 40PT (Tetragonal), as labeled by red circle....... 42
Fig.3-2. Phase equilibrium between the A2 and DO3 or B2 phases in Fe-x at.%Ga alloys. Of particular interests are 12Ga, 20Ga and 25Ga locating in A2, A2+DO3 and DO3 phase regions, as marked by red arrows.................................................... 44
Fig.3-3. Schematics illustration of (a) Philips MPD high resolution x-ray diffractometer; and (b) (200) and (002) mesh scans in the reciprocal (H0L) zone, which are same with two ω-2θ mesh scans in the real space ............................................. 46
Fig.3.4. Schematic diagram of neutron triple-axis spectrometer (http:// www.physics.uc.edu/ ~jph/emma/tas.html) ................................................... 49
Fig.3-5. Force deflection versus tip-sample vertical distance plot. Contact mode works in the repulsive force range with preset cantilever deflection, “setpoint”; tapping mode works in the attractive force range with preset cantilever oscillation amplitude, “setpoint”. The “setpoints” are labeled by two color bars, and light color corresponds to the increase of either repulsive or attractive force ........... 51
Fig.3-6. Principle of piezoresponse SFM (a) No topographic contrast if no voltage is applied. (b) A change in thickness occurs for a positive voltage applied to the tip (or during the positive half periods of an AC voltage). (c) Opposite thickness changes for a negative voltage (or during the negative half periods) ................ 53
Fig.3-7. Schematic illustration of piezoresponse force microscopy set-up, Vecco DI3100a............................................................................................................................. 56

xiv
Fig.3-8. Schematic illustration of MFM working at a lifted taping mode........................ 58
Fig.4-1. E-T diagram. Top panel is obtained from FC structural measurements. Bottom panel shows data from the increasing electric-field process after ZFC. Arrows indicate the scanning directions and ranges of the corresponding measurement sequences. Circles represent the transition temperatures and fields determined from each sequence............................................................................................ 66
Fig.4-2. The dependence of the lattice parameters (top panel) and α (bot-tom panel) on temperature under zero electric field ................................................................. 68
Fig.4-3. Sketch of the unit cell and domain configuration in the reciprocal (h 0 l) plane for monoclinic phases, (a) top: unit cell of MA phase; bottom: domain configuration in reciprocal space, illustrating the two a domains of MA; and (b) top: unit cell of MC phase; bottom: domain configuration in reciprocal space, illustrating the two a domains (unshaded) and one b domain (shaded) of MC phase .................................................................................................................. 70
Fig.4-4. Mesh scans around the (200) and (220) reciprocal lattice positions at different temperatures in field-cooled process ................................................................. 73
Fig.4-5. Temperature dependence of the lattice parameters (top panel), and 90°-β (bottom panel) observed in field-cooled process. For the MA phase, the lattice parameters aMa/√2, bMa/√2 and cMa are plotted; whereas, for the MC phase the lattice parameters aMc, bMc and cMc are plotted. Solid lines drawn through the data points are guides to the eyes....................................................................... 74
Fig.4-6. (200) mesh scan at 350K with increasing field, which clearly shows a sequential phase transition from R MA MC T............................................................. 76
Fig.4-7. Neutron (220) profiles for PMN-30%PT. The sample was cooled under E=0. The solid lines are fits described in the text. The inset shows a neutron intensity contour around the pseudo-cubic (200) reflection in the H0L zone at 300K, which confirms the existence of the MA phase in the FC condition. These data were all taken using a perfect crystal Ge (004) analyzer ................................... 79
Fig.4-8. Temperature dependence of dielectric constant of PMN-30%PT PT (a) zero field cooled at E=0; (b) field cooled at E=1 kV/cm; and (c) Curie-Weiss plot of field cooled at E=1 kV/cm. The dashed lines indicate the phase range determined by XRD studies ....................................................................................................... 83
Fig.4-9. Temperature dependence of dielectric constant of PMN-30%PT during field cooling at a frequency of 100kHz, (a) k vs. T plot and (b) Curie-Weiss plot. The dashed lines indicate the phase range determined by XRD studies under E=2kV/cm.......................................................................................................... 85
Fig.4-10. Piezoresponse force images for various (001)-oriented PMN-x%PT crystals.. 88

xv
Fig.4-11. Fast Fourier Transformation of images in Fig.4-1............................................ 89
Fig.4-12. Domain hierarchy of (001)-orientated PMN-30%PT in R phase. (a) Spindle-like macrodomain plates with a <110> type preferred orientation by POM; (b) wave-like self-assembled domains by PFM; (c) high resolution PFM image illustrating non-smooth domain boundaries and irregularity; and (d) cross-sectional line analysis normal to [110]..................................................................................... 91
Fig.4-13. Domain hierarchy of (001)-orientated PMN-35%PT in Mc phase. (a) Stripe-like macrodomain plates with a [010] type preferred orientation by POM; (b) micro domain striations with a <110> type preferred orientation by PFM, kinks are illustrated at boundaries; (c) high resolution PFM image, illustrating non-smooth domain boundaries and irregularities; and (d) cross-sectional line analysis normal to [110]..................................................................................... 92
Fig.4-14. Domain hierarchy of (001)-orientated PMN-40%PT in T phase. (a) Stripe-like macrodomain plates with a <100> type preferred orientation by POM; (b) <100> orientated stripe-like micro domains with fibrous sub-domain structures by PFM; (c) high resolution PFM image, illustrating domain irregularity; and (d) cross-sectional line analysis normal to [100]..................................................... 94
Fig.4-15. XRD of PMN-x%PT (x=10, 20, 30, 35 and 40), (a) (200) line scans; and (b) (110) line scans. Note the left asymmetric (200) peak of PMN-30%PT........... 96
Fig.4-16. Schematic illustration of domain evolution from PNR to macrodomain plate with respect to relevant phase symmetries in PMN-x%PT crystals ................. 98
Fig.4-17. Domain hierarchy of (001)-orientated PMN-20%PT in the ZFC and FC conditions. (a) Lack of macro-domain plates in the POM image for the ZFC condition, a similar image was found for the FC condition; (b) PFM image for the ZFC condition; and (c) PFM image for the FC condition.......................... 100
Fig.4-18. Domain hierarchy of (001)-orientated PMN-30%PT in the FC condition, which is of the MA phase. (a) Spindle-like macro domains with <110> preferred orientation by POM; (b) identification of polar nano-domains or PND by PFM; (c) high resolution PFM image illustrating size of PND; (d) cross-sectional line analysis normal to [110]................................................................................... 103
Fig.4-19. Domain hierarchy of (001)-orientated PMN-35%PT in the FC condition, which is of the MC phase. (a) Stripe-like macro domains with [100] preferred orientation by POM; (b) domain striations with either [110] or [001] preferred orientation by PFM, which are of notably smaller length than those of the ZFC condition; (c) high resolution PFM image; (d) cross-sectional line analysis normal to [100] ................................................................................................ 104
Fig.4-20. Domain hierarchy of (001)-orientated PMN-40%PT in the FC condition, which is of the T phase. (a) Stripe-like macro domains with <100> preferred orientation by POM; (b) [100]-orientated strip-like micro domains with fibrous

xvi
sub-domain structures by PFM; (c) high resolution PFM image illustrating irregularity; (d) cross-sectional line analysis normal to [010] ......................... 105
Fig.4-21. Structure of a polydomain martensitic plate consisting of alternating lamellae of two twin-related orientation variants (domains) of the martensite shown by black and white. The boundary between the lamellae is the twin plane. The ratio of the “black” and “white” domain thicknesses provides the macroscopic invariancy of the habit plane. These plates fully fill a sample......................... 109
Fig.4-22. PFM images for a (001)-oriented PMN-20%PT crystal under various dc electrical voltages, top center: the initial annealed condition; left-hand column: under positive bias on the bottom electrode; right-hand column: under negative bias on the bottom electrode ............................................................................ 115
Fig.4-23. PFM images for a (001)-oriented PMN-35%PT crystal under various dc electrical voltage, top center: the initial annealed condition; left-hand column: under positive bias on the bottom electrode; right-hand column: under negative bias on the bottom electrode ............................................................................ 116
Fig.5-1. (3/2)λ100 as a function of Ga concentration for furnace cooled, quenched and directionally solidified Fe100-xGax. (Ref.)......................................................... 121
Fig.5-2. (a) (002) and (b) (200) mesh scans of Fe-12 at.%Ga alloy in the (H0L) zone, where Qx corresponds to (H, 0, 0) and Qz corresponds to (0, 0, L). ................ 125
Fig.5-3. (a) (002) and (b) (200) line scans of Fe-12 at.%Ga alloy in the (H0L) zone, where Qx corresponds to (H, 0, 0) and Qz corresponds to (0, 0, L) ................. 126
Fig.5-4. (a) (002) and (b) (200) mesh scans of Fe-20 at.%Ga alloy in the (H0L) zone, where Qx corresponds to (H, 0, 0) and Qz corresponds to (0, 0, L) ................. 128
Fig.5-5. (a) (002) and (b) (200) line scans of Fe-20 at.%Ga alloy in the (H0L) zone, where Qx corresponds to (H, 0, 0) and Qz corresponds to (0, 0, L). Red lines were fitted by single Gaussian curve; green lines were fitted by two Gaussian curves ............................................................................................................... 129
Fig.5-6. (a) (002) and (b) (200) mesh scans of Fe-25 at.%Ga alloy in the (H0L) zone, where Qx corresponds to (H, 0, 0) and Qz corresponds to (0, 0, L) ................. 131
Fig.5-7. (a) (002) and (b) (200) line scans of Fe-25 at.%Ga alloy in the (H0L) zone, where Qx corresponds to (H, 0, 0) and Qz corresponds to (0, 0, L) ................. 132
Fig.5-8. MFM images of the (001) surface of Fe-12 at.% Ga at furnace cooled condition, (a) and (c); and after being post-annealed, (b) and (d). Region A shows an area populated by domains preferentially aligning along [100] direction and region B shows broken domains and magnetic closure patterns .................................... 136

xvii
Fig.5-9. MFM images of the (001) surface of Fe-20 at.% Ga at furnace cooled condition, (a) and (c); and after being post-annealed, (b) and (d) .................................... 138
Fig.5-10. MFM images of the (001) surface of Fe-25 at.% Ga in the furnace-cooled state, (a) and after being post-annealed, (b), to show similar domain structures less preferentially aligned along [010].................................................................... 140
Fig.5-11. FFM images of (001) surface of Fe-12 at.% Ga, (a) and (b); Fe-20 at.% Ga, (c) and (d); and Fe-25 at.% Ga in the furnace-cooled and post-annealed state, respectively. The insets are the FFT images corresponding to Figure 3 (c) and (d) with fine domain structure to show domain hierarchy in different scales. Both of the insets have a frequency scale from 20 µm-1 to DC .................................... 143
Fig.5-12. X-ray diffraction line scans taken along the (002) zone for (a) Fe-20at%Ga in the furnace-cooled and post-annealed conditions; and (b) various (001)-oriented Fe-x%Ga crystal in the as-grown condition for 12<x<25 ............................... 145
Fig.5-13(a). Magnetic domain configuration of Fe-19.5 at.% Ga crystal during magnetization rotation under magnetic field normal to the (001) surface. Image size 40×40 µm2. ............................................................................................... 150
Fig.5-13(b). Magnetic domain configuration of Fe-19.5 at.% Ga crystal during magnetization rotation under magnetic field normal to the (001) surface. Image size 10×10 µm2. Bottom- the closure-type domain before and after applying magnetic field................................................................................................... 151
Fig.5-14. Magnetic domain configuration of Fe-19.5 at.% Ga crystal during magnetization rotation under magnetic field parallel to the (001) surface. Left column: Image size 10×10 µm2; right column: Image size 40×40 µm2 .......... 152
Fig.5-15. Magnetic domain structures of Fe-25 at.% Ga before applying field, Part (a); upon applying step-increased fields of H=~400 and 800 Oe normal to the surface, Part (b) and (c); and after removal of magnetic field, Part (d) ........... 155
Fig.5-16. Change in the reconstructed phase images with cooling in a Ni51Fe22Ga27 alloy heat-treated at 1473 K. The images were obtained for the same area as those of Figs. 1(b)–1(d). Black lines represent the lines of magnetic flux projected along the incident electron beam. Arrows indicate the direction of magnetic flux. [Ref.].......................................................................................................................... 156

- 1 -
I. INTRODUCTION
1.1 Ferroics and multiferroics
A ‘primary ferroics’ is a general term that includes ferromagnetic, ferroelectric, and
ferroelastic materials.1-2 Generally, ferroic crystals have three characteristics: (i) a
spontaneous order parameter (magnetization, electric polarization or elastic deformation);
(ii) the occurrence of multiple domain states over whose length scale the order parameter
is essentially uniform, and whose boundaries move under an external field; and (iii)
hysteresis caused by field-induced domain motion during order parameter reversal. A
hyteresis loop of three primary ferroics and their important parameters are illustrated in
Fig1-1. The properties of ferroic materials are often superior to conventional materials
because of their spontaneous order parameters and large nonlinear coefficients. Due to
inherent structural nonlinearity, such ferroic properties render sensors more sensitivity
and actuators more powerful.
“Multiferroics” are characterized by the co-existence of more than one spontaneous
order parameter.3 Accordingly, these materials have at least (i) two types of hysteresis
loops; (ii) two types of domain structures and (iii) exchange between primary order
parameters. The relation between multiferroic and primary ferroics are shown in Figure 2,
where A represents the coexistence of magnetization and electric polarization; B the
coexistence of electric polarization and ferroelastic strain; C the coexistence of
magnetization and ferroelastic strain; and D the coexistence of all these spontaneous
order parameters. For primary ferric materials, an order parameter only appears below a
certain critical symmetry transformation temperature and domain states can only be

- 2 -
Fig.1-1. Schematic illustrate of a hysteresis loop showing the coercive field, remnant and
saturation strain, polarization and magnetization.

- 3 -
Fig.1-2. Schematic illustration of functional ferroic and multi-ferroic materials.

- 4 -
switched by a field that is conjoint to the order parameter. In the contrast, the Curie
temperature of a multiferroic material is dependent on multiple ordering fields (magnetic
field, electric field or stress). Accordingly, their domain states can be switched by more
than one field type. For example, magnetoelectric (ME) materials are characterized by the
switching of an electric polarization upon applying a magnetic or electric field, and vice
verse.4 Clearly, multiferroic materials can offer the potential for revolutionary device
designs, as they are at the heart of multifunctionality.
1.2 Ferroelectric and ferroelastic biferroics
To possess a spontaneous polarization, a crystal must lack a center of symmetry. In
addition, the spontaneous polarization must be switchable by an applied electric field, i.e.
at least two equivalent crystallography orientations for different polarization vectors.5
Amongst the 32 crystal point groups, twenty-one crystal classes do not have a center of
symmetry and thus (i) have one or more polar orientations, and (ii) possess odd-rank
tensor properties. The only exception is the group 432, which lacks a center of symmetry,
but has other symmetry operations that destroy polarity. All non-centrosymmetric point
groups exhibit a piezoelectric effect that is defined by a change in electric polarity under
applied stress, and vice versa. Out of the twenty piezoelectric classes, ten possess a
unique polar axis, the spontaneous polarization of which depends on temperature. This is
called the pyroelectric effect. Ferroelectric crystals belong to the pyroelectric family,
which in addition has a spontaneous polarization that can be reversed by external electric
field, i.e. more than one equivalent direction for Ps.6 It is clear that a ferroelectric material
must be simultaneously piezo- and pyro-electrics.

- 5 -
1.2.1 Origin of ferroelectricity and piezoelectricity
The most extensively studied and widely used ferroelectric materials have the
perovskite structure. A perfect perovskite structure has a general formula of ABO3, where
A represents a divalent or trivalent cation and B is typically a tetravalent or trivalent
cation. The A ions occupy the corners of the cube, while the B ions sit on the body center
positions inside an oxygen octahedron, which are at the face center positions. The B-site
ions can move relative freely inside the oxygen octahedron with relative small restoring
force.
Barium titanate (BaTiO3) is the most well-known ferroelectric material and can serve
as an excellent example to illustrate the ferroelectricity and piezoelectricity in perovskite
structures. The tetravalent Ti4+ ions occupy the B site of the BaTiO3 perovskite structure
and are surrounded by O2- in the octahedral configuration. At high temperature (T>Tc),
although the open octahedral structure allows the Ti4+ ions to move from one position to
another, there is no spontaneous alignment of the dipoles due to random thermal vibration.
In this cubic symmetric configuration, the material is paraelectric, (i.e. no net dipole
moment). At a temperature below Tc, the structure changes from cubic to tetragonal (T)
with the Ti4+ ions in an off-center position giving rise to a net dipole moment along the c-
axis (spontaneous polarization direction), as illustrated in Fig.1-3. Accordingly,
polarization formation rises a transformation to a tetragonal lattice structure. At lower
temperatures, a sequence of phase transformations was reported in BaTiO3: in T R
(rhombohedral) with a <111> spontaneous polarization, and a subsequent R O
(orthorhombic) with a <110> spontaneous polarization.7 The spontaneous polarization

- 6 -
Fig.1-3. A BaTiO3 unit cell in an isometric projection and viewed looking along one face, which
shows the displacement of Ti4+ and O2- ions from the center of the face.
- 7 -
direction is coupled to lattice structure via electrostriction, and the differential of the
electrostrictive strain over applied electric field (E-field) gives rise to piezoelectricity.
1.2.2 Ferroelectric phase transformations
As stated in last section, ferroelectric phase transformations involve a change in
symmetry of a crystal. Such structural phase transitions can be classified as continuous
or discontinuous. If the spontaneous polarization varies continuously with temperature
and tends towards zero at the transition temperature, as shown in Fig.1.4(a), it is said to
be a second order transition. However, if the spontaneous polarization abruptly changes
at the transition temperature, as shown in Fig.1.4(b), it is said to be a first order
transition. In the case of continuous phase (2nd order) transformation, the symmetry
group of the ferroelectric phase is a subgroup of that of the paraelectric state. However,
for a 1st order transformation, there is no such simple relation between the symmetries of
the two phases.
A popular and useful way to identify a ferroelectric phase transformation is the
temperature dependence of the dielectric constant. Fig.1-5 shows the dielectric constant
(κ) of BaTiO3 single crystals as a function of temperature.[7] In this figure, a phase
transformation sequence of C T O R can be seen with decreasing temperature. The
order of each transition can be determined by Curie-Weiss plots (1/κ vs T). If 1/κ
approaches zero at Tc, then the transition is 1st order; whereas if 1/κ approaches a finite
value at Tc, then it is a 2nd order transition.

- 8 -
Fig.1-4. Polarization vs. temperature plot for: (a). 2nd order phase transition; (b). 1st order phase
transition.
Temperature
Pola
riza
tion
(a) (b)

- 9 -
Fig.1-5. Dielectric permittivity of BaTiO3 single crystals as a function of temperature under weak
E-field. All phase transitions from high to low temperature are the first order. [Ref.7]

- 10 -
1.2.3 Prior investigations of relaxor ferroelectrics
Relaxor behavior
Relaxor behavior was first found in bismuth and strontium titanate (BST).8 The
complex permittivity is strongly frequency dependent, where the temperature of the
dielectric maximum shifts to higher temperature with increasing measurement frequency.
Smolenski et al. have reported similar relaxation behavior in the zero-field-cooled (ZFC)
state of Pb(Mg1/3Nb2/3)O3 (PMN).9 Bokov found slim polarization vs. electric field (P-E)
loop near the dielectric maximum temperature; whereas fat hysteretic P-E response at
lower temperature.10 He also identified the presence of “normal” domains in the field-
cooled (FC) state. Consequently, these materials became known as relaxor ferroelectrics
to contrast their dual nature which had previously been believed to be mutually exclusive,
i.e. having both the characteristics of a classic relaxational dielectric in the ZFC state and
a normal ferroelectric in the FC state. In crystalline solutions, such as PMN-PT, the
relative phase stability of normal and relaxor ferroelectric states can be tailored by
changing the PT concentration, as will be discussed latter.
Cross has summarized the basic features of PMN relaxors, which are applicable to
other relaxors,11 including: (1) a broadening of the complex dielectric constant where the
peak value of dielectric constant (ε’max) decreases with increasing measurement
frequency; (ii) a lack of macro symmetry changes that can be detected by X-ray or
neutron diffraction near or below the dielectric anomaly; and (iii) slim hysteresis loop
instead of normal square one near Tmax. These basic relaxor characteristics are illustrated
in Fig.1-6, where the temperature dependence of dielectric constant and polarization of
PMN-10%PT is given.12-13

- 11 -
Fig.1-6. (a) Dielectric constant of PMN-10%PT as a function of temperature at measurement
frequencies of 0.1, 0.2, 0.4, 1, 2, 4, 10, 20, 40 and 100 kHz. The highest dielectric response is the
0.1 kHz curve, the lowest is the 100 KHz curve, and the other curves between are in order of
increasing frequency. (b)-(d): Polarization curves at various temperatures. The solid points are the
experimental data measured at -50, 10, 50 and 110oC, respectively. [Ref.12-13]

- 12 -
Presence of polar nano-regions (PNR)
Burns and Docal observed that the optical index of refraction for the (Pb1-
3x/2Lax)(ZryTi1-y)O3 (PLZT) relaxor deviated from a linear temperature dependence until
temperatures significantly higher than Tmax.14 These results were interpreted in terms of
the occurrence of local polarizations at an onset temperature (denoted as TBurns or Td) far
above Tmax. For PMN relaxors, Td was determined to be ~620 K. The nonlinearity in the
index of refraction was attributed to a coupling of the local polarization to the optical
constants via the quadratic electro-optic coefficients. The degree of deviation from
linearity was found to significantly increase with decreasing temperature, indicating an
increase in the volume fraction of the local polar moments.
Soft mode and nature of PNR
The concept of a “soft mode” is relevant to the fundamental understanding of the
structural aspects of normal ferroelectric transformations. It is known in displacive
transformations that the ferroelectric phase is realized by minute thermal displacements
of atoms in the paraelectric state. It was the idea of Cochran and Anderson that when the
frequency of transverse optic (TO) phonon approaches zero, a structural transformation to
a ferroelectric phase occurs.[15-16] In ferroelectric phases, the soft modes are infrared
active and of long wavelength. Such mode softening develops due to the cancellation of
short- and long-range forces. By use of lattice dynamics, the ferroelectric transformation
can be associated with the condensation of a soft mode in the Brillourin-zone center (i.e.
q=0, where q is the wave vector). The existence of a soft transverse optic phonon mode
has been documented in numerous perovskite including PbTiO3, BaTiO3, SrTiO3 and

- 13 -
KTaO3. In the case of PbTiO3, the frequency of the lowest-lying TO mode drops when
cooled from high temperature and condenses at a (first-order) transition temperature
Tc=763 K.[17]
However, in the case of PMN and PZN relaxors, a soft transverse optic mode has
only been seen at a temperature above Td, which is hundreds of degrees higher than the
ferroelectric transition temperature. In the temperature range between Tc and Td, lattice
dynamical studies by Naberezhnov et al. have shown the transverse optic and transverse
acoustic (TA) mode dispersion.[18] In addition, neutron inelastic scattering by Gehring et
al. has revealed an unusual feature where the TO branch appears to drop into the TA
branch around a q of 0.15 reciprocal lattice unit (1 rlu=1.545 Ǻ-1), as shown in Fig.1-7.19
This feature was latter designated as the “waterfall” and was believed due to an unusual
damping mechanism that effectively freezes out the long-wavelength TO modes. The
polar nano regions are the most plausible cause of this damping. If one assumes that the
waterfall peak position in q gives a measure of the size of the PNR according to 2π/q, one
obtains a value of 30 Ǻ, or about 7-8 unit cells, consistent with the conjecture of Burns
and Dacol.14
Finally, polar nano-regions in PMN have been directly imaged by transmission
electronic microscopy (TEM), as shown in Fig.1-8. They appeared to be fine-scale
contrast in the bright field images.20 Accordingly, relaxors like PMN and PZN are not
homogeneous ordered crystals but rather a 0-3 nanocomposite of ferroelectric “displaced
polar nanoregions” embedded in cubic matrix.

- 14 -
Fig.1-7. Logarithmic color contour plot of the neutron inelastic scattering intensity measured in
PZN at 500 K in the (200) Brillouin zone. Yellow represents the highest intensity. The vertical
red region around k = 0.14 r.l.u. corresponds to the waterfall anomaly in which the TO phonon
branch appears to plummet into the TA branch. [Ref. 19]

- 15 -
Fig.1-8. Bright-field images for various PMN-PT compositions: (a) 90/10, (b) 80/20, (c) 65/35,
and (d) 40/60. For PMN-PT 90/10, polar nanodomains are clearly evident. The average size of
these polar nanodomains was 50 Å. [Ref.20]

- 16 -
Relaxor-normal ferroelectric solid solution
Since the discovery of PLZT and PMN, the study of relaxor behavior has
intensified due to strong nonlinearities in the dielectric, elastic and electromechanical
properties that are suitable for applications from multilayer ceramic capacitors to
actuators and electro-optical devices. However, most relaxors have rhombohedral
structure and relatively low E-field induced strain along spontaneous polarization
direction. Since the normal tetragonal ferroelectric phase yields a large strain due to E-
field induced a- to c- domain rotation, a natural idea of tailoring material properties is to
make relaxor-normal ferroelectric solid solution. The phase diagram of PZT ceramics is
showed in Fig.1-9(a).21 Compositions near the boundary region between tetragonal and
rhombohedral phases exhibit anomalously high dielectric and piezoelectric properties
(Fig.1-9(b)).22-23 This composition region was later named as morphotropic phase
boundary (MPB), where R and T phases were believed to coexist. Alternate MPB
systems have been extensively searched in relaxor-PbTiO3 or relaxor-BaTiO3, in which
relaxor materials are complex perovskites with the general formula Pb(BIBII)O3 (BI=Mg2+,
Zn2+, Ni2+, Sc3+…, BII=Nb5+, Ta5+, W6+…). All of these solid solutions are characterized
by much improved properties compared to their components. It was believed that the high
dielectric and piezoelectric properties resulted from the coupling between two equivalent
energy states (T and R phases), allowing optimum domain reorientation during the poling
process.

- 17 -
Fig.1-9. (a) The PZT phase diagram; and (b) the corresponding dielectric constant and
electromechanical coupling factor kp dependence on composition. [Ref.21-23]

- 18 -
1.2.4 Domain engineering in relaxor-normal ferroelectric solutions
The most important advancement in ferroelectric materials during the last decade
was the discovery of Pb(Mg1/3Nb2/3)O3-x%PbTiO3 (PMN-x%PT) and Pb(Zn1/3Nb2/3)O3-
x%PbTiO3 (PZN-x%PT) single crystals.24 When poled along a non-spontaneous <001>
direction, an ultra-high piezoelectric coefficient d33 of 2500 pC/N and electromechanical
coupling coefficient k33 of 94% have been reported for compositions near the
morphotropic phase boundary (MPB), as shown in Fig.1-10.24-25 A domain-engineered
state, due to an electric field induced rhomobohedral-to-tetragonal phase transition, was
originally proposed by Park and Shrout to explain the ultrahigh electromechanical
properties. Strain as high as 1.7% has been realized as a result of this induced transition,
as shown in Fig.1-11. However, how the R phase transforms into T phase remained
unclear.
Domain engineering—ferroelectric polarization interpretation
Investigation of the origin of the ultra-high electromechanical properties has been
ongoing since then. Noheda first discovered a monoclinic phase, sandwiched between R
and T phases near a MPB in Pb(ZrTi)O3 (PZT) ceramics at low temperature.26 This
completely changed the well-accepted picture of the MPB, since this new phase acts as a
structural bridge between the R and T phases. Subsequently, first principle calculations
by Fu and Cohen suggested a polarization rotation during an E-field induced R to T phase
transformation, which takes a path with small energy change, and thus allows the
existence of intermediate low symmetry phase(s).27 They predicted that the energy
changes are probably very small in PMN-PT, so a very small field can cause the

- 19 -
Fig.1-10. The piezoelectric coefficient d33 dependence on PT concentration, (a) PMN-x%PT and
(b) PZN-x%PT. [Ref.24-25]

- 20 -
Fig.1-11. Strain vs. electric field of several piezoelectric ceramics and single crystals. [Ref.24]

- 21 -
polarization rotation. And using a Landau-Devonshire approach, Vanderbilt and Cohen
then expanded the free energy to the eighth power in the polar order parameter, providing
the thermodynamic basis for a monoclinic phase.28-29 According to this theory, while the
direction of the polarization vector in a conventional ferroelectric tetragonal (or
rhombohedral) phase is fixed to the [001] (or [111]) direction, the monoclinic symmetry
allows the polarization vector to continuously rotate in a plane and contributes to
enhanced polarization and strain. They further suggested three monoclinic phases: MA,
MB and MC, according to their symmetry relations with the parent phase. Bellaiche et al.
predicted that applying an E-field along [111] direction to the T phase results to a phase
transformation sequence of T MA R, while application of an E-field along [001]
orientation to an R phase induces a phase transformation sequence of
R MA Tri MC T.30 Up to now, diffraction experiments of PZN-x%PT and PMN-
x%PT have provided direct evidence of these monoclinic phases in both zero-field-cooled
and field cooled samples for E//[001] direction.31-37 Fig.1-12 shows the recent updated
phase diagrams of the PMN-PT crystalline solution in the zero-field-cooled condition
based on these experiment results, where the MPB composition has an MC phase
symmetry.36 However, the transformational sequence of these PMN-x%PT crystals under
E-field has not yet been experimentally established, which is very important for the
application such as actuators and transducers.
- 22 -
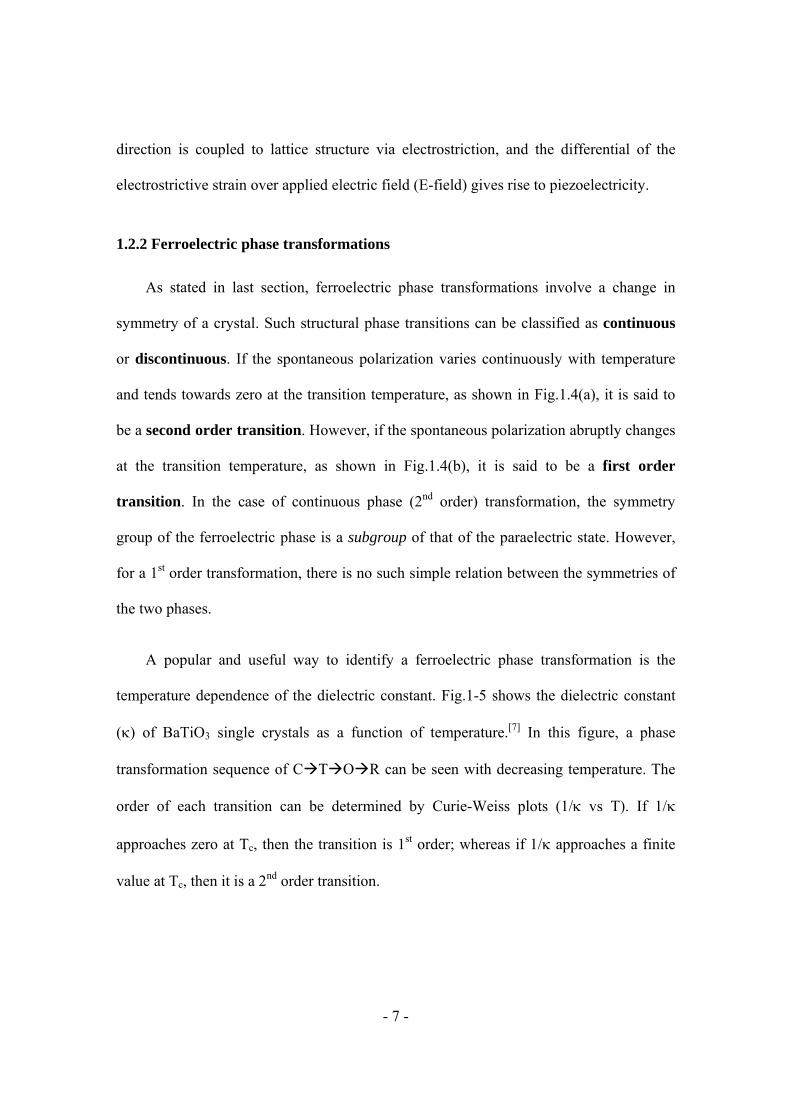
Fig.1-12. (a) Phase diagram of the PMN-PT solid solution system. The data points come from
published results by Noheda et al.36 (b) Polarization rotation path in the perovskite MA and MC
unit cell. C, R, T, O and M refer to cubic, rhombohedral, tetragonal, orthorhombic and monoclinic
regions, respectively.[Ref. 36]

- 23 -
Domain engineering—ferroelastic domain interpretation
Martensitic transformations (MT) are a common phenomenon, driven by
thermodynamics in ferroelastic alloys. At a transition temperature (TM), a sudden change
of lattice parameters occurs between high temperature and low temperature phases, which
correspond to austensite and martensite, respectively. Thus, the MT is a first-order
diplacive transformation. The lack of smoothness during the transformation yields such
characteristics as hysteresis loop, twinning, and a release of latent heat. Twinning is one
of the most important structural features of martensite. Ferroelastic twin boundaries relax
elastic energy by adjusting to particular crystallographic orientations in order to achieve
stress accommodation and thus energy minimization. These twin conditions are
documented in the Wechsler-Lieberman-Read theory of martensitic transformation.38
However, the presence of mesoscopic tweed-like striations observed by TEM at
temperature significantly above “Tm” in shape memory alloys (such as FePd and NiAl)
later challenged the conventional martensitic transformation theory, mentioned above.39-
40 Kartha et al. developed a dimensional “glassy” mesophase model for metastable tweed
structure observed in premartensitic transformations.41 They modeled precursor
phenomena using nonlinear nonlocal elastic free energy coupled to quenched local
composition inhomogeneities. Khachaturyan et al. proposed a more sophisticated
thermodynamic theory which allows for adaptive symmetries.42
An adaptive phase was believed to be a metastable alternative to normal nucleation
and growth. Rather, in this case, the transformation path is characterized by a sequence of
mesoscale coherent structures formed by atomically thin martensitice plates consisting of
quasiperiodic alternation lamellae with period λ, as show in Fig.1-13. The condition for

- 24 -
the minimization of the twin thickness is controlled by a balance of elastic and surface
energy terms, as given below:
2/12001 )/(~ ><µεγλ Dtw
where γtw is the twin surface energy, µ is the shear modulus, and ε<001> is the elastic strain
along the <001>. Twin thickness minimization to atomic levels will occur under
simultaneous conditions of a low γtw, a soft elastic shear modulus and high transformation
strain in the C T transformation. The symmetry requirement upon the adaptive phase is
that it must be a subgroup of the parent phase. Consequently, an adaptive phase is related
to its parent phase through an invariant-plane strain (IPS), which is also parallel to the
twinning plane of the produce phase. In a cubic-to-tetragonal MT, an adaptive phase has
an averaged pseudocubic orthorhombic symmetry.42 Accordingly, the Tm locates between
C and O phase instead of C and T phases.
Recently, this adaptive phase theory has been applied to the relaxor-normal
ferroelectric phase transformation near the MPB, assuming that (i) an R T ferroelastic
phase transformation with large strain during poling that requires domain rearrangement;
(ii) R phase can be deemed as pseudocubic phase; and (iii) the domain wall energy is
very small in the vicinity of the MPB. 43 It was shown that this theory can successfully
explain the E-field induced intermediate orthorhombic and monoclinic ferroelectric
phases of PZN-PT near the MPB.43 Later, Jin et al. proposed a model of an adaptive
ferroelectric phase, conjecturing that nanoscale stress-accommodated tetragonal
microdomains near the MPB results in form an averaged monoclinic MC phase.44 The
intrinsic relationships of lattice parameters between the C, T and MC were shown to be
experimentally fulfilled in PMN-x%PT for 31<x<37 and PZN-8%PT.

- 25 -
Fig.1-13. Schematic representation of the martensitic phase plate composed of twin-related
lamellae of two orientation variants of the martensitic phase. The appropriate d1-to-d2 ratio
completely accommodates the martensite-toparent phase macroscopic transformation strain
mismatch along the habit plane. [Ref. 42].

- 26 -
Domain engineering and PNR
The current available experiment results are not sufficient to provide a conclusive
answer to whether the intermediate phases are actually independent of their parent phases
or not, i.e. true phase transformation in atomic scale. However, it is now widely accepted
that the domain engineering in the relaxo-normal ferroelectric crystals can be interpreted
in terms of polarization rotation and appearance of intermediate low symmetry M or O
phases. In the view of tailoring materials properties, the most important issues are why
the induced intermediate phases exist near the MPB. It is important to note two things: (i)
dielectric constant measurements have shown that the relaxor characteristics remain in
PMN-xPT up to x=0.35;45 and (ii) diffusive scattering by both synchrotron x-ray and
neutron have shown that PNRs present in PMN-xPT for PT concentration far above the
MPB until x=0.6.46 Accordingly, it is reasonable to suggest that PNRs must be related to
intermediate phases. However, how PNRs assemble into a structural inhomogeneous state
is still not clear.

- 27 -
1.3 Ferromagnetic and ferroelastic-like biferroics
Joule magnetostriction is the phenomenon in which the shape of a ferromagnetic
material changes with magnetization. The inverse Joule magnetoelastic effect (Villari
Effect) is characterized by the change of magnetization upon application of a stress. In
this thesis, we will only consider Joule magnetostriciton.47 A typical magnetostrictive
elongation as a function of applied magnetic field is illustrated in Fig.1-14. The
magnetostrictive (δl/l) changes with increasing magnetic field and saturates at a value of
λs. If the magnetostrictive strain is positive, the effect is called positive magnetostriction;
otherwise it is designated as negative magnetostriction. Ferromagnetic materials are
always magnetostrictive matierials, however not all of them can be considered as
ferroelastic. What we are interested is ferromagnetic materials with ferroelastic-like
behavior, which gives rise of large magnetostriction in materials even though the
magnetic anisotropy is weak.
Fig.1-14. Magnetostrictive elongation as a function of applied magnetic field.
H
l/dl
λs

- 28 -
1.3.1 Origin of magnetostriction
Magnetostriction has its origin in a coupling between the direction of the spin
moment of an atom and the orientation of its anisotropically shaped electron charged
cloud, i.e. the “spin-orbit coupling”.47 When the atomic magnetic moment (the dipole-
dipole exchange energy) changes under external magnetic field, the distance and angle of
a dipole moment pair will spontaneously adjust to achieve minimum energy. Accordingly,
the crystal will deform to some finite strain such that an equilibrium state will be reached.
Analytically, the equilibrium state can be obtained by minimizing the total energy of
magnetocrystalline energy (Ek), elastic energy (Eelas) and magnetoelastic energy (Ems),
mselasK EEEE ++= [1.8]
Detailed discussion of elastic and magnetoelastic energies can be found in reference book
by Etienne du Trémolet de Lacheisserie.48 Table 1.2 lists the properties of some
magnetostricitive materials.
In a cubic single crystal, the saturation magnetostriction along the [100] and [111]
directions can be written as
)(32
2211
1]100[ CC
b−
−=λ , [1.9(a)]
44
2]111[ 3C
b−=λ [1.9(b)]
where C11, C12 and C44 are the elastic coefficients of a cubic crystal, and b1 and b2 are the
magnetoelastic coefficients. Thus, it is possible to enhance magnetostriciton by
increasing b1 and/or decreasing ½(C11-C12).
- 29 -
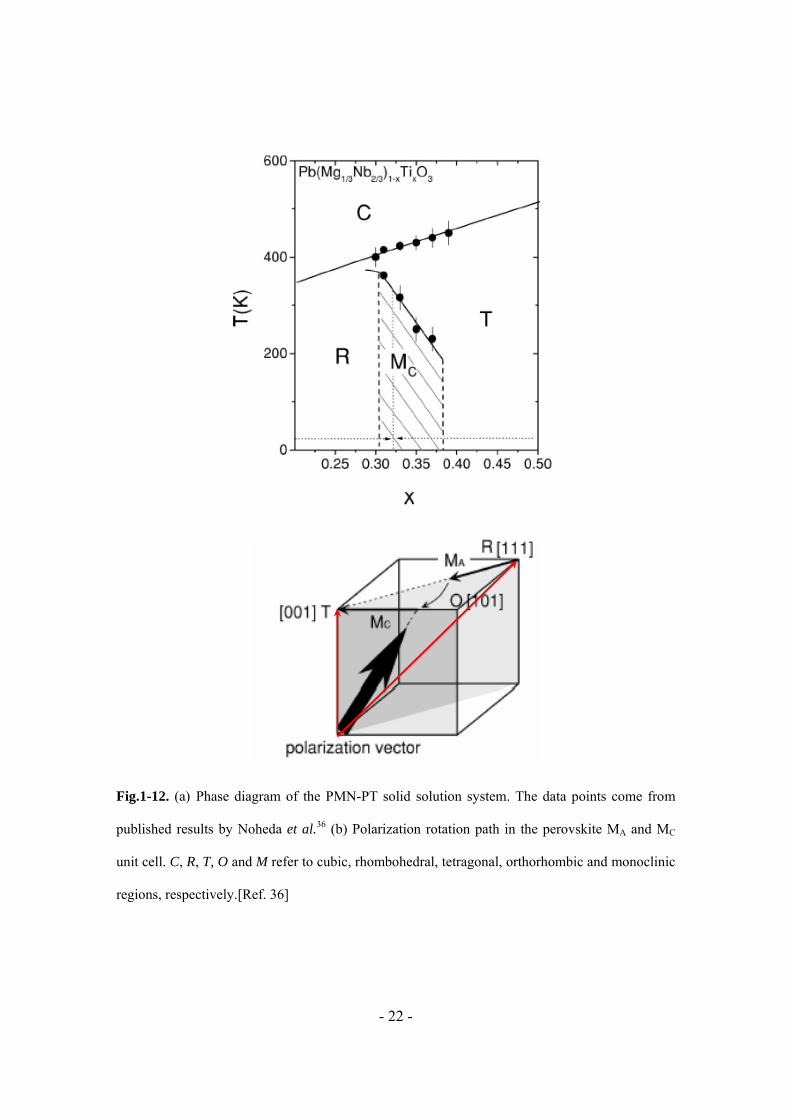
Table 1-1. Magnetostriction of some materials at room temperature
Crystals λ100 (×10-6) λ111 (×10-6) 5
32 111100]100[
λλλ
+= (×10-6)
Fe 20.7 -21.2 -4.4
Ni -45.9 -24.3 -33
85%Ni-Fe -3 -3 -3
40%Co-Fe 146.8 8.7 64
19%Ga-Fe 265 28 123
19%Al-Fe 106 5 45.4
Fe3O4 -20 78 39
Mn1.05Fe1.95O4 -28 4 -8.8
Mn0.4Zn0.1Fe2.1O4 -14 14 3
Ni0.8Fe2.2O4 -36 -4 -17
Ni0.3Zn0.45Fe2.25O4 -15 11 0.6
Co0.8Fe2.2O4 -590 120 164
Co0.8Zn0.2Fe2.2O4 -210 110 -18
Tb0.3Dy0.7Fe2 1200
Ni49.8Mn28.5Ga21.7* 60,000
* Ni2MnGa is a magnetic shape memory alloys.

- 30 -
1.3.2 Large magnetostriction in binary alloys
The magnetostriction of body-centered cubic (bcc) Fe is known for its near
compensating constant and anomalous temperature dependence: λ100 attains a minimum
around 400 K and then again rises to a maximum just before the Curie temperature of
Fe.49 In search of a material that has superior magnetic properties relative to pure Fe,
there have been significant efforts to alloy Fe with various non-magnetic species, both
transition and non-transition metal elements. These elements include Ti, Co, Ge, Si, Cr,
Mo, Al, V and etc.50
With regards to magnetostriction, Fe-x at.%Al alloys have attracted much interests,
where the λ100 reaches about 80~100 ppm, 4x that of pure Fe crystal, for x=19 and then
decreases with further increment of Al concentration.50 Hall has shown that the
magnetocrystalline anisotropy constant K1 for both order and disordered Fe-Al alloys
decreases sharply with increasing Al content and goes through zero, meaning that a low
magnetic field can reach saturation magnetostriction for cubic crystals.50 Leamy et al.
have shown for disordered alloys that additions of 20 at.%Al to Fe decreases ½(C11-C12)
by nearly half of that of the Fe value and slightly increases C44.51
Ga and Al belong to the same chemical group in the periodic table, sharing similar
electronic configuration. Accordingly, some similarities in phase stability and properties
of both Fe-Al and Fe-Ga alloys were anticipated. Surprisingly, Clark et al. have recently
demonstrated that a significantly enhanced manetostriction (over 250 ppm) can be
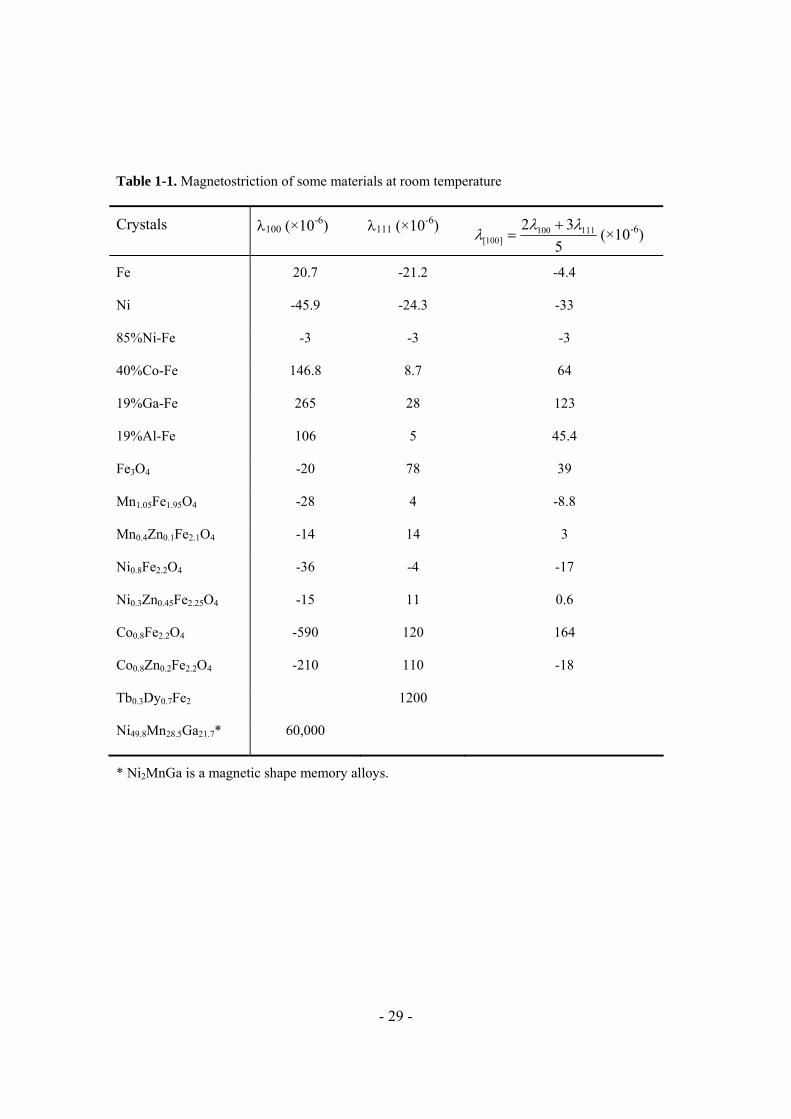
obtained in Fe-Ga bcc single crystals.52 Fig.1-15 compares the saturation
magnetostricition of both Fe-x at.%Ga and Fe-x at.%Al at room temperature.53-54 Clear
similarities can be seen between these two alloys. In both cases, the saturation

- 31 -
magnetostriction λ100 increases with increasing alloy concentration until x=17~19, and
then decreases for larger x. In addition, it has been found that the magnetostriction of Fe-
x at.%Ga is also dependent on the thermal history of the alloy, analogous to what has
been reported for Fe-Al alloys. In the furnace-cooled (FC) condition, a maximum in λ100
is reached at x=17; whereas in the rapidly quenched (RQ) condition, the value of λ100
continues to increase with increasing Ga content until x=19, as shown in Fig.1-15(b).54
And the magnetostriction of Fe-x at.%Ga alloys for 19<x<21.4 is almost 25% higher for
RQ samples than that of FC ones. Even higher magnetostriction of about -700 ppm has
been reported in melt-spun Fe81Al19 (~5x that of corresponding bulk materials55), and
about 1100 ppm for melt-spun stacked Fe-15 at.% Ga ribbons with much larger cooling
rate56. Finally, magnetic anisotropy constant measurements in Fe-x at.%Ga have shown a
sharp drop of both K1 and K2 with increasing Ga concentration in the range of 5<x<20
at.%.
Fig.1-16 shows the phase diagram of Fe-x at.%Ga and Fe-x at.%Al alloys.57 The A2
phase has a disordered cubic structure up to 15 at.% Ga. For 15<x<22.5 at%Ga, the
equilibrium state is a two-phase field of A2+DO3 phases in the FC state; whereas in the
RQ condition, it is believed that the same crystal maintains a single phase A2 cubic
structure until x≈19at%. A single unstable DO3 phase exists for 22.5<x<31 at.%Ga.
Above this composite range, a stable B2 phase exists. The structures of A2, DO3 and B2
phases are also shown in Fig.1-16.
- 32 -
Fig.1-15. Saturation magnetostriction measured at room temperature for FexGa1-x and FexAl1-x. (b)
Recent updated data by A. E. Clark et al. [Ref. 53-54]
■ Furnace Cooled ● Quenched ▲ Directionally Solidified (unannealed)
Fe100-xGax

- 33 -
Fig.1-16. Phase equilibrium between the A2 and DO3 or B2 phases in Fe-x at.%Ga in comparison of Fe-x at.%Al alloys. [Ref. 57]

- 34 -
1.3.3 Prior investigations of Fe-Ga (Al) alloys
During the investigations of the origin of large magnetostriciton in Fe-Al and Fe-Ga
alloys, some clues were first noticed concerning the magnetostricion’s dependence on
composition and crystal orientation. In both alloys, λ100 increases approximately as x2
until a maximum is reached.58 This type of behavior suggests that the enhanced
magnetostriciton is related to the presence of clusters of solute atoms (Al or Ga), which
act as magnetic and magneoelastic defects in the alloys. A simple thermodynamic model
has been developed by Wuttig et al., which predicted that the saturation magnetostriction
should increase as the number of Al-Al or Ga-Ga pairs, i.e., as x2 at small
concentrations.58 For larger concentrations, the isolated pairs are gradually replaced by
larger clusters. Many of the pairs become part of these larger entities, so that the
magnetostriction no longer increases as x2. For even larger x, it is impossible to retain the
disordered bcc structure, as the alloys are partially or fully DO3 or B2 structured, thus
there are very few clusters in the alloy to act as magnetoelastic centers.
The effect of these clusters was evidenced by the measurement of the magnetoelastic
coefficient b1 and the shear elastic constants ½(C11-C12) and C44, by Wuttig et al.58 and
Clark et al.54, respectively. It was found that while the rhombohedral shear elastic
constant C44 is independent of Ga concentration, the tetragonal shear elastic constant
½(C11-C12) decreases linearly with increasing Ga content and extrapolates to zero near 27
at.%Ga,58 as shown in Fig.1-17. Meanwhile, the magnetoelastic constant |b1| was found to
increase from 2.9 to 15.6 MJ/m3 at x=18.7 at.%, and then to decrease for higher Ga
concentrations.

- 35 -
Fig.1-17. Shear elastic constants ½ (C11–C12), circles, and C44 , squares, of bcc Fe–Ga solid
solutions, full symbols, determined in this study. The open symbols represent the elastic constants
of bcc Fe–Al solid solutions. [Ref.58.]

- 36 -
Furthermore, it has been found that the increase of λ111 with increasing x is almost
negligible compared to λ100 for both Fe-Al and Fe-Ga alloys, consistent with the
measurements of C44, as shown in Fig.1-18.58 This supports the presumption that there
are no nearest neighbor pairs along the <111> direction, because of the size difference
between Ga (or Al) and Fe atoms. The next nearest neighbors are along the [100]
direction and contribute to the enhancement of λ100, thus relating the thermodynamic
model to the pair model of magnetostriction. Lograsso et al. have suggested a modified
DO3 structure, as illustrated in Fig.1-18.59 Wu has also conjectured a B2-like tetragonal
structure, taking into account Ga pairs along the <100> directions, which was believed to
play a key role in the strong positive magnetostriction in Fe-Ga alloys.60 Wuttig et al
suggested that these local tetragonal features are premartensitic embryos.58 In this sense,
the enhanced “magnetostriction” in Fe-Ga alloys can be considered as being ferroelastic-
like strain instead of a simple magnetostriction. However, up to now, no conclusive
structure evidence has been presented that demonstrates either tetragonal distortions or
magnetization inhomogeneities.

- 37 -
Fig.1-18. Schematic illustration of modified DO3 and B2-like lattice structure.[Ref.59-60]
Modified DO3 B2-like

- 38 -
II. PURPOSE OF THIS THESIS
Two multiferroic materials will be investigated in my dissertation work: they are
ferroelastic-ferroelectric Pb(Mg1/3Nb2/3)O3-PbTiO3 (PMN-PT) and ferromagnetic-
ferroelastic-like Fe-Ga alloys. Attention will be given to the nanoscale inhomogeneities
in these materials and their roles in the enhancement of materials properties.
Domain-engineered states in PMN-PT or PZN-PT crystals have been interpreted as
homogeneous intermediate low-symmetry phases. However, as discussed in the
introduction, structural inhomogeneities entities (i.e. PNR) are known to exist over a wide
composition range for relaxo-normal crystalline solution. Clearly, it is reasonable to
suggest that intermediate phases could be related to PNR. But how? How does nature
assemble a structural inhomogeneous state of PNR into various states with apparent M or
O symmetry. To address this question, a combination investigation of phase
transformation characteristics on the macro scale and domain structure in nano scale is
needed. The results sections will attempt to provide some answers to the following,
1) What is the phase transformation sequence during poling and in the after-
poled state? There are two poling schemes: field cooling from a temperature
above Tc to room temperature, and increasing field at a constant temperature.
The electric field vs. temperature (E-T) diagram needs to be established.
[Please see Section 4.2]
2) How do domains evolve during the phase transformation sequence of
C R Mc T in the phase diagram, and what is the role of PNR on this
sequence? Is there a domain hierarchy with different symmetries on different

- 39 -
length scales? Accordingly, a detailed investigation is needed to study the
domain structures of PMN-x%PT over various length scales from nano- to
milli-meter for different x near the MPB. [Please see Section 4.3]
3) Are the domain distributions of PMN-x%PT in the zero-field-cooled and
field-cooled conditions different, possibly reflecting differences in the phase
transformation sequence? How do such differences in domain distributions
depend on composition about the MPB? [Please see section 4.4]
4) How do domain configurations evolve during poling and/or polarization
reversal? [See Section 4.5]
Due to limited spatial resolution, polarized optical microscopy (POM) only provides
an averaged macro domain structure in the micro and larger scales. So we will also use
piezoresponse force microscopy (PFM) to study the evolution of the domain structure on
a nano-meter-length scale for PMN-x%PT crystals with different x. The results will
compare to those obtained by POM. Detailed experiment methods will be given in
Chapter 3.
As discussed in Section 1.3 for the binary Fe-x at.% Ga(Al) alloys, both the increase
of the magnetoelastic coupling coefficient (b1) and the decrease of tetragonal elastic
constant ½(C11-C12) with x are believed to be related to the changes in the number of Ga
pairs. This is a conjecture built upon two hypothesis: (i) at least a small tetragonal
splitting induced by Ga pairs; and (ii) composition segregation that results in magnetic
spin reorientation. However, neither have yet been reported, although earlier neutron
scattering work in Fe-25at.%Al has shown evidence of an anomalous inhomogeous

- 40 -
magnetism or “cluster glass”.61 So the primary tasks of my dissertation work is to address
these unanswered questions, specifically
5) Is there low-symmetry lattice distortion in Fe-x at.% Ga with the increment
of Ga-concentration? Both line scans and mesh scans in different reciprocal
zones will be performed. [Please see section 5.2]
6) Are there magnetic domain inhomogeneities? How does change in the degree
of magnetic domain alignment depend on composition and how might this
dependence relate to the changes in magnetostriction? Why does the location
of the maximum magnetostriction shift in the phase field with changes in
thermal history? To answer these questions, the thermal history dependence
of the magnetic domain distribution will be studied for Fe-x at.%Ga in the
vicinity of A2-DO3 boundary. [Please see section 5.3]
7) How does magnetic domain rotate during applying magnetic field along
longitudinal and transverse direction? What is the effect of lattice distortion
on magnetic spin reorientation? The magnetic domain structures of Fe-x at.%
Ga will be compared during magnetization alignment/reversal. [Please see
section 5.4]
Magnetic force microscopy (MFM) is an excellent tool to study magnetic domain
inhomogeneities due to the high resolution and sensitivity. As for structure investigation,
X-ray diffraction has only low penetration depth about 3~5 µm. It is necessary to perform
neutron scattering to get the bulk information. Details of the MFM and neutron scattering
methods will be discussed in the following chapter.

- 41 -
III. EXPERIMENT TECHNIQUES
3.1 Preparation of samples
3.1.1 Pb(Mg1/3Nb2/3)O3-PbTiO3 single crystals
PMN-PT single crystal were grown by a vertical Bridgmen–Stockbarger method,
using a sealed platinum crucible by self-seeding, and were obtained from HC Materials
(Urbana, IL).62-63 The starting materials were high purity PbO, MgO, Nb2O5, and TiO2
(the purity is better than 99.99%). The starting powders were weighed to be the same
chemical ratio as the formula PMN-x%PT (x=10, 20, 30, 35 and 40), as shown in Fig.3-1,
and were mixed thoroughly in an agate mortar and pestle, and then loaded into a platinum
crucible. The maximum temperature in the furnace was at 1395 °C and the crystal growth
rate was controlled at 0.4 mm/h at a temperature gradient of 20 °C/cm, which yields
optimum results for growing this type of relaxor ferroelectrics.
For optical and piezoresponse force microscopy (PFM) studies, all crystals were cut
into plates with typical dimensions of 4x4x0.5 mm3. The top faces of the crystals were
polished to 0.25 µm finishes. For X-ray and neutron diffraction, a PMN-30%PT crystal
was cut into a cube of dimension 4x4x3 mm3. All faces of the crystal were again polished
to a 0.25 µm finish. A gold electrode was then deposited on two 4 x4 mm2 faces by
sputtering (SPI-Module Sputter Coater). Before measurements were begun, all crystals
were annealed at 550 K for 30 min to remove surface stresses.

- 42 -
Fig.3-1. Phase diagram of PMN-x%PT crystalline solutions. Of particular interests are 10PT
(Cubic), 20PT (Rhombohedral), 30PT (Rhombohedral), 35PT (Monoclinic+Tetragonal) and
40PT (Tetragonal), as labeled by red circle. [Ref. 64]

- 43 -
3.1.2 Fe-Ga single crystals
Crystals used in this investigation were grown at Ames Laboratory by a Bridgman
method in a resistance furnace, as previously described.52 Appropriate quantities of iron
and gallium were cleaned and arc melted several times under an argon atmosphere. The
buttons were then remelted and the alloy drop cast into a copper chill cast mold to ensure
compositional homogeneity throughout the ingot. The nominal compositions of the ingot
are Fe87.7Ga12.3, Fe80Ga20 and Fe74.4Ga24.8, whose locations in the phase diagram is shown
in Fig.3-2.54 The as-cast ingot was placed in an alumina crucible and heated under a
vacuum to 900oC. After reaching 900oC, the growth chamber was backfilled with ultra
high purity argon to a pressure of 1.03×10⁵ Pa. This over-pressurization is necessary in
order to maintain stoichiometry. Following pressurization, heating was continued until
the ingot reached a temperature of 1600oC and held for 1 hour before being withdrawn
from the furnace at a rate of 4mm/hr. The ingot was annealed at 1000oC for 168 hours,
using heating and cooling rates of 10 degrees per minute, after which the crystals are
considered to be in the “furnace-cooled” (or FC) state.
Samples were then oriented and sectioned from the ingot. All crystals were of
dimensions 10x10x2 mm3. The (001)-oriented 10x10 mm2 faces were polished using
standard metallographic techniques down to 0.3 µm finish. Careful investigations were
performed using MFM, by starting from the FC state, and then again after being post-
annealed (PA) at 750oC or higher temperature (above Curie temperature) in an ambient of
argon for one hour.

- 44 -
Fig.3-2. Phase equilibrium between the A2 and DO3 or B2 phases in Fe-x at.%Ga alloys. Of
particular interests are 12Ga, 20Ga and 25Ga locating in A2, A2+DO3 and DO3 phase regions, as
marked by red arrows. [Ref. 57]

- 45 -
3.2 Characterization methods
3.2.1 X-ray diffraction
The XRD system used during my studies was a Philips MPD high resolution x-ray
diffractometer equipped with a two bounce hybrid monochromator, an open 3-circle
Eulerian cradle, and a domed hot-stage. A Ge (220) cut crystal was used as analyzer,
which had a 2theta-resolution of ~0.0068o (or 0.43 arcseconds). The x-ray wavelength
was that of CuKα (λ=1.5406 Å) and the x-ray generator was operated at 45 kV and 40 mA.
XRD was used to perform (i) high-resolution 2θ line scan (single scan) to measure lattice
parameters, both at room temperature and as a function of temperature up to 650 K; (ii)
rocking curve (ω scan) to determine the maximum peak intensity (ω is then fixed during
2θ line scan in the field cooling or heating condition); and (iii) ω-2θ mesh scan (area scan)
as functions of temperature and electric field to determine the crystal symmetry and
domain distributions. All the angles are illustrated in Fig.3-3(a).
The ω-2θ mesh scan shows the area of reciprocal space covered when ω-2θ line
scans with a range of, for example one degree, are made over a range of one degree in ω.
The (200) and (002) mesh scans in reciprocal space and real space are schematically
illustrated in Fig.3.3(b). Mesh scans can reflect multi-domain patterns caused either by
different lattice parameters (2θ) or by various angles between the crystallographic plane
and incident beam (ω). Thus, it is very useful method to determine the symmetry of a
sample, by analyzing domains distributions in different reciprocal zones.

- 46 -
Fig.3-3. Schematics illustration of (a) Philips MPD high resolution x-ray diffractometer; and (b)
(200) and (002) mesh scans in the reciprocal (H0L) zone, which are same with two ω-2θ mesh
scans in the real space.
H
L
(200)
(002)
ω-2θ
ω
ω-2θ
(B)
(A)

- 47 -
3.2.2 Triple-axis neutron scattering
Due to the limited penetration depth of X-rays, neutron scattering is necessary to
obtain the bulk information concerning a crystal. Similar to X-rays, neutrons are also
diffracted by crystals, following the well-known Bragg’s law:
G=kf-ki [3.1]
|G|=2|ki|sinθ [3.2]
where G is a reciprocal lattice vector, ki is the direction of the incident beam relative to
the crystal, kf is the direction of the diffracted beam, and 2θ is the angle between the
incident and diffracted beam for the Bragg condition.
The triple-axis spectrometer (TAS) is the most versatile and useful instrument for
use in both elastic and inelastic scattering because it allows one to probe nearly any
coordinates in energy and momentum space in the precisely controlled manner. Fig.3-4
shows the schematic diagram of a triple-axis spectrometer;65 specifically note
1) The first axis of rotation is around the monochromator crystal, where neutrons of
a specific wavelength are extracted from the neutron beam and Bragg reflected
onto the sample. Diffraction conditions at the monochromator crystal ensure that
the neutron beam incident on the sample is monochromatic with fixed initial
energy and wavevector (Ei, ki).
2) The second axis of rotation is at the sample position, where neutrons are scattered
inelastically by the sample. The single-crystal sample is mounted with the
scattering plane of interest oriented horizontally (i.e. in the plane of the beam).

- 48 -
3) Finally, neutrons scattered by the sample, (possessing a distribution of final
energies and wave vectors), are then incident on an analyzer crystal positioned at
the third axis. The analyzer is aligned in order to reflect neutrons of a specific
energy and wave vector onto the detector.
Since the scattering plane is horizontal, the scattering observed at the detector is a
function of only three variables; the energy transfer (E = Ef - Ei), and the two components
of momentum transfer (scattering vector Q) in the plane.
The neutron scattering experiments in this thesis were performed on the BT9 triple-
axis spectrometer located at the NIST Center for Neutron Research. Measurements were
made using a fixed incident neutron energy Ei of 14.7 meV (wavelength λ=2.359 Å),
obtained from the (002) reflection of a PG monochromator, and horizontal beam
collimations of 10’-46’-20’-40’. We exploited the (004) reflection of a perfect Ge crystal
as analyzer to achieve unusually fine q-resolution near the relaxor (220) Bragg peak,
thanks to a nearly perfect matching of the sample and analyzer d-spacings. Close to the
(220) Bragg peak, the q−resolution along the wave vector direction is about 0.0012Å-1
(∆q/q≈2x10-4).14

- 49 -
Fig.3.4. Schematic diagram of neutron triple-axis spectrometer (http:// www.physics.uc.edu/
~jph/emma/tas.html)

- 50 -
3.2.3 Scanning force microscope (SFM)
The operation principle of a scanning force microscope (SFM, also call scanning
probe microscope, SPM) is based on the detection of the position of a soft cantilever-type
spring with a sharp tip mounted at its end. When the tip approaches the sample surface,
the forces acting on it causes a deflection of the cantilever according, in a first
approximation, to the Hooke’s law. The degree of bending can be controlled by a
feedback loop, which regulates the vertical position of the tip with respect to the sample
surface. By keeping the deflection constant while scanning the sample, a three-
dimensional map of the surface topography can be obtained. It can be seen that the key
point of the system is mapping the “tip-sample interaction”.
There are two main modes of operation according to the type of interaction between
the SFM tip and the sample: contact and tapping. In the contact mode, the tip always
contacts the sample surface during scanning, and the force between tip and sample
maintains a constant value (setpoint), which is controlled by the feedback loop. In the
tapping mode, the cantilever is oscillated at or near its resonance frequency with an
amplitude ranging typically from 20 to 100 nm. The tip lightly “taps” on the sample
surface during scanning, only contacting the surface at the bottom of its swing. The
feedback loop keeps a constant oscillation amplitude (setpoint), as shown in Fig.3-5, by
which a constant tip-sample interaction is also maintained during imaging. Contact mode
has higher scan speed than tapping mode, whereas tapping mode has better lateral
resolution on most samples (1~5 nm) and less damage to both the tip and sample. Contact
mode works well in detecting real-time strain changes, while tapping mode is more
suitable to sense long-distance magnetic or electrostatic interaction.
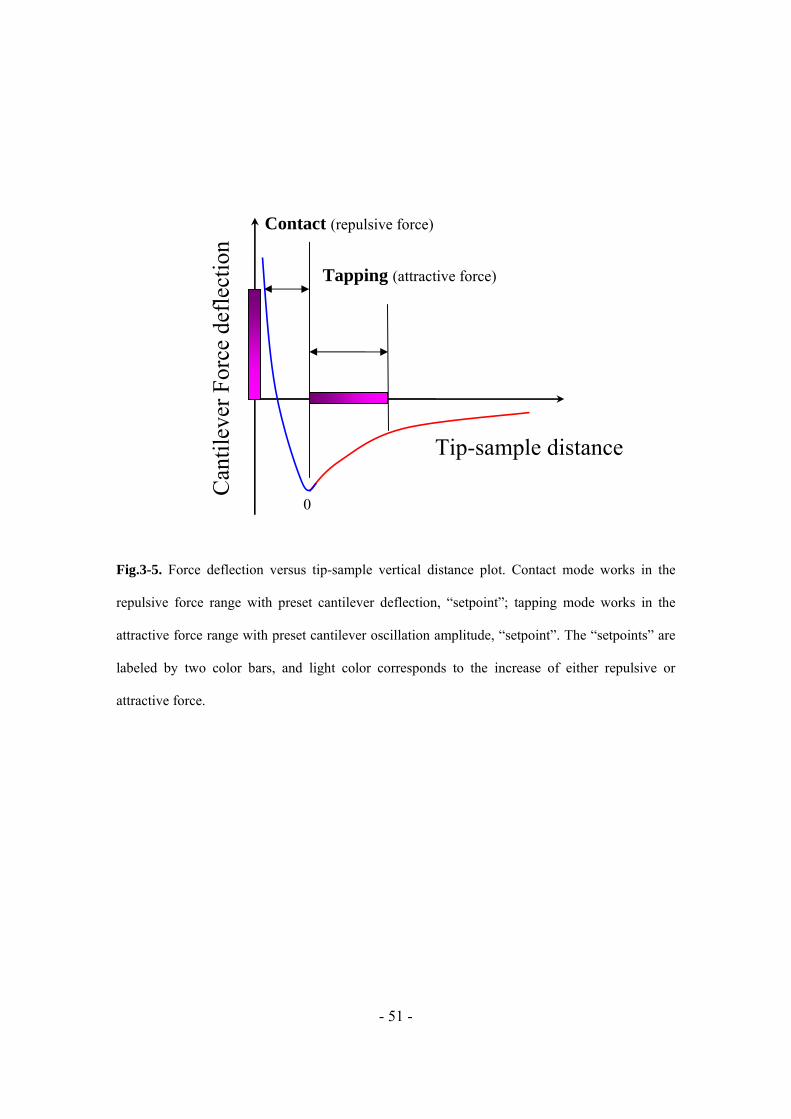
- 51 -
Fig.3-5. Force deflection versus tip-sample vertical distance plot. Contact mode works in the
repulsive force range with preset cantilever deflection, “setpoint”; tapping mode works in the
attractive force range with preset cantilever oscillation amplitude, “setpoint”. The “setpoints” are
labeled by two color bars, and light color corresponds to the increase of either repulsive or
attractive force.
Can
tilev
er F
orce
def
lect
ion
Contact (repulsive force)
Tapping (attractive force)
Tip-sample distance
0

- 52 -
3.2.4 Piezoresponse force microscopy (PFM)
Also called voltage-modulated scanning force microscopy, this method has proven to
be the most suitable method to study and control the ferroelectric domain structure at the
nanometer scale. The advantage is that it allows simultaneous modification and detection
of the ferroelectric polarization on a local level.
Principle of PFM
The piezoresponse-SFM technique is based on the converse piezoelectric effect.
Since all ferroelectrics exhibit piezoelectricity, an electric field applied to a ferroelectric
sample results in changes of its dimensions. To detect the polarization orientation, the
SFM tip is used as a top electrode, which can be moved over the sample surface. To
illustrate the imaging mechanism, let us consider the simplified example circuit shown in
Fig.3.6, with the ferroelectric sample sandwiched between a bottom electrode and the
conductive SFM tip. Also, let us consider two ferroelectric domains having opposite
orientations of polarization, perpendicular to the sample surface. In Fig.3-5(a) no voltage
is applied between the electrodes and the two ferroelectric domains have the same
dimensions along the z-direction, as the spontaneous strain is identical for both 180o
domains. When a voltage is applied to the tip, the electric field generated in the sample
causes the domains with the polarization parallel to the field to extend and the domains
with opposite polarization to contract. The images (b) and (c) in Fig.3-6 illustrate the z-
deformation of the domains when a positive, respectively negative voltage with respect to
the bottom electrode, is applied to the tip.66

- 53 -
Fig.3-6. Principle of piezoresponse SFM (a) No topographic contrast if no voltage is applied. (b)
A change in thickness occurs for a positive voltage applied to the tip (or during the positive half
periods of an AC voltage). (c) Opposite thickness changes for a negative voltage (or during the
negative half periods). [Ref.66]
- 54 -
Using the constitutive equations for the piezoelectric effect and the above
assumptions, the following relation can be obtained:
Vdz ⋅−=∆ * [3.3]
where d*=d33 for positive domains with Pz>0; d*=-d33 for negative domains with Pz<0.
A typical numeric value for the piezoelectric coefficient, d33 = 50 pm/V and applied
voltage 4 V, results in a piezoelectric deformation of about 0.2 nm. This value is very
close to the lower resolution of a typical SFM, and such a displacement can be easily
obscured by topographic features of 5 nm to 10 nm. Therefore, a DC voltage method is
not suitable to monitor the ferroelectric domains on rough surfaces. Using an AC method
combined with lock-in detection considerably improves the signal-to-noise ratio. By
replacing the voltage in Eq. 3.3 with V=VAC sin(t), the surface movements induced
underneath the tip are given by:
)sin(33 tVdz AC ϖ⋅−=∆ for Pz>0, or [3.4(a)]
)sin(33 tVdz AC ϖ⋅=∆ for Pz<0. [3.5(b)]
Therefore, opposite orientations of polarization along the z-axis cause the sample
surface to vibrate out of phase under a small AC voltage. The name “voltage-modulated
SFM” of this method originates from the fact that during the scanning process, the SFM
tip passes across different ferroelectric domains which modulate the carrier of
information (the AC oscillation) with their mechanical response, according to the local
polarization orientation.

- 55 -
Set-up of PFM
As shown in Fig.3-7, the vertical position of the SFM tip (or its deflection) is usually
monitored using a laser beam, which is reflected by the cantilever on which the SFM tip
is mounted.66 Using an optical detector, the cantilever bending is converted into an
electrical signal and is further processed by the SFM controller. In the PFM mode, the
deflection signal also contains the induced oscillations of the sample surface transmitted
to the tip cantilever. These electrical oscillations can be simply extracted from the global
deflection signal using a lock-in amplifier. The lock-in detection rules out any other
harmonic components of the deflection signal and the piezoelectric oscillations are in this
way separated from the topography. The signal detected by the lock-in amplifier is
usually referred to as the piezoresponse signal, [29] and is directly related to the amplitude
and phase of the surface vibration via the detector sensitivity d :
)sin(0 Φ+∆⋅= tz ϖδνϖ [3-6]
where ∆z0=d33VAC, Φ=π for positive domains and Φ=0 for negative domains. The
piezoresponse signal expressed here contains information about the polarization
orientation of the area under the SFM tip, via the phase shift Φ and also about the
magnitude of the piezoelectric coefficient.
In this thesis, all ferroelectric samples were polished to 0.25 µm finishes. Gold
electrodes were then deposited on the bottom face of each sample by sputtering. The
electroded face was then glued to the SFM sample stage, and the opposite unelectroded
surface was subjected to SFM tip scanning. PFM images were obtained using commercial
equipment (DI 3100a by Veeco) equipped with Lock-in amplifier. All scans were performed

- 56 -
Fig.3-7. Schematic illustration of piezoresponse force microscopy set-up (Veeco DI3100a).
[Ref.66]

- 57 -
at room temperature, using a conductive silicon-tip coated with cobalt. An ac voltage
with a frequency of 20 kHz and amplitude from 1 and 10V was applied between the
conductive tip and the bottom gold electrode.
3.2.5 Magnetic force microscopy (MFM)
In MFM, a tapping cantilever equipped with a special tip coated with magnetic layer
first scans over the surface of the sample to obtain topographic information. Using
LiftMode as shown in Fig.3-8, the tip then rises just above the sample surface. The
surface topography is scanned and monitored for the influence of magnetic forces. MFM
measures these influences using the principle of force gradient detection.
In the absence of magnetic forces, the cantilever has a resonant frequency f0. This
frequency is shifted by an amount ∆f proportional to vertical gradients in the magnetic
forces on the tip. The shifts in resonant frequency tend to be very small, typically in the
range 1-50 Hz for cantilevers having a resonant frequency f0 ~70 kHz. These frequency
shifts can be detected three ways: phase detection which measures the cantilever’s phase
of oscillation relative to the piezo drive; amplitude detection which tracks variations in
oscillation amplitude; and frequency modulation which directly tracks shifts in resonant
frequency. Phase detection and frequency modulation produce results that are generally
superior to amplitude detection. In this thesis, all MFM images were obtained in the
phase detection mode by using a Veeco DI 3100a SFM.

- 58 -
Fig.3-8. Schematic illustration of MFM working at a lifted taping mode. [Ref.67]

- 59 -
Qualitative analysis of magnetic force
The magnetic force between tip and sample can be written as (for simplicity reason,
only static interaction will be considered)
sampletipHM EF −− ∇= [3.7]
where Etip-sample is the energy of the tip-sample interaction. In most cases, the tip-sample
interaction is substantially one-dimensional, and thus consideration of the z-component of
the force derivative gives satisfactory numerical estimations.
The phase shift ∆φ is proportional to the force derivative F’:
ZFzk
Q∂∂
−=∆φ [3.8]
In addition to the one-dimensional approximation above, some further simplified
modes have been proposed to estimate the real distribution of the magnetization of the
MFM tip, Mtip. There are two most widespread approaches: the point probe model and
the extended charge model.68-70 Expression for the monopole approximation is given as:
sampletipsampletiptipHM HqdVHMF ⋅−→∫∇=− [3.9]
where Vtip is the effective imaging volume of the tip, and the total magnetization of the tip
is considered as a magnetic pole, q. (Using dipole approximation gives the same result in
Equation 3.6) Thus we have
ZHzk
qQ∂∂
−=∆φ [3.10]

- 60 -
Factors affecting resolution and sensitivity
The most important parameter affecting imaging resolution is Lift height. The range
of 10–200 nm is most useful. In general, MFM resolution is roughly equal to the lift
height. Smaller Lift Scan heights give better resolution; conversely, magnetic features
smaller than the Lift Scan height may not be resolved. The tip also experiences stronger
fields close to the surface, giving improved signal-to-noise ratios.
Another important issue about MFM is the selection of magnetic tip. Considerations
should include tip sensitivity, coercivity of the tip, coercivity of the magnetic sample and
resolution. For example, high sensitivity is preferred for a sample having weak external
fields. In this case, a magnetic tip with a thicker coating layer should be selected. A
cautionary note is that, in spite of the improved sensitivity, a thicker coating will result in
a tip with a larger stray field, raising the likelihood of locally perturbing the
micromagnetic structure of the sample. A thicker coating also implies reduced spatial
resolution. Therefore, optimization of the MFM response to one of these considerations
may sometimes come at the cost of reduced performance of another. Table 3.2 shows the
two kinds of cantilevers used in this thesis.
Table 3-1. MFM cantilevers used in this thesis (standard data sheet by Veeco)67

- 61 -
IV. ROLE OF PNR IN DOMAIN ENGINEERED
PMN-PT CRYSTALS
4.1 Introduction
The most dramatic feature in the phase diagram of Pb(Mg1/3Nb2/3)O3-PbTiO3
(PMN-PT) and Pb(Zn1/3Nb2/3)O3-PbTiO3 (PZN-PT) solid solutions is the morphotropic
phase boundary (MPB), where enormous piezoelectric and electromechanical coupling
coefficients have been obtained. Structural studies of Pb(Zr1-xTix)O3 (PZT) were the first
that revealed the existence of a new ferroelectric monoclinic phase, which was
sandwiched between the rhombohedral (R) and tetragonal (T) phases near the MPB.26
Two monoclinic phases, MA and MC, have since been reported in PZN-x%PT and PMN-
x%PT.32-34 The MA and MC notation is adopted following Vanderbilt and Cohen.28
Another MB phase was reported in PMN-x%PT (27<x<30).71-72 Theoretical works by
using first-principles or phenomenological approaches have suggested that the enhanced
electromechanical properties near the MPB have the source of induced low-symmetry
phase transitions.27-29
One mystery of the MPB concerns its compositional width. More precisely,
different widths have been reported for the same solid solution, depending on the (i)
growth conditions; (2) experiment methods (dielectric constant measurement, X-ray
diffraction or neutron scattering); and (iii) the thermal and electrical history of crystals.73
Chemical short-range ordering related polar nano regions are often invoked for this
variance between different measurements, since no long-range ordering occurs in the
mixed sublattice of either PZT or PMN–PT systems near their MPBs. However, why and

- 62 -
how PNRs affect the morphotropic phase boundary remains two unresolved questions. To
answer these two questions requires evidences from both bulk phase symmetry and local
domain evolution studies to establish the dependence of the MPB on composition,
temperature and electric field.
Fig.3-1 previously showed the phase diagram of PMN-x%PT in the ZFC condition,
replotted according to recent data published by Noheda et al.36 The MC phase extends
from x=31% to x=37%. For x<31%, the phase diagram exhibits a R phase as well as a
new phase, designated as X, with an average cubic structure (a=b=c).63,74 Pronounced
anisotropic peak broadening has been reported to the left of the MPB; whereas this
broadening is absent to the right of the MPB.36 This anomalous broadening has been
attributed to compositional heterogeneities by Noheda et al.36 However, Singh and
Pandey have argued that the broadening in PMN-x%PT for 27<x<30 can be accounted
for in terms of the Cm space group.71 Accordingly, the structure of PMN-x%PT is R for
x<27, MB type monoclinic for 27<x<30, orthorhombic (O) for x=30, MC type monoclinic
for 30<x<35 and T for x>35.75
In the FC condition, previous investigations in poled PMN-35%PT crystals have
shown a MA phase at room temperature by high-resolution synchrotron XRD.34 As for the
stable phase of other poled PMN-x%PT, less data are available compared to PZN-x%PT,
where a MA phase was reported in poled PZN-4.5%PT and an O phase was reported in
poled PZN-8%PT and PZN-9%PT crystals.32-34 In addition, recent neutron diffraction
studies of the effect of an electric field (E) on PZN-8%PT by Ohwada et al.76 have shown
that a cubic (C) T MC transformational sequence occurs when field-cooled, and that
an R MA MC T sequence takes place with increasing E at 350K beginning from the

- 63 -
ZFC condition. An electric field versus temperature (E-T) diagram was constructed based
on these experiments. However, such transformational sequence has not yet been
experimentally established for PMN-x%PT under electric field. I believe that such work
is very important to extend knowledge of the abnormal MPB, affected by both
temperature and E-field, in relaxor systems.
Corresponding to these structural studies, counterpart investigations of the domain
structure evolution with increase of PT content have been performed by polarized optical
microscopy (POM)77-80, and transmission electron microscopy (TEM)81-83. For example,
spindle-like rombohedral domains, monoclinic domains with various optical extinction
angles, and stripe-like tetragonal domains have been reported in PMN-24%PT, PMN-
33%PT and PMN-50%PT crystals,77-79 respectively. In addition, previous TEM studies
have revealed miniature polar nano domains (or PND) of several hundred angstroms in
size for x<30, where the average size decreased with decreasing x; small cross-hatched
tweed-like domains for 30≈x<35; and normal micron-sized 90o domains in the T phase,82-
83 as shown in Fig.1-9. However, these experiment results are far from satisfactory. The
POM can not reveal the details of domain configurations due to limited resolution, but
rather only provides a representative domain structure averaged throughout the specimen
thickness. Also, the high energy of the electron beam in TEM can alter the domain
configuration.
In recent years, scanning force microscopy (SFM) in the piezo-response mode
(PFM) has been used to study ferroelectric domains in PMN-PT and PZN-PT crystals.84-
85 Small irregular domain structures were observed in the poled condition in both vertical
and lateral piezoelectric modes, whereas large antiparallel domains were found in the

- 64 -
unpoled condition, demonstrating that small scale ferroelectric domain features can be
identified by this method. The dependence of the domain structure on orientation has also
been reported for unpoled PZN-4.5%PT crystals.86 In the unpoled condition, small
irregular domains were reported on (001)-oriented surfaces; whereas for (111) cuts,
normal micron-sized domains oriented along permissible crystallographic planes were
found. However, systematic domain investigations have not yet been performed
comparing the morphological details over a range of length scales for the ZFC and FC
domain structures, which is very important to understand the nature of the domain
engineered state and resultant anomalous electromechanical properties.
In the following sections, I will present a combination phase transformation and
domain structure investigation. My intention is to establish a comprehensive
understanding of (i) how the phase stability of average crystal symmetry is altered with
temperature and electric field (Section 4.2); (ii) how the domain configurations of
different compositions are related with their symmetries in the ZFC condition (Section
4.3) and FC condition (Section 4.4); and (iii) how the domain configurations evolve
during poling and switching (Section 4.5). A brief summary will then be given at the end
of this chapter.

- 65 -
4.2. Phase transformation sequence of PMN-30%PT under E-field
In this section, my focus is on establishing the structural transformation sequence of
PMN-30%PT as a function of temperature and electric field. PMN-30%PT was chosen
because it locates just outside of the monoclinic phase in the phase diagram and has the
highest electromechanical properties. Careful experiments have been performed using both
x-rays and neutrons, starting from an annealed condition and by (i) cooling the sample from
550K to 300K under constant electric field; and (ii) gradually increasing E at constant
temperature. The results unambiguously identify a transformational sequence of
C T MC MA in the FC condition, and of R MA MC T with increasing E at
constant temperature.87
The electric field-temperature measurements are summarized in Fig.4-1. This is
done for convenience of reading – raw data will be presented in the following
subsections. The top panel of this figure gives the field-cooled diagram, where
measurements were made under a constant field on cooling from 500 K, whereas the
bottom panel was obtained by increasing E beginning from the ZFC condition at each
fixed temperature. Circles represent the transition temperatures and fields determined
from each increasing field sequence. Arrows are used to indicate the scanning direction
and range of the corresponding measurement sequence.

- 66 -
300 350 400 450 5000
2
4
0
1
2
3
Increasing FieldMCMA
E (k
V/c
m)
T (K)
T
C
R
Cooling
PMN-30%PT, E// [001]
Field Cooling
CTMCMA
Fig.4-1. E-T diagram. Top panel is obtained from FC structural measurements. Bottom panel
shows data from the increasing electric-field process after ZFC. Arrows indicate the scanning
directions and ranges of the corresponding measurement sequences. Circles represent the
transition temperatures and fields determined from each sequence.

- 67 -
4.2.1 XRD investigations
Phase stability in zero-field-cooled condition
The temperature dependence of the lattice parameter was investigated under zero
electric field (E=0kV/cm). The specimen was first heated up to 700 K, and it was
confirmed that the structure was cubic. Measurements were then made on cooling. A cubic
to tetragonal phase transition was observed near 405 K associated with 90° domain
formation, which was confirmed by observing a peak splitting of the (200) reflection. By
fitting the (200) reflection with a double Gaussian function, we obtained the temperature
dependence of the lattice constants cT and aT, as shown in the top panel of Fig. 4-2. On
further cooling, a subsequent tetragonal to rhombohedral transformation was found near
385 K. This was manifested by the development of a splitting of the (220) reflection, and a
simultaneous disappearance of the (200) peak splitting. The rhombohedral lattice
parameters and tilt angle (α) were calculated by fitting the (220) reflection to (220) and
)022( peaks. The temperature dependence of α is shown in the bottom panel of Fig.4-2.
Our x-ray results under zero field are in close agreement with the x-ray powder diffraction
results on PMN-30%PT of Noheda et al.36

- 68 -
300 400 500 600 700
0.00
0.05
0.10
4.015
4.020
4.025
4.030
Lat
tice
Para
met
ers (
Å)
α (d
eg.)
T (K)
aT
cT
aCaR
PMN-30%PT, E=0, Cooling
Fig.4-2. The dependence of the lattice parameters (top panel) and α (bottom panel) on
temperature under zero electric field.

- 69 -
Phase stability in field-cooled condition
The temperature dependence of the lattice parameter was investigated under
electric fields of 1 and 2 kV/cm. The specimen was first heated up to 500 K. An electric
field was then applied and measurements were made on cooling. For E=1 kV/cm, a cubic
to tetragonal phase transition was observed on cooling near 430 K, as determined by the
starting temperature at which 2θ began decreasing (i.e., the c parameter increasing) in the
(002) profile on cooling. A tetragonal to monoclinic MC transformation was found near
365 K, and on further cooling a subsequent monoclinic MC to monoclinic MA transition
occurred. After increasing E to 2kV/cm, the T MC and MC MA transition temperatures
decreased, and the phase stability ranges of both T and MC phases increased.
A sketch of the unit cells and domain configurations in the reciprocal (h0l) plane
for the MA and MC phases is shown in Fig.4-3(a) and (b), respectively. For the MA phase,
am and bm lie along the pseudo-cubic [ ]011 and [ ]011 directions, and the unit cell is
doubled in volume with respect to the pseudo-cubic unit cell. For the MC phase, am and
bm lie along the [100] and [010] directions, and the unit cell is primitive. In both cases,
the angle between am and cm is defined as β. Usually, monoclinic symmetry leads to a
very complicated domain configuration. However, once the field is applied, the c axis is
fixed along the field direction. The monoclinic domain configuration then consists of two
b domains related by a 90o rotation around the c axis, and each of the b domains contains
two a domains in which am forms angles of either β or 180o- β. In the (H0L)cubic zone,
only two a domains can be observed for the MA phase, as shown in Fig.4-3(a); whereas
one b domain and two a domains can be observed for the MC phase, as shown in Fig.4-
3(b).

- 70 -
Fig.4-3. Sketch of the unit cell and domain configuration in the reciprocal (h 0 l) plane for
monoclinic phases, (a) top: unit cell of MA phase; bottom: domain configuration in reciprocal
space, illustrating the two a domains of MA; and (b) top: unit cell of MC phase; bottom: domain
configuration in reciprocal space, illustrating the two a domains (unshaded) and one b domain
(shaded) of MC phase.
a
b
cβ
c*
b*
a*
a
b
cβ
c*
a*
MA MC(a) (b)

- 71 -
To best illustrate the observed transformational sequence, XRD mesh scans around
(200) and (220) reflections are shown in Fig.4-4 taken at temperatures of 375, 350 and
300 K. These scans were all obtained under an applied dc electrical bias of E=1 kV/cm.
For T=375 K, the lattice constant cT is elongated, whereas aT is contracted. This indicates
phase with tetragonal symmetry. For T=350 K, the (200) reflection was found to split
into three peaks, consisting of two (200) peaks and a single (020) peak; whereas, the (220)
reflection was found to be split into two peaks. These results indicate a phase with
monoclinic MC symmetry. On further cooling, significant changes in the mesh scans were
found. For T=300 K, the (200) reflection was found to split only into two peaks, which
can be attributed to the presence of two domains, whereas the (220) reflection was found
to split into three peaks. This indicates a phase with monoclinic MA symmetry. The room
temperature mesh scans are consistent with those previously reported by Ye et al. for
PMN-35%PT crystals,34 demonstrating that the MA phase is stable in the FC condition.
Moreover, our results also give conclusive and direct evidence of an MC MA transition
on cooling in the FC condition for PMN-30%PT. This is different from the results for
PZN-8%PT single crystals, where an MC MA transition was not observed in the FC
condition.76
Fig.4-5 shows the temperature dependence of the structural data in the FC
condition for E=1 kV/cm. The top panel of this figure shows the lattice parameters, and
the monoclinic tilt angle (β−90o) is shown in the bottom panel. The lattice constant cT (aT)
gradually increases (decreases) with decreasing temperature. Near T=365 K, where the
T MC transition occurs, the value of the lattice constants abruptly changes and a
monoclinic tilt angle of βMc−90o ≈0.08ο forms between the (001) and (100). In the MC

- 72 -
phase region, the lattice parameters aMc, bMc, cMc, and βMc are relatively temperature
independent over the range of temperatures investigated. The value of bMc can be viewed
as a natural extension of the aT lattice parameter; the value of aMc is close to the value of
the cubic lattice parameter, whereas the value of cMc is notably different than either cT, aT,
or ac. Near T=330 K, the lattice constants and the tilt angle abruptly change, where the
MC MA transition occurs. Again, in the MA phase region, it was found that lattice
parameters are only weakly temperature dependent over the range of temperatures
investigated.

- 73 -
Fig.4-4. Mesh scans around the (200) and (220) reciprocal lattice positions at different
temperatures in field-cooled process.

- 74 -
300 350 400 450 500
0.00
0.05
0.10
4.01
4.02
4.03
4.04
T (K)
Lat
tice
Para
met
er (Å
)β-
90o (d
eg.)
MA MC
T
C
a b c
PMN-30%PT E=1kV/cm, cooling
Fig.4-5. Temperature dependence of the lattice parameters (top panel), and 90°-β (bottom panel)
observed in field-cooled process. For the MA phase, the lattice parameters aMa/√2, bMa/√2 and cMa
are plotted; whereas, for the MC phase the lattice parameters aMc, bMc and cMc are plotted. Solid
lines drawn through the data points are guides to the eyes.

- 75 -
Phase Stability at fixed temperatures with increasing E
The field dependence of the lattice structure was investigated at various temperatures.
The specimen was first heated up to 550 K and then cooled under zero field. This was done
at the beginning of measurements at each temperature, thus ensuring that the specimen was
always properly zero-field cooled. XRD mesh scans were then performed at various dc
electric biases for 0≤E≤4 kV/cm. Both R MA and MA MC transitions were observed
with increasing E.
Mesh scans around (200) are shown in Fig.7 taken at 0, 0.5, 3 and 4kV/cm. These
scans were all obtained at T=350 K. The corresponding lattice parameters were listed in
Table 1. For E=0 kV/cm, a rhombohedral phase was found. Under E=0.5 kV/cm, the (200)
reflection was found to be split into two peaks. This indicates an R MA transition with
increasing E. Under E=3 kV/cm, the (200) was found to be split into three peaks,
revealing a monoclinic MC phase. And under E=4 kV/cm, the (200) was found to become
to one peak, revealing a tetragonal T phase.
These changes in the mesh scans provide conclusive evidence of an R MA MC T
phase transition sequence with increasing E starting from the ZFC condition. The field at
which the R MA, MA MC and MC T transitions occur varies with temperature, and is
summarized in the E-T diagram of Fig.4-1(b). Upon removal of the field, the R phase does
not recover, but instead a monoclinic phase appears. For T<350 K, the MA phase is
recovered; whereas for T>350 K, the MC phase is recovered. Thus, the MA phase dominates
the E-T diagram. This is different from the previous results for PZN-8%PT, where the MC
phase recovers after removal of the field, instead of the MA phase.76

- 76 -
Fig.4-6. (200) mesh scan at 350K with increasing field, which clearly shows a sequential phase
transition from R MA MC T.

- 77 -
Table 4-1. Lattice parameter for the PMN-30%PT at 350K with increasing electric filed, measured by XRD. Errors = +0.002Å.
a (Å) b (Å) α(=γ) (o) β (o) Phase ZFC from 550K, E=0 4.020 R
E=0.5kV/cm 4.023 90 90.08 MA E=2kV/cm 4.019 4.014 90 90.09 MC E=4kV/cm 4.015 4.015 90 90 T
Table 4-2. Lattice parameters of PMN-30%PT under zero-field, measured by neutron scattering. Errors= +0.001Å
T (K) Phase a (Å) b (Å) c(Å) α(=γ) (o) β (o) 600 C 4.022 4.022 4.022 90 90 550 C 4.020 4.020 4.020 90 90 450 C 4.019 4.019 4.019 90 90 400 T 4.017 4.017 4.023 90 90 350 R 4.019 4.019 4.019 89.96 89.96 300 R 4.019 4.019 4.019 89.91 89.91 200 R 4.018 4.018 4.018 89.87 89.87 100 R 4.017 4.017 4.017 89.84 89.84

- 78 -
4.2.2 Neutron scattering investigations
Neutron scattering investigations were also performed in the zero-field-cooled state.
The crystal was first heated up to 600 K, where again it was confirmed that the structure
was cubic. Measurements of both (220) and (002) reflections were then made on cooling
between 600K and 50K. A cubic to tetragonal phase transition is observed near 410 K,
and confirmed by the peak splitting of the (002) reflection, similar to that found by XRD.
A tetragonal to rhombohedral phase transition is observed near 385 K, as evidenced by
the disappearance of the (002) splitting, and the development of a (220) splitting. The
rhombohedral phase persists down to 50 K.
Fig.4-7 shows (220) scans taken at 500K and 100K. The single peak at 500K
confirms that the structure is cubic, while the splitting of the (220) is clearly evident in
the low temperature rhombohedral phase. In addition, a dramatic change in the line width
was found on cooling. The line width was nearly an order of magnitude broader in the
rhombohedral phase, relative to that in the cubic phase.
By fitting the (002) reflection with a double Gaussian function, we obtained the
tetragonal lattice constants cT and aT. The lattice parameter and tilt angle (α) of the
rhombohedral phase were calculated by fitting the (220) reflection to (220) and )022(
peaks. A summary of the temperature dependence of the lattice parameters is presented in
Table 2. The neutron results clearly show that the rhombohedral phase is stable at room
temperature, in agreement with our XRD studies and previous investigations by Noheda
et al.36
Mesh scans of a poled PMN-30%PT single crystal were also obtained by neutron
scattering. A (200) peak splitting along the transverse direction was found, as can be seen

- 79 -
1.99 2.00 2.01
0
100
200
300
400
500
600
MA
0.00
0.01
-0.01
2.012.001.99
(0,0
,L)
(H, 0, 0)
Neutron
T=100K T=500K
Inte
nsity
(arb
.)
(H, H, 0)
Fig.4-7. Neutron (220) profiles for PMN-30%PT. The sample was cooled under E=0. The solid
lines are fits described in the text. The inset shows a neutron intensity contour around the pseudo-
cubic (200) reflection in the H0L zone at 300K, which confirms the existence of the MA phase in
the FC condition. These data were all taken using a perfect crystal Ge (004) analyzer17.

- 80 -
in the inset of Fig.4-7. The (200) splitting can be attributed to two a domains. This
neutron mesh scan is nearly identical to the XRD mesh scan shown in Fig.4-4. The
neutron mesh scan shows that the MA phase is stable in the bulk of the crystal.
4.2.3. Discussion and summary
Our results for PMN-30%PT in the ZFC condition demonstrate a phase
transformational sequence of C T R with decreasing temperature (Tc≈405K). The
results are in agreement with the phase diagram given in Fig.2-1, which provides a
confirmation for the composition of the crystal. This is important to know for sure, as if x
had been slightly higher, Mc could have been the stable ground state, rather than R.
The stability of the MA phase
With decreasing temperature under a constant applied field (i.e., in the FC
condition), we find that PMN-30%PT undergoes the phase transformational sequence
C T MC MA. This sequence is similar to that observed in PZN-8%PT,76 except that
our x-ray and neutron investigations reveal an MC MA transition with decreasing
temperature, which was not found for PZN-8%PT. Moreover, with increasing field at
fixed temperature starting from the ZFC condition, we find that PMN-30%PT exhibits the
phase transformational sequence R MA MC T. The R MA transition is irreversible
upon removal of the field, whereas the MA MC transition is reversible. Similar studies
of PMN-25%PT (data not shown) also indicate that the MA phase is stable at room
temperature in the after-poled condition. Clearly, compared with the MPB compositions
of PZN-x%PT, the MA phase dominates the E-T diagram of PMN-x%PT, and not the MC

- 81 -
phase. Ohwada et al. explained the MC phase in PZN-8%PT by a hidden orthorhombic
symmetry, located on the T-MC-O polarization rotational pathway.76 However, more
thought is required to explain the reversibility of the MC MA transition in PMN-x%PT
after removal of the field, since the MC phase is currently believed to be the ground state
at the MPB.
Recent investigations by Singh et al. on polycrystalline PMN-x%PT for
0.27≤x≤0.30 have reported a monoclinic MB phase at room temperature.71 In the MB
phase, the polarization would be constrained to the (100)c plane, and there would be two
a domains in the reciprocal (hk0) plane where the lattice parameters fulfill aMb>cMb. Our
investigations have failed to find an MB phase, either in the ZFC condition (where we
found the R phase) or in the FC condition (where we found two a domains with aMb<cMb,
i.e., the MA phase). However, recent investigations by Viehland and Li have indicated
that the MB phase can be induced only by an electric field applied along (011)c, where the
MA phase is recovered on removal of E.72
Diffuse nature of phase transformational sequence
The E-T diagrams in Fig.4-12 show that the temperature stability range of the MA,
MC, and T phases is significantly increased by the application of an electric field. This
can be further noted by comparisons of the lattice parameter data for the ZFC state in
Fig.4-2 with that for the FC state (E=1 kV/cm) in Fig.4-4.
We performed dielectric constant measurements under the same temperature and
field conditions as that for the ZFC and FC lattice parameter data. Fig.4-13 shows the
dielectric constant as a function of temperature for (a) E=0 kV/cm on cooling, and (b)
E=1 kV/cm on cooling. The dielectric response in both cases is a single, broad featureless

- 82 -
peak, which is typical of a diffuse phase transition. The temperature of the dielectric
constant maximum (Tmax) did not change between the ZFC and FC measurements – Tmax
is ~405K in both cases. In this regard, the dielectric constant data reveal a notable
difference with respect to the corresponding lattice parameters. Previous studies of PZN-
8%PT by Ohwada et al. have shown a similar large change of the C T boundary with
increasing E in the E-T diagrams;76 in addition, recent dielectric investigations of PMN-
30%PT have shown a field independence of Tmax,88 similar to that shown in Fig.4-8.
One would expect that the changes in the lattice parameters would occur at
temperatures below Tmax. This is required either for a 1st or 2nd order transition. However,
in the FC state, our data show that a tetragonal splitting develops at T>Tmax. In diffuse
transitions, local polar regions are believed to have transition temperatures notably
greater than that of the dielectric maximum.89 According to the theory of diffuse
transitions, the prototypic cubic and low temperature ferroelectric phases coexist over a
broad temperature range, where the relative volume fractions of the coexisting phases
change with temperature. However, our structural investigations demonstrate a single
phase tetragonal region over the temperature range of 365<T<430K, even though the
observed Tmax from the dielectric constant was ~405K.

- 83 -
0
10000
20000
30000
40000 CTR
(a) PMN-30%PT E=0, cooling
Die
lect
ric C
onst
ant,
K
0
10000
20000
30000
40000
300 350 400 450 500
Temperature (K)
CTMCMA
(b) E=1kV/cm, cooling
Die
lect
ric C
onst
ant,
K
Fig.4-8. Temperature dependence of dielectric constant of PMN-30%PT PT (a) zero field cooled
at E=0; and (b) field cooled at E=1 kV/cm. The dashed lines indicate the phase range determined
by XRD studies.

- 84 -
Indications of non-conventionality were also found in the FEMa FEMc transition. It
is important to first remind ourselves that the Mc and Ma phases do not have subgroup
relationships between the symmetries of their point groups. Glazer has recently noted the
relevance of this fact to MPB transitions in ferroelectrics.90 Thus, in a displacive
transformation, originating from an m3m prototypic symmetry, the FEMc FEMa
transition is required to be first order. A common way to determine the order of a
ferroelectric transition is by a Curie-Weiss plot of the dielectric constant. Fig.4-9 shows
the Curie-Weiss plot, K-1 vs. T, during field cooling. Neither a 1st nor 2nd order transition
was found at the MC MA transition. Rather, the data is featureless, indicative of a
diffuse MC MA transition and that the transition can not be understood as a conventional
displacive structural phase transition. Furthermore, a clear 2nd order transition was found
during a MC MA transition. However, it was found that the lattice parameters of T and
MC phase had the intrinsic relationships predicted by the adaptive theory. Thus the T M
transition was believed an atomic level domain rearrangement instead of a true phase
transition. However, it is still unknown whether domain rearrangement can produce
dielectric constant peak or not.
In conclusion, we have established that the phase transformational sequence of
PMN-30%PT is (i) C T MC MA on cooling in the FC condition; and (ii)
R MA MC T with increasing E at constant temperature starting from a ZFC condition.
The R MA transition is irreversible, but the MA MC transition is reversible upon
removal of the electric field. As a consequence MA is the dominant phase for T<Tc in the
E-T diagram. Evidence is also given that the FEMa FEMc is not 1st order, but rather
diffusive.

- 85 -
0
10000
20000
30000
40000D
iele
ctric
con
stan
t E=0 1kV/cm 1.3kV/cm 2kV/cm
200 300 400 5000.0000
0.0001
0.0002
0.0003
0.0004
0.0005
1/ k
Temperature (K)
E=0 1kV/cm 1.3kV/cm 2kV/cm
Fig.4-9. Temperature dependence of dielectric constant of PMN-30%PT during field cooling at a
frequency of 100kHz, (a) k vs. T plot and (b) Curie-Weiss plot. The dashed lines indicate the
phase range determined by XRD studies under E=2kV/cm.
MA MC T C

- 86 -
4.3 Domain hierarchy in PMN-x%PT crystals
4.3.1 Domain evolution with various compositions
First, we illustrate changes in the PFM (real-space) images for unpoled (001)-
oriented PMN-x%PT crystals with various values of x between 10 and 40%, as given in
Fig.4-10. Polar nanoregions (PNRs) were found for PMN-10%PT, which were quite
irregular in morphology and distribution. The average PNR size was small, close to the
tip’s resolution limit (~40nm). With increasing PT content to 20%, the density of PNRs
increased, and some limited assembly into regular patterns observed. With increasing x
to 30%, the average size of the PNRs continued to increase, and their distribution
became increasingly regular. For x=35%, self-assembly of PNR into long and thin
<110>-oriented domain striations was apparent. These <110> striations subsequently
assembled into 90o macro-domain plates that were aligned along the <010>. Finally, for
PMN-40%PT, only 90o micron-sized tetragonal domains with a <100> preferred
orientation were found, typical of a ferroelectric tetragonal phase.
Next in Fig.4-11, we show the FFT (reciprocal space) images that correspond to
the domain structures in the respective parts of Fig.4-10, where π/λx and π/λy are the
domain wave-vectors along the x- and y- directions. For PMN-10%PT, the average value
of π/λx was quite large, reflecting small average domain sizes (40nm). The intensity
distribution of the FFT image resembled a halo that was very diffuse and symmetric
about the x- and y-axes. The halo feature shows that there is no preferred crystallographic
orientation of PNR, and the diffuseness reveals the presence of a broad distribution in
PNR sizes. Accordingly, the PNRs are independent of each other, and essentially are not
stress accommodating to each other. It also can not be ruled out that weak contact forces

- 87 -
with the SiN probe-tip might alter the PNR state at the crystal surface, as it is presumably
quite fragile. With increasing x to 20%, the FFT images remained broad, diffuse and
symmetric along both x- and y-axes. Accordingly, both PMN-20%PT and PMN-10%PT
do not have any significant degree of geometrical organization of their PNRs along any
preferred crystallographic direction – they are insensitive to domain engineering.
Upon increment of PT-content from 30<x<40%, significant changes in the FFT
images were observed. For x=30%, the value of the average domain size was increased to
λ=340nm. In addition, an elongation of the intensity distribution within the FFT image
was found along the <110>, indicating some self-organization of PNRs into longer-scale
domain features that are partially stress accommodated. However, for x=35%, a
significant degree of crystallographic regularity in the domain features was found along
<110>, as evidenced by the sharp splitting of the FFT intensity distribution about this
direction. FFT analysis yielded an average domain width and length of λy~300nm and
λx~5000nm, respectively. This significant enhancement in domain self-organization
indicates that stress accommodation along the <110> becomes increasingly important in
the vicinity of the MPB. Finally, on increment of the PT-content to x=40%, the FFT
image revealed strict domain alignment along <100> – a signature of a tetragonal
ferroelectric phase. The average domain length was DC (~10 µm in this image, but 40
µm using a larger scan area) and the average width was ~2 µm. The large domain size
and strong <100> alignment shows that the tetragonal phase is fully formed. [Also see
reference 91]

- 88 -
Fig.4-10. Piezoresponse force images for various (001)-oriented PMN-x%PT crystals.
10PT
20PT 30PT
2μm
35PT 40PT
(001) PMN-x%PT

- 89 -
Fig.4-11. Fast Fourier Transformation of images in Fig.4-10.
20PT 30PT
35PT 40PT
PMN-x%PT, (001), FFT
[100]
[001]
[010]
20
DC
20
π/λ y
(µm
-1)
20
DC
20
20
DC
20
π/λx (µm-1)
DC DC 20 20 20 20
10PT

- 90 -
4.3.2 Characterization of domain structures over various length scales
For (001)-oriented PMN-10%PT, which is of the X phase,63 POM revealed a
featureless image. However, the corresponding PFM image, shown above, revealed the
presence of PND. Comparison of these results show that phase X consists of PND,
which do not self-assemble into macro-domain plates. The PND are essentially non-
stress accommodating, and thus their boundaries are not restricted by elastic
compatibility. A similar domain structure was observed for PMN-20%PT. However,
with increasing PT concentration, more regular domain patterns became evident, as to be
shown below, indicating an importance of stress accommodation.
Fig.4-12 shows POM and PFM images taken over various lengths scales for (001)-
oriented PMN-30%PT, which is of the R phase.36 Part (a) shows a POM image that
reveals rhombohedral macrodomain plates twinned close to a <110>, which have a
spindle-like morphology. The macrodomain widths are ~1 µm and their lengths are ~20
µm. Inside of the macrodomain plates, miniature ‘wavy’ domains oriented close to a
<110> were found, as shown in the PFM image of Part (b). A higher resolution PFM
image, shown in Part (c), illustrates that the domain boundaries are rough, and that there
are irregularities of similar size to PND internal to the ‘wavy’ domains. In Part (d),
cross-sectional line analysis along the [110] direction revealed an average domain
spacing of ~0.34µm, where the phase difference fluctuated pronouncedly as a function of
distance.

- 91 -
Fig.4-12. Domain hierarchy of (001)-orientated PMN-30%PT in R phase. (a) Spindle-like
macrodomain plates with a <110> type preferred orientation by POM; (b) wave-like self-
assembled domains by PFM; (c) high resolution PFM image illustrating non-smooth domain
boundaries and irregularity; and (d) cross-sectional line analysis normal to [110].
(001) PMN-30%PT
irregularities
[100][001
[010]
[110
4μm 0.4μm

- 92 -
Fig.4-13. Domain hierarchy of (001)-orientated PMN-35%PT in Mc phase. (a) Stripe-like
macrodomain plates with a [010] type preferred orientation by POM; (b) micro domain striations
with a <110> type preferred orientation by PFM, kinks are illustrated at boundaries; (c) high
resolution PFM image, illustrating non-smooth domain boundaries and irregularities; and (d)
cross-sectional line analysis normal to [110].
0.4μm
(001) PMN-35%PT
4μm
Kin
irregularitie
[100][001
[010]
[110
100μm

- 93 -
Fig.4-13 shows the domain hierarchy for (001)-orientated PMN-35%PT, which is of
the Mc phase.36 Broad stripe-like domains oriented close to a <001> direction were found
by POM, as shown in Part (a). The average domain width was ~50µm. Inside the
macrodomain plates, alternating domain striations oriented close to a <110> were found
that had a width of <0.5µm, as shown in the PFM image of Part (b). Kinks between
neighboring striations, illustrated by a circle, are 90o twins between them. A higher
resolution PFM image is given in Part (c). The striations can be seen to be rough and
non-uniform in thickness, having internal irregularities of similar size to PND. Cross-
sectional line analysis, shown in Part (d), yielded an average domain spacing of ~0.35
µm. In addition, the analysis indicated pronounced contrast variation within a domain,
as illustrated by the peaks between two triangles, which may be sub-domain structures
corresponding to PNDs in Part (c).
The domain hierarchy of PMN-40%PT is shown in Fig.4-14, which is of the T
phase.36 Stripe-like tetragonal domains oriented close to a <001> are apparent in the
POM image of Part (a). These macrodomain plates are similar to those of PMN-35%PT,
except for thin 90o fringes, indicative of a larger transformation stress. Internal to the
macrodomains, fine broken domain striations were found that were oriented close to a
<001>, as can be seen in the PFM image of Part (b). Their lengths varied from several to
~30µm. It is relevant to note that these macrodomains and internal striations were both
oriented along the same direction, unlike that for PMN-35%PT. Part (c) shows a higher
resolution PFM image, revealing that the striations are quite rough. Cross-sectional
analysis taken along the [010], shown in Part (d), reveals an average domain spacing of
~2 µm that fluctuated notably, possibly reflecting the domain heterogeneities in Part (c).

- 94 -
Fig.4-14. Domain hierarchy of (001)-orientated PMN-40%PT in T phase. (a) Stripe-like
macrodomain plates with a <100> type preferred orientation by POM; (b) <100> orientated
stripe-like micro domains with fibrous sub-domain structures by PFM; (c) high resolution PFM
image, illustrating domain irregularity; and (d) cross-sectional line analysis normal to [100].
(001) PMN-40%PT
[100][001
[010]
[110
0.4μm4μm
100μm

- 95 -
4.3.3 Evolution from PNR to macro domain
The results above are very helpful to explain the [002] line scans of PMN-x%PT by
XRD, as shown in Fig.4-15. For 10%PT, although there are many PNRs embedded in a
cubic matrix, the size of these PNRs is well below the coherence length of X-ray.19 So a
very sharp peak was observed with a FWHM (full width at half maximum) of 0.0276.
For 20%PT, both the size and density of PNRs have significantly increased. The PNR
should now be called as polar nano domain (PND) with the appearance of a bulk
ferroelectric phase. XRD shows a typical signature of R phase: one peak for a {002} line
scan, two peaks for {101} or {111} line scans. These PNDs are now detectable by X-ray
and cause broadening of the (002) peak with a FWHM of 0.058. However, there is no
clear boundary between PNR and PND or between cubic and rhombohedral phase on the
phase diagram, which is actually depending on the detection wavelength.
With PT concentration increasing to 30%PT, even broader (002) peak was observed
with a FWHM of 0.1200 - 4x of that of 10%PT. This is due to the high density of PND
in PMN-30%PT crystal. Also, it should be noted that the (002) peak is left-asymmetric,
which was found in both XRD and neutron scattering.87 There are two possible causes
for the asymmetry: stress or the appearance of a second phase. As mentioned above, all
samples were annealed at 550K to remove residual stress. Since the line scan plot
exhibits three splits for (110) peak, it is reasonable to state that a second phase coexists
with the rhombohedral phase. However, it may be of a low volume fraction, and thus
was not be resolved by mesh scans.

- 96 -
44.4 44.6 44.8 45.0 45.2 45.4 45.60
10000
20000
30000
40000
50000
Inte
nsity
(arb
. uni
ts)
10PT 20PT 30PT 35PT 40PT
65.2 65.4 65.6 65.8 66.0
0
2000
4000
6000
8000
10000
12000
Inte
nsity
(arb
. uni
ts)
2θ (degree)
30PT 35PT 40PT
Fig.4-15. XRD of PMN-x%PT (x=10, 20, 30, 35 and 40), (a) (200) line scans; and (b) (110) line
scans. Note the left asymmetric (200) peak of PMN-30%PT.
FWHM: 0.0276 0.0580 0.1200 0.0419

- 97 -
The PNDs evolve into stress-accommodated micro domains in PMN-35%PT with
clear [110] preferred orientation. No macro twin structure was found. However, [001]
oriented kinks are observed, which are the tetragonal domain boundaries observed by
POM. The size of these domains are larger than the X-ray coherence length, thus a
narrower peak was observed in the (200) line scan with a FWHM=0.0419. In addition,
there were clearly two peaks on the (200) line scan. Noheda et al. have suggested a
coexistence of M and T phases in PMN-35%PT. We thus confirmed different domain
symmetries on different scale levels: a monoclinic one at the microdomain level
observed by PFM and a tetragonal one at the macro domain level observed by POM.
For 40%PT, in spite of the fact that well-aligned stripe-like macro-domains were
observed by POM and clear tetragonal splitting was found in the {200} line scan, small
PNDs may still persist due to compositional inhomogeneity. This could contribute to
broadening along the (200) and (002) peaks, where FWHM were found to be 0.0993o
and 0.0631o respectively.
In summary, our results demonstrate (i) a domain hierarchy on various lengths
scales between nano- and milli-meters for certain compositions; and (ii) evolution from
PNR to macro domain by stress accommodation with increasing PT concentration, as
shown in Fig.4-16. In details, phase C consists of PNR, which do not self-assemble into
macrodomain plates that can be detected by X-ray or neutron beam; phase R (x=20, 30)
consists of PND that begin to self-assemble into colonies close to a <110>; Phase M
(x=35) consists of micron-domains, which first self-assemble into <110> striations of
µm size and then <001> macrodomain plates of mm size; and phase T (x=40) consists of
<001> oriented striations of µm size that still have an internal nano-scale heterogeneity.

- 98 -
Fig.4-16. Schematic illustration of domain evolution from PNR to macrodomain plate with
respect to relevant phase symmetries in PMN-x%PT crystals.
PNR
PND Micron
Tetragonal domain T
PT %
- 99 -
4.4 Domain configurations of after-poled PMN-x%PT
In the after-poled conditions, 20PT and 30PT change from R to MA phases; 35PT
and 40PT are still MC and T phase, however, domain rearrangement occurs during field
cooling. In the following sections, the domain structures of field-cooled (FC) PMN-
x%PT crystals were investigated. [Also see reference 92]
4.4.1 Domain structures in the field-cooled condition
PMN-20%PT
Fig.4-17 shows POM and PFM images taken over various length scales for (001)
PMN-20%PT in the ZFC and FC (E=6kV/cm) conditions. In the ZFC condition (see Part
(a)), which is of the X phase, no larger scale domain features were found by POM.
Similar POM images were obtained for the FC condition, but are not shown. However,
miniature polar domains of nano-meter size (PND) were found in the PFM images,
whose morphology and distribution were quite irregular, as shown in Part (b). The
volume fractions of light and dark color regions, representative of different domain
variants, were roughly equal. In the FC condition (see Part (c)), miniature domains of
irregular shape remained present, and there was no clear evidence of significant domain
growth. However, the relative volume fraction of one domain variant was strongly
favored over the others, indicating an alignment of PND along an easy axis.

- 100 -
Fig.4-17. Domain hierarchy of (001)-orientated PMN-20%PT in the ZFC and FC conditions. (a) Lack
of macro-domain plates in the POM image for the ZFC condition, a similar image was found for the
FC condition; (b) PFM image for the ZFC condition; and (c) PFM image for the FC condition
0.4μm
(c) FC (b) ZFC
0.4μm
(a) ZFC
[100]
[001]
[010]

- 101 -
PMN-30%PT
Fig.4-18 shows POM and PFM images taken over various lengths scales for (001)
PMN-30%PT in the FC condition. The stable phase is of the MA structure.87 Part (a)
shows a POM image that reveals tiny domains developing inside of spindle-like domains,
forming at almost 90o angles. The spindle domains are ~1 µm in width; and maintain a
{110} orientation, consistent with the polarization of the MA phase being confined to the
)011(−
c plane. The internal structure of the FC domains was probed using PFM, as shown
in the image given in Part (b). Miniature polar domains were found in the PFM images,
whose morphology and distribution were quite irregular. Part (c) shows a higher
resolution PFM image. Comparisons of Parts (c) of Fig.4-12 and 4-18 in the ZFC and FC
conditions will reveal a dramatic decrease in the size of the miniature domains on poling
for PMN-30%PT. In the ZFC condition, the miniature domains demonstrate a significant
degree of self-assembly, although irregularities of similar size and morphology to PND
were found within the domain striations; whereas in the FC condition, self-assembly was
no longer apparent on a length scale distinguishable by PFM, rather only the irregularities
were apparent. Cross-sectional analysis confirmed a significant decrease in the size of the
miniature domains in the FC condition (0.04 µm), relative to that of the ZFC (0.25 µm in
width and microns in length).
PMN-35%PT
Fig.4-19 shows POM and PFM images taken over various lengths scales for (001)
PMN-35%PT in the FC condition. The stable phase is also of the MC structure.35-36 Part
(a) shows a POM image that reveals the presence of macrodomain plates oriented along
{001} that are ~50 µm wide, which is quite similar with the POM image in ZFC

- 102 -
condition. The internal structure of the FC macrodomains was probed using PFM, as
shown in the image given in Part (b). Part (c) shows a higher resolution PFM image.
Inside the macro-plates was found alternating domain striations; however, comparisons
of the higher resolution PFM images in the ZFC and FC conditions, Parts (c) of Fig.4-13
and 4-19, will clearly reveal two important differences. First, the FC domain striations
were notably shorter in length, than the corresponding ZFC ones – less than one micron
compared to tens of microns, although the widths were quite similar. Second, the FC
domain striations were zig-zagged between {010} variants about the {110}, as indicated
in Fig.4-19(c). In both the FC and ZFC conditions, internal irregularities of similar size to
PND were found. Cross-sectional analysis yielded similar average domain sizes for both
the FC and ZFC conditions (~0.25 µm).
PMN-40%PT
Fig.4-20(a) and (b) show POM and PFM images in the FC condition, respectively.
The macrodomain plates in the PLM image can be seen to be similar to those for the ZFC
condition in terms of size, an internal fibrous structure, and the presence of fringes.
However, in the PFM image, comparisons of the internal fibrous structure between the
ZFC and FC conditions will reveal that the {001} lamella domains are wider, longer, and
more regularly spaced in the FC condition: application of E caused some to grow in a
sidewise direction to the field, and others to shrink. However, inspection of the lamella
domains will reveal many internal irregularities, indicating that domain growth does not
occur by a coherent boundary movement, but rather by the re-organization of internal
irregularities.

- 103 -
Fig.4-18. Domain hierarchy of (001)-orientated PMN-30%PT in the FC condition, which is of the MA
phase. (a) Spindle-like macro domains with <110> preferred orientation by POM; (b) identification of
polar nano-domains or PND by PFM; (c) high resolution PFM image illustrating size of PND; (d)
cross-sectional line analysis normal to [110].
[100]
[001]
[010]
PMN-30%PT, FC, Phase MA
(a)
40µm
(c)
0.4μm
(b)
2μm
5.0
-5.0
0.0
Phas
e D
iffer
ence
(o )
Distance (µm) 0 2.5 5.0 7.5 10.0 12.5
(d)

- 104 -
Fig.4-19. Domain hierarchy of (001)-orientated PMN-35%PT in the FC condition, which is of the
MC phase. (a) Stripe-like macro domains with [100] preferred orientation by POM; (b) domain
striations with either [110] or [001] preferred orientation by PFM, which are of notably smaller length
than those of the ZFC condition; (c) high resolution PFM image; (d) cross-sectional line analysis
normal to [100].
[100]
[001]
[010]
Phas
e D
iffer
ence
(o )
Distance (µm)
5.0
-5.0
0.0
PMN-35%PT, FC, Phase MC
4μm
(b)
100μm
(a)
0.4μm
(c)
(d)
0 2.5 5.0 7.5 10.0

- 105 -
Fig.4-20. Domain hierarchy of (001)-orientated PMN-40%PT in the FC condition, which is of the T
phase. (a) Stripe-like macro domains with <100> preferred orientation by POM; (b) [100]-orientated
strip-like micro domains with fibrous sub-domain structures by PFM; and (c) high resolution PFM
image illustrating irregularity.
[100]
[001]
[010]
100μm
(a)
10μm
(b)
2μm
(c)
PMN-40%PT, FC, Phase T

- 106 -
4.4.2 Comparison of domain structures in the ZFC and FC conditions
Our PFM results provide important insights into the nature of the domain
engineered state in PMN-x%PT crystals. The results demonstrate the presence of a
domain hierarchy on various length scales, ranging from nano- to milli-meters, which
depends upon the electrical history of the crystal. The findings can be summarized with
respect to relevant phases.
For x=20at%, in phase X, the results show the presence of PND that do not self-
assemble into macro-domain plates. The PND are essentially non-stress accommodating.
The boundaries between them are not restricted by elastic compatibility. Field-cooling
aligns PND, however it fails to induce the formation of normal micron-sized domains, or
their assembly into macro-domain plates.
In phase R (i.e., the ZFC condition of PMN-30%PT), the PND assemble into ‘wavy’
domains with some preferential orientation along {110}. These ‘wavy’ domains then self-
assemble into macrodomain plates that are oriented along {111}. However, in phase MA (i.e.,
the FC condition of PMN-30%PT), the hierarchy of domain structures is notably changed,
specifically resulting in a dramatic decrease in the domain size, although the macrodomain
plates keep the same {110} orientation.
In phase MC, for both the ZFC and FC conditions, the PNDs self-assemble into domain
striations; however, there are important differences in the internal structure of the striations.
The striations in the ZFC condition are long and preferentially oriented along only {110};
whereas those in the FC condition are more limited in spatial extent, consisting of zig-zags
between {010} variants about {110}. In both the ZFC and FC conditions, the domain
striations self-assemble into much larger macrodomain plates which are oriented along {001}.

- 107 -
Phase T (x=40%) consists of {001} oriented striations of µm size that have an internal
nano-scale heterogeneity, which self-assemble into macrodomain plates of mm size oriented
along a {001}. Application of E results in growth of some {001} striations at the expense of
others, via re-organization of internal irregularities.
4.4.3 Origin of Domain-engineered state
A natural question to ask is what is the origin of the domain hierarchy, and
subsequent changes with composition and electrical history. It is important to compare our
results with conventional ferroelectric ‘fingerprint’ domains in BaTiO3. In this case
macrodomain plates have been observed, which contain internal ‘fingerprint’ domains.
Following conventional thought, these ‘fingerprint’ patterns are 180o T domains, whose
distribution achieves polarization compensation; whereas the macrodomain plates are 90o
ferroelastic domains, whose distribution achieves stress accommodation. Accordingly, in this
classic case, a domain hierarchy exists, consisting of (i) micron-sized 180o ferroelectric
domains oriented along {001}, which exists inside of (ii) larger 90o ferroelastic domains, also
oriented along {001}.
So what is different in PMN-x%PT crystals? First, the ‘fingerprints’ in PMN-
x%PT crystals were oriented along {110}, for both PMN-30%PT and PMN-35%PT.
Second, the “fingerprints” were apparently built from finer scale polar structures or PND
– there is an additional lower end of the hierarchal scale. Third, the ‘fingerprints’ were
quite irregular in morphology – the ‘wavy’ domain boundaries indicate that random-fields
disrupt the long-range polar order, partially compensating the polarization. Thus, the
domain hierarchy can not be completely adjusted at each length scale in an independent
manner, i.e., polarization compensation and stress accommodation occur at all stages of

- 108 -
the hierarchy, and not at separate length scales independent of the other. Fourth,
‘fingerprints’ within macrodomain plates were found only in phases R and MC; and not in
phases X, MA, and T. Finally, the ‘fingerprints’ in PMN-x%PT crystals were very thin –
the hierarchy consists of an extremely high domain wall density. In particular, the density
of ‘fingerprints’ was extreme near the MPB: at lower PT contents domain irregularities
dominated the morphology, and at higher PT contents ‘fingerprints’ did not form.
Self-assembly due to Stress Accommodation in Adaptive Martensite
Alternatively, let us consider the conventional ferroelastic microstructure. On a
fine length scale, alternating layers of twin-related domains exist, which also form a
‘fingerprint’ pattern, as shown in Fig.4-21.93 The twin boundaries of the ‘fingerprints’ are
not restricted to be 180o. Self-assembly is achieved by varying the relative domain layer
thicknesses of the ‘fingerprints’, which are adjusted to establish the macroscopic
invariance of the habit plane,94-95 and in so-doing eliminating the long-range stress fields
generated by crystal lattice misfits.96-98 This requires the domain-averaged stress-free
transformation strain of each plate to be an Invariant Plane Strain (IPS), where the
invariant plane is parallel to the habit plane. Stress-accommodating alternating domain
layers (or ‘fingerprints’) typical of ferroelastics will occur for any displacive
transformation, which can form a domain-averaged transformation strain that is an IPS –
including ferroelectrics.
Recently, a theory for the conformal miniaturization of the self-assembled domain
topology was developed.42-44 This theory considered the case of abnormally small domain
wall energy, or extreme domain wall density. The theory was applied to ferroelastics and
ferroelectrics containing miniaturized domains – in particular to PMN- x%PT and

- 109 -
Fig.4-21. Structure of a polydomain martensitic plate consisting of alternating lamellae of two twin-
related orientation variants (domains) of the martensite shown by black and white. The boundary
between the lamellae is the twin plane. The ratio of the “black” and “white” domain thicknesses
provides the macroscopic invariancy of the habit plane. These plates fully fill a sample. [Ref.44]
1.0 µm

- 110 -
PZN-x%PT crystals. It predicted the self-assembly of nano-domains into particular
topologies, whose hierarchy was determined by stress accommodation and specific
geometrical invariant conditions. The theory unambiguously predicted that the M phases
of PMN-x%PT and PZN-x%PT are not homogeneous, but rather an adaptive mixed
structural state with microdomain-averaged adjustable topological parameters. Changes
in PND topology then resulted in changes in domain hierarchy, and also in an apparent
phase stability.
Self-assembly of Domain Engineered States in PMN-x%PT
In PMN-x%PT crystals, we believe three ingredients – stress accommodation,
polarization compensation, and random fields99 – are key to understanding the domain
hierarchy. Partial stress accommodation may occur at the ‘fingerprint’ boundaries, in
addition to partial polarization compensation. Also, hierarchal self-assembly is apparently
complicated by random-fields, which partially compensate the polarization.
At lower PT contents, random-fields may limit self-organization of the domain
hierarchy. Thus, only PNRs or PNDs are observed, which do not assemble into striations
or ‘fingerprints’, nor do macrodomain plates form. The domain morphology is non-stress
accommodating. However, with increasing PT content, as the MPB is approached which
has a significantly higher c/a ratio, stress accommodation of the PND may become
critical. To minimize the elastic energy, the PND may begin to assemble into geometrical
patterns that achieve the invariant conditions required of stress accommodation. Since the
invariant plane for R and T domains lies along the {110} and {010} respectively, it is
natural that colonies of PND assemble with a morphology oriented along these two
planes, as showed in Fig.4-19(c). To achieve a more complete stress accommodation,

- 111 -
macrodomain plates then form. At higher PT contents, in the T phase region, the domain
hierarchy is much more like that expected of a conventional C T phase transition in
ferroelectric perovskites. Critical to the fine ‘fingerprints’ is a low domain wall energy
density – which is the key requirement for the conformal miniaturization of stress-
accommodation. Our results show that this requirement is satisfied only in the vicinity of
the MPB.
Field cooling may alter the distribution of PND. Thus, the domain hierarchy can
be changed by electrical history. In the FC condition, for both PMN-30%PT and PMN-
35%PT, the domain striations were reduced in size relative to the ZFC one. This
significant increase in domain wall density may favor the conformally-miniaturized stress
accommodating (or adaptive) ferroelectric state. In the ZFC condition, the lattice
symmetry of PMN-30%PT is phase R, and X-ray reflections are relatively broad;
whereas in the FC condition, the lattice symmetry is MA, and the reflections considerably
sharper.87 Sharpening of the reflections also occurs in the Mc phase of PMN-35%PT on
field-cooling. Comparisons of these observations with the PFM images indicate that
field-cooling may favor a shorter-scale geometrical patterning of miniature polar domains.
In this case, the reduction in the inhomogeneous line broadening may reflect a relaxation
of the elastic strain energy between miniature domains, which also alters the domain
hierarchy.

- 112 -
4.5 Polarization switching in (001)_oriented PMN-x%PT
Polarization rotation instabilities under field within FEM phases are known, where
rotation occurs against a very small anisotropy.29 Investigations of the induced
polarization (P) have shown significant differences depending upon whether the crystals
are driven under unipolar or bipolar electric field (E): unipolar results in anhysteretic P-E
responses, whereas bipolar results in significant hysteresis.100-101 Clearly, domains play
an important role in polarization switching under bipolar drive.
Polarization switching has been extensively investigated in normal ferroelectric
materials by measuring current transients in response to square wave electrical pulses of
reverse electric field (E).102-109 Early investigations by Mertz revealed a model for
polarization reversal where 2-D nucleation of reversed clusters is restricted to 180o
domain walls,102 and where 1-D growth of reversed step-like domains is restricted to be
coherent in a direction perpendicular to that of E. It is known in finite-size systems that
the Mertz model is inapplicable,110 which has been modified by Scott et al.111 However,
it was not until recently that defects were considered to play a vital role in polarization
switching.112-114 For example, in PMN-x%PT,99,113-114 polarization switching under E has
been understood by heterogeneous nucleation in the vicinity of quenched random fields
that act conjugate to E.
However, direct (in-situ) evidence of polarization switching by heterogeneous
nucleation in the vicinity of random fields has not previously been reported. The purpose
of this investigation was to study the domain evolution of (001)-oriented PMN-20%PT
and PMN-35%PT crystals with changing DC electric bias by SFM in the piezoresponse

- 113 -
mode. The results provide direct evidence of heterogeneous domain nucleation and
growth, where nucleation is not restricted to occur at domain boundaries.
SFM images were again obtained in the piezoresponse mode. During image
scanning, an ac voltage with a frequency of 20 kHz and amplitude between 1 and 10V
was applied between the conductive tip and the bottom gold electrode. During
polarization and/or switching, the ac bias was reduced to zero; and a step-changed dc
bias was superimposed on the bottom electrode to switch the polarization within a small
central portion of the initial image, which was achieved by moving the grounded SFM tip
only over this small area. [Also see reference 115]
Fig.4-22 shows the piezoresponse force images of PMN-20%PT for various
electrical histories. Data are shown in this figure beginning from the initial annealed state,
followed by increasing positive Vdc on the central 2×2µm2 area (left-hand column),
subsequently followed by increasing magnitude of negative Vdc on the central 1×1µm2
area (right-hand column). The sequence of bias changes can be followed by the arrows in
the figure. In the initial annealed condition (center top), polar nano domains (PND) were
observed, somewhat similar to those previously reported by electron microscopy [25,26].
The distribution of PNDs was almost random, although there was evidence of
organization of PND into regular colonies with some spatial correlation. On application
of positive Vdc (left-hand column), the self-organization of the colonies was broken down,
leaving only randomly distributed polar regions of nano-meter size. With increasing Vdc,
the density of the PND was decreased, eventually becoming a single domain state at
Vdc=10V (solid dark area). On subsequent application of negative Vdc (right-hand

- 114 -
column), nano-sized polar nuclei were formed, which were randomly distribution within
the matrix. With increasing Vdc, the density of these nuclei was increased, until a
reversed single domain state (solid bright area) was formed. These results directly show
that polarization switching in (001)-oriented PMN-20%PT crystals occurs by
heterogeneous nucleation, where nuclei creation is not confined in the vicinity of domain
boundaries, but rather can occur throughout the crystal volume.
Fig.4-23 shows the piezoresponse force images of PMN-35%PT for various
electrical histories, presented in a similar manner as that of Fig. 1. In the annealed
condition (center top), long and thin domain striations oriented along {110} were
apparent, which had a somewhat regular spacing. The domain lengths were on the order
of tens of microns, whereas the widths were dramatically less. On application of positive
Vdc to the central 4×4µm2 area (left-hand column), the striations became thinner and less
regular. With increasing Vdc, the striations broke down into isolated PND, eventually
becoming a single domain of the same polarization at Vdc=12V (solid dark area). On
subsequent application of negative Vdc to the central 2×2µm2 area (right-hand column),
polar nuclei of nano-meter size formed, which were randomly distributed. With
increasing Vdc, the nuclei density increased and self-organized into {110} striations,
indicating a stress-accommodated domain growth process. However, the twin boundaries
appeared fuzzy or diffuse, presumably due to the interaction of polarization with charged
point defects. These results indicate that polarization switching initiates by preferential
nucleation near pre-existing twin boundaries; however with increasing Vdc, nucleation
occurs heterogeneously throughout the crystal volume. At higher voltages, a reversed
single domain state (solid light area) was found at Vdc= -9.0V (solid bright area).

- 115 -
Fig.4-22. PFM images for a (001)-oriented PMN-20%PT crystal under various dc electrical
voltages, top center: the initial annealed condition; left-hand column: under positive bias on the
bottom electrode; right-hand column: under negative bias on the bottom electrode.
E=5.0V
E=7.5 V
E=10V E= -2.5V
E= -4.0V
E= -6.0V
E=0 V 1µm
(001) PMN-20%PT

- 116 -
Fig.4-23. PFM images for a (001)-oriented PMN-35%PT crystal under various dc electrical
voltage, top center: the initial annealed condition; left-hand column: under positive bias on the
bottom electrode; right-hand column: under negative bias on the bottom electrode.
E=5.0V
E= -4.2V
E=7.5V
E=12 V
E= -9.0V
E= -5.4V
E=0 V 2µm
(001) PMN-35%PT
- 117 -
Our results are consistent with recent pulsed polarization switching investigations
of PMN-x%PT and PZN-x%PT by current transient methods [20-22]. In these
investigations, polarization switching for PMN-30%PT and PZN-4.5%PT was found to
follow stretched exponential behavior. Following the random-field theory of disordered
magnetic systems,116-117 the results were explained as heterogeneous nucleation of nano-
sized domains in the vicinity of quenched random fields that act conjugate to E.
Accordingly, switching occurs by a mechanism where domain walls become diffuse with
increasing E, due to the creation of polar nuclei heterogeneously throughout the crystal
volume; rather than by the creation of 2-D nuclei of reversed clusters geometrically
restricted to the vicinity of pre-existing 180o walls. Recent investigations by Jullian et
al.114 revealed two long-time transients that followed stretched exponential behavior: one
for t>10-2 sec under moderate E which was dimensionally confined to domain walls
(n=2), and a second for 10-4<t<10-2 sec under higher E which was a volume process (n=3)
that was geometrically unconfined with nucleation preferentially occurring in the vicinity
of defects or random-fields. For lower PT content crystals which are closer to relaxor
systems, our piezoresponse force images directly reveal, that nucleation is a volume
process occurring in the vicinity of quenched random fields; whereas for higher PT
content crystals near the MPB, nucleation is initially geometrically confined to domain
walls (n=2), but with increasing voltage a switchover to a volume process (n=3) occurs
that is unconfined.
In summary, domain switching of (001)-oriented PMN-x%PT has been investigated
by SFM in a piezoresponse force mode under various superimposed DC electrical
voltages. The results provide direct evidence of heterogeneous domain nucleation for

- 118 -
PMN-20%PT, where nucleation is not restricted to occur at domain boundaries. With
increasing PT content to 35%PT, nucleation preferentially initiates near existing twin
boundaries; however, the boundaries become diffuse with increasing Vdc, due to
heterogeneous nucleation and growth throughout the volume.
4.6. Summary
Both bulk phase transformation and local domain structures of PMN-x%PT
(10<x<40) relaxor-type crystals have been investigated by XRD and PFM. Significant
contribution of PNRs to the enhanced electromechanical properties in compositions near
MPB has been found, which can be summarized as followed,
1) The phase transformational sequence of PMN-30%PT crystal is (i)
C T MC MA in the FC condition; and (ii) R MA MC T with increasing E
at constant temperature starting from a ZFC condition. Thus the MPB range can
be enlarged by apply E-field along [001] direction. MA is the dominant phase at
room temperature, whereas MC phase becomes stable above 350K.
2) Inhomogeneities of PNR exist in a wide range for 10<x<40 in PMN-x%PT. With
increasing PT concentration, they first grow into PNDs with R phase symmetry
that can be resolved by XRD or neutron scattering; then self assemble into micron
domains with <110> preferred orientation (R or M symmetry) by stress-
accommodation. With increment of the c/a ratio, the M domains further assemble
into <100> macro plates (T symmetry). Since full stress accommodation and
complete polarization compensation can not be achieved on one length scale due

- 119 -
to the existence of random fields, a domain hierarchy is developed on various
length scales ranging from nanometer to millimeter.
3) The existence of a domain hierarchy down to the nm scale fulfills the requirement
of low domain wall energy, which is necessary for polarization rotation. Thus,
upon applying an E-field along <001> direction(s) in a composition near the MPB,
low symmetry phase transitions can easily be induced, by altering the orientation
and distribution of PNDs. For compositions with T symmetry, applying an E-field
only assists sidewise growth of large domains along the direction of E-field and
shrink of others.
4) Finally, polarization switching is also controlled by the density of PNRs (or
PNDs) and their degree of stress accommodation. For PMN-20%PT with a high
density of PNDs and weak stress accommodation, heterogeneous domain
nucleation was favored, which was not restricted to occur at domain boundaries.
However, for PMN-35%PT with a low density of PNDs and strong stress
accommodation, domain nucleation is tuned by applied E-fields: nucleation
preferentially initiates near existing twin boundaries; however, the boundaries
become diffuse with increasings E-field, due to heterogeneous nucleation and
growth of domains.
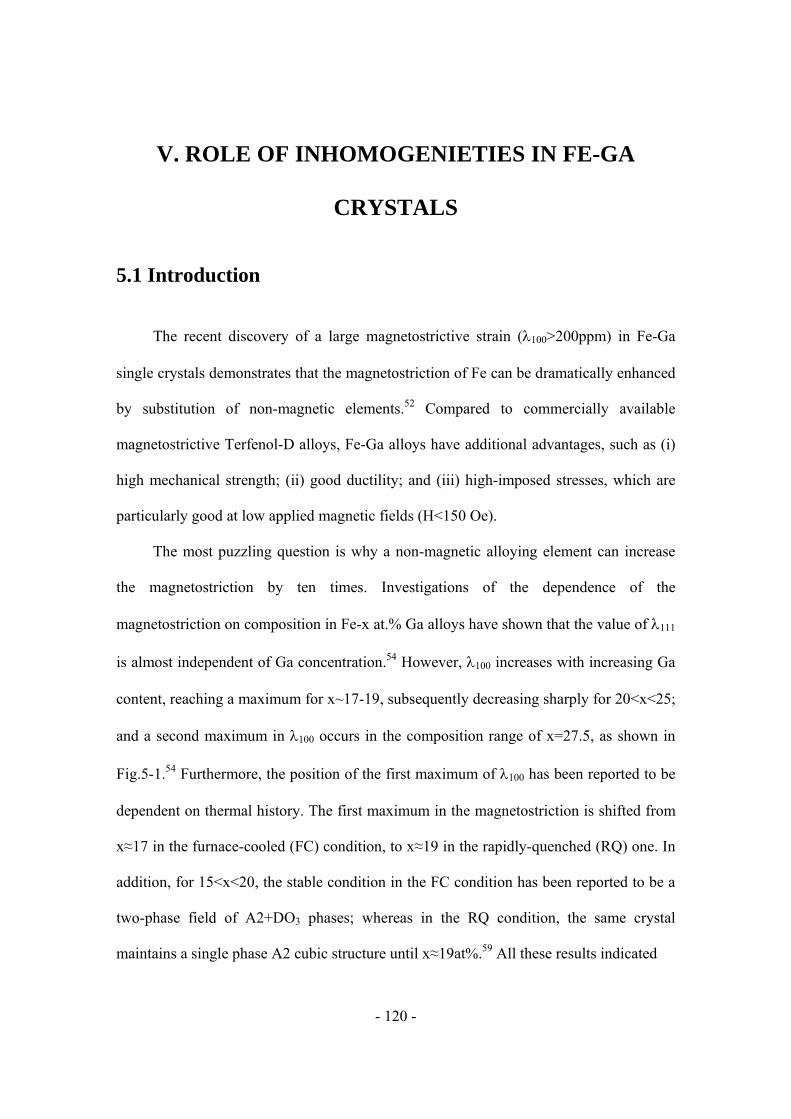
- 120 -
V. ROLE OF INHOMOGENIETIES IN FE-GA
CRYSTALS
5.1 Introduction
The recent discovery of a large magnetostrictive strain (λ100>200ppm) in Fe-Ga
single crystals demonstrates that the magnetostriction of Fe can be dramatically enhanced
by substitution of non-magnetic elements.52 Compared to commercially available
magnetostrictive Terfenol-D alloys, Fe-Ga alloys have additional advantages, such as (i)
high mechanical strength; (ii) good ductility; and (iii) high-imposed stresses, which are
particularly good at low applied magnetic fields (H<150 Oe).
The most puzzling question is why a non-magnetic alloying element can increase
the magnetostriction by ten times. Investigations of the dependence of the
magnetostriction on composition in Fe-x at.% Ga alloys have shown that the value of λ111
is almost independent of Ga concentration.54 However, λ100 increases with increasing Ga
content, reaching a maximum for x~17-19, subsequently decreasing sharply for 20<x<25;
and a second maximum in λ100 occurs in the composition range of x=27.5, as shown in
Fig.5-1.54 Furthermore, the position of the first maximum of λ100 has been reported to be
dependent on thermal history. The first maximum in the magnetostriction is shifted from
x≈17 in the furnace-cooled (FC) condition, to x≈19 in the rapidly-quenched (RQ) one. In
addition, for 15<x<20, the stable condition in the FC condition has been reported to be a
two-phase field of A2+DO3 phases; whereas in the RQ condition, the same crystal
maintains a single phase A2 cubic structure until x≈19at%.59 All these results indicated

- 121 -
Fig.5-1. (3/2)λ100 as a function of Ga concentration for furnace cooled, quenched and
directionally solidified Fe100-xGax. (Ref.54).
■ Furnace Cooled ● Quenched ▲ Directionally Solidified (unannealed)
Fe100-xGax

- 122 -
that the large magnetostriction in Fe-Ga alloys might be related to clusters of short-range
Ga pairs along <100> crystallographic orientation(s), which act as both magnetic and
magnetoelastic defects. In other words, Ga-pairs induced low-symmetry distortion may
increase the magnetoelastic coefficient, and soften the elastic modulus along <100>
direction, as reported by Clark et al.54 In addition, Ab-initio calculations have also
indicated that the tetragonal structure – induced by short-range ordering of Ga atoms – is
important to enhanced magnetostriction.60
However, structural studies of the distortions induced by short-range clusters of Ga-
pairs have yet to be provided. Previous XRD studies of FC Fe-19 at.% Ga have revealed
a cubic structure with notable transverse line broadening in (001) mesh scans, indicating
a short lateral correlation length.118 In addition, XRD analysis in the quenched Fe-19
at.%Ga crystal has shown an unexpected peak in the (100) and (111) line scans, which
was not consistent with either a disordered bcc or a long-range ordered DO3 structure.59
An alternative arrangement of Ga atoms in the unit cell was then suggested: the so-called
modified DO3 phase with a body-centered tetragonal structure, having lattice parameters
of at=bt=4.1Å and ct=2.9Å.59 However, since X-rays have only a very limited penetration
depth of 3~5µm in Fe-Ga alloy, the obtained results may be affected by surface quality or
residual stress. Thus it is necessary to perform neutron scattering in order to probe the
bulk structural information of the crystals.
Furthermore, measurements of the magnetic anisotropy have found that K2 is equal
to -9K1/4 over a wide composition range from 5 to 20 at.%Ga.119 The same type of
magnetization versus field behavior has been observed in magnetic shape memory alloys,
such as NiMnGa or NiFeGa,120 over a range of temperature above the cubic to tetragonal

- 123 -
transition. In addition, NiMnGa alloys also show a very soft tetragonal shear modulus,
similar with Fe-Ga alloys. It has been reported that an intermediate low-symmetry phase
was produced above the martensitic transformation (MT) temperature (Tm), which is
known as the precursor effect of the MT. Magnetic domain structure studies in
Ni51Fe22Ga27 alloys have also provided important evidence of such precursor patterns
above Tm.121-122 It was hypothesized that a similar structure may occur in Fe-Ga alloys.
However, to date, investigations of the magnetic domain structure of Fe-x at.% Ga
crystals have not been reported. We believe that such studies could provide important
information concerning the origins of the enhanced magnetostriction, and why the
maximum in λ100 is dependent on thermal history.
In the following sections, I will present a combination structural investigation of
Fe-x at.% Ga crystals for x=12, 20 and 25 by neutron scattering and magnetic force
microscopy (MFM). My intention is to establish (i) the bulk lattice structure of Fe-x at.%
Ga to verify if there is any evidence of the local structural distortions; (ii)the dependence
of the magnetic domain structure on Ga concentration, determining if there are magnetic
domain inhomogenieties; (iii) the relationship between the magnetic domain structures
and their thermal history, resolving why the maximum magnetostriciton shifts with
thermal history; and (iv) the evolution of the domain configuration during domain
rotation under a step-increased magnetic bias.

- 124 -
5.2 Structural investigations by neutron diffraction
The neutron scattering experiments were again performed on the BT9 triple-axis
spectrometer located at the NIST Center for Neutron Research. Measurements were made
using a fixed incident neutron energy Ei=13.7 meV, obtained from the (002) reflection of
a PG monochromator, and horizontal beam collimations of 15’-46’-10’-20’. We exploited
the PG (004) analyzer to achieve a fine q-resolution of 0.0104 Å-1. At 300K, the pseudo-
cubic lattice constant of Fe-20 at.% Ga is 2.903 Å, corresponding to the reciprocal lattice
unit (or l rlu) is a*=2π/a=2.164 Å-1. All mesh scans shown in this study were plotted in
reference to this reciprocal unit.
Fe-12 at. %Ga
Fig.5-2 shows neutron mesh scans of Fe-12 at.% Ga taken in the (H0L) zone (a) the
(002); and (b) the (200) mesh scan. Comparisons of the results from these two zones
show that the crystal growth direction is not a significant influence. Our mesh scans
exhibit at least four satellite peaks along the transverse direction, qualitatively similar to
that found by XRD (not shown here). Clearly, the transverse splitting is a bulk
phenomenon, and not confined to the outer-layer regions of the crystal.
Fig.5-3 shows the (200) and (002) line scans of Fe-12 at.% Ga taken in the (H0L)
zone. A single 2θ peak was found in both scans by Gaussian peak fit. A typical value for
FWHM was 0.0052 r.l.u. However, there is clear difference between the peak center
positions: for the (200) peak, the d-spacing was 2.888 Å; whereas for the (002) peak, the
d-spacing was 2.901 Å. Although the resolution of current triple-axis neutron scattering is
about 0.0048 r.l.u., these results may indicate the presence of a tetragonal-like distortion.

- 125 -
Fig.5-2. (a) (002) and (b) (200) mesh scans of Fe-12 at.%Ga alloy in the (H0L) zone, where Qx
corresponds to (H, 0, 0) and Qz corresponds to (0, 0, L).
Fe-12 at.% Ga

- 126 -
1.98 1.99 2.00 2.01 2.02
0
500
1000
1500
2000
2500
3000
3500
4000
Fe-12%Ga_002
Cou
nts p
er se
c
Qz
1.98 1.99 2.00 2.01 2.02
0
500
1000
1500
2000Fe-12%Ga_200
Cou
nts p
er se
c
Qx
Fig.5-3. (a) (002) and (b) (200) line scans of Fe-12 at.%Ga alloy in the (H0L) zone, where Qx
corresponds to (H, 0, 0) and Qz corresponds to (0, 0, L).
Center=2.889 Ǻ FWHM=0.0051
Center=2.891 Ǻ FWHM=0.0053

- 127 -
Fe-20 at.% Ga
Fig.5-4 shows neutron mesh scans of Fe-20 at.% Ga taken in the (H0L) zone, (a)
the (002) mesh scan; and (b) the (200) mesh scan. Similar peak splitting along the
transverse direction has been found. There are clear two differences compared with the
corresponding mesh scans of 12 at.% Ga, which are (i) the number of satellite peaks
decreases to three, which may indicate an improvement of the crystal homogeneity; and
(ii) the 2θ peak along the longitudinal direction is very broad, extending from
approximately 1.99≤L≤2.01.
We then performed (200) and (002) line scans with a finer step size, as shown in
Fig.5-5. Gaussian fits revealed a single broad peak for both line scans, with a typical
FWHM about 0.008 r.l.u., and a lattice parameter of a=2.904 Å. According to the phase
diagram, Fe-20 at.% Ga is located within the A2+DO3 two phase region, where the
volume fraction of each phase depends on the thermal history of the crystal. If the phase
fractions are not equivalent, the 2θ peak will be asymmetric. Accordingly, we tried to fit
the line profiles with two Gaussian peaks, but obtained a fitting with a higher error than
that by a single peak. In addition, a typical FWHM of ~0.006 r.l.u. was obtained, larger
than that of Fe-12at.%Ga. We then repeated these experiments using a Ge (004) analyzer
with a much better resolution of 0.0012 Å-1: again, a similar broad peak was observed.
Since the structures of A2 and DO3 are very similar, precipitation of DO3 nuclei within
the A2 matrix could lead to fine-scale microstructure in which it is difficult to distinguish
one phase from another. Thus, we conclude that Fe-20at.% Ga has a pseudo-cubic
structure, i. e. an averaged-cubic structure; however, this does not exclude the possibility
of an intimate mixture over a length scale smaller than that of neutron beam coherence.

- 128 -
Fig.5-4. (a) (002) and (b) (200) mesh scans of Fe-20 at.%Ga alloy in the (H0L) zone, where Qx
corresponds to (H, 0, 0) and Qz corresponds to (0, 0, L).
Fe-20 at.% Ga

- 129 -
1.98 1.99 2.00 2.01 2.02
0
500
1000
1500
2000
2500
3000
Fe-20%Ga_002
Coun
ts pe
r sec
Qz
1.98 1.99 2.00 2.01 2.02
0
500
1000
1500
2000
Fe-20%Ga_200
Cou
nts p
er se
c
Qx
Fig.5-5. (a) (002) and (b) (200) line scans of Fe-20 at.%Ga alloy in the (H0L) zone, where Qx
corresponds to (H, 0, 0) and Qz corresponds to (0, 0, L). Red lines were fitted by single Gaussian
curve; green lines were fitted by two Gaussian curves.
a=2.902 Ǻ FWHM=0.0063c=2.909 Ǻ FWHM=0.0063
a=2.901 Ǻ FWHM=0.0054c=2.908 Ǻ FWHM=0.0062
Center=2.904 ǺFWHM=0.0080
Center=2.904Ǻ FWHM=0.0078

- 130 -
Fe-25 at.% Ga
Fig.5-6 shows neutron mesh scans of Fe-25 at.% Ga taken in the (H0L) zone, (a)
the (002) mesh scan; and (b) the (200) mesh scan. Only two satellite peaks along
transverse direction were found, which may indicate further improvement in crystal
homogeneity. Fig.5-7 shows the (200) and (002) line scans of Fe-25 at.%Ga taken in the
(H0L) zone. A sharp single peak was found by Gaussian peak fit in both scans. A typical
value of FWHM was 0.0044 r.l.u. And analysis of the peak center positions of (200) and
(002) line scans yielded an identical lattice parameter of a=2.901 Å.
Discussion and summary
The mesh scan results demonstrate the presence of regions that are slightly tilted
with respect to each other. In each case, the angle of rotation about the transverse
direction was quite small (<0.5o). We found that it was possible to distinguish between A2
(x=12), intermediate bridging (x=20), and DO3 (x=25) phase regions by the type of
splitting along the transverse direction. A 4-fold splitting was found for A2; a 3-fold for
the intermediate region; and a 2-fold for DO3. All satellite peaks have a similar transverse
FWHM of ~0.0078 r.l.u. We believe that the tilting of {001} planes results in a texture
pattern that one might loosely say in colloquial-terms resembles a “quilt” – in that it
consists of slightly different pieces that have all been stitched together nice and snug, not
perfectly, but with some (crystallographic) character. The texture pattern then changes
with x, being notable different in the various phase regions of the crystalline solution. We
note that changes in structural texture may influence magnetic domain size and regularity,

- 131 -
Fig.5-6. (a) (002) and (b) (200) mesh scans of Fe-25 at.%Ga alloy in the (H0L) zone, where Qx
corresponds to (H, 0, 0) and Qz corresponds to (0, 0, L).
Fe-25 at.% Ga

- 132 -
1.98 1.99 2.00 2.01 2.02
0
200
400
600
800
1000
1200Fe-25%Ga_002
Coun
ts pe
r sec
Qz
1.98 1.99 2.00 2.01 2.02
0
500
1000
1500
2000
2500
3000
3500Fe-25%Ga_200
Cou
nts p
er se
c
Qx
Fig.5-7. (a) (002) and (b) (200) line scans of Fe-25 at.%Ga alloy in the (H0L) zone, where Qx
corresponds to (H, 0, 0) and Qz corresponds to (0, 0, L).
Center=2.901 Ǻ FWHM=0.0042
Center=2.901 Ǻ FWHM=0.0045

- 133 -
as will be shown in Section 5.3: in the A2 phase, macrodomain plates with a strong {001}
preferred orientation have been observed by MFM; whereas for DO3, only miniature
domains with much reduced preferred orientation were found.
Furthermore, our results have clearly shown a 2θ peak broadening sequence of 20
at.% Ga>12 at.% Ga>25 at.% Ga. Normally, the lattice structure determined by XRD or
neutron scattering is the same as the local structure in a single crystal. However, in
systems consisting of inhomogeneous entities, whose size is less than or close to the
coherence length of X-rays or neutron beams, the diffraction pattern may reflect an
averaged lattice structure, rather than the crystal lattice of individual parent phase or
inhomogeneity. This is similar with what we have discussed in ferroelectric relaxors with
PNRs. According to phase diagram, Fe-12 at.%Ga has a disordered A2 phase, Fe-20 at.%
Ga has A2+DO3 phase and Fe-25 at.% Ga has a pure DO3 phase. However, there is
actually no clear phase boundary between the A2 and DO3 phases, which is strongly
dependent on the thermal history of the crystals. Local DO3 or modified-DO3 clusters
(Ga-pairs) may coexist with the A2 phase over a wide composition range, contributing to
the broadening of the 2θ peak. Accordingly, Fe-20 at.% Ga has a broader peak due to the
increase of Ga concentration and degree of fine-scale local inhomogeneities. However,
Fe-25 at.% Ga is generally regarded as a pure long-range ordered DO3 phase, so the 2θ
peak is very sharp. According, the change of peak broadness with Ga concentration is
consistent with the change of magnetostriction predicted according to Ga-pairs model.
Finally, it might be helpful to clarify the difference between “Ga-pairs” and “pre-
martenstic” (PM) phenomena in the literature. Premartensite is found above the

- 134 -
martensitic transition temperature in either Ni-Al or Heusler-type NiMnGa alloys: it has a
clear low/reduced symmetry structure, monoclinic or orthorhombic, compared to either
the parent austenite (cubic) or fully formed martensite (tetragonal) phase.40,123 In these
regards, PM is an intermediate phase. Khachaturyan et al. has thus developed an adaptive
theory for these particular low-symmetry intermediate phases,42 which I designate as PMI.
(also see Section 1.2.4) According to this theory, Tm is actually above the temperature
where PMI appears. In the PMI state, tetragonal domains are conformally miniaturized,
and geometrically arranged to achieve particular invariant conditions that minimize the
elastic energy. However, following Kartha,41 there is another “glassy” PM state (I
designate here as PMII), where tetragonal clusters exist within a austenite (parent) matrix.
In this case, the elastic compatibility between neighboring domains is not necessary to
achieve. This is consistent with previous elastic neutron scattering investigation of
Ni2MnGa,123 in which a diffuse quasi-elastic peak was found in the same peak position of
PMI during cooling, however, at a temperature above TM. Accordingly, with regards to
Fe-Ga alloys, my results reveal similarities to PMII for compositions close to A2-DO3
boundary: fine-scale structural inhomogeneities (i.e., local tetragonal distortion) results in
diffuse scattering, but do not geometrically arrange into colonies to achieve elastic
accommodation.
In summary, our experiments reveal (i) a tetragonal-like distortion for x=12, (ii) a
single broad pseudo-cubic peak for x=20, which may be caused by local inhomogenities
of Ga-pairs; and (iii) a splitting transverse to the (002), revealing a structural domain
texture in which domains are slightly tilted with respect to each other, and whose pattern
changes with x.

- 135 -
5.3 Magnetic domain structures of Fe-x at.% Ga
5.3.1 MFM Images
Fig.5-8(a) and (c) shows the domain structures of furnace-cooled (FC) Fe-12 at.%
Ga. To better illustrate the overall domain morphology and local domain features, images
with different scan scales are shown. It should be noted that there are some magnetic
defect lines on the MFM images due to physical scratches, however, these scratches are
homogenous in topography (not show here) and thus have little influence on our domain
alignment analysis. In the region designated by the symbol A in Part (c) of this figure, the
magnetic domains can be seen on average to be aligned along the [100] direction. The
domain width is ~0.5µm, and its length ≥10µm. However, we did find regions in which
the domain alignment was disrupted, and a typical magnetic closure pattern was
established, as designated by the symbol B. According to Lord, when the domain
configuration is terminated by a surface defect, the demagnetization or magnetostatic
energy will in general attempt to reduce the volume of any domain having a
magnetization normal to the surface, and thus generates closure domain patterns. Domain
structures of Fe-12 at.% Ga in the post-annealed (PA) condition are shown in Figs.5-1(b)
and (d), again images with different scan scales are shown. A similar domain structure
was found; except that the domains were much wider, and also had a higher degree of
[100] alignment. These slight differences in domain structures between the FC and PA
conditions may reflect corresponding variations in the magnetostriction with thermal
history that was previously reported.54

- 136 -
Fig.5-8. MFM images of the (001) surface of Fe-12 at.% Ga at furnace cooled condition, (a) and
(c); and after being post-annealed, (b) and (d). Region A shows an area populated by domains
preferentially aligning along [100] direction and region B shows broken domains and magnetic
closure patterns.
(d)
2µm
10µm
(a) 100
010
10µm
(b)
Fe-12 at.% Ga Furnace-cooled Post-annealed
(c)
2µm
A
B
100
010

- 137 -
Fig.5-9 shows MFM images of the domain structure of Fe-20 at.% Ga. Part (a) and
(c) show the domain structure in the FC state. In Part (a), small domains of micron-size or
below can be seen to be arranged within [001]-oriented domain platelets of 5-10 µm
width and 30-50µm length. Part (c) shows an image with a higher resolution of
10x10µm2, which better illustrates the features of the finer domains. These domains can
be seen to be much smaller in size and much less regular than the corresponding ones for
Fe-12 at.% Ga, as can be seen by comparing Fig.5-8(c) and Fig.5-9(c). The fine scale
domains of FC Fe-20 at. %Ga were ~0.4µm in width and <2µm in length. These fine
scale domains, or sub-domains, tended to have some [010] preferential orientation;
however, (i) the domain walls were often bent or rough, (ii) there was considerable
bending between [010] and [100] variants, and (iii) there were domain regions not
restricted to this crystallographic direction. Part (b) and (d) show the domain structure in
the PA state. The image in Part (b) shows the presence of [001]-oriented domain platelets
of 5-10µm width and 30-50µm length that have a finer internal domain structure – in
these two regards, the results from the FC and PA conditions are similar. However, there
was a significant difference between these two conditions, with regards to the
morphology and distribution of the fine domain structure within the platelets. Part (d)
shows a higher resolution image taken from an area of 10 µm2. This image illustrates that
the sub-domains organize into dendrite morphology.

- 138 -
Fig.5-9. MFM images of the (001) surface of Fe-20 at.% Ga at furnace cooled condition, (a) and
(c); and after being post-annealed, (b) and (d).
(a)
10µm
(c)
2µm
100
010
(d)
2µm
(b)
10µm
100
010
Fe-20 at.% Ga Furnace-cooled Post-annealed

- 139 -
Finally, the magnetic domain structures of Fe-25 at.% Ga are shown in Fig.5-10:
Part(a) in the FC condition, and Part (b) in the PA conditions. Similar domain structures
were found for both conditions. Macrodomain platelets were not found, rather the only
observable feature in the MFM images was the finer sub-domains. A typical length and
width of these sub-domains was <1µm and <0.2µm, respectively. The fine domains have
somewhat preferred alignment along [010] direction, but notably less than that for lower
Ga-content crystals. These results indicate that the DO3 phase is fully formed for Fe-25
at.% Ga. This was confirmed by XRD, and is consistent with prior results which have
reported the boundary between the two phase (A2+DO3) and DO3 phase fields at about
x=23 at.% Ga.57

- 140 -
Fig.5-10. MFM images of the (001) surface of Fe-25 at.% Ga in the furnace-cooled state, (a) and
after being post-annealed, (b), to show similar domain structures less preferentially aligned along
[010].
(b)
2µm
(a)
2µm
100
010
Fe-25 at.% GaFurnace-cooled Post-annealed
100
010

- 141 -
5.3.2 Fast Fourier Transformations analysis of MFM images
Next, we performed Fast Fourier Transformations (FFT) on the MFM images. This
allowed us to obtain a better measure of domain alignment and features, in both x- and y-
directions. The FFT algorithm separates the original waveform into its constituent parts,
mapping each wavelength on a 2D spectral plot, providing information on (i) domain
alignment - well aligned domains have narrow frequency bands and thus sharp contrast in
FFT images; (ii) domain orientation - the symmetry of the wavelength distribution
reflects domain orientation; and (iii) the value of the wavelength represents the average
width of aligned domains – the shorter wavelengths lie around the periphery of the plot,
whereas the longer wavelengths lie near its center, and the center-most point is labeled as
“DC” (for “direct current”) which corresponds to a size equal to that of the image.
Figs.5-11(a) and (b) show the FFT of the Fe-12 at.% Ga images originally given in
Figs.5-8(a) and (b), which are FC and PA states respectively. A two-fold symmetry along
the x-axis ([100] direction) can be seen for both images, clearly revealing that the domain
structure has a significant degree of [100] preferred alignment, i.e., 180o oriented along
[100]. In the FC condition, relative to the PA, we noticed (i) two additional peaks with
notably weaker intensities that were slightly rotated away from the [010], indicating 90o
domains that are slightly tilted presumably to relax the elastic energy; and (ii) that the
intensity had a diffuse halo, with a relatively broad distribution of radii, indicating
significant domain size non-uniformity. The wavelengths were then determined to be
1.7<λx<4µm and 0.6<λy<0.9µm for the FC state, and λx=DC and λy≈1.4µm for the PA
state. These results clearly show that post-annealing increases the domain size and its
regularity.

- 142 -
Figs.5-11(c) and (d) show the FFT result of Fe-20 at.% Ga in the FC and PA states,
originally shown in Figs.5-9(a) and (b) respectively. Similar to 12 at.% Ga, a two-fold
symmetry was also found for Fe-20 at.% Ga, which was strictly aligned along [010]. The
average wavelengths were λx≈10 and λy≈10 µm for the FC state, and λx≈8µm and
λy≈8µm for the PA one – which corresponds to the size of the [100] macrodomain plates
in the MFM image. We then obtained the FFT of the higher resolution MFM images for
Fe-20 at.% Ga (Figs.5-9(c) and (d)), shown in the insets of Figs.5-11(c) and (d)
respectively. These insets show a diffuse halo with peaks close to the [100] and [010]
directions. Post-annealing was found to result in an increase in the diffuseness of the halo,
and an increase in its radii. The FFT of Fe-20 at.% Ga evidences hierarchial domains
organized over different length scales, whose degree of organization and wavelengths are
both decreased by post-annealing.
Figs.5-11(e) and (f) show FFTs of Fe-25 at.% Ga in the FC and PA states,
respectively. [Please note the different frequency scales.] The signature feature of the
FFT for Fe-25 at.% Ga crystals was a broad and diffuse halo, with 0.3<λR<0.5µm
( 22yxR λλλ += ). The results indicate a lack of organization of the miniature domains
into a crystallographically regular pattern; although, weak intensity peaks indicate some
residual domain alignment along [010].

- 143 -
Fig.5-11. FFM images of (001) surface of Fe-12 at.% Ga, (a) and (b); Fe-20 at.% Ga, (c) and (d);
and Fe-25 at.% Ga in the furnace-cooled and post-annealed state, respectively. The insets are the
FFT images corresponding to Figure 3 (c) and (d) with fine domain structure to show domain
hierarchy in different scales. Both of the insets have a frequency scale from 20 µm-1 to DC.
Furnace-cooled Post-annealed
DC DC20 20 20
π/λx (µm-1) 20
20
DC
20
5
DC
5
5
DC
5
FFT, Fe-x at.% Ga
π/λ
y (µm
-1)
DC DC 5 5 5 5
100
010
(c) 20%Ga (d)
12%Ga (b)100
010
(a)
100
010
(e) 25%Ga (f)

- 144 -
5.3.3 Discussion and Summary
Thermal history dependent magnetostriction
The observation of sub-domains with a dendritic morphology in Fig.5-9 is
indicative of a phase change, possibly due to the DO3 structure as previously reported.57
According to the phase diagram in Fig.3-2, the phase boundary of A2+DO3 and DO3 is
located at x~22.5at%Ga. Recent work by Clark et al. has shown that slowing cooling
favors precipitation of the DO3 phase.54 Thus, it is reasonable to conjecture that the
dendrite contrast in the MFM image may arise due to an intimate two phase mixture of
DO3 and A2 phases, which have magnetization differences. The self-organization of the
dendrites into [100] oriented macrodomain plates indicates that these two phases maintain
a degree of mutual adaptivity with respect to each other on cooling below the Curie
temperature into their magnetostrictive states. Decomposition may affect the local
magnetization contrast, but does not prevent elastic accommodation on a longer length
scale that results in conventional macordomain plates.
We also carried out structure analysis to investigate the effect of annealing. Fig.5-
12(a) shows the lattice parameters of Fe-20 at.%Ga crystals with different thermal
histories. A clear peak position shift and phase separation process can be seen from FC
state to the PA conditions. Fig.5-12(b) shows the (200) line scans of Fe-x at.%Ga. It can
be seen that the lattice parameter increases with increasing the Ga concentration. This is
consistent with previous XRD studies.124 Comparison of Fig.5-12 (a) and (b) revealed
that the peak center position of Fe-20 at.% Ga has a lower 2θ value than that of Fe-
25at.%Ga, which has also been confirmed by neutron scattering, as shown in Section 5.2.

- 145 -
63.4 63.6 63.8 64.0 64.2 64.4 64.60
5000
10000
15000
20000
25000
Post annealed
Fe-20%Ga, (002)In
tens
ity (C
PS)
2θ (degree)
Furnace cooled
63.9 64.0 64.1 64.2 64.3 64.4 64.5 64.6
0
20000
40000
60000
80000
100000
120000
140000
160000
180000
19.8% Ga
12.3% Ga
24.8% Ga
(001)_oriented Fe-x%Ga crystal
Inte
nsity
(cps
)
2θ (degree)
Fig.5-12. X-ray diffraction line scans taken along the (002) zone for (a) Fe-20at%Ga in the
furnace-cooled and post-annealed conditions; and (b) various (001)-oriented Fe-x%Ga crystal in
the as-grown condition for 12<x<25.

- 146 -
Accordingly, it can be inferred that the post annealing shifts the lattice parameter of
20at.%Ga in a similar manner to that of a crystal with a higher Ga concentration.
One remaining question of the thermal history influence on the magnetostriction of
Fe-x at.%Ga near A2 and DO3 phase boundary is whether the number of Ga-pairs is
dependent on cooling rate or not. The question is very important since we might further
enhance magnetostriction by increasing the number of Ga-pairs along the <100>
directions. The comparison of furnace-cooled and fast quenched from 800oC (>Tc) Fe-x
at.%Ga mentioned earlier has evidenced an enhanced magnetostriction for 17<x<19.54
However, it is well known that fast cooling favors complete disordering instead of Ga-
pairs along the special <100> directions. Thus, only those pairs along <100> directions
existing prior to cooling can undergo para- to ferro-magnetic transformation and persist
down to room temperature. Consequently, increasing the cooling rate only helps to (i)
stabilize disordered A2 phase to high Ga concentration in phase diagram; and (ii) increase
the number of Ga-pairs due to the increase of total Ga concentration, both of which are
important for large magnetostriction. However, raising the cooling rate can not increase
the number of Ga-pairs for a constant composition. This is why no enhancement was
observed for 5<x<17 composition.54
Magnetic domain inhomogeneities
The results of our investigation demonstrate with increasing x that (i) the typical
domain size is decreased; (ii) the domain morphology becomes increasingly irregular;
and (iii) the degree of [100] preferential orientation is reduced. These results clearly show
increasing domain inhomogeneity with increasing Ga content. The enhancement of λ100

- 147 -
with increasing x below 19 (see Fig.5-1) has previously been attributed to the emergence
of directional short-range ordering of Ga pairs.58 However, our MFM results indicate that
domain non-uniformity may also play a key role in enhanced magnetostriction. This may
be due to an increase in the ease of domain movement – it is much easier to move a
diffuse wall than a sharp one in the presence of quenched disorder.125 Recent
investigations of elastic constants have shown that the value of ½(C11-C12) decreases as
the Ga content is increased in the Fe-x at. % Ga alloys. The combination of these
prior54,58 and our present results indicate that metastable pre-martensitic states may be
trapped by quenched disorder, as predicted by earlier theories of Kartha et. al.41
The fact that the magnetic domains in Fe-12 at.% Ga had a strong degree of
preferred [100] orientation on the (001) plane, instead of [100] and [010] closure domains,
indicates an intrinsic deviation from a conventional BCC structure in the A2 phase. This
crystallographic restriction is not unique to tetragonal structures, but rather can also be
found in lower symmetry orthorhombic and monoclinic domain variants, which have in-
equivalent c- and a-axes. As mentioned in Section 5.1, previous XRD studies of
quenched Fe-19 at.% Ga crystals have shown that (i) the c-axis of the tetragonal
distortion lies parallel to the direction of Ga-pairing;59 and (ii) an elongation of the
diffraction peak (i.e., peak broadening) along the [101] direction in mesh scans,
indicative of orthorhombic or lower symmetry structural modulations.113 These prior
XRD results that indicate distortions from a conventional tetragonal domain variant are
consistent with our observation of decreasing domain regularity with increasing x. It
implies a hetero-phase region over a relatively large phase field, where the characteristic
length-scale of the DO3 phase depends on Ga-content and thermal history.

- 148 -
In summary, the domain structure of furnace-cooled and post-annealed Fe-x at.% Ga
crystals have been investigated by magnetic force microscopy for 12<x<25. Our results
indicate the importance of quenched disorder on a domain hierarchy. With increasing x,
we have observed a decrease in (i) the typical size of the magnetic domains within macro-
domain platelets, and a disappearance of the platelets in the DO3 phase field; (ii) the
degree of domain regularity; and (iii) the degree of [100] preferred orientation. Our
results indicate enhanced magnetostriction for crystals with miniaturized domains that
retain good [100] preferred orientation. In addition, post annealing with slow cooling rate
tends to favor the separation of DO3 phase and thus equivalently shift the Ga
concentration to a high value. This is the reason that the maximum magnetostriction
shifts in the phase field with changes in thermal history.

- 149 -
5.4 Magnetic domain rotation in Fe-x at.% Ga
In this section, we use MFM to observe the domain rotation upon applying the
magnetic field normal and parallel to the surface of a sample. The domain structures of
Fe-x at.%Ga alloys in the A2+DO3 and DO3 phase range were compared. These results
indicate the increase of density and degree of domain fluctuations with increasing applied
magnetic field, which may be caused by randomly distributed short-range Ga-pairs,
serving as magnetic and magnetoelastic defects.
Fig.5-13 shows the MFM images of Fe-19.5 at.%Ga upon applying a step-increased
magnetic field normal to the surface - Part (a) shows an image of 40×40 µm2, and Part (b)
shows a high resolution image of 10×10 µm2. With increasing magnetic field, two
processes can be seen controlling the magnetic rotation, which are (i) the shrinkage of
domains; and (ii) the increasing number of domain fluctuation, as emphasized by white
circles. The domain width changes from ~300nm to ~200nm upon applying H=400 Oe.
The shrinkage of domain width normal to the applied field direction can be explained by
a classical closure-type domain structure, as shown on the bottom of Fig.5-13(b). Such
domains are generally observed in cubic ferromagnetic crystals with K1>0. Upon
applying the magnetic field, the elongation of closure domain will be confined by the two
main domains, thus results in an increase of the stress and magnetoelastic energy.
Fig.5-14 shows the magnetic domain rotation process upon applying the magnetic
field parallel to the sample surface: left column, image size 40×40 µm2; right column,
high resolution images of 10×10 µm2. Again, the number of magnetic domain
fluctuations was seen to increase with the increase of magnetic field. Since the

- 150 -
Fig.5-13(a). Magnetic domain configuration of Fe-19.5 at.% Ga crystal during magnetization
rotation under magnetic field normal to the (001) surface. Image size 40×40 µm2.
a
10µm
b
10µm
c
10µm
d
10µm
As-grown
H^=1000Oe
H^=400Oe
H^=2600Oe
Fe-19.5%Ga (100)
H

- 151 -
Fig.5-13(b). Magnetic domain configuration of Fe-19.5 at.% Ga crystal during magnetization
rotation under magnetic field normal to the (001) surface. Image size 10×10 µm2. Bottom- the
closure-type domain before and after applying magnetic field.
Fe-19.5%Ga (100)
a
2µm
b
2µm
d
2µm
As-grown H^=400Oe
H^=2600Oe
c
2µm H^=1000Oe
H

- 152 -
Fig.5-14. Magnetic domain configuration of Fe-19.5 at.% Ga crystal during magnetization
rotation under magnetic field parallel to the (001) surface. Left column: Image size 10×10 µm2;
right column: Image size 40×40 µm2.
a
10µm
b
10µm
c
10µm
Fe-19.5%Ga (100), as-grown
a
2µm H//= 0 Oe
b
2µm H//= 400 Oe
c
2µm H//= 800 Oe
H//= 0 Oe
H//= 400 Oe
H//= 800 Oe

- 153 -
demagnetization effect can be neglected in this case, only a low magnetic field is needed
to fully rotate the magnetic domains.
Finally, we performed MFM studies on high Ga concentration of Fe-25 at.% Ga,
where long-range ordering of DO3 structure is fully established. Fig.5-15 shows the
magnetic domain configuration before applying field, Part (a); upon applying step-
increased fields of H=~400 and 800 Oe normal to the surface, Part (b) and (c); and after
removal of magnetic field, Part (d). Regular dot-like domains were seen with typical size
of ~200 nm, and no domain fluctuation was observed upon applying magnetic field. The
domains return to their origin state after removing field.
Domain fluctuation can be caused by defects, a secondary phase, a nonmagnetic
phase, and etc. In the present case of single crystals, one apparent source of magnetic
fluctuation is surface defects. However, the number of these defects should be
independent of external magnetic field. Thus, there must be some other source(s) relating
to magnetic domain fluctuation. Previous studies of NiFeGa domain structures by
Lorentz microcopy have shown two distinct modulations of magnetic flux lines during
cooling from parent cubic phase: (i) modulation of the magnetic flux that subdivides the
original micrometer-sized domains into the scale of 100 nm; and (ii) local fluctuation (of
the order of 10 nm) that may be responsible for the speckles-like features,121-122 as
illustrated in Fig.5-16. These modulations were explained by the precursors of phase
transition, as mentioned in Section 5.1: such features are eliminated when tetragonal
martensite finally forms. Accordinlgy, one could conjecture that another source of
domain fluctuation may be short-range Ga-pairs clusters, i.e. a random-field state.

- 154 -
Although Fe-20 at.% Ga crystal has an anisotropy constant K1 close to zero, locally,
clusters may have a much larger anisotropy constant due to a lower-symmetry structure.
Such low-symmetry distortions, induced by random fields, could serve as magnetic and
magnetoelastic defects, coupling the local magnetic domain with the bulk elastic strain,
and contributing to enhanced magnetostriction.

- 155 -
Fig.5-15 Magnetic domain structures of Fe-25 at.% Ga before applying the field, Part (a); upon
applying step-increased fields of H=~400 and 800 Oe normal to the surface, Part (b) and (c); and
after removal of magnetic field, Part (d).
(001)_oriented Fe-25%Ga
Annealed
a
500nm
Removed
d
500nm
H=400Oe
b
500nm
H=800Oe
c
500nm
100
010

- 156 -
Fig.5-16. Change in the reconstructed phase images with cooling in a Ni51Fe22Ga27 alloy heat-
treated at 1473 K. The images were obtained for a same area. Black lines represent the lines of
magnetic flux projected along the incident electron beam. Arrows indicate the direction of
magnetic flux. [Ref.121]

- 157 -
5.5 Summary
The magnetic domain configurations and crystal lattice structures of Fe-x at.%Ga
(x=12, 20 and 25) alloys have been studied by neutron scattering and magnetic force
microscopy, respectively. My results can be summarized, as follows:
1) Existence of short-range ordering has been observed by neutron scattering.
Compared to the sharp 2θ peak of Fe-25 at.% Ga that has a long-range ordered
DO3 structure, a notably broad peak was found in Fe-20 at.% Ga, near the
A2/A2+DO3 phase boundary.
2) The magnetic domains in Fe-12 at.% Ga and Fe-20 at.% Ga have a strong degree
of preferred [100] orientation on the (001) plane; however, no domain alignment
was found in Fe-25 at.%Ga with DO3 structure. This clearly indicates a deviation
from cubic symmetry.
3) A domain hierarchy was found in both furnace cooled and post-annealed Fe-20
at.% Ga crystals with miniaturized domains affected by thermal history. This is
the domain structure predicted by the frustration of the magnetization by
randomly distributed nano-clusters, having compositional and structural
heterogeneities.
4) Post annealing using a slow cooling rate tends to favor the precipitation of the
DO3 phase, and thus effectively shifts the A2-DO3 phase boundary to a lower Ga
concentration. This is the reason that the maximum magnetostriction shifts in the
phase field with changes in thermal history.

- 158 -
5) An increasing degree of domain fluctuations was founding during magnetization
rotation, which may be related to short-range Ga-pairing clusters with larger local
anisotropy energy, serving as magnetic and magnetoelastic defects.

- 159 -
VI. CONCLUSION AND FUTURE WORK
6.1 Conclusion
In this dissertation, I have performed systematic lattice structure, phase
transformation and domain configuration studies of two multiferroic crystals,
Pb(Mg1/3Nb2/3)O3-PbTiO3 (PMN-PT) and Fe-Ga single crystals, both of which either
have large electromechanical or magnetomechanical properties.
It was found that polar nano regions (PNRs) have a significant contribution to the
enhanced electromechanical properties of PMN-x%PT crystals by assisting low-
symmetry intermediate phase transformation. With increasing PT concentration, PNRs
first grow into polar nano domains (PNDs) with rhombohedral (R) phase symmetry; then
self assemble into micron-sized domains that have <110> preferred orientation. With
incremental changes in the c/a ratio, the micro-domains further assemble into <100>
macro plates of T symmetry. For compositions near MPB, a domain hierarchy was also
observed on various length scales ranging from nanometer to millimeter. The existence of
a domain hierarchy down to the nm scale fulfills the requirement of low domain wall
energy, which is necessary for polarization rotation. Thus, upon applying an E-field along
the <001> direction(s) in a composition near the MPB, low symmetry phase transitions
(monoclinic or orthorhombic) are readily induced, via altering the orientation and
distribution of PNDs. Detailed investigations revealed that the phase transition sequence
of these intermediate phases was strongly dependent on electrical and thermal histories. A
complete E-T diagram of PMN-30%PT has been established.

- 160 -
With regards to Fe-x at.% Ga alloys, short-range Ga-pairings have been shown to
serve as both magnetic and magnetoelastic defects, coupling the local magnetic domain to
the average elastic strain of the crystals, resulting in enhanced magnetostriction. Evidence
of such inhomogeneities has been found by neutron scattering, as evidenced by a 2θ peak
broadening near the A2-DO3 phase boundary. Secondly, MFM images revealed magnetic
domains on the nano meter scale, i.e. short-range Ga-pairing clusters resulting in
magnetic inhomogeneities. Post annealing using a slow cooling rate favors the
precipitation of the DO3 phase, and thus effectively shifts the A2-DO3 phase boundary to
a lower Ga concentration. Accordingly, the maximum magnetostriction shifts in the phase
field with changes in thermal history. Furthermore, an increasing degree of domain
fluctuations was found during magnetization rotation, which may be related to a large
local anisotropy constant of low-symmetry Ga-pairs clusters.
- 161 -
6.2 Recommendations on future work
6.2.1 What is the stable phase of poled PZN-8%PT at a low temperature?
PZN-8%PT has a C T MC phase transition sequence in the FC condition. An
irreversible MA MC transition can be seen during increasing field at constant
temperature. So MC is the dominant phase. This is different from that of PMN-30%PT,
where a reversible MA MC transition was found. Since PMN-30%PT and PZN-8%PT
have almost the same location in their respective phase diagrams, it would be quite
interesting to see whether a reversible MA MC transition occurs at lower temperatures
for PZN-8%PT during field cooling.
According to adaptive phase theory, MA domains consist of a state of miniaturized
R domains; while MC consist of miniaturized T domains. In ZFC condition, a T R phase
transition occurs; while in the FC condition, a reversible MC MA transition is expected,
since poling tends to enlarge the MC and T phase range, but not fully prevent the
transition to occur. Conversely, if the MC phase is stable until very low temperatures, it
may indicate that a true T MC transition occurs at the atomic level: this means that once
the MPB is enlarged by the E-field, it would be stable on cooling to very low
temperatures, even after removal of the E-field.
A systematic neutron scattering study of field cooling down to 300 K plus zero-
field cooling down to 15K would be helpful to answer these questions. Mesh scans in
(H0L) and (HHL) zones should be obtained for comparison.

- 162 -
6.2.2 Can “PNRs” be created by strain engineering?
The existence of PNRs has been explained by compositional, structural or thermal
fluctuations. However, quite different from common defects or inhomogeneities, PNRs
can form long-range ordering under the E-field, which causes all those complicated
domain structures, and contributes to enhanced electromechanical properties. It is well
known that PNRs do not exist in normal ferroelectric materials. However, a good
question to ask is whether is is possible to create PNRs by domain/strain engineering.
Thermodynamic calculations have predicted a T MA R phase transition when
applying a sufficient E//<111> on a normal ferroelectric material. However, up to now, the
intermediate low-symmetry phases have not been reported under such conditions. As
mentioned above, polarization rotation requires very small domain wall energy: for
normal ferroelectrics, this condition is difficult to satisfy.
However, enhancement of both TC and remanent polarization has been reported in
film-on-substrate systems for normal ferroelectrics.126-128 It is believed that the 2D
clamping from the substrate may result in a change of phase sequence and the appearance
of phases forbidden in bulk crystals. Pertsev et al. have suggested a strain-temperature
phase diagram,129 where low-symmetry M or O phase can exist between paraelectric C
and ferroelectric T phases under a critical strain level and over a certain temperature
range. This is so-called “strain engineering”. However, the suggested phase diagrams are
yet to be manifested by structural observation.
Accordingly, it is quite interesting to perform both elastic and inelastic scattering of
normal ferroelectric films (BaTiO3 or PbTiO3) in the suggested intermediate phase range.
Such studies may provide important insights to answer (i) if enhanced polarization comes

- 163 -
from low-symmetry phases, (ii) if strain engineering can create short-range ordering
above the Curie temperature of bulk crystal; and (iii) if there is any similarity between
domain engineering and strain engineering.
6.2.3 Neutron scattering of Fe-Ga crystals under magnetic fields
For magnetic shape memory alloys, growth of c-axis elastic domains occurs upon
application of magnetic field, which contributes to large elastic strain in addition to
magnetostrictive strain. My results have indicated that there are different Ga-pairs along
a- or c-axis with a lower symmetry than cubic. Competition of Ga-pairs along different
crystallographic orientations is at least possible in two neighboring modified-DO3 cells
with 90o angle. However, it is not known whether the size and orientation of Ga-pairs
change during cooling down (scalar) or upon applying magnetic fields (vector). In other
words, it is very interesting to see if there is field-forced ordering in Fe-Ga alloys.
Diffuse neutron scattering is a powerful method that can resolve such nanoscale
inhomogeneities. I presume that comparison of the diffuse scattering patterns in different
zones before and after applying magnetic fields may help to resolve these questions.
Compositions near A2 and DO3 phase boundary should be given special attention.
6.2.4 Magnetic domain structures of Fe-Ga alloys under stress
It is well known that applying compressive stress can pre-align magnetic domains,
and thus increase magnetostriction during domain rotation. However, previous studies of
magnetostriction as a function of the magnetization squared for three compressive stress

- 164 -
levels have shown a nonlinear deviation from theory predictions. Both the domain pre-
alignment process under stress and domain rotation process under magnetic fields remain
unresolved issues. It is generally believed that (i) pre-stress can assist the alignment of
ferroelastic domains; and (ii) as the magnitude of compressive stress is increased,
attainment of equivalent magnetostriction requires larger magnetic field. Both of these
results will facilitate observation of domain rotation process by MFM method.
Accordingly, it might be fruitful to perform MFM studies upon (i) increasing
compressive stress; and (ii) applying step-increased magnetic fields perpendicular to the
direction along which stress is applied.

- 165 -
Reference
1. Shigeyuki Sŏmiya, Advanced Ceramics III, (Elesvier Applied Science, London and
New York), p71
2. V. K. Wadhawan, Introduction to Ferroic Materials, Gordon & Breach, UK, 2000.
3. E. K. H. Salje, Phase transitions in ferroelastic and co-elastic crystals : an
introduction for mineralogists, material scientists, and physicists (Cambridge
University Press, Cambridge, 1990), p.147
4. A. J. Freeman and H. Schmid, Magnetoelectric Interaction Phenomena in Crystals
(Gordon and Breach, London, 1975).
5. Ferroelectrics and related materials, Lines and Glass, Oxford (1977)
6. Aizu, K., J. phys. Soc. Jpn. 19, 918; 20, 959. Phys. Rev. 140, 590; 146, 423
7. H. F. Kay and P. Vousden, Philos. Mag. 40, 1019 (1949)
8. G. Skanavi and E. Matveeva, Sov. Phys. Rev. B, 50, 13168 (1957)
9. G. Smolenskii and A. Agranovskaya, Sov. Phys. Sol. State, 1, 1429 (1960)
10. V. Bokov and I. Myl’nikova, Sov. Phys. Sol. State, 3 613 (1961)
11. L. E. Cross, Ferroelectrics, 76, 241 (1987)
12. D. Viehland, s. Jang, L. cross and M. Wuttig, J. Appl. Phys. 68, 2916 (1990)
13. D. Viehland, J. Li, S. Jang, L. cross and M. Wuttig, Phys. Rev. B, 43, 8316 (1991)
14. G. Burns and F. Docal, Phys. Rev. B, 28, 2527 (1983)
15. W. Cochran, Phys. Rev. Lett. 3, 412 (1959); Adv. Phys. 9, 387 (1960); Adv. Phys.
10, 401, 1691; W. Cochran and A. Zia, Phys. Stat. Sol. 25, 273 (1968)
16. P. Anderson, G. Skanavi (Akad. Nauk. SSSR. Moscow), 290, 1959
17. G. Shirane, J. D. Axe, J. Harada, and J. P. Remeika, Phys. Rev. B 2, 155 (1970).

- 166 -
18. A. Naberezhnov, S. Vakhrushev, B. Dorner, and H. Moudden, Eur. Phys. J. B 11, 13
(1999).
19. P. M. Gehring, S.-E. Park, and G. Shirane, PRL 84, 5216 (2000)
20. D. Viehland, M-C. Kim, Z. Xu, and J, Li, Appl. Phys. Lett. 67 (1995), 2471
21. B. Jaffe, W. Cook and H. Jaffe, "Piezoelectric Ceramics", Academic Press, London
(1971)
22. B. Jaffe, R. Rath and S. Marzullo, J. Appl. Phys. 25, 809 (1954)
23. T. Weston, A. Webster and V. McNamara, J. Can. Ceram. Soc., 36, 15 (1967)
24. S-E. Park and T. Shrout, J. Appl. Phys. 82, 1804 (1997)
25. Y. Guo, H. Luo, D. Ling, H. Xu, T. He and Z. Yin, J. Phys.: Condens. Matter 15, L77
(2003)
26. B. Noheda, D. E. Cox, G. Shirane, J. A. Gonzalo, L. E. Cross and S-E. Park, Appl.
Phys. Letts., 74, 2059 (1999)
27. H. Fu and R. Cohen, Nature (London) 403, 281 (2000).
28. D. Vanderbilt and M. Cohen, Phys. Rev. B 63, 094108 (2001).
29. L. Bellaiche, A. García and D. Vanderbilt, Phys. Rev. Lett. 84, 5427–5430 (2000)
30. L. Bellaiche, A. García and D. Vanderbilt, Phys. Rev. B 64, 060103 (2001)
31. R. Guo, L.E. Cross, S-E. Park, B. Noheda, D.E. Cox, and G. Shirane, Phys. Rev. Lett.
84, 5423 (2000).
32. D. E. Cox, B. Noheda, G. Shirane, Y. Uesu, K. Fujishiro and Y. Yamada, Appl. Phys.
Lett., 79, 400 (2001).
33. B. Noheda, D. E. Cox, G. Shirane, S-E. Park, L. E. Cross, and Z. Zhong, Phy. Rev.
Lett. 86, 3891 (2001).

- 167 -
34. Z. Ye, B. Noheda, M. Dong, D. Cox, and G. Shirane, Phys. Rev. B 64, 184114 (2001).
35. J. M. Kiat, Y. Uesu, B. Dkhil, M. Matsuda, C. Malibert and G. Calvarin, Phys. Rev. B
65, 064106 (2002).
36. B. Noheda, D. E. Cox, Shirane, J. Gao and Z. Ye, Phys. Rev. B 66, 054104 (2002).
37. D. La-Orauttapong, B. Noheda, Z.-G Ye, P. M. Gehring, J. Toulouse, D. E. Cox and G.
Shirane, Phys. Rev. B 65, 144101 (2002)
38. M. Wechsler, D. Lieberman and T. Read, Trans. Metall. Soc. AIME 197, 1503 (1953)
39. L. E. Tanner, Philos. Mag. 14, 111 (1966).
40. S. Shapiro, J. Larese, Y. Noda, S. Moss, and L. E. Tanner, Phys. Rev. Lett. 57, 3199
(1986).
41. S. Kartha, T. Castan, J. A. Krumhansl, and J. P. Sethna, Phys. Rev. Lett. 67, 3630
(1991).
42. A. G. Khachaturyan, S. M. Shapiro, and S. Semenovskaya, Phys. Rev. B 43, 10832
(1991).
43. D. Viehland, J. Appl. Phys. 88, 4794 (2000).
44. Y. M. Jin, Y. Wang, A. G. Khachaturyan, J. Li and D. Viehland, J. Appl. Phys. 94,
3629 (2003).
45. E. R. Leite, A. M. Scotch, A. Khan, T. Li, H. M. Chan, M. P. Harmer, S. F. Liu and S-
E. Park, J. Am. Ceram. Soc., 85, 3018 (2002).
46. Stock, Ellis, Swainson, G. Xu, Hiraka, Z. Zhong, H. Luo, D. Viehland, Birgenaue and
G. Shirane, submitted to Phys. Rev. B.
47. G. Engdahl, Handbook of Giant Magnetostrictive Materials (Academic, San Diego,
2000)

- 168 -
48. É. du Trémolet de Lacheisserie, Magnetostriction theory and applications of
magnetoelasticity, (CRC Press), 1993
49. E. Tatsumoto and T. Okamoto, J. Physs Soc. Japan, 14, 1588 (1959).
50. R. C. Hall, J. Appl. Phys.30, 816 (1959); 31, 1037 (1960).
51. H. Leamy, E.D. Gibson, and F.X. Kayser, Acta Metallurgica, 1967. 15: p. 1827.
52. A. E. Clark, M. Wun-Fogle, J. B. Restorff, T. A. Lograsso, A. R. Ross, and D. L.
Schlagel, Proceedings of Actuator 2000 Conference, Berlin, German
53. J. R. Cullen, A. E. Clark, M. Wun-Fogle, J. B. Restorff, T. A. Lograsso, J. Magn.
Magn. Mater. 226, 948 (2001)
54. A. E. Clark, K. B. Hathaway, M. Wun-Fogle, J. B. Restorff, T. A. Lograsso and V.
M. Keppens, G. Petculescu and R. A. Taylor, J. Appl. Phys. 93, 8621 (2003)
55. Z. H. Liu, G. D. Liu, M. Zhang, G. H. Wu, F. B. Meng, H. Y. Liu, Q. Yan, J. P. Qu
and Y. X. Li, Appl. Phys. Lett. 85, 1751 (2004)
56. G. D. Liu, L. B. Liu, M. Zhang, J. L. Chen, J. Q. Li, G. H. Wu, Y. X. Li, J. P. Qu and
T. S. Chin, Appl. Phys. Lett. 84, 2124 (2004)
57. O. Ikeda, R. Kainuma, I. Ohnuma, K. Fukamichi and K. Ishida, J. Alloys Comp. 347,
198 (2002)
58. M. Wuttig, L. Dai and J. Cullen, Appl. Phys. Lett. 80, 1135 (2002)
59. T. Lograsso, A. Ross, D. Schlagel, A.E. Clark, and M. Wun-Fogle, J. Alloys and
Compounds 350, 95 (2003).
60. R. Wu, J. Appl. Phys. 91, 7358 (2002).
61. R. D. Shull, H. Okamoto, P. A. Beck, Solid State Commun. 20, 863 (1976)
62. W. Zhu and P. Han, Appl. Phys. Lett. 75, 3868 (1999).

- 169 -
63. W. Tan, Z. Xu, J. Shang, and P. Han, Appl. Phys. Lett. 76, 3732 (2000).
64. G. Xu, D. Viehland, J. Li, P. Gehring and G. Shirane, Phys. Rev. B 68, 212410 (2003)
65. Online materials, URL: http:// www.physics.uc.edu/ ~jph/emma/tas.html
66. Harnagea, PhD Dissertation, Martin-Luther University, Halle-Wittenberg, Germany
(2001).
67. DimensionTM 3100 Scanning Probe Microscope, Manual by Veeco
68. U. Hartmann, Phys. Lett. A, 137, 475 (1989)
69. C. D. Wright and E. W. Hill, Appl. Phys. Letts. 67, 433 (1995)
70. S. McVitie, R. Ferrier, J. Scott, G. S. White and A. Gallagher, J. Appl. Phys. 89,
3656 (2001)
71. A. K. Singh and D. Pandey, Phys. Rev. B 67, 064102 (2003).
72. D. Viehland and J.F. Li, J. Appl. Phys. 92, 7690 (2002).
73. Ragini, R. Ranjan, S. K. Mishra, and D. Pandey, J. Appl. Phys. 92, 3266 (2002).
74. P. M. Gehring, W. Chen, Z. –G. Ye and G. Shirane, Cond-Mat./ 0304289.
75. A. Singh and D. Pandey, Phys. Rev. B 68, 172103 (2003).
76. K. Ohwada, K. Hirota, P. Rehrig, Y. Fujii, and G. Shirane, Phys. Rev. B 67, 094111
(2003).
77. C-S Tu, C. –L. Tsai, V. H. Schimidt, H. Luo and Z. Yin, J. Appl. Phys. 89, 7908
(2001)
78. G. Xu, H. Luo, H. Xu and Z. Yin, Phys. Rev. B 64, 020102 (2001)
79. Z.-G. Ye and M. Dong, J. Appl. Phys. 87, 2312 (2000)
80. C. Tu, I. Shih, V. Schmidt, and R. Chien, Appl. Phys. Let. 83, 1833 (2003).
81. C. Randall, D. Barber, and R. Whatmore, J. Microsc. 45, 275 (1987).

- 170 -
82. D. Viehland, Myung-Chul Kim, Z. Xu, and Jie-Fang Li, Appl. Phys. Let. 67, 2471-
2473 (1995).
83. Z. Xu, M.C. Kim, Jie-Fang Li, and Dwight Viehland, Phil. Mag. A 74, 395-406
(1996).
84. M. Abplanalp, L.M. Eng, and P. Gunter, App. Phys. A 66, S231 (1998).
85. M. Abplanalp, D. Barosova, J. Erhart, J. Fousek, P. Gunter, J. Nosek and M. Sulc, J.
Appl. Phys. 91, 3797 (2002)
86. K. Bdikin, V. V. Shvartsman and A. L. Kholkin, Appl. Phys. Letts. 83, 4232 (2003)
87. F. Bai, N. Wang, J. Li, D. Viehland, G. Xu, G. Shirane and P. Gehring, J. Appl. Phys.
96, 1620 (2004)
88. J. Han and W. Cao, Phys. Rev. B, 134102 (2003)
89. G. Smolenskii, J. Phys. Soc. Jpn. 28, 26 (1970).
90. M. Glazer, presented at 10th European Meeting on Ferroelectricity, Cambridge, United
Kingdom (August 2003).
91. F. Bai, J. Li and D. Viehland, Appl. Phys. Lett. 85, 2313 (2004).
92. F. Bai, J. Li, and D. Viehland, J. Appl. Phys., 97, 054103 (2005).
93. Syutkina, and E.S. Jakovleva, Phys. Status Solids 21, 465 (1967).
94. M.S. Wechsler, D.S. Lieberman, and T. A. Read, Trans. Metall. Soc., AIME 197,
1503 (1953).
95. J.C. Bowles, and J.K. Mackenzie, Acta Metall. 2, 129 (1954).
96. A.G. Khachaturyan, and G.A. Shatalov, Zh. Eksp. Teor. Fiz. 56, 1037 (1969) (Sov.
Phys. JETP 29, 557 (1969)).
97. A.G. Khachaturyan, The Theory of Structural Transformations in Solids, Wiley,

- 171 -
1983, New York.
98. A.L. Roytburd, Fiz.Tverd.Tela 10, 3619 (1968) (Sov.Phys. Solid State 10, 2870
(1969))
99. D. Viehland and Y.-H. chen, J. Appl. Phys. 88, 6696 (2000).
100.D. Viehland and J. Powers, J. Appl. Phys. 89, 1820-1825 (2001).
101.D. Viehland, J. Powers, and J.F. Li, J. Appl. Phys. 90, 2479-2843 (2001).
102.W.J. Merz, Physical Review, 95, 690-698 (1954).
103.M.E. Drougard, J. Appl. Phys. 31, 352-355 (1960).
104.R.C. Miller and G. Weinreich, Phys. Rev. 117, 1460-1466 (1960).
105.V. Shur, E. Rumyantsev, and S. Makarov, J. Appl. Phys. 84, 445-451 (1998).
106.Y. Ishibashi and Y. Takagi, J. Phys. Soc. Japan 31, 506-511 (1971).
107.A. Levstik, M. Kosec, V. Bobnar, C. Filipic, and J. Holc, Jap. J. Appl. Phys. 36, Pt. 1,
No. 5A, 2744-2746 (1997).
108.Y. Ishibashi, Integrated Ferroelectrics 2, 41 (1992).
109.T. Song, S. Aggarwal, Y. Gallais, B. Nagaraj, R. Ramesh, and J. Evans, Appl. Phys.
Lett. 73, 3366-3368 (1998).
110.J. Dalton, Phys. Rev. 133A, 1034 (1964).
111.J.F. Scott, L. Kammerdiner, M. Parris, S. Traynor, V. Ottenbacher, A. Shawabkeh,
and W. Oliver, J. Appl. Phys. 64, 787 (1988).
112.J.F. Scott, “Ferroelectric Memories”, Springer, Berlin (2000).
113.D. Viehland and J.F. Li, J. Appl. Phys. 90, 2995 (2001)
114.C. Jullian, J.F. Li, and D. Viehland, J. Appl. Phys. 95, 5671 (2004)
115.F. Bai, J. Li, and D. Viehland, Appl. Phys. Lett. 85, 4457 (2004)

- 172 -
116.Y. Imry and S. Ma, Phys. Rev. Lett. 35, 1399 (1975).
117.J. Natterman and J. Villain, Phase Transitions 11, 5 (1988).
118.D. Viehland, J. F. Li, T. A. Lograsso and M. Wuttig, Appl. Phys. Lett. 81, 3185
(2002)
119.S. Rafique, J. R. Cullen, M. Wuttig, and J. Cui, J. Apply. Phys. 95, 6939 (2004)
120.R. Tickle and R. D. James, J. Magn. Magn. Mater. 195, 627 (1999).
121.Y. Murakami, D. Shindo, K. Oikawas, R. Kainuma and K. Ishida, Appl. Phys. lett.
82, 3695 (2003)
122.Y. Murakami, D. Shindo, K. Oikawas, R. Kainuma and K. Ishida, Appl. Phys. lett.
85, 6170 (2004)
123.A. Zheludev, S. M. Shapiro, P. Wochner and L. E. Tanner, Phys. Rev. B, 54, 15045
(1996)
124.S. Guruswamy, N. Srisukhumbowornchai, A. E. Clark, J. B. Restorff, and M. Wun-
Fogle, Sc. Mater. 43, 239 (2000)
125.Y. Imry and S. Ma, Phys. Rev. Lett. 35, 1399 (1975).
126.F. Bai, H. Zheng, J. Zhai1, J. Li, R. Ramesh, and D. Viehland, Appl. Phys. Letts. 85,
4109 (2004)
127.J. H. Haeni, P. Irvin, W. Chang, R. Uecker, P. Reiche, Y. L. Li,S. Choudhury, W.
Tian, M. E. Hawley, B. Craigo, A. K. Tagantsev, X. Q. Pan, S. K. Streiffer, L. Q.
Chen, S. W. Kirchoefer, J. Levy and D. G. Schlom, Nature, 430, 758 (2004)
128.K. J. Choi, M. Biegalski, Y. L. Li, A. Sharan, J. Schubert, R. Uecker, P. Reiche, Y. B.
Chen, X. Q. Pan, V. Copalan, L.-Q. Chen, D. G. Schlom and C. B. Eom, Science,
306, 1005 (2004)

- 173 -
129.N. A. Pertsev, A. G. Zembilgotov, A. K. Tagantsev, Phys. Rev. Lett. 80, 1988 (1998).
130.R. A. Kellogg, A. B. Flatau, A. E. Clark, M. Wun-Fogle and T. A. Lograsso, J. Appl.
Phys. 91, 7821 (2002)

- 174 -
VITA
Feiming Bai was born in Nei Mengu, People’s Repulic of China. He graduated from
Tsinghua University, Beijing, with a B.E. degree in Materials Science and Engineering in
1999 and a M.S. degree in Materials Science (metallurgy) in 2002. He entered the
graduate college of Virginia Tech in the same year, focusing on the preparation and
structural characterization and integration of smart materials and structures. He is a
member of the American Ceramics Society, the Materials Research Society and the
American Physics Society. He has authored and co-authored nearly thirty papers in the
literature.