Embed Size (px)
Citation preview

The Pennsylvania State University
The Graduate School
College of Earth and Mineral Sciences
PROCESS-STRUCTURE-PROPERTY RELATIONSHIPS OF MICRON THICK
GADOLINIUM OXIDE FILMS DEPOSITED BY REACTIVE ELECTRON
BEAM-PHYSICAL VAPOR DEPOSITION (EB-PVD)
A Dissertation in
Materials Science & Engineering
by
Daniel A. Grave
© 2014 Daniel A. Grave
Submitted in Partial Fulfillment
of the Requirements
for the Degree of
Doctor of Philosophy
December 2014

ii
The dissertation of Daniel A. Grave was reviewed and approved* by the following:
Douglas E. Wolfe
Associate Professor of Materials Science & Engineering
Associate Professor of Engineering Science & Mechanics
Dissertation Co-Adviser
Chair of Committee
Joshua A. Robinson
Assistant Professor of Materials Science & Engineering
Dissertation Co-Adviser
James H. Adair
Professor of Materials Science & Engineering
Professor of Biomedical Engineering and Pharmacology
Michael A. Lanagan
Professor of Engineering Science & Mechanics
Suzanne Mohney
Professor of Materials Science & Engineering
Chair of the Intercollege Graduate Degree Program in Materials Science and Engineering
*Signatures are on file in the Graduate School.

iii
Abstract
Gadolinium oxide (Gd2O3) is an attractive material for solid state neutron
detection due to gadolinium's high thermal neutron capture cross section. Development
of neutron detectors based on Gd2O3 requires sufficiently thick films to ensure neutron
absorption. In this dissertation work, the process-structure-property relationships of
micron thick Gd2O3 films deposited by reactive electron-beam physical vapor deposition
(EB-PVD) were studied. Through a systematic design of experiments, fundamental
studies were conducted to determine the effects of processing conditions such as
deposition temperature, oxygen flow rate, deposition rate, and substrate material on
Gd2O3 film crystallographic phase, texture, morphology, grain size, density, and surface
roughness. Films deposited at high rates (> 5 Å / s) were examined via x-ray diffraction
(XRD) and Raman spectroscopy. Quantitative phase volume calculations were
performed via a Rietveld refinement technique. All films deposited at high rates were
found to be fully monoclinic or mixed cubic / monoclinic phase. Generally, increased
deposition temperature and increased oxygen flow resulted in increased cubic phase
volume. As film thickness increased, monoclinic phase volume increased. Grazing
incidence x-ray diffraction (GIXRD) depth profiling analysis showed that cubic phase
was only present under large incidence angle (large penetration depth) measurements,
and after a certain point, only monoclinic phase was grown. This was confirmed by
transmission electron microscopy (TEM) analysis with selected area diffraction (SAD).
Deposition of a pure cubic phase film was possible at high deposition rates for
film thickness less than 50 nm under a deposition temperature of 250 °C and 200 sccm
O2 flow. However, this film was shown to be under significant compressive stress of 1.7

iv
GPa by XRD residual stress measurements. Thick (1 μm) pure cubic phase films were
deposited by lowering the deposition rate to < 1 Å / s, and increasing the deposition
temperature to 650 °C. This was attributed to both increased adatom mobility as well as
reduction in compressive stress as measured by the wafer curvature technique.
Based on this information, a large compressive stress was hypothesized to cause
the formation of the monoclinic phase and this hypothesis was confirmed by
demonstrating the existence of a stress induced phase transition. An experiment was
designed to introduce compressive stress into the Gd2O3 films via ion beam assisted
deposition (IBAD). This allowed for systematic increase in compressive stress while
keeping a large adatom diffusion length on the film surface. It was shown that the films
could be completely transformed from the cubic to monoclinic phase with applied
compressive stress of -777 MPa for the deposition conditions considered, confirming the
existence of a stress-induced phase transition.
Crystallographic texture evolution in the Gd2O3 films was investigated for
different substrate types. At high rates, it was shown that films deposited on different
substrates (quartz, silicon, sapphire, and GaN) all had similar θ-2θ diffraction patterns,
suggesting that films grew similarly on different substrates due to the low adatom
mobility. However, significant differences in texture were observed for films deposited
at low rates (< 1 Å / s) and high temperature (650 °C) on different substrates. For
evaluation of in-plane texture in the Gd2O3 films, pole figure analysis was performed.
Mixed phase films deposited at high rates and low temperature showed weak out-of-plane
texture and random in-plane texture. Mixed phase films deposited at high temperatures
possessed a fiber texture (strong out-of-plane texture), but lacked the necessary adatom

v
mobility to develop in-plane texture. For single phase cubic films grown under low rates
of deposition, out-of-plane texture was observed on quartz substrates. However, weak
and strong in-plane textures were observed for sapphire and GaN substrates, respectively.
The use of ion bombardment resulted in the formation of moderate biaxial texture for
films grown on quartz. For films grown on sapphire, a very strong biaxial texture was
achieved with ion bombardment which adds additional energy to the system.
The effects of processing on the structure, composition, and interfacial chemistry
of the Gd2O3 films were investigated. The results showed that films primarily adhered to
the Structure-Zone models with a few exceptions. The deviation from the Structure-Zone
model was explained by the combined effects of columnar growth, shadowing, and
adatom mobility. At low deposition temperatures, decreasing oxygen flow resulted in
increased film density due to higher adatom mobility. Films deposited at this temperature
were characterized by small (10 – 15 nm) nanocrystalline grains with some porous
disordered regions. As the deposition temperature was raised to 650 °C, a dense
nucleation region was observed and the films were highly crystalline with larger grain
size. After the approximately 200 nm dense nucleation region, columnar growth was
observed as the film grew thicker. Porosity formed between the growing columns due to
shadowing effects. The effects of processing on the interfacial layer size of Gd2O3 films
deposited on silicon were investigated. The size and structure of the interfacial layer was
dependent upon the deposition conditions. Generally, higher oxygen flow and higher
deposition temperature led to larger interfacial layer size and a more undulating interface.
The interfacial reaction was determined to proceed as a result of intermixing of the SiOx
layer with the Gd2O3 layer to form the Gd-Si-O interface during deposition. Films

vi
deposited on GaN possessed excellent interfacial characteristics with near heteroepitaxial
growth and no apparent interfacial layer. Ion beam assisted deposition was shown to
result in significant densification of the film structure and elimination of the columnar
morphology. Lastly, the O : Gd ratio of the Gd2O3 films was investigated using EDS and
XPS, and showed that the processing conditions had significant effects on the film
composition. Increasing temperature was found to decrease the O : Gd ratio. Increasing
oxygen flow was found to increase the O : Gd ratio for films deposited at low
temperatures, but had little effect for films deposited at high temperature due to the fact
that adatom mobility was significantly more affected by oxygen flow at lower
temperatures.
The dielectric properties of Si(111) / Gd2O3 / Ti / Au MOS capacitors were
investigated. Moisture absorption in Gd2O3 films was found to result in both increased
dielectric loss (10x) and inflated dielectric constant values (~40 %). Heat treatment of
the films at 100 °C resulted in outgassing of moisture, reduction in dielectric constant,
and excellent frequency dispersion of the dielectric constant over a range of 10 kHz – 1
MHz. The effect of film processing on the dielectric constant was systematically
investigated. Tuning of the dielectric constant from a value of 11 to a value of 24 was
possible by manipulating the structure and crystallographic phase of the material via the
processing conditions. Capacitance-voltage (C-V) and conductance-voltage (G-V)
characteristics of GaN / AlGaN / Gd2O3 / Ti / Au MOS capacitors were investigated. The
effects of processing on fixed oxide charge, trapped oxide charge, and density of
interface states were evaluated. Single phase cubic films deposited at low rates with near
heteroepitaxial growth were shown to have the lowest density of trapped charge.

vii
Additionally, threshold instability in the C-V curve as well as a non-volatile charge
trapping effect was observed. Conduction mechanisms in Gd2O3 films were studied
through current-voltage-temperature (I-V-T) measurements. A number of mechanisms
were found to govern conduction in Gd2O3 films across a wide measurement temperature
and electric field range including ohmic conduction, Schottky Emission, Poole-Frenkel
emission, and space charge limited conduction. For Poole-Frenkel emission, the trap
heights of 1.03 eV and 1.25 eV were found for the cases of gate and substrate injection,
respectively. Schottky barrier height at the Si (111) / Gd2O3 interface and Gd2O3 / Ti /
Au interface was found to be 0.56 eV and 0.54 eV, significantly lower than the expected
barrier height value. For GaN / AlGaN / Gd2O3 / Ti / Au capacitors, the Schottky barrier
height at the GaN / AlGaN / Gd2O3 interface was found to be 0.79 eV and the Poole
Frenkel trap height was 0.46 eV. The performance of GaN / AlGaN / Gd2O3 / Ti / Au
high electron mobility transistors (MOS-HEMTs) was investigated with emphasis on
necessary device performance for radiation detection. Gd2O3 films deposited at 650 °C
led to devices with good switching characteristics including an on/off ratio of ~109
and
subthreshold swing as low as 88 mV. However, significant hysteresis and threshold
voltage instability was observed for the Gd2O3 MOS-HEMTs.
Finally, the response of GaN / AlGaN / Gd2O3 / MOS-HEMTs to gamma and
neutron radiation was investigated. The devices showed sensitivity to both types of
radiation. For devices with 1 μm thick Gd2O3 films, the neutron response was not
improved over the control device. Devices with 10 μm thick films showed significantly
increased neutron detection. However, the neutron response was larger than the expected
theory, suggesting that added signal due to γ-radiation may have been collected.

viii
Table of Contents
List of Figures ................................................................................................................... xi
List of Tables .................................................................................................................. xxi
Acknowledgements ...................................................................................................... xxiv
Chapter 1 Introduction ........................................................................................... 1
Chapter 2 Background ........................................................................................... 8
2.1. Radiation detection.................................................................................................. 8
2.2. The crystal structure of gadolinium oxide (Gd2O3) .............................................. 14
2.3. Phase transitions in bulk Gd2O3 ............................................................................ 18
2.4. Thin film growth ................................................................................................... 20
2.4.1. Electron beam-physical vapor deposition (EB-PVD) ................................... 20
2.4.2. Atomistic description of thin film growth ..................................................... 22
2.4.3. Macroscopic description of thin film growth and Structure-Zone model ..... 24
2.4.4. Residual stress in thin films .......................................................................... 27
2.5. Gadolinium oxide (Gd2O3) thin films ................................................................... 27
2.5.1. Epitaxial gadolinium oxide films .................................................................. 28
2.5.2. Polycrystalline gadolinium oxide films ......................................................... 29
2.5.3. Amorphous Gd2O3 films ............................................................................... 31
2.5.4. Phase transitions in thin film Gd2O3 during growth ...................................... 31
2.6. Dielectric properties .............................................................................................. 33
2.7. Conduction in metal oxides ................................................................................... 35
2.7.1. Bulk-limited conduction mechanisms ........................................................... 37
2.7.1.1. Space charge limited conduction (SCLC) ............................................. 37
2.7.1.2. Frenkel-Poole conduction ...................................................................... 38
2.7.2. Electrode-limited conduction mechanisms ................................................... 39
2.7.2.1. Schottky emission .................................................................................. 39
2.7.2.2. Fowler-Nordheim tunneling .................................................................. 40
Chapter 3 Experimental methods ........................................................................ 41
3.1. Film Deposition ..................................................................................................... 41
3.1.1. Electron beam-physical vapor deposition (EB-PVD) ................................... 41
3.1.2. Reactive electron-beam physical vapor deposition ....................................... 43
3.1.3. Direct electron beam-physical vapor deposition ........................................... 45
3.1.4. Ion beam assisted deposition (IBAD) ........................................................... 46
3.2. Materials characterization ..................................................................................... 47
3.2.1. Scanning electron microscopy (SEM) ........................................................... 48
3.2.2. Transmission electron microscopy (TEM) .................................................... 48
3.2.3. Focused ion beam (FIB) ................................................................................ 49
3.2.4. Atomic force microscopy (AFM) .................................................................. 49
3.2.5. X-ray diffraction (XRD) ................................................................................ 50
3.2.6. Raman spectroscopy ...................................................................................... 53
3.2.7. Energy dispersive x-ray spectroscopy (EDS) ................................................ 53
3.2.8. X-ray photoelectron spectroscopy ................................................................. 54
3.2.9. UV-Vis spectroscopy .................................................................................... 54

ix
3.2.10. Ellipsometry ................................................................................................ 55
3.2.11. Residual stress by wafer curvature method ................................................. 55
3.3. Electrical test structure fabrication........................................................................ 56
3.3.1. Gd2O3 / Si(111) MOS capacitor fabrication .................................................. 57
3.3.2. GaN / AlGaN quantum well structures ......................................................... 58
3.3.3. GaN / AlGaN / Gd2O3 / Ti / Au device fabrication ...................................... 60
3.4. Electrical characterization techniques ................................................................... 62
3.4.1. Capacitance-voltage (C-V) measurements .................................................... 62
3.4.2. Current-voltage-temperature (I-V-T) measurements .................................... 64
3.4.3. Field effect transistor (FET) measurements .................................................. 64
3.5. Radiation testing ................................................................................................... 65
3.6. Design of experiments .......................................................................................... 69
3.7. Heat treatments...................................................................................................... 74
Chapter 4 Results and Discussion: Process-phase relationships in Gd2O3 films
76
4.1. Effect of deposition temperature on Gd2O3 phase stability .................................. 77
4.1.1. Quantitative phase volume and crystallite size analysis ............................... 81
4.2. Effect of oxygen flow on Gd2O3 phase stability ................................................... 88
4.3. GIXRD depth profiling indicating phase and texture evolution in Gd2O3 films .. 94
4.4. Effect of film thickness on phase of Gd2O3 films ................................................. 96
4.5. Effect of substrate type on crystallographic phase and orientation of Gd2O3 films
.................................................................................................................................... 100
4.6. Effect of heat treatments on crystallographic phase and orientation of Gd2O3 films
.................................................................................................................................... 101
4.7. Conclusions ......................................................................................................... 103
Chapter 5 Results and Discussion: Deposition of single phase cubic films and
stress induced phase transformation ........................................................................... 107
5.1. Deposition of thin (< 50 nm) single phase Gd2O3 films at low temperature ...... 108
5.2. Effects of residual stress on Gd2O3 thin films ..................................................... 112
5.3. Deposition of thick single phase cubic Gd2O3 films ........................................... 115
5.4. Stress induced phase transformation by ion beam assisted deposition (IBAD).. 117
5.5. Texture evolution in single phase cubic films deposited at low rates ................. 122
5.6. Pole figure analysis for determination of preferred orientation .......................... 125
5.6.1. Mixed phase films deposited at high rates .................................................. 126
5.6.2. Single phase cubic films deposited at low rates on different substrate
materials ................................................................................................................ 128
5.7. Conclusions ......................................................................................................... 134
Chapter 6 Results and Discussion: Microstructure, composition, and interfacial
phenomena of Gd2O3 films. .......................................................................................... 138
6.1. The effects of processing on Gd2O3 film structure and interface........................ 139
6.1.1. The structure of thin (< 50 nm) Gd2O3 films deposited on silicon (111) .... 139
6.1.2. Effects of temperature on Gd2O3 film morphology deposited on Si(111).. 145
6.1.3. Effect of oxygen flow on the Gd2O3 film morphology of s deposited on
Si(111) ................................................................................................................... 155

x
6.1.4. Effect of film thickness on Gd2O film morphology deposited on Si(111) .. 163
6.1.5. Interfacial structure and composition of Gd2O3/Si(111) films .................... 168
6.1.6. Effect of deposition rate and substrate material on Gd2O3 film morphology
............................................................................................................................... 179
6.1.7. Effect of ion bombardment on the morphology of Gd2O3 films deposited on
sapphire ................................................................................................................. 190
6.1.8. Effect of heat treatments on Gd2O3 film morphology deposited on Si(111)
............................................................................................................................... 193
6.2. Compositional analysis ....................................................................................... 196
6.2.1. X-Ray photoelectron spectroscopy ............................................................. 196
6.2.2. Energy dispersive x-ray spectroscopy ......................................................... 200
6.3. Conclusions ......................................................................................................... 202
Chapter 7 Results and Discussion: Electrical properties and neutron detection
response of thick film Si(111) / Gd2O3 / Ti / Au MOS capacitors and GaN / AlGaN /
Gd2O3 / Ti / Au HEMTs ............................................................................................... 208
7.1. Introduction ......................................................................................................... 208
7.2. Dielectric properties ............................................................................................ 209
7.2.1. Effects of processing on the dielectric constant .......................................... 210
7.2.2. Bulk and interface charges .......................................................................... 215
7.3. DC conduction in Si(111) / Gd2O3 / Ti / Au MOS capacitors ............................ 223
7.4. Conduction mechanisms in GaN / AlGaN / Gd2O3 / Ti / Au MOS capacitors ... 236
7.4. Integration of Gd2O3 into GaN / AlGaN HEMTs ............................................... 237
7.5. Thermal neutron and gamma response of GaN / AlGaN MOS HEMTs ............ 240
7.6. Conclusions ......................................................................................................... 245
Chapter 8 Conclusions and Future Work......................................................... 248
8.1. Conclusions ......................................................................................................... 248
8.2. Future Work ........................................................................................................ 254
8.2.1. Direct evaporation ....................................................................................... 255
8.2.2. Stabilization of micron thick single cubic phase films deposited at high rates
............................................................................................................................... 255
8.2.3. Stabilization of amorphous Gd2O3 films ..................................................... 257
8.2.4. Further investigation of stress induced phase transition in Gd2O3 films ..... 257
8.2.5. Development of dry etch for Gd2O3 device processing .............................. 258
8.2.6. Electrical properties and device performance ............................................. 259
8.2.7. Radiation detection ...................................................................................... 259
References ...................................................................................................................... 261
GaN / AlGaN device fabrication and mask layouts .................... 272 Appendix A.
Appendix A.1. Device fabrication procedure ............................................................ 272
Appendix A.2. Mask layouts ...................................................................................... 275
Optical properties of Gd2O3 films ................................................ 278 Appendix B.
Appendix B.1. Optical band gap measurements ........................................................ 278
Appendix B.2. Refractive index measurements ......................................................... 280

xi
List of Figures
Figure 1.1. Schematic showing radiation test structures based on (a) silicon-based
electronics and (b) AlGaN/GaN based electronics. Figures not drawn to scale. .. 2
Figure 2.1. Energy spectrum of detectors illustrating superior energy resolution of
the semiconductor-based detection method.1 ....................................................... 9
Figure 2.2. (a) Neutron capture cross section of gadolinium-157, boron-10,
lithium-6, and helium-3 as a function of neutron energy, and (b) products
associated with the neutron/element reaction (right). Note the large neutron
cross section range as a function of neutron energy for 157
Gd.20
.......................... 10
Figure 2.3. Schematic representations of (a) scintillator solid state detector, (b)
silicon-based state-of-the-art solid state detector, and (c) Gd2O3 solid state
device. ................................................................................................................... 11
Figure 2.4. Phase diagram for rare earth binary oxides as a function of cation
atomic number under standard pressure.36
............................................................ 16
Figure 2.5. Crystal structures of Gd2O3 in (a) cubic C phase (space group Ia3) and
(b) monoclinic B phase (space group C2/m). The oxygen and gadolinium
coordination for each phase is shown next to the unit cells. Red corresponds
to oxygen atoms and gray corresponds to gadolinium atoms. .............................. 17
Figure 2.6. Diffraction pattern showing phase change from C phase to A phase
with increasing pressure and formation of B phase upon pressure release.37
....... 19
Figure 2.7. Schematic of electron beam-physical vapor deposition process.40
........... 21
Figure 2.8. Schematic showing the stages of film growth.41
....................................... 23
Figure 2.9. Structure-Zone model for vapor deposited coatings. The schematic
contains both a top side and cross sectional view.44
............................................. 25
Figure 2.10. Schematic of a MOS capacitor. ............................................................... 33
Figure 2.11. C-V curve for a MOS capacitor with n-type substrate showing three
regions of capacitor operation. ............................................................................. 34
Figure 2.12. Hysteresis in CV curves as a result of trapped oxide charge. ................. 35
Figure 2.13. Energy level transitions for different conduction mechanisms. Ev is
the valence band, Ec is the conduction band, Ef is the Fermi level, and qɸ is
the Schottky barrier height.66
................................................................................ 36
Figure 3.1. Schematic of the Denton vacuum EB-PVD system. ................................. 42

xii
Figure 3.2. Digital image showing the substrate holder used in Gd2O3 EB-PVD
experiments which can accommodate four 2” wafers, one 1” x 1” substrate,
and seven 9 x 9 mm substrates. ............................................................................ 44
Figure 3.3. Digital images of (a) Gd2O3 and (b) Gd source material after direct
and reactive evaporations, respectively. ............................................................... 46
Figure 3.4. (a) Gd2O3 film thickness from which 99% of the intensity originates as
a function of angle 2θ and (b) percentage of diffracted intensity as a function
of Gd2O3 film thickness at the Si(111) peak position. .......................................... 51
Figure 3.5. Schematic of wafer curvature measurement using Tencor Flexus
2320.73
................................................................................................................... 56
Figure 3.6. (a) Cross Sectional Schematic of Si / Gd2O3 / Ti / Au MOS capacitor
and (b) digital image of top view of Si / Gd2O3 / Ti / Au MOS capacitor. The
small and large circular contacts are 1.5 mm and 3 mm in diameter,
respectively. .......................................................................................................... 57
Figure 3.7. Optical microscope image of GaN / AlGaN based “dot-ring” structure
with several MOS capacitors with diameters ranging from 62.5 μm to 1 mm. .... 58
Figure 3.8. Optical microscope image of top surface of GaN / AlGaN based “rad
sensor” structures. The device contains a number of electrical test structures
including four high electron mobility transistors (HEMTs) with different
device geometries, transmission line measurement structures, Van Der Pauw
structures, MOS capacitors, an RF-Field effect transistor, an ohmic resistor,
and a Schottky resistor. The labels S, D, and G correspond to the source,
drain, and gate for each of the four transistor structures. ..................................... 60
Figure 3.9. Capacitance-voltage (C-V) measurement of Si(111) / Gd2O3 / Ti / Au
MOS capacitor using a Suss PM5 probe station with probes connected to
Keithley 4200 Semiconductor Characterization System. ..................................... 63
Figure 3.10. (a) Digital image of GaN / AlGaN “rad sensor’ device die attached to
Cerdip packaging and (b) optical microscope image showing wirebonds to
GaN / AlGaN / Gd2O3 / Ti / Au MOS-HEMT terminals. ..................................... 66
Figure 3.11. Digital images of (a) beam lab housing beam port #7 and (b)
radiation detector fixture with lead shield and cable connections to
electronics. ............................................................................................................ 68
Figure 3.12. (a) SEM image of FIB cross section of thick Gd2O3 film deposited at
room temperature showing the origin of cracks at the substrate/film interface
and extending to the film surface and (b) optical microscopy image of top
surface of same Gd2O3 film showing widespread surface cracking. .................... 69

xiii
Figure 4.1. θ-2θ X-ray diffraction patterns of Gd2O3 films 6A (250 °C), 6B (350
°C), 6C (450 °C), 6D (550 °C), and 6E (650 °C) deposited on quartz as a
function of temperature under 200 sccm O2 flow. ................................................ 78
Figure 4.2. θ-2θ X-ray diffraction patterns of (a) fully cubic Gd2O3 powder and
(b) fully monoclinic Gd2O3 pellet after sintering at 1400 °C used to estimate
the difference in diffracted intensity between the two phases. ............................. 84
Figure 4.3. Raman spectra of Gd2O3 films 6A (250 °C), 6B (350 °C), 6C (450
°C), 6D (550 °C), and 6E (650 °C) deposited on quartz as a function of
temperature under 200 sccm O2 flow. The cubic and monoclinic bands used
for quantitative phase volume analysis are marked C and M, respectively. ......... 87
Figure 4.4. θ-2θ X-ray diffraction patterns of Gd2O3 films 4A (25 sccm), 4B (50
sccm), 4C (100 sccm), 4D (150 sccm), and 4E (200 sccm) deposited on
quartz as a function of oxygen flow at deposition temperature of 250 °C. .......... 89
Figure 4.5. θ-2θ X-ray diffraction patterns of Gd2O3 films 1A (50 sccm O2), 1B
(100 sccm O2), 1C (150 sccm O2), and 1D (200 sccm O2) deposited on quartz
as a function of oxygen flow at a deposition temperature of 650 °C. .................. 92
Figure 4.6. Grazing incidence diffraction patterns taken at incident angles of 1, 2,
5, 10, and 15 ° for film 6E (650 °C, 200 sccm O2, 0.87 µm) deposited on
quartz. The inset shows the magnified M(111) and C(222) peaks located at
28.0 and 28.6 °, respectively. ................................................................................ 95
Figure 4.7. θ-2θ X-ray diffraction patterns of Gd2O3 films 3A (0.58 µm), 3B (1.11
µm), 3C (2.10 µm), 3D (5.12 µm), and 3E (11.01 µm) deposited on quartz as
a function of film thickness at deposition temperature of 250 °C and oxygen
flow rate of 200 sccm. .......................................................................................... 97
Figure 4.8. θ-2θ X-ray diffraction patterns of Gd2O3 films 9A (0.38 µm), 9B
(0.59 µm), 9C (1.02 µm), 9D (2.69 µm), and 9E (5.72 µm) deposited on
quartz as a function of thickness at deposition temperature of 650 °C and
under 200 sccm of O2 flow. .................................................................................. 99
Figure 4.9. θ-2θ X-ray diffraction patterns of Gd2O3 film 12C (250 °C, 200 sccm
O2, 0.99 µm) deposited on silicon, quartz, sapphire, and GaN substrates. ........... 101
Figure 4.10. θ-2θ X-ray diffraction patterns of Gd2O3 film 12B (650 °C, 200
sccm O2, 1.1 µm): (a) as deposited, (b) after1 hour anneal in oxygen at 800
°C and (c) after1 hour anneal in oxygen at 1000 °C ............................................. 102
Figure 4.11. Process-phase summary map displaying the effects of temperature,
oxygen flow, and thickness on the phase of Gd2O3 films deposited at high
rates (greater than 5 Å / s) by reactive electron beam physical vapor
deposition (EB-PVD). ........................................................................................... 105

xiv
Figure 5.1. Grazing incidence pattern of fully cubic Gd2O3 film 8A (250 °C, 200
sccm O2, 47 nm thick). Red lines show equilibrium peak position given by
ICDD card #0042-1014. ....................................................................................... 108
Figure 5.2. Sin2ψ versus strain plot for film Gd2O3 film 8A (250 °C, 200 sccm O2,
47 nm). From the slope, a compressive stress of -1.7x ± 0.1 GPa (where x
the ratio between Young’s modulus for the C(222) plane and the bulk) was
calculated. ............................................................................................................. 111
Figure 5.3. (a) Measured residual stress via wafer curvature technique for ~1 µm
thick films 7A (250 °C), 7B (350 °C), 7C (450 °C), 7D (550 °C), and 7E (650
°C) deposited as a function of temperature on Si(111) under 50 sccm O2 flow
and (b) corresponding θ-2θ diffraction patterns deposited on quartz
substrates showing increasing cubic phase volume with increasing
temperature. .......................................................................................................... 114
Figure 5.4. θ-2θ X-ray diffraction patterns of fully cubic Gd2O3 film 10B (650 °C,
50 sccm O2, 910 nm, 0.5 Å/s) deposited on sapphire, quartz, silicon, and
GaN. ...................................................................................................................... 116
Figure 5.5. θ–2θ XRD patterns of Gd2O3 films 11A (0 mA), 11B (200 mA), 11C
(400 mA), and 11D (800 mA) grown on sapphire at 650 °C and 50 sccm O2
under low growth rate of ~0.5 Å / s as a function of ion beam source current..... 118
Figure 5.6. Raman spectra of cubic Gd2O3 powder and Gd2O3 films 11B (200
mA), 11C (400 mA), and 11D (800 mA) grown on sapphire at 650 °C and 50
sccm O2 under low growth rate of ~0.5 Å / s as a function of ion source
current. .................................................................................................................. 120
Figure 5.7. Grazing incidence diffraction patterns taken at incidence angles of 1,
2, 5, 10, and 15 degrees for film 10B (650 °C, 50 sccm O2, 910 nm, 0.5 Å/s)
deposited on quartz. The inset shows the magnified C(222) and C(400)
peaks. .................................................................................................................... 124
Figure 5.8. (a) C(222) and (b) M(-402) pole figures of film 6A (250 °C, 200 sccm
O2, 7.5 Å / s) deposited on quartz showing weak out-of-plane texture and
random in-plane texture. ....................................................................................... 127
Figure 5.9. (a) C(222) and (b) M(-402) pole figures of film 6E (650 °C, 200 sccm
O2, 8.2 Å / s) deposited on quartz showing strong fiber texture and random
in-plane texture. .................................................................................................... 127
Figure 5.10. Pole figures of (a) C(222), (b) C(400), (c) C(440), and (d) C(622)
planes for film 10B (650 °C, 50 sccm O2, 0.5 A / s) deposited on quartz
showing strong fiber texture and random in-plane texture. .................................. 128

xv
Figure 5.11. Pole figures of (a) C(222), (b) C(400), (c) C(440), and (d) C(622)
planes for film 10B (650 °C, 50 sccm O2, 0.5 Å / s) deposited on sapphire
showing strong out-of-plane texture and medium in-plane texture. ..................... 130
Figure 5.12. Pole figures of (a) C(222), (b) C(400), (c) C(440), and (d) C(622)
planes for film 10B (650 °C, 50 sccm O2, 0.5 Å / s) deposited on GaN
showing strong in and out-of-plane texture. ......................................................... 131
Figure 5.13. Pole figures of (a) C(222), (b) C(400), (c) C(440), and (d) C(622)
planes for film 11B (650 °C, 50 sccm O2, 0.5 Å / s, 200 mA) deposited on
quartz using ion beam assisted deposition (IBAD) showing strong in and out-
of-plane texture. .................................................................................................... 133
Figure 5.14. Pole figures of (a) C(222), (b) C(400), (c) C(440), and (d) C(622)
planes for film 11B (650 °C, 50 sccm O2, 0.5 Å / s, 200 mA) deposited on
sapphire using ion beam assisted deposition (IBAD) showing very strong in
and out-of-plane texture. ....................................................................................... 134
Figure 5.15. Relationship between residual stress and phase volume for films 11A
(0 mA), 11B (200 mA), 11C (400 mA), and 11D (800 mA) grown on
sapphire at 650 °C and 50 sccm O2 under low growth rate of ~0.5 Å / s as a
function of ion source current. The bulk of the phase transition occurs when
the compressive residual stress is between 317 MPa and 517 MPa. .................... 136
Figure 6.1. Select SEM top surface images of thin Gd2O3 films (a) 8A (250 °C,
200 sccm O2, 47 nm), (b) 8B (250 °C, 25 sccm O2, 41 nm), and (c) 8E (650
°C, 200 sccm O2, 20 nm) deposited on silicon. .................................................... 140
Figure 6.2. Low-magnification bright-field TEM images of thin Gd2O3 films (a)
8A (250 °C, 200 sccm O2, 47 nm) and (b) 8E (650 °C, 200 sccm O2, 20 nm).
The arrows denote porous regions. The corresponding SAD patterns are
shown in (c) and (d), respectively......................................................................... 141
Figure 6.3. High-resolution TEM images of thin Gd2O3 films (a) 8A (250 °C, 200
sccm O2, 47 nm) and (b) 8E (650 °C, 200 sccm O2, 20 nm). A few
crystallographic planes were indicated by short white lines and labeled. FFT
patterns of (c) 8A and (d) 8E. Four spotty rings are marked by short white
lines in (c). ............................................................................................................ 144
Figure 6.4. SEM top surface images of Gd2O3 films (a) 2A (250 °C), (b) 2B
(350 °C), (c) 2C (450 °C), (d) 2D (550 °C), and (e) 2E (650 °C) deposited as
a function of temperature under 200 sccm O2 flow at high rates ( > 5 Å / s).
Arrows denote voiding. ........................................................................................ 146
Figure 6.5. (a) SEM surface image of film 2A (250 °C, 200 sccm O2, 1.26 μm)
and (b) the corresponding grain size measurement technique. The measured
grain size was 51.2 ±1.6 nm for film 2A deposited at 250 °C under 200 sccm
O2 flow. ................................................................................................................. 149

xvi
Figure 6.6. (a) Low-magnification and (b) high-magnification bright-field TEM
images of thick Gd2O3 film 6A (250 °C, 200 sccm O2, 1.07 µm). The arrows
denote porous regions. SAD patterns were collected from the (c) interfacial
region, (d) the middle section, and (e) the top section of the film,
respectively. Five primary diffraction rings are marked by short white lines in
each diffraction pattern for identifying crystal planes and phases present. .......... 150
Figure 6.7. (a) Low-magnification and (b) high-magnification bright-field TEM
images of thick Gd2O3 film 6E (650 °C, 200 sccm O2, 0.87 µm). The arrows
denote porous regions. SAD patterns collected from the (c) interfacial region,
(d) the middle section, and (e) the top section of the film, respectively. .............. 153
Figure 6.8. AFM surface topography of Gd2O3 (a) film 2A (250 °C, 200 sccm O2,
1.26 μm) and (b) film 2E (650 °C, 200 sccm O2, 2.05 μm). ................................. 154
Figure 6.9. SEM top surface images of Gd2O3 films (a) 4A (25 sccm O2), (b) 4B
(50 sccm O2), (c) 4C (100 sccm O2), (d) 4D (150 sccm O2), and (e) 4E (200
sccm O2) deposited as a function of oxygen flow at 250 °C at high rates ( > 5
Å / s). .................................................................................................................... 156
Figure 6.10. (a) Low-magnification and (b) high-magnification bright-field TEM
images of thick Gd2O3 film 7A (250 °C, 50 sccm O2, 1.11 µm). SAD patterns
collected from the (c) interfacial region, (d) the middle section, and (e) the
top section of the film, respectively. ..................................................................... 158
Figure 6.11. SEM top surface images of Gd2O3 films (a) 1A (50 sccm O2), (b) 1B
(100 sccm O2), (c) 1C (150 sccm O2), and (d) 1D (200 sccm O2) deposited on
silicon as a function of oxygen flow at 650 °C at high rates (> 5 Å / s).
Arrows denote ridge-like growth. ......................................................................... 160
Figure 6.12. (a) Low-magnification and (b) high-magnification bright-field TEM
images of thick Gd2O3 film 7E (650 °C, 50 sccm O2, 1.2 µm). SAD patterns
collected from the (c) interfacial region, (d) the middle section, and (e) the
top section of the film, respectively. ..................................................................... 162
Figure 6.13. AFM RMS surface roughness and grain size for set 4 (250 °C,
function of oxygen flow, ~1 µm) and set 1 (650 °C, function of oxygen flow,
~2 µm). ................................................................................................................. 163
Figure 6.14. SEM surface images of film (a) 3A (580 nm) and (b) 3D (5.2 µm)
deposited on silicon at 250 °C under 200 sccm O2 flow at high rates (> 5 Å /
s). .......................................................................................................................... 164
Figure 6.15. SEM morphology of Gd2O3 films (a) 9A (0.38 µm), (b) 9B (0.59
µm), (c) 9C (1.02 µm), and (d) 9D (2.69 µm), and (e) 9E (5.72 µm) deposited
on Si(111) at 650 °C under 200 sccm O2 flow at high rates ( > 5 Å / s). The
inset in Figure 6.15a shows a C(222) triangular facet. ......................................... 165

xvii
Figure 6.16. SEM grain size and AFM surface roughness of Gd2O3 films from set
3 (250 °C, 200 sccm O2, function of thickness) and set 9 (650 °C, 200 sccm
O2, function of thickness). .................................................................................... 167
Figure 6.17. High-resolution TEM images collected from the interfacial regions of
Gd2O3 films (a) 6A (250 °C, 200 sccm O2, 1.07 µm) and (b) 6E (650 °C, 200
sccm O2, 0.87 µm) deposited on silicon under 200 sccm O2 at high rates (> 5
Å / s). .................................................................................................................... 169
Figure 6.18. High-resolution TEM images collected from the interfacial regions of
Gd2O3 films (a) 7A (250 °C, 50 sccm O2, 1.11 µm) and (b) 7E (650 °C, 50
sccm O2, 1.20 µm) deposited on silicon under 50 sccm O2 at high rates (> 5 Å
/ s). ........................................................................................................................ 170
Figure 6.19. Low-magnification HAADF STEM images of thin Gd2O3 films (a)
8A (250 °C, 200 sccm O2, 47 nm) and (b) 8E (650 °C, 200 sccm O2, 20 nm)
grown under 200 sccm oxygen flow. Higher magnification images collected
near the interface regions of the (c) 8A and (d) 8E heterostructures,
respectively. .......................................................................................................... 171
Figure 6.20. EDS spectra collected from the interfacial layers of the films 8A
(250 °C, 200 sccm O2, 47 nm) and 8E (650 °C, 200 sccm O2, 20 nm)
heterostructures. The C peak is from atmospheric carbon contamination and
Mo peak is related to the Mo TEM grid. .............................................................. 172
Figure 6.21. HAADF STEM images collected from the interface region of the
thick Gd2O3 films (a) 6A (250 °C, 200 sccm O2, 1.07 µm) and (b) 6E
(650 °C, 200 sccm O2, 0.87 µm) grown under 200 sccm O2 flow. The top and
bottom dashed lines indicate the approximate positions of the
Gd2O3/interfacial layer and interface layer/Si boundaries, respectively. ............. 175
Figure 6.22. EEL spectra collected from positions i to iv as indicated in (a) 6E
(Figure 6.21b) and (b) 7E (Figure 6.23b). The upper arrow (green) indicates a
weak Si edge while the lower arrow (blue) indicates a weak Gd edge. ............... 176
Figure 6.23. HAADF STEM images collected from the interfacial region of the
thick Gd2O3 films at (a) 7A (250 °C, 50 sccm O2, 1.11 µm ) and (b) 7E
(650 °C, 50 sccm O2, 1.20 µm) grown under 50 sccm oxygen. The top and
bottom dashed lines indicate the approximate positions of the
Gd2O3/interfacial layer and interfacial layer/Si boundaries, respectively. ........... 177
Figure 6.24. SEM surface images of film 12E (650 °C, 200 sccm O2, 1.2 µm, 10
Å / s) deposited on (a) silicon (111), (b) sapphire, (c) GaN, and (d) quartz. ........ 179
Figure 6.25. SEM surface images of Gd2O3 film 10A (650 °C, 50 sccm O2, 1.01
µm, 0.5 Å / s) on (a) silicon(111), (b) GaN, (c) quartz, and (d) sapphire
substrates. .............................................................................................................. 181

xviii
Figure 6.26. (a) Low-magnification bright-field image of thick Gd2O3 film (650
°C, 50 sccm O2, 1.01 µm, 0.5 Å / s) deposited on silicon (111) and (b)
corresponding SAD pattern collected from the film............................................. 183
Figure 6.27. High-resolution TEM images collected from the interfacial region of
the Gd2O3 film 10A (650 °C, 50 sccm O2, 1.01 µm, 0.5 Å/ s) deposited on
silicon showing (a) amorphous and (b) crystalline character. The dashed
lines denote the interfacial region. ........................................................................ 185
Figure 6.28. (a) Low-magnification bright-field TEM images of Gd2O3 film 10A
(650 °C, 50 sccm O2, 1.01 µm, 0.5 Å / s) deposited on GaN. SAD patterns
collected from (b) the whole film with a 500 nm diameter circular aperture.
SAD patterns collected from (c) interfacial region, (d) middle, and (e) top
sections of the Gd2O3 film using a 150 nm diameter circular aperture,
respectively. .......................................................................................................... 187
Figure 6.29. (a) High-resolution TEM image collected from the interfacial region
of Gd2O3 film 10A (650 °C, 50 sccm O2, 1.01 µm, 0.5 Å / s) deposited on
GaN. The arrow denotes a defect region. ............................................................ 188
Figure 6.30. (a) Low-magnification and (b) high-magnification bright-field TEM
images of Gd2O3 film 10A (650 °C, 50 sccm O2, 1.01 µm, 0.5 Å / s)
deposited on sapphire. .......................................................................................... 190
Figure 6.31. SEM top surface images of Gd2O3 films deposited using ion beam
assisted deposition with currents of (a) 11A (0 mA), (b) 11B (200 mA), (c)
11C (400 mA), and (d) 11D (800 mA) deposited on sapphire as a function of
IBS current at 650 °C, 50 sccm O2, and with growth rate of ~ 0.5 Å / s. ............ 191
Figure 6.32. (a) Low-magnification and (b) high-magnification bright-field TEM
images of thick Gd2O3 film 11D (650 °C, 50 sccm O2, 0.5 Å / s) deposited on
sapphire under 800 mA of IBS current, and (c) SAD pattern collected from
the middle section of the film. .............................................................................. 192
Figure 6.33. SEM top surface images of mixed phase film 12E (650 °C, 200 sccm
O2, 1.2 µm) in the following conditions: (a) as deposited and (b) heat treated
at 1000 °C in O2 environment for 1 hour. Arrows denote porous regions. ......... 193
Figure 6.34. Low-magnification bright-field TEM image of cubic Gd2O3 film
10A (650 °C, 50 sccm O2, 1.01 µm, 0.5 Å/ s) after heat treatment at 1000 °C
in O2 environment for 1 hour. ............................................................................... 194
Figure 6.35. High-magnification bright-field TEM image of the interface of cubic
Gd2O3 film 10A (650 °C, 50 sccm O2, 1.01 µm, 0.5 Å / s) after heat treatment
at 1000 °C in O2 environment for 1 hour. Arrow denotes resputtered
material. ................................................................................................................ 195

xix
Figure 6.36. Depth profile of XPS binding energy levels of (a) Gd 4d and (b) O1s
of film 2E (650 C, 200 sccm O2, 2.05 µm). ........................................................ 196
Figure 6.37. Depth profile of XPS binding energy levels of (a) Gd 4d and (b) O1s
of film 2A (250 C, 200 sccm O2, 1.26 µm). ........................................................ 197
Figure 6.38. Atomic composition of Gd2O3 films (a) 2A (250C, 200 sccm O2,
1.26 µm) and (b) 2E (650C, 200 sccm O2, 2.05 µm) as a function of etch
depth. .................................................................................................................... 199
Figure 6.39. O : Gd ratio calculated from EDS measurements for (a) set 2
(function of temperature, 200 sccm O2, 1-2 µm), (b) set 4 (250 °C, function
of oxygen flow, ~1 µm), and (c) set 3 (250 °C, 200 sccm O2, function of
thickness), respectively. ........................................................................................ 201
Figure 7.1. Dispersion of the dielectric constant and loss tangent of a Gd2O3 film
as a function of frequency (a) as deposited and (b) after heat treatment at 100
°C. Arrows denote corresponding y axis. ............................................................. 210
Figure 7.2. Gd2O3 permittivity measured at a frequency of 1 MHz as a function of
(a) temperature of films 6A-6E (function of temperature, 200 sccm O2, ~1
µm) and (b) oxygen flow rate for films 4A-4E (250 °C, function of O2 flow,
~1 µm). ................................................................................................................. 212
Figure 7.3. Capacitance-Voltage curves taken at 1 MHz for GaN / AlGaN / Gd2O3
/ Ti / Au MOS capacitors 7A (250 °C, 50 sccm O2, 1.1 µm), 7E (650 °C, 50
sccm O2, 1.20 µm), 10A (650 °C, 50 sccm O2, 1.01 µm, 0.5Å/s) and GaN /
AlGaN / Ti / Au Schottky control sample. ........................................................... 217
Figure 7.4. Example of G-V and C-V curve used for extracting the density of
interface states (Dit) for sample 7E (650 °C, 50 sccm O2, 1.1 µm). ..................... 219
Figure 7.5. C-V curves for GaN / AlGaN / Gd2O3 / Ti / Au MOS capacitors (a) 6A
(250 °C, 200 sccm O2, 1.07 µm) and (b) 10A (650 °C, 50 sccm O2, 1.01 µm,
0.5Å/s). ................................................................................................................. 222
Figure 7.6. J-E characteristics for Si / Gd2O3 / Ti / Au film 9D (650 °C, 200 sccm
O2, 2.69 μm) measured under temperature range of 25 - 250 °C. ........................ 224
Figure 7.7. Log I vs Log V under gate injection for Gd2O3 film 9D (650 °C, 200
sccm O2, 2.69 μm) measured between 25 – 250 °C under low electric field of
1x10⁶ V / m – 1x10
7 V / m. .................................................................................. 225
Figure 7.8. Schottky emission plots (ln (J/T2) vs E
1/2) under (a) gate injection and
(b) substrate injection for Gd2O3 film 9D (650 °C, 200 sccm O2, 2.69 μm). ....... 227
Figure 7.9. (a) Arrhenius ln(J/T2) vs 1/T plots used to extract reduced Schottky
barrier height for various voltages (85, 90, 95, 100) and (b) extraction of

xx
effective Schottky barrier height by extrapolation of reduced barrier height vs
V1/2
to V=0 under gate injection for film 9D (650 °C, 200 sccm O2, 2.69 μm). .. 230
Figure 7.10. Poole-Frenkel plots (ln (J/E) vs E1/2
) under (a) gate injection and (b)
substrate injection for Gd2O3 film 9D (650 °C, 200 sccm O2, 2.69 μm). ............. 232
Figure 7.11. (a) Arrhenius ln(J/E) vs 1/T plots to extract trap energy levels for
various electric field strengths and (b) extraction of zero field trap ionization
energy by extrapolation of trap energy vs V1/2
to V=0 under gate injection for
Gd2O3 film 9D (650 °C, 200 sccm O2, 2.69 μm). ................................................. 233
Figure 7.12. Log I versus Log V showing space charge limited conduction under
high electric fields for Gd2O3 film 9A (650 °C, 200 sccm O2, 0.38 μm). ............ 235
Figure 7.13. J-E characteristics for GaN / AlGaN / Gd2O3 / Ti / Au film 10A (650
°C, 50 sccm O2, 1.01 µm, 0.5Å/s) measured under temperature range of 25 -
250 °C. .................................................................................................................. 236
Figure 7.14. Transfer characteristics of Gd2O3 MOS HEMT, SiO2 MOS HEMT,
and a control MS HEMT without oxide layer. ..................................................... 239
Figure 7.15. In situ current response in (a) gate and (b) drain of 1 μm mixed phase
cubic Gd2O3 device 12F during neutron irradiation at 100kW reactor power.
The arrows identify the noise in the measurement. .............................................. 242
Appendix Figures:
Figure A.1. Overall mask layout for GaN / AlGaN rad sensor device fabrication. ..... 275
Figure A.2. Isolation layer mask layout for GaN / AlGaN rad sensor device
fabrication. ............................................................................................................ 275
Figure A.3. Ohmic level mask layout for GaN / AlGaN rad sensor device
fabrication. ............................................................................................................ 276
Figure A.4. Dielectric etch level mask layout for GaN / AlGaN rad sensor device
fabrication. ............................................................................................................ 276
Figure A.5. Schottky level mask layout for GaN / AlGaN rad sensor device
fabrication. ............................................................................................................ 277
Figure B.1. UV-Vis transmission measurements for Gd2O3 films 6A (250 °C, 200
sccm, 1.07 µm), 6E (650 °C, 200 sccm, 0.87 µm), and 7A (250 °C, 50 sccm
O2, 1.11 µm) deposited on quartz. The inset shows optical band gap
extraction via the Tauc method. ............................................................................ 278
Figure B.2. UV-Vis transmission measurements for Gd2O3 films from set 9 (650
°C, 200 sccm O2, function of thickness) deposited on quartz. ............................. 279

xxi
List of Tables
Table 2.1. Properties of Gd2O3 bulk ceramic at standard pressure .............................. 18
Table 3.1. Deposition parameters for Gd2O3 films deposited via reactive electron
beam physical vapor deposition. Set 1 is deposited as a function of oxygen
flow at a deposition temperature of 650 °C. Set 2 is deposited as a function
of temperature under an oxygen flow of 200 sccm. Set 3 is deposited as a
function of thickness at 250 °C and under 200 sccm O2 flow. Set 4 is
deposited as a function of oxygen flow at a deposition temperature of 250 °C. .. 70
Table 3.2. Deposition parameters for set 5. These films were deposited as a
function of temperature by direct deposition using Gd2O3 as the source
material. ................................................................................................................ 71
Table 3.3. Deposition parameters for sets 6 and 7 deposited as a function of
temperature by reactive EB-PVD with target thickness of 1 µm. Sets 6 and 7
were deposited under (a) 200 sccm and (b) 50 sccm O2 flow. ............................. 72
Table 3.4. Parameters for set 8 grown by reactive EB-PVD consisting of films
less than 50 nm thick deposited under various conditions. .................................. 73
Table 3.5. Deposition parameters for sets 9 deposited as a function of thickness by
reactive EB-PVD at 650 °C under oxygen flow of 200 sccm. ............................. 73
Table 3.6. Deposition parameters for set 10. These films were deposited with very
low deposition rates (<0.5 A / s) in order to deposit single phase cubic films. .... 74
Table 3.7. Deposition parameters for set 11. These films were deposited under
low deposition rate (<0.5 A / s) as a function of IBS current. The IBS voltage
was held float at approximately 500V and the current varied from 0 to 800
mA. ....................................................................................................................... 74
Table 4.1. 2θ equilibrium peak positions for high intensity diffraction planes
observed in Gd2O3 film growth and the corresponding phases for Cu Kα
radiation according to ICDD cards #0042-1465 and #0043-1014 (λ= 1.54056
Å). ......................................................................................................................... 77
Table 4.2. Phase volume and crystallite size for films 6A-6E. Phase volume was
calculated by the integrated intensity (I-I) method, Rietveld refinement, and
Raman spectroscopy. M denotes the monoclinic phase and C denotes the
cubic phase. Crystallite size was calculated using Scherrer’s equation. .............. 82
Table 4.3. Raman band positions and corresponding relative intensity of cubic
Gd2O3 powder and single crystal monoclinic Gd2O3. .......................................... 86

xxii
Table 4.4. Phase volume and crystallite size of Gd2O3 films 4A (25 sccm), 4B (50
sccm), 4C (100 sccm), 4D (150 sccm), and 4E (200 sccm) deposited on
quartz as a function of oxygen flow at a deposition temperature of 250 °C. ....... 90
Table 4.5. Phase volume and crystallite size of Gd2O3 films 1A (50 sccm), 1B
(100 sccm), 1C (150 sccm), and 1D (200 sccm) deposited on quartz as a
function of oxygen flow at deposition temperature of 650 °C. ............................ 94
Table 4.6. Phase volume and crystallite size of Gd2O3 films 3A (0.58 µm), 3B
(1.11 µm), 3C (2.10 µm), 3D (5.12 µm), and 3E (11.01 µm) deposited on
quartz as a function of film thickness at deposition temperature of 250 °C and
oxygen flow rate of 200 sccm. .............................................................................. 98
Table 4.7. Phase volume and crystallite size of Gd2O3 films 9A (0.38 µm), 9B
(0.59 µm), 9C (1.02 µm), 9D (2.69 µm), and 9E (5.72 µm) deposited on
quartz as a function of thickness at deposition temperature of 650 °C and
under 200 sccm of O2 flow. .................................................................................. 100
Table 4.8. Phase volume and crystallite size for film 12B (650 °C, 200 sccm O2,
1.1 µm) subjected to heat treatments in oxygen atmosphere. ............................... 103
Table 4.9. Summary of process-phase trends describing the effects of temperature,
oxygen flow, and thickness on the phase of Gd2O3 films deposited at high
rates greater than 5 Å / s. The bolded letters indicate the varied deposition
parameters for each set. ........................................................................................ 104
Table 5.1. Calculated strain for film 8A (250 °C, 200 sccm, 47 nm) based on
equation 5.1 ........................................................................................................... 109
Table 5.2. Phase volume and crystallite size for Gd2O3 films 11A (0 mA), 11B
(200 mA), 11C (400 mA), and 11D (800 mA) grown on sapphire at 650 °C
and 50 sccm O2 under low growth rate of ~0.5 Å / s as a function of ion beam
source current. ....................................................................................................... 119
Table 5.3. Relative intensities of main cubic peaks for Gd2O3 film 10B (650 C, 50
sccm O2, 910 nm. .................................................................................................. 123
Table 5.4. Films used in pole figure analysis and corresponding in-and-out-of-
plane textures. ....................................................................................................... 126
Table 6.1. Deposition conditions and interfacial layer structure for select Gd2O3
films. ..................................................................................................................... 168
Table 6.2. Summary of process-phase trends describing the effects of temperature,
oxygen flow, and thickness on the morphology of Gd2O3 films deposited at
high rates greater than 5 Å / s. The bolded letters indicate the varied
deposition parameters for each set. ....................................................................... 204

xxiii
Table 6.3. Effect of substrate material on morphology of Gd2O3 film 10A (650
°C, 50 sccm O2, 1.01 µm, 0.5 Å / s). .................................................................... 206
Table 7.1. Dielectric constants for select Gd2O3 films measured at 1 MHz. ............... 211
Table 7.2. Threshold voltage shift (ΔVTH), hysteresis (ΔVH), bulk trapped charge
(Nit), and interface state density (Dit) for select Gd2O3 films. .............................. 218
Table 7.3. Calculated dielectric constant from Schottky and Poole-Frenkel plots
for Si / Gd2O3 / Ti / Au device 9D (650 °C, 200 sccm O2, 2.69 μm). .................. 228
Table 7.4. Response of Gd2O3 and SiO2 MOS-HEMTs to unshielded radiation
(neutrons + γ-rays), shielded radiation (γ-rays only), and calculated neutron
response in both the drain and the gate. ................................................................ 244
Tables in Appendix:
Table B.1. Refractive index for select films measured by ellipsometry. .................... 280

xxiv
Acknowledgements
First and foremost, I would like to thank my advisor, Dr. Douglas Wolfe for his
guidance during the span of my Ph.D work. His support and encouragement were
instrumental for the achievement of the dissertation goals and for my growth as a
professional researcher. I have learned many things under his mentorship and hope to
have the honor of working with him in the future. Thank you.
I would like to thank my dissertation co-advisor and committee member Dr.
Joshua Robinson for his substantial contributions and helpful scientific discussions. I
would also like to thank my other committee members, Dr. Michael Lanagan and Dr.
James Adair for their suggestions and guidance.
I would like to acknowledge the staff members in the ARL Advanced Coatings
Department who have helped tremendously throughout the course of this work. I would
like to extend a special thanks to Thomas Medill who initially trained me on the Denton
EB-PVD system and provided countless hours of technical assistance as well as valuable
insight into thin film processing and many other areas. I would like to thank Anna
Stump for her extensive help with materials characterization. I would also like to express
my gratitude to Scottie Showers for his help in the lab. I would like to thank the fellow
graduate students (Michael Schmitt, Michael Reedy, Nan Butler, and Joyce Lin) and
undergraduates in the Advanced Coatings laboratory that I have worked with over the
years.
I would like to acknowledge the Electro-Optics Center (EOC) of Penn State. It
was a pleasure working with Dr. David Snyder, Zachary Hughes, Kathleen Trumbull,
Greg Pastir, and Dillon Nichols. Their work in electrical fabrication and characterization

xxv
was essential towards the dissertation work. I would also like to acknowledge the work
done by the staff at the Penn State University Radiation Science and Engineering center,
most notably by Brenden Heidrich. I would also like to acknowledge the modeling work
performed by Dr. Igor Jovanovic and Ed Cazalas which provided useful insight into the
radiation induced phenomena. I would like to acknowledge the technical staff at MRI and
MCL, especially, Dr. Xiaojun Weng who was instrumental to the TEM work.
I am extremely thankful to my parents, Ilan and Yarona Grave, and my sister,
Lidar. Without their continued support, I would not be where I am today and achieving
these goals would not have been possible. Thank you. I would like to express a sincere
thanks to my friends, you know who you are.
Lastly, I would like to thank the Defense Threat Reduction Agency (DTRA)
which sponsored this research under contract number DTRA01-03-D-0010-0022 and
the Eric Walker fellowship program of the Applied Research Laboratory at the
Pennsylvania State University for allowing me this great opportunity.

1
Chapter 1
Introduction
Detection of special nuclear materials (SNM) has been of interest since the
inception of nuclear technology. Special nuclear materials decay by spontaneous fission
which results in neutron emission. As a result, efficient neutron detectors are needed to
detect nuclear weapons technology and deter proliferation of illegal nuclear material.
Significant research has advanced radiation technology through the introduction and
optimization of ionization chambers, proportional counters, scintillation detectors,
photomultiplier tubes, and semiconductor diode detectors.1 However, no technology has
emerged as a viable replacement to the costly state-of-the-art 3He gas-filled proportional
detector. Gadolinium-based materials are particularly attractive for solid state neutron
detection due to gadolinium's high thermal neutron capture cross section.1 Despite the
attractiveness of Gd2O3 for solid state neutron detection, little work has been achieved on
understanding of the relevant process-structure-property relationships of the material for
use in radiation detection.
The basis for incorporation of Gd2O3 into a neutron detector relies on the Gd atom
– neutron interaction. Absorption of a neutron by a Gd nucleus results in a number of
interactions, one of which is the simultaneous emission of a conversion electron and a
gamma ray.2 Figure 1.1 shows the schematic drawings for two different types of detector
test structures that both operate on the basis of this reaction. In Figure 1.1a, the Gd2O3
film is deposited on a silicon substrate and electrical contacts are made to the front and
back. Due to Gd2O3’s insulating nature, if enough conversion electrons-hole pairs are
created and swept to the device terminals under an applied bias, it is possible to measure

2
an electrical current. This phenomenon is known as radiation induced conductivity (RIC)
and has been observed experimentally in other oxide systems.3 The low cost and ease of
scalability of silicon electronics makes this detector very appealing if adequate neutron
detection efficiencies can be met.
Figure 1.1. Schematic showing radiation test structures based on (a) silicon-based
electronics and (b) AlGaN/GaN based electronics. Figures not drawn to scale.
Another promising class of materials for radiation detection is based on the group
IIIa-nitride compound semiconductors: aluminum nitride (AlN), gallium nitride (GaN),
and their alloy, AlGaN. Polarization of the GaN/AlGaN system induces a high density of
electrons called the 2 dimensional electron gas (2DEG) at the interface between the two
materials.4 These electrons contain extremely high mobilities due to the absence of
ionized impurity scattering and are very sensitive to external charge. Incorporation of
GaN/AlGaN semiconductor quantum well (QW) structures with radiation sensitive
materials such as Gd2O3 that generate charged particles in the presence of radiation could
be ideal for enabling the future development of highly sensitive, miniature detector
architectures. The test structure pictured in Figure 1.1b is a high electron mobility
transistor (HEMT) based on the AlGaN / GaN system. Each test structure is composed of

3
source and drain materials (known as ohmic contacts), a gate metal (Ti/Au), and a gate
dielectric (Gd2O3). The current in the 2DEG channel is modulated by applying a bias to
the gate. Therefore, in addition to the current collection measured between drain and gate
as a result of neutron interaction in the gate dielectric, charge injection into the highly
sensitive 2DEG can result in a much higher collection efficiency by monitoring the drain-
source current during irradiation.
Since neutron absorption is directly linked to film density and volume, thick films
are needed to ensure proper capture of reaction products. Indeed, the mean free path of a
neutron in Gd2O3 is approximately 7.7 μm.5 However, since Gd2O3 has gained interest as
a candidate for the replacement of SiO2 in the metal oxide semiconductor field effect
transistor (MOSFET), the deposition of Gd2O3 films reported in the literature have been
for either epitaxial or polycrystalline films with thicknesses below 100 nm.6–8
Therefore,
many of the difficulties and issues associated with the deposition of thick films have not
yet been addressed.
As film thickness increases, film structural stability becomes a much larger issue
due to increased intrinsic growth stresses.9 The effects of grain growth, film porosity,
crystallographic texture, phase, and surface roughness on film properties must be
considered. Stability at the interface between the film and the substrate becomes critical
with increasing film thickness as to avoid cracking or film delamination. Increased
probability of incorporated microscopic defects into the film may add difficulty in
maintaining stoichiometry and can significantly alter film electrical, optical, and
structural properties. Understanding the cause and role of these defects will allow for
improved film quality and device performance. In addition to neutron detection, thick

4
Gd2O3 films have potential for use in other technological fields. For instance, Gd2O3 is a
promising candidate for use in optical coating systems due to its large experimentally
measured band gap and transparency in the ultraviolet spectrum.10–12
Possible
applications include UV anti-reflective coatings13
and photoluminescent phosphors.14
Prior to the development of a neutron radiation detector, the properties of thick
Gd2O3 films must be well understood and device performance characterized and
optimized for radiation detection. Therefore, the goals for this work are three-fold:
1) Develop process-structure-property relations of micron thick Gd2O3 films
deposited by reactive electron beam-physical vapor deposition (EB-PVD).
a. Create a process window for deposition of Gd2O3 films by
investigating deposition parameters such as substrate type, substrate
temperature, oxygen flow, deposition rate, and ion beam power.
b. Determine the effects of processing on the crystallographic phase,
texture, crystallite size, surface roughness, density, composition, and
interfacial structure of the Gd2O3 films.
c. Determine the effects of processing and structure on the film electrical
and optical properties.
2) Investigate the electrical properties and performance of thick Gd2O3 film
incorporation into silicon-based MOS capacitors and GaN / AlGaN high
electron mobility transistors (HEMTs).
3) Assess the fundamental interaction of neutron and gamma radiation with
Gd2O3 microelectronic devices.

5
To address these goals, the outline for the thesis will be as follows:
Chapter 2 will provide background material for the basis of the work. It will
begin with an overview of current state of the art radiation detectors and the advantages
and disadvantages of the proposed gadolinium oxide detector. This will be followed by
background material on the structure, properties, and phase stability of gadolinium oxide.
After this, a description of film deposition processes, with particular emphasis on the
growth of films by electron beam physical vapor deposition will be covered. This will
lead into an overview on previous deposition of Gd2O3 thin films in the literature. The
last section will cover electrical properties of oxide films and associated microelectronic
device performance.
Chapter 3 will discuss the experimental methods used to perform this work. The
first section will describe the electron beam physical vapor deposition system used in this
work and outline the deposition process. An overview of the materials characterization
techniques used in this work will then be given. Next, the techniques used to fabricate
the microelectronic Gd2O3 devices and the electrical characterization methods will be
discussed. Finally, an overview of the radiation testing set up and procedure will be
reviewed. The chapter will end with a description of the design of experiments used in
the dissertation work.
Chapter 4 is a discussion of the process phase relationships observed in the Gd2O3
films deposited under a range of deposition conditions. θ-2θ X-ray diffraction (XRD)
analysis was used to investigate the effect of deposition temperature, oxygen flow rate,
film thickness, and substrate on the crystallographic phase, orientation, and crystallite
size of Gd2O3 films. Quantitative Rietveld analysis was employed in order to determine

6
phase volume. Grazing incidence x-ray diffraction (GIXRD) was used to identify a
thickness dependent crystallography in the Gd2O3 films through depth profiling.
Chapter 5 will provide evidence for the deposition of micron thick single phase
cubic Gd2O3 films. This was linked to the effects of adatom mobility and residual stress
on the Gd2O3 film phase stability. Demonstration of a stress induced phase change using
ion beam assisted deposition will be presented. Finally, pole figure analysis was
employed to determine the in and out-of-plane orientation of the Gd2O3 films.
In chapter 6, the effects of film processing on Gd2O3 film morphology,
composition, and interfacial chemistry will be presented and related to the
crystallographic phase and texture results from chapters 4 and 5. Scanning electron
microscopy (SEM) was used to examine the morphology, grain size, and thickness of the
films and related to the Structure-Zone model.15
Atomic force microscopy (AFM) was
used to characterize the surface roughness. Transmission electron microscopy (TEM)
was used for film structure determination, phase identification, interfacial structure, and
composition. Energy dispersive spectroscopy (EDS) and X-ray photoelectron
spectroscopy (XPS) were used to investigate the Gd / O ratio of the films. The results
from the materials characterization techniques were correlated with film processing.
In chapter 7, the effects of film processing and structure on the electrical
properties of the Si(111) / Gd2O3 / Ti / Au and GaN / AlGaN / Gd2O3 / Ti / Au MOS
capacitors were examined. Current-voltage-temperature (I-V-T) measurements were
performed to investigate the leakage current and conduction mechanisms present within
the devices. Capacitance-Voltage (C-V) techniques were used to examine frequency
dependent dielectric properties such as dielectric constant and dielectric loss. The device

7
performance of GaN / AlGaN / Gd2O3 / Ti / Au HEMTs with respect to the requirements
for neutron detection was examined. Finally, the response of the HEMT devices to
gamma and neutron radiation was studied.
Chapter 8 will provide a bulleted summary of the important conclusions that
resulted from this work and will then conclude with directions for future work. This will
include discussion of fundamental research pertaining to optimizing the structure and
properties of the Gd2O3 films through processing. Suggestions will be given to improve
the performance of the Gd2O3 electronic devices. Furthermore, interesting new pathways
for scientific exploration that originated from the dissertation work will be explored.

8
Chapter 2
Background
The literature review in this chapter will begin with a discussion on the current
state-of-the-art in neutron detection and comparisons will be made to the gadolinium
oxide (Gd2O3) based device discussed in this work. Next, the phase stability of bulk
Gd2O3 will be reviewed. Specific detail will be given to phase transitions observed in
rare earth oxides due to temperature, pressure, and ion irradiation. This will be followed
by a general overview of oxide thin film deposition coupled with a literature review on
the deposition of Gd2O3 thin films and their properties. Lastly, dielectric properties and
charge transport in Gd2O3 microelectronic devices will be discussed and related to
neutron detection.
2.1. Radiation detection
Detection of gamma and neutron radiation has been of interest since the inception
of nuclear technology. As a result, significant research has advanced radiation
technology through the introduction and optimization of ionization chambers,
proportional counters, scintillation detectors, photomultiplier tubes, and semiconductor
diode detectors.1 Helium-3 (
3He) has been the benchmark for new neutron radiation
sensitive materials since its first use in detectors in 1955, and has been widely available
commercially for nearly 40 years.1 Although
3He detectors can reach efficiencies of 80%
using high pressure and expensive high purity 3He gas, long term stability issues resulting
from gas leakage and electronegative poisoning can reduce 3He detectors efficiencies to
10-15%.16
In addition, the high voltages required for operation, large detector footprint,

9
high pressures, and sensitivity to micro-phonics make the detector undesirable for air
transport and field deployment. Silicon-based solid-state detectors have also been
developed which improve upon the robustness, power consumption, and energy
resolution compared to their scintillator and ionization chamber counterparts.1 Recently,
boron-10 (10
B) doped solid state materials have also shown promise for neutron
detection, and have demonstrated higher detection efficiencies than their He3 counterpart
under the same conditions.17
As shown in Figure 2.1, semiconductor-based solid state detection has superior
energy resolution as compared to gas proportional detectors and scintillators. This higher
energy resolution allows for distinguishing between various radiological threats too
difficult to resolve using other techniques – especially when the signatures are of low
intensity.
Figure 2.1. Energy spectrum of detectors illustrating superior energy resolution of the
semiconductor-based detection method.1
A figure of merit for neutron sensitive materials is the capture cross section
(measured in barns (10-28
m2)) and is a direct indicator of the probability of interaction
between a neutron and isotope of choice; thus, as the cross section increases so does the

10
probability of interaction. Materials for radiation detection are chosen based on this
intrinsic property, of which 3He,
10B,
6Li, and
157Gd exhibit some of the largest cross
sections for thermal neutrons.1
Figure 2.2a demonstrates the cross section of these elements as a function of
neutron kinetic energy.18,19
Helium-3, boron-10, and lithium-6 exhibit large thermal
neutron cross sections (5333b, 3840b, 940b, respectively), but it is gadolinium that
exhibits the largest thermal neutron capture cross section - elemental Gd ~ 49700b and
157Gd ~ 259000b. The interaction of a neutron with any of the aforementioned elements
results in the ejection of one or more charged particles and gamma radiation (Figure
2.2b). Because of its large capture cross section, gadolinium based materials represent an
attractive choice for the active material in a neutron detector.
Figure 2.2. (a) Neutron capture cross section of gadolinium-157, boron-10, lithium-6, and
helium-3 as a function of neutron energy, and (b) products associated with the
neutron/element reaction (right). Note the large neutron cross section range as a function
of neutron energy for 157
Gd.20
Figure 2.3 directly compares current scintillator and silicon-based solid state
detectors with the Gd2O3-based test structure fabricated in this study. For typical
(a) (b)

11
scintillators, as shown in Figure 2.3a, a gamma ray is absorbed by the scintillator
material, which re-emits the absorbed energy in the form of a visible light photon (i.e.,
gamma ray is converted into detectable light). The light photon is subsequently
converted to an electron (photoelectric effect), which undergoes multiplication (photo-
electrons) to generate a measurable electrical pulse.
Figure 2.3. Schematic representations of (a) scintillator solid state detector, (b) silicon-
based state-of-the-art solid state detector, and (c) Gd2O3 solid state device.
The ideal scintillator material has linear conversion (light yield proportional to energy
over a wide range), is transparent to its own emission wavelength for increased light
collection, has induced luminescence with short decay times for fast signal responses, and
can be made large enough to facilitate component fabrication. Unfortunately, no single
material meets all these requirements. Generally, a scintillator material (such as NaI, or
(a)
(b) (c)

12
oxide-based single crystal) having good linearity and high light output, will have a slow
response time. A more detailed description on scintillators is provided by Birks.21
Charged particle interactions within a scintillator will also create light photons. By
adding a neutron converter such as those shown in Figure 2.3b, scintillators can be used
as neutron detectors. The primary disadvantage of this type of neutron detector is the
poor energy resolution, efficiency degradation due to electron backscattering and color
center formation, long decay times, and slow response. Thermal neutron detection
efficiency of most scintillators is good. However, temperature sensitivities, the required
photomultiplier tube and required high operating voltages, result in poor robustness,
which significantly limits fieldability for many applications.
Current state-of-the-art semiconductor detectors require converter films on top of
a semiconductor PiN or Schottky diode as illustrated in Figure 2.3b.22,23
The probability
of signal generation in the material resulting from incident neutron interaction is directly
proportional to the density of the material, neutron flux, absorption cross section, and
surface area of the detector. Consequently, for a given material quality, sensitivity is
dictated by the size (area and volume) of the detector. While silicon and germanium
detectors have shown good energy resolution, they require significant cooling to reduce
electronic noise in the detector. Silicon carbide and diamond-based detectors have shown
great promise for radiation hard, room temperature solid state detectors; however, to date,
no detector larger than 5 mm2 has been reported.
24,25
Detector size has been limited by
material quality and defects. The required thickness of the semiconductor drift
(collection) region can be prohibitively large. Detection of neutrons (and charged
particles) is heavily dependent on the ability to collect as much signal as possible before

13
the neutron exits the back side of the detector. Impurities, crystalline structure, and
defects in a material can detrimentally affect the ability to achieve collection widths
required for high energy particle detection. Additionally, commercial SiC devices
require bias voltages on the order of 1000 V to achieve collection widths of μm. They
also undergo extensive detector fabrication processes and are extremely expensive (~
$10,000 for a one 2-inch wafer).26
A major influence on sensitivity comes from the properties of the converter film,
and current state-of-the-art solid state detectors require that the chemical, structural, and
thickness characteristics of the converter material be optimized for neutron detection.
Highly reactive materials that generate charged particles (, 3H, or protons) are required
for efficient detection of neutrons. The coating performance is a strong function of film
microstructure, and thus processing parameters. Impurities in boron-based converter
films have been reported to significantly reduce converter film sensitivity, and it can be
expected that this effect will be similar in other films of interest.27,28,29
To date, research
has focused on the optimization of converter film thickness; however, little has been
accomplished on structural and impurity optimization of the films.
The Gd2O3 based solid state system developed in this dissertation and shown in
Figure 2.3c requires no converter film because the active, Gd2O3 film converts neutron
radiation and detects the interaction simultaneously. Due to Gd2O3’s insulating nature, as
electron-hole pairs are created in the film and swept to the device terminals under an
applied bias, it is possible to measure an electrical current. This phenomenon is known
as radiation induced conductivity (RIC).30
100% of the charge associated with a neutron-
gadolinium (n/Gd) interaction (i.e. conversion efficiency) should be measured in this

14
active layer solid state detector, which results in increased detection efficiency, as
opposed to 50% in the solid state detectors which employ a Gd conversion layer. This is
due to the emission of the reaction products, gamma ray and conversion electron, at 180°
away from each other. Furthermore, gadolinium oxide (Gd2O3) is stable at high
temperatures under oxidizing environments, and thus an attractive alternative to the
environmentally unstable, pure Gd metal. Gd2O3 has also been applied to polymer-based
substrate materials at room temperature, can be doped with other rare earth oxide
materials allowing for tailorability. Also, it can be used for applications where visible
transparency is important (i.e., protective eyewear, windshields, building windows and
architecture, road signs, etc).22
However, for development of a Gd2O3 based thick film
neutron detector, an understanding of the process-structure-property relationships of
Gd2O3 is necessary to synthesize high quality films.
2.2. The crystal structure of gadolinium oxide (Gd2O3)
The rare earth metals include the lanthanide elements (atomic number Z=57-71),
scandium (atomic number Z=21) and yittrium (atomic number Z=39).31
The metals
received their name because most of them were originally isolated from rare minerals in
the 18th
and 19th
centuries although many of the elements are not particularly rare in the
present day. The lanthanides have typically been segregated into two groups, the light
rare earth elements (Z=57-63) and the heavy rare earth elements (Z=64-71). Most of the
rare earths have electronic configuration [Xe]6s24f
* with the 5d orbital remaining vacant
and the electrons filling into the 4f orbital.32
Gadolinium is an exception with electronic
configuration [Xe]6s24f
75d
1 to retain a half-filled f-orbital. Gadolinium is a malleable

15
and ductile silvery-white metal. The crystal structure of gadolinium under ambient
conditions is hexagonal close packed (HCP) until 1262 °C, where it transforms to a body
centered cubic (BCC) structure. The density of Gd is approximately 7.89 gm / cm3 and
the melting point is 1312 °C.33
Rare earth metals are typically extremely reactive with oxygen.34
Therefore, the
rare earth oxides have extremely high stability in oxidizing environments and under high
temperatures. Most binary rare earth oxides employ an ion with a trivalent state with
formula R2O3 where R is a rare earth metal, though divalent and tetravalent states are
possible. The trivalency of the cations and similarity in ionic radii allow for significant
solid substitution of rare earth elements for each other into various lattices, and is the
reason why multiple rare earth elements are often found in the same minerals.
The phase stability of the rare earth binary oxides at ambient temperature and
pressure depends on the cation and anion radius ratios.35
Figure 2.4 displays the phase
diagram of the binary rare earth oxides under standard pressure.36
The following phases
are typically found for rare earth oxides at temperatures below 2300 °K: the hexagonal
(A) phase (space group P32/m), the monoclinic (B) phase (space group C2/m), and the
cubic bixbyite (C) phase (space group Ia3). The small rare earth cations typically favor
the C or B phase at ambient conditions while the larger cations favor the A phase. As
shown in Figure 2.2, for bulk Gd2O3 under standard pressure, the low temperature
thermodynamically stable phase is the cubic (C) structure. Between 1472 and 2373 °K,
Gd2O3 exists in the monoclinic (B) phase. Above 2373 °K, Gd2O3 is reported to be of the
hexagonal (H) phase (space group P63/mmc). Another phase transition to the cubic (X)
phase (Im3m) has been observed at slightly higher temperatures before the melting

16
temperature. For the remainder of this dissertation, reference to the cubic phase will be
exclusively towards the bixbyite (C) (space group Ia3) phase as it is the only cubic phase
observed in this work.
.
Figure 2.4. Phase diagram for rare earth binary oxides as a function of cation atomic
number under standard pressure.36
It is important to note the difference in the crystal structures of the Gd2O3 phases
since they are vastly different from one another and may possess significant differences
in their properties. The cubic bixbyite (C) Gd2O3 structure shown in Figure 2.5a, space
group Ia3, is identical to the fluorite lattice structure, except with one fourth of the anion
sites vacant. It contains 32 metal atoms and 48 oxygen atoms per unit cell. The resulting
coordination is six for gadolinium and four for oxygen. The monoclinic Gd2O3 structure
shown in Figure 2.3b, space group C2/m, has sevenfold coordination of the cation, with
three unique Gd sites. The oxygen site is four, five, or six coordinated.

17
Figure 2.5. Crystal structures of Gd2O3 in (a) cubic C phase (space group Ia3) and (b)
monoclinic B phase (space group C2/m). The oxygen and gadolinium coordination for
each phase is shown next to the unit cells. Red corresponds to oxygen atoms and gray
corresponds to gadolinium atoms.
(a) Cubic (C) Phase (Ia3)
(b) Monoclinic (B) Phase (c2/m)
Oxygen Coordination (4)
Gadolinium Coordination (6)
Oxygen Coordination (4, 5, 6)
Gadolinium Coordination (7)

18
The cubic to monoclinic phase transition is reconstructive with bond breaking,
accompanied by a change in the Gd coordination from six to seven as well as a decrease
in the molar volume by approximately 8%. The hexagonal (A) phase, space group
P32/m, has Gd in seven coordination while the oxygen is four and five coordinated. The
change in molar volume between the A and B phase is relatively small, approximately
2%. Unsurprisingly, the CB transformation has been reported to be irreversible while
the BA transformation is reversible.37
As a result, while Gd2O3 can exist at room
temperature in either the monoclinic or the cubic phase, the hexagonal phase cannot be
quenched in at room temperature. Table 2.1 provides select properties of cubic and
monoclinic Gd2O3. One possible advantage that the monoclinic phase has over the cubic
phase for neutron detection is its greater density. An increased number of gadolinium
atoms in the same volume provide an increased probability of neutron absorption which
could increase detector efficiency. However, the poor symmetry of the monoclinic phase
may result in worse packing density and potentially undesirable electrical properties in
thin film form.
Table 2.1. Properties of Gd2O3 bulk ceramic at standard pressure
Cubic (C)
Monoclinic (B)
Space group Ia3 C2/m
Temperature (°C) <1250 >1250
Density (g / cm3) 7.62 8.35
Unit Cell Volume (106 pm
3) 1264.27 432.43
Lattice parameter (Å) a = 10.81 a = 14.06, b = 3.57, c = 8.76
2.3. Phase transitions in bulk Gd2O3
Since the structure of the Gd2O3 phases are quite different from one another and
may possess different properties, it is important to understand what dictates the phase

19
stability of the material. In addition to temperature, phase transitions in Gd2O3 have also
been induced due to shock38
, pressure37,39
, and ion irradiation.36
For instance, the
dependency of Gd2O3 phase on pressure was studied via a diamond anvil experiment.39
Gd2O3 powder was placed inside a diamond anvil cell and hydrostatic pressure was
applied. An irreversible phase transition from the cubic (C) phase to the hexagonal (A)
phase was observed between 7 and 15 GPa. After release of the pressure, a spontaneous
transformation occurred to the B phase as shown by the diffraction patterns in Figure 2.6.
The authors correlated this pressure induced phase transition to the relative lattice
energies of the three phases.
Figure 2.6. Diffraction pattern showing phase change from C phase to A phase with
increasing pressure and formation of B phase upon pressure release.37
Phase transformations in Gd2O3 have also been observed by ion irradiation. Very
recently, the CB transformation was induced in Gd2O3 via means of swift heavy ion
irradiation (2.25 GeV Au ions).36
The exact nature of the phase transition was not
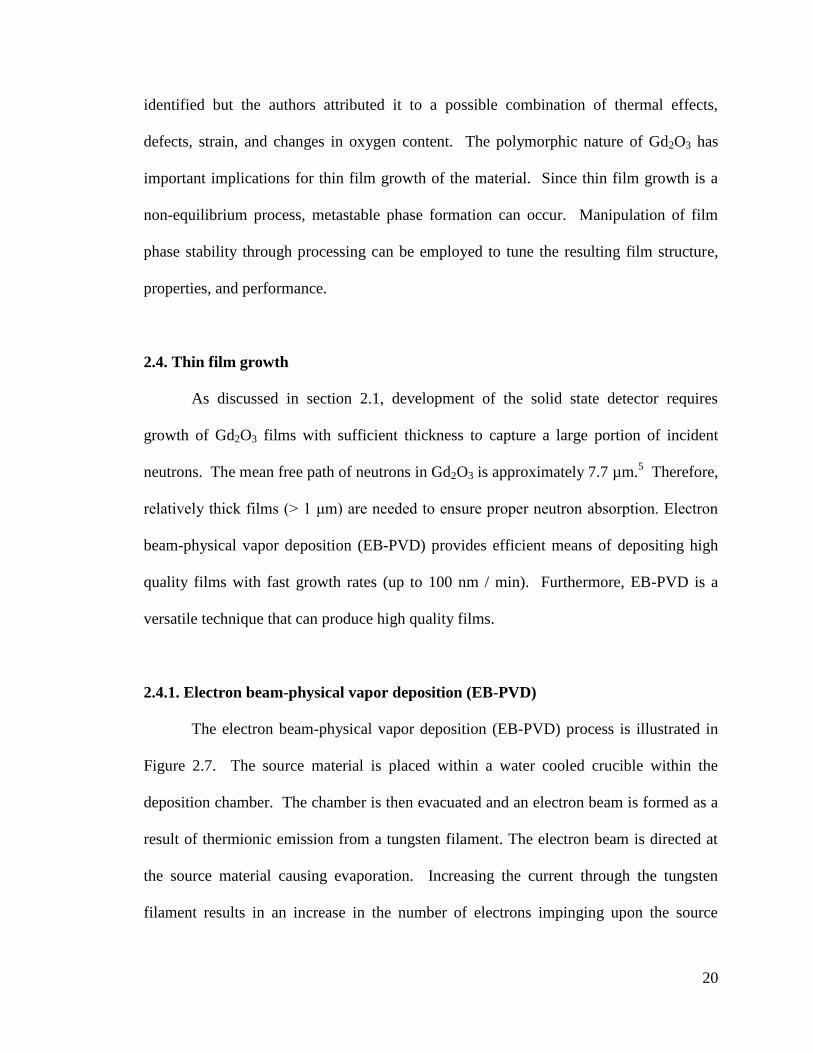
20
identified but the authors attributed it to a possible combination of thermal effects,
defects, strain, and changes in oxygen content. The polymorphic nature of Gd2O3 has
important implications for thin film growth of the material. Since thin film growth is a
non-equilibrium process, metastable phase formation can occur. Manipulation of film
phase stability through processing can be employed to tune the resulting film structure,
properties, and performance.
2.4. Thin film growth
As discussed in section 2.1, development of the solid state detector requires
growth of Gd2O3 films with sufficient thickness to capture a large portion of incident
neutrons. The mean free path of neutrons in Gd2O3 is approximately 7.7 µm.5 Therefore,
relatively thick films (> 1 μm) are needed to ensure proper neutron absorption. Electron
beam-physical vapor deposition (EB-PVD) provides efficient means of depositing high
quality films with fast growth rates (up to 100 nm / min). Furthermore, EB-PVD is a
versatile technique that can produce high quality films.
2.4.1. Electron beam-physical vapor deposition (EB-PVD)
The electron beam-physical vapor deposition (EB-PVD) process is illustrated in
Figure 2.7. The source material is placed within a water cooled crucible within the
deposition chamber. The chamber is then evacuated and an electron beam is formed as a
result of thermionic emission from a tungsten filament. The electron beam is directed at
the source material causing evaporation. Increasing the current through the tungsten
filament results in an increase in the number of electrons impinging upon the source

21
material; this in turns increases the rate of evaporation. The electron beam gun is
electromagnetically deflected according to the Lorentz force towards the evaporant
material, in which enough kinetic energy is imparted by the beam of electrons into the
material to cause evaporation. Due to the change in localized pressure, the atoms then
rise and deposit on the substrate. The process is performed under sufficient vacuum
(typically greater than 10-3
Torr) to ensure large mean free path of the evaporated species.
EB-PVD of gadolinium oxide can either be performed via a direct method where the
Gd2O3 material is evaporated directly onto the substrate from the oxide source or through
a reactive method where the gadolinium metal is evaporated and reacted with background
oxygen gas to form an oxide film on the substrate surface.
Figure 2.7. Schematic of electron beam-physical vapor deposition process.40

22
2.4.2. Atomistic description of thin film growth
Thin film processing determines the manner in which the evaporated atoms
condense on the substrate and form the resulting film structure. Therefore, development
of process-structure-property relationships for thin films must begin with an
understanding of how the processing parameters affect growth at an atomistic level. Film
growth by EB-PVD can be described in the following steps:
1) The evaporated species absorb on the film surface
2) The adsorbed species diffuse along the film surface until they are incorporated in
the film
3) A reaction occurs between the adsorbed species forming chemical bonds
(chemisorption)
4) Nucleation and Growth
5) Film develops morphology and structure
6) Diffusion within bulk film or interfacial reaction with the substrate
Adjusting the processing parameters can impact each of the above steps.
Beginning with step 1, the evaporated atoms can either adsorb on the film or substrate
surface or they can be re-evaporated (Figure 2.8). The atoms that initially adsorb are
weakly bonded to the substrate or film (physisorption). At this point, these atoms can
desorb, diffuse across the surface, or condense as part of the growing film. The
desorption rate is a function of the bonding energy between the film and substrate,
surface temperature, and arrival rate of the incoming atoms. Atoms that do not desorb
and are mobile on the film surface are called adatoms and are responsible for the film
growth.

23
Figure 2.8. Schematic showing the stages of film growth.
41
Each adatom sits within an energy well on the surface of the substrate or film.
This well is separated by an energy barrier from adjacent energy wells by some barrier.
The atoms oscillate within the wells due to thermal oscillation. If an atom acquires
enough energy to overcome the barrier, it may hop to an adjacent site resulting in surface
diffusion (step 2). The surface mobility and diffusion length of the adatoms are
determined by a number of factors. For instance, as the substrate temperature increases,
the surface mobility increases due to an increased hopping rate. However, too high of a
substrate temperature can result in increased desorption which has the ability to limit
surface mobility as well. If the evaporant flux to the film surface is high or a background
gas is present, the adatoms may collide with another atom, which reduces the surface
mobility and diffusion length. Therefore, a lower evaporation rate and lower gas flow is
favorable for higher surface mobility.
The adatoms condense on the surface by losing energy through the formation of
chemical bonds, also known as chemisorption (step 3). This can occur through bonding
to the substrate, bonding to the film, collision with other adatoms, or bonding at
preferential nucleation sites (defects, steps, grain boundaries, etc.). Addition of atoms to
the growing surface creates additional surface energy. Therefore, nuclei of a critical size

24
must be formed in order to stabilize the film. The nucleation rate is controlled by the
processing parameters. Increased deposition temperature results in an increased critical
nuclei size and a lower nucleation rate. Higher deposition rates result in a decreased
critical nuclei size which leads to an increase in nucleation rate.
The initial stages of film nucleation and growth are dominated by minimization of
surface energy, or more specifically; the surface energy of the substrate free surface (γs),
the surface energy of the film free surface (γf), and the surface energy of the
substrate/film (γi) interface. Three different types of growth modes exist depending on
the magnitudes of these surface energies. If γs > γf + γi, then the film will wet the surface
to lower the surface energy and the film will grow layer by layer (Frank van der Merwe
growth). If γs < γf + γi, then the atoms will be more strongly bound to each other, and
form three dimensional islands (Volmer-Weber growth). Lastly, when γs is
approximately equal to γf + γi, the films will undergo mixed growth, where they initially
grow layer by layer, and then form islands after a few monolayers are deposited
(Stranski-Karstanov growth). At this point, it is more appropriate to move towards a
macroscopic description of thin film growth to explain the formation of film structure and
morphology (step 5).
2.4.3. Macroscopic description of thin film growth and Structure-Zone model
While evaporated thin films are initially accurately described by the growth
modes described in section 2.4.2, once films reach a certain thickness, they may be
described by the Structure-Zone model. The Structure-Zone model was first introduced
by Movchan and Demchisin42
and subsequently modified by Thornton43
and Messier.15

25
The Structure-Zone model given by Thornton as a function of pressure and substrate
temperature is shown in Figure 2.9. It is important to note that the Structure-Zone model
is only applicable to polycrystalline and amorphous films as there are no zones in
epitaxial thin films.
Figure 2.9. Structure-Zone model for vapor deposited coatings. The schematic contains
both a top side and cross sectional view.44
Zone 1, where the deposition temperature, T, is < 0.2 of the melting temperature,
Tm, is characterized by thin (10 - 20 nm), fibrous, columnar grains separated by voids.
This structure arises from low adatom mobility and shadowing effects, meaning that open
boundaries between the columns are formed and cannot be filled in due to the low
mobility. As the films grow thicker, the columns may span the full length of the film
thickness, but the grain size within the column can still remain small (< 20 nm) or the
column may even contain amorphous material.40

26
Zone T, where T < 0.4 Tm, is similar to that of Zone 1 with small fibrous grains.
However, there is less voiding due to the slight increase in surface diffusion. Due to the
small nanometer sized grains, this structure has a large grain boundary volume. Zone T
is an intermediate step between Zones 1 and 2, and is typically observed in sputtered
films rather than evaporated films.
Zone 2, where T < 0.7 Tm, exhibits a columnar microstructure with wide columns.
In this region, surface diffusion is a dominating factor in film growth. The added surface
mobility allows for densification of the columnar boundaries, which reduces the voiding
within the film. The grain size increases, and the crystallinity is improved. The
increased surface mobility allows for the atoms to rearrange themselves in low energy
orientations. Indeed, certain crystallographic planes may grow faster than others due to
reduced surface energy, and from this, preferred orientation or texture may arise.
In zone 3, where T > 0.7 Tm, substantial surface and bulk diffusion occurs. This
results in significant grain growth and densification leading to an equiaxed grain
structure. The columns may consist of single crystals that span the entire length of the
film thickness.
While the Structure-Zone model has been accurate in predicting the structure of
numerous vapor deposited materials, it is a phenomenological model and therefore, it
should be taken simply as a guide. It is possible that exceptions to the model exist
depending on the type of material being deposited and variations in the film processing
conditions. No previous work had been completed on the applicability of the Structure-
Zone model to Gd2O3 films until the author’s work45
, which will be discussed in great
detail in chapter 6.

27
2.4.4. Residual stress in thin films
With the development of film structure and increased film thickness, the residual
stress of thin films becomes an important consideration. Residual stress is defined as the
stress remaining in a thin film after the growth process. Residual stresses are important
because they can affect the structure46
and properties of thin films.47
Residual stresses in
thin films are a summation of the intrinsic, extrinsic, and epitactic components of residual
stresses. Intrinsic residual stresses refer to stresses that arise in the material during the
growth process. This can be affected by numerous factors including the density of the
film, nucleation and growth, grain size, crystallographic texture, phase transitions,
defects, atom impingement, surface morphology, and compositional differences.
Extrinsic stresses are due to external factors such as coefficient of thermal expansion
(CTE) mismatch between the film and substrate, lattice mismatch, and interfacial
structure / chemistry. Epitactic stresses are stresses that arise due to epitaxy and can be
disregarded for amorphous or polycrystalline films. It is difficult to measure the intrinsic
components of residual stress due to the complexity and number of contributing
mechanisms. Extrinsic stresses, however, can generally be estimated since CTE
mismatch is typically the major contribution to extrinsic stress. The effects of residual
stress on Gd2O3 thin films were found to have a significant effect on film phase stability
and will be discussed in detail in chapter 5.
2.5. Gadolinium oxide (Gd2O3) thin films
Gadolinium oxide films have been investigated thoroughly as a replacement for
SiO2 as a gate dielectric as a result of the downscaling of complementary metal-oxide-

28
semiconductor (CMOS) devices. Therefore, most of the published work on the deposition
of Gd2O3 until this point has been focused on the deposition of less than 100 nm thick
films for use as high K gate dielectrics. Several different methods have been used to
deposit Gd2O3 films including electron beam-physical vapor deposition (EB-PVD)7,
pulsed laser deposition (PLD)48
, chemical vapor deposition (CVD)49
, atomic layer
deposition50
, and magnetron sputtering51
on a variety of substrate materials. Deposition of
amorphous6, epitaxial
52, and polycrystalline
8 Gd2O3 films has been observed and will be
discussed in greater detail in the following sections.
2.5.1. Epitaxial gadolinium oxide films
Thin film epitaxial Gd2O3 deposited on silicon has been extensively investigated
for microelectronic use. For very thin (4.5 nm) Gd2O3 films deposited on silicon (111)
by molecular beam epitaxy (MBE), growth of the cubic bixbyite phase with a two
dimensional in-plane epitaxial relationship is observed due to the small lattice
mismatch.53
Epitaxial Gd2O3 on Si(111) exhibits an A/B twinning relationship where B
orientation is related to the substrate A by a 180° rotation around the surface normal.
Epitaxial relationships have also been found to exist for Gd2O3 grown on Si(100) and
Si(110).53
The leakage currents for the Si / Gd2O3 / Pt metal-oxide-semiconductor (MOS)
capacitors were found to be 0.4, 0.5, and 4.5 mA / cm2
for Si(001), Si(111), and Si(110)
substrates, respectively.
Gd2O3 films were also grown epitaxially by electron beam physical vapor
deposition (EB-PVD) under ultrahigh vacuum (UHV) conditions on GaAs(100)
substrates.54
The Gd2O3 film grew in the bixbyite phase and was (110) oriented with

29
single domain epitaxy. These films were characterized by a breakdown field of 4 MV /
cm and possessed leakage currents of ~10-9
A / cm2
at zero bias.
Gd2O3 films have also been grown epitaxially on GaN substrates in cubic55
,
monoclinic56
, and hexagonal57
structures. A 76 nm thick cubic Gd2O3 film was grown
epitaxially on GaN via metalorganic chemical vapor deposition (MOCVD) with
orientation Gd2O3(111) || GaN(0001). The large bond length mismatch resulted in a film with
a high density of dislocations. This reduced the breakdown field of the oxide to 0.3 MV /
cm. The dielectric constant of the film was 11.4.55
Another group reported the growth of
10 nm thick single crystal monoclinic Gd2O3 heteroepitaxially on GaN with orientational
relationship Gd2O3(-402) || GaN(0001).56
These films possessed a low leakage current of 4.6
x 10-9
A / cm2
at 1 MV / cm and a dielectric constant of ~17. Another study succeeded in
stabilizing the high temperature hexagonal (H) phase using epitaxy on a GaN substrate.57
They deposited a 3 nm thick hexagonal film with epitaxial relationship Gd2O3(0001) ||
GaN(0001). The film possessed a significantly higher dielectric constant of 24. The ability
to grow cubic, monoclinic, and hexagonal Gd2O3 films through epitaxy highlights the
polymorphic nature of Gd2O3, which must be taken into consideration for processing of
polycrystalline Gd2O3 films.
2.5.2. Polycrystalline gadolinium oxide films
The growth of thin polycrystalline Gd2O3 has been shown to yield cubic,
monoclinic, and mixed phase films.58
100-300 nm thick polycrystalline Gd2O3 films
deposited by metalorganic chemical vapor deposition (MOCVD) on silicon(111) and
fused quartz substrates resulted in cubic Gd2O3 with C(222) texture. The C(222) texture

30
was attributed to the minimization of surface energy. In another study, ~30 nm thick
polycrystalline Gd2O3 films deposited on Si(001) substrates by magnetron sputtering
deposition exhibited mixed cubic and monoclinic phases.8 An increase in the deposition
temperature from 450 °C to 570 °C resulted in an increase of the monoclinic phase, and
change from C(222) texture to M(-402) texture. The transition to monoclinic phase was
accompanied by a significant decrease in the dielectric constant from 17 to 9 and an
increase in the leakage current by nearly one order of magnitude (from 2 to 13 mA / cm2
at -6 V). In comparison, Li et al. investigated the effect of oxygen concentration on the
properties of ~70 nm thick polycrystalline Gd2O3 films deposited on Si(100) by
magnetron sputtering deposition at a deposition temperature of 650 °C.51
An increase in
the amount of cubic phase was observed with increasing oxygen partial pressure.
However, the dielectric constant for all deposited films was approximately 12, regardless
of oxygen content, suggesting no correlation of dielectric constant to crystal structure
which is in contrast to Yue et al.8 As shown by these studies, thin film structure and
properties can differ significantly depending upon deposition methods and processing
parameters.
Another important consideration for growth of Gd2O3 films on silicon substrates
are interfacial reactions. Wu et al.59
observed an amorphous silicate interfacial layer
between the silicon substrate and a 30 nm thick Gd2O3 film deposited by direct EB-PVD.
Annealing at 900 °C in oxygen for 2 minutes resulted in a complicated multilayer
structure consisting of oxide layers, silicate layers, and SiO2 rich layers. It has been
suggested that ultra-high vacuum (UHV) may be necessary to grow Gd2O3 without an

31
interfacial layer on silicon.60
Furthermore, the extended time required for deposition of
thick films needed for neutron detection could result in additional interfacial reactions.
2.5.3. Amorphous Gd2O3 films
Gd2O3 films have also been deposited in the amorphous phase without long range
order. One study showed that a 4.6 nm thick amorphous Gd2O3 film deposited by direct
electron beam physical vapor deposition resulted in improved surface roughness over
epitaxial thin films.6 The leakage current density was also improved by 3 orders of
magnitude, 10-6
A at 1 V. The dielectric constant of this film was found to be 14. The
author is not aware that any other reports regarding amorphous Gd2O3 films, possibly
suggesting that Gd2O3 may crystallize fairly easily during thin film growth.
2.5.4. Phase transitions in thin film Gd2O3 during growth
In section 2.5.1, it was shown that epitaxial stabilization of metastable Gd2O3
phases was possible. Interestingly, a number of reports have detailed the existence of
phase transitions due to changes in film thickness. During the epitaxial growth of Gd2O3
on Ge, Molle et al. reported initial growth of the thermodynamically stable cubic phase
followed by a transition to the monoclinic phase above a critical film thickness of 8.8
nm.61
This was attributed to strain, but the mechanism was not investigated further. In
another study, Gd2O3 films deposited on GaN (0001), transformed from the hexagonal
phase to the cubic phase at a critical film thickness of approximately 3-4 nm.62
A similar
phase transition from hexagonal to monoclinic phase was observed when the film

32
thickness increased from 2 nm to 6 nm for single crystal Gd2O3 deposited on GaAs
(111).63
Naturally, differences in Gd2O3 phase volume have resulted in various film
morphologies and electrical properties. Recently, a study investigated the effect of film
thickness in very thin epitaxial layers grown on Si(111).64
A large increase in dielectric
constant was found (13 to 20) for very small thicknesses (below 8 nm) as compared to
thicker films. This was attributed to a possible strain induced structural change into the
monoclinic phase before eventual relaxation into the bulk cubic phase, which is the
reverse direction of the transition mentioned previously by Molle.61
The aforementioned
results suggest that the strain and residual stress in Gd2O3 films can alter the phase, and
therefore, the properties of the Gd2O3 films. Indeed, we will show in chapter 5 that
residual stress plays a crucial role in determining the phase stability of Gd2O3 films.
Understanding the mechanisms that govern structural and crystalline growth in
Gd2O3-based films may be essential towards optimizing film properties for a specific
application, such as radiation detection. Furthermore, the change in molar volume from
cubic Gd2O3 to the monoclinic phase is approximately 8%. For films with sufficient
thicknesses, transformations with such drastic changes in volume may result in cracking
or failure. Since solid state neutron radiation detection devices incorporating Gd2O3 may
utilize films that are several microns thick, the ability to control the phase and resulting
properties of thick films is highly desirable.

33
2.6. Dielectric properties
The metal-oxide-semiconductor (MOS) capacitor consists of a semiconductor
substrate, insulating film, and a metal electrode referred to as a gate as shown in Figure
2.10. The MOS capacitor is not widely used by itself in modern electronics, but is
instead sandwiched between two p-n junctions to form a MOS transistor. However,
measurement of MOS capacitor properties can provide significant information about film
properties through study of the dielectric properties and conduction mechanisms within
the devices.
Figure 2.10. Schematic of a MOS capacitor.
Characterization of the dielectric properties of MOS capacitors can yield
information about the film dielectric constant, dielectric loss, and the types of defect
present within the material. In a C-V measurement, a voltage is applied to the gate metal
and the capacitance is measured. A typical capacitance-voltage (C-V) curve of a MOS
capacitor with an n-type semiconductor substrate is shown in Figure 2.11. The MOS
capacitor undergoes three distinct modes of operation when the bias is swept to sufficient
voltages. When the bias attracts the majority charge carriers, the capacitance measured is
the capacitance across the dielectric film only and the MOS device is in accumulation.
Semiconductor
Oxide
Metal

34
With the device in accumulation, the dielectric constant of the film can be calculated
provided the thickness of the film and area of the device are known. When the bias
begins to force majority charge carriers away, the MOS device enters depletion and the
capacitance decreases. The capacitance decreases due to the depletion of charge at the
oxide-semiconductor interface. After all of the charge carriers have been depleted from
the semiconductor, the minority carriers begin to accumulate at the interface, forming an
inversion layer.
Figure 2.11. C-V curve for a MOS capacitor with n-type substrate showing three regions
of capacitor operation.
Since charges in the oxide cause a shift in the gate voltage required to reach the
threshold condition, the C-V measurement can provide information about the fixed oxide
charge, oxide trapped charge, mobile charge, and interface trapped charge. A shift in the
flatband voltage can be attributed directly to the presence of fixed oxide charge within the
film. Fixed oxide charge is often a result of oxygen vacancies or broken bonds. The
C/Coxide
-VG VG Applied Gate Voltage
Accumulation Inversion
Depletion

35
presence of hysteresis as shown in the CV curve in Figure 2.12 can be attributed to either
mobile charges within the oxide or interface trap states. Interface traps typically cause
“smearing out” of the C-V curve, meaning that the transition from accumulation to
depletion is no longer sharp. Combining the C-V measurement with conductance-voltage
(G-V) measurement enables extraction of interface state density.
Figure 2.12. Hysteresis in CV curves as a result of trapped oxide charge.
2.7. Conduction in metal oxides
Understanding how Gd2O3 conducts charge is extremely important for
optimization of a neutron detector to improve charge transport and detection efficiency.
Metal oxides can be conducting, semiconducting, or insulating. Like the other rare earth
oxides, Gd2O3 is a dielectric insulator with a large bandgap (5.4 eV or greater).65
The measured current in a MOS capacitor can be the result of a number of
different conduction mechanisms. Charge carriers within an oxide can either be intrinsic,
meaning they belong to the insulator, or extrinsic, meaning they are injected from the
C/Coxide
-VG VG Applied Gate Voltage

36
electrodes. For intrinsic charge carriers, the conduction is ohmic and the charge carrier
density is low.
Extrinsic conduction leads to two types of conduction mechanisms in the MOS
structure. The first is where the electrodes act as an infinite source of electrons. In this
case, conduction is governed by the bulk of the oxide. The second type of conduction is
where the electrodes limit carrier injection into the oxide. These two types of conduction
are referred to as bulk-limited and electrode-limited conduction.
A schematic detailing energy level transitions for different conduction
mechanisms is shown in Figure 2.13.66
The bulk limited conduction mechanisms include
hopping conduction67
, space charge limited current68
, and Frenkel-Poole conduction.69
The electrode limited mechanisms include Schottky (thermionic) emission70
, tunneling66
,
and Fowler-Nordheim effect.71
Figure 2.13. Energy level transitions for different conduction mechanisms. Ev is the
valence band, Ec is the conduction band, Ef is the Fermi level, and qɸ is the Schottky
barrier height.66

37
2.7.1. Bulk-limited conduction mechanisms
In bulk-limited conduction, at low fields, the I-V characteristics should be ohmic
as long as the electrode can readily supply carriers. This is generally explained by
hopping conduction, where electrons move from one trap to the other without excitation
into the conduction band as shown in Figure 2.13e. The ohmic current saturates when all
carriers can be driven through the insulator for an applied bias. Hopping conduction can,
however, be non-ohmic in nature when carrier distribution throughout the oxide grows
due to increasing temperature or voltage.
2.7.1.1. Space charge limited conduction (SCLC)
Space charge is defined as electrical charge distributed through the oxide. This
charge is thought of as a continuum of charge rather than specific electrical point charges.
Essentially, an electron cloud is created throughout the material creating a space charge
region. This typically only occurs in dielectrics because in metals, this charge is quickly
neutralized.
If leakage throughout the dielectric is bulk limited, the characteristics of the
current flow are governed by electrons in the conduction band. The concentration of
charge carriers in the conduction band are largely affected by the energy of the trap
levels, the concentration of trap levels, and the injection of electrons into these traps.
Typically, it is quite difficult to elevate electrons into the conduction band by thermal
transition or tunneling due to large energy barriers. However, if the oxides have a large
trap density, electrons can be activated into the conduction band with small activation
energies as shown in Figure 2.13f. Space charge limited conduction is typically observed

38
in room temperature or below since a low density of charge carriers causes charge
unbalance quite easily. However, due to increased charge trap density in rare earth
oxides, this can also be observed at high temperatures in these materials.
For SCLC, the current voltage relationship will be proportional to J~Vn
where n =
2 for discrete traps. If traps are distributed in the middle of the band gap, then n may be
greater than 2. In order to fit the curve to SCLC mechanism, log (J) versus log (V) is
plotted. The resulting plot will be linear with the slope equal to the exponent n if the
SCLC mechanism is dominant.
2.7.1.2. Frenkel-Poole conduction
For Frenkel-Poole conduction, we will again assume the case of perfect ohmic
contacts that are able to inject charge without any potential barriers at the electrode film
interface. Electrons are trapped in localized states within an insulator and require thermal
fluctuations to reach the conduction band. Once an electric field is applied, the charge
carriers escape their trap state by overcoming a potential barrier into the conduction band
as shown in Figure 2.13d. Once in the conduction band, the electrons can move into a
lower energy trap state. This mechanism is, therefore, thermally activated and governed
according to equation 2.1:
𝐽 = (𝑞𝑁𝐶𝜇)𝐸𝑜𝑥 [−𝑞(ɸ−√𝑞𝐸𝑜𝑥/𝜋𝜀𝑟𝜀0
𝑘𝐵𝑇] Eq 2.1
where J is the current density, q is the electronic charge, Nc is the density of states in the
conduction band, μ is the electronic drift mobility, Eox is the electric field across the
oxide, π is a constant, ɸ is the trap energy level, 𝜀𝑟 is the oxide dielectric constant, 𝜀0 is

39
the permittivity of free space, kB is Boltzmann’s constant, and T is the measurement
temperature.
In a large electric field, however, the electron does not need as much thermal
energy to overcome the potential barrier and escape to the conduction band. For fitting
the Frenkel-Poole curves, log (J/E) is plotted vs E1/2
. This gives a linear plot. The
accuracy of this plot can be checked by calculating the dielectric constant from the given
slope. If the calculated dielectric constant is reasonably close to the measured dielectric
constant, it is likely that Frenkel-Poole is the dominating conduction mechanism.
2.7.2. Electrode-limited conduction mechanisms
2.7.2.1. Schottky emission
The interface between two materials may have a potential barrier known as a
Schottky barrier as shown in Figure 2.13a. Similar to the case of Frenkel-Poole
conduction, application of a bias will allow the charge carries to overcome this barrier.
This mechanism is also thermally activated. Schottky conduction can be shown by the
equation 2.2:
𝐽 = 𝐴∗𝑇2𝑒𝑥𝑝 [−𝑞(ɸ−√𝑞𝐸𝑜𝑥/4𝜋𝜀𝑟𝜀0
𝑘𝐵𝑇] Eq 2.2
where J is the current density, A* is the Richardson constant, T is the measurement
temperature, q is the electronic charge, ɸ is the Schottky barrier height, Eox is the electric
field across the oxide, π is a constant, kB is Boltzmann’s constant, 𝜀𝑟 is the oxide
dielectric constant, and 𝜀0 is the permittivity of free space. By plotting log (J) versus E1/2
,
one can derive the linear slope of the graph and calculate the dielectric constant. Similar

40
to Frenkel-Poole, the accuracy of the dielectric constant can be checked to determine if
Schottky emission is a dominating conduction mechanism
2.7.2.2. Fowler-Nordheim tunneling
Fowler-Nordheim Tunneling is another electrode-limited or interface-limited
conduction mechanism. Instead of overcoming a potential barrier in the classical sense,
the charge carriers are tunneled through from the electrode Fermi level directly into the
conduction band as shown in Figure 2.13c. Fowler-Nordheim tunneling is governed
according to the equation 2.3:
𝐽𝐹𝑁 = (𝑞3𝐸2
8𝜋ℎ𝜙𝐵) ∗ exp(
−8𝜋√2𝑞𝑚𝑜𝑥
3ℎ𝐸𝜙𝐵3/2
) Eq 2.3
where J is current density, q represents the elementary charge, E represents the applied
electric field within the insulator, π is a constant, 𝜙𝐵is the voltage barrier that an electron
must overcome to move from atom to atom within the insulator, 𝑚𝑜𝑥 is the effective
mass of an electron in the insulator, and h is Planck’s constant.
To check for this conduction mechanism, log (J/E2) versus -1/V is plotted. A
linear region suggests the presence of Fowler-Nordheim Tunneling. Since there is no
temperature dependence for FN tunneling, any thermal gradient cannot be attributed to
this conduction mechanism.

41
Chapter 3
Experimental methods
This chapter discusses the experimental methods used to perform the dissertation
work in detail. The first section covers the basics of film deposition by reactive electron
beam-physical vapor deposition as well as details about the processing conditions. The
second section covers the materials characterization techniques used to analyze the
Gd2O3 films. Then, a brief description of the electrical test structure fabrication process
is given. Finally, the electronic characterization and radiation testing techniques
employed will be discussed.
3.1. Film Deposition
3.1.1. Electron beam-physical vapor deposition (EB-PVD)
A schematic of EB-PVD equipment used for the Gd2O3 depositions is shown
Figure 3.1. The vacuum chamber (Denton Vacuum, Inc. (DV-SJ/26)) is approximately
30 inches high and 26 inches wide with a volume of approximately 0.3 m3. The chamber
and most of the components within it are made of stainless steel. The inside of the
chamber is covered with aluminum foil to keep contaminants from adsorbing to the
chamber walls and to assist with easy chamber clean-up. There are two window ports on
the chamber door and one port on the side for viewing of the deposition process. Glass
plates are placed over the viewports to prevent film deposition since they are inexpensive
and easily removable. The substrate holder was a 6” diameter stainless steel platen used
to accommodate the various substrates during the deposition process.

42
Within the deposition chamber, a stainless steel heater with a molybdenum
element was used for elevated temperature depositions. A vapor shield is used to protect
the inside of the heater walls from evaporant material deposition. The upper temperature
limit of the heater is 650 °C. There are four water-water cooled graphite crucibles (25
cubic centimeters) contained in the source manifold.
Figure 3.1. Schematic of the Denton vacuum EB-PVD system.
When one crucible is exposed to the 270° deflected electron beam, the other three
remain shielded by the copper housing. The four crucibles allow for the deposition of
thick films which require more material than is available in one crucible without the need
to vent the chamber. Additionally, the other crucibles can be used to deposit multilayers
of different materials. The electron beam (Temescal model STIH-270-2MB) is generated

43
from an emitter assembly which consists of a beam former and an electron-emitting
tungsten filament.
3.1.2. Reactive electron-beam physical vapor deposition
Gadolinium oxide (Gd2O3) films were deposited on heavily doped, 2” diameter
0.002–0.008 Ω-cm resistivity, n-type (111) silicon wafers (Silicon Inc.), 9 x 9 mm GaN /
AlGaN quantum well structures, 2” diameter sapphire C-cut wafers, and 1” x 1” quartz
substrates (Ted Pella Inc.) via reactive electron beam physical vapor deposition. Prior to
Gd2O3 film deposition, the substrates were cleaned in an acetone bath for four minutes,
followed by an iso-propanol (IPA) bath for 1 min. The substrates were then rinsed with
de-ionized water and dried with high purity (99.9999%) N2 gas. The silicon samples were
etched in diluted HF solution (BOE 6:1) for 30 seconds before being rinsed with DI water
and dried with N2. The samples were then placed in the substrate holder. The mask is
shown in Figure 3.2. There are four locations for 2” diameter wafers (Si or sapphire), one
location for the 1”x1” quartz substrate and seven locations for 9 x 9 mm pieces typically
used for GaN / AlGaN or Si(111).
A gadolinium metal ingot (Hefa Rare Earth), purity 99.99%, weighing between 25
and 30 g was placed in a graphite crucible and used as the evaporant material. Additional
crucibles were used for depositions requiring films thicker than 5 µm as the source
material would begin to oxidize during the deposition resulting in a smaller melt pool
(and thus lower flux) and a distortion of the vapor plume leading to non-uniform film
deposition. Therefore, when the melt pool began to shrink, the crucible was changed to
provide a fresh pot with unoxidized Gd metal to maintain the Gd flux. Two quartz

44
crystals were installed in the crystal thickness monitor before every deposition for
measuring insitu film thickness.
Figure 3.2. Digital image showing the substrate holder used in Gd2O3 EB-PVD
experiments which can accommodate four 2” wafers, one 1” x 1” substrate, and seven 9 x
9 mm substrates.
After the samples were loaded into the deposition chamber and positioned within
the heater, the chamber was first evacuated using a mechanical pump to a pressure of
approximately 10-3
Torr. Subsequently, the base pressure was pumped below
6 × 10− 6
Torr by use of a cryogenic pump. Cold water was flowed throughout the
chamber walls to keep the chamber cooled and to prevent damage. During elevated
temperature deposition, the sample temperature was ramped up and the samples allowed
2” diameter sapphire wafer
2” diameter silicon wafers
1” x 1” quartz substrate
9 x 9 mm GaN / AlGaN substrate
6” diameter wafer mask

45
to soak at temperature for 10 minutes before starting the deposition process. Ultra high
purity O2 (99.9999%) was introduced to the chamber through an inlet tube 15 seconds
before opening of the deposition shutter. This was done to allow the Gd metal atoms to
react with oxygen to form the gadolinium oxide, i.e. reactive EB-PVD. Select
depositions where more oxygen was required involved flowing additional oxygen
through the ion beam manifold. The deposition pressure varied between 10− 4
and
10− 6
Torr depending on O2 flow rate (10-200 sccm) whereas the deposition temperature
was varied between ambient and 650 °C depending on experimental conditions. The
source to substrate distance was 12.5 inches (31.75 cm). In situ film thickness was
monitored through use of a quartz crystal thickness monitor (QCM) in conjunction with
the IC 6000 deposition controller. The IC-6000 allows for the programming of up to 6
different film programs with 37 adjustable parameters. While the IC-6000 has the
capability to run in automated mode, all depositions in this work were performed in
manual mode. In manual mode, the operator controls the electron beam current and
resulting deposition rate. During the deposition process, the deposition rate, gas flow,
chamber pressure, and source material were constantly monitored.
3.1.3. Direct electron beam-physical vapor deposition
Select depositions were completed via a direct evaporation method utilizing a
Gd2O3 source rather than Gd metal. The Gd2O3 source material (Cerac Inc., 99.99%
purity) consisted of a large number of small pellets packed into a graphite crucible. The
Gd2O3 and Gd source material after extended deposition in oxygen environments are
shown in Figure 3.3.

46
Figure 3.3. Digital images of (a) Gd2O3 and (b) Gd source material after direct and
reactive evaporations, respectively.
As can be seen in Figure 3a, during the direct evaporation of Gd2O3, substantial
dendritic growth is observed as well oxygen deficiency in the source material
characterized by the metallic black outerlayer. The dendritic growth has potential to
cause a distorted vapor plume resulting in an uneven film thickness, composition, texture,
and morphology. Therefore, most of the work in this thesis focused on reactive
deposition of Gd metal with oxygen due to the good, uniform melt pool during
evaporation as shown by the divot in the Gd source material in Figure 3b. The dendritic
growth in the Gd2O3 source material could possibly be a result of phase transformation
within the Gd2O3 from the cubic to the monoclinic phase which was discussed in section
2.2, and has a molar volume change of approximately 9%. To mitigate this behavior and
to minimize the change in plume geometry, a rod source could be used during
evaporation.
3.1.4. Ion beam assisted deposition (IBAD)
Select depositions utilized ion beam assistance using a Denton CC-101 cold
cathode ion source. The CC-101 is able to produce ion beams of Ar+, N
+ and O
+. The
Gd2O3 Gd metal
Graphite crucible
(a) (b)

47
ions are used to bombard the substrate during deposition to increase adatom mobility,
increase film density, control crystallographic orientation, and impart stress into the film.
Gas is introduced into the ion beam source (IBS) chamber where it is ionized by a high
voltage field between the cathode and anode. An extraction grid, a 100 mm diameter
meshed stainless steel grid, covers the IBS exit port. As the ionized gas exits the IBS, the
extraction grid serves as an electron getter. It collects the electrons which in turn creates
a potential that helps accelerate the ionized species towards the substrate.
3.2. Materials characterization
A variety of analytical materials characterization techniques were used to
determine the phase, structure and properties of the Gd2O3 films. X-ray diffraction
(XRD) was used for the determination of film crystallographic structure, film texture, and
residual stress. Raman spectroscopy was used to assist in phase identification. Scanning
electron microscopy (SEM) was use to characterize top surface and fracture surface
morphology as well as extract film thickness. Atomic force microscopy (AFM) was used
to investigate film surface roughness. Transmission electron microscopy (TEM) in
conjunction with energy dispersive x-ray spectroscopy (EDS) and electron energy loss
spectroscopy (EELS) was used to analyze film structure, orientation, and interfacial
chemistry. EDS was also used during SEM analysis to evaluate bulk Gd / O ratio in the
films. X-ray photoelectron spectroscopy (XPS) was used to evaluate chemical state and
Gd / O ratio of the Gd2O3 films. A wafer curvature technique was used to measure the
film residual stress. UV-Vis spectroscopy and ellipsometry were used to determine the
band gap and refractive index of the films, respectively.

48
3.2.1. Scanning electron microscopy (SEM)
SEM is essential for the analysis of film microstructure and morphology. Both top
surface and fracture surfaces of the Gd2O3 films were studied. Two field effect scanning
electron microscopes were used for analysis of the Gd2O3 films. SEM (JEOL 6700F)
surface morphology was used in conjunction with Clemex Vision analytical software for
grain size determination. Clemex allows for automated analysis of grain size based on
image contrast. Ten SEM images (magnification 50000x) were obtained from various
locations on the sample surface for determining the average grain size. A LEO 1530
FESEM was also used for surface and fracture surface characterization when higher
resolution images were required.
3.2.2. Transmission electron microscopy (TEM)
TEM was used to analyze the structure, interfacial chemistry, and phase of the
Gd2O3 films. TEM cross-sectional specimens were prepared using conventional
mechanical polishing followed by Ar ion milling in a PIPS ion thinner. Cross-sectional
TEM, selected area diffraction (SAD), scanning transmission electron microscopy
(STEM), energy dispersive x-ray spectroscopy (EDS), and electron energy loss
spectroscopy (EELS) were performed in a JEOL-2010F field-emission TEM/STEM
equipped with a EDAX XEDS system and a Gatan Enfina 1000 EELS system. Both
XEDS and EELS were performed under STEM mode using an electron probe with a
nominal size of 0.5 nm. The EEL spectra were collected with a dispersion of
0.2 eV/channel and a resolution of ∼1.4 eV. The semiconvergence angle was 7.25 mrad
and the collection angle was 6.92 mrad for the EELS acquisition. High-angle annular

49
dark-field (HAADF) STEM images were collected with an inner detector radius of 63.5
mrad. The microscope operation energy was 200 kV for all studies. TEM work was
performed by Daniel Grave and Dr. Xiaojun Weng, Materials Research Institute, Penn
State University.
3.2.3. Focused ion beam (FIB)
Focused ion beam was used to investigate the cross sections of select Gd2O3 films
when traditional wafer cleaving methods and fracture surfaces were not sufficient. An
FEI Quanta 200 3D dual beam FIB was used to prepare the cross sections. Before ion
milling, a metallic protective layer was applied to the film in order to create a clean cross
section. The cross sections were milled using a 30kV Ga ion beam. Subsequent to cross
section preparation, the samples were studied via SEM.
3.2.4. Atomic force microscopy (AFM)
AFM (Digital Instruments Dimension 3100) was used for evaluation of surface
morphology and roughness analysis. The AFM was operated in tapping mode under
ambient conditions. AFM scans were completed over 1 µm2, 5 µm
2, and 10 µm
2 areas on
the sample surface. Additionally, select scans were completed on a Bruker Dimension
Icon AFM using PeakForce tapping mode, a novel technique where the tapping
oscillation is performed at frequencies significantly below the cantilever resonance
(which extends cantilever lifetime). Scanasyst AFM tips with a resonance frequency of
50 - 90 kHz and a spring constant of 0.4 N/m were used.

50
3.2.5. X-ray diffraction (XRD)
A number of X-ray diffraction techniques were used in this work for analysis of
film phase, preferred orientation, crystalline grain size, residual stress, and texture
evolution. θ-2θ scans were performed on the Gd2O3 films using a Phillips MRD-XRD,
type PW3040/00. A copper anode was used as the x-ray source. Scans were collected
from a 2θ angle of 10 degrees to 90 degrees with operating voltage / current of 40kV / 45
mA. The step size was 0.02° and the time step was 1 second. The x-ray beam was set for
1.2 mm x 10 mm horizontal and vertical divergence, respectively. When higher
resolution was needed for the θ-2θ scans, select samples were scanned over the same 2θ
range using a Phillips Empyrean diffractometer with a PIXcel 3D detector.
Scherrer's formula72
was used to determine and correlate the XRD crystallite size
with the measured grain size of the films:
𝐷 =𝐾𝜆
𝐵𝑐𝑜𝑠𝜃 3.1
where D is the grain size, K is the shape factor, λ is the X-ray wavelength, B is the
difference in the instrumental broadening and crystallite size broadening, and θ is the
Bragg angle. K was taken to be 0.9 and λ to be 1.54056 Å for Cu radiation. The
instrument broadening contribution obtained from a diffraction pattern of a standard
packed Si powder was subtracted from the full width half maximum (FWHM) of the
analyzed peaks.
For films deposited on single crystal substrates, diffraction peaks from the
substrate were observed if the film thickness was small enough. Therefore, the x-ray
depth of penetration for Gd2O3 was calculated using the mass attenuation coefficient of
Gd2O3. Figure 3.4a displays the film thickness from which 99% of the intensity originates

51
for a given angle 2θ. Figure 3.4b shows the X-ray penetration depth at angle 28.4° 2θ,
the substrate peak for Si(111). As can be seen from this graph, one can expect to see
some diffraction from the substrate up until a Gd2O3 film thickness of approximately 1.5
µm. For sapphire wafers which have a substrate peak at approximately 41 degrees, one
can expect to see diffraction from the substrate for film thicknesses of approximately 3
µm.
Figure 3.4. (a) Gd2O3 film thickness from which 99% of the intensity originates as a
function of angle 2θ and (b) percentage of diffracted intensity as a function of Gd2O3 film
thickness at the Si(111) peak position.
(a)
(b)

52
Grazing incidence (GIXRD), or 2θ-only, X-ray diffraction scans were also
performed using a Phillips X’Pert MRD-XRD, type PW3040/00, diffractometer. In 2θ-
only scans, the incident angle of diffraction is held constant, and only the detector moves.
This gives diffraction from other planes which are not just oriented parallel to the
substrate surface. In a perfectly randomly oriented sample, the peak positions and
relative intensities from both the θ/2θ and 2θ-only scans would match. However,
significant texturing is observed in some of the deposited Gd2O3 films, and therefore, 2θ
scans can yield significant information about the film structure and orientation.
Additionally, since the incident angle of diffraction is controlled, the depth of penetration
can be varied. Scans were performed at incedence angles of 1, 2, 5, 10, and 15 ° for
depth profiling of the Gd2O3 films. This is especially useful for the deposited Gd2O3 films
since a thickness dependent crystallography was observed.
Pole figure measurements were also performed on select Gd2O3 films to
determine both out-of-plane and in-plane texture. The scans were performed using a
Phillips X’Pert MRD-XRD, type PW3040/00, diffractometer. Pole figures were taken
using sample tilts of 0 – 85° in 5° steps with azimuthal rotation from 0 – 355° with a step
size of 1° and step time of 1 second. The operating voltage / current were 40 kV / 45 mA,
respectively. The x-ray beam was set for 1.2 mm x 10 mm horizontal and vertical
divergence, respectively

53
3.2.6. Raman spectroscopy
Raman spectroscopy (WiTec alpha300 Confocal Raman instrument) was used to
observe changes in the vibrational modes of the Gd2O3 films to assist in phase
identification. A laser beam with wavelength 488 nm was directed at the deposited films,
and the light from the illuminated spot was collected in a lens and dispersed onto a
detector. The shift in the laser was used to identify the vibrational modes in the material
which gives information about its phase, residual stress, and crystallinity. The
wavelength of the excitation laser used was 488 nm combined with a 100 × objective
yielding a lateral resolution of 325 nm. Integration times were 1 min with a laser power
of 25 mW.
3.2.7. Energy dispersive x-ray spectroscopy (EDS)
Energy dispersive x-ray spectroscopy (EDS) was used to determine the Gd / O
ratio in the Gd2O3 films. Fractured sections of Gd2O3 films deposited on Si(111) were
attached to a large 2” diameter stainless steel stub, which can hold up to 12 samples at
one time, for EDS characterization. The samples were then sputter coated with carbon.
Silver paste was applied to make a conducting path from the Gd2O3 film to the stub. The
stub was mounted in the ESEM FEI 2000 chamber and then evacuated and the sample
surface was imaged. Three EDS scans were taken at different points on the sample for a
collection period of 1 minute and averaged to determine the Gd / O ratio. The oxygen
and gadolinium concentrations were measured relative to a Gd2O3 “standard” 99.99%
pure pellet (Cerac). A few considerations must be taken into account. There may be
some differences in the local environment in the chamber whenever the chamber is

54
vented and then reloaded. Therefore, it is only accurate to compare samples that are
measured under the same conditions. Secondly, the electron beam may penetrate films
that are too thin resulting in skewed data. The additional silicon peak for these samples
may affect the accuracy of the recorded values. Thirdly, these measurements should be
regarded as semi-quantitative since the “standard” may not necessarily be stoichiometric
Gd2O3. Nevertheless, under the same chamber conditions, EDS provides a means to
compare the Gd / O ratio of the Gd2O3 films as a function of processing conditions.
3.2.8. X-ray photoelectron spectroscopy
XPS can yield additional information about the stoichiometry of the Gd2O3 films.
It also can give information about the bonding state in the films. XPS was performed on a
Kratos Axis Ultra XPS (Kratos Analytical Inc., Chestnut Ridge, NY) using Aluminum
Kα (1486.6 eV) as the radiation source. The photoelectrons were analyzed at a take-off
angle normal to the sample plane. Survey scans were recorded for each sample with a
pass energy of 80 eV and step size of 1 eV. An Ar ion beam was used for depth profiling.
Survey scans were repeated periodically throughout the film thickness until the substrate
had been reached. XPS measurements were carried out by Vince Bojan and Tad Daniels,
Materials Research Institute, Penn State.
3.2.9. UV-Vis spectroscopy
UV-Vis spectroscopy is an optical characterization technique which allows the
measurement of transmittance through the sample. Optical transmission measurements in
the wavelength range of 800–190 nm were made on select Gd2O3 films deposited on

55
quartz substrates using a PerkinElmer Lambda 950 UV/Vis/NIR spectrometer in order to
measure the optical band gap value. From this data, (αhυ)2 as a function of hυ was
plotted, where α is the absorption coefficient and hυ is the photon energy. A tangential
line to the absorption edge was drawn to obtain the optical band gap value.
3.2.10. Ellipsometry
Ellipsometry is an optical characterization technique that is used to determine film
thickness and refractive index. A Gaertner L116C variable angle ellipsometer was used
to determine the refractive index of the Gd2O3 films. The measurement setup involves
the illumination of the sample with a 1 mW Ne-He 632.8 nm laser. The laser light was
then reflected into the detector, and the change in polarization of the light was measured.
The measurements were taken at a 50° angle of incidence. Five measurements across the
wafer were taken to obtain the refractive index distribution of the Gd2O3 films.
3.2.11. Residual stress by wafer curvature method
To investigate the relationship between the residual stress state of the films and
the phase stability, a wafer curvature technique was used to measure the residual stress.
The wafer curvature technique allows for the measurement of total residual stress in thin
films, namely the sum of the intrinsic and extrinsic stresses. A Tencor Flexus 2320 laser
wafer curvature system was used to measure the radius of curvature of the silicon and
sapphire wafers before and after film deposition for residual stress calculations. A
schematic of the measurement is shown in Figure 3.5.

56
Figure 3.5. Schematic of wafer curvature measurement using Tencor Flexus 2320.
73
The laser is scanned across the film surface and reflected back to a photodetector.
45mm (90%) of the (50.8 mm) wafer diameter was measured to avoid edge effects.
Assuming a biaxial stress state and a coating thickness much smaller than the substrate,
we employed Stoney’s equation74
to calculate the residual stress:
𝜎 =𝐸𝑠𝑡𝑠
2
6(1 − 𝜈𝑠)𝑎(1
𝑅2−
1
𝑅1)
where Es/(1-vs) is the biaxial modulus of the substrate, ts is the substrate thickness, a is
the film thickness, and R2 and R1 are the radii of curvature after and before deposition.
This method assumes a uniform stress state across the entire film.
3.3. Electrical test structure fabrication
Microelectronic devices based on silicon and GaN / AlGaN electronics were
fabricated for both electrical characterization and radiation testing. Si (111) / Gd2O3 / Ti /
Au MOS capacitors were fabricated using a shadow mask and were used to extensively
study the effects of processing on the electrical properties of the Gd2O3 films. GaN /

57
AlGaN / Gd2O3 / Ti / Au MOS capacitors and high electron mobility transistors (HEMT)
were also fabricated using clean room fabrication techniques. These will be discussed in
more detail in the following sections.
3.3.1. Gd2O3 / Si(111) MOS capacitor fabrication
Subsequent to film deposition, select samples deposited on Si(111) were chosen
for electrical fabrication. Metal-oxide-semiconductor (MOS) capacitor structures were
fabricated by depositing 20 nm Ti / 200 nm Au contacts on top of the Gd2O3 films with a
Kurt J. Lesker Lab 18 electron beam evaporator through a shadowmask making circular
contacts with diameters of 1.5 mm and 3 mm. The Ti/Au multilayer was deposited on the
edge of the wafer (where no oxide film was deposited) to create an adequate bottom
contact. Figure 3.6a shows a schematic of the cross section and Figure 3.6b shows a
digital image of the top view of the device.
Figure 3.6. (a) Cross Sectional Schematic of Si / Gd2O3 / Ti / Au MOS capacitor and (b)
digital image of top view of Si / Gd2O3 / Ti / Au MOS capacitor. The small and large
circular contacts are 1.5 mm and 3 mm in diameter, respectively.
Silicon
Gd2O3 Film
Titanium (10 nm)
Gold (100 nm)
(a) (b)

58
3.3.2. GaN / AlGaN quantum well structures
Microelectronic devices based on GaN / AlGaN quantum well structures were
fabricated for electrical characterization and radiation testing. The first device, referred
to as the “dot-ring” structure, shown in Figure 3.7, contains standard MOS capacitor
structures with circular contacts of varying sizes (ranging from 62.5 μm to 1 mm
diameter) as shown in Figure 3.7. This structure was used primarily for capacitance-
voltage (C-V) and current-voltage (I-V) measurements.
Figure 3.7. Optical microscope image of GaN / AlGaN based “dot-ring” structure with
several MOS capacitors with diameters ranging from 62.5 μm to 1 mm.
The second type of device architecture, referred to as “rad sensor”, shown in
Figure 3.8 contains a number of electrical test structures including the high electron
Gate metal (Ti / Au) with Gd2O3 film underneath
Ohmic contact (Ti / Al / Ni /Au)
GaN / AlGaN
substrate

59
mobility transistors that were used for radiation detection (HEMTs). Both the MOS
capacitor structures and “rad-sensors” were processed using standard lithographic
processes. The process steps were the same except different masks were used for the
lithography steps to create the different test structures.
The top view of the “rad sensor” is shown in Figure 3.8. The four large areas
labeled 1-4 are the high electron mobility transistor (HEMT) devices. The source and
drain contacts are labeled “S” and “D” while the gate contact is labeled “G” for each
device. The architectures of the transistor devices were designed with interdigitated
electrodes of varying geometry so that different device properties such as gate oxide
volume, channel width, and gate length could be studied for the optimization of radiation
detection. These transistor devices are labeled 1-4. For purposes of repeatability, device
4 was used for measuring the GaN / AlGaN HEMTs properties in this dissertation work.
Device 4 has a drain-source spacing of 1 mm and a gate width of 5 μm.
Other device architectures on the chip include two capacitor structures for
standard C-V and I-V measurements with a diameter of 150 μm. One of the capacitor
structures is coated with Gd2O3 while the other is absent of the Gd2O3. Transmission
Line Measurement (TLM) pads were also present for contact and sheet resistance
measurements. The spacing between the various pads was 2.5, 5, 7.5, 10, 15, and 20 μm.
Van Der Pauw structures on the chips are used for Hall measurements to determine
carrier mobility and concentration. Other structures included an RF field effect transistor,
ohmic resistor, and Schottky resistor but were not used in this work.

60
Figure 3.8. Optical microscope image of top surface of GaN / AlGaN based
“rad sensor” structures. The device contains a number of electrical test structures
including four high electron mobility transistors (HEMTs) with different device
geometries, transmission line measurement structures, Van Der Pauw structures, MOS
capacitors, an RF-Field effect transistor, an ohmic resistor, and a Schottky resistor. The
labels S, D, and G correspond to the source, drain, and gate for each of the four transistor
structures.
3.3.3. GaN / AlGaN / Gd2O3 / Ti / Au device fabrication
The bare SiC / GaN / AlGaN substrates (CREE Inc.) were first cleaned with
isopropanol for 2 minutes, and then rinsed with DI water. Then, they were spin coated
with 3012 photo resist at 5000 rpm for 45 seconds and baked at 95 °C for 60 seconds.
Van Der Pauw
GaN
Capacitor
Transmission line measurement structure
Gd2O3 Capacitor
Gd2O3 coated Van Der Pauw
R-F field effect transistor
Ohmic resistor
Schottky resistor
Transistor #1
Transistor #3 Transistor #4
Transistor #2

61
The samples were exposed to ultraviolet (UV) light for 7 seconds using a Suss MA/BA6
contact aligner under the “isolation” mask (see Appendix A) to pattern the sample. After
UV exposure, the samples were developed in CD-26 for 60 seconds, and then cleaned
with IPA and DI water. The samples were then subjected to a chlorine-based reactive ion
etch (RIE) to isolate active regions of the GaN/AlGaN structures using a Tegal PM2
etcher. The etch was performed at pressure of 2 mTorr for 104 seconds to reach an
approximate thickness of 90 nm. Then, the photoresist was stripped using remover PG
and the samples were cleaned in IPA and DI water for 2 minutes each. After isolation
level was established, a lift-off technique was used to pattern the ohmic contacts. The
samples were spin coated with LOR5A photoresist at 6000 rpm for 45 seconds and baked
at 180 °C for 10 min. A second layer of 3012 photoresist was deposited at 6000 rpm for
45 seconds followed by a bake at 95 °C for 60 seconds. The samples were then exposed
to ultraviolet (UV) light for 7 seconds under “ohmic” mask (see appendix A) and
developed / cleaned as detailed earlier. The ohmic metal stack consisting of Ti / Al / Ni /
Au with thicknesses of 15 nm / 100 nm / 50 nm / 50 nm, respectively, were deposited
using a Kurt J. Lesker Lab 18 electron beam evaporator. The samples were then dipped in
PRS-3000 at 90 °C for 20 minutes to dissolve the remaining photoresist leaving only the
metal deposited directly on the GaN/AlGaN substrate. Following the metal deposition, an
ohmic anneal was performed at 875°C for 60 seconds in a nitrogen environment using an
Alwin 21 AG610 rapid thermal annealing system. At this point, the Gd2O3 films were
deposited as previously described in section 3.1. Following the film deposition, the films
were spin coated using SPR 955 at 3000 rpm for 45 seconds. This was repeated twice to
deposit a tri-layer of photoresist. The samples were then patterned using the procedure

62
listed above according to the dielectric etch mask (see Appendix A). The films were then
subject to a chemical etch using a sulfuric acid and water solution at 1:100 ratio. Etching
times varied between ten seconds and two minutes depending on the film. The remaining
photoresist was removed using PRS3000 as described earlier. Finally, the samples were
once again coated with LOR5A and 3012 photoresist as described above. The samples
were then patterned under the “Schottky” mask and Ti /Au with thickness 10 nm / 100
nm was deposited using the Lab 18 evaporator. The photoresist was stripped using
PRS3000, and the samples were cleaned, leaving the final device architecture. A full
detailed process description can be found in Appendix A.
3.4. Electrical characterization techniques
A number of different techniques were used to characterize the Gd2O3 films
deposited on both Silicon and GaN. Capacitance-Voltage (C-V) measurements were
made to measure dielectric constant and loss of the MOS capacitor structures as well as
determine the amount of oxide charges present in the structures. Current-Voltage-
Temperature (I-V-T) measurements were performed on the MOS capacitors as well to
determine the conduction mechanisms within the oxide films.
3.4.1. Capacitance-voltage (C-V) measurements
Capacitance-Voltage measurements were performed on Si(111) and GaN / AlGaN
MOS capacitors. The Keithley Model 4200-SCS Semiconductor Characterization
System was used to obtain C-V measurements for the MOS capacitors. A 4200-CVU
integrated C-V measuring unit was used to extract these measurements. The unit was

63
calibrated to correct for stray capacitances using open and short calibrations. For the Si /
Gd2O3 / Ti / Au MOS capacitors, the dielectric constant and loss was measured as a
function of frequency from 10kHz to 1 MHz with a 20 mV RMS oscillating signal. Due
to the high doping level and degenerative nature of the silicon substrate, depletion was
not possible and therefore, standard C-V sweeps were not performed. An example of the
measurement setup is shown in Figure 3.9
Figure 3.9. Capacitance-voltage (C-V) measurement of Si(111) / Gd2O3 / Ti / Au MOS
capacitor using a Suss PM5 probe station with probes connected to Keithley 4200
Semiconductor Characterization System.
C-V sweeps were performed on GaN / AlGaN / Gd2O3 / Ti / Au MOS capacitors
at a frequency of 1 MHz with a 30 mV RMS oscillating signal using the Keithley Model
4200-SCS Semiconductor Characterization System. The gate voltage bias range

64
depended on the measurement conditions and will be discussed in greater detail in
Chapter 7. A pre-soak was also applied for certain measurements. From the C-V
measurement, dielectric constant, interface trapped charge, fixed oxide charge, and bulk
oxide trapped charge values were extracted.
3.4.2. Current-voltage-temperature (I-V-T) measurements
Current-voltage relationships of the silicon based and GaN / AlGaN based Gd2O3
MOS capacitors were measured as a function of temperature in order to determine DC
conduction mechanisms within the Gd2O3 films. The samples were loaded onto a
Cascade Microtech probe station at the Penn State Dielectric Center. An Agilent
HP4140B pA meter was used to measure the current. The temperature of the stage was
controlled by a Temptronic TP3000A Thermochuck system. The measurements were
fully automated and programmed by GADD software developed at Penn State set to run
on a Windows personal computer.
The details of the I-V-T measurement were as follows: the samples were swept
from -100 V to +100 V at 5 V increments. The samples were held at each voltage for 60
seconds to let the capacitor reach steady-state conditions. Then the current was measured
and the sweep continued. Each I-V sweep was performed at 25 °C increments starting
from 25 °C to a maximum temperature of 200 °C.
3.4.3. Field effect transistor (FET) measurements
After transistor fabrication was completed on GaN / AlGaN substrates, field effect
transistor (FET) measurements were made. The fabricated transistors were depletion

65
mode devices. For depletion mode devices under standard conditions with no voltage
applied, the device is “on”, meaning that current is flowing between the source and the
drain and the channel is conductive. To turn the device “off”, or impede the current flow
between the source and the drain, a large enough negative gate voltage (VG) must be
applied between the source and the gate. This is called the threshold voltage, VT. When
the threshold voltage is reached, the device is “off” and the drain current (ID) is at a
minimum.
These measurements were performed using a Keithley Model 4200-SCS
Semiconductor Characterization System. The gate voltage was swept from +10 V to –50
V in order to turn “off” the device. The voltage was then swept back to +10 V to assess
the stability of the threshold voltage and determine if any hysteresis was present. A
constant 10 V bias was applied between the source and drain during the measurement.
3.5. Radiation testing
Radiation induced conductivity (RIC) in Gd2O3 films was tested by exposing the
devices to gamma and neutron radiation. The irradiations were performed at the Penn
State Breazeale Nuclear Reactor in beam port #7. The reactor is a 1 MW TRIGA Mark
III reactor. The neutron flux present in the beam is controlled by the reactor’s operating
power. Due to the nature of reactor, gamma rays are present as well and can contribute to
the RIC observed in the Gd2O3 devices.
Samples with the best electrical properties were selected for radiation detection.
To prepare the samples for radiation detection, they were packaged using Ceramic Dual
In-Line Packaging (CERDIP) as shown in Figure 3.10a. To perform this, the samples

66
were first attached to the CERDIP using silver paste. A small dot of the silver paste was
applied to the packaging, and the sample was placed face up over the silver paste. The
paste was left for at least 1 hour to let it harden. Next, the corresponding terminals of the
desired devices were wirebonded to the CERDIP pins. A Kulicke & Soffa Inc.
wirebonder was used for wirebonding. The wirebonding temperature was set to 50 °C
and the default power, time, and force settings were used. The wirebonded sample is
shown in Figure 3.10b.
Figure 3.10. (a) Digital image of GaN / AlGaN “rad sensor’ device die attached to Cerdip
packaging and (b) optical microscope image showing wirebonds to GaN / AlGaN /
Gd2O3 / Ti / Au MOS-HEMT terminals.
After wirebonding, the samples were taken to the Pennsylvania State University
Breazeale Nuclear Reactor for radiation testing. Figure 3.11a shows the beam lab and the
pneumatic shutter for beam port #7. The CERDIP devices were placed in a custom built
radiation test box with BNC cabling connected to the Keithley Model 4200-SCS
Semiconductor Characterization System as shown in Figure 3.11b. The radiation test box
(a) (b)

67
was mounted using a custom built fixture in front of the pneumatic beam port shutter.
The table was moved within 6” of the beam hole opening allowing for a precise
alignment with the beam path. In order to decrease the signal resulting from unwanted
radiation interaction with the other electronic components, a few steps were taken to
provide shielding. First, a collimator was inserted into the beam port to bring the
effective beam diameter down to 1.5”. A lead disc approximately 6” thick with an
opening ½” in diameter was placed directly in front of the sample, effectively blocking
all electronics aside from the detector itself as shown in Figure 3.11b. This technique
allowed for precise and repeatable testing.
The samples were irradiated by thermal neutron beam at powers ranging from 1
kW to 100 kW. A bias was applied to the samples and the shutter was opened to record
the change in sample conductivity during irradiation. The shutter was then closed and
this process was repeated for a total of 5 times to look at the prolonged effects of
exposure. Afterwards, a cadmium foil shield was placed in the beam path in order to stop
the thermal neutrons and the experiment was repeated. This allowed for measurement of
the gamma only response. Subsequent to radiation testing, the samples were then
electrically characterized to see if any degradation in device performance occurred.

68
Figure 3.11. Digital images of (a) beam lab housing beam port #7 and (b) radiation
detector fixture with lead shield and cable connections to electronics.
Beam port #7 pneumatic shutter
Direction of neutron beam
Test fixture for device mounting
Radiation test box (Cerdip placed in front facing the beam port)
BNC cables to Keithley 4200
Lead shield with 0.5” diameter hole placed directly in front of sample

69
3.6. Design of experiments
This section discusses the design of experiments used for the deposition of Gd2O3
films. A thorough processing map was established to determine the effects of deposition
conditions on the structure and properties of thick Gd2O3 films. Initially, films were
deposited at ambient temperatures. Films deposited at ambient temperatures underwent
cracking and delamination when the film thickness exceeded 4 µm or when subject to
annealing temperatures of 200 C, making device fabrication impossible. Figure 3.12a
shows a FIB cross section of a 4 µm thick Gd2O3 film deposited at ambient temperature.
As can be seen, the cracking originated at the film/substrate interface and extended
throughout the film, resulting in widespread surface cracking displayed by the optical
microscope image of the top surface of the film in Figure 3.12b
Figure 3.12. (a) SEM image of FIB cross section of thick Gd2O3 film deposited at room
temperature showing the origin of cracks at the substrate/film interface and extending to
the film surface and (b) optical microscopy image of top surface of same Gd2O3 film
showing widespread surface cracking.
Cracking was observed on silicon, sapphire, quartz, and GaN substrates. Due to
the poor structural stability of Gd2O3 films deposited at ambient temperatures, the

70
majority of the work presented in the thesis will focus on films deposited at substrate
temperatures of 250 °C to 650 °C.
The effects of substrate temperature, oxygen gas flow, and film thickness were
initially investigated systematically in four sets with the experimental details summarized
in Table 3.1 Films 1A–D were deposited as a function of varying O2 flow from 50 to
200 sccm at a deposition temperature of 650 °C. Films 2A–E were deposited as a
function of deposition temperature from 250 to 650 °C under a gas flow of 200 sccm.
Table 3.1. Deposition parameters for Gd2O3 films deposited via reactive electron beam
physical vapor deposition. Set 1 is deposited as a function of oxygen flow at a deposition
temperature of 650 °C. Set 2 is deposited as a function of temperature under an oxygen
flow of 200 sccm. Set 3 is deposited as a function of thickness at 250 °C and under 200
sccm O2 flow. Set 4 is deposited as a function of oxygen flow at a deposition
temperature of 250 °C.
Film
#
Deposition
Temperature (°C)
Oxygen flow
(sccm)
Film Thickness
(µm)
Deposition
Rate (Å/s)
1A 650 50 2.05 9.75
1B 650 100 1.73 9.67
1C 650 150 2.03 8.26
1D 650 200 2.05 9.75
2A 250 200 1.26 6.01
2B 350 200 1.23 5.86
2C 450 200 2.44 11.60
2D 550 200 2.46 11.70
2E 650 200 2.05 9.75
3A 250 200 0.58 10.75
3B 250 200 1.11 8.42
3C 250 200 2.10 9.22
3D 250 200 5.12 9.93
3E 250 200 11.01 12.41
4A 250 25 1.36 11.34
4B 250 50 1.67 13.93
4C 250 100 1.29 10.76
4D 250 150 1.39 11.59
4E 250 200 0.76 6.34

71
Films 3A–E were deposited as a function of film thickness from approximately
500 nm to 11 μm at a deposition temperature of 250 °C and 200 sccm O2 flow. Films
4A–E were deposited as a function of varying O2 flow at a deposition temperature of
250 °C. In each set, one variable was varied while the rest were kept constant. While
independent variables such as temperature and gas flow were easily controlled, slight
fluctuations were observed in dependent variables such as deposition rate and pressure.
All samples were found to be stable and did not show any signs of film cracking except
for sample 3E deposited at 250 °C which had a measured thickness of 11.01 μm. In this
work, films as thick as 23μm have been deposited at substrate temperatures of 650 °C
without any observed cracking.
Table 3.2 shows the deposition parameters for set 5. These films were deposited
as a function of temperature from 250 to 650 °C under a gas flow of 200 sccm using a
direct evaporation method where Gd2O3 source material was used instead of Gd metal.
Table 3.2. Deposition parameters for set 5. These films were deposited as a function of
temperature by direct deposition using Gd2O3 as the source material.
Film
#
Deposition
Temperature (°C)
Oxygen flow
(sccm)
Film Thickness
(µm)
Deposition
Rate (Å/s)
5A 250 200 6.08 11.1
5B 350 200 5.20 9.6
5C 450 200 1.68 3.2
5D 450 200 3.67 6.8
5E 550 200 6.63 11.9
5F 550 200 4.27 7.9
5G 650 200 3.34 6.19
Due to the non-fully molten nature of the evaporated source material, the need to
use a sweeping beam pattern, and the growth of dendritic structures in the crucible during
deposition (as discussed in section 3.1.3), it was extremely difficult to control the

72
deposition rate and maintain film uniformity over the entire substrate. Films deposited by
the direct method were found to have comparatively more defects than those deposited by
the reactive method. As a result, the focus of this work will be primarily for films
deposited by the reactive method using Gd metal source material.
Due to the requirements for the development of the microelectronic radiation
detectors, Gd2O3 films with thicknesses of approximately 1 µm were deposited. The
effects of temperature and oxygen flow on these films were studied. Table 3.3 displays
the deposition parameters for sets 6 and 7 which were deposited as a function of
deposition temperature under oxygen flows of 50 and 200 sccm, respectively.
Table 3.3. Deposition parameters for sets 6 and 7 deposited as a function of temperature
by reactive EB-PVD with target thickness of 1 µm. Sets 6 and 7 were deposited under (a)
200 sccm and (b) 50 sccm O2 flow.
Film
#
Deposition
Temperature (°C)
Oxygen flow
(sccm)
Film Thickness
(µm)
Deposition
Rate (Å/s)
6A 250 200 1.07 7.53
6B 350 200 0.90 7.51
6C 450 200 0.85 6.79
6D 550 200 0.69 6.92
6E 650 200 0.87 8.19
7A 250 50 1.11 9.58
7B 350 50 1.08 15.22
7C 450 50 1.07 8.52
7D 550 50 1.10 11.55
7E 650 50 1.20 9.11
In order to investigate the growth mechanisms at the initial stages of film growth,
very thin films less than 50 nm thick were deposited under a number of processing
conditions. These films are referred to as films 8A-8E and the deposition parameters are
listed in Table 3.4.

73
Table 3.4. Parameters for set 8 grown by reactive EB-PVD consisting of films less than
50 nm thick deposited under various conditions.
Film
#
Deposition
Temperature (°C)
Oxygen flow
(sccm)
Film Thickness
(nm)
Deposition
Rate (Å/s)
8A 250 200 47 7.34
8B 250 25 41 6.84
8C 250 50 - -
8D 650 50 - -
8E 650 200 20 3.34
The effects of film thickness on Gd2O3 films deposited at a substrate temperature
of 250 °C were examined in set 3. The effects of film thickness for films deposited at
elevated temperatures were further investigated with the deposition of set 9. Films in set
9 were deposited as a function of film thickness under oxygen flow rate of 200 sccm and
deposition temperature of 650 °C.
Table 3.5. Deposition parameters for sets 9 deposited as a function of thickness by
reactive EB-PVD at 650 °C under oxygen flow of 200 sccm.
Film
#
Deposition
Temperature (°C)
Oxygen flow
(sccm)
Film Thickness
(µm)
Deposition
Rate (Å/s)
9A 650 200 0.38 10.4
9B 650 200 0.59 6.83
9C 650 200 1.02 8.23
9D 650 200 2.69 10.9
9E 650 200 5.72 11.5
As will be shown later, decreasing the deposition rate led to the growth of single
phase cubic films. Set 10 consists of purely cubic phase films approximately 1 µm thick
grown at deposition rates lower than 0.5 Å / s. These films were grown under oxygen
flow rate of 50 sccm. Table 3.6 lists the deposition conditions for set 10.

74
Table 3.6. Deposition parameters for set 10. These films were deposited with very low
deposition rates (<0.5 A / s) in order to deposit single phase cubic films.
Film
#
Deposition
Temperature (°C)
Oxygen flow
(sccm)
Film Thickness
(µm)
Deposition
Rate (Å/s)
10A 650 50 0.91 0.44
10B 650 50 1.01 0.48
Deposition parameters for set 11 are shown in Table 3.7. In this set, the effect of ion
bombardment on Gd2O3 films was examined. The films were grown under similar
conditions to set 10 (650 °C, 50 sccm O2, ~1μm), except with use of the ion source. The
voltage was held float at approximately 500V while the IBS current was varied
systematically from 0 – 800 mA.
Table 3.7. Deposition parameters for set 11. These films were deposited under low
deposition rate (<0.5 A / s) as a function of IBS current. The IBS voltage was held float
at approximately 500V and the current varied from 0 to 800 mA.
Film
#
Deposition
Temperature (°C)
Oxygen flow
(sccm)
Film
Thickness
(µm)
Deposition
Rate (Å/s)
IBS
Current
(mA)
11A 650 50 0.91 0.44 0
11B 650 50 0.70 0.34 200
11C 650 50 0.750 0.38 400
11D 650 50 0.99 0.46 800
There were several other sets of deposition trials, but this dissertation will focus on the
deposition sets discussed within chapter 3.
3.7. Heat treatments
Heat treating films can change film phase and structural characteristics as well as
improve film electrical properties. Select films were chosen for high temperature anneals
in oxygen and nitrogen environments. Films deposited on Si(111) were annealed at

75
temperatures of 800 °C and 1000 °C for 1 and 3 hours in a Lindberg Blue M tube
furnace. Films deposited on GaN could only be annealed for a maximum of 5 minutes at
875 °C in a rapid thermal annealing (RTA) furnace in order to avoid degradation of the
ohmic contacts. For future work, it may be helpful to deposit the ohmic contacts after
Gd2O3 film deposition.

76
Chapter 4
Results and Discussion: Process-phase relationships in Gd2O3 films
This chapter will cover the fundamental relationships between processing and the
resulting crystallographic phase, structure, and orientation of Gd2O3 films deposited by
reactive electron beam-physical vapor deposition (EB-PVD). Confocal Raman
spectroscopy and a variety of x-ray diffraction (XRD) techniques were used for film
characterization.
Theta-two-theta (θ-2θ) and grazing incidence x-ray diffraction (GIXRD) were
used for phase identification and determination of preferred orientation. In addition to
phase identification, Rietveld pattern refinement was used to quantitatively calculate
phase volume. Grazing incidence depth profiling analysis was performed on select
samples in order to reveal information about structure throughout the film thickness.
These techniques are crucial to understanding the evolution of texture during the growth
of Gd2O3 thick films.
A comprehensive study on the effects of processing parameters will be presented.
First, the discussion will cover the effects of deposition temperature on the
crystallographic phase and structure of the Gd2O3 films, focusing on film set 6 (function
of temperature, 200 sccm O2, ~1 µm). Next, the effect of oxygen flow on the phases of
the film will be discussed for both set 1 (650 °C, function of oxygen flow, ~2 µm) and set
4 (250 °C, function of oxygen flow, 1 µm). X-ray diffraction of set 3 (250 °C, 200 sccm
O2, function of thickness) and set 9 (650 °C, 200 sccm O2, function of thickness) will
assist in examining the effect of film thickness on Gd2O3 film phase stability at
deposition temperatures of 250 °C and 650 °C, respectively. Additionally, the effect of

77
underlying substrate type on the Gd2O3 film crystallographic structure will be discussed.
Finally, select samples were subject to heat treatments in order to improve film electrical
properties. The effects of these heat treatments on film phase stability and structure will
also be presented.
4.1. Effect of deposition temperature on Gd2O3 phase stability
Table 4.1 lists the equilibrium peak positions in ° 2θ for high intensity planes of
the cubic and monoclinic Gd2O3 phases. The listed peak positions for copper Kα radiation
were determined from the International Center for Diffraction Data (ICDD) cards75,76
#0042-1465 and #0043-1014 for the monoclinic and cubic phases, respectively.
Table 4.1. 2θ equilibrium peak positions for high intensity diffraction planes observed in
Gd2O3 film growth and the corresponding phases for Cu Kα radiation according to ICDD
cards #0042-1465 and #0043-1014 (λ= 1.54056 Å).
Cubic Phase Monoclinic Phase
Peak (° 2θ) Phase/Plane Peak (° 2θ) Phase/Plane
20.1 C(211) 14.9 M(-201)
28.6 C(222) 28.2 M(111)
30.9 C(321) 30.1 M(-402)
33.1 C(400) 31.0 M(003)
35.2 C(411) 31.5 M(-310)
39.0 C(332) 32.4 M(-112)
47.5 C(440) 51.0 M(020)
52.1 C(611) 60.0 M(421)
56.4 C(440) 60.4 M(-422)
59.2 C(444) 60.9 M(115)
Figure 4.1 shows the θ-2θ XRD patterns for films 6A-E deposited as a function of
temperature under 200 sccm O2 flow at deposition rates greater than 5 Å/s. The
monoclinic and cubic peaks are denoted on the patterns with the letters M and C,

78
respectively, followed by the corresponding Miller indices of the plane in parentheses.
Due to the small thickness of these films, the diffraction pattern in Figure 4.1 is shown
for Gd2O3 films deposited on quartz substrates to remove the overlap of the Si(111)
contribution (28.4°) with that of the Gd2O3 C(222) peak (28.6°). This allows for
quantitative phase volume, texture, and crystallite size analysis. At deposition rates
greater than 5 Å /s, diffraction patterns for Gd2O3 films were found to be very similar on
quartz and silicon substrates.
Figure 4.1. θ-2θ X-ray diffraction patterns of Gd2O3 films 6A (250 °C), 6B (350 °C), 6C
(450 °C), 6D (550 °C), and 6E (650 °C) deposited on quartz as a function of temperature
under 200 sccm O2 flow.
As observed from Figure 4.1, Gd2O3 films 6A-6E are polycrystalline and of
mixed cubic/monoclinic phase. Film 6A (250 °C, 200 sccm), is primarily monoclinic
Incre
asin
g C
ub
ic P
hase V
olu
me

79
with preferred M(-310) orientation, though diffraction from the M(-402) peak is also
observed. A low intensity peak is centered at approximately 28.0-28.6° and suggests
diffraction from both the M(111) and C(222) planes, resulting in some minor cubic phase
contribution. It is important to note that film 6A shows broad diffraction peaks,
indicating poor crystallinity as a result of low adatom mobility and limited diffusion at
the low deposition temperature of 250 °C. As the deposition temperature is increased to
350 °C (film 6B), the preferred orientation changes to the M(-402) orientation, with
additional diffraction observed from the C(222), M(111), M(-112) and M(-310) peaks.
The diffraction pattern for film 6B is also characterized by broad peaks indicating poor
crystallinity.
The formation of monoclinic phase at low temperatures is initially surprising
given the thermodynamic stability of the cubic phase. However, EB-PVD is a non-
equilibrium process, and formation of metastable phases may be observed. One potential
explanation for the formation of the metastable monoclinic phase in the Gd2O3 films is
given by Ostwald’s empirical “rule of stages”,77
in which intermediate states
characterized by metastable polymorphs occur prior to the formation of the stable
thermodynamic polymorph. In this case, the metastable monoclinic polymorph is formed
in the Gd2O3 films, and due to the low adatom mobility, transition to the
thermodynamically stable cubic phase cannot occur. Since monoclinic structures possess
less symmetry than the cubic phase, the Gd2O3 monoclinic phase may be formed more
easily and “quenched in” due to the low adatom mobility.
At a deposition temperature of 450 °C (film 6C), a transition to a predominantly
cubic phase film is observed with strong out of plane (in the growth direction) C(222)

80
texturing. A clear shift from a peak position of the M(111) peak at 28.0° to the C(222)
peak at 28.6° is observed. Some contribution from the M(-402), M(-310), and M(-112)
peaks are present, indicating some monoclinic phase remaining. Similar diffraction
patterns are observed for films 6D (550 °C) and 6E (650 °C). The observed trend of
increasing cubic phase volume with increasing temperature is in contrast to studies
investigating growth of thin polycrystalline Gd2O3 film by other deposition methods.
Singh et al. deposited 100-300 nm thick polycrystalline Gd2O3 films by MOCVD, which
resulted in fully cubic highly textured (111) films at a substrate temperature of 525 °C.49
Upon raising the substrate temperature to 750 °C, monoclinic phase formed. Similar
results have been shown for magnetron sputtered Gd2O3 films, showing an increase in
polycrystalline monoclinic phase volume when the deposition temperature was raised
from 470 to 550 °C.8 The differences between the results shown in this work and those
in the literature suggest that deposition method and processing have a significant effect
on Gd2O3 phase stability.
The presence of the cubic phase at high deposition temperatures can be explained
by the large adatom surface mobility which increases the diffusion length required to
form the thermodynamically stable cubic phase. It is also important to note that thin film
growth for a Zone 2 columnar microstructure (expected at deposition temperatures of 650
°C) is dominated by surface diffusion rather than bulk diffusion. The result is a driving
force to minimize the surface energy of the film. It has been shown in bixbyite (Ia3)
structured Y2O3 films that the (111) planes possess the lowest surface energy.78
Since the
Gd2O3 cubic phase shares the same bixbyte (Ia3) crystal structure, this explains the strong

81
texturing of the C(222) planes observed in the high temperature deposited Gd2O3 films
6C-6E.
4.1.1. Quantitative phase volume and crystallite size analysis
To gain a better understanding of the phase relationships, quantitative phase
volume analysis was employed. No standard method for calculating phase volume for
Gd2O3 films currently exists. Therefore, three methods were used and compared: 1)
Calculation of the ratios of the integrated intensities of the cubic and monoclinic peaks
from the θ-2θ XRD patterns, 2) Rietveld refinement of the θ-2θ XRD patterns, and 3)
Calculation of the ratios of the peak intensities corresponding to the Raman modes of the
cubic and monoclinic phases.
Quantitative phase analysis by XRD is a challenging and often disputed task,
especially for textured thin film materials.79
The first method employed to calculate phase
volume relies on the integrated intensities of the main cubic and monoclinic peaks from
the θ-2θ XRD data. The patterns were fitted using a Pseudo-Voigt function and the
chosen peaks for the analysis were the peaks with the largest integrated intensity as
observed in the XRD patterns. The monoclinic phase volume (%M) was calculated using
the equation 4.1:
(4.1)
%𝑀
=𝐼𝑀(111) + 𝐼𝑀(−402) + 𝐼𝑀(−310) + 𝐼𝑀(112) + 𝐼𝑀(020) + 𝐼𝑀(−422)
𝐼𝑀(111) + 𝐼𝑀(−402) + 𝐼𝑀(−310) + 𝐼𝑀(112) + 𝐼𝑀(020) + 𝐼𝑀(−422) + 𝐼𝐶(222) + 𝐼𝐶(444)

82
where I is the integrated intensity of the corresponding diffraction peaks noted in the
subscript. The cubic phase volume was calculated as %C = 100 - %M. The calculated
phase volumes for films 6A-6E by the integrated intensity, Rietveld, and Raman methods
are listed in Table 4.2. As can be seen, substantial increase in the cubic phase volume is
observed with increasing deposition temperature for the integrated intensity method. It is
important to note that this method does not take into account the effects of preferred
orientation or the difference in the intensity of diffraction between the Gd2O3 cubic and
monoclinic phases, and therefore, should be regarded as semi-quantitative. It is typically
expected that a cubic phase will diffract 2-3x stronger than a monoclinic phase due to the
increased symmetry of the crystal structure.80
In order to achieve more accurate results
for the calculation of phase volume, Rietveld refinement was utilized.
Table 4.2. Phase volume and crystallite size for films 6A-6E. Phase volume was
calculated by the integrated intensity (I-I) method, Rietveld refinement, and Raman
spectroscopy. M denotes the monoclinic phase and C denotes the cubic phase.
Crystallite size was calculated using Scherrer’s equation.
Film
Deposition
Temperature
(°C)
O2
flow
(sccm)
Phase
Volume
(%) by
I-I
Method
Phase
Volume
(%) by
Rietveld
Phase
Volume
(%) by
Raman
Cubic
Crystallite
Size (nm)
Monoclinic
Crystallite
Size (nm)
M C M C M C
6A 250 200 95 5 100 0 100 0 - 12
6B 350 200 83 17 94 6 71 29 19 13
6C 450 200 37 63 34 66 20 80 24 15
6D 550 200 5 95 18 82 10 90 25 14
6E 650 200 12 88 31 69 20 80 45 19
Rietveld refinement was performed using the Whole Pattern Fitting function of
JADE MDI software for quantitative determination of phase volume. Since Rietveld
refinement is typically meant for randomly oriented samples, a number of considerations

83
had to be taken into account when performing the refinement for textured thin films. The
first and most challenging aspect of refinement of the Gd2O3 films was the effect of
preferred orientation which causes deviations from the theoretical intensity ratios of the
XRD peaks. In the case of the Gd2O3 films, strong preferred orientation was often
observed from numerous monoclinic and cubic phase reflections. This was accounted for
by using either the March-Dollase model81
or the spherical harmonics model.82
Another critical component in Rietveld phase quantification is proper selection of
structure data. For the refinement, either crystal structure data or powder diffraction files
containing the reference intensity ratio (RIR) are needed. RIR is an instrument
independent constant for use in quantitative phase analysis which is measured as the
intensity ratio of the diffraction pattern from the selected material relative to the intensity
of the diffraction pattern from a corundum standard. For Gd2O3, powder diffraction files
taken from the ICDD database possess RIR values of 11-14 for cubic Gd2O3 and 0.9-3.5
for monoclinic Gd2O3. Differences in RIR value can yield significant differences in
phase volume. For instance, in calcium aluminum chromium oxide hydrates, a change in
RIR from 1.0 to 3.0 was found to affect phase volume calculations by a factor of 3.83
In
order to determine which values were most likely to yield accurate results, a θ-2θ
diffraction pattern of single phase cubic powder was taken. The cubic Gd2O3 powder
was then pressed and heated to 1400 °C and left at temperature to fully transform the
cubic Gd2O3 to the monoclinic phase. The θ-2θ diffraction patterns for the pure cubic
and monoclinic phases are shown in Figure 4.2. The difference in integrated intensity
ratio between the cubic and monoclinic Gd2O3 phases is approximately 3.5. Based on

84
this, powder diffraction files (#0042-1465 and #0043-1014) resulting in the closest
matching RIR ratio were chosen for Rietveld quantitative analysis listed in Table 4.2.
Figure 4.2. θ-2θ X-ray diffraction patterns of (a) fully cubic Gd2O3 powder and (b) fully
monoclinic Gd2O3 pellet after sintering at 1400 °C used to estimate the difference in
diffracted intensity between the two phases.
Table 4.2 shows the cubic and monoclinic phase volumes for films 6A-6E
quantitatively calculated by the Rietveld refinement. Similar to values computed from
using the integrated intensity method, a general trend of increasing cubic phase volume
with increasing deposition temperature is observed, with film 6D (550 °C) possessing the
greatest cubic phase volume. The greater phase volume in film 6D than film 6E (650 °C)
can be explained by the smaller thickness (0.69 µm) of film 6D. The effect of film
thickness on phase volume will be discussed in greater detail in section 4.4. Due to the
low RIR of the monoclinic phase, it is apparent that there is still monoclinic phase
(a)
(b)

85
volume in the high temperature deposited films (6C-6E) even though the peak intensities
are relatively small. This suggests that the integrated intensity method presented earlier
likely overestimated the cubic phase volume based on the assumption of equal RIR for
both phases. In order to verify this conclusion, another characterization technique
(Raman) which was not based on x-ray diffraction was needed to correlate the phase
volume calculations between the two methods.
Raman spectroscopy is another useful tool for phase identification that can be
used to compliment XRD analysis, especially in cases of highly textured thin films.
Raman vibrational modes are not directly correlated to the x-ray diffraction peaks and
therefore, provide a means to verify the accuracy of the phase volume calculation
independent of preferred orientation effects observed in XRD. Table 4.3 lists the Raman
band positions and corresponding relative intensities for a cubic Gd2O3 powder and single
crystal monoclinic Gd2O3 taken from the literature.58
The surprisingly high number of
active Raman modes observed in the spectra (19) can possibly be explained by group
theory which predicts a total of 22 active Raman modes in Gd2O3.84
The Raman spectra
for the cubic Gd2O3 powder is the only one reported in the literature for the cubic phase
and additional studies are desirable.
Raman analysis was performed on set 6 in order to assess the validity of the phase
volume calculation by the Rietveld method. Figure 4.3 shows the measured Raman
spectra of Gd2O3 films 6A-6E on quartz substrates. The broad Raman peaks and low
intensity of film 6A (250 °C) confirms the poor crystallinity in the film. As a result, it is
difficult to distinguish the peaks due to the poor signal to noise ratio for this film. Film
6B (350 °C) shows predominantly monoclinic bands at 415 cm-1
and 389 cm-1
, but also

86
displays some cubic contribution from the band at 361 cm-1
. For films 6C (450 °C), 6D
(550 °C) and 6E (650 °C), a large intensity value is observed from the cubic band located
at 361 cm-1
suggesting a predominantly cubic film structure. However, intensity of
additional monoclinic bands remains high, suggesting significant presence of the
monoclinic phase remains.
Table 4.3. Raman band positions and corresponding relative intensity of cubic Gd2O3
powder and single crystal monoclinic Gd2O3.
Monoclinic Gd2O3 85
Cubic Gd2O3 58
Band Position (cm-1
) Intensity Band Position (cm-1
) Intensity
71 Strong 81 Medium
84 Medium 85 Very Weak
99 Very Strong 95 Strong
108 Medium 108 Very Weak
114 Weak 115 Weak
133 Very Weak 135 Weak
151 Very Weak 145 Weak
175 Medium 198 Weak
219 Medium 235 Weak
233 Weak 299 Very Weak
257 Weak 316 Medium
268 Weak 337 Very Weak
298 Medium 361 Very Strong
385 Strong 401 Weak
415 Medium 413 Very Weak
428 Medium 447 Medium
441 Medium 479 Very Weak
499 Weak 568 Medium
A quantitative Raman phase analysis procedure for Gd2O3 films has not been
performed in the literature. However, calculation of monoclinic concentration in mixed
tetragonal-monoclinic zirconia materials has been performed by a number of authors on
the premise that the Raman bands for the two phases are proportional to their
concentrations.86
We employ a similar method to calculate the phase volume of
monoclinic and cubic Gd2O3 in the films. The peaks from the Raman spectra in Figure

87
4.3 were fitted using a Gaussian profile and the integrated intensity was calculated for the
two strongest monoclinic and cubic bands located at 361 cm-1
and 418 cm-1
, respectively.
The phase volume was calculated quantitatively using the equation 4.2:
%𝑀 =𝐼𝑀(418)
𝐼𝑀(418)+𝐼𝐶(361) (4.2)
where IM(418) and Ic(361) correspond to the integrated intensities of the monoclinic band
located at 418 cm-1
and the cubic band located at 361 cm-1
, respectively. Though exact
agreement in the numerical value is not present, these data suggest good correlation in the
trends between the Raman and XRD Rietveld data. As a result, the rest of the
quantitative phase analysis that will be presented in this chapter was calculated via the
Rietveld refinement technique.
Figure 4.3. Raman spectra of Gd2O3 films 6A (250 °C), 6B (350 °C), 6C (450 °C), 6D
(550 °C), and 6E (650 °C) deposited on quartz as a function of temperature under 200
sccm O2 flow. The cubic and monoclinic bands used for quantitative phase volume
analysis are marked C and M, respectively.
Inc
rea
sin
g C
ub
ic P
ha
se
Vo
lum
e

88
Another useful physical quantity that can be extracted from XRD analysis is
crystallite size. Scherrer’s formula was used to determine the XRD crystallite size using
equation 4.3 for films 6A-6E shown in Table 4.2:
𝐷 =𝐾𝜆
𝐵𝑐𝑜𝑠𝜃 (4.3)
where D is the grain size, K is the shape factor, λ is the x-ray wavelength, B is the
difference in the instrumental broadening and crystallite size broadening, and θ is the
Bragg angle. K was taken to be 0.9 and λ to be 1.54056Å for Cu radiation. The
instrument broadening contribution was obtained from a diffraction pattern of a high
purity polycrystalline silicon standard that was subtracted from the full width half max
(FWHM) of the analyzed peaks. The calculated crystallite sizes for films 6A-6E are
listed in Table 4.2, showing a significant increase in crystallite size from 19 nm to 45 nm
for the cubic phase with increasing deposition temperature from 250 to 650 °C. The
grain size of the monoclinic phase increased slightly from 12 to 19 nm over the same
temperature range. These results are explained by the higher adatom mobility and
diffusion present at high temperatures which allows for increased grain growth,
consistent with the structure zone model. It also highlights the increased growth of the
cubic phase with increased deposition temperature.
4.2. Effect of oxygen flow on Gd2O3 phase stability
Figure 4.4 shows the θ–2θ XRD patterns of Gd2O3 films 4A-4E deposited as a
function of O2 flow rate from 25 - 200 sccm at a substrate temperature of 250 °C under
growth rates greater than 5 Å / s. Films 4A-4D (25 - 150 sccm) exhibit a predominantly
monoclinic crystal structure with M(-402) preferred orientation. As the oxygen flow

89
increased from 25-150 sccm, the intensity of the (M-402) peak relative to the M(310)
decreased. At an oxygen flow of 150 sccm, a shift in the peak position from 28.0° (4D)
to 28.5° (4E) indicated increased reflection from the C(222) plane rather than the M(111)
plane, suggesting increased cubic phase volume within the film.
Figure 4.4. θ-2θ X-ray diffraction patterns of Gd2O3 films 4A (25 sccm), 4B (50 sccm),
4C (100 sccm), 4D (150 sccm), and 4E (200 sccm) deposited on quartz as a function of
oxygen flow at deposition temperature of 250 °C.45
Similar results regarding higher concentration of cubic phase volume at greater
oxygen partial pressures have been reported for very thin (~20 nm) polycrystalline Gd2O3
films.51
In Y2O3 cubic bixbyte structured films, a similar effect has been observed and
was attributed to extended defect nucleation as a result of oxygen vacancy aggregates.
When one oxygen plane is removed from a pristine bixbyte structure, the resulting cation
and anion plane stacking sequence is not allowed from a crystallographic standpoint.
Incr
easi
ng
Cu
bic
Ph
ase
Vo
lum
e

90
Therefore, planes relax by a small shear which leads to the formation of the monoclinic
phase.87
If this mechanism also occurs in the deposition of Gd2O3 films, then, as the
oxygen flow is decreased, an increased number of oxygen vacancies are present in the
film, resulting in increased formation of the monoclinic phase. This is confirmed by the
quantitative phase analysis results presented in Table 4.4.
Table 4.4. Phase volume and crystallite size of Gd2O3 films 4A (25 sccm), 4B (50 sccm),
4C (100 sccm), 4D (150 sccm), and 4E (200 sccm) deposited on quartz as a function of
oxygen flow at a deposition temperature of 250 °C.
Film
Deposition
Temperature
(°C)
Oxygen
Flow
(sccm)
Cubic
Phase
Volume
(%)
Monoclinic
Phase
Volume
(%)
Cubic
Crystallite
Size (nm)
Monoclinic
Crystallite
Size (nm)
4A 250 25 0 100 - 20
4B 250 50 0 100 - 19
4C 250 100 2 98 - 18
4D 250 150 20 80 11 14
4E 250 200 80 20 18 -
As observed by the increase in the FWHM of the diffraction peaks in Figure 4.4,
the film crystallinity increases slightly with decreasing oxygen flow. One potential
reason for this is that excess oxygen incorporation into the films deposited at high oxygen
flux results in disruption of the crystal lattice and increased voiding and porosity.
Another possible explanation is that the excess oxygen in the chamber during deposition
acts to scatter the adsorbing Gd atoms which cause a decrease in adatom surface
mobility. This results in poor surface coverage of the adsorbing atoms, resulting in
porosity. Additionally, when there is excess oxygen in the chamber, it is more likely that
the evaporated Gd atoms will react with the oxygen atoms before reaching the surface. A
compound of Gd2O3 will have significantly decreased surface mobility as compared to a

91
lone Gd atom. Indeed, it will be shown in Chapter 6 that films deposited at 250 °C are
denser when deposited under lower oxygen flow and that films deposited under higher
(200 sccm) O2 flow possessed porous regions. Quantitative crystallite size calculations
are shown in Table 4.4. Increasing oxygen flow resulted in decreasing crystallite size for
the monoclinic phase and increased crystallite size for the cubic phase. This may be due
to preferential growth of cubic crystallites over monoclinic crystallites due to the greater
cubic phase volume.
Figure 4.5 shows the θ–2θ XRD patterns for Gd2O3 films 1A-1D deposited as a
function of O2 flow from 50 to 200 sccm at a deposition temperature of 650 °C. Note that
these films are all approximately 2 µm thick and showed mixed cubic/monoclinic
character. Film 1A (650 °C, 50 sccm O2, 2.05 µm) is predominantly monoclinic with
strong contribution from the C(222) and M(− 402) reflections and minor contributions of
the M(-112), M(-422), and M(-310) reflections. According to the quantitative Rietveld
analysis, this film possessed 22% cubic phase volume as shown in Table 4.5. For film
1B (650 °C, 100 sccm O2, 1.73 µm), the intensity of the M(− 402), M(− 112), and
M(− 422) peaks decrease, resulting in a predominantly cubic structure (90%) with strong
C(222) orientation. The diffraction pattern for film 1C (650 °C, 150 sccm O2, 2.03 μm)
shows the emergence of a strong M(020) orientation. As the oxygen flow is increased to
200 sccm (film 1D), an increase in the cubic phase volume (85%) is observed due to
increased intensity from the C(222) peak as well as the emergence of low intensity peaks
at 47.5° and 56.4° corresponding to the C(440) and C(622) planes, respectively.

92
Figure 4.5. θ-2θ X-ray diffraction patterns of Gd2O3 films 1A (50 sccm O2), 1B (100
sccm O2), 1C (150 sccm O2), and 1D (200 sccm O2) deposited on quartz as a function of
oxygen flow at a deposition temperature of 650 °C.
The effects of preferred orientation in films 1A-1D can be explained on the
following basis. Due to the low oxygen flow present in the deposition chamber for films
1A (650 °C, 50 sccm O2) and 1B (650 °C, 100 sccm O2), the atoms were able to diffuse
farther and minimize the surface energy of the film. As previously discussed, the C(222)
plane has been shown to be the low surface energy plane of the bixbyte Ia3 crystal
structure. Unfortunately, the authors are not aware of any studies that have modeled or
calculated the surface energies for any materials possessing the C2/m structure.
However, the M(-402) plane has been identified as the cleavage plane in single crystal
C2/m monoclinic Gd2O3.85
Although not a rule, the cleavage plane for a given crystal
structure is typically the lowest surface energy plane. Based on this information and the

93
results presented in this work, we propose that the M(-402) plane is likely the low surface
energy plane in the monoclinic structure. This cannot be verified until the elastic
constants of the monoclinic (C2/m) Gd2O3 phase are determined. When the oxygen flow
was increased to 150 and 200 sccm, increased scattering in the vacuum chamber resulted
in decreased adatom mobility. Therefore, the atom diffusion length was not large enough
to minimize the surface energy causing the film crystallographic orientation to change to
M(020), which is likely a result of strain energy minimization. This will be discussed
further in section 4.4, where the effect of film thickness more clearly illustrates the
competition between surface energy and strain energy and its effects on film texture and
phase.
The crystallite size was calculated for both the cubic and monoclinic phases for
films 1A-1D as shown in Table 4.5. Change in oxygen flow resulted in a change in cubic
(19 – 27 nm) and monoclinic (15- 29 nm) crystallite size but no clear trend was observed.
It is important to note the difference in the diffraction patterns of Gd2O3 films 1D
(650 °C, 200 sccm, 2.05 µm, Figure 4.5) and 6E (650 °C, 200 sccm, 0.87 µm, Figure
4.1). Both films were deposited at 650 °C and under 200 sccm O2 flow at a similar
deposition rate, but with different film thicknesses. However, the diffraction patterns are
significantly different, with film 1D possessing a higher monoclinic phase content and
significant texturing of the M(020) reflection. This suggests that the difference in film
thickness between the two films has a significant effect on film phase volume. The
effects of film thickness will be discussed in greater detail in sections 4.3 and 4.4.

94
Table 4.5. Phase volume and crystallite size of Gd2O3 films 1A (50 sccm), 1B (100
sccm), 1C (150 sccm), and 1D (200 sccm) deposited on quartz as a function of oxygen
flow at deposition temperature of 650 °C.
Film
Deposition
Temperature
(°C)
Oxygen
Flow
(sccm)
Cubic
Phase
Volume
(%)
Monoclinic
Phase
Volume
(%)
Cubic
Crystallite
Size (nm)
Monoclinic
Crystallite
Size (nm)
1A 650 50 22 78 19 23
1B 650 100 90 10 24 29
1C 650 150 65 35 27 16
1D 650 200 85 15 26 15
4.3. GIXRD depth profiling indicating phase and texture evolution in Gd2O3 films
All films discussed up to this point have been either mixed phase (cubic and
monoclinic) or fully monoclinic according to the θ-2θ diffraction pattern and associated
quantitative analysis. However, the data suggests that the monoclinic and cubic phases
may not be distributed evenly throughout the film thickness. In GIXRD, the incident
angle is fixed at a constant value throughout the scan. By performing multiple scans with
various incident angles, it is possible to vary the x-ray penetration depth into the sample.
This allows for depth profiling of film phase and texture.
Figure 4.6 shows the GIXRD patterns taken at various incident angles between 1
and 15 ° for film 6E (650 °C, 200 sccm, 0.87 µm). At high incidence angles (10 and
15°), the patterns are similar to the θ-2θ pattern (Figure 4.1) because the depth of
penetration into the film is large. However, a marked difference is observed in the
diffraction patterns for incidence angles of 5° and below. A better understanding can be
gained from looking at the inset in Figure 4.6. At high incidence angles of 10 and 15°,
there is strong diffraction from the C(222) peak, indicating large cubic phase volume.
However, at incidence angle of 5°, diffraction is observed from both the C(222) peak at

95
28.6° 2θ and the M(111) peak at 28.0° 2θ with a large decrease in intensity of the C(222)
peak.
Figure 4.6. Grazing incidence diffraction patterns taken at incident angles of 1, 2, 5, 10,
and 15 ° for film 6E (650 °C, 200 sccm O2, 0.87 µm) deposited on quartz. The inset
shows the magnified M(111) and C(222) peaks located at 28.0 and 28.6 °, respectively.
At incidence angles of 1 and 2° which results in very shallow depth of x-ray
penetration, diffraction is only observed from the M(111) peak. This disappearance of
the C(222) peak at these low incidence angles suggests that there is no cubic phase
present in this surface region and that increased monoclinic phase volume formed as the
film grew thicker. Additionally, it is important to note that the M(-402) reflection is
observed only at large incidence angles (10 and 15°). This further supports the claim that

96
the M(-402) plane is the low surface energy plane of the monoclinic phase which is
present at the initial stages of growth. However, as the film grows thicker, other
orientations become more favorable due to strain energy considerations. From this data,
it is clear that film thickness plays a role in the texture evolution and phase stability of
Gd2O3 films deposited by reactive EB-PVD.
4.4. Effect of film thickness on phase of Gd2O3 films
In section 4.3, we showed that x-ray depth penetration plays a significant role in
the observed phase volume of Gd2O3 films as measured by XRD. Therefore, the
discussion in this section will focus on deposition sets 3 (250 °C, 200 sccm, function of
thickness) and 9 (650 °C, 200 sccm, function of thickness) in order to elucidate the
effects of thickness on Gd2O3 film phase stability. Figure 4.7 shows the θ-2θ XRD
patterns for films 3A-3E deposited at 250 °C under 200 sccm O2 flow as a function of
film thickness from 580 nm to 11.01 μm. Film 3A (580 nm thick) appears to be a mixed
cubic and monoclinic phase film. The location of the peak around 28° is broad,
suggesting contributions from both the M(111) and C(222) reflections are present.
Additionally, reflection from the M(-112) and C(400) convoluted peaks are observed in
the diffraction pattern. As the film thickness increases to 1.11 µm (film 1B), the peak
position shifted to 28.0° corresponding to the M(111) reflection. No reflections from the
cubic phase were observed in this pattern and only monoclinic peaks were observed with
the M(-310) peak possessing the largest intensity. As the film thickness increases further
(films 3C-3E) up to 11 µm, only monoclinic phase growth is observed and the intensity
of the M(-402) reflection increases relative to the other peaks, suggesting slight changes

97
in preferred orientation. Based on the grain size calculation from the FWHM of the
peaks, the crystallite size remains constant at a value of approximately 12 nm as shown in
Table 4.6, due to limited grain growth as a result of the low adatom mobility.
Figure 4.7. θ-2θ X-ray diffraction patterns of Gd2O3 films 3A (0.58 µm), 3B (1.11 µm),
3C (2.10 µm), 3D (5.12 µm), and 3E (11.01 µm) deposited on quartz as a function of film
thickness at deposition temperature of 250 °C and oxygen flow rate of 200 sccm.
This data suggests that that cubic phase may be present in the initial stages of film
growth and monoclinic phase may form as the film thickness increases. Indeed, it will be
shown in section 6.1.4 through selected area diffraction (SAD) of a TEM cross sectional
sample taken at different points along the film thickness that monoclinic phase gradually
forms as the film thickness increases. The reasons for this phase transition are related to
strain energy and residual stress state of the film and will be discussed in greater detail in
Inc
rea
sin
g M
on
oc
lin
ic P
ha
se V
olu
me

98
sections 5.1-5.4. The phase transition from monoclinic to cubic phase with increasing
thickness is observed for films deposited at a low deposition temperature of 250 °C. In
order to determine if a similar trend occurred at high substrate temperatures, films were
deposited as a function of thickness at a deposition temperature of 650 °C (Set 9).
Table 4.6. Phase volume and crystallite size of Gd2O3 films 3A (0.58 µm), 3B (1.11 µm),
3C (2.10 µm), 3D (5.12 µm), and 3E (11.01 µm) deposited on quartz as a function of film
thickness at deposition temperature of 250 °C and oxygen flow rate of 200 sccm.
Film
Deposition
Temperature
(°C)
Oxygen
Flow
(sccm)
Film
Thickness
(µm)
Cubic
Phase
Volume
(%)
Monoclinic
Phase
Volume (%)
Cubic
Crystallite
Size (nm)
Monoclini
c
Crystallite
Size (nm)
3A 250 200 0.58 93 7 12 13
3B 250 200 1.11 0 100 - 13
3C 250 200 2.10 0 100 - 13
3D 250 200 5.12 0 100 - 12
3E 250 200 11.02 0 100 - 12
Figure 4.8 shows the θ-2θ diffraction patterns of Gd2O3 films 9A-9E deposited at
650 °C as a function of thickness under 200 sccm O2 flow and at deposition rates greater
than 5 Å / s on quartz substrates. For film 9A (650 °C, 200 sccm O2, 380 nm), strong
preferred orientation of the C(222) plane is observed. Within an intermediate thickness
range for films 9B (650 °C, 200 sccm O2, 580 nm) and 9C (650 °C, 200 sccm O2, 1.02
µm), increasing the thickness leads to increased intensity of the M(-402) reflection at the
expense of the C(222) reflection, and a predominantly monoclinic structure. The M(020)
plane becomes strongly oriented for film 9D (2.69 µm), though some reflection is still
observed from the C(222) and M(-402) planes. However, once the films reached a
critical thickness (between 2.69 and 5.72 µm), the only diffraction peak observed in the
patterns is the M(020) peak, resulting in highly textured growth of the monoclinic phase
as shown by film 9E (650 °C, 200 sccm, 5.72 µm).

99
Figure 4.8. θ-2θ X-ray diffraction patterns of Gd2O3 films 9A (0.38 µm), 9B (0.59 µm),
9C (1.02 µm), 9D (2.69 µm), and 9E (5.72 µm) deposited on quartz as a function of
thickness at deposition temperature of 650 °C and under 200 sccm of O2 flow.
This growth can be explained on the basis of surface and strain energy
minimization. Initial growth of the cubic phase, specifically with C(222) orientation, is
preferred due to the low surface energy of the close packed (111) set of planes.
Competing growth of the low energy M(-402) planes is also observed. As strain buildup
occurs in the film with increasing thickness, there is a driving force to minimize strain
energy resulting in transformation to a lower stress state via formation of the monoclinic
phase. The growth of the M(020) orientation is observed for all thick films grown by
high deposition rates (> 5 Å / s) regardless of oxygen flow. This data suggests that the
M(020) plane may be the lowest strain energy plane of the monoclinic structure. It will
be shown in Chapter 7, that the growth of the M(020) orientation results in deleterious
effects on film morphology and electrical properties. It is important to note, however,
Incr
easi
ng
Mo
no
clin
ic P
hase
Volu
me

100
that the x-rays cannot penetrate fully into the Gd2O3 film for thickness values greater than
1.2 µm for the C(222) diffraction angle. Therefore, cubic phase may still be present at or
near the substrate/film interface. Table 4.7 shows the calculated phase volumes and
crystallite sizes for films 9A-9E. The crystallite sizing displayed a decreasing trend with
increasing thickness for the cubic phase. This can be explained by the fact that the cubic
phase volume decreases with increasing film thickness, resulting in smaller crystallite
sizes (51 to 17 nm) calculated from the C(222) reflection. The monoclinic crystallite size
increases slightly (19 to 23 nm) over the same range.
Table 4.7. Phase volume and crystallite size of Gd2O3 films 9A (0.38 µm), 9B (0.59 µm),
9C (1.02 µm), 9D (2.69 µm), and 9E (5.72 µm) deposited on quartz as a function of
thickness at deposition temperature of 650 °C and under 200 sccm of O2 flow.
Film
Deposition
Temperature
(°C)
Oxygen
Flow
(sccm)
Film
Thickness
(µm)
Cubic
Phase
Volume
(%)
Monoclinic
Phase
Volume
(%)
Cubic
Crystallite
Size (nm)
Monoclinic
Crystallite
Size (nm)
9A 650 200 0.38 55 45 51 19
9B 650 200 0.59 12 88 36 19
9C 650 200 1.02 13 87 23 21
9D 650 200 2.69 3 97 17 24
9E 650 200 5.72 0 100 - 23
4.5. Effect of substrate type on crystallographic phase and orientation of Gd2O3
films
Figure 4.9 displays typical XRD patterns of Gd2O3 films from the same
deposition grown on silicon, quartz, sapphire, and GaN substrates. As can be observed
from Figure 4.9, the diffraction patterns are very similar, suggesting nearly identical
growth on all substrates. During thin film growth, if adatom mobility is high enough and
interfacial mismatch is minimized, thin films can grow heteroepitaxially on the
underlying substrate in order to minimize strain. However, due to the high rate of

101
deposition associated with the growth of the Gd2O3 films discussed thus far, the substrate
was expected to have minor impact on the film growth. When evaporated atoms arrive
quickly on the substrate surface, there is not enough time to diffuse along the substrate
fully.
Figure 4.9. θ-2θ X-ray diffraction patterns of Gd2O3 film 12C (250 °C, 200 sccm O2, 0.99
µm) deposited on silicon, quartz, sapphire, and GaN substrates.
4.6. Effect of heat treatments on crystallographic phase and orientation of Gd2O3
films
Select Gd2O3 films were subjected to heat treatments in an oxygen atmosphere in
order to improve their electrical properties. X-ray diffraction was completed on these
samples in order to determine the effects of high temperature heat treatments on the phase
stability and structure of the Gd2O3 films. Figure 4.10 displays the theta-two-theta x-ray

102
diffraction pattern for film 12B (650 C, 200 sccm O2, 1.1 µm) deposited with growth rate
of > 5 Å / s.
Figure 4.10. θ-2θ X-ray diffraction patterns of Gd2O3 film 12B (650 °C, 200 sccm O2,
1.1 µm): (a) as deposited, (b) after1 hour anneal in oxygen at 800 °C and (c) after1 hour
anneal in oxygen at 1000 °C
From the diffraction pattern of the as deposited sample shown in Figure 4.10 and
the quantitative Rietveld analysis in Table 4.8, it can be seen that the film is majority
monoclinic phase (cubic phase volume of 16%) with preferred M(-402) orientation.
After annealing at 800 °C in an oxygen environment for 1 hour, the peak intensity ratio of
C(222) / M(-402) increases, accompanied by an increase in the cubic phase volume of the
film to 20% as measured by Rietveld refinement. After annealing at 1000 °C for 1 hour,
the cubic phase volume increases to 49%. Two factors are primarily responsible for this
increase in monoclinic to cubic phase transition. First, it is likely that increasing the
Incr
easi
ng
Cu
bic
Ph
ase
Vo
lum
e
(a)
(b)
(c)

103
temperature provides the added diffusion necessary to allow the structure to form the
thermodynamically stable cubic phase. Secondly, if the films were oxygen deficient,
increased oxygen incorporation into the film may help stabilize the cubic phase. This
further reinforces the possibility that oxygen deficiency plays a contributing role in the
formation of the monoclinic phase as discussed in section 4.2. Table 4.8 also lists the
calculated crystallite size for film 1B. There is a slight increase in crystallite size from 26
nm to 37 nm for the cubic phase after annealing at 800 °C. Increasing the annealing
temperature to 1000 °C results in a significant increase in crystallite size for the cubic
phase to a value of 61 nm. Interestingly, the crystallite size of the monoclinic phase
increases with annealing temperature despite the increasing cubic phase volume.
Table 4.8. Phase volume and crystallite size for film 12B (650 °C, 200 sccm O2, 1.1 µm)
subjected to heat treatments in oxygen atmosphere.
Film Cubic Phase
Volume (%)
Monoclinic
Phase Volume
(%)
Cubic
Crystallite Size
(nm)
Monoclinic
Crystallite Size
(nm)
As deposited 16 84 26 22
800 °C anneal 20 80 37 33
1000 °C anneal 49 51 61 40
4.7. Conclusions
The effects of processing Gd2O3 film phase stability was studied via XRD and
Raman spectroscopy. Quantitative phase volume analysis was performed via a Rietveld
refinement technique. Gd2O3 films deposited at high rates (> 5 Å / s) were polycrystalline
and of mixed cubic/monoclinic phase. The qualitative trends are summarized in Table
4.9. For ~1 µm thick films deposited as a function of temperature at constant 200 sccm
O2 flow (set 6), increasing the deposition temperature from 250 °C to 650 °C was found
to increase the cubic phase volume in the film, improve the crystallinity, and increase the

104
crystallite size. The observed increase in cubic phase volume with increasing deposition
temperature appears to be unique to Gd2O3 films deposited by EB-PVD, as greater
monoclinic content is typically observed with increasing temperature for films prepared
by other deposition methods.49,8
Table 4.9. Summary of process-phase trends describing the effects of temperature,
oxygen flow, and thickness on the phase of Gd2O3 films deposited at high rates greater
than 5 Å / s. The bolded letters indicate the varied deposition parameters for each set.
Set Temperature
(°C)
Oxygen
flow (sccm) Thickness (µm) Trend
6 Function of
temperature
(250 – 650 °C)
200 ~1
Increasing cubic phase
volume with increasing
temperature
1 650 °C Function of
O2 flow
(50 -200)
~2 No trend
4 250 °C Function of
O2 flow
(25 -200)
~1
Increasing cubic phase
volume with increasing
oxygen flow
3 250 °C 200 sccm Function of
thickness (0.5 – 11)
Increasing monoclinic
phase volume with
increasing film thickness
9 650 °C 200 sccm Function of
thickness (0.4 – 6)
Increasing monoclinic
phase volume with
increasing film thickness
For films deposited as a function of oxygen flow at low deposition temperature of
250 °C (Set 4), increasing the oxygen flow from 25 to 200 sccm was found to increase
the cubic phase volume in the material, consistent with other reports found in the
literature. At high deposition temperatures of 650 °C, the O2 flow affected the preferred
orientation of the film, and showed an increase in cubic phase content from 50 to 100
sccm, but decreased for higher oxygen flow (150, 200 sccm O2). The effects of
processing on the phase of Gd2O3 films deposited at rates greater than 5 Å / s is

105
summarized in Figure 4.11 which shows the effects of temperature, oxygen flow, and
thickness on Gd2O3 phase content.
Figure 4.11. Process-phase summary map displaying the effects of temperature, oxygen
flow, and thickness on the phase of Gd2O3 films deposited at high rates (greater than 5 Å
/ s) by reactive electron beam physical vapor deposition (EB-PVD).
GIXRD depth profiling analysis showed that cubic phase was detected at large
incidence angles, but only monoclinic phase was observed at low incidence angles. This
suggested that cubic phase grew near the film/substrate interface and monoclinic phase
formed as the film grew thicker. This was supported by the θ-2θ diffraction patterns of
sets 3 (250 °C, 200 sccm O2, function of thickness) and 9 (650 °C, 200 sccm O2, function
of thickness) which both showed increasing monoclinic phase volume with increasing
film thickness. At high deposition rates (> 5 Å / s), films were shown to grow similarly

106
on silicon, quartz, sapphire, and GaN substrates suggesting that the large flux of arriving
atoms at the film surface dominates the growth over any interfacial effects. High
temperature heat treatments in an oxygen atmosphere resulted in phase transition from
the metastable monoclinic phase to the thermodynamically stable cubic phase with no
film cracking, which was attributed to increased diffusion and oxygen incorporation into
the film.

107
Chapter 5
Results and Discussion: Deposition of single phase cubic films and stress induced
phase transformation
In chapter 4, it was shown that all films deposited at high rates (>5 Å / s) by
reactive electron-beam physical vapor deposition (EB-PVD) possessed either fully
monoclinic or mixed cubic and monoclinic phase character. For the mixed phase films,
cubic phase was present near the substrate/film interface, and monoclinic phase volume
increased as the film thickness increased. In order to understand the development of
phase formation for thick Gd2O3 films, it is necessary to examine the growth processes at
the initial stages of film growth. Therefore, analysis of Gd2O3 films less than 50 nm thick
will be presented (set 8, variable temperature, variable O2 flow, < 50 nm thick). In
addition, this data will form the basis for discussion of the cubic to monoclinic phase
transition.
Links between the deposition parameters and residual stress state of the Gd2O3
films and their resulting effects on film phase stability will be discussed. By decreasing
the deposition rate to less than 1 Å/s for films grown at temperatures of 650 °C (set 10,
650 °C, 50 sccm, <0.5 Å/s), films up to 1 µm thick were grown in the pure cubic C (Ia3)
phase. The growth of the thermodynamically stable cubic phase under these conditions is
attributed to both higher surface mobility of the adatoms during growth leading to longer
diffusion distances and to increased tensile stresses within the film. To differentiate
between these two contributions, ion beam assisted deposition (IBAD) using ~500 eV
oxygen ions was performed to introduce compressive stress into the Gd2O3 films (set 11,
650 °C, 50 sccm O2, 0.5 A/s, function of ion beam current) to form the monoclinic phase.

108
Wafer curvature measurements, X-ray diffraction, and confocal Raman spectroscopy
were utilized to characterize the films and present evidence for the existence of a stress-
induced phase transition in the Gd2O3 films. Additionally, x-ray pole figure analysis was
performed in order to determine in-plane texture of the Gd2O3 films on various substrates.
5.1. Deposition of thin (< 50 nm) single phase Gd2O3 films at low temperature
Based on the results presented in section 4.4 which showed increasing monoclinic
phase volume with increasing film thickness, it was predicted that a very thin layer of
Gd2O3 may grow in the cubic phase for a small film thickness. Therefore, thin (< 50 nm)
films were deposited under a variety of conditions (films 8A-8E) and analyzed via x-ray
diffraction. The grazing incidence x-ray diffraction (GIXRD) pattern for Gd2O3 film 8A
(250 °C, 200 sccm O2, 47 nm) is shown in Figure 5.1
Figure 5.1. Grazing incidence pattern of fully cubic Gd2O3 film 8A (250 °C, 200 sccm
O2, 47 nm thick). Red lines show equilibrium peak position given by ICDD card #0042-
1014.

109
As can be seen from the pattern, the only visible peaks are the C(222), C(400),
C(440), and C(622) peaks, indicating that the film is indeed fully cubic and randomly
oriented. It is important to note that the positions of the diffraction peaks of the thin film
grown at 250 °C shown in Figure 5.1 are shifted to lower angles 2θ by approximately 0.1-
0.5 degrees 2θ from the equilibrium positions evaluated by ICDD diffraction card #00-
043-1014.76
This is similarly observed in the θ-2θ scan, suggesting a large amount of
tensile strain in the out-of-plane direction, which corresponds to compressive stress in the
plane of the film for a biaxial stress state.
The out-of-plane strain may be calculated by the following equation:
𝜀𝑧 =𝑑−𝑑𝑒
𝑑𝑒 (5.1)
where d is the measured interplanar spacing and de is the equilibrium interplanar spacing
absent of stress. Using equation 5.1, the strain was calculated from the θ-2θ XRD
pattern of film 8A for the C(222), C(400), C(440), and C(622) planes. The values for de
were evaluated from the cubic ICDD card for Gd2O3 #0043-1014. The calculated strain is
approximately 0.6-0.7% as shown in Table 5.1
Table 5.1. Calculated strain for film 8A (250 °C, 200 sccm, 47 nm) based on equation 5.1
Plane Equilibrium d
spacing from ICDD
# 0042-1014 (Å)
Measured d spacing
(Å)
% Strain
(222) 3.121 3.142 0.7
(400) 2.703 2.721 0.7
(440) 1.912 1.925 0.7
(622) 1.630 1.640 0.6
Under the assumption of isotropic elasticity, the strain can be related to the stress using
Hooke’s law (equation 5.2):

110
𝜀𝑧 = {𝜎𝑧 − 𝜈(𝜎𝑥 + 𝜎𝑦)}/𝐸 (5.2)
where E is Young’s modulus, v is Poisson’s ratio, and σx, σy are the in-plane stresses.
Assuming a biaxial stress state where σx = σy, the equation can be reduced to equation 5.3
and the residual stress can be calculated:
𝜎𝑥 = −𝐸
2𝜈𝜀𝑧 (5.3)
Based on the lattice spacings for the various planes measured in Table 5.1, the resulting
residual stress given by equation 5.3 is approximately between -1.5 and -1.7 GPa. The
negative sign indicates compressive stress acting within the plane of the film.
To further investigate the degree of residual stress in the films, XRD sin2
ψ
residual stress analysis was performed. The XRD sin2ψ technique
88 works by measuring
the lattice spacing at various tilt angles from the surface normal, and extracting the
residual stress from these strain measurements. Calculation of the residual stress is given
by equation 5.4:
𝑑𝜓−𝑑0
𝑑0=
1+𝜈
𝐸𝜎𝑠𝑖𝑛2𝜓 (5.4)
where ψ is the angle of sample tilt from the surface normal, E is Young’s modulus, ν is
Poisson’s ratio, σ is the in-plane-stress, d0 is the lattice spacing at ψ = 0, and dψ is the
lattice spacing at every tilt angle ψ. For a particular set of planes, the stress can be
determined from the slope of the plot of the strain versus sin2ψ. The sin
2ψ technique
was performed on the C(222) planes of film 8A (250 °C, 200 sccm O2, 47 nm) and the
resulting plot is shown in Figure 5.2. Since the elastic constants for Gd2O3 are unknown,
the specific values for Young’s modulus of the (222) plane could not be used in the
calculation. Therefore, the bulk Young’s modulus (148 GPa) and Poisson’s ratio (0.29)

111
were taken from the NIST database.89
From Figure 5.2, the measured slope corresponds
to a stress value of -1.7x ± 0.1 GPa (where 𝑥 =(𝐸
1+𝜈)222
(𝐸
1+𝜈)𝑏𝑢𝑙𝑘
), similar to the values
previously calculated.
Figure 5.2. Sin2ψ versus strain plot for film Gd2O3 film 8A (250 °C, 200 sccm O2, 47
nm). From the slope, a compressive stress of -1.7x ± 0.1 GPa (where x the ratio between
Young’s modulus for the C(222) plane and the bulk) was calculated.
The magnitude of the calculated compressive stress (-1.7 GPa) is very large for a
film that is only 47 nm thick. It is unclear where the source of this residual stress
originates. The low deposition temperature of 250 ° C should result in small amounts of
tensile extrinsic stresses due to coefficient of thermal expansion (CTE) mismatch.
Therefore, it is suggested that the large compressive stress generated is due to intrinsic
growth stresses. Due to the nature of electron beam evaporation, the kinetic energy
imparted to the substrate via the evaporated atoms is extremely low, eliminating “atomic

112
peening”90
as a source of compressive stress. Possible explanations may come from
surface stresses due to island formation before coalescence91
or adatom injection into the
grain boundaries.92
Nevertheless, this large compressive stress may be the driving force
for the formation of the monoclinic phase as the film grows thicker. The large
compressive stress results in increased strain energy within the film. Once the strain
energy reaches a certain critical limit, transformation from the cubic phase to the
metastable monoclinic phase occurs in order to minimize the strain energy.
5.2. Effects of residual stress on Gd2O3 thin films
A trend of increasing monoclinic phase content with increasing film thickness
was observed for set 3 (250 °C, 200 sccm O2, function of thickness) and set 9 (650 °C,
200 sccm O2, function of thickness). For intermediate film thicknesses (500 nm to 3 µm),
the cubic phase volume is larger for films from set 9 (650 °C) than those from set 3 (250
°C). One explanation for this behavior is that the surface mobility of the adatoms is
increased at these elevated temperatures, resulting in larger diffusion lengths which allow
for atomic rearrangements into the more thermodynamically stable cubic structure and
preferred C(222) low surface energy orientation. It is interesting to note though, that in
the case of low temperature deposition, films are initially fully cubic at very small
thicknesses (Figure 5.1). This suggests that adatom mobility is not the only mechanism
for phase transformation. Another explanation is offered relating to the residual stress
state of the films, where increased compressive stresses may result in formation of the
monoclinic phase.

113
The extrinsic stress in the film due to coefficient of thermal expansion (CTE)
mismatch is given by equation 5.5:
𝜎𝐶𝑇𝐸 =𝐸𝑐
1−𝜈𝑐(𝛼𝑠 − 𝛼𝑐)(𝑇𝑓 − 𝑇𝑑) (5.5)
where Ec
1−νc is the biaxial modulus of the Gd2O3 film, αsandαc are the coefficients of
thermal expansion of the substrate and film, respectively, and Tf and Td are the final and
deposition temperatures, respectively. It is not possible to calculate the absolute value of
thermal stress in these films because of their mixed cubic and monoclinic phase nature.
The CTE of monoclinic Gd2O3 has been reported to be significantly higher (9-15 x 10-6
/
°C depending on orientation) than that of cubic Gd2O3 (7.95 x 10⁻⁶
/ °C).93
However, the
coefficient of thermal expansion in both cases is higher in the film than in the silicon
substrate (2.55 x 10⁻⁶
/ °C),94
and therefore, increasing the deposition temperature will
result in increased tensile residual stresses within the film upon cooling.
Due to the unknown elastic constants of Gd2O3 as well as the mixed phase nature
and heavy degree of texture in the thicker Gd2O3 films, the XRD sin2ψ technique for
measurement of the residual stress was determined to possess significant amount of error
for some samples. Therefore, the wafer curvature technique in conjunction with Stoney’s
equation was employed to measure the residual stress of the thicker films. Since the
calculation of residual stress by this method is based entirely on the curvature of the
wafer and the material properties of the substrate, the film material properties are not
needed. This allows for simple calculation of the residual stress in multi-phase films.
The expected trend of increased tensile residual stress with increasing deposition
temperature is reflected in Figure 5.3a which shows the total residual stress measured by

114
the wafer curvature technique for Gd2O3 films 7A-7E (function of temperature, 50 sccm
O2 flow, ~1 µm) grown on silicon.
Figure 5.3. (a) Measured residual stress via wafer curvature technique for ~1 µm thick
films 7A (250 °C), 7B (350 °C), 7C (450 °C), 7D (550 °C), and 7E (650 °C) deposited as
a function of temperature on Si(111) under 50 sccm O2 flow and (b) corresponding θ-2θ
diffraction patterns deposited on quartz substrates showing increasing cubic phase
volume with increasing temperature.
Incre
asin
g C
ub
ic P
hase V
olu
me

115
Figure 5.3b displays the corresponding θ-2θ diffraction patterns for films 7A-7E
grown on quartz which clearly show increasing cubic phase content with increasing
deposition temperature. The increased tensile stresses for films deposited at higher
temperatures may therefore stabilize a greater amount of cubic phase within the film. It is
important to note, however, that the total residual stress includes both the extrinsic and
intrinsic components of the residual stress, which is a complex combination of variables
during the growth process and cannot be fully explained by the CTE mismatch alone.
5.3. Deposition of thick single phase cubic Gd2O3 films
Until this point, the discussion has focused on films with high growth rates, > 5
Angstroms / s, which has resulted in mixed cubic/monoclinic phase growth for films
greater than 50 nm thick regardless of deposition temperature. It was proposed that the
relatively fast deposition rates were not allowing adequate time for the adatoms to diffuse
resulting in a “quenched in” monoclinic structure. Therefore, the deposition temperature
was set at 650 °C and the rate was lowered to approximately 0.5 Å / s to determine if
these conditions would allow for formation of the pure cubic phase for a thick gadolinium
oxide film. Figure 5.4 displays the θ-2θ diffraction pattern for film 10B (650 °C, 50 sccm
O2, 910 nm, 0.5 Å / s) on silicon, sapphire, quartz, and GaN substrates. Aside from the
Al2O3, GaN, and AlGaN substrate peaks, all observed peaks in the diffraction pattern
correspond to cubic reflections of Gd2O3. However, it is important to note that the
preferred orientation in the Gd2O3 film differs depending on the substrate type, in contrast
to films deposited under high rates of deposition (> 5 Å/s), where there was no change in
preferred orientation. This will be discussed in greater detail in sections 5.5 and 5.6.

116
Figure 5.4. θ-2θ X-ray diffraction patterns of fully cubic Gd2O3 film 10B (650 °C, 50
sccm O2, 910 nm, 0.5 Å/s) deposited on sapphire, quartz, silicon, and GaN.
The measured tensile residual stresses by the wafer curvature method for the
cubic phase film 10B (650 °C, 50 sccm O2, 910 nm, 0.5 Å/s) deposited at 650 °C on
silicon was 166 ± 38 MPa. The measured residual stress of the pure cubic film deposited
on the sapphire substrate was 45 ± 19 MPa. The increased compressive stress in this film
compared to the one grown on silicon can be attributed to the smaller CTE mismatch
between the sapphire substrate (7.30 x 10⁻⁶
/ °C) and the film (7.07 - 15 x 10
-6 / °C
depending on phase and orientation) as compared to the silicon substrate (2.55 x 10⁻⁶
/
°C). This increase in compressive stress is also reflected in the peak shift within the
diffraction pattern to lower angles two-theta.

117
It is important to note that the measured residual stress of cubic phase film 10B
was significantly larger (166 ± 38 MPa) than for the mixed phase film 7E (650 °C, 50
sccm O2, 1.2 µm, 9.1 Å / s, Figure 5.3b) deposited on silicon at the same temperature (35
± 11 MPa), suggesting that larger tensile stresses may play a role in assisting formation of
the cubic phase. Indeed, all single phase cubic films deposited at 650 °C possessed
higher tensile stress than mixed phase films deposited at the same temperature. As
evidenced by lowering the deposition rate, the growth of the pure cubic phase under these
conditions can once again be related to the effect of surface diffusion lengths and residual
stress state. In this case, it is difficult to determine whether the cubic phase formation
was caused by the increased adatom mobility due to the lower deposition rate, or rather a
result of the increased tensile stress, or a mixed combination.
5.4. Stress induced phase transformation by ion beam assisted deposition (IBAD)
In order to differentiate between these two possible mechanisms, an experiment
was designed using ion beam assisted deposition (IBAD) to induce compressive stress
during Gd2O3 film growth on sapphire substrates. Sapphire substrates were chosen to
avoid significant interfacial layer formation as in the case of the silicon substrates.
Additionally, increased compressive stress due to the CTE mismatch between the
sapphire substrate and Gd2O3 film was predicted to help in driving the phase transition.
Ion bombardment during film growth using an O2 plasma at a floating voltage of
approximately 500V was performed for films 11B (650 °C, 50 sccm O2, 200 mA), 11C
(650 °C, 50 sccm O2, 400 mA), and 11D (650 °C, 50 sccm O2, 800 mA). The deposition
rate was kept at < 0.5 Å / s for all the films. Due to the low deposition rate and the

118
increased energy (i.e. current density) from the ion beam, it was possible to alter the
stress state of the films while keeping surface energy and atom diffusion lengths large.
This allowed for structural rearrangement of atoms and isolation of the effects of
diffusion length vs. residual stress on the phase stability of the Gd2O3 films.
The θ-2θ diffraction patterns for films 11A-11D deposited as a function of ion
beam power are shown in Figure 5.5. Table 5.2 displays the cubic and monoclinic phase
volumes calculated from the Rietveld refinement of the pattern as well as the measured
residual stress values determined by the wafer curvature method.
Figure 5.5. θ–2θ XRD patterns of Gd2O3 films 11A (0 mA), 11B (200 mA), 11C (400
mA), and 11D (800 mA) grown on sapphire at 650 °C and 50 sccm O2 under low growth
rate of ~0.5 Å / s as a function of ion beam source current.95
Film 11A (0 mA) deposited without any IBAD assistance under a low deposition
rate possessed a tensile stress of approximately 45 MPa and is fully cubic in nature.

119
Applying 200 mA (film 11B) of current during deposition resulted in 317 MPa of
compressive stress in the film. From Figure 5.5, film 1B is still predominantly of the
cubic phase with a small amount of monoclinic phase formation. The increase in the
energy at the film surface also promoted the growth of a strong preferred C(222)
orientation under heavy strain. This is reflected in the shift of the C(222) peak in the
XRD pattern from approximately 28.6 to 28.4 degrees two-theta and a measured residual
stress of -317 MPa. This stress was enough to induce a small amount of monoclinic phase
formation in the film.
Table 5.2. Phase volume and crystallite size for Gd2O3 films 11A (0 mA), 11B (200 mA),
11C (400 mA), and 11D (800 mA) grown on sapphire at 650 °C and 50 sccm O2 under
low growth rate of ~0.5 Å / s as a function of ion beam source current.
Film
Ion Beam
Current
(mA)
Cubic
Phase
Volume
(%)
Monoclinic
Phase
Volume
(%)
Measured
Residual
Stress
(MPa)
Cubic
crystallite
size (nm)
Monoclinic
crystallite
size (nm)
11A 0 100 0 45 ± 19 45 -
11B 200 98 2 -317 ± 76 54 13
11C 400 5 85 -517 ± 44 28 18
11D 800 0 100 -777 ± 77 - 16
Increasing the ion beam current further for film 1C (400 mA) resulted in a
compressive stress state of -512 MPa. The XRD pattern (Figure 5.5) shows that this film
is predominantly monoclinic phase. This suggests that a significant amount of the cubic
phase was converted to monoclinic phase with an applied stress between -317 and -517
MPa. Further increasing the ion beam current for film 11D (800 mA) resulted in a pure
monoclinic Gd2O3 film with a compressive residual stress of -777 MPa. No evidence of
the cubic phase was observed.
The crystallite sizes for films 11A – 11D are also listed in Table 5.2. An increase
in cubic crystallite size (45 nm to 54 nm) was observed with an increase in ion beam

120
current from 0 mA to 200 mA. This is explained by the extra energy supplied by the
highly mobile ions to overcome the nucleation barrier and begin growth. Further
increasing the ion beam current to 400 mA results in a decrease of cubic crystallite size
(54 to 28 nm) and an increase in monoclinic crystallite size (13 to 18 nm) as a result of
the phase transition in which more monoclinic crystallites grow at the expense of cubic
crystallites.
Raman spectroscopy was performed on films 11A-11D deposited as a function of
IBS current to further validate the film phases as shown in Figure 5.6. The locations of
the Raman bands for each sample were indexed to determine the phase content. For
baseline comparison, a Raman scan of cubic Gd2O3 powder was included. The primary
band corresponding to the cubic phase is shown at approximately 365 cm-1
. The primary
band of the monoclinic phase is located at approximately 420 cm-1
.
Figure 5.6. Raman spectra of cubic Gd2O3 powder and Gd2O3 films 11B (200 mA), 11C
(400 mA), and 11D (800 mA) grown on sapphire at 650 °C and 50 sccm O2 under low
growth rate of ~0.5 Å / s as a function of ion source current.

121
The Raman results correspond closely to the results shown from the x-ray
diffraction patterns. There is a clear increase in the monoclinic phase content with
increasing ion source amperage and increasing residual stress, again with the majority of
the transformation occurring between films 11B (-317 MPa) and 11C (-512 MPa). Film
11D (-777 MPa) also displayed no evidence of the cubic phase by Raman spectroscopy
suggesting that a cubic to monoclinic phase change in Gd2O3 can occur by introducing
compressive stress into the lattice. Indeed, based on these results, it is likely that
compressive stress is the primary reason for the phase transition observed with increasing
film thickness.
These results may be analogous to pressure induced phase transformations
observed in diamond anvil cell experiments of bulk Gd2O3 in which high pressure was
found to transform Gd2O3 from the cubic structure to higher density structures.39
In these
experiments, it has been shown that under hydrostatic pressure conditions, approximately
7-15 GPa of pressure is necessary to stabilize the phase change which is significantly
higher than the measured residual compressive stress (300 – 500 MPa) in the Gd2O3
films. Due to large surface to volume ratio, nanocrystalline materials may have vastly
different properties than bulk materials. Therefore, it may be possible to intitiate phase
transitions that are not possible in the bulk under the same conditions. It has been shown
in Zr3N4 that even though the overall stress in a thin film is low, high local stress regions
can lead to the nucleation of a metastable phase.96
For instance, in ZrO2 thin films, a
stress-induced phase transition from the tetragonal to monoclinic phase was driven with
only 300 MPa of compressive stress.97

122
There are numerous recent studies detailing phase transformations of Y2O398,99
,
Er2O3100
, Dy2O3100
, and Gd2O3101,102
films and bulk materials using large ion energies
(200 keV+) to drive the phase transformation. The phase transitions have been attributed
to a number of factors including: 1) large damage cascade followed by recrystallization
due to a thermal spike and 2) damage accumulation resulting in clustering of defects and
an increase in the Gibb’s Free energy above the phase boundary limit.100
The first
explanation is unlikely due to the low energy of the impinging ions in our experiments
(400-500eV) vs (200keV+) in the other experiments. The second explanation may
possibly explain the source of the residual stress. More specifically, the accumulation of
defects due to the bombarding ions disrupting the crystal structure results in increased
film stresses and eventually leads to the monoclinic phase formation. Finally, loss of
oxygen during ion irradiation has been suggested as a contributing factor to the phase
transition in other oxide materials under irradiation.101
However, in this experiment, the
film was bombarded with oxygen ions and the surface mobility was large allowing us to
discount oxygen deficiency as a reason for the phase transition.
5.5. Texture evolution in single phase cubic films deposited at low rates
Figure 5.4 showed the θ-2θ XRD patterns for film 10B (650 °C, 50 sccm O2, 910
nm, 0.5 Å/s) deposited on silicon, quartz, sapphire, and GaN being 100% cubic phase
regardless of the underlying substrate composition and structure. However, differences in
the preferred orientation and residual stress state of the films were observed. The relative
intensities of the C(222), C(400), C(440), and C(622) peaks for film 10B are listed in

123
Table 5.3 and compared to the expected intensity from the ICDD powder diffraction file
#0042-1014.
Table 5.3. Relative intensities of main cubic peaks for Gd2O3 film 10B (650 C, 50 sccm
O2, 910 nm.
Sample
C(222)
Relative
Intensity (%)
C(400)
Relative
Intensity (%)
C(440)
Relative
Intensity (%)
C(622)
Relative
Intensity (%)
10B / Silicon 100 0 2 3
10B / Quartz 100 10 7 17
10B / Sapphire 31 44 100 5
10B / GaN 100 7 3 0
ICDD #0042-1014 100 32 35 13
Due to the small lattice mismatch of Gd2O3 C(222) interplanar spacing (3.121 Å)
with that of Si(111) (3.136 Å), there is a strong degree of C(222) preferred orientation
observed in the film grown on silicon, with minimal contribution from the other Gd2O3
peaks. The film grown on quartz also possessed some preferred C(222) orientation, but is
more random in growth as compared to the silicon. This can be accounted for by the fact
that the C(222) planes are the low surface energy planes of the cubic bixbyte Ia3
structure. The C(222) planes have also been shown to nucleate even on amorphous
substrates despite there not being a template for its growth.49
The film grown on sapphire
exhibited C(440) preferred orientation despite being a higher surface energy plane. This
is attributed to the smaller lattice mismatch of the sapphire (006) basal plane interplanar
spacing (2.164 Å) with the spacing of the Gd2O3 C(440) plane (1.911 Å). The film
grown on GaN grows with strong C(222) preferred orientation despite the large lattice
mismatch (20%) between GaN and Gd2O3 and large difference in the basal plane spacing
of GaN (2.59 Å) and the Gd2O3 C(222) interplanar spacing (3.12 Å). This is partly due to
the close symmetry that the (111) planes in the bixbyite structure share with the (0001)

124
GaN basal plane. For very thin Gd2O3 films (<70 nm) deposited by MOCVD, Gd2O3 was
shown to grow epitaxially on GaN with significant dislocation density.55
In order to learn more about the texture evolution in the Gd2O3 films deposited at
low rates, grazing incidence x-ray diffraction (GIXRD) depth profiling was employed.
GIXRD scans were taken for film 10B (650 °C, 50 sccm O2, 910 nm, 0.5 Å/s) deposited
on quartz at incidence angles of 1, 2, 5, 10, and 15 degrees as shown in Figure 5.7.
Figure 5.7. Grazing incidence diffraction patterns taken at incidence angles of 1, 2, 5, 10,
and 15 degrees for film 10B (650 °C, 50 sccm O2, 910 nm, 0.5 Å/s) deposited on quartz.
The inset shows the magnified C(222) and C(400) peaks.
At a large incidence angle of 15°, the depth of penetration into the film is large
and the GIXRD pattern appears to be similar to the θ-2θ pattern, suggesting that the film
deposited on quartz is mostly randomly oriented. The inset in Figure 5.7 displays the

125
magnification of the C(222) and C(400) peaks. It is important to note that as the
penetration depth increases, the intensity ratio of the C(222) to C(400) peak increases.
This suggests that even for a fully cubic phase film, the C(222) planes are not stable at
large film thicknesses. This is further supported by the shift in the C(222) peak position
from approximately 28.6 ° to 28.4 ° as the penetration depth increases.
5.6. Pole figure analysis for determination of preferred orientation
Pole figures are stereographic projections of the crystallographic directions present in
a material. More specifically, pole figures describe the statistical average distribution of
the pole density for a certain-plane. In a randomly oriented material, the pole density is
uniform. When the pole density is concentrated in the stereographic projection, this
suggests the presence of preferred orientation. While θ-2θ XRD scans provide
information about out-of-plane texture in thin films, pole figures can reveal information
about in-plane texture as well. Fiber texture refers to films where preferred orientation
exists in the out-of-plane orientation, but the films are randomly oriented in-plane.
Biaxial texture occurs when the in-plane orientation becomes locked with respect to the
substrate. In this section, pole figure analysis will be used to determine the degree of in-
and-out-of-plane texture for 1) mixed phase films deposited at high rates, 2) single phase
films deposited at low rates, and 3) films deposited at low rates using ion beam assisted
deposition. These samples will specifically show the effects of increasing surface energy
and adatom mobility on the texture in thick Gd2O3 films. The samples used for pole
figure analysis to illustrate a wide range of texture are listed in Table 5.4.

126
Table 5.4. Films used in pole figure analysis and corresponding in-and-out-of-plane
textures.
Film Temperature
(°C)
O2
flow
(sccm)
IBS
Current
(mA)
Deposition
Rate
(Å / s)
Substrate
Out-of-
plane
texture
In-plane
texture
6A 250 200 0 7.5 Quartz Weak
M(-310) Random
6E 650 200 0 8.2 Quartz Strong
C(222) Random
10B 650 50 0 0.48 Quartz Strong
C(222) Random
10B 650 50 0 0.48 Sapphire Strong
C(440)
Medium
C(440)
10B 650 50 0 0.48 GaN Strong
C(222)
Strong
C(222)
11B 650 50 200 0.34 Quartz Strong
C(222)
Strong
C(222)
11B 650 50 200 0.34 Sapphire
Very
Strong
C(222)
Very
Strong
C(222)
5.6.1. Mixed phase films deposited at high rates
Figure 5.8 shows the C(222) and M(-402) pole figures for mixed phase film 6A
(250 °C, 200 sccm O2, 7.5 Å/s) deposited on quartz. As observed from the C(222) pole
figure, the distribution of the contour lines and their wide spacing suggests random
orientation of the (222) grains distributed throughout the film. There is some weak out-
of-plane texture of the M(-402) planes shown by the low intensity (~1000 counts) and
widely spaced contour lines. Other pole figures (not shown here) display that there is no
in-plane orientation for this film, but rather random orientation of crystallites dispersed
throughout the film. This is expected due to the low deposition temperature (250 °C) and
deposition rates which results in a low adatom mobility and an inability for the films to
develop any in-plane orientation with respect to the substrate.

127
Figure 5.8. (a) C(222) and (b) M(-402) pole figures of film 6A (250 °C, 200 sccm O2, 7.5
Å / s) deposited on quartz showing weak out-of-plane texture and random in-plane
texture.
Figure 5.9 displays the C(222) and M(-402) pole figures for film 6E (650 °C, 200
sccm O2, 8.2 Å /s) deposited on quartz. This film shows strong fiber texture of the
C(222) planes with tightly packed contour lines and high intensity (~9000 counts). Weak
out-of-plane texture of the M(-402) plane is also observed. This film is only strongly
oriented in the out-of-plane direction, with random in-plane orientation. Despite the high
deposition temperature, the fast arrival of metal flux at the film surface as well as the
amorphous substrate does not allow for in-plane alignment of the Gd2O3 film.
Figure 5.9. (a) C(222) and (b) M(-402) pole figures of film 6E (650 °C, 200 sccm O2, 8.2
Å / s) deposited on quartz showing strong fiber texture and random in-plane texture.
(a) (b)
(a) (b)

128
5.6.2. Single phase cubic films deposited at low rates on different substrate materials
Figure 5.10 displays the pole figures for single phase cubic film 10B (650 °C, 50
sccm O2, 0.5 Å / s) deposited on quartz. There is a strong out-of-plane texture for the
C(222) planes with maximum intensity located at ψ angle of 0°. There is some weak
texturing of the C(400) planes which are offset slightly from the center with a maximum
intensity at approximately 15 degrees from the surface normal.
Figure 5.10. Pole figures of (a) C(222), (b) C(400), (c) C(440), and (d) C(622) planes for
film 10B (650 °C, 50 sccm O2, 0.5 A / s) deposited on quartz showing strong fiber texture
and random in-plane texture.
(a) (b)
(c) (d)

129
The C(440) planes are randomly oriented throughout the sample and the C(622) planes
show a weak fiber texture. Despite the low deposition rate and fully cubic nature of the
film, no in-plane orientation is observed for film 10B deposited on quartz. This is likely
due to the amorphous nature of the quartz substrate which does not provide an adequate
template for epitaxy.
The pole figures for film 10B (650 °C, 50 sccm O2, 0.5 Å / s) deposited on
sapphire are shown in Figure 5.11. In agreement with the θ-2θ XRD pattern, there is a
strong C(440) out-of-plane texture (Figure 5.11c). Weak out-of-plane texturing of the
C(222), C(400) and C(622) planes are observed as shown in Figures 5.11a, 5.11b, and
511.d, respectively. The C(222) pole figure possesses a maximum intensity for six poles
located at approximately 35° from the surface normal. The theoretical angle between the
C(440) and C(222) planes in a cubic crystal is 35.2°, suggesting that an in-plane
orientation of the C(440) crystallites exists in this film. This is likely due to the low
growth rate and small difference in the sapphire (006) basal plane interplanar spacing
(2.164 Å) with the spacing of the Gd2O3 C(440) plane (1.911 Å). However, the spread of
the contour lines is very large, scattering over approximately 20-25 degrees suggesting
that the in-plane orientation is weak.

130
Figure 5.11. Pole figures of (a) C(222), (b) C(400), (c) C(440), and (d) C(622) planes for
film 10B (650 °C, 50 sccm O2, 0.5 Å / s) deposited on sapphire showing strong out-of-
plane texture and medium in-plane texture.
The pole figures for film 10B (650 °C, 50 sccm O2, 0.5 Å / s) deposited on GaN
are shown in Figure 5.12. The C(222) pole (Figure 5.12a) shows extremely strong out-of-
plane texture. A strong contribution from the C(400) planes (Figure 5.12b) is observed
as well. Interestingly, the C(440) pole figure shows six poles located at 35° from the
surface normal. This angle agrees well with the theoretical angle between the C(222) and
C(440) planes, suggesting very strong in-plane orientation of the C(111) crystallites.
This is further supported by the six C(622) poles (Figure 5.11d) which show a maximum
(a) (b)
(c) (d)

131
intensity at 30 ° ψ, close to the theoretical angle of 29.5° between the C(622) and C(222)
planes. Additionally, the spread of the contour lines is scattered over only a few degrees,
suggesting very good in-plane orientation. This is likely a result of the close symmetry
the C(111) bixbyite plane shares with the GaN (0002) basal plane.
Figure 5.12. Pole figures of (a) C(222), (b) C(400), (c) C(440), and (d) C(622) planes for
film 10B (650 °C, 50 sccm O2, 0.5 Å / s) deposited on GaN showing strong in and out-
of-plane texture.
Interestingly, sixfold symmetry was observed for the C(111) planes instead of
the expected threefold symmetry. Similar sixfold symmetry was also present for bixbyite
Sc2O3 grown epitaxially on GaN via molecular beam epitaxy and was attributed to a 180
(a) (b)
(c) (d)

132
° rotational twin.103
Twinning of the C(111) plane has been used to explain sixfold
orientation in other cubic bixbyite oxides grown on GaN.104
For film 10B, as the film
thickness increases, the large lattice mismatch (~20%) between GaN and Gd2O3 causes
formation of defects within the film, which initiate polycrystalline growth as observed by
the formation of the C(400) planes. Nevertheless, the excellent sixfold in-plane
alignment of the C(111) crystallites suggests the possibility of epitaxy for a smaller
Gd2O3 film thickness.
Figure 5.13 displays the pole figures for film 11B (650 °C, 50 sccm O2, 200 mA)
deposited on quartz using ion beam assisted deposition. As observed from the C(222)
pole (Figure 5.13a), a very strong out-of-plane C(222) texture (94,000 counts) exists.
The C(400) pole figure (Figure 5.13b) shows threefold symmetry of the C(111) poles at
an angle of 55° from the surface normal, consistent with the theoretical angular difference
(54.7°) between the C(222) and C(400) planes. The C(440) and C(622) poles also reveal
the presence of in-plane orientation (Figure 5.13c and 5.14d, respectively), confirming
that the film is heavily textured both in-and-out-of-plane. The spread of the contour lines
is shown over approximately 5-10 degrees, showing strong in-plane orientation. The
formation of biaxial texture on an amorphous substrate such as quartz shows the
capability of using ion beam assisted deposition to tailor the orientation of the films.
Figure 5.14 displays the pole figures for film 11B (650 C, 50 sccm O2, 200 mA)
deposited on sapphire using ion beam assisted deposition. Note that the intensities are
lower due to use of an iron filter to protect the diffractometer detector from damage due
to high intensity. The iron filter decreases the measured intensity by approximately an
order of magnitude.

133
Figure 5.13. Pole figures of (a) C(222), (b) C(400), (c) C(440), and (d) C(622) planes for
film 11B (650 °C, 50 sccm O2, 0.5 Å / s, 200 mA) deposited on quartz using ion beam
assisted deposition (IBAD) showing strong in and out-of-plane texture.
The pole figures for film 11B deposited on sapphire are similar to that of film 11B
deposited on quartz. However, the spread in the contour lines is extremely small,
suggesting excellent in-plane texture. This is likely due to the ability for the Gd and O
atoms to order themselves along a single crystalline template as opposed to an amorphous
substrate such as quartz. Despite the formation of a small amount of monoclinic phase
(2%), the films are nearly epitaxial. This suggests that perhaps by slightly lowering the
(a) (b)
(c) (d)

134
ion beam energy, IBAD can facilitate the growth of thick epitaxial C(111) oriented
Gd2O3 films.
Figure 5.14. Pole figures of (a) C(222), (b) C(400), (c) C(440), and (d) C(622) planes for
film 11B (650 °C, 50 sccm O2, 0.5 Å / s, 200 mA) deposited on sapphire using ion beam
assisted deposition (IBAD) showing very strong in and out-of-plane texture.
5.7. Conclusions
Single phase cubic films were deposited under select conditions at a deposition
temperature of 250 °C for very thin films (< 50 nm). It was shown through XRD
residual stress measurements that cubic phase films deposited under these conditions
were under significant compressive stress. This compressive stress was hypothesized to
be the driving force for the cubic to monoclinic phase transition. In order to determine
(a) (b)
(c) (d)

135
whether or not compressive stress could drive the phase transition, wafer curvature
technique was used to determine the total residual stress in the Gd2O3 films deposited
under different conditions. It was found that increasing the deposition temperature
resulted in increased tensile stresses in the Gd2O3 films. The accompanying increase in
cubic phase volume was attributed to both increased tensile stresses in the film and
increased adatom mobility allowing for the formation of the cubic phase. The deposition
rate was then lowered to < 1 Å / s at a deposition temperature of 650 °C which allowed
for the deposition of 1 µm thick cubic phase films. Wafer curvature measurements
showed that the cubic phase films possessed tensile stress approximately 100 MPa greater
than the mixed phase films deposited at the same temperature with high deposition rate.
In order to separate the effects of adatom mobility and residual stress on the phase
stability, an experiment was designed using ion beam assisted deposition (IBAD) which
allowed for the introduction of compressive stress in the film while keeping the adatom
diffusion length on the film surface large. The experimental results confirmed the
hypothesis of stress dependent phase stability. Increasing the amount of compressive
stress in the Gd2O3 films through ion bombardment during growth as shown in Figure
5.15 resulted in driving the cubic to monoclinic phase transition. The bulk of the phase
change occurs between 317 and 517 MPa of applied compressive stress for the
experimental conditions studied.
The texture evolution of the Gd2O3 films was further investigated using θ-2θ,
GIXRD depth profiling and pole figure analysis. θ-2θ analysis showed that the out-of-
plane texture differed significantly based on the substrate type. GIXRD analysis showed
that for pure cubic phase films deposited under low rates at 650 °C, the C(222) planes are

136
heavily textured near the substrate/film interface and that with increasing film thickness,
other orientations begin to be favored. This is attributed to increased strain with
increasing film thickness.
Figure 5.15. Relationship between residual stress and phase volume for films 11A (0
mA), 11B (200 mA), 11C (400 mA), and 11D (800 mA) grown on sapphire at 650 °C
and 50 sccm O2 under low growth rate of ~0.5 Å / s as a function of ion source current.
The bulk of the phase transition occurs when the compressive residual stress is between
317 MPa and 517 MPa.
Pole figure analysis was employed to look at the in-plane texture of the Gd2O3
films. It was shown that mixed phase films deposited at low temperatures possess weak
out-of-plane texture / random texture. Mixed phase films deposited at high temperatures
possess a fiber texture, but lack the necessary adatom mobility to develop in-plane
texture. For single phase cubic films grown under low rates of deposition, out-of-plane
texture is observed on quartz substrates. However, weak and strong in-plane textures are

137
observed for sapphire and GaN substrates, respectively, and will be related to the film
structure in Chapter 6. The use of ion bombardment resulted in the formation of
moderate biaxial texture for films grown on quartz. For films grown on sapphire, a very
strong biaxial texture is achieved with ion bombardment which adds additional energy to
the system.

138
Chapter 6
Results and Discussion: Microstructure, composition, and interfacial phenomena of
Gd2O3 films.
In this chapter, the effects of processing on film morphology, interfacial
chemistry and composition will be discussed. Analysis of film morphology was
primarily carried out by scanning electron microscopy (SEM), transmission electron
microscopy (TEM), and atomic force microscopy (AFM). SEM was used to image the
top surface of the films and examine grain size and surface porosity. TEM was used in
conjunction with electron diffraction to investigate the cross sections of the Gd2O3 films,
with specific emphasis on porosity, crystallinity, phase, orientation, and interfacial
phenomenon. AFM was used to measure the surface roughness of the films. X-ray
photoelectron spectroscopy (XPS) and energy dispersive x-ray spectroscopy (EDS) were
performed on select films for compositional investigation.
Throughout this chapter, film processing and crystallographic structure will be
linked to the film microstructure. The chapter will begin with characterization of set 8,
composed of very thin Gd2O3 films (variable temperature, variable O2 flow, < 50 nm
thick), in order to understand the growth processes at the first stages of film growth.
Then, discussion will move to the effect of deposition temperature on thick (> 1 µm)
Gd2O3 film structure with emphasis on sets 2 (function of temperature, 200 sccm O2 flow,
~1 – 2 µm) and 6 (function of temperature, 200 sccm O2 flow, ~1 µm thick). The effect
of oxygen flow will be discussed, with emphasis on sets 1(650 °C, function of oxygen
flow, ~2 µm) and 4 (250 °C, function of oxygen flow, ~1 µm). Characterization of sets 3
(250 °C, 200 sccm O2, function of film thickness) and 9 (650 °C, 200 sccm O2, function

139
of film thickness) will cover the effect of film thickness on Gd2O3 films. The effects of
low deposition rate and substrate type on film structure will be examined with
characterization of films from set 10. Furthermore, the effects of ion bombardment on
the microstructure of the films will be discussed in set 11 (650 °C, 50 sccm O2, 0.5 A/s,
function of ion beam current). Lastly, characterization of select films subject to heat
treatments will be presented and discussed.
6.1. The effects of processing on Gd2O3 film structure and interface
6.1.1. The structure of thin (< 50 nm) Gd2O3 films deposited on silicon (111)
To gain a better understanding of the growth mechanisms present in the thick (> 1
µm) Gd2O3 films, it is important to look at the initial stages of film growth. Therefore,
the structure and morphology of Gd2O3 thin films from set 8 (< 50 nm thick Gd2O3 films)
were examined. Figure 6.1a – 6.1c displays the top surface SEM images of films 8A (250
°C, 200 sccm O2, 47 nm thick), 8B (250 °C, 25 sccm O2, 41 nm thick), and 8E (650 °C,
200 sccm O2, 20 nm thick), respectively. As shown from x-ray diffraction measurements
in section 5.1, film 8A deposited at 250 °C and under 200 sccm O2 flow, was fully cubic
and possessed random orientation. The film surface as shown in Figure 6.1a is
characterized by clusters of small grains separated by voids. Figure 6.1b displays the top
surface SEM image of mixed phase film 8B deposited at 250 °C under 25 sccm O2 flow.
This film shows a denser surface morphology with more surface continuity. The presence
of voiding between the grains is not as apparent. This is due to less oxygen being present
in the chamber resulting in greater Gd adatom diffusion length and better surface
coverage leading to less entrapped oxygen within the film. This will be discussed further
in section 6.1.3. Film 8c displays the top surface SEM image of mixed phase film 8E

140
deposited at 650 °C under 200 sccm O2 flow. This film has a very dense surface
morphology and possesses a larger grain diameter than the film deposited at 250 °C as a
result of the greater adatom mobility supplied by elevated temperature (650 °C) which
allows for densification and grain growth consistent with the structure zone model.15
Figure 6.1. Select SEM top surface images of thin Gd2O3 films (a) 8A (250 °C, 200 sccm
O2, 47 nm), (b) 8B (250 °C, 25 sccm O2, 41 nm), and (c) 8E (650 °C, 200 sccm O2, 20
nm) deposited on silicon.
For further analysis of the structure and phase, TEM analysis of the film cross
sections was employed. Figure 6.2 shows the low-magnification bright-field TEM
images of thin Gd2O3 films 8A and 8E grown at (a) 250 °C and (b) 650 °C under 200
sccm O2 flow, collected along the Si <110> zone axis under multibeam diffraction
Voiding
(a)
(c)
(b)
(c)

141
conditions. As shown in Figure 6.2a, the surface of the film grown at 250 °C appears to
be rough, while the surface of the film grown at 650 °C is relatively smooth (Figure
6.2b).
Figure 6.2. Low-magnification bright-field TEM images of thin Gd2O3 films (a) 8A (250
°C, 200 sccm O2, 47 nm) and (b) 8E (650 °C, 200 sccm O2, 20 nm). The arrows denote
porous regions. The corresponding SAD patterns are shown in (c) and (d), respectively. 105
For both heterostructures, a thin layer with a bright contrast exists at the
film/substrate interface. Nanometer-size pore-like features with a relatively brighter
contrast than the rest of the film were also observed in the 250 °C grown film, as
indicated by the arrows in Figure 6.2a. High-resolution TEM indicated that those features
were disordered domains surrounded by the crystallites. The relatively brighter contrast
of these pore-like features suggests that these features are probably more oxygen-rich

142
than the Gd2O3 crystallites. In comparison to 8A (250 °C), the thin film 8E grown at
650 °C appears to be dense without pore-like features, in similar fashion to the surface
images shown in Figure 6.1c.
It is important to note that film 8E (20 nm) is thinner than film 8A (47 nm),
making direct comparison of the two films difficult. However, film 8E clearly has a
larger grain size than 8A even though 8E film thickness is approximately half that of 8A.
Generally, surface roughness and grain size increase with film thickness. However, as
will be shown later in section 6.2, thick Gd2O3 films (>1 µm) deposited at 650 °C remain
dense throughout the nucleation region which is approximately 200 nm thick before the
onset of columnar growth. Therefore, we believe that a similar structure to film 8E will
be observed even for films 50 nm thick. Instead, the difference in the structure between
8A and 8E can be explained by the greater surface diffusion present for samples
deposited at higher substrate temperatures. For film 8A, the deposition temperature of
250 °C results in a structure with small crystallites separated by voids which cannot be
filled due to the low surface mobility of the adatoms. The increased temperature of 650
°C allows the adatoms to diffuse further resulting in improved surface coverage and
higher density.
Figures 6.2c and 6.2d are SAD patterns corresponding to the brightfield TEM
images shown in Figures 6.2a and 6.2b, respectively. Each SAD pattern was collected
from a region containing both the Si substrate and the Gd2O3 film, in which the strong
spots are from the single crystalline Si substrate while the reflections from the film are
rather weak due to the low film thickness. As shown in the SAD patterns, the reflections
from 8A (250 °C) and 8E (650 °C) are different, indicating that the films have different

143
phases and microstructure. For 8A, the thin film grown at 250 °C, the reflections
observed in Figure 6.2c can be described as nearly continuous rings, indicating that the
film consists of small crystallites with random orientations. Indexing the SAD pattern
(Figure 6.2c) of 8A (250 °C) suggests that it is predominantly cubic with the three rings
1, 2, and 3 corresponding to the C(222), C(400), and C(440) reflections of cubic Gd2O3,
respectively. In comparison, the reflections shown in Figure 6.2d have a short arc/spot
appearance, indicating a textured structure for the 650 °C grown film (8E). The two short
arcs 1 and 2 in the diffraction pattern shown in Figure 6.2d, correspond to the C(222)
reflection of cubic Gd2O3 and the M(-402) reflection of monoclinic Gd2O3, respectively.
This confirms that the 650 °C film (8E) consists of both cubic and monoclinic Gd2O3
phases (mixed phase).
In Figure 6.2a, several regions appear to be disordered besides the pore-like
region indicated by the arrows. While some of those regions may be amorphous, we
believe that the majority of them are crystalline as indicated by the SAD pattern. The
disordered appearance of those regions in the high-resolution TEM image is most likely
related to the crystallographic orientations of the crystallites. The crystallites were likely
oriented in such directions that the d-spacings of the crystal planes parallel to the incident
electron beam are beyond the resolution of the TEM, which led to the disordered
appearance. Further analysis in the FEI Titan 3 microscope may assist in resolving the
disordered appearance.
To further support the SAD pattern results, high resolution TEM images were
obtained for films 8A and 8E as shown in Figure 6.3.

144
Figure 6.3. High-resolution TEM images of thin Gd2O3 films (a) 8A (250 °C, 200 sccm
O2, 47 nm) and (b) 8E (650 °C, 200 sccm O2, 20 nm). A few crystallographic planes
were indicated by short white lines and labeled. FFT patterns of (c) 8A and (d) 8E. Four
spotty rings are marked by short white lines in (c).105

145
A high-resolution TEM image of the 250 °C grown Gd2O3 film (8A) is shown in
Figure 6.3a, which reveals crystallites with different orientations and sizes on the order of
∼10 nm. The Fast Fourier Transform (FFT) pattern of the image is shown in Figure 6.3c,
in which four spotty rings are apparent. The spacings of these 4 spotty rings correspond
to the d-spacings of the cubic C(222), C(400), C(440), and C(622) planes, thus indicating
that the 250 °C film is cubic.
Figure 6.3b is a typical high-resolution TEM image of the 650 °C grown Gd2O3
film (8E), with the corresponding FFT pattern shown in Figure 6.3d. The film consists of
domains with sizes on the order of ∼10 – 20 nm. Both cubic and monoclinic domains
were observed, with the C(222) and M(-402) planes nearly parallel to the (111) plane of
the Si substrate. High-resolution TEM images collected from the interface regions of 8A
(250 °C, Figure 6.3a) and 8E (650 °C, Figure 6.3b), indicate a bright layer that is
disordered with a thickness of ∼2 nm. These disordered layers are SiOx-rich, similar to
the interface layers between electron-beam evaporation deposited thin polycrystalline
Gd2O3 films on Si substrates reported in the literature.60,106,107
The effects of temperature clearly had a substantial impact on film phase, growth
and morphology of the thin films from set 8. The initial growth characteristics set the
template for the resulting growth of the thick Gd2O3 films. In the next sections, the
effects of increasing deposition temperature, oxygen flow, and film thickness will be
discussed for micron thick Gd2O3 films.
6.1.2. Effects of temperature on Gd2O3 film morphology deposited on Si(111)
Figures 6.4a – 6.4e show SEM top surface images for thick (~1-2 µm) Gd2O3
films 2A-2E deposited as a function of temperature under 200 sccm O2 flow.

146
Figure 6.4. SEM top surface images of Gd2O3 films (a) 2A (250 °C), (b) 2B (350 °C),
(c) 2C (450 °C), (d) 2D (550 °C), and (e) 2E (650 °C) deposited as a function of
temperature under 200 sccm O2 flow at high rates ( > 5 Å / s). Arrows denote voiding.
As observed in Figure 6.4a, film 2A deposited at 250 °C shows film growth
leading to a slightly porous surface morphology with small grain sizes of approximately
50 nm separated by voids.
(a) (b)
(c) (d)
(e)

147
As the deposition temperature is increased to 350 °C (film 2B), the surface
becomes more textured with voiding still being observed as shown in Figure 6.4b.
Further increasing the deposition temperature to 450 °C (Film 2C, Figure 6.4c) results in
significant grain growth and a marked increase in the surface porosity/voiding. At
deposition temperatures of 550 °C (film 2D) and 650 °C (film 2E), this effect becomes
more pronounced as shown in Figures 6.4d and 6.4e, respectively. The top surface image
of sample 2E deposited at 650 °C shows an extremely complex, rough, and porous
surface morphology. Image analysis was attempted in order to obtain grain size for the
high temperature grown films, but the rough, irregular surface made it difficult to obtain
accurate values. However, the increase in grain size does correlate with increase in
crystallite size as calculated using Scherrer’s formula from the x-ray diffraction
measurements in section 4.2
As previously discussed in section 2.4.3, coatings deposited by vapor techniques
at high substrate temperatures typically exhibit a dense columnar or equiaxed grain
structure due to the high adatom mobility which allows for structural rearrangement and
densification according to the structure zone model presented by Thornton43
and
Messier.15
However, due to the relatively high rate of evaporation for films 2A-2E, it is
possible that the metal flux is arriving so quickly that the surface mobility is limited.
This results in an effect called shadowing, in which high points on the growing film
surface receive more metal flux than the valleys resulting in increased void formation.108
Due to the high rates of deposition, the adatom mobility is not sufficiently high for the
atoms to provide full surface coverage so the atoms coalesce in the high flux regions.
When this occurs, voids begin to form between the columns. Due to geometrical

148
constraints, the shadowing effectively screens the flux of arriving metal atoms and the
low mobility prevents the voids from being filled. However, this may not solely explain
the observed surface morphology as a function of temperature observed in Figure 6.4.
Based on the fact that higher temperature results in greater surface mobility, it
would be expected that the effect of shadowing would be more pronounced in low
temperature films and would lead to increased porosity. Indeed, in section 6.1.1, it was
shown that this is the case for very thin (< 50 nm) Gd2O3 films, where film 8E deposited
at 650 °C was significantly denser than film 8A deposited at 250 °C. However, this
appears to be different in the case of thicker films (> 1 µm), where film 2E deposited at
650 °C appears to be more porous than film 2A deposited at 250 °C (Figure 6.4). This
discrepancy is explained by the combined effects of temperature and shadowing during
Gd2O3 film growth. At low deposition temperatures, there is insufficient mobility for
significant grain growth or preferential texturing. This leads to a high density of nuclei
and a low grain coalescence rate. As the film grows thicker, the low surface mobility
results in the formation of small voids between the crystallites. When the deposition
temperature is increased, more surface energy is provided resulting in preferential growth
of large columnar grains at a deposition temperature of 650 °C. While the columns
themselves are dense, they may grow at different rates or in various orientations leading
to non-uniform grain growth. These protruding columns act to block the incoming vapor
flux. The atoms coalesce at the column tips, resulting in porosity between the columns.
As the columns grow larger with increasing film thickness, the voiding between them
increases, resulting in a porous top surface as shown in Figure 6.4e. An additional reason
as to the complex Gd2O3 surface morphology can be explained by the increase in

149
monoclinic phase content with increasing film thickness. This will be discussed in
greater detail in section 6.1.4
Grain size measurements were performed on the SEM surface images at
magnification of 50,000 × for Gd2O3 films deposited at 250 °C. Figures 6.5a and 6.5b
display an SEM surface image and the Clemex analytical software technique for grain
size measurement of sample 2A deposited at 250 °C under 200 sccm O2 flow. The
colored areas in Figure 6.5b correspond to the individual grains.
Figure 6.5. (a) SEM surface image of film 2A (250 °C, 200 sccm O2, 1.26 μm) and (b)
the corresponding grain size measurement technique. The measured grain size was 51.2
±1.6 nm for film 2A deposited at 250 °C under 200 sccm O2 flow.
Ten SEM images were obtained from various locations on the surface of each
film and subsequently measured by the Clemex analytical software grain size
characterization technique. Only the grain size of films deposited at 250 °C was
quantitatively measured. The values agreed well with those calculated from XRD and
Scherrer’s method. Films deposited at elevated temperatures displayed a large amount of
surface texturing resulting in the previously discussed irregular grain structure and
therefore, grain size could not be quantitatively measured for those samples accurately.
TEM cross sectional samples were prepared in order to further investigate the
effect of temperature on Gd2O3 film microstructure. Film 6A (250 °C, 200 sccm O2,
(a) (b)

150
1.07 µm), deposited under similar conditions as 2A, was used for analysis. Figure 6.6
shows (a) low-magnification and (b) higher magnification bright-field TEM images of
Gd2O3 film 6A grown at 250 °C under 200 sccm O2 flow, collected along the Si<112>
zone axis.
Figure 6.6. (a) Low-magnification and (b) high-magnification bright-field TEM images
of thick Gd2O3 film 6A (250 °C, 200 sccm O2, 1.07 µm). The arrows denote porous
regions. SAD patterns were collected from the (c) interfacial region, (d) the middle
section, and (e) the top section of the film, respectively. Five primary diffraction rings are
marked by short white lines in each diffraction pattern for identifying crystal planes and
phases present.
Film 6A consists of a high density of porous regions as shown by the arrows in
Figure 6.6a-b. In addition, a disordered layer with a relatively brighter contrast is also
present at the film/substrate interface (Figure 6.6b). Such a layer is not apparent in the
lower magnification image (Figure 6.6a), presumably due to the small thickness of the
layer and the overall dark contrast of the interface region caused by the large TEM
specimen thickness. Figures 6.6c–e show SAD patterns collected from the interfacial

151
region consisting of both the bottom section of the film and the Si substrate, the middle
section, and the top section of the film, respectively.
The diffraction rings in the SAD patterns suggest that thick film 6A contains
randomly oriented grains with small sizes, similar to the thin 250 °C grown film (8A)
discussed in section 6.1.1. In Figure 6.6c, the five diffraction rings (with increasing radii)
correspond to the C(222), C(400), C(422), C(440), and C(622) reflections of cubic
Gd2O3, respectively. Therefore, the bottom section of the film is predominantly cubic,
consistent with the observation from the thin 250 °C grown film (8A). The diffraction
patterns from the middle and the sections of the film shown respectively in Figures 6.6d
and 6.6e also appear to be dominated by five diffraction rings of cubic Gd2O3. However,
extra reflections from another phase are also visible. In particular, additional reflections
are not present between the strong C(222) and C(400) rings in the bottom section of the
film (Figure 6.6c), yet weak reflections are discernible between these two rings in SAD
patterns collected from the middle (Figure 6.6d) and top (Figure 6.6e) sections of the film
as shown in Figures 6.6d and 6.6e. Considering that the high intensity reflections of
monoclinic Gd2O3, M(111), M(401), M(-402), M(003), M(310), and M(-112), lie near or
in between the cubic C(222) and C(400) rings, the SAD results indicate the formation of
a small amount of monoclinic phase in the middle and top sections of the film. Therefore,
the monoclinic phase gradually formed as the thickness of film 6A increased. This
confirms the earlier prediction of the occurrence of a phase transition with increasing
Gd2O3 film thickness, which was based on the x-ray diffraction results presented in
section 4.4. Additionally, high-intensity arcs are observed in Figure 6.6d, indicating the
presence of regional texture in the middle section of the film.

152
It is worth noting that a diffuse ring overlaps with the first two diffraction rings
(C(222) and C(400)) of the crystalline Gd2O3 in Figures 6.6d and 6.6e. The diffuse ring
arose due to the increased volume of amorphous porous regions for the film in the growth
direction. In comparison, the diffraction pattern collected from the interface region
(Figure 6.6c), consists of sharp diffraction rings from crystalline Gd2O3. Similarly, in the
diffraction pattern of the 250 °C heterostructure with the thin Gd2O3 film 8A shown in
Figure 6.2c, the Gd2O3 reflections were dominated by sharp rings 1, 2, and 3. Diffuse
rings associated with amorphous Gd2O3 were not observed in either Figure 6.2c or Figure
6.6c, which strongly suggests that the thin film (8A) and the bottom part of the thick film
(2A) are primary crystalline. This indicates that amorphous like regions formed as the
film thickness grew larger, possibly a result of the cubic to monoclinic phase transition.
Figure 6.7 shows (a) low-magnification and (b) higher magnification bright-field
TEM images of Gd2O3 film 6E (650 °C, 200 sccm O2, 0.87 µm) grown at 650 °C,
collected along the Si<112> zone axis. The film, especially the top section, possesses a
columnar structure with large grains elongating in the growth direction. The film was
dense near the film/substrate interface, consistent with the structure of the 20 nm thin
film (8E) deposited at 650 °C. Pores formed between the columnar grains as the growth
proceeded as denoted by the arrows in Figure 6.7(a). This is due to the effects of
columnar grain growth, shadowing, and increasing monoclinic phase content previously
discussed. As a result of the increased porosity near the top of the film, the surface
becomes very rough.

153
Figure 6.7. (a) Low-magnification and (b) high-magnification bright-field TEM images
of thick Gd2O3 film 6E (650 °C, 200 sccm O2, 0.87 µm). The arrows denote porous
regions. SAD patterns collected from the (c) interfacial region, (d) the middle section,
and (e) the top section of the film, respectively.
The SAD patterns collected from the interfacial region, the middle section, and
the top section of film 6E (650 °C, 200 sccm O2, 0.87 µm) are shown in Figures 6.7c –
6.7e, respectively. As revealed in Figure 6.7c, the diffraction rings from the bottom
section of the 650 °C film appear to be relatively continuous. Therefore, the grains near
the film/substrate interface have a small size, similar to those in the thin 650 °C film 8E.
The Gd2O3 diffraction rings appear to be less continuous in SAD patterns collected from
the middle and the top sections of the film as a result of increasing grain size suggesting
greater crystallinity in the film growth direction. Diffraction consists of both monoclinic
and cubic Gd2O3 reflections, with monoclinic rings dominating as the film grows thicker
(Figure 6.7c).

154
The change in surface morphology as a function of deposition temperature was
further investigated by AFM surface topography. Figure 6.8a shows a fairly smooth and
uniform surface for sample 2A deposited at 250 °C under 200 sccm O2 flow. AFM
topography of film 2E deposited at 650 °C (Figure 6.8b) shows a much rougher and
textured film supported by the TEM cross section shown in Figure 6.7
Figure 6.8. AFM surface topography of Gd2O3 (a) film 2A (250 °C, 200 sccm O2, 1.26
μm) and (b) film 2E (650 °C, 200 sccm O2, 2.05 μm).
RMS surface roughness measurements were made for each sample by calculating
an average value from three topography scans taken over 1 μm2 and 5 μm
2 areas. An
increase in surface roughness from 8.6 ± 0.5 nm to 56.6 ± 1.2 nm is observed with
increasing deposition temperature from 250 °C to 650 °C. A peak to valley roughness of
approximately 400 nm is observed in Gd2O3 film 2E deposited at 650 °C, suggesting that
the porosity observed between the columns in the cross sectional TEM image is
significant. This could have deleterious effects on electrical fabrication and properties
resulting in poor contact uniformity, increased leakage currents, and reduced dielectric
constant.
(a) (b)

155
6.1.3. Effect of oxygen flow on the Gd2O3 film morphology of s deposited on Si(111)
The effects of O2 flow on the microstructure of the thick Gd2O3 films from set 1
(650 °C, function of O2, ~2 µm) and set 4 (250 °C, function of O2, ~1 µm) were examined
via TEM, SEM, and AFM. The O2 flow not only affects the film phases, but also impacts
the film porosity and the film/substrate interfacial reaction region. As discussed in section
6.1, for thin films (< 50 nm, set 8), lowering the oxygen flow from 200 sccm (film 8A) to
25 sccm (film 8b) for films deposited at 250 °C resulted in a denser surface morphology
with less voiding which was attributed to adatom mobility during growth. A similar
trend is observed for thick Gd2O3 films deposited at 250 °C (set 4).
Figure 6.9 shows the SEM top surface images for set 4 (250 C, function of O2
flow, ~1 µm). The surface of film 4A (Figure 6.9a) deposited under 25 sccm O2 flow
shows a very dense and textured surface morphology. The grains are well defined with
sharp edges. As the O2 flow is increased to 50 sccm, low voiding between the grains is
observed, though the general structure is preserved. As the oxygen flow is increased to
100 sccm (film 4C, Figure 6.9c) and 150 sccm (film 4D, Figure 6.9d), the surface
becomes increasingly less textured and more porous. Finally, for film 4E (Figure 6.9e)
deposited under 200 sccm O2 flow, a significant amount of surface porosity is observed.
The grains also possess a more spherical geometry than the films deposited at lower
oxygen flow (25 – 150 scm) which possessed pyramidal geometry. These observations
are supported by the diffraction patterns displayed in section 4.4 which showed improved
crystallinity and reduced FWHM for films deposited at low oxygen flow. Additionally,
the cubic phase volume fraction (Table 4.4) increased with increasing oxygen flow which
may be related to the observed structure.

156
Figure 6.9. SEM top surface images of Gd2O3 films (a) 4A (25 sccm O2), (b) 4B (50
sccm O2), (c) 4C (100 sccm O2), (d) 4D (150 sccm O2), and (e) 4E (200 sccm O2)
deposited as a function of oxygen flow at 250 °C at high rates ( > 5 Å / s).
The increased porosity observed in the higher O2 flow films can be described by
the effects of adatom mobility similar to the case of the thin (<50nm) films discussed in
section 6.1. Increasing the amount of oxygen in the chamber reduces the Gd adatom
diffusion length and results in poor surface coverage. Due to shadowing of the incoming
(a) (b)
(c) (d)
(e)

157
Gd flux, the effects of poor adatom mobility are compounded as the film grows thicker
resulting in a more pronounced porosity between the grains for thicker films.
For further understanding of oxygen flow effects on the thick Gd2O3 films
deposited at 250 °C, TEM analysis was performed. Figure 6.10 shows (a) low-
magnification and (b) high-magnification bright-field TEM images of 1.11 μm thick
Gd2O3 film 7A grown at 250 °C using an oxygen flow of 50 sccm, collected along the
Si<112> zone axis. TEM analysis suggests that film 7A (250 °C, 50 sccm O2, 1.1 µm)
also consists of small crystallites surrounded by a few porous regions, similar to film 6A
(250 °C, 200 sccm O2, 1.07 µm Figure 6.6). In addition, a thin interface layer with a
relatively brighter contrast is present. Figures 6.10c – 6.10e show SAD patterns collected
from the interfacial region consisting of both the bottom section of the film and the Si
substrate, the middle section, and the top section of the film, respectively.
The diffraction rings in the SAD patterns suggest that the film contains randomly
oriented grains with small sizes, similar to the 250 °C film (6A) grown under 200 sccm
O2. The SAD pattern from the bottom section of the film shown in Figure 6.10c is similar
to that of 6A (Figure 6.2c), indicating that the bottom part of film 7A grown under 50
sccm is also predominantly cubic. However, some weak spots did exist between the
strong C(222) and C(400) rings in Figure 6.10c, suggesting that a small amount of
monoclinic phase formed near the film/substrate interface with lower O2 flow (50 sccm).
Furthermore, as shown in Figures 6.10d and 6.10e, many diffraction rings from
monoclinic Gd2O3 were perceived in the SAD patterns from the middle and the top
sections of the film. These results suggest qualitatively that more monoclinic Gd2O3

158
formed during the growth under 50 sccm O2 (7A) than under 200 sccm O2 (6A),
consistent with the x-ray diffraction results presented in section 4.4.
Figure 6.10. (a) Low-magnification and (b) high-magnification bright-field TEM images
of thick Gd2O3 film 7A (250 °C, 50 sccm O2, 1.11 µm). SAD patterns collected from the
(c) interfacial region, (d) the middle section, and (e) the top section of the film,
respectively.
A careful comparison of the TEM images from the thick 250 °C films grown
using different O2 flows revealed differences in the microstructure. As demonstrated in
Figures 6.2a, 6.2b, 6.10a, and 6.10b, a lower O2 flow of 50 sccm led to reduced film
porosity and a more homogeneous thin interfacial disordered SiOx layer as compared to
the films deposited at higher O2 flow (200 sccm). These differences in the microstructure
may be explained qualitatively in terms of the O2 flow reducing Gd adatom mobility. The
lower O2 flow allowed more time for the Gd atoms to diffuse on the surface before
reacting with oxygen, which leads to a more complete surface coverage of Gd2O3. In

159
comparison, the high O2 flow reduced the Gd diffusion length on the surface, thus leading
to the formation of Gd2O3 nanocrystallites and porous regions in between.
Figure 6.11 shows the top surface images for films from set 1 deposited as a
function of oxygen flow at a deposition temperature of 650 °C. For film 1A (Figure
6.11a) deposited under 50 sccm O2 flow, an irregular and complex surface morphology is
observed. Distinct platelets arranged in a ridge-like formation are present. The surface
image of film 1B (Figure 6.11b) deposited under 100 sccm O2 flow has a similar surface
to that of film 1A with distinct platelets. As the oxygen flow is increased to 150 and 200
sccm for films 1C and 1D, the distribution of these platelets appears to be more sporadic
and the surface is generally less ordered as shown in Figures 6.11c-d. Additionally, film
1A deposited under 50 sccm O2 flow appears to have the densest surface, though
substantial surface porosity is observed in all the films. These results may be explained
by the increased adatom mobility provided from lower oxygen content in the chamber
which may reduce some of the shadowing effects. Indeed, for set 4 deposited as a
function of O2 flow at 250 °C, the oxygen content played a large role in the film structure
and morphology. However, at higher temperatures, adatom mobility is dominated by the
energy supplied by the increased temperature which allows the atoms to diffuse far
greater distances than in the case of the 250 °C films. The relative effect of oxygen flow
at this high deposition temperature is likely minimal compared to the effects of
temperature.

160
Figure 6.11. SEM top surface images of Gd2O3 films (a) 1A (50 sccm O2), (b) 1B (100
sccm O2), (c) 1C (150 sccm O2), and (d) 1D (200 sccm O2) deposited on silicon as a
function of oxygen flow at 650 °C at high rates (> 5 Å / s). Arrows denote ridge-like
growth.
Another explanation for the slight differences in film morphology may be offered
in terms of the relative phase content and preferred orientation. From section 4.2, it was
observed that the diffraction patterns from film 1A and 1B had strong preferred
orientation of the C(222) and M(-402) reflections with very slight diffraction from the
M(020) plane. In comparison, the diffraction patterns of films 1C and 1D, deposited
under 150 sccm and 200 sccm of oxygen flow, respectively, showed substantial
contribution from the M(020) orientation. The appearance of disorder and irregular grain
growth appears to be linked to the formation of the M(020) grain orientation. The origin
and effects of this surface morphology will be discussed in further detail in section 6.4 for
films deposited as a function of thickness, as growth of the M(020) orientation occurs
only in thick films grown at high temperatures.
(a) (b)
(c) (d)

161
For further investigation of the thick Gd2O3 film structure deposited under low O2
flow, TEM analysis was performed. Figure 6.12 shows (a) low-magnification and (b)
higher magnification bright-field TEM images of thick (∼1.2 μm) Gd2O3 film 7E grown
at 650 °C under 50 sccm O2, collected along the Si<112> zone axis. Similar to the thick
650 °C film grown under 200 sccm O2, this film also possesses a columnar structure with
large grains elongating in the growth direction. Furthermore, it was dense near the
film/substrate interface but elongated pores formed between grains as the growth
proceeded. The SAD patterns collected from the interface region containing both Si and
the bottom section of the film, the middle section, and the top section of the film are
shown in Figures 6.12c – 6.12e, respectively. The SAD patterns from the bottom of the
film show diffraction from both cubic and monoclinic grains. The short/arc appearance
suggests that texture is present at the bottom of the film. The SAD patterns from the
middle and top sections of the film contain spotty rings from large monoclinic Gd2O3
grains, similar to the case in the thick 650 °C film grown under 200 sccm O2, suggesting
transition to monoclinic phase with increasing film thickness, consistent with X-ray
diffraction results. Comparison of Figures 6.12a (film 7E) and 6.7a (film 6E) reveals that
film 7E deposited at lower O2 flow (50 sccm) appears to possess less intercolumnar
porosity than film 6E grown under 200 sccm O2 flow, consistent with surface images
shown in Figure 6.11. Additionally, film 7E deposited under lower O2 flow appeared to
have a slightly smoother surface due to the more uniform columnar growth and reduced
voiding.

162
Figure 6.12. (a) Low-magnification and (b) high-magnification bright-field TEM images
of thick Gd2O3 film 7E (650 °C, 50 sccm O2, 1.2 µm). SAD patterns collected from the
(c) interfacial region, (d) the middle section, and (e) the top section of the film,
respectively.
Grain size measurements obtained by the Clemex method are shown in Figure
6.13 for films 4A – 4E (250 °C, function of oxygen flow, ~ 1 µm). For films deposited at
250 °C, the oxygen flow had little effect on the measured grain size for films deposited
between 25 and 150 sccm O2. At oxygen flow of 200 sccm, the grain size decreases
slightly as supported by the X-ray diffraction results presented in section 4.2. Figure 6.13
also shows AFM surface roughness measurements for both sets 4 (250 °C) and 1 (650
°C) deposited as a function of oxygen flow. The surface roughness for films deposited at
250 °C is also not significantly affected by oxygen flow. As will be shown in section
6.1.4, at this low deposition temperature, the surface roughness scales with the film
thickness. For films deposited at 650 °C, the surface roughness was found to be

163
relatively independent of oxygen flow between 50-150 sccm, but increased substantially
at an oxygen flow rate of 200 sccm. This increase in surface roughness was supported by
the large intercolumnar porosity and high peak to valley distances observed in the TEM
brightfield images shown earlier.
Figure 6.13. AFM RMS surface roughness and grain size for set 4 (250 °C, function of
oxygen flow, ~1 µm) and set 1 (650 °C, function of oxygen flow, ~2 µm).
6.1.4. Effect of film thickness on Gd2O film morphology deposited on Si(111)
Based on the differences observed between the crystalline phases, orientation, and
morphology of the very thin films (set 8) discussed in section 6.1 and the thick films from
various sets shown in sections 6.2 and 6.3, further examination of the effect of film
thickness was performed systematically for the Gd2O3 films. Therefore, sets 3 and 9,
deposited as a function of film thickness at 250 °C and 650 °C, respectively, were

164
characterized in more detail. Figure 6.14 displays surface images from film 3A, 580 nm
thick and film 3D, 5.2 microns thick. For films deposited at 250 °C (set 3), aside from
the increased grain size, there is no substantial change in the surface morphology or film
porosity. This suggests that after the initial dense crystalline region shown in the TEM
micrograph (Figure 6.6a), the films develop porosity and grow uniformly as the
thickness increases. This is due to the fact that the low substrate temperature does not
provide enough surface mobility for the films to undergo significant grain growth,
resulting in a Zone 1 type microstructure with small grains, separated by voids. There is
slight grain growth (28 nm – 50 nm) as the film grows thicker as evidenced by the
surface images.
Figure 6.14. SEM surface images of film (a) 3A (580 nm) and (b) 3D (5.2 µm) deposited
on silicon at 250 °C under 200 sccm O2 flow at high rates (> 5 Å / s).
Figure 6.15 shows the surface morphologies of Gd2O3 films from set 9 deposited
on silicon as a function of thickness at a temperature of 650 °C and under an O2 flow of
200 sccm at high growth rates of ~1 nm / s. Figure 6.15a displays the surface
morphology of film 9A (380 nm). The image is characterized by a dense underlayer with
various features partially covering the surface which is linked to the dense nucleation
200 nm 200 nm
(a) (b)

165
zone observed in the TEM images before columnar growth. The various observed
features can be attributed to the mixed phase nature of the film. More specifically, the
inset in Figure 6.15a shows a large triangular C(222) facet, surrounded by smaller
crystallites, likely representative of M(-402) grains. The difference in the grain size of
the cubic and monoclinic crystallites is consistent with crystallite size calculated with
Scherrer’s equation in Table 4.7.
Figure 6.15. SEM morphology of Gd2O3 films (a) 9A (0.38 µm), (b) 9B (0.59 µm), (c)
9C (1.02 µm), and (d) 9D (2.69 µm), and (e) 9E (5.72 µm) deposited on Si(111) at 650
°C under 200 sccm O2 flow at high rates ( > 5 Å / s). The inset in Figure 6.15a shows a
C(222) triangular facet.

166
With increasing film thickness (from 380 to 590 nm), significantly enhanced
surface coverage is observed for film 9B (Figure 6.15b) as a result of the onset of
columnar growth. The surface image of film 9C (1.02 µm thick) shown in Figure 6.15c
reveals a denser surface morphology with significant grain growth. As the film grows
thicker, there is a substantial change in surface morphology observed for film 9D (2.69
µm thick) displayed in Figure 6.15d. This surface is characterized by an increase in the
surface porosity and irregular growth of varying surface orientations. For film 9E (5.72
um thick, Figure 6.15e), this surface porosity appears to be even more pronounced.
Two mechanisms can be attributed to the onset of the rough and highly porous
surface morphology with increasing thickness at high deposition temperatures (650 °C).
The first is linked to the effect of shadowing discussed in section 6.1.2. As the columnar
grains grow larger, more metal flux arrives at the column tips. Due to the high rate of
incoming metal atoms, the adatoms cannot diffuse quickly enough to fill the voids
between the columns. While this can explain the slight surface porosity observed in
films 9A-9C, it cannot fully account for the evolution of the structure as evidenced by the
substantial increase in surface porosity for films 9D and 9E. Another possibility is linked
to the formation of the monoclinic phase and preferred orientation of the M(020) plane.
The diffraction pattern for film 9A-9C possessed primarily diffraction from the C(222)
and M(-402) planes (Figure 4.8). The diffraction pattern for film 9D, however, had
strong intensity from the M(020) peak which coincides with the onset of the surface
porosity observed in Figure 6.15d. Film 9E showed diffraction only from the M(020)
orientation which correlates with the highly porous structure observed in Figure 6.15e.
As the columns grow in the M(020) orientation, the less symmetrical monoclinic

167
structure leads to poor packing density in the film. The growth of this grain orientation
combined with shadowing effects led to the highly irregular and porous surface
morphology.
Figure 6.16 shows the effect of film thickness on the measured grain size via the
Clemex analytical technique and the AFM surface roughness of films 3A-3E deposited at
250 °C under 200 sccm. The measured grain size increased from a value of 36.2 ± 0.7 nm
for film 3A with thickness 580 nm to 52.1 ± 1.2 nm for film 3E with thickness 11.01 μm.
The surface roughness of these films increased from approximately 5.8 nm to 13.9 nm.
Figure 6.16. SEM grain size and AFM surface roughness of Gd2O3 films from set 3 (250
°C, 200 sccm O2, function of thickness) and set 9 (650 °C, 200 sccm O2, function of
thickness).

168
Figure 6.16 also displays the measured AFM surface roughness for films 9A - 9D
(650 °C, 200 sccm O2, function of thickness). There is a significant increase in the
surface roughness of the films with increasing film thickness for films deposited at 650
°C from approximately 17 nm RMS for film 9A with thickness 380 nm to 40 nm RMS
for film 9D with a thickness of 2.69 μm. This has important implications for the
fabrication of microelectronic devices. Indeed, the peak to valley distances for films 9A-
9D range from 115 nm to 327 nm. This large surface porosity may result in poor contact
uniformity, decreased dielectric constant, and increased dielectric losses.
6.1.5. Interfacial structure and composition of Gd2O3/Si(111) films
The interfacial structure and chemistry of select Gd2O3 films deposited on silicon
(111) under various conditions shown in Table 6.1 were studied by TEM, EDS, and
EELS. The various deposition conditions such as temperature, oxygen flow rate, film
thickness, and deposition time are found to have a significant effect on interfacial size,
structure, and composition.
Table 6.1. Deposition conditions and interfacial layer structure for select Gd2O3 films.
Film Deposition
Temperature
(°C)
Oxygen
Flow
(sccm)
Thickness (µm) Interfacial
Layer Size
(nm)
Interfacial
Composition and
Structure
6A 250 200 1.07 5 Gd-Si-O diffusive,
indulating
8A 250 200 0.047 2 Flat, sharp
SiOx-rich
6E 650 200 0.87 10 Gd-Si-O diffusive
8E 650 200 0.020 2 Flat, diffusive
SiOx-rich
7A 250 50 1.11 3 Gd-Si-O diffusive
7E 650 50 1.20 6 Gd-Si-O diffusive

169
Figure 6.17a is a high-resolution TEM image collected from the interface region
of film 6A. As indicated by the arrows, select Si / interfacial regions possess a slightly
brighter contrast than the rest of the Si substrate. The formation of such interfacial
regions is an indication that further interfacial reaction via oxygen diffusion into the Si
substrate occurred during the extended growth period of 6A as compared to the
homogenous interfacial layer observed in film 8A (Figure 6.3a) deposited under the same
conditions, but shorter deposition time (~20x reduction). It is also worth noting that the
interfacial layer appears to be undulating, which suggests that interdiffusion of Si and Gd
had also occurred. The thickness of the interfacial layer for 6A is approximately 5 nm.
Figure 6.17. High-resolution TEM images collected from the interfacial regions of Gd2O3
films (a) 6A (250 °C, 200 sccm O2, 1.07 µm) and (b) 6E (650 °C, 200 sccm O2, 0.87 µm)
deposited on silicon under 200 sccm O2 at high rates (> 5 Å / s).
The interfacial layer between Gd2O3 film 6E (650 °C, 200 sccm O2, 0.87 µm) and
the Si substrate (Figure 6.17b) also appears to be different than that of 8E (650 °C, 200
sccm O2, 0.20 µm, Figure 6.3b). It is larger in size (~10 nm), suggesting further

170
interfacial reaction occurred during the extended growth at 650 °C. This is explained by
the greater diffusion length of the atoms due to the increased deposition time. A
comparison of the interfacial layers of films 6A and 6E (Figure 6.17) suggests that
increasing the deposition temperature from 250 to 650 °C results in increased diffusion
and a 2x increase in interfacial layer size (5nm to 10 nm).
Figure 6.18a is a high-resolution TEM image collected from the interfacial region
of the Gd2O3 film 7A (250 °C, 50 sccm O2, 1.11 µm). The lower O2 flow, along with the
higher film density, results in a decrease in the amount of oxygen diffusing into the Si
surface during Gd2O3 deposition, thus reducing SiOx thickness at the interface. A thin
disordered interfacial layer with a uniform thickness of ∼2 nm is apparent (Figure 6.18a).
Figure 6.18. High-resolution TEM images collected from the interfacial regions of Gd2O3
films (a) 7A (250 °C, 50 sccm O2, 1.11 µm) and (b) 7E (650 °C, 50 sccm O2, 1.20 µm)
deposited on silicon under 50 sccm O2 at high rates (> 5 Å / s).

171
Figure 6.18b is a high-resolution TEM image of the interface region of Gd2O3
film 7E (650 °C, 50 sccm O2, 1.20 µm). An undulating layer is also observed for film
7E, however, it is narrower in comparison with that in film 6E (650 °C, 200 sccm O2,
Figure 6.17b). Thus, lower O2 flow has also resulted in a reduced interfacial reaction for
films grown at 650 °C.
Chemical analysis, with a focus on the interfacial chemistry, was carried out using
a combination of high-angle annular-dark-field scanning transmission electron
microscopy (HAADF STEM), XEDS, and EELS. In HAADF STEM images, the
intensity is nearly proportional to Zn, where Z is the atomic number of the material and
the value of the power n ranges from ∼1.6 to 1.9. Thus, Z-contrast STEM images provide
compositional information of the materials. Figures 6.19a and 6.19b show representative
HAADF STEM images of thin Gd2O3 films 8A (250 °C, 200 sccm O2, 47 nm) and 8E
(650 °C, 200 sccm O2, 20 nm).
Figure 6.19. Low-magnification HAADF STEM images of thin Gd2O3 films (a) 8A
(250 °C, 200 sccm O2, 47 nm) and (b) 8E (650 °C, 200 sccm O2, 20 nm) grown under 200
sccm oxygen flow. Higher magnification images collected near the interface regions of
the (c) 8A and (d) 8E heterostructures, respectively.

172
In each heterostructure, the interfacial layer possesses an overall relatively darker
contrast than the film and the Si substrate. This indicates that it has a relatively lower
average Z and is thus most likely SiOx-rich. Figure 6.20 shows XEDS spectra collected
from the interfacial layers in the two heterostructures, which also reveal the SiOx-rich
nature of the interface. The presence of the C and Mo peaks in the spectra is attributed to
atmospheric carbon contamination and the Mo TEM grid, respectively.
Figure 6.20. EDS spectra collected from the interfacial layers of the films 8A (250 °C,
200 sccm O2, 47 nm) and 8E (650 °C, 200 sccm O2, 20 nm) heterostructures. The C peak
is from atmospheric carbon contamination and Mo peak is related to the Mo TEM grid.
In the literature, formation of similar SiOx-rich interface layers has been attributed
to high oxygen partial pressure in the growth chamber for Gd2O3/Si(100) heterostructures
grown by electron beam evaporation.107
Such interfacial layers were eliminated in
heterostructures grown by MBE, in which the oxygen partial pressure was significantly
lower.6,109
In our case, while a HF-dip was applied to remove the native surface oxide
layer immediately before the Si substrates were loaded into the growth chamber, thermal
deoxidation of the substrate surface was not performed. Furthermore, the base pressure of

173
the chamber was relatively high (<6 × 10⁻⁶
Torr) and O2 was introduced into the chamber
∼15 s before the Gd flux. Thus, a thin layer of amorphous SiOx might be present on the
Si surface prior to the start of Gd2O3 film deposition. As the growths continued, O2 might
diffuse through the polycrystalline Gd2O3 film and react with Si to form extra SiOx. Such
a process was also observed in another study which detailed the post-growth thermal
annealing of Gd2O3/Si(100) in an oxygen atmosphere.60,106
The interfacial layer in a heterostructure with a thick Gd2O3 film (films 6A and
6E) was thicker than that in a heterostructures with a thin film (films 8A and 8E) grown
at the same temperature and O2 flow as shown in Table 6.1. This supports the fact that
deposition time and temperature results in greater diffusion and larger interfacial
thicknesses. Furthermore, heterostructures grown with a lower O2 flow possessed thinner
interfacial layers than those grown with a higher O2 flow (Table 6.1). This supports the
finding that extra SiOx formed as the deposition process proceeded via the diffusion of
oxygen into the interfacia region and the subsequent reaction with Si. The thin
amorphous interface layer could prevent the possible heteroepitaxial growth of Gd2O3
films on Si(111), thus affecting the crystal quality, film stress, and electronic properties.
It would be of great interest for future studies to investigate how a SiOx free Si surface
affects the growth, interfacial structure, interfacial chemistry, microstructure, stress, and
surface morphology of the Gd2O3 films.
For film 8A (Figure 6.19a), the pore-like features (indicated by the arrows)
possess a relatively darker contrast (darkfield) than the rest of the film. Thus, the pore-
like features may be relatively less Gd-rich than stoichiometric Gd2O3, which led to a
lower average Z and darker contrast. Another possible reason for the dark contrast of the

174
pore-like features is that they may possess a relatively lower density than the rest of the
Gd2O3 film. This makes these features virtually “thinner” in the imaging direction, which
consequently resulted in the lower intensity in the HAADF STEM image. Pore-like
features were not observed in film 8E due to the dense structure resulting from higher
adatom mobility. The slight lateral contrast variation of film 8E (Figure 6.19b) is mainly
due to the different orientations of the grains, which resulted in differences in the
amounts of electrons diffracted into the STEM detector from individual grains.
TEM images of the interfacial layers for films 8A and 8E (Figure 6.3a and 6.3b)
appeared to be similar. However, further investigation using the Z-contrast HAADF
STEM images (Figure 6.19a and 6.19b) revealed that these interface layers were indeed
different. The interface layer of 8A appears to be sharp with a uniform thickness while
the interface of 8E has a relatively diffusive contrast. This may be seen more clearly in
Figures 6.19c and 6.19d, higher magnification STEM images of the 8A and 8E,
respectively. The interface layer of 8E possesses a nonuniform thickness and a lateral
contrast variation. Such a diffusive appearance indicates that interfacial interdiffusion of
Gd and Si occurred during the high temperature deposition. More specifically, Si outward
diffusion may have occurred forming the Gd-Si-O layer. This is supported by the small
Gd peak in the XEDS spectrum from this SiOx-rich layer in 8E (Figure 6.20)
Increased interfacial reaction occurred between the thick (~1 µm) Gd2O3 films
and the Si substrates due to the extended growth periods (~20 min) for films 6A and 6E.
Figure 6.21 shows HAADF STEM images collected from the interfacial regions of films
6A and 6E. The top and bottom dashed lines indicate the approximate positions of the
Gd2O3/interfacial layer and interface layer/Si boundaries, respectively. As shown in

175
Figure 6.21a, the interfacial layer between film 6A and the Si substrate possesses a
diffusive contrast that appears to be undulating. The total thickness of the intermixing
layer at the interface is ∼5 nm, as estimated based on the contrast variation in the STEM
image. The interfacial layer thickness increased to >10 nm for Gd2O3 film 6E (Figure
6.21b), due to the high deposition temperature resulting in increased diffusion at the
interface.
Figure 6.21. HAADF STEM images collected from the interface region of the thick
Gd2O3 films (a) 6A (250 °C, 200 sccm O2, 1.07 µm) and (b) 6E (650 °C, 200 sccm O2,
0.87 µm) grown under 200 sccm O2 flow. The top and bottom dashed lines indicate the
approximate positions of the Gd2O3/interfacial layer and interface layer/Si boundaries,
respectively.

176
Figure 6.22a shows EEL spectra collected from positions i to iv indicated in
Figure 6.21b. All the spectra were collected under the STEM mode using an electron
probe with a nominal size of 0.5 nm, which provided a spatial resolution <1 nm. As
indicated by the arrows, a weak Si edge (green arrow) and a weak Gd edge (blue arrow)
were present in the spectra from near the top (position ii) and the bottom (position iii) of
the interface layer, respectively. Therefore, the results indicate that the composition of the
layers can be described as follows: i) Gd2O3, ii) Gd rich – O – Si, iii) Gd-O-Si rich, and
iv) Si.
Figure 6.22. EEL spectra collected from positions i to iv as indicated in (a) 6E (Figure
6.21b) and (b) 7E (Figure 6.23b). The upper arrow (green) indicates a weak Si edge while
the lower arrow (blue) indicates a weak Gd edge.

177
To further investigate the interfacial properties of Gd2O3 grown on Si at low
oxygen flow, HAADF STEM images (Figure 6.23) were collected from the interfacial
regions of films 7A (250 °C) and 7E (650 °C) grown under 50 sccm O2 flow.
Figure 6.23. HAADF STEM images collected from the interfacial region of the thick
Gd2O3 films at (a) 7A (250 °C, 50 sccm O2, 1.11 µm ) and (b) 7E (650 °C, 50 sccm O2,
1.20 µm) grown under 50 sccm oxygen. The top and bottom dashed lines indicate the
approximate positions of the Gd2O3/interfacial layer and interfacial layer/Si boundaries,
respectively.
The total thicknesses of the interface layers estimated based on the STEM image
contrast variation and EELS measurements were ∼3 and 6 nm for 7A and 7E,
respectively, smaller than in films 6A (5 nm) and 6E (10 nm) grown under 200 sccm O2
flow. However, the same trend of increasing interfacial layer size with increasing
deposition temperature was observed. EELS examinations indicated that these interface
layers were also mixed Gd-Si-O layers. Figure 6.22b shows EEL spectra collected from

178
positions i to iv indicated in Figure 6.23b. Again, a compositional transition from Si to
Gd-Si-O to Gd2O3 in the growth direction was observed.
Similar Gd-Si-O interfacial layers were also observed in a few earlier reports on
the thermal stability of very thin Gd2O3 films (< ∼15 nm) grown on Si(100) substrates by
electron-beam evaporation.60,106,107
In those studies, a thin (1.5 nm) SiOx interfacial layer
was observed between the 500 °C deposited film and the substrate. Rapid thermal
annealing (RTA) in O2 at higher temperatures resulted in the formation of an intermixed
3 nm thick Gd-Si-O layer between the Gd2O3 film and the SiOx layer.107
Furthermore, an
increase in the thickness of the SiOx layer between the Gd-Si-O layer and the Si substrate
was observed after RTA, which was attributed to the further reaction between oxygen and
Si due to oxygen diffusion through the Gd2O3 film. Such an increase in the SiOx layer
size during deposition was not observed in our heterostructures with thick films. We
believe that is due to the significantly reduced amount of oxygen diffusing to the Si
surface as the thickness of the Gd2O3 films increased. As a result, the entire SiOx layer
intermixed with Gd2O3 to form the interfacial Gd-Si-O layer as the growth proceeded. In
an earlier study on RTA of a ∼10 nm Gd2O3/ SiOx /Si(100) structure, N2 was used instead
of O2 as the annealing atmosphere.110
Since oxygen was absent in the atmosphere, the
thickness of the SiOx layer was found to be reduced due to its intermixing with the Gd2O3
film to form Gd-Si-O. Gd2O3 was theoretically predicted to be thermodynamically stable
in contact with Si at a temperature of 1000 K.111
Indeed, Gd2O3/Si heterostructures
without Gd-Si-O interfacial layers were obtained using MBE growth under ultrahigh
vacuum.6,109
Based on analysis of the interface chemistry and the results reported in the
literature, we conclude that oxygen plays a crucial role in the interfacial reaction between

179
Gd2O3 and Si. At generally used growth temperatures (<1000 K), the Gd2O3/Si interfacial
reaction and the formation of the Gd-Si-O interfacial layer occur only when excess
oxygen reaches the interface. The excess oxygen reacts with Si to form SiOx, which will
then intermix with Gd2O3, leading to the formation of the Gd-Si-O interface layer.
6.1.6. Effect of deposition rate and substrate material on Gd2O3 film morphology
It was previously shown in section 4.5 that the XRD patterns of the mixed phase
Gd2O3 films deposited under high rates of deposition on silicon and other substrates are
very similar in terms of phase and preferred orientation. As a result, it was expected that
the surface morphologies would be similar regardless of underlying substrate. Figure
6.24 shows the surface morphologies of film 12E (650 °C, 200 sccm O2, 1.03 µm)
deposited on silicon(111), sapphire, GaN, and quartz substrates at a deposition rate of 10
Å / s.
Figure 6.24. SEM surface images of film 12E (650 °C, 200 sccm O2, 1.2 µm, 10 Å / s)
deposited on (a) silicon (111), (b) sapphire, (c) GaN, and (d) quartz.
(a) (b)
(c) (d) (d) (c)
(a) (b)

180
As expected, the surface morphologies are relatively similar despite being grown
on the various substrates. Due to the high rate of growth, structural rearrangement at the
substrate/film interface is impeded by the constant flux of arriving Gd atoms at the
surface resulting in lower mobility of the adatoms. Therefore, all the films grow in a
similar fashion resulting in the observed ridge-like morphology which is attributed to
both shadowing and formation of irregular monoclinic phase facets.
Lowering the deposition rate below 0.5 Å / s at a deposition temperature of 650
°C and O2 flow of 50 sccm resulted in formation of single phase cubic Gd2O3 films for
films as thick as 1 µm. Figure 6.25a – 6.25d display the SEM surface morphologies of
Gd2O3 film 10A (650 °C, 50 sccm O2, 1.01 µm, 0.5Å / s) deposited on silicon, GaN,
quartz, and sapphire, respectively. A comparison of all four samples reveals that these
films deposited with a very low growth rate (0.5 Å / s) have significantly denser surface
morphology than mixed phase films deposited at higher rates of deposition (5 Å / s).
This is primarily due to the elimination of shadowing as a result of the enhanced adatom
mobility. Since less flux is arriving due to the low evaporation rate, the Gd metal atoms
are able to diffuse much further without interruption, resulting in less porosity between
the growing columns. Additionally, the presence of only one phase allows for higher
packing density within the film and lower strain energy barriers that compete with growth
corresponding to mixed phases.
Significant differences were observed in the preferred orientation and crystallite
sizes depending on the underlying substrate type for films grown at low deposition rates
as demonstrated by XRD analysis in section 5.3. The increased mobility of the adatoms
allows the atoms to rearrange themselves on the surface to minimize the free energy.

181
Based on this knowledge, significant variation in the film microstructures grown on
different substrates was expected. The surface morphology of film 10A grown on silicon
(Figure 6.25a) is primarily composed of the large triangular facets (~170 nm) of the
C(222) planes, supported by the strong preferred orientation observed in the XRD
pattern. The film grown on GaN (Figure 6.25b) shows a similar surface morphology
with large grain size (~160 nm) and significant faceting of the C(222) planes. Some of
the C(222) facets appear to be disrupted by the presence of other grains. The large grain
size observed for the films deposited on GaN and silicon can be explained by the strong
C(222) in and out-of-plane orientation as well as highly coherent growth at the interface
as will be shown by the TEM analysis.
Figure 6.25. SEM surface images of Gd2O3 film 10A (650 °C, 50 sccm O2, 1.01 µm, 0.5
Å / s) on (a) silicon(111), (b) GaN, (c) quartz, and (d) sapphire substrates.

182
For film 10A grown on quartz (Figure 6.25c), slight faceting of the C(222) planes
is observed with the formation of smaller polycrystalline material between them. The
Gd2O3 grain size on quartz was slightly smaller (~110 nm) than that of the GaN and
silicon samples. This can be explained by the fact that on an amorphous template, there
is no interface energy anisotropy for grain rotation. Since the interface energy is uniform,
no preferred in-plane orientation will exist as confirmed by the pole figure analysis
shown in section 5.6. Therefore, only an out of plane fiber texture will exist based on the
competition between surface and strain energy. As a result, the Gd2O3 film 10A grown
on quartz is mostly (111) oriented in efforts to minimize surface energy, but nucleation
and growth of other grains occurs to minimize strain energy which results in the
additional smaller grain size material observed in Figure 6.25c.
For Gd2O3 film 10A grown on sapphire (Figure 6.25d), a polycrystalline surface
morphology with much smaller grain size (85 nm) is observed. The decrease in grain
size is likely a result of compressive stress in the film. When the stress is increased, and
the lattice expands in the out of plane direction, this causes an increase in the lattice
energy. Due to the increase in lattice energy, the driving force for growth is lessened, and
other grains are nucleated.112
Additionally, a small amount of monoclinic phase formed
for this film as a result of the increased compressive stress acting to further reduce the
grain size.
TEM analysis was performed to further investigate the nature of the growth of
film 10A on the various substrates. Figure 6.26a shows a low-magnification bright-field
TEM image of single phase cubic Gd2O3 film 10A (650 °C, 50 sccm O2, 1.01 µm, 0.5
Å/s) deposited on Si(111) and grown at 650 °C, collected along the Si<112> zone.

183
Similar to those films deposited at 650°C under high rates of deposition (~5 Å/s), a
columnar morphology is observed. However, the grain growth is more uniform with
column widths spanning ~ 100 nm. The film appears to be significantly denser without
significant porosity observed between the grains. This is a result of the single phase
cubic growth combined with increased surface adatom mobility due to the lower
evaporated Gd flux.
Figure 6.26. (a) Low-magnification bright-field image of thick Gd2O3 film (650 °C, 50
sccm O2, 1.01 µm, 0.5 Å / s) deposited on silicon (111) and (b) corresponding SAD
pattern collected from the film.
Figure 6.26b shows a diffraction pattern taken from the middle section of Gd2O3
film 10A deposited on silicon. The bright arcs suggests heavy texturing of the C(222)
planes as expected from the XRD pattern (Figure 5.4) and SEM top surface image
(Figure 6.25a). Indexing the additional arcs/spots shows that all the rings are cubic,
confirming the results shown by XRD. The strong preferred growth of the Gd2O3
C(222) planes can be attributed to the low surface energy of the (111) planes in the Ia3
structure.99
The low surface energy results in little competition for nucleation of grains
(a) (b)

184
oriented in other directions besides the most energetically favorable (222) orientation,
allowing for larger and more uniform growth of the C(222) grains. However, based on
this information, we would expect strong preferred orientation of the C(222) planes
regardless of the underlying substrate, unless the strain energy is high enough to disrupt
crystal growth. Differences in preferred orientation were observed for films grown on
quartz and sapphire substrates. One explanation for the increased C(222) preferred
orientation on the silicon substrate may result from the fact that the mismatch in
interplanar spacing between the Si(111) planes (3.136 Å) and Gd2O3 C(222) planes
(3.121 Å) is small, which promotes epitaxial growth. However, it was shown that for
mixed phase Gd2O3 films deposited on Si(111), that an Gd-Si-O amorphous layer was
present between the film and substrate, which prevents epitaxial growth.
High resolution TEM analysis was employed to investigate the interfacial region
of film 10A grown on silicon. Figure 6.27 shows high magnification bright-field TEM
images of the interfacial region of film 10A grown on silicon. Figure 6.27a shows a
region denoted by dashed arrows where there is a clear amorphous interfacial layer
approximately 5 nm thick separating the Gd2O3 film and silicon substrate. In this region,
growth of Gd2O3 cubic grains with various orientations is observed.
Figure 6.27b shows a region denoted by dashed arrows where the interfacial layer
appears to be primarily crystalline. In this region, the growth consists primarily of
C(222) planes parallel to the substrate. This is due to the close lattice match of Si(111)
and C(222) which promotes an epitaxial relationship.

185
Figure 6.27. High-resolution TEM images collected from the interfacial region of the
Gd2O3 film 10A (650 °C, 50 sccm O2, 1.01 µm, 0.5 Å/ s) deposited on silicon showing
(a) amorphous and (b) crystalline character. The dashed lines denote the interfacial
region.
Si(111)
Gd2O3
Gd2O3
Si(111)
(a)
(b)

186
The existence of different interfacial regions within the same Si/Gd2O3
heterostructure is surprising. This may be explained by partial regrowth of SiOx on the
silicon surface during the time the silicon substrate is etched and the chamber is
evacuated (approximately 5-10 min) or complex stress/strain relationships during the
initial nucleation and growth mechanisms with different grain orientations.
Figure 6.28a shows a low magnification bright field TEM image of Gd2O3 film
10A (650 °C, 50 sccm O2, 1.01 µm, 0.5 Å/s) on a GaN / AlGaN substrate. Uniform
growth of feather-like C(222) facets as observed. The top of the columns possess a
small amount of porosity, due to the strong faceting of the (222) planes. The widths of
the columns appear to span approximately 150 - 250 nm at the thickest points, suggesting
very large grain growth.
Figure 6.28b displays a selected area diffraction pattern using a circular aperture
with a diameter of 500 nm from the top section of film 10A grown on GaN. A single
crystal-like diffraction pattern is observed suggesting the growth of a very large C(222)
grain in this region. Additional rings suggest the presence of other polycrystalline cubic
material. Figures 6.28c, 6.28d, and 6.28e display SAD patterns taken using a smaller
150 nm diameter aperture from the bottom, middle, and top section of the film,
respectively, along one columnar grain. Diffraction from the bottom part of the film
indicates the growth of a single cubic Gd2O3 grain in the C(222) orientation within the
region defined by the 150 nm diameter. This is indicated by the spacing between the
diffracted spots and the absence of diffraction rings which indicate polycrystalline
growth. Figure 6.28d shows diffraction from the middle of the film at same lateral
coordinates and it can be observed that the diffraction pattern still corresponds to a single

187
C(222) grain. Near the top film surface, Figure 6.28e shows that there is development of
additional diffraction spots and diffraction rings, besides the C(222). This is due to the
fact that the width of the columns is smaller at the top of the film, resulting in diffraction
from adjacent grains. However, it is important to note that the C(222) diffraction spots
are still relatively bright. This diffraction data suggests that columns with widths of
approximately 200 nm are able to grow with epitaxial relationship to the GaN substrates.
Figure 6.28. (a) Low-magnification bright-field TEM images of Gd2O3 film 10A (650 °C,
50 sccm O2, 1.01 µm, 0.5 Å / s) deposited on GaN. SAD patterns collected from (b) the
whole film with a 500 nm diameter circular aperture. SAD patterns collected from (c)
interfacial region, (d) middle, and (e) top sections of the Gd2O3 film using a 150 nm
diameter circular aperture, respectively.
Figure 6.29 displays a high resolution TEM image the interfacial region of the
Gd2O3 / GaN interface for film 10A. The interface is entirely crystalline and the Gd2O3
(a) (b)
(c) (d) (e)

188
film grows directly on the GaN basal plane without the formation of an amorphous
interfacial layer. The absence of an amorphous interfacial layer could result in significant
measured differences in the electrical properties of the Gd2O3 films deposited on GaN as
compared to silicon.
Figure 6.29. (a) High-resolution TEM image collected from the interfacial region of
Gd2O3 film 10A (650 °C, 50 sccm O2, 1.01 µm, 0.5 Å / s) deposited on GaN. The arrow
denotes a defect region.
The potential for single crystal growth is highlighted in Figure 6.29. There is
uniform growth of a single set of Gd2O3 C(222) lattice planes consistent with the electron
diffraction patterns. The formation of a defect is visible near the interfacial region. This
is likely a misfit dislocation formed in order to relieve the strain as a result of the large
lattice mismatch (20%) between the GaN(0001) basal plane and Gd2O3 (111) plane.99
The
Gd2O3
GaN

189
continued formation of these defects will disrupt the lattice structure and result in growth
of other grain orientations which explains the polycrystalline nature of the film.
Nevertheless, these results are promising and suggest the possibility of single crystal
growth of C(222)Gd2O3 || H(0001)GaN, at least in the early stages of coating growth. As the
film grows, stresses resulting from the lattice mismatch, coefficient of thermal expansion
mismatch, and intrinsic growth stresses are likely to result in the formation of defects
which could result in the formation of other grain orientations and potentially secondary
monoclinic phase. Single crystal films have potential for significantly enhanced charge
carrier transport which is beneficial for radiation detection purposes.
For comparison, Figure 6.30a shows a low magnification bright field TEM image
of film 10A (650 °C, 50 sccm O2, 1.01 µm, 0.5Å/s) deposited on a sapphire substrate.
Deposition on the sapphire substrate resulted in growth of significantly thinner columns
(~30 nm) as compared to the growth on Si(111) and GaN with porosity forming near the
top of the film. The increased compressive stresses may impede adatom mobility across
the surface. Furthermore, the lattice energy is increased which decreases the driving
force for grain growth. As a result there is competition for nucleation of grains exhibiting
a number of different orientations which leads to growth of multiple grains with smaller
sizes. High resolution TEM taken at the interface of Gd2O3 film 10A grown on sapphire
is shown in Figure 6.30b. A small (2 nm thick) interfacial layer is observed with bright
contrast. This layer appears to be primarily crystalline. Unfortunately, EDS or EELS data
is not available for this interface layer so the composition is unknown.

190
Figure 6.30. (a) Low-magnification and (b) high-magnification bright-field TEM images
of Gd2O3 film 10A (650 °C, 50 sccm O2, 1.01 µm, 0.5 Å / s) deposited on sapphire.
6.1.7. Effect of ion bombardment on the morphology of Gd2O3 films deposited on
sapphire
Surface images of the films from set 11 deposited as a function of ion source
current on sapphire are shown in Figure 6.31. For a baseline film, Figure 6.31a, shows
that the surface morphology of Gd2O3 film 11A (650 °C, 50 sccm O2, 0.4 Å/s, 0 mA)
deposited without ion beam assist (0 mA) exhibits a fairly uniform distribution of small
faceted grains across the surface. As the IBS energy is introduced and increased from 0
to 200 mA (film 11B, Figure 6.31b, 200 mA), there appears to be increased grain growth
as shown in Figure 6.31b. This can be correlated to the increased energy from the ion
source which quickly allows atoms to overcome the activation barrier for nucleation,
leading to longer diffusion lengths, and therefore, increased grain growth. The surface
appears to be more dense with fewer C(222) facets observed.
Gd2O3
Sapphire
(a) (b)

191
Figure 6.31. SEM top surface images of Gd2O3 films deposited using ion beam assisted
deposition with currents of (a) 11A (0 mA), (b) 11B (200 mA), (c) 11C (400 mA), and
(d) 11D (800 mA) deposited on sapphire as a function of IBS current at 650 °C, 50 sccm
O2, and with growth rate of ~ 0.5 Å / s.
As the ion beam current is increased to 400 mA for film 11C (Figure 6.31c), the
surface becomes more dense due to the higher adatom mobility along with a transition in
phase volume to 95% monoclinic phase. Figure 6.31d shows the surface morphology of
fully monoclinic film 11D (Figure 6.31d) deposited with 800 mA IBS current in which
the surface is very smooth and dense. It is clear from Figure 6.31 that the surface
morphology becomes smoother as result of film densification and increased diffusion
distance with increasing ion beam current (energy).
Figure 6.32a shows a low magnification bright field TEM image of single phase
monoclinic film 11D (650 °C, 50 sccm O2 flow, 0.5 Å/s, 800 mA) deposited on a
sapphire substrate. As shown in section 5.4, the large compressive stress resulting from
the ion bombardment resulted in a phase transition to the monoclinic phase. Unlike the
films deposited without IBS, a columnar morphology is not observed. Instead, the film
( ) ( )
( ) ( )
(a) (b)
(c) (d)

192
possesses a significantly denser structure with no apparent voiding, consistent with the
SEM top surface images.
Figure 6.32. (a) Low-magnification and (b) high-magnification bright-field TEM images
of thick Gd2O3 film 11D (650 °C, 50 sccm O2, 0.5 Å / s) deposited on sapphire under 800
mA of IBS current, and (c) SAD pattern collected from the middle section of the film.
A high magnification TEM image shown in Figure 6.32b shows that the M(-402)
oriented grains grow parallel to the substrate surface. This is further reflected in the SAD
pattern shown in Figure 6.32c, which is characterized by bright arcs showing significant
Gd2O3
Sapphire
Sapphire
Gd2O3
(a) (b)
(c)

193
texturing of the M(-402) plane. The highly ordered growth is due to the increased energy
from the ion beam which allows the structure to retain the low surface energy orientation.
Additionally, all the additional diffraction rings correspond to monoclinic planes,
suggesting that the film fully transformed to the monoclinic phase as shown by Raman
and XRD in section 5.4. These results highlight the capability of using IBS to synthesize
single phase films with smooth surfaces and dense microstructures, which can result in
significantly improved film electrical properties.
6.1.8. Effect of heat treatments on Gd2O3 film morphology deposited on Si(111)
Heat treatments were performed on the Gd2O3 films in order to improve the film
electrical properties. Figures 6.33a and 6.33b show top surface SEM images of mixed
phase film 12E (650 °C, 200 sccm O2 flow, 1.2 µm, ~5 Å/s) in the as deposited state and
after anneal in oxygen at 1000 °C for 1 hour, respectively. Significant grain growth is
observed in the top surface, but is also accompanied by an increase in surface porosity.
As the grains grow larger and coalesce, porosity begins to form between the columns.
Figure 6.33. SEM top surface images of mixed phase film 12E (650 °C, 200 sccm O2, 1.2
µm) in the following conditions: (a) as deposited and (b) heat treated at 1000 °C in O2
environment for 1 hour. Arrows denote porous regions.
(a) (b)

194
The effect of heat treatments on single phase cubic films was also investigated.
Cubic film 10A (650 °C, 50 sccm O2 flow, 1.01 µm, 0.5 Å/s) deposited on silicon was
subject to a heat treatment in oxygen for 1 hour at 1000 °C as shown in Figure 6.34. As
observed by this low-magnification bright-field TEM image of the heat treated Gd2O3
film, collected along the Si<112> zone axis, significant grain coarsening and surface
roughening occurred. Additionally, formation of voids (features showing bright contrast)
between the grains is observed, slightly increasing the porosity within the film. However,
the porosity is significantly reduced as compared to the heat treated mixed phase films.
Figure 6.34. Low-magnification bright-field TEM image of cubic Gd2O3 film 10A (650
°C, 50 sccm O2, 1.01 µm, 0.5 Å/ s) after heat treatment at 1000 °C in O2 environment for
1 hour.
Gd2O3
Si(111)

195
Figure 6.35 shows the interfacial region of cubic film 10A deposited on silicon
after heat treatment at 1000 °C in O2 environment. The interface appears to phase
separate into two distinct regions. Note that there is debris covering the layers which is
likely resputtered material from the ion beam cleaning during TEM sample preparation.
From EDS data (not pictured), the first interface region at the substrate is an
approximately 85 nm thick SiOx layer with no Gd detected. Selected area diffraction (not
shown here) suggests this layer is amorphous.
Figure 6.35. High-magnification bright-field TEM image of the interface of cubic Gd2O3
film 10A (650 °C, 50 sccm O2, 1.01 µm, 0.5 Å / s) after heat treatment at 1000 °C in O2
environment for 1 hour. Arrow denotes resputtered material.
The second region is a Gd-Si-O layer which is approximately 88 nm thick. This
layer is crystalline as can be observed from the lattice fringes in the regions where the
resputtered material is absent. Above this layer, the Gd2O3 film is apparent. Obviously,
Si(111)
SiOx
85 nm
Gd-Si-O
88 nm
Resputtered
material

196
annealing at 1000 °C in O2 atmosphere leads to substantial diffusion and interfacial layer
growth.
6.2. Compositional analysis
6.2.1. X-Ray photoelectron spectroscopy
X-ray photoelectron spectroscopy (XPS) was used to further characterize the
chemical state and film composition of select films 2A (250 C, 200 sccm O2, 1.26 µm)
and 2E (650 C, 200 sccm O2, 2.05 µm). Sputter depth profiling was performed to
investigate the chemistry and composition of the Gd2O3 films as a function of depth.
Figures 6.36a and 6.36b show the core level spectra measured at various depths ranging
from the middle of the film through the interface for film 2E.
Figure 6.36. Depth profile of XPS binding energy levels of (a) Gd 4d and (b) O1s of film
2E (650 C, 200 sccm O2, 2.05 µm).
The Gd 4d level shown in Figure 6.36a for film 2E is characterized by multiplet splitting
of the Gd 4d hole with the 4f7 valance electrons to form 9D and 7D ionic states with
binding energy of 149 and 143 eV, respectively.113
The Si 2s peak located at 151 eV
begins to rise as the penetration depth increases through the interfacial layer and the
(a) (b)

197
substrate. The O 1s peak shown in Figure 6.37b has a single uniform peak that decreases
as the depth penetration increases. This suggests that Gd-O bond for film 2E is
heterogeneous throughout the oxide volume.
Figures 6.37a-b show the core level spectra measured at various depths ranging
from the middle of the film through the interface for film 2A (250C, 200 sccm O2, 1.26
µm). The peaks of the Gd 4d core level spectra shown in Figure 6.37a displays a shift in
binding energy with increasing penetration depth of approximately 4eV.
Figure 6.37. Depth profile of XPS binding energy levels of (a) Gd 4d and (b) O1s of film
2A (250 C, 200 sccm O2, 1.26 µm).
The observed shift is likely due to surface charging. Insulating materials such as
Gd2O3 result in positive charge buildup on the sample surface. As a result, the kinetic
energy of the photoelectrons decreases resulting in a shift in the spectra to higher binding
energies. Additionally, since the information depth of XPS (~10 nm) is approximately
equal to the RMS surface roughness of Gd2O3 film 2A, differential surface charging may
occur in which the insulating properties of the film are not equal throughout the
Gd 4d
x 102
10
20
30
40
50
60
70
80
CP
S
152 148 144 140 136 132
Binding Energy (eV)
O 1s
x 103
4
6
8
10
12
14C
PS
532 528 524 520
Binding Energy (eV)
(a) (b)

198
thickness. The peak shape remains unchanged during the shift, which further supports
that this is simply a shift due to charging rather than chemical state.
The O 1s spectra shown in Figure 6.37b also displays a peak shift of
approximately 4eV. However, there is an intermediate state where the peak shape is
distorted, suggesting a possibility of a change in chemical state. If a change in the
chemical state is present, it may be related to the O rich pore like regions observed in the
TEM images. Unfortunately, it is impossible to definitively determine whether or not the
shift is related to a change in the chemistry of the oxygen bonding state or surface
charging.
XPS analysis was further used to measure the O : Gd ratio of the films. Evident
from the compositional profile shown in Figure 6.38a, deposition of Gd2O3 at 250C for
film 2A results in an oxygen rich film, with a measured O : Gd ratio of 1.86:1.
However, when the deposition temperature is increased to 650C for film 2E (Figure
6.38b), the O : Gd ratio is very close to the 1.5:1 ratio of stoichiometric Gd2O3. It is
important to note that without extreme care and use of a verified external standard, XPS
should be regarded as a semi-quantitative technique. Nevertheless, the higher degree of
oxygen content in film 2A is consistent with TEM results presented in section 6.1 which
showed the presence of oxygen rich regions for films deposited at 250 °C.
In addition, evaluation of Figure 6.38 indicates diffusion of Si, Gd, and O
resulting in formation of a ternary interface layer. According to the compositional
profile, the ternary interface layer at 250C is approximately 50 nm, while at 650C the
interface layer is nearly 150 nm, suggesting that enhanced reactivity occurs for samples at
higher temperature. However, the interfacial layer for these samples as observed by TEM

199
was approximately 3 nm and 10 nm, respectively. The discrepancy in these results could
be attributed to the different sputtering rates of Gd, O, and Si. This error is compounded
by the fact that the etch depth in Figure 6.38 was calculated by taking the etch time to
reach the silicon substrate and diving by the film thickness under the assumption of a
linear etch rate. Additionally, the high surface roughness of the films and small
information depth of XPS may further disrupt the accuracy of depth profiling.
Figure 6.38. Atomic composition of Gd2O3 films (a) 2A (250C, 200 sccm O2, 1.26 µm)
and (b) 2E (650C, 200 sccm O2, 2.05 µm) as a function of etch depth.
(a)
(b)

200
6.2.2. Energy dispersive x-ray spectroscopy
Energy dispersive x-ray spectroscopy (EDS) was performed on the Gd2O3 films in
order to learn more information about the compositions. These measurements are semi-
quantitative and may not provide accurate results with regards to the exact stoichiometry
of the Gd2O3 films. However, EDS provides a means to compare the relative O : Gd
ratios in the Gd2O3 films.
Figure 6.40a displays the EDS data for set 2 (function of temperature, 200 sccm
O2, 1-2 µm) deposited as a function of temperature under 200 sccm O2 flow. As the
deposition temperature is increased, the oxygen to gadolinium ratio decreases from
approximately 1.52 to 1.16 from 250 °C to 650 °C. This corresponds to a percentage
decrease of 23.6%. The percentage decrease from the XPS measurements for the same
samples was 22.7%. The similarity between these measurements suggests good
agreement and that EDS may be used to estimate the O : Gd ratio for qualitative trends.
The EDS confirms the XPS data suggesting that films deposited at low temperatures are
oxygen rich. This is supported by the entrapped oxygen pockets observed in the low
temperature deposited films (Figure 6.6) by TEM in section 6.1. Additionally, increased
temperature adds energy to the system, which allows greater diffusion lengths, and
therefore, films that are more likely to be closer to stoichiometry, as excess oxygen would
diffuse out of the film.

201
Figure 6.39. O : Gd ratio calculated from EDS measurements for (a) set 2 (function of
temperature, 200 sccm O2, 1-2 µm), (b) set 4 (250 °C, function of oxygen flow, ~1 µm),
and (c) set 3 (250 °C, 200 sccm O2, function of thickness), respectively.
(a)
(b)
(c)

202
EDS data for films 4A-4E (250 °C, function of oxygen flow, ~1 µm) are shown in
Figure 6.40b. Not surprisingly, the oxygen concentration in the films increases with
increased O2 flow during the deposition process. The effect of oxygen flow appears to
have a much larger effect on O : Gd of the films deposited at low temperatures (250 °C)
than those deposited at high temperatures (650 °C). This is likely due to the reduced
surface mobility at low temperature, and the effective trapping of oxygen within the film
structure as previously discussed. It is unknown whether the excess oxygen is located in
the bulk of the film, at the grain boundaries, or at the film/substrate interface. The
presence of excess oxygen can be correlated with the greater porosity of the films
deposited at lower temperatures and higher oxygen flows as supported by the TEM and
SEM results.
Films deposited as a function of thickness at a low deposition temperature of 250
°C are shown in Figure 6.40c. Interestingly, there is not a substantial difference in the O
: Gd ratio over a thickness of range of approximately 1 micron to 11 microns. This
suggests that as the growth of the film proceeds, the O : Gd ratio is fairly uniform
suggesting robust processing and stability.
F
6.3. Conclusions
In this chapter, the effects of processing on the structure, composition, and
interfacial chemistry of Gd2O3 films were investigated by a variety of characterization
techniques. The chapter began with a review of the structure and morphology of very
thin Gd2O3 films (< 50 nm) that were deposited under various conditions. Fully cubic
film 8A (250 °C, 200 sccm O2, 47 nm) was shown to be characterized by small clusters
of crystalline grains separated by voids. Nanometer-size pore-like features were

203
observed and determined to be disordered domains surrounded by crystallites.
Decreasing the oxygen flow to 25 sccm was found to decrease the film porosity and
improve film crystallinity. Increasing the deposition temperature to 650 °C was found to
further densify the film.
Next, the effects of processing on the phase, structure, and morphology of ~1 µm
thick Gd2O3 films deposited on Si(111) were investigated. Selected area diffraction
confirmed the existence of a phase transition from cubic to monoclinic phase along the
film thickness for both films deposited at 250 °C and 650 °C. Table 6.2 summarizes the
effects of processing on the morphology of the Gd2O3 films grown at high deposition
rates greater than 5 Å / s. For ~1 µm thick films deposited as a function of temperature
at constant 200 sccm O2 flow (set 6), increasing temperature resulted in a change from a
porous fibrous morphology to a structure with a dense nucleation zone followed by
columnar growth. Voids formed between the columns due to shadowing effects and
mixed phase growth, resulting in increased surface porosity and roughness. For films
deposited as a function of oxygen flow at a deposition temperature of 650 °C (set 1), no
significant changes were observed in the film structure. For films deposited as a function
of oxygen flow at deposition temperature of 250 °C (set 4), increasing the oxygen flow
was found to result in increased porosity in the film due to the lower adatom mobility
resulting from excess oxygen in the chamber. Increasing the film thickness at a
deposition temperature of 250 C (set 3) resulted to an increase in grain size, but no
substantial change in surface morphology. For films grown at 650 C (set 9), film growth
was initially characterized by large (~50 nm) cubic (222) facets surrounded by smaller
monoclinic grains. As the film thickness increased, the monoclinic grains dominated the

204
surface morphology. A resulting complex surface morphology with ridge-like features
was observed for thick films and attributed to both shadowing effects and highly oriented
growth of M(020) grains.
Table 6.2. Summary of process-phase trends describing the effects of temperature,
oxygen flow, and thickness on the morphology of Gd2O3 films deposited at high rates
greater than 5 Å / s. The bolded letters indicate the varied deposition parameters for each
set.
Set Temperature
(°C)
Oxygen
flow
(sccm)
Thickness
(µm) Trend
6 Function of
temperature
(250 - 650 °C)
200 ~1
Increasing temperature results in
columnar structure with increased
grain size, roughness and surface
porosity.
1 650 °C Function
of O2 flow
(50 -200)
~2
No substantial effects observed.
Temperature dominates surface
characteristics.
4 250 °C Function
of O2 flow
(25 - 200)
~1
Increasing oxygen flow leads to
smaller grain size and increased
porosity.
3 250 °C 200 sccm
Function
of
thickness
(0.5 - 11)
Increasing thickness leads to
increased grain size, but similar
morphology
9 650 °C 200 sccm
Function
of
thickness
(0.4 - 6)
Thin films show large C(222)
grains mixed with small monoclinic
phase crystallites. Surface porosity
increases with increasing thickness.
The effects of processing on the interfacial structure of select Gd2O3 films
deposited at high rates (> 5 Å / s) on silicon were studied. The results were summarized
in Table 6.1. Very thin films (<50 nm) deposited at 650 and 250 C possessed thin (2
nm) SiOx rich interfacial layers. Due to longer deposition times which resulted in
increased diffusion, thick films possessed mixed Gd-Si-O interfacial layers. The size and
structure of the interfacial layer was dependent upon the deposition conditions.

205
Generally, higher oxygen flow and higher deposition temperature led to larger interfacial
layer size and a more undulating interface. The interfacial reaction was determined to
proceed as a result of intermixing of the SiOx layer with the Gd2O3 layer to form the Gd-
Si-O interface during deposition.
Films deposited at high rates (> 5 Å / s) resulted in similar morphologies
regardless of the underlying substrate. However, when the deposition rate was lowered
to < 0.5 Å / s. significant differences were observed in the structure of the Gd2O3 films
due to the increased adatom mobility on the film surface. Table 6.3 summarizes the
effects of substrate material on the structure of film 10A grown at low rate. Gd2O3 films
grown on silicon (111) possessed large grain size and strong C(222) faceting.
Interestingly, the interfacial structure for film 10A grown on silicon was not uniform with
some interfacial regions for film 10A being primarily crystalline while others possessed
amorphous character. In the regions with a crystalline interface, highly ordered growth of
the C(222) planes were observed, while regions with amorphous interfacial layer showed
polycrystalline character. Gd2O3 films grown on GaN exhibit a completely crystalline
interfacial layer. As a result of this and the close symmetry of the (222) planes with the
GaN basal plane, regions of near epitaxy are observed during film growth. The film
consists of large columns (~200 nm) in direct epitaxial with the substrate. Due to the
large lattice mismatch, however, dislocations form and polycrystalline grain growth
occurs in some regions as the film thickness increases. Films grown on quartz possess
slightly smaller grain size as a result of the formation of multiple grains with various
orientations. This is due to the amorphous nature of the substrate which does not provide
a template for preferred in-plane orientation. Films grown on sapphire exhibited

206
significantly smaller grain size and column width. This was attributed to increase in
lattice energy due to increased compressive stresses as well as formation of small amount
of monoclinic phase.
Table 6.3. Effect of substrate material on morphology of Gd2O3 film 10A (650 °C, 50
sccm O2, 1.01 µm, 0.5 Å / s).
Substrate
Top
Surface
Grain Size
(nm)
Column
Width
(nm)
Description
Si(111) 170 100-200
Surface composed entirely of C(222) facets
with large grain size. Uniform columnar grain
growth
Quartz 110 - Surface composed of C(222) facets with
formation of smaller polycrystalline material
Sapphire 85 30-50
Surface composed of various different facets
showing clear polycrystalline growth. Small
grain size and column width attributed to
increased compressive stress
GaN 160 100-250
Surface composed mainly of C(222) facets
with large grain size. Regions of near
epitaxial growth observed. No interfacial
layer
The effects of ion bombardment on Gd2O3 film structure were examined.
Increasing ion beam current resulted in increased film densification and smoother surface
morphology. These results show that ion beam assisted deposition can be used to deposit
smooth, dense single phase thick Gd2O3 films. Next, the effects of heat treatments on
Gd2O3 film morphology were studied. It was found that heat treatments in oxygen at
1000 °C led to increased film porosity and substantial increase in interfacial layer size.
The interface phase separated into two distinct regions, an amorphous SiOx region and a
crystalline Gd-Si-O region. Lastly, XPS and EDS were used to investigate the O : Gd
ratio in the films. Films deposited at low temperatures were found to be oxygen rich,

207
consistent with the TEM results which showed porous oxygen-rich regions. As the
deposition temperature increased, the O : Gd ratio decreased. Increasing the oxygen flow
for films deposited at 250 °C (set 4) resulted in substantial change in the O : Gd ratio
while there was minimal effect at 650 °C (set 1). Lastly, the O : Gd ratio was similar for
films deposited as a function of thickness, suggesting uniformity in the O : Gd ratio
through the film thickness. As shown by the results in this chapter, it is clear that the
deposition conditions have substantial effect on film structure and morphology, which
will be shown to have significant effects on film electrical properties in chapter 7.

208
Chapter 7
Results and Discussion: Electrical properties and neutron detection response of
thick film Si(111) / Gd2O3 / Ti / Au MOS capacitors and GaN / AlGaN / Gd2O3 / Ti /
Au HEMTs
7.1. Introduction
In this chapter, the effects of processing on the electrical properties, device
performance, and neutron response of Si(111) / Gd2O3 / Ti / Au metal-oxide-
semiconductor (MOS) capacitors, GaN / AlGaN / Gd2O3 / Ti / Au MOS capacitors, and
high electron mobility transistors (HEMTs) will be discussed.
Frequency dispersion of the dielectric properties over a range of 10kHz – 1MHz
was examined for the Si(111) / Gd2O3 / Ti / Au MOS capacitors. From these
measurements, the effects of processing, structure, and phase on Gd2O3 dielectric
constant were obtained. Capacitance-voltage (C-V) and conductance-voltage (G-V)
measurements were performed on the GaN / AlGaN / Gd2O3 / Ti / Au MOS capacitors to
extract values of bulk trapped charge and interface trapped charge in the devices.
Furthermore, a charge trapping effect and non-volatile memory window were
investigated via C-V methods.
For the Si(111) / Gd2O3 / Ti / Au MOS capacitors, DC current-voltage (I-V)
measurements were performed to determine leakage currents of the Gd2O3 films. The
effects of deposition temperature, film thickness, oxygen flow, and deposition rate on the
DC I-V properties were determined and related to the film structure. Additionally, I-V
measurements as a function of temperature (I-V-T) were performed to determine the

209
conduction mechanisms present in the Gd2O3 films and determine trap levels. I-V-T
measurements were also performed on GaN / AlGaN / Gd2O3 / Ti / Au capacitors.
The operation of GaN / AlGaN / Gd2O3 / Ti / Au MOS-HEMTs was examined
with a focus on the necessary device performance for radiation detection. The effect of
film processing on the switching characteristics and leakage currents was examined.
Finally, the performance of the MOS-HEMTs under thermal neutron irradiation was
studied.
7.2. Dielectric properties
The frequency dispersion of the real dielectric constant, imaginary dielectric
constant, and dielectric loss in the range of 1kHz – 1MHz was studied for the Gd2O3
films. As observed from the dielectric dispersion measurement of a typical Gd2O3 film
shown in Figure 7.1, there is a significant reduction in dielectric constant with increasing
measurement frequency for the as-deposited sample. This was originally thought to be
caused by space charges which can respond at low frequencies but cannot become
polarized quickly enough to respond at high frequencies. However, films were then heat
treated in air at 100 °C, allowed to cool to room temperature and then, immediately re-
measured. After heat treatment, the films possessed excellent frequency dispersion over
a frequency range of 1 kHz to 1 MHz, with very minor reduction in the dielectric
constant. This is explained by the outgassing of trapped moisture within the Gd2O3 film.
The entrapped water causes a strong dipolar orientation response and inflates the
measured dielectric constant due to the high permittivity value of water (ε = 80).114
Indeed, it is well known that rare earth oxides can be highly hygroscopic.115
The

210
frequency dispersion of the dielectric constant measured after heat treatment shows that
there is minimal contribution from space charge polarization within the Gd2O3 film.
Additionally, the loss factor is significantly reduced after the heat treatment.
Figure 7.1. Dispersion of the dielectric constant and loss tangent of a Gd2O3 film as a
function of frequency (a) as deposited and (b) after heat treatment at 100 °C. Arrows
denote corresponding y axis.
7.2.1. Effects of processing on the dielectric constant
The effects of processing, structure, and crystallographic phase on the dielectric
constants of the Gd2O3 films were further examined. Table 7.1 displays the dielectric
constants for select Gd2O3 films measured at a frequency of 1MHz. All films were

211
measured at room temperature directly after heat treatment at 100 °C to ensure accurate
determination of the dielectric constant.
Table 7.1. Dielectric constants for select Gd2O3 films measured at 1 MHz.
Film Temperature (°C) O2 flow (sccm) Thickness (µm) Dielectric Constant
1A 650 50 2.05 13.4
1B 650 100 2.03 13.9
1C 650 150 1.73 14.0
1D 650 200 2.05 13.6
3A 250 200 0.58 12.0
3B 250 200 1.11 10.9
3C 250 200 2.10 10.9
3D 250 200 5.12 10.9
3E 250 200 11.01 -
4A 250 25 1.36 17.7
4B 250 50 1.67 17.7
4C 250 100 1.29 14.4
4D 250 150 1.39 13.2
4E 250 200 0.76 11.4
6A 250 200 1.07 11.7
6B 350 200 0.90 15.6
6C 450 200 0.85 15.8
6D 550 200 0.69 16.9
6E 650 200 0.89 17.2
9A 650 200 0.38 22.0
9B 650 200 0.59 22.7
9C 650 200 1.02 -
9D 650 200 2.69 14.3
9E 650 200 5.72 13.9
For films 6A-6E (function of temperature, 200 sccm O2, ~1 µm), a general trend
of increasing dielectric constant with increasing temperature was observed from a value
of 11.7 for film 6A (250 °C) to a value of 17.2 for film 6E (650 °C) as observed in Figure
7.2a. A number of possibilities for this observed dielectric behavior are proposed. The
first is explained by the increase in crystallinity in the Gd2O3 film with increasing
deposition temperature as previously shown by XRD analysis in section 4.1.

212
Figure 7.2. Gd2O3 permittivity measured at a frequency of 1 MHz as a function of (a)
temperature of films 6A-6E (function of temperature, 200 sccm O2, ~1 µm) and (b)
oxygen flow rate for films 4A-4E (250 °C, function of O2 flow, ~1 µm).
(a)
(b)

213
Indeed, it was shown in section 6.2 through transmission electron microscopy
(TEM) that films deposited at low temperature possessed regions of porosity which
would effectively lower the dielectric constant since permittivity of air is equal to a value
of one. Therefore, the increase in film density coupled with the higher dielectric constant
from crystalline Gd2O3 explains the observed behavior.
A significant change is not observed in the film dielectric constant value (13-14)
for films 1A-1D (650 °C, function of O2 flow, ~2 µm) deposited as a function of O2 flow
at 650 °C as observed from Table 7.1. This is consistent with diffraction data and
microscopy results which showed that there is minimal effect of oxygen flow on phase
volume, microstructure, and O : Gd ratio at a deposition temperature of 650 °C.
Therefore, it can be concluded that the film dielectric constant is highly correlated with
film phase, structure, and composition.
As shown in Figure 7.2b, a significant decrease in the dielectric constant from a
value of 17.7 to a value of 11.7 is observed for films 4A-4E (250 °C, function of O2 flow,
~1 µm) with increasing oxygen flow at a deposition temperature of 250 °C. A number of
possibilities exist for the decrease in dielectric constant in the material. The first is related
to the density of the film. Films deposited at lower oxygen flow rates were significantly
denser than films deposited at higher oxygen flow rates due to reduced atomic collisions
(scattering) during deposition. The porosity that formed due to the higher oxygen flow
rate and thus, lower surface adatom mobility, effectively reduces the dielectric constant.
Additionally, the grain size and crystallinity decreased with increasing O2 flow.
However, this alone may not be sufficient to explain such a drastic decrease in film
dielectric constant. Therefore, it is also necessary to consider phase volume analysis.

214
As displayed in Table 4.4, decreasing the amount of oxygen flow resulted in an
increase in the amount of the monoclinic phase from 100% (Film 4A, 25 sccm O2) to
roughly 20% (Film 4A, 200 sccm O2). The increase in dielectric constant with increased
monoclinic phase is in contrast to the studies investigating magnetron sputtering
deposition of polycrystalline Gd2O3 films51,8
in which an increase in the monoclinic phase
resulted in a decrease or no change of the dielectric constant. However, another study has
shown that epitaxial deposition of Gd2O3 films by MBE56
has resulted in a higher
dielectric constant for single phase monoclinic films (κ = 17) as compared to single phase
cubic films (κ = 14).
To further investigate the effects of phase volume on the Gd2O3 film dielectric
constant, we employ the Clausius-Mossoti relation. The Clausius–Mossotti relation116
provides a link between the physical structure of a material and the dielectric constant κ:
𝜅 =1+
8𝜋𝛼𝑚3𝑉𝑚
1−4𝜋𝛼𝑚3𝑉𝑚
Eq. 7.1
where αm is the microscopic polarizability and Vm is the molar volume. Since the molar
volume of the Gd2O3 monoclinic unit cell75
(43.67 mol / cm3) is smaller than the molar
volume of the cubic unit cell76
(47.58 mol / cm3), one would expect to observe a higher
dielectric constant for Gd2O3 films of the monoclinic phase assuming a constant
microscopic polarizability. Therefore, it is expected that for a mixed phase
polycrystalline film, an increase in monoclinic phase volume will be accompanied by a
higher dielectric constant if the microscopic polarizability remains constant. Using a
value of 9.23 for the Gd2O3 microscopic polarizability57
yields expected dielectric
constant values of κ = 14.0 and κ = 24.2 for the cubic and monoclinic phases

215
respectively. To assess the validity of the relation, the dielectric constant of pure highly
crystalline cubic phase film 11A and pure monoclinic phase film 11D were measured and
found to be κ = 13.6 and κ = 23.5, respectively. The Claussius-Mossoti relation suggests
excellent agreement for the monoclinic and cubic phase films.
Table 7.1 displays the effects of film thickness on the dielectric constant for films
9A-9E (650 °C, 200 sccm O2, function of thickness). Increase in the film thickness from
380 nm (film 9A) to 590 nm (film 9B) resulted in an increase of dielectric constant value
from 20 to 24. This is explained by the increased monoclinic phase volume observed for
film 9B as compared to 9A, and the retention of high film density before the onset of
columnar growth. With increasing thickness for films 9C-9E, the dielectric constant
decreases to values of 19, 16, and 14, respectively, despite the fact that the monoclinic
phase grew exclusively as the film grew thicker. This is correlated directly with the
increase in film porosity observed due to voiding between the growing columns as shown
in Chapter 6.4.
The effect of film thickness on the dielectric constant for films 3A-3E (250 °C,
200 sccm O2, function of thickness) are shown in Table 7.1. The dielectric constant for
these samples is low due to the poor crystallinity and porosity characterized by low
temperature deposition and high oxygen flow. Additionally, the calculated dielectric
constant was very similar between the samples due to the similarity in phase volume.
7.2.2. Bulk and interface charges
C-V measurements can yield information about fixed oxide charge, interface
trapped charge, oxide trapped charge, and mobile oxide charge within oxide thin films.

216
A typical C-V curve for a MOS capacitor will have three distinct regions corresponding
to accumulation, depletion, and inversion. However, the degenerative silicon substrates
used in this work possess high doping (N = 1019
cm-3
) and low resistivity (0.002 - 0.008
ohm - cm) which prevents substantial penetration of the electric field into the substrate.
As a result, significant depletion of the carriers in the silicon substrate does not occur and
the measured capacitance (Cm) is quite low resulting in a ratio of Cm/Cox of close to 1,
where Cox is the oxide capacitance in accumulation. Indeed, for thicker films (> 1 µm),
the capacitance remained constant even when sweeping the voltage from a value of -30 V
to +30 V (largest allowed by the instrument). A substrate with low resistivity was
necessary for radiation detection studies to ensure that the electric field stayed confined
to the film and that charge collection due to gamma radiation generated in the substrate
was minimized. Since significant depletion is not observed, it is difficult to extract
information about the trapped charge density in the oxide films. Therefore, capacitance-
voltage characterization was performed for GaN / AlGaN / Gd2O3 / Ti /Au MOS
capacitors.
Figure 7.3 displays the C-V data for GaN / AlGaN / Gd2O3 / Ti / Au MOS
capacitors 7A (250 °C, 50 sccm O2, 1.1 µm), 7E (650 °C, 50 sccm O2, 1.20 µm), and 10A
(650 °C, 50 sccm O2, 1.01 µm, 0.5Å/s). For comparison, C-V data for a GaN / AlGaN /
Ti / Au Schottky gate MS capacitor (without oxide layer) is also plotted. All samples
were swept from -20 V to 0 V to -20 V to drive the capacitor from inversion to
accumulation and back to inversion.
As observed from Figure 7.3, the threshold voltage (VTH) of the MS control
sample is approximately -2.9 V with sharp transitions between accumulation, depletion,

217
and inversion. Additionally, no hysteresis is observed in the C-V curve. The C-V
curves for the Gd2O3 devices retained this sharp transition, without any “smearing out”
characteristics suggesting good interface quality between the Gd2O3 film and GaN
substrate.117
Deposition of the Gd2O3 film, however, results in significant shift of the
threshold voltage (ΔVTH) towards more negative values. The leftward shift of the C-V
curve is attributed to positive fixed oxide charge present within the Gd2O3 film. In oxide
materials, positive fixed charge have typically been linked to oxygen vacancies and
broken bonds.118
ΔVTH values for select samples are listed in Table 7.2.
Figure 7.3. Capacitance-Voltage curves taken at 1 MHz for GaN / AlGaN / Gd2O3 / Ti /
Au MOS capacitors 7A (250 °C, 50 sccm O2, 1.1 µm), 7E (650 °C, 50 sccm O2, 1.20
µm), 10A (650 °C, 50 sccm O2, 1.01 µm, 0.5Å/s) and GaN / AlGaN / Ti / Au Schottky
control sample.

218
The largest ΔVTH values of 8.35 V and 6.52 V are observed for films 6A (250 °C,
200 sccm O2, 1.07 µm) and 7A (250 °C, 50 sccm O2, 1.10 µm), respectively. Increasing
the deposition temperature resulted in smaller ΔVTH values of 6.08 V and 4.81 V for films
6E (650 °C, 200 sccm O2, 0.87 µm) and 7E (650 °C, 50 sccm O2, 1.1 µm). From these
values, it is clear that decreasing deposition temperature and increasing oxygen flow
result in increased fixed positive oxide charge. We have shown in Chapter 6.2 through
EDS and XPS compositional analysis results that oxygen content decreases with
increasing deposition temperature and with decreasing oxygen flow. However, TEM
analysis in Chapter 6.1.2 has shown that films deposited at 250 °C possess oxygen rich
disordered regions and are less homogenous and dense than films grown at 650 °C.
Therefore, despite the greater concentration of oxygen in films deposited at 250 °C, the
increased crystallinity and greater homogeneity of the films deposited at 650 °C results in
significantly reduced fixed oxide charge. Indeed, this is further supported by the small
ΔVTH value (1.85 V) of single phase cubic film 10A (650 °C, 50 sccm O2, 1.01 µm,
0.5Å/s) which possessed excellent crystallinity and homogeneity.
Table 7.2. Threshold voltage shift (ΔVTH), hysteresis (ΔVH), bulk trapped charge (Nit),
and interface state density (Dit) for select Gd2O3 films.
Sample
Dep.
Temp
(° C)
O2
Flow
(sccm)
Film
t
(µm)
Dep.
Rate
(Å/s)
ΔVTH
(V)
ΔVH
(V) Nit (cm
-2)
Dit
(eV-1
-cm-2
)
6A 250 200 1.07 7.53 8.35 3.07 6.9 x 10¹¹
1.56 x 10¹¹
6E 650 200 0.87 8.19 6.08 3.48 3.2 x 10¹¹
1.27 x 10¹¹
7A 250 50 1.10 9.58 6.52 3.35 3.0 x 10¹¹
4.01 x 10¹¹
7E 650 50 1.20 9.11 4.81 3.41 2.7 x 10¹¹
4.61 x 10¹¹
10A 650 50 1.00 0.48 1.85 0.89 6.9 x 10¹⁰
1.05 x 10¹¹

219
The interface trap density Dit was calculated from the C-V and G-V curves using
the Cole-Hillman method119
shown in equation 7.2:
𝐷𝑖𝑡 =2
𝑞𝐴
𝐺𝑚𝑎𝑥
𝜔[(𝐺𝑚𝑎𝑥
𝜔𝐶𝑜𝑥)2+ (1 −
𝐶𝑚
𝐶𝑜𝑥
)2]−1 (eV
-1-cm
-2) Eq 7.2
where Dit is the interface state density, q is the electronic charge, A is the capacitor area,
Cox is the capacitance in accumulation, Gmax is the peak value of the conductance from
the G-V curve, ω is the angular frequency, and Cm is the measured capacitance at Gmax.
The extraction of Dit from the C-V and G-V curves is shown in Figure 7.4.
Figure 7.4. Example of G-V and C-V curve used for extracting the density of interface
states (Dit) for sample 7E (650 °C, 50 sccm O2, 1.1 µm).

220
The calculated values for Dit are shown in Table 7.2. For films 6A, 6E, 7A, and
7E deposited at high rates, raising the oxygen flow from 50 sccm to 200 sccm by a factor
of 4 reduces the interface state density by a factor of 4 from ~4 x 10¹¹
to ~1 x 10¹¹
eV-1
-
cm-2
. Indeed, this data suggests that oxygen flow plays a more important role than
temperature in determining the Dit. One possibility is that for films deposited at 50 sccm
O2 under high rates, not enough oxygen is present to passivate the surface states. Single
phase cubic film 10A deposited at low rates possessed the lowest Dit (1 x 10¹¹
eV-1
-cm-2
)
of all measured samples. This is unsurprising given the near-epitaxial growth observed in
the TEM analysis shown in Chapter 6.1.6.
All the GaN / AlGaN / Gd2O3 / Ti / Au MOS capacitors showed significant
amount of hysteresis, ΔVH, as shown in Figure 7.3. Hysteresis is indicative of the
presence of trapping of slow charge carriers. The hysteresis possessing counter-
clockwise character is a result of electron trapping within the bulk oxide film and/or at
the semiconductor / film interface. Since the measured Dit was fairly low and similar for
all samples deposited at high rates, it is likely that the ΔVH is mainly a result of bulk
oxide trapping. ΔVH is significantly reduced for single phase film 10A deposited at low
rates. From the hysteresis it is possible to calculate the trapped charge using equation
7.3120
:
𝑁𝑖𝑡 =Δ𝑉𝐻𝐶𝑜𝑥
𝑞𝐴 (cm
-2) Eq 7.3
where Nit is the concentration of trapped charge, ΔVH is the hysteresis, Cox is the
capacitance in accumulation, q is the electronic charge, and A is the area of the capacitor.
The measured values for Nit are listed in Table 7.2.

221
Recent work by Chang et al. has shown that crystalline Gd2O3 can act as a charge
trapping layer with a nonvolatile memory effect.121
While this is desirable for charge
memory storage devices, a memory effect would lead to instability and suboptimal device
performance for the HEMTs during neutron detection. Chang et al. have proposed that
this effect occurs in crystalline Gd2O3 films deposited on GaN/AlGaN structures, but is
absent in amorphous Gd2O3-based devices. To test this phenomenon, C-V characteristics
of GaN / AlGaN / Gd2O3 / Ti / Au MOS capacitors 6A (250 °C, 200 sccm O2, 1.07 µm)
and 10A (650 °C, 50 sccm O2, 1.01 µm, 0.5Å/s) were investigated. 6A and 10A were
chosen due to their poor and excellent crystallinity, respectively.
Figure 7.5a shows the C-V curve of Gd2O3 film 6A. For the first measurement,
the bias was swept from 0 V to -20V at 1MHz frequency (curve 1). The C-V curve shows
clear accumulation, depletion, and inversion regions with a threshold voltage of
approximately -14V. The C-V measurement was then repeated multiple times (curves 2
and 3), with an applied soak before the sweep to test the threshold voltage stability and
charge trapping effect. As observed from Figure 7.5, the C-V curve shifted to the right,
with application of ~2 and 3 V positive voltage soaks suggesting charge trapping was
occurring. To determine if the charge trapping effect was reversible, the device was then
biased in depletion at a voltage of -30 V. The sweep was repeated and it was observed
that the threshold voltage could shift back leftward, suggesting that the charge trapping
effect is indeed reversible for film 6A.
Figure 7.5b shows the C-V curve for Gd2O3 film 10A. For the first measurement,
the bias was swept from 0 V to -20V at 1MHz frequency (curve 1). The sample was then

222
soaked at +10 V and the C-V sweep was re-measured (curve 2). A slight 2 V positive
shift is observed in the C-V curve.
Figure 7.5. C-V curves for GaN / AlGaN / Gd2O3 / Ti / Au MOS capacitors (a) 6A (250
°C, 200 sccm O2, 1.07 µm) and (b) 10A (650 °C, 50 sccm O2, 1.01 µm, 0.5Å/s).
(a)
(b)

223
After applying a +30 V soak and re-sweeping (curve 3), a significant shift in the
threshold voltage (5 V) was observed. A -30 V bias was then applied to deplete the
capacitor, and the sweep was re-run (curve 4). However, no return to the original state
was observed and the threshold remained fixed. Therefore, a nonvolatile memory effect
is observed in the highly crystalline Gd2O3 devices deposited at 650 °C, but not in the
poorly crystalline devices deposited at 250 °C. In comparison, Chang et al. found that
the nonvolatile memory effect was present in their crystalline samples, but not their
amorphous samples.121
Furthermore, they suggested that recovery is only achievable
through time dependent natural charge loss. These trapped charges could have
significant effect on device operation, the effects of which will be discussed in more
depth in the following sections.
7.3. DC conduction in Si(111) / Gd2O3 / Ti / Au MOS capacitors
DC conduction in Gd2O3 films was investigated through current-voltage-
temperature (I-V-T) measurements. These measurements are used to determine the
conduction mechanisms which dominate charger carrier transport within the oxide. Due
to the costs and time associated with the measurements, select samples were chosen for
evaluation. For the I-V-T measurements, the applied voltage ranged from 0 to 100V in
both positive bias (substrate injection) and negative bias (gate injection). Due to the
low penetration depth of the electric field into the degeneratively doped silicon substrate,
it is possible to analyze conduction mechanisms in both positive and negative bias
without significant effects from substrate conduction. The magnitude of the electric field
range studied depended on the oxide film thickness. Figure 7.6 displays the I-V-T data

224
for Si / Gd2O3 / Ti / Au MOS capacitor 9D (650 °C, 200 sccm O2, 2.69 μm) measured at
temperatures from 25 °C to 200 °C. For purposes of film thickness and device area
normalization, we plot the results in terms of current density J (A / cm2) and electric field
E (V/m).
Figure 7.6. J-E characteristics for Si / Gd2O3 / Ti / Au film 9D (650 °C, 200 sccm O2,
2.69 μm) measured under temperature range of 25 - 250 °C.
Current in an ohmic conduction regime is expressed in equation 7.4:
𝐽 =𝑞𝑛0𝜇𝐸
𝑑 (A / cm
2) Eq.7.4
where J is the current density, n0 is the density of free carriers, μ is the carrier mobility, V
is the voltage, and d is the film thickness. Log I vs Log V is plotted for film 9D under
negative bias in the low field region (1x10⁶ V / m – 1x10
7 V / m) for measurement

225
temperatures of 25 – 200 °C as shown in Figure 7.7. The dots are the measured data
points and the solid line is the fit to the data.
Figure 7.7. Log I vs Log V under gate injection for Gd2O3 film 9D (650 °C, 200 sccm
O2, 2.69 μm) measured between 25 – 250 °C under low electric field of 1x10⁶ V / m –
1x10⁷ V / m.
At room temperature (25 °C), the slope is equal to 1 indicating that the I-V
relationship is linear and therefore dominated by ohmic conduction. At higher
measurement temperatures under gate injection, the slope increases to a value of 1.4 – 1.7
which cannot be attributed to ohmic conduction. Under substrate injection, a good fit to
ohmic conduction is not observed (not plotted). This is possibly due to contribution from
the interfacial layer at the Si / Gd2O3 interface which results in a combination of bulk and
interfacial conduction. A comprehensive study of conduction mechanisms for Gd2O3

226
films with different interfacial layer size and composition could help reveal the effects of
the interface on conduction.
Since ohmic conduction was not observed except at room temperature under gate
injection, various non-linear conduction mechanisms were investigated to explain the
observed behavior. The conduction mechanisms are grouped into two categories;
electrode limited conduction where contacts or interfacial effects dominate conduction
and bulk limited conduction where conduction is limited by the oxide itself. The first
investigated mechanism was the electrode limited Schottky emission mechanism. The
expression for Schottky emission is given by equation 7.5122
:
𝐽 = 𝐴∗𝑇2𝑒𝑥𝑝 [−𝑞(ɸ−√𝑞𝐸𝑜𝑥/4𝜋𝜀𝑟𝜀0
𝑘𝐵𝑇] (A / cm
2) Eq. 7.5
where J is the current density, A* is the Richardson constant, T is the measurement
temperature, q is the electronic charge, ɸ is the Schottky barrier height, Eox is the electric
field across the oxide, kB is Boltzmann’s constant, 𝜀𝑟 is the oxide dielectric constant, and
𝜀0 is the permittivity of free space. Therefore, if Schottky conduction is a dominating
mechanism, ln(J/T2) vs √𝐸𝑜𝑥 should yield a linear plot. The fit to Schottky emission is
plotted for both positive and negative bias in Figures 7.8a and 7.8b, respectively.
The data in Figure 7.8 displays a good linear fit to the Schottky conduction under
both gate and substrate injection. However, in order to confirm that Schottky mechanism
is dominating conduction in this range, the permittivity calculated from the slope of the
plot based on equation 7.5 must be in good agreement with the measured permittivity of
the material.

227
Figure 7.8. Schottky emission plots (ln (J/T
2) vs E
1/2) under (a) gate injection and (b)
substrate injection for Gd2O3 film 9D (650 °C, 200 sccm O2, 2.69 μm).
Table 7.3 displays the calculated dielectric constants from the Schottky plots
which are found to be between 1.4 and 2.9 for the temperature range of 25 – 200 °C.
This is significantly lower than the measured static permittivity of the Gd2O3 films (10-
24). However, it has been proposed that the optical permittivity should be used when
(a)
(b)

228
the charge carriers possess high velocity since it only induces the electronic component
of polarization. In comparison, if the carriers are slow, then the static permittivity should
be used.123
For Gd2O3 films, optical permittivity124
has been used in the literature. The
optical permittivity of the Gd2O3 films in this work was extracted from the measured
refractive index using the ellipsometry technique. The refractive index was found to
range from 1.4 - 2.1 depending on the deposition conditions (see appendix B). Using the
relation, n2
= εo, this yields an optical dielectric constant of 1.95 – 4.4. These values
match quite well with the calculated dielectric constants extracted from the Schottky plots
for temperatures of 75 – 200 °C under gate injection and 100 – 200 °C under substrate
injection, suggesting Schottky emission is dominant in this regime.
Table 7.3. Calculated dielectric constant from Schottky and Poole-Frenkel plots for Si /
Gd2O3 / Ti / Au device 9D (650 °C, 200 sccm O2, 2.69 μm).
Negative bias (gate injection) Positive bias (substrate injection)
Measurement
Temperature ( °C )
Calculated
dielectric
constant –
Schottky
Calculated
dielectric
constant –
Poole Frenkel
Calculated
dielectric
constant –
Schottky
Calculated
dielectric
constant – Poole
Frenkel
25 1.4 17.3 1.3 10.0
50 1.6 15.8 1.3 9.6
75 2.0 22.7 1.6 16.0
100 2.5 47.0 2.0 27.2
125 2.9 66.0 2.1 32.6
150 2.8 76.3 2.2 28.9
175 2.7 71.6 2.1 38.1
200 2.9 155.7 2.2 47.8
The reduced Schottky barrier height is obtained from the slope of the ln(J/T2) vs
1/T plot shown in Figure 7.9a for various voltages. The reduced barrier height decreases
linearly with V1/2
. By extrapolating to V = 0, the effective Schottky barrier height can be

229
determined as shown in Figure 7.9b. From the plot, a Gd2O3 / Au barrier height of 0.54
eV is extracted. This is significantly smaller than the ~3 eV barrier height we can expect
based on the work function of the Au electrode125
(5.1 eV) and the electron affinity of
Gd2O3 (~2 eV).126
However, this barrier height is similar to the value reported in the
literature of 0.33 and 0.51 eV by two different methods for a 70 nm thin film Si / Gd2O3 /
Au structure.127
A few possibilities can explain the low value of the barrier height
compared to the theoretical value. The first is related to Fermi level pinning, where a
large density of surface states “pins” the Fermi level at a surface state energy. Indeed,
while absent in single crystal Gd2O3, Fermi level pinning has been shown to exist in
amorphous and polycrystalline Gd2O3.128
Another possibility is related to bulk trap states which modulate the barrier value.
A recent report which found a barrier height of 0.6 eV for a thin epitaxial Si / Gd2O3 / Pt
structure suggested the lower extracted barrier height is a result of a defect-related energy
band in the oxide.126
Additionally, for the substrate injection case, a barrier height of
0.56 eV (not plotted) was extracted for the Si / Gd2O3 interface, very similar to that of the
Gd2O3 / Ti / Au interface. This suggests that the Si / Gd2O3 interface does not contribute
significantly to Schottky emission, and further supports that the cause of reduced barrier
height is related to the existence of a bulk trap state rather than an interface state.

230
Figure 7.9. (a) Arrhenius ln(J/T
2) vs 1/T plots used to extract reduced Schottky barrier
height for various voltages (85, 90, 95, 100) and (b) extraction of effective Schottky
barrier height by extrapolation of reduced barrier height vs V1/2
to V=0 under gate
injection for film 9D (650 °C, 200 sccm O2, 2.69 μm).
As shown in Table 7.3, despite the good linear fits at temperatures of 25 °C and
50 °C, the extracted dielectric constant is too low to indicate that the Schottky conduction
(a)
(b)

231
mechanism is dominant and suggests another conduction mechanism may be possible.
Therefore, bulk-limited Poole-Frenkel conduction was investigated in the Gd2O3 films.
Poole-Frenkel is very similar to Schottky conduction except that the electrons are injected
from bulk traps within the oxide conduction band rather than from an electrode. For
Poole-Frenkel conduction122
, the current density is given by equation 7.6:
𝐽 = (𝑞𝑁𝐶𝜇)𝐸𝑜𝑥 [−𝑞(ɸ−√𝑞𝐸𝑜𝑥/𝜋𝜀𝑟𝜀0
𝑘𝐵𝑇] (A/cm
2) Eq 7.6
where J is the current density, q is the electronic charge, Nc is the density of states in the
conduction band, μ is the electronic drift mobility, Eox is the electric field across the
oxide, ɸ is the trap energy level, 𝜀𝑟 is the oxide dielectric constant, 𝜀0 is the permittivity
of free space, kB is Boltzmann’s constant, and T is the measurement temperature. From
equation 7.6, ln (J/E) vs V1/2
should give a linear relationship for this conduction
mechanism. The Poole-Frenkel plots are shown for gate and substrate injection in Figure
7.10a and 7.10b, respectively, showing good fitting characteristics. The permittivities
were obtained from the slope using equation 7.6 and are listed in Table 7.3. For gate
injection, at temperatures between 25 – 75 °C, the extracted permittivities (15-22) agree
well with the static permittivities measured from the C-V measurements in section 7.2.2.

232
Figure 7.10. Poole-Frenkel plots (ln (J/E) vs E1/2
) under (a) gate injection and (b)
substrate injection for Gd2O3 film 9D (650 °C, 200 sccm O2, 2.69 μm).
(a)
(b)

233
In addition, the trap activation energies (Et) at a given voltage may be calculated
from the slope of ln (J/E) vs 1/T plot using equation 7.6. For the gate injection case, this
plot is shown in Figure 7.11a.
Figure 7.11. (a) Arrhenius ln(J/E) vs 1/T plots to extract trap energy levels for various
electric field strengths and (b) extraction of zero field trap ionization energy by
extrapolation of trap energy vs V1/2
to V=0 under gate injection for Gd2O3 film 9D (650
°C, 200 sccm O2, 2.69 μm).
(a)
(b)

234
The zero-field ionization energy was extracted by extrapolating the Et vs. V1/2
plot
to yield the zero field trap ionization energy (ɸt) as shown in Figure 7.11b. From these
plots we extract trap energy levels of 1.03 eV and 1.25 eV for gate and substrate
injection, respectively. These trap levels match well with previously reported trap level
of 1.2 eV under gate injection for epitaxial 6 nm thick Gd2O3 deposited on p-type Si.124
Due to the large thickness (2.69 μm) of film 9D (650 °C, 200 sccm O2, 2.69 μm)
and the maximum applied voltage of 100V, a large electric field could not be placed
across the device. Therefore, conduction mechanisms of film 9A (650 °C, 200 sccm O2,
0.38 μm) were studied in order to determine the dominant mechanism in the high electric
field region. Film 9A was deposited under similar conditions as film 9D, but with
smaller film thickness. Space charge limited current conduction (SCLC) mechanism is
given by equation 7.7 for a single discrete trap level:
𝐽 = 9
8𝜇𝜀𝑟𝜀0
𝑉2
𝑑3 (A / cm
2) Eq. 7.7
where J is the current density, μ is the carrier mobility, 𝜀𝑟 is the oxide dielectric constant,
𝜀0 is the permittivity of free space, V is the applied voltage, and d is the film thickness.
According to equation 7.7, for SCLC conduction mechanism, a log I versus log V should
yield a linear fit with a slope of 2. Figure 7.12 shows the log I versus log V plots and the
fits to the SCLC conduction mechanism.
Under gate injection, in the temperature range of 150 – 200 °C, the data fits well
to the SCLC mechanism with a single discrete trap level. In the temperature range of 75
– 125 °C, the data fits the SCLC conduction mechanism but the slope (2.4) was higher
than 2. This indicates that the trap states may be exponentially distributed in the energy

235
gap.129
Under substrate injection, a good fit to the SCLC conduction mechanism was not
found.
Figure 7.12. Log I versus Log V showing space charge limited conduction under high
electric fields for Gd2O3 film 9A (650 °C, 200 sccm O2, 0.38 μm).
Unfortunately, due to the high required electric field to induce the SCLC
mechanism and the maximum 100 V bias of the measurement apparatus, we are unable to
confirm the thickness dependence of the SCLC mechanism based on equation 7.7 for
thicker Gd2O3 films since the SCLC mechanism appears only for electric field values
greater than 1x10⁸
V / m. However, it is important to note that increased film thickness
resulted in significant changes in film phase and structure. Therefore, conduction through
the films may not be equivalent for the same applied electric field in different films. It is
strongly suggested that further work investigate the effects of processing, film structure,
and phase on Gd2O3 conduction mechanisms. Clearly, conduction in thick Gd2O3 films is

236
governed by a number of different conduction mechanisms across a wide temperature and
electric field range.
7.4. Conduction mechanisms in GaN / AlGaN / Gd2O3 / Ti / Au MOS capacitors
The I-V-T characteristics for fully cubic Gd2O3 film 10A (650 °C, 50 sccm O2,
1.01 µm, 0.5Å/s) deposited on GaN /AlGaN is shown in Figure 7.13. As observed, the
curve is highly asymmetric, with the forward bias current being approximately 2 orders
of magnitude higher than the reverse bias current. For the GaN / AlGaN / Gd2O3 / Ti /
Au MOS capacitor devices, we studied the conduction mechanisms in the positive bias
region (substrate injection) under accumulation to ensure that the electric field drops only
across the oxide and that no significant contributions from substrate conduction are
observed.
Figure 7.13. J-E characteristics for GaN / AlGaN / Gd2O3 / Ti / Au film 10A (650 °C, 50
sccm O2, 1.01 µm, 0.5Å/s) measured under temperature range of 25 - 250 °C.

237
Between 25 – 100 °C, the experimental data in the positive bias regions was fitted
to the Poole-Frenkel model using equation 7.6. Dielectric constants of 12-23 were
extracted using the slope of the linear ln (J/E) vs E1/2
plots. These values are in good
agreement with the static permittivity measured by C-V measurements. From the
temperature dependence, a trap height of 0.46 eV was calculated. As the temperature is
increased between 125 and 200 °C, the Poole-Frenkel model no longer holds. Instead,
transition to Schottky mechanism is observed. Schottky plots of ln (J/T2) vs E
1/2 yielded
dielectric constants of 2-2.5, a good match to the optical dielectric constants measured
through ellipsometry. A Schottky barrier height of 0.79 eV was calculated from the data.
7.4. Integration of Gd2O3 into GaN / AlGaN HEMTs
After transistor fabrication was completed on GaN / AlGaN substrates, field effect
transistor (FET) measurements were made to determine the quality of the devices. The
fabricated transistors were depletion mode devices. For depletion mode devices under
standard conditions with no voltage applied, the device is “on”, meaning that current is
flowing between the source and the drain and the channel is conductive. To turn the
device “off”, or impede the current flow between the source and the drain, a large enough
negative gate voltage (VG) must be applied between the source and the gate. This is
called the threshold voltage, VT. Two figures of merit for these devices are the on/off
ratio and the subthreshold swing (SS). The on/off ratio refers to the ratio of the
maximum measured current in the on state to the minimum measured current in the off
state in the drain. Due to the small generated currents from neutron absorption in Gd2O3,

238
a low leakage current in the drain in the off state is necessary (< 1 nA) for radiation
detection and therefore, a high on/off ratio is desired. The subthreshold swing is an
indicator of how quickly a transistor can switch on and off and a lower number indicates
faster switching.
The transfer characteristics for GaN / AlGaN / Gd2O3 / Ti / Au MOS-HEMT 10A
(650 °C, 50 sccm O2, 1.01 µm, 0.5Å/s), a GaN / AlGaN / SiO2 / Ti / Au MOS-HEMT,
and a control GaN / AlGaN / Ti / Au MS-HEMT without a gate oxide are shown in
Figure 7.14. For the control sample, the threshold voltage is approximately -4 V. The
on/off ratio for this device is only 45 and the subthreshold swing is 585 mV/ decade. The
properties of the control device are quite poor likely due to significant leakage from the
gate. Insertion of the SiO2 oxide layer improves the on/off ratio to approximately 106.
The threshold voltage is shifted towards a negative value by only ~1 V, suggesting small
amount of fixed oxide positive charge. Insertion of the Gd2O3 oxide layer significantly
improves the transistor properties. The measured on/off current ratio of ~5 x 10⁹ for the
device with Gd2O3 film 10A is among the highest values for GaN / AlGaN MOS-HEMTs
reported in the literature.130
Additionally, the subthreshold swing is greatly improved
over the control device, being reduced to 88 mV / decade. However, it is important to
note that a significant amount of hysteresis is observed in the transfer curves of the
Gd2O3 device that is not present in the control device or in the SiO2 device. This is likely
related to the effects of charge trapping shown previously through C-V measurements.
Additionally, repeated gate voltage sweeps resulted in shifting of the threshold voltage.
This threshold voltage instability is detrimental for device operation and more work is
needed to determine how to mitigate this issue.

239
Figure 7.14. Transfer characteristics of Gd2O3 MOS HEMT, SiO2 MOS HEMT, and a
control MS HEMT without oxide layer.
The high on/off ratio corresponds to low leakage current in the drain in the off
state (< 10 pA). Low drain leakage currents in the off state allow for measurement of
radiation induced phenomenon within the devices which based on our results require
leakage currents of <1 nA. The in-situ radiation testing was performed at a value of Vg
right below Vt to ensure that off state drain currents are low. It is critical, however, that
the leakage current through the gate oxide must be low enough in the off state so that it is
possible to simultaneously measure the current increases in the gate as a result of the
radiation. For the Gd2O3 devices, even at values of Vg as high as -50V, the gate current
remains <100pA. Therefore, the Gd2O3 devices were adequately resistive for use in
radiation testing. It is also important to note that only devices where the Gd2O3 film was
deposited at 650 °C showed good transfer characteristics adequate for neutron detection.

240
Gd2O3 HEMTs incorporating films deposited at 250 °C suffered from poor on/off ratios
(~106) and extremely large (~30 V) threshold voltage shifts.
7.5. Thermal neutron and gamma response of GaN / AlGaN MOS HEMTs
After transistor characterization and packaging, select samples were taken to the
Breazeale nuclear reactor for thermal neutron irradiation in the beam lab. Results from
three GaN / AlGaN / Gd2O3 / Ti /Au HEMTs are presented: a ~1 μm thick cubic phase
film (Film 10A, 650 °C, 50 sccm O2, 1.01 µm, 0.5Å/s), a ~1 μm thick mixed phase film
(Film 12F, 650 °C, 50 sccm O2, 1.03 µm, 7.4Å/s), and a ~10 μm thick mixed phase film
(Film 12G, 650 °C, 50 sccm O2, 10.2 µm, 7.6Å/s). Additionally, a ~1 μm thick SiO2
control sample was fabricated in order to isolate the gamma ray contribution since SiO2 is
not sensitive to neutrons.
The gate bias was set 1 V below the threshold voltage to ensure the device
remained in the off state during irradiation. Since the threshold voltage varied between
samples, the necessary voltage required to turn the device off resulted in differences in
electric field applied across the oxide for different devices. The threshold voltage for
Gd2O3 devics was significantly higher (Δ = ~3 V) than that of SiO2 as was shown in
Figure 7.14, resulting in a larger electric field needed across the oxide. Unfortunately, a
larger gate bias could not be placed across the SiO2 device to ensure the same electric
field across all devices due to the high gate leakage within the SiO2 which was unsuitable
for neutron detection. The drain voltage was set to a default value of 10 V unless the
drain currents were exceedingly high in which case the drain voltage was lowered to
ensure drain currents <500 pA.

241
Once the samples were biased below the threshold voltage, the neutron beam
shutter was opened and the in-situ current response was measured in both the drain and
the gate as shown in Figure 7.15. Due to the negative bias applied on the gate, the
current is negative in sign, and the current becomes increasingly negative as the device is
irradiated and the charge products collected. The response in the drain is of opposite
polarity and of smaller magnitude than that of the gate. The neutron beam shutter was
then closed, and reopened multiple times for each sample at various reactor powers
(neutron fluxes). As can be observed from Figure 7.15, there is noise (shown by the
arrow) in the measurement on the order of ~0.1 pA. The spikes observed in the drain
current are a result of the vibrations induced by the force of the shutter movement.
Additionally, a slight decrease in magnitude of the current change is observed with each
successive shutter opening, which was attributed to transient behavior before the samples
could reach steady state.
The magnitude of the current response in the gate and drain is shown in Table 7.4
for select GaN / AlGaN MOS-HEMTs under irradiation at reactor power of 100 kW.
Samples were irradiated under the full beam which contained neutrons (n) and gamma
radiation (γ-rays). Subsequently, the devices were shielded with cadmium foil which
stopped 99.99% of the neutrons from passing through, creating a gamma-ray only signal.
The neutron response was then calculated by subtracting the shielded response from the
unshielded response in equation 7.8:
ΔIunshielded (n + γ-rays) – ΔIshielded (γ-rays) = ΔIneutrons (n) (Amps) Eq 7.8

242
where ΔIunshielded is the current response to the full beam (neutrons and γ-rays), ΔIshielded is
the current response to the shielded beam (γ-rays) only and ΔIneutrons is the calculated
current response to neutrons.
Figure 7.15. In situ current response in (a) gate and (b) drain of 1 μm mixed phase cubic
Gd2O3 device 12F during neutron irradiation at 100kW reactor power. The arrows
identify the noise in the measurement.
(a)
(b)

243
Table 7.2 displays the device gate response to unshielded (neutrons and γ-rays),
shielded (γ-rays only) radiation, and the calculated neutron only response. For the 1 μm
thick GaN / AlGaN / Gd2O3 MOS-HEMTs, the current increase due to neutron radiation
was approximately 2.56 pA and 1.43 pA for devices with cubic Gd2O3 film 10A and
mixed phase film 12F under electric fields of 200kV / cm and 300 kV / cm, respectively.
Assuming a linear increase in current with electric field, this suggests a fairly similar
current between the mixed and cubic phase films, suggesting that processing parameters
did not play a large role in total charge collection. Additionally, the SiO2 sample showed
a neutron response of 1.78 pA in the gate at an applied electric field of 50 kV/cm, which
suggests that SiO2 device outperformed the Gd2O3 devices. Since the SiO2 layer should
not be neutron sensitive, the larger currents may come as a result of γ-rays. The small
neutron response of the Gd2O3 films could potentially be a result of the low film
thickness relative to the mean free path of neutrons in Gd2O3 (~7.7 μm).5 Therefore, a 10
μm thick mixed phase film was synthesized, processed, and evaluated. With the 10 μm
Gd2O3 overlayer, we observed a significant increase in the radiation response of the GaN
/ AlGaN MOS-HEMTs. At low fields of approximately 40 kV / cm, an increase in the
measured neutron response up to 10 pA was observed.
The observed drain currents shown in Table 7.4 are lower in magnitude than the
gate currents. Interestingly, no response was observed in the drain current for 10 μm
thick Gd2O3 device 12G in both unshielded and shielded irradiations as shown in Table
7.4. This is likely due to the fact recombination is occurring in the thick Gd2O3 film,
preventing charge injection into the channel during irradiation. As shown in Table 7.4,
for the 1 μm thick films, we observe that the SiO2 device resulted in a higher total

244
calculated neutron response than the Gd2O3 device. This suggests that in the thin film
limit (1 μm), the Gd2O3 overlayer does not provide any additional benefit in detection of
thermal neutrons in the drain response of the GaN/AlGaN MOS-HEMTs.
Table 7.4. Response of Gd2O3 and SiO2 MOS-HEMTs to unshielded radiation (neutrons
+ γ-rays), shielded radiation (γ-rays only), and calculated neutron response in both the
drain and the gate.
1 μm cubic
phase Gd2O3
film 10A
1 μm mixed
phase Gd2O3
film 12F
10 μm mixed
phase Gd2O3
film 12G
SiO2
control
film
Applied field
over gate
oxide
(kV / cm)
300 200 40 50
Gate
n + γ-ray
response (pA) 4.73 1.96 26.7 1.92
γ-ray
response (pA) 2.17 0.53 16.7 0.20
n response
(pA) 2.56 1.43 10 1.78
Drain
n + γ-ray
response (pA) 0.52 1.35 0 1.67
γ-ray
response (pA) 0 0.45 0 0.93
n response
(pA) 0.52 0.9 0 0.74
The experimental currents measured during neutron irradiation greatly exceed
those simulated by the GEANT4 modeling by an order of magnitude.5 For the 10 μm
thick film 12G, we observed over an order of magnitude increase in the response
compared to the model. Assuming that the model is correct, the excess currents may be
the result of charge collection due to secondary gamma radiation, which would explain

245
the current response for the SiO2 devices. Perhaps with more film optimization, it would
be possible to increase the neutron current response of the Gd2O3 films.
7.6. Conclusions
The dielectric properties of Si(111) / Gd2O3 / Ti / Au MOS capacitors were
investigated. Moisture absorption in Gd2O3 films was found to result in both increased
dielectric loss (~10x) and inflated dielectric constant values (40%). Heat treatment of the
films at 100 °C resulted in outgassing of moisture, reduction in dielectric constant, and
excellent frequency dispersion of the dielectric constant over a range of 10 kHz – 1 MHz.
The effects of film processing and structure on the high frequency (1 MHz)
dielectric constant of the Gd2O3 films were examined. Improvement in film crystallinity
due to increased deposition temperature from 250 °C to 650 °C resulted in an increase in
the dielectric constant from a value of ~11 to 17 for films 6A-6E (function of
temperature, 200 sccm O2, ~1 μm). For films 4A-4E (250 °C, function of O2 flow, ~1
μm), dielectric constant decreased from 18 (25 sccm O2) to 11 (200 sccm O2) with
increasing oxygen flow. This was attributed to both increased density at lower O2 flow as
well as greater monoclinic phase volume. The dielectric constants for pure cubic (film
11A) and monoclinic (film 11D) phase films were 14 and 24, respectively, agreeing well
with the Claussius-Mossoti relationship. Increasing the film thickness resulted in
decreased dielectric constant for sets 9 (650 °C, 200 sccm O2, function of thickness) and
3 (250 °C, 200 sccm O2, function of thickness) due to the increase in film porosity.
Capacitance-voltage (C-V) characteristics of GaN / AlGaN / Gd2O3 / Ti / Au
MOS capacitors were investigated and all Gd2O3 films tested showed leftward threshold

246
voltage shift compared to the MS control sample as a result of fixed oxide charge within
the film. No smearing out of the C-V curve was shown indicating good interface quality.
All Gd2O3 devices displayed hysteresis characteristics in the C-V curves from which the
concentration of trapped charge (Nt) was calculated. Conductance-voltage (G-V)
measurements were performed in order to extract interface state density (Dit). Pure cubic
phase films deposited at 650 °C with low rate were shown to have lowest Dit (1.05 x 10¹¹
eV-1
-cm-2
) and Nt (6.9 x 10¹⁰
cm-2
). C-V measurements were also performed to test the
threshold stability and charge trapping effects in the Gd2O3 devices. A non-volatile
memory effect consistent with previous literature reports was observed for crystalline
Gd2O3 films deposited at 650 °C, but was absent in films deposited at 250 °C. All devices
showed threshold voltage instability regardless of film deposition temperature.
Conduction mechanisms in Gd2O3 films were studied through current-voltage-
temperature (I-V-T) measurements. A wide range of mechanisms were found to govern
conduction in Gd2O3 films across a wide temperature and electric field range. In general,
at low measurement temperature under low fields, Poole-Frenkel was determined to be
the dominating conduction mechanism. Trap heights of 1.03 and 1.25 eV were extracted
for gate and substrate injection, respectively. In general, at high temperature under low
fields, Schottky emission was found to be the dominating conduction mechanism.
Schottky barrier heights for the Gd2O3 / Ti / Au and Si / Gd2O3 interfaces were found to
be 0.54 eV and 0.56 eV, respectively, suggesting that the interfacial layer did not
significantly affect Schottky emission. The low barrier height was attributed to the
existence of a bulk trapping effect in the oxide. Finally, in the high electric field region,
space charge limited current (SCLC) was responsible for conduction under gate injection.

247
It is important to note that in certain regions, the I-V data could not be fit to any
particular mechanism, suggesting that conduction is complex and a function of multiple
mechanisms.
For GaN / AlGaN / Gd2O3 / Ti / Au MOS capacitors, I-V-T measurements
determined that the I-V characteristics were governed by Poole-Frenkel effect at
temperatures of 25 – 100 °C with a trap height of 0.46 eV. Between 125 and 200 °C, the
current was controlled by Schottky emission with a barrier height of 0.79 eV. The
performance of GaN / AlGaN / Gd2O3 / Ti / Au MOS-HEMTs was investigated with
emphasis on necessary device performance for radiation detection. Gd2O3 films
deposited at 250 °C resulted in devices with poor switching characteristics and poor
on/off ratios (106). Gd2O3 films deposited at 650 °C led to devices with good switching
characteristics including on/off ratio of 109
and subthreshold swing of 88 mV. However,
significant hysteresis and threshold voltage instability was observed for the Gd2O3 MOS-
HEMTs, which is related to the effects of trapped charge identified in the C-V
measurements.
Finally, the radiation response of GaN / AlGaN / Gd2O3 / Ti / Au MOS-HEMTs to
gamma and neutron radiation was investigated and compared with a GaN / AlGaN /
SiO2O / Ti / Au control device. For devices with 1 μm thick Gd2O3 films, the neutron
response was similar to the control device, suggesting that the Gd2O3 overlayer did not
provide any added benefit of neutron detection. Devices with 10 μm thick Gd2O3 films
showed significantly increased current response to neutrons (10pA at reactor power of
100 kW). However, the neutron response was larger than the expected theory, suggesting
that added signal due to gamma radiation may have been collected.

248
Chapter 8
Conclusions and Future Work
8.1. Conclusions
The process-structure-property relationships of thick Gd2O3 films deposited by
reactive electron-beam physical vapor deposition (EB-PVD) have been investigated. The
performed work has resulted in a number of important findings that are important from
both a scientific perspective as well as for development of neutron detectors
incorporating micron thick Gd2O3 films. This section will summarize the major results of
this dissertation work pertaining to the process-phase relationships (chapter 4), stress-
induced phase transition and texture evolution (chapter 5), microstructure, composition,
and interfacial phenomena (chapter 6), and electrical properties and radiation response of
Gd2O3 microelectronic devices (chapter 7).
Chapter 4 – Bulleted Summary
The effects of substrate temperature, oxygen flow, and film thickness on the phase
and crystallinity of thick Gd2O3 films deposited by reactive electron beam-physical
vapor deposition (EB-PVD) at high rates (> 5 Å / s) were examined via x-ray
diffraction (XRD) and Raman spectroscopy. Quantitative phase volume
calculations were performed via a Rietveld refinement technique.
o All films were found to be fully monoclinic or mixed / cubic monoclinic
phase.
o Generally, increased deposition temperature and increased oxygen flow
resulted in increased cubic phase volume.

249
o As film thickness increased, monoclinic phase volume increased.
Grazing incidence x-ray diffraction (GIXRD) depth profiling analysis showed that
cubic phase was only present under large incidence angle (large penetration depth
into the film) measurements, and that after a certain point, only monoclinic phase was
grown. The gradual transition from cubic to monoclinic phase along the film
thickness was later confirmed in Chapter 6 via transmission electron microscopy
(TEM) and selected area diffraction (SAD).
The primary results from Chapter 4 show that it is possible to significantly tailor the
structure (and thus properties and performance) of the Gd2O3 films by systematic
variation of processing parameters.
Chapter 5 – Bulleted Summary
Successful deposition of a pure cubic phase film was obtained at high deposition rates
for films less than 50 nm thick under a deposition temperature of 250 °C and 200
sccm O2 flow. However, this film was shown to be under significant compressive
stress of 1.7 GPa by XRD residual stress measurements.
Thick (1 μm) pure cubic phase films were deposited by lowering the deposition rate
to < 1 Å / s and increasing the deposition temperature to 650 °C. This was attributed
to both increased adatom mobility as well as reduction in compressive stress as
measured by the wafer curvature technique. Based on this information, a large
compressive stress was hypothesized to cause the formation of the monoclinic phase.
An experiment was designed to introduce compressive stress into the Gd2O3 films via
ion beam assisted deposition (IBAD). This allowed for systematic increase in

250
compressive stress while keeping a large adatom diffusion length on the film surface.
It was shown that the films could be completely transformed from the cubic to
monoclinic phase with applied compressive stress of -777 MPa for the deposition
conditions considered, confirming the existence of a stress-induced phase transition in
Gd2O3.
At high deposition rates, it was shown that films deposited on different substrates
(quartz, silicon, sapphire, and GaN) all had similar θ-2θ diffraction patterns,
suggesting that films grew similarly on different substrates due to the low adatom
mobility.
Significant differences in texture were observed for films deposited at low rates (< 1
Å / s) and high temperature (650 °C) on the different substrates. For evaluation of in-
plane texture in the Gd2O3 films, pole figure analysis was performed.
o Mixed phase films deposited at high rates and low temperature showed weak
out-of-plane texture and random in-plane texture.
o Mixed phase films deposited at high temperatures possess a fiber texture
(strong out-of-plane texture), but lack the necessary adatom mobility to
develop in-plane texture.
o For single phase cubic films grown under low rates of deposition, out-of-plane
texture was observed on quartz substrates. However, weak and strong in-
plane textures were observed for sapphire and GaN substrates, respectively.
o The use of ion bombardment resulted in the formation of moderate biaxial
texture for films grown on quartz. For films grown on sapphire, a very strong

251
biaxial texture was achieved with ion bombardment, and was attributed to the
additional energy added to the system from the bombarding ions.
Chapter 6 – Bulleted Summary
The effects of processing on the structure, composition, and interfacial chemistry of
the Gd2O3 films was investigated via SEM, TEM, AFM, EDS, and XPS. The results
showed that films primarily adhered to the structure zone models with a few
exceptions. The deviation from the Structure-Zone model15
was explained by the
combined effects of columnar growth, shadowing, and adatom mobility.
o At low deposition temperatures, decreasing oxygen flow resulted in increased
film density due to higher adatom mobility. Films deposited at this
temperature were characterized by small (10 – 15 nm) nanocrystalline grains
with some porous disordered regions.
o As the deposition temperature was raised to 650 °C, a dense nucleation region
was observed and the films were highly crystalline with larger grain size.
After the approximately 200 nm dense nucleation region, columnar growth
was observed as the film grew thicker. Porosity formed between the growing
columns due to shadowing effects and growth of the monoclinic (020)
orientation.
The effects of processing on the interfacial layer size of Gd2O3 films deposited on
silicon were investigated. The size and structure of the interfacial layer was
dependent upon the deposition conditions. Generally, higher oxygen flow and higher
deposition temperature led to larger interfacial layer size and a more undulating

252
interface. The interfacial reaction was determined to proceed as a result of
intermixing of the SiOx layer with the Gd2O3 layer to form the Gd-Si-O interface
during deposition.
Films deposited on GaN possessed excellent interfacial characteristics with near
heteroepitaxial growth and no apparent interfacial layer.
Ion beam assisted deposition was shown to result in significant densification of the
film structure and elimination of the columnar morphology.
The O : Gd ratio of the Gd2O3 films was investigated using EDS and XPS, and
showed that the processing conditions had significant effects on the film composition.
o Increasing temperature was found to decrease the O : Gd ratio.
o Increasing oxygen flow was found to increase the O : Gd ratio for films
deposited at high temperatures, but had little effect for films deposited at low
temperature.
Chapter 7 – Bulleted Summary
Moisture absorption in Gd2O3 films was found to result in both increased dielectric
loss (10x) and inflated dielectric constant values (~40 %). Heat treatment of the films
at 100 °C resulted in outgassing of moisture, reduction in dielectric constant, and
excellent frequency dispersion of the dielectric constant over a range of 10 kHz – 1
MHz.
The effect of film processing on the dielectric constant was systematically
investigated. Tuning of the dielectric constant from a value of 11 to a value of 24 was

253
possible by manipulating the structure and crystallographic phase of the material via
the processing conditions.
Capacitance-voltage (C-V) and conductance-voltage (G-V) characteristics of GaN /
AlGaN / Gd2O3 / Ti / Au MOS capacitors were investigated. The effects of
processing on fixed oxide charge, trapped oxide charge, and density of interface states
were evaluated. Single phase cubic films deposited at low rates with near
heteroepitaxial growth were shown to have the lowest density of trapped charge.
Additionally, threshold instability in the C-V curve as well as a non-volatile charge
trapping effect was observed.
Conduction mechanisms in Gd2O3 films were studied through current-voltage-
temperature (I-V-T) measurements. A number of mechanisms were found to govern
conduction in Gd2O3 films across a wide measurement temperature and electric field
range including ohmic conduction, Schottky Emission, Poole-Frenkel emission, and
space charge limited conduction. For Poole-Frenkel emission, the trap heights of
1.03 eV and 1.25 eV were found for the cases of gate and substrate injection,
respectively. Schottky barrier height at the Si (111) / Gd2O3 interface and Gd2O3 / Ti
/ Au interface was found to be 0.56 eV and 0.54 eV, significantly lower than the
expected barrier height value.
For GaN / AlGaN / Gd2O3 / Ti / Au capacitors, the Schottky barrier height at the GaN
/ AlGaN / Gd2O3 interface was found to be 0.79 eV and the Poole Frenkel trap height
was 0.46 eV.
The performance of GaN / AlGaN / Gd2O3 / Ti / Au high electron mobility transistors
(MOS-HEMTs) was investigated with emphasis on necessary device performance for

254
radiation detection. Gd2O3 films deposited at 650 °C led to devices with good
switching characteristics including an on/off ratio of ~109
and subthreshold swing as
low as 88 mV. However, significant hysteresis and threshold voltage instability was
observed for the Gd2O3 MOS-HEMTs.
GaN / AlGaN / Gd2O3 / MOS-HEMTs devices showed sensitivity to both gamma and
neutron radiation. For devices with 1 μm thick Gd2O3 films, the neutron response
was not improved over the SiO2-based control device. Devices with 10 μm thick
Gd2O3 films showed significantly increased neutron detection. However, the neutron
response was larger than the expected theory, suggesting that added signal due to
gamma radiation may have been collected.
8.2. Future Work
The work completed in this dissertation provides the basis for a number of novel
and important research directions in both fundamental and applied science. These
possible research directions will be discussed in detail in this chapter. From a structural
material’s perspective, these topics include stabilization of thick cubic phase films with
high deposition rates, stabilization of amorphous phase films, extended study of direct
evaporation of Gd2O3 films, and further investigation into the mechanism of the stress
induced phase transition. From an electrical properties perspective, detailed investigation
of conduction mechanisms governing charge transport would be beneficial. Further study
regarding the types of defects present in the Gd2O3 films is also of interest. This
information can be used to improve performance of Gd2O3 microelectronic devices.

255
Finally, more work is needed to understand the neutron and gamma ray response of the
Gd2O3 microelectronic devices.
8.2.1. Direct evaporation
The films discussed in this dissertation were deposited via reactive electron beam-
physical vapor deposition (EB-PVD). This was due to the better uniformity and control
obtained from the reactive evaporation process using a gadolinium metal source. During
direct evaporation, dendritic growth was observed from the Gd2O3 source material in the
crucible resulting in an uneven vapor plume and significant difficulty in maintaining a
constant evaporation rate. Use of a rod-fed system (in which the source material is
introduced into the chamber in rod form) could mitigate the deleterious effects of
dendritic growth. A detailed investigation of the process-structure-property relationships
for films deposited via direction evaporation similar to the study performed in this work
would be of great interest. Additionally, it has been suggested that films deposited from
an oxide source can prevent formation of interfacial SiOx layer for Gd2O3 films deposited
on silicon.131
8.2.2. Stabilization of micron thick single cubic phase films deposited at high rates
It was shown in Chapters 4 and 5 that all films deposited at high rates (> 5 Å / s)
with thickness greater than 50 nm resulted in mixed phase films. The cubic phase was
only stabilized for thick films (1 μm) when the deposition temperature was increased to
650 °C and the deposition rate was lowered to less than 1 Å / s resulting in a deposition
time of ~ 6 hours. This is problematic for applications where single phase cubic films

256
with even larger thicknesses are needed. For instance, in Chapter 7, we showed that 10
μm thick Gd2O3 films showed better response to neutron detection than 1 μm thick films
due to the large mean free path of neutrons in the material. The long deposition time
required to grow a 10 μm thick film at such a low rate is not feasible or cost efficient.
Therefore, other methods of stabilizing the cubic phase, yet maintaining a high deposition
rate would be attractive. One possible pathway to achieve this goal would be to raise the
deposition temperature. In chapter 4, we showed that increasing the deposition
temperature from 250 to 650 °C increased the cubic phase volume due to the higher
adatom mobility and increased tensile stress. However, 650 °C was the substrate
temperature upper limit of the vacuum chamber used in this work. It would be of interest
to raise the deposition temperature to a higher temperature to see if single phase cubic
films could be deposited at higher rates. The added tensile stress due to the CTE
mismatch between the materials as well as the higher mobility of adatoms has potential to
stabilize the cubic phase.
Another possible method for stabilizing the cubic phase at high deposition would
be through the incorporation of tensile stress within the Gd2O3 films. This can be done
through doping the films with other lanthanide oxide elements. Many of the lanthanide
oxide elements are isomorphic miscible within one another. Based on the size of the
substituted species, it would be possible to tune the lattice spacing and resulting stress
state of the films.

257
8.2.3. Stabilization of amorphous Gd2O3 films
It would be of great interest to deposit thick amorphous Gd2O3 films since they
possess no grain boundaries, which could result in better electrical properties and less
leakage current. Since it was shown in this work that the crystallinity of Gd2O3 films
deposited by reactive EB-PVD increased with increasing deposition temperature,
synthesis of amorphous films would require low deposition temperatures. Gd2O3 films
crystallize (although poorly) quite easily via reactive EB-PVD even at ambient
temperature, and are not structurally stable. We showed in chapter 3 that films deposited
at ambient temperature were prone to cracking once a critical thickness was reached
(typically ~4 μm). Films thinner than 4 μm could be deposited at ambient without
cracking, but the films cracked upon heat treatment even at low temperatures of 100 °C.
Preventing this failure would be a critical step towards the synthesis of amorphous Gd2O3
films which would likely require even lower substrate temperatures (through liquid
nitrogen cooling).
8.2.4. Further investigation of stress induced phase transition in Gd2O3 films
We have shown the existence of a stress induced cubic to monoclinic phase
transition by bombarding the Gd2O3 films with low energy oxygen ions (500 eV) during
film deposition. It would be interesting to determine if it is possible to induce this
transition by ion bombardment after film deposition. This could potentially allow for
direct manipulation of film phase volume based on ion fluence. Indeed, a very recent
study, has shown that bulk Gd2O3 cubic pellets can be transformed to the monoclinic
phase with swift heavy ion irradiation (2.25 GeV Au ions).36
If the phase change is

258
possible with low energy ions such as the one used in our study, this would yield further
information on the mechanism of the phase change. Further experimental investigation
into the mechanism for the stress induced phase transition presented in chapter 5 is also
desirable. For instance, in situ TEM during ion irradiation would assist in determining
what is physically happening to the structure of the material under irradiation.
Additionally, in-situ wafer curvature measurements during film deposition would yield
significant information about the role of stress in phase formation. A theoretical
approach towards calculating the necessary stress needed to drive the phase transition
would be of interest as well. However, this requires knowledge of the elastic constants of
both cubic and monoclinic Gd2O3 which have not been reported in the literature.
8.2.5. Development of dry etch for Gd2O3 device processing
For device fabrication of the Gd2O3 metal-oxide-semiconductor (MOS) capacitors
and transistors, an etch step was necessary as discussed in chapter 3. Unfortunately,
Gd2O3 dry etching (via reactive ion etching) is a prohibitively slow process132
with an
etch rate of less than 1 nm / s. Therefore, wet etching based on sulfuric acid solution was
employed. However, wet etching was shown to result in uneven etch rate and
undercutting of the protecting photoresist, which may result in degradation of film
structure and properties. Therefore, development of a dry etch with increased rate would
be beneficial towards device processing.

259
8.2.6. Electrical properties and device performance
This work opens up many possibilities for further study into the electrical
properties of thick Gd2O3 films. The current-voltage-temperature (I-V-T) measurements
performed on the Si / Gd2O3 / Ti / Au capacitors showed that numerous conduction
mechanisms govern charge transport over a wide electric field and measurement
temperature range. However, the costs and time associated with performing I-V-T
measurements on all the deposited samples was prohibitive. Nonetheless, it would be of
significant interest to further explore the effects of film processing and structure on the
conduction mechanisms in the Gd2O3 films. Deposition of thinner films (< 500 nm)
would allow for investigation of the thickness dependency of the space charge limited
conduction mechanism in the Gd2O3 films. These measurements coupled with a TEM
study of the size and structure of the interfacial layer, would enable extraction of the
interfacial layer contribution to charge transport. Additionally, we have shown through
both C-V and I-V-T measurements that electronic defects are present within the Gd2O3
films. These defects have adverse effects on device properties such as threshold voltage
shift, threshold instability, and non-volatile charge trapping effects. Possible techniques
to study these traps in more detail are thermally stimulated current (TSC) spectroscopy
and deep level transient spectroscopy (DLTS).
8.2.7. Radiation detection
We have shown that Gd2O3 is sensitive to both gamma and neutron radiation.
However, more investigation is needed to determine the efficiency limits of the Gd2O3
detectors and the effects of film thickness on radiation detection. Optimizing the film

260
and device properties could lead to enhanced charge collection and response.
Additionally, developing ways of attenuating the gamma response is necessary to meet
detector requirements and avoid generation of false positives.

261
References
1. Knoll, G. F. Radiation Detection and Measurement. 1–802 (John Wiley, 2010).
2. Caruso, A. N. The physics of solid-state neutron detector materials and geometries.
J. Phys. Condens. Matter 22, 443201 (2010).
3. Zinkle, S. J. & Hodgson, E. R. Radiation-induced changes in the physical
properties of ceramic materials. J. Nucl. Mater. 191-194, 58–66 (1992).
4. Ambacher, O., Smart, J., Shealy, J. R., Weimann, N. G., Chu, K., Murphy, M.,
Schaff, W. J., Eastman, L. F., Dimitrov, R., Wittmer, L., Stutzmann, M., Rieger,
W. & Hilsenbeck, J. Two-dimensional electron gases induced by spontaneous and
piezoelectric polarization charges in N- and Ga-face AlGaN/GaN heterostructures.
J. Appl. Phys. 85, 3222 (1999).
5. Personal communication from E. Cazalas.
6. Kwo, J., Hong, M., Kortan, A. R., Queeney, K. L., Chabal, Y. J., Opila, R. L.,
Muller, D. A., Chu, S. N. G., Sapjeta, B. J., Lay, T. S., Mannaerts, J. P., Boone, T.,
Krautter, H. W., Krajewski, J. J., Sergnt, A. M. & Rosamilia, J. M. Properties of
high κ gate dielectrics Gd2O3 and Y2O3 for Si. J. Appl. Phys. 89, 3920 (2001).
7. Kwo, J., Hong, M., Kortan, A. R., Queeney, K. T., Chabal, Y. J., Mannaerts, J. P.,
Boone, T., Krajewski, J. J., Sergent, A. M. & Rosamilia, J. M. High ε gate
dielectrics Gd2O3 and Y2O3 for silicon. Appl. Phys. Lett. 77, 130 (2000).
8. Yue, S., Wei, F., Wang, Y., Yang, Z., Tu, H. & Du, J. Phase control of magnetron
sputtering deposited Gd2O3 thin films as high-κ gate dielectrics. J. Rare Earths
26, 371–374
9. Wolfe, D. E., Singh, J., Miller, R. A., Eldridge, J. I. & Zhu, D.-M. Tailored
microstructure of EB-PVD 8YSZ thermal barrier coatings with low thermal
conductivity and high thermal reflectivity for turbine applications. Surf. Coatings
Technol. 190, 132–149 (2005).
10. Senthilkumar, M., Sahoo, N. K., Thakur, S. & Tokas, R. B. Reactive electron
beam evaporated gadolinia films at ambient substrate temperature: optical
properties and morphology studies. Appl. Surf. Sci. 245, 114–127 (2005).
11. Sahoo, N. K., Senthilkumar, M., Thakur, S. & Bhattacharyya, D. Correlation of
optical and microstructural properties of Gd2O3 thin films through phase-
modulated ellipsometry and multi-mode atomic force microscopy. Appl. Surf. Sci.
200, 219–230 (2002).

262
12. Bhattacharyya, D., Biswas, A. & Sahoo, N. K. Investigation on dispersion of
optical constants of Gd2O3 films by phase modulated spectroscopic ellipsometry.
Appl. Surf. Sci. 233, 155–162 (2004).
13. Raut, H. K., Ganesh, V. A., Nair, A. S. & Ramakrishna, S. Anti-reflective
coatings: A critical, in-depth review. Energy Environ. Sci. 4, 3779 (2011).
14. Yi, S., Bae, J. S., Shim, K. S., Jeong, J. H., Park, J.-C. & Holloway, P. H.
Enhanced luminescence of Gd2O3:Eu3+ thin-film phosphors by Li doping. Appl.
Phys. Lett. 84, 353 (2004).
15. Messier, R. Revised structure zone model for thin film physical structure. J. Vac.
Sci. Technol. A Vacuum, Surfaces, Film. 2, 500 (1984).
16. Batchelor, R., Aves, R. & Skyrme, T. H. R. Helium-3 Filled Proportional Counter
for Neutron Spectroscopy. Rev. Sci. Instrum. 26, 1037 (1955).
17. Uher, J., Pospisil, S., Linhart, V. & Schieber, M. Efficiency of composite boron
nitride neutron detectors in comparison with helium-3 detectors. Appl. Phys. Lett.
90, 124101 (2007).
18. ENDFPLOT-2 at http://atom.kaeri.re.kr/index.html.
19. Munter, A. http://www.ncnr.nist.gov/resources/n-lengths/. National Institute of
Standards and Technology (NIST), Center for Neutron Research (2009).
20. McGregor, D. S., Hammig, M. D., Yang, Y.-H., Gersch, H. K. & Klann, R. T.
Design considerations for thin film coated semiconductor thermal neutron
detectors—I: basics regarding alpha particle emitting neutron reactive films. Nucl.
Instruments Methods Phys. Res. Sect. A Accel. Spectrometers, Detect. Assoc.
Equip. 500, 272–308 (2003).
21. Birks, J. B. The Theory and Practice of Scintillation Counting. 662 (Pergamon
Press, 1964).
22. McGregor, D. S., Klann, R. T., Sanders, J. D., Lindsay, J. T., Linden, K. J.,
Gersch, H. K., De Lurgio, P. M., Fink, C. L. & Ariesanti, E. Recent results from
thin-film-coated semiconductor neutron detectors. in International Symposium on
Optical Science and Technology (eds. James, R. B., Franks, L. A., Burger, A.,
Westbrook, E. M. & Durst, R. D.) 164–182 (International Society for Optics and
Photonics, 2003). doi:10.1117/12.455697
23. Peurrung, A. . Recent developments in neutron detection. Nucl. Instruments
Methods Phys. Res. Sect. A Accel. Spectrometers, Detect. Assoc. Equip. 443, 400–
415 (2000).

263
24. Berdermann, E., Ciobanu, M., Connell, S. H., da Costa, A. M. O. D., Fernandez-
Hernando, L., Oh, A. & Sellschop†, J. P. F. Charged particle detectors made of
single-crystal diamond. Phys. status solidi 201, 2521–2528 (2004).
25. Nava, F., Castaldini, A., Cavallini, A., Errani, P. & Cindro, V. Radiation Detection
Properties of 4H-SiC Schottky Diodes Irradiated Up to 10^16 n/cm^2 by 1 MeV
Neutrons. IEEE Trans. Nucl. Sci. 53, 2977–2982 (2006).
26. Personal communication from Cree Inc. Raleigh, NC. (2009).
27. Hodgson, E. R. Radiation-enhanced electrical breakdown in fusion insulators. J.
Nucl. Mater. 179-181, 383–386 (1991).
28. Ishii, M., Kuwano, Y., Asai, T., Asaba, S., Kawamura, M., Senguttuvan, N.,
Hayashi, T., Kobayashi, M., Nikl, M., Hosoya, S., Sakai, K., Adachi, T., Oku, T.
& Shimizu, H. M. Boron based oxide scintillation glass for neutron detection.
Nucl. Instruments Methods Phys. Res. Sect. A Accel. Spectrometers, Detect. Assoc.
Equip. 537, 282–285 (2005).
29. Chernov, V. M., Belyakov, V. A., Bryuzgin, A. M., Cherednichenko, Y. G.,
Ievleva, J. I., Khorasanov, G. L., Plaksin, O. A., Stepanov, V. A., Vizgalov, A. V.,
Zherebtsov, V. A. & Zrodnikov, A. V. Investigations on radiation-induced
processes in dielectric materials. J. Nucl. Mater. 233-237, 1304–1309 (1996).
30. Fowler, J. F. Radiation-induced Conductivity in the Solid State, and Some
Applications. Phys. Med. Biol. 3, 395–410 (1959).
31. Castor, B. & Hedrick, J. B. in Industrial Minerals and Rocks 769–792 (2006).
32. Atwood, D. A. The Rare Earth Elements : Fundamentals and Applications. 1–624
(Wiley, 2013).
33. Nowick, A. S. Rare Earth Permanent Magnets. 214 (Elsevier Science, 2012).
34. Eyring, L. Synthesis of Lanthanide and Actinide Compounds. 187 (Springer
Science & Business Media, 1991).
35. Adachi, G. & Imanaka, N. The Binary Rare Earth Oxides. Chem. Rev. 98, 1479–
1514 (1998).
36. Lang, M., Zhang, F., Zhang, J., Tracy, C. L., Cusick, A. B., VonEhr, J., Chen, Z.,
Trautmann, C. & Ewing, R. C. Swift heavy ion-induced phase transformation in
Gd2O3. Nucl. Instruments Methods Phys. Res. Sect. B Beam Interact. with Mater.
Atoms 326, 121–125 (2014).

264
37. Bai, L., Liu, J., Li, X., Jiang, S., Xiao, W., Li, Y., Tang, L., Zhang, Y. & Zhang, D.
Pressure-induced phase transformations in cubic Gd2O3. J. Appl. Phys. 106,
073507 (2009).
38. Atou, T., Kusaba, K., Fukuoka, K., Kikuchi, M. & Syono, Y. Shock-induced phase
transition of M2O3 (M = Sc, Y, Sm, Gd, and In)-type compounds. J. Solid State
Chem. 89, 378–384 (1990).
39. Zhang, F., Lang, M., Wang, J., Becker, U. & Ewing, R. Structural phase transitions
of cubic Gd2O3 at high pressures. Phys. Rev. B 78, 064114 (2008).
40. Mattox, D. M. Handbook of Physical Vapor Deposition (PVD) Processing. 792
(William Andrew, 2010).
41. Lüth, H. Solid Surfaces, Interfaces and Thin Films. 1–580 (Springer Berlin
Heidelberg, 2010).
42. Movachan, B. A. & Demchishin, A. V. Study of the Structure and Properties of
Thick Vacuum Condensates of Nickel, Titanium, Tungsten, Aluminum Oxide and
Zirconium Dioxide Fiz. Met. Met. 28, 83–90 (1969).
43. Thornton, J. A. High Rate Thick Film Growth. Annu. Rev. Mater. Sci. 7, 239–260
(1977).
44. Ohring, M. Materials Science of Thin Films : Deposition and Structure. 1–794
(Elsevier, 2002).
45. Grave, D. A., Hughes, Z. R., Robinson, J. a., Medill, T. P., Hollander, M. J.,
Stump, A. L., Labella, M., Weng, X. & Wolfe, D. E. Process–structure–property
relations of micron thick Gd2O3 films deposited by reactive electron-beam
physical vapor deposition (EB-PVD). Surf. Coatings Technol. 206, 3094–3103
(2012).
46. Cao, L., Sozontov, E. & Zegenhagen, J. Cubic to Tetragonal Phase Transition of
SrTiO3 under Epitaxial Stress: An X-Ray Backscattering Study. Phys. status solidi
181, 387–404 (2000).
47. Shaw, T. M., Suo, Z., Huang, M., Liniger, E., Laibowitz, R. B. & Baniecki, J. D.
The effect of stress on the dielectric properties of barium strontium titanate thin
films. Appl. Phys. Lett. 75, 2129 (1999).
48. Liu, K.-C., Tsai, J.-R., Li, C.-S., Chien, P.-H., Chen, J.-N. & Feng, W.-S.
Characteristics of Transparent ZnO-Based Thin-Film Transistors with High- k
Dielectric Gd 2 O 3 Gate Insulators Fabricated at Room Temperature. Jpn. J. Appl.
Phys. 49, 04DF21 (2010).

265
49. Singh, M. P., Thakur, C. S., Shalini, K., Banerjee, S., Bhat, N. & Shivashankar, S.
A. Structural, optical, and electrical characterization of gadolinium oxide films
deposited by low-pressure metalorganic chemical vapor deposition. J. Appl. Phys.
96, 5631 (2004).
50. Niinistö, J., Petrova, N., Putkonen, M., Niinistö, L., Arstila, K. & Sajavaara, T.
Gadolinium oxide thin films by atomic layer deposition. J. Cryst. Growth 285,
191–200 (2005).
51. Li, Y., Chen, N., Zhou, J., Song, S., liu, L., Yin, Z. & Cai, C. Effect of the oxygen
concentration on the properties of Gd2O3 thin films. J. Cryst. Growth 265, 548–
552 (2004).
52. Laha, A., Osten, H. J. & Fissel, A. Influence of interface layer composition on the
electrical properties of epitaxial Gd2O3 thin films for high-K application. Appl.
Phys. Lett. 90, 113508 (2007).
53. Laha, A., Osten, H. J. & Fissel, A. Impact of Si substrate orientations on electrical
properties of crystalline Gd2O3 thin films for high-K application. Appl. Phys. Lett.
89, 143514 (2006).
54. Hong, M. Epitaxial Cubic Gadolinium Oxide as a Dielectric for Gallium Arsenide
Passivation. Science (80-. ). 283, 1897–1900 (1999).
55. Johnson, J. W., Luo, B., Ren, F., Gila, B. P., Krishnamoorthy, W., Abernathy, C.
R., Pearton, S. J., Chyi, J. I., Nee, T. E., Lee, C. M. & Chuo, C. C. Gd2O3/GaN
metal-oxide-semiconductor field-effect transistor. Appl. Phys. Lett. 77, 3230
(2000).
56. Chang, W. H., Lee, C. H., Chang, P., Chang, Y. C., Lee, Y. J., Kwo, J., Tsai, C. C.,
Hong, J. M., Hsu, C.-H. & Hong, M. High κ dielectric single-crystal monoclinic
Gd2O3 on GaN with excellent thermal, structural, and electrical properties. J.
Cryst. Growth 311, 2183–2186 (2009).
57. Chang, W. H., Lee, C. H., Chang, Y. C., Chang, P., Huang, M. L., Lee, Y. J., Hsu,
C.-H., Hong, J. M., Tsai, C. C., Kwo, J. R. & Hong, M. Nanometer-Thick Single-
Crystal Hexagonal Gd 2 O 3 on GaN for Advanced Complementary Metal-Oxide-
Semiconductor Technology. Adv. Mater. 21, 4970–4974 (2009).
58. Le Luyer, C., Garcia-Murillo, A., Bernstein, E. & Mugnier, J. Waveguide Raman
spectroscopy of sol-gel Gd2O3 thin films. J. Raman Spectrosc. 34, 234–239
(2003).
59. Wu, X., Landheer, D., Sproule, G. I., Quance, T., Graham, M. J. & Botton, G. A.
Characterization of gadolinium and lanthanum oxide films on Si (100). J. Vac. Sci.
Technol. A Vacuum, Surfaces, Film. 20, 1141 (2002).

266
60. Gupta, J. A., Landheer, D., Sproule, G. I., McCaffrey, J. P., Graham, M. J., Yang,
K.-C., Lu, Z.-H. & Lennard, W. N. Interfacial layer formation in Gd2O3 films
deposited directly on Si(0 0 1). Appl. Surf. Sci. 173, 318–326 (2001).
61. Molle, A., Wiemer, C., Bhuiyan, M. N. K., Tallarida, G., Fanciulli, M. & Pavia, G.
Cubic-to-monoclinic phase transition during the epitaxial growth of crystalline
Gd2O3 films on Ge(001) substrates. Appl. Phys. Lett. 90, 193511 (2007).
62. Chang, W. H., Wu, S.-Y., Lee, C.-H., Lai, T.-Y., Lee, Y.-J., Chang, P., Hsu, C.-H.,
Huang, T.-S., Kwo, J. R. & Hong, M. Phase transformation of molecular beam
epitaxy-grown nanometer-thick Gd2O3 and Y2O3 on GaN. ACS Appl. Mater.
Interfaces 5, 1436–41 (2013).
63. Chiang, T.-H., Wu, S.-Y., Huang, T.-S., Hsu, C.-H., Kwo, J. & Hong, M. Single
crystal Gd2O3 epitaxially on GaAs(111)A. CrystEngComm 16, 8457 (2014).
64. Schwendt, D., Osten, H. J., Shekhter, P. & Eizenberg, M. Strain-induced effects on
the dielectric constant for thin, crystalline rare earth oxides on silicon. Appl. Phys.
Lett. 100, 232905 (2012).
65. Singh, M. P., Thakur, C. S., Shalini, K., Banerjee, S., Bhat, N. & Shivashankar, S.
A. Structural, optical, and electrical characterization of gadolinium oxide films
deposited by low-pressure metalorganic chemical vapor deposition. J. Appl. Phys.
96, 5631 (2004).
66. Bentarzi, H. Transport in Metal-Oxide-Semiconductor Structures. 1–106 (Springer
Berlin Heidelberg, 2011).
67. Pollak, M. A percolation treatment of dc hopping conduction. J. Non. Cryst. Solids
11, 1–24 (1972).
68. Rose, A. Space-Charge-Limited Currents in Solids. Phys. Rev. 97, 1538–1544
(1955).
69. Simmons, J. Poole-Frenkel Effect and Schottky Effect in Metal-Insulator-Metal
Systems. Phys. Rev. 155, 657–660 (1967).
70. Schottky, W. Uber kalte und warme Elektronenentladungen. Zeitschrift fur Phys.
14, 63–106 (1923).
71. Fowler, R. H. & Nordheim, L. Electron Emission in Intense Electric Fields. Proc.
R. Soc. London. Ser. A, Contain. Pap. a Math. Phys. Character 119, pp. 173–181
(1928).
72. Patterson, A. The Scherrer Formula for X-Ray Particle Size Determination. Phys.
Rev. 56, 978–982 (1939).

267
73. Plawsky, J. L., Achanta, R., Cho, W., Rodriguez, R., Saxena, R. & Gill, W. N. in
Dielectric Films for Advanced Microelectronics (eds. Baklanov, M. R., Green, M.
L. & Maex, K.) 152 (John Wiley & Sons, Ltd, 2007).
74. Stoney, G. The Tension of Metallic Films deposited by Electrolysis. Proc. R. Soc.
Lond. A 82, 172 (1909).
75. (n.a). International Center for Diffraction Data (ICDD), Card 00–42–1465, (1994).
76. (n.a). International Center for Diffraction Data (ICDD), Card 00–43–1014, (1994).
77. Ostwald, W. Z. Studien uber die Bildung und Umwandlung fester Korper. Phys.
Chem. 22, 289–330 (1897).
78. Gaboriaud, R. J., Pailloux, F., Guerin, P. & Paumier, F. Yttrium oxide thin films,
Y2O3 , grown by ion beam sputtering on Si. J. Phys. D. Appl. Phys. 33, 2884–
2889 (2000).
79. Kim, Y. I., Nahm, S. H. & Jung, M.-J. Structural refinement of SnO2 thin film
prepared by plasma-enhanced chemical vapor deposition. Mater. Lett. 57, 3653–
3659 (2003).
80. Johnson, Q. & Zhou, R. S. Checking and estimating RIR values. Adv. X-ray Anal.
42, 287–296 (2000).
81. Dollase, W. A. Correction of intensities for preferred orientation in powder
diffractometry: application of the March model. J. Appl. Crystallogr. 19, 267–272
(1986).
82. Ahtee, M., Nurmela, M., Suortti, P. & Järvinen, M. Correction for preferred
orientation in Rietveld refinement. J. Appl. Crystallogr. 22, 261–268 (1989).
83. Chrysochoou, M. & Dermatas, D. Application of the Rietveld method to assess
chromium(VI) speciation in chromite ore processing residue. J. Hazard. Mater.
141, 370–7 (2007).
84. White, W. B. & Keramidas, V. G. Vibrational spectra of oxides with the C-type
rare earth oxide structure. Spectrochim. Acta Part A Mol. Spectrosc. 28, 501–509
(1972).
85. Zarembowitch, J., Gouteron, J. & Lejus†, A. M. Raman spectrum of single crystals
of monoclinic B-type gadolinium sesquioxide. J. Raman Spectrosc. 9, 263–265
(1980).
86. Whitney, E. D. Kinetics and mechanism of the transition of metastable tetragonal
to monoclinic zirconia. Trans. Faraday Soc. 61, 1991 (1965).

268
87. Gaboriaud, R. J., Lacroix, B. & Paumier, F. Ion irradiation-induced phase
transformations in bixbyite-fluorite related oxides: The role of dislocation loop
nucleation. Nucl. Instruments Methods Phys. Res. Sect. B Beam Interact. with
Mater. Atoms 277, 18–20 (2012).
88. Noyan, I. C. & Cohen, J. B. Residual stress: measurement by diffraction and
interpretation. 276 (Springer, 1987).
89. http://www.ceramics.nist.gov/srd/summary/Gd2O3.htm.
90. Thornton, J. A. Internal stresses in titanium, nickel, molybdenum, and tantalum
films deposited by cylindrical magnetron sputtering. J. Vac. Sci. Technol. 14, 164
(1977).
91. Freund, L. B. & Suresh, S. Thin Film Materials: Stress, Defect Formation and
Surface Evolution. 1–750 (Cambridge University Press, 2004).
92. Chason, E., Sheldon, B., Freund, L., Floro, J. & Hearne, S. Origin of Compressive
Residual Stress in Polycrystalline Thin Films. Phys. Rev. Lett. 88, 156103 (2002).
93. Sawbridge, P. T. & Waterman, N. A. On the thermal expansion and
crystallography of cubic (C) and monoclinic (B) forms of Gd2O3 in the
temperature range 20 to 900 C. J. Mater. Sci. 3, 15–18 (1968).
94. Okada, Y. & Tokumaru, Y. Precise determination of lattice parameter and thermal
expansion coefficient of silicon between 300 and 1500 K. J. Appl. Phys. 56, 314
(1984).
95. Grave, D. A., Schmitt, M. P., Robinson, J. A. & Wolfe, D. E. Stress induced phase
transition in Gd2O3 films by ion beam assisted reactive electron beam-physical
vapor deposition (EB-PVD). Surf. Coatings Technol. 242, 68–73 (2014).
96. Chhowalla, M. & Unalan, H. E. Thin films of hard cubic Zr3N4 stabilized by
stress. Nat. Mater. 4, 317–22 (2005).
97. Piascik, J. R., Zhang, Q., Bower, C. A., Thompson, J. Y. & Stoner, B. R. Evidence
of stress-induced tetragonal-to-monoclinic phase transformation during sputter
deposition of yttria-stabilized zirconia. J. Mater. Res. 22, 1105–1111 (2011).
98. Hémon, S., Chailley, V., Dooryhée, E., Dufour, C., Gourbilleau, F., Levesque, F.
& Paumier, E. Phase transformation of polycrystalline Y2O3 under irradiation
with swift heavy ions. Nucl. Instruments Methods Phys. Res. Sect. B Beam
Interact. with Mater. Atoms 122, 563–565 (1997).

269
99. Gaboriaud, R. J., Paumier, F., Jublot, M. & Lacroix, B. Ion irradiation-induced
phase transformation mechanisms in Y2O3 thin films. Nucl. Instruments Methods
Phys. Res. Sect. B Beam Interact. with Mater. Atoms 311, 86–92 (2013).
100. Tang, M., Lu, P., Valdez, J. A. & Sickafus, K. E. Ion-irradiation-induced phase
transformation in rare earth sesquioxides (Dy2O3,Er2O3,Lu2O3). J. Appl. Phys.
99, 063514 (2006).
101. Lang, M., Zhang, F., Zhang, J., Tracy, C. L., Cusick, A. B., VonEhr, J., Chen, Z.,
Trautmann, C. & Ewing, R. C. Swift heavy ion-induced phase transformation in
Gd2O3. Nucl. Instruments Methods Phys. Res. Sect. B Beam Interact. with Mater.
Atoms 326, 121–125 (2014).
102. Antic, B., Kremenovic, A., Draganic, I., Colomban, P., Vasiljevic-Radovic, D.,
Blanusa, J., Tadic, M. & Mitric, M. Effects of O2+ ions beam irradiation on crystal
structure of rare earth sesquioxides. Appl. Surf. Sci. 255, 7601–7604 (2009).
103. Herrero, A. M., Gila, B. P., Abernathy, C. R., Pearton, S. J., Craciun, V., Siebein,
K. & Ren, F. Epitaxial growth of Sc2O3 films on GaN. Appl. Phys. Lett. 89,
092117 (2006).
104. Jur, J. S., Wheeler, V. D., Lichtenwalner, D. J., Maria, J.-P. & Johnson, M. A. L.
Epitaxial growth of lanthanide oxides La2O3 and Sc2O3 on GaN. Appl. Phys. Lett.
98, 042902 (2011).
105. Weng, X., Grave, D. A., Hughes, Z. R., Wolfe, D. E. & Robinson, J. A.
Microstructure, phase transition, and interfacial chemistry of Gd2O3/Si(111)
grown by electron-beam physical vapor deposition. J. Vac. Sci. Technol. A
Vacuum, Surfaces, Film. 30, 041512 (2012).
106. Botton, G. A., Gupta, J. A., Landheer, D., McCaffrey, J. P., Sproule, G. I. &
Graham, M. J. Electron energy loss spectroscopy of interfacial layer formation in
Gd2O3 films deposited directly on Si(001). J. Appl. Phys. 91, 2921 (2002).
107. Landheer, D., Gupta, J. A., Sproule, G. I., McCaffrey, J. P., Graham, M. J., Yang,
K.-C., Lu, Z.-H. & Lennard, W. N. Characterization of Gd2O3 Films Deposited on
Si(100) by Electron-Beam Evaporation. J. Electrochem. Soc. 148, G29 (2001).
108. Thornton, J. A. The microstructure of sputter-deposited coatings. J. Vac. Sci.
Technol. A Vacuum, Surfaces, Film. 4, 3059 (1986).
109. Merckling, C., Saint-Girons, G., Delhaye, G., Patriarche, G., Largeau, L., Favre-
Nicollin, V., El-Kazzi, M., Regreny, P., Vilquin, B., Marty, O., Botella, C.,
Gendry, M., Grenet, G., Robach, Y. & Hollinger, G. Epitaxial growth of high-κ
oxides on silicon. Thin Solid Films 517, 197–200 (2008).

270
110. Gottlob, H. D. B., Stefani, A., Schmidt, M., Lemme, M. C., Kurz, H., Mitrovic, I.
Z., Werner, M., Davey, W. M., Hall, S., Chalker, P. R., Cherkaoui, K., Hurley, P.
K., Piscator, J., Engstrom, O. & Newcomb, S. B. Gd silicate: A high-k dielectric
compatible with high temperature annealing. J. Vac. Sci. Technol. B
Microelectron. Nanom. Struct. 27, 249 (2009).
111. Hubbard, K. J. & Schlom, D. G. Thermodynamic stability of binary oxides in
contact with silicon. J. Mater. Res. 11, 2757–2776 (2011).
112. Ghosh, R., Basak, D. & Fujihara, S. Effect of substrate-induced strain on the
structural, electrical, and optical properties of polycrystalline ZnO thin films. J.
Appl. Phys. 96, 2689 (2004).
113. Gupta, J. A., Landheer, D., McCaffrey, J. P. & Sproule, G. I. Gadolinium silicate
gate dielectric films with sub-1.5 nm equivalent oxide thickness. Appl. Phys. Lett.
78, 1718 (2001).
114. Schwan, H. P. Complex permittivity of water at 25 °C. J. Chem. Phys. 64, 2257
(1976).
115. Jeon, S. & Hwang, H. Effect of hygroscopic nature on the electrical characteristics
of lanthanide oxides (Pr2O3, Sm2O3, Gd2O3, and Dy2O3). J. Appl. Phys. 93,
6393 (2003).
116. Tomida, K., Kita, K. & Toriumi, A. Dielectric constant enhancement due to Si
incorporation into HfO2. Appl. Phys. Lett. 89, 142902 (2006).
117. Goetzberger, A. & Irvin, J. C. Low-temperature hysteresis effects in metal-oxide-
silicon capacitors caused by surface-state trapping. IEEE Trans. Electron Devices
15, 1009–1014 (1968).
118. Grovenor, C. R. M. Microelectronic Materials. 544 (CRC Press, 1989).
119. Hill, W. A. & Coleman, C. C. A single-frequency approximation for interface-state
density determination. Solid. State. Electron. 23, 987–993 (1980).
120. Rozen, J., Dhar, S., Dixit, S. K., Afanas’ev, V. V., Roberts, F. O., Dang, H. L.,
Wang, S., Pantelides, S. T., Williams, J. R. & Feldman, L. C. Increase in oxide
hole trap density associated with nitrogen incorporation at the SiO2/SiC interface.
J. Appl. Phys. 103, 124513 (2008).
121. Chang, L. B., Das, A., Lin, R. M., Maikap, S., Jeng, M. J. & Chou, S. T. An
observation of charge trapping phenomena in GaN/AlGaN/Gd2O3/Ni–Au
structure. Appl. Phys. Lett. 98, 222106 (2011).

271
122. Chiu, F.-C. A Review on Conduction Mechanisms in Dielectric Films. Adv. Mater.
Sci. Eng. 2014, 1–18 (2014).
123. Li, P. & Lu, T.-M. Conduction mechanisms in BaTiO3 thin films. Phys. Rev. B 43,
14261–14264 (1991).
124. Gottlob, H. D. B., Echtermeyer, T. J., Schmidt, M., Mollenhauer, T., Wahlbrink,
T., Lemme, M. C. & Kurz, H. Leakage Current Mechanisms in Epitaxial Gd2O3
High-k Gate Dielectrics. Electrochem. Solid-State Lett. 11, G12 (2008).
125. Michaelson, H. B. The work function of the elements and its periodicity. J. Appl.
Phys. 48, 4729 (1977).
126. Lipp, E., Shahar, Z., Bittel, B. C., Lenahan, P. M., Schwendt, D., Osten, H. J. &
Eizenberg, M. Trap-assisted conduction in Pt-gated Gd2O3/Si capacitors. J. Appl.
Phys. 109, 073724 (2011).
127. Gupta, R. K., Ghosh, K. & Kahol, P. K. Junction characteristics of pulsed laser
deposition grown Gd2O3 on p-silicon. Phys. E Low-dimensional Syst.
Nanostructures 41, 1201–1203 (2009).
128. Lipp, E., Eizenberg, M., Czernohorsky, M. & Osten, H. J. Effect of oxide structure
on the Fermi-level pinning at metal/Gd2O3 interfaces. Appl. Phys. Lett. 93,
193513 (2008).
129. Joung, D., Chunder, A., Zhai, L. & Khondaker, S. I. Space charge limited
conduction with exponential trap distribution in reduced graphene oxide sheets.
Appl. Phys. Lett. 97, 093105 (2010).
130. Hsu, S. S. H. AlGaN/GaN HEMTs With Low Leakage Current and High On/Off
Current Ratio. IEEE Electron Device Lett. 31, 102–104 (2010).
131. Bierwagen, O., Proessdorf, A., Niehle, M., Grosse, F., Trampert, A. & Klingsporn,
M. Oxygen-Deficient Oxide Growth by Subliming the Oxide Source Material: The
Cause of Silicide Formation in Rare Earth Oxides on Silicon. Cryst. Growth Des.
13, 3645–3650 (2013).
132. Vitale, S. A., Wyatt, P. W. & Hodson, C. J. Plasma-enhanced atomic layer
deposition and etching of high-k gadolinium oxide. J. Vac. Sci. Technol. A
Vacuum, Surfaces, Film. 30, 01A130 (2012).

272
GaN / AlGaN device fabrication and mask layouts Appendix A.
Appendix A.1. Device fabrication procedure
1000 LOT START DATE
A Move-in 1000
B Inscribe wafer ID's
C Inspect for scratches, cracks, poor surface, edge chips, etc.
D Solvent clean: ACE 2 min, IPA 2 min, DI rinse
E Move-out 1000
1010 ISOLATION PHOTOLITHOGRAPHY DATE
A Move-in 1010
B Pre-bake: Dehydration at 95 ºC for 1 min
C Resist coat: 3012 @ 5000 rpm for 45 s
D PAB: 95°C for 60 s
E Expose first level (no alignment): Mask "ISO" Exposure time: 7.0 s
F Develop: CD-26 for 60s, DI rinse; N2 blow dry
G Mask clean: soak in ACE, IPA, DI or Remover PG, IPA, DI
H Microscope inspection _______________________________________
I Move-out 1010
1020 ISOLATION ETCH DATE
A Move-in 1020
B Sample mount: 150-mm Si carrier wafer, w/green Revalpha tape
C ICP/RIE: Recipe "AEOC_GN2": BCl3 /Ar, Flow: 6/11 sccm; Pres.: 2 mTorr;
D 60W; RF power: ____ W; Etch time: 104 s (Target 80 nm)
E Sample demount: Hotplate @127 ºC for 20 s
F Deskin M4L_225w_ 2min_8sccm Ar_100sccm O2_10mTorr
G Resist strip: 95°C Remover PG, Sonicate 5 sec to remove redep,
IPA 2 min, DI 2 min, N2 blow dry
H Microscope inspection _Profilometer__________________________
I Move-out 1020
2010 OHMIC CONTACT PHOTOLITHOGRAPHY DATE
A Move-in 2010
B Pre-bake: Dehydration at 95 ºC for 1 min
C Resist coat: LOR5A @6000 rpm for 45 s
D PAB: 180°C for 10 min
E Resist coat: 3012 @6000 rpm for 45 s
F PAB: 95°C for 60 s
G Align & expose: Mask "OHMIC" Exposure time: 6.5 -7.0 s (check last traveler)
H Develop: CD-26 for 60s, DI rinse; N2 blow dry
I Mask clean: soak in ACE, IPA, DI or Remover PG, IPA, DI
J Microscope inspection _______________________________________
K Move-out 2010
2020 OHMIC METAL EVAPORATION DATE
A Move-in 2020
B Descum: M4L @150 W, O2/He flow: 150/50 sccm, 600 mTorr, for 60 s
C Oxide etch: BOE: DI = 1:10 for 60 s, DI rinse, N2 blow dry
D LOAD IMMEDIATELY INTO EVAPORATOR
E Evaporate Ti/Al/Ni/Au: 150/1000/500/500Å Dep rates : ___ /___ /___ /____ Å/s
F Move-out 2020
2030 OHMIC METAL LIFTOFF DATE
A Move-in 2030
C Liftoff soak: Ace_15min_IPA_2min (to remove patterning resist)
D Liftoff: PRS-3000 at 90 ºC for 20 min_Sonicate in new IPA_2sec blasts
E DI rinse, N2 blow dry
F Move-out 2030

273
2040 OHMIC CONTACT ALLOY DATE
A Move-in 2040
B RTA: Dummy run with Recipe P875_60
The recipe in Big Bertha is pictured
C RTA: Contact alloy run run with Recipe P875_60
D Microscope inspection _______________________________________
E Move-out 2040
2050 OHMIC CONTACT TEST DATE
A Move-in 2050
B I-V test: Probe TLM test structures and characterize ohmic contacts
C Move-out 2050
3010 DIELECTRIC DEPOSITION DATE
A Move-in 3010
(TBD)
n Move-out 3010
4010 DIELECTRIC PATTERNING PHOTOLITHOGRAPHY DATE
A Move-in 4010
B Pre-bake: Dehydration at 95 ºC for 60 s
C SPR 955 tri-layer:
1) coat @ 3000rpm for 45s (D09_30_45) PAB: 105˚C_10min
2) coat @ 3000rpm for 45s (D09_30_45) PAB: 105˚C_5min
3) coat @ 3000rpm for 45s (D09_30_45) PAB: 105˚C_1min
Apply each layer quickly, new resist removes the previous layer if left to sit
D Align & Expose: Mask "DIELECTRIC" Exposure time: 7.0 s
E Develop: CD-26 for 60s, DI rinse; N2 blow dry
F Mask clean: soak in ACE, IPA, DI or Remover PG, IPA, DI
G Microscope inspection _______________________________________
H Move-out 4010
4020 DIELECTRIC ETCH DATE
A Move-in 4020
B TBD: depends on dielectric --->
C
D DI rinse & N2 blowdry
G Resist strip: Gd2O3:PRS3000 @ 80C for 10 min, IPA 2 min, DI 2 min, N2 dry
Resist strip: BN:EKC830 @ 60C for 10 min, IPA 2 min, DI 2 min, N2 blow dry
H Microscope inspection _______________________________________
I Move-out 4020
5010 GATE METAL PHOTOLITHOGRAPHY DATE
A Move-in 5010
B Pre-bake: Dehydration at 95 ºC for 1 min
C Resist coat: LOR5A @5000 rpm for 45 s
D PAB: 180°C for 10 min
E Resist coat: 3012 @5000 rpm for 45 s
F PAB: 95°C for 60 s
G Align & expose: Mask "_5um_" Exposure time: _7s
H Develop: CD-26 for 60s, DI rinse; N2 blow dry
I Microscope inspection _______________________________________
J Move-out 5010

274
5020 GATE METAL DEPOSITION DATE
A Move-in 5020
B Descum: M4L @150 W, O2/He flow: 150/50 sccm, 600 mTorr, for 60 s
C LOAD IMMEDIATELY INTO EVAPORATOR
D Evaporate Ti/Au: 200/2800 Å Dep rates : ______ /______ Å/s
E Move-out 4020
5030 GATE METAL LIFTOFF DATE
A Move-in 5030
B Liftoff soak: PRS-3000 at 80 ºC for 10 min,
C Liftoff: IPA for 1 min + 5 sec sonicate, DI rinse, N2 blow dry
D Microscope inspection _______________________________________
E Move-out 5030

275
Appendix A.2. Mask layouts
Figure A.1. Overall mask layout for GaN / AlGaN rad sensor device fabrication.
Figure A.2. Isolation layer mask layout for GaN / AlGaN rad sensor device fabrication.

276
Figure A.3. Ohmic level mask layout for GaN / AlGaN rad sensor device fabrication.
Figure A.4. Dielectric etch level mask layout for GaN / AlGaN rad sensor device
fabrication.

277
Figure A.5. Schottky level mask layout for GaN / AlGaN rad sensor device fabrication.

278
Optical properties of Gd2O3 films Appendix B.
Appendix B.1. Optical band gap measurements
The optical properties of select Gd2O3 films, approximately 1 μm in thickness,
deposited on quartz substrates were investigated by UV–Vis spectroscopy. Preliminary
optical transmittance measurements of the Gd2O3 films were made as shown in Figure
B.1. From this data, (αhυ)2 as a function of hυ was plotted, where α is the absorption
coefficient and hυ is the photon energy.
Figure B.1. UV-Vis transmission measurements for Gd2O3 films 6A (250 °C, 200 sccm,
1.07 µm), 6E (650 °C, 200 sccm, 0.87 µm), and 7A (250 °C, 50 sccm O2, 1.11 µm)
deposited on quartz. The inset shows optical band gap extraction via the Tauc method.
A tangential line to the absorption edge was drawn to obtain the band gap value.
Increasing the deposition temperature from 250 °C to 650 °C at an O2 flow rate of

279
200 sccm resulted in a significant decrease in the band gap value from 5.96 eV to
5.44 eV. This is most likely due to the increased crystallinity of the Gd2O3 films at
elevated temperatures. Decreasing the oxygen flow rate into the deposition chamber from
a value of 200 sccm to 50 sccm at a deposition temperature of 250 °C resulted in only a
slight decrease in the band gap value from 5.96 to 5.77 eV.
Additional effects of processing on the optical band gap of the Gd2O3 films were
investigated. The thickness dependence on the optical band gap for set 9 (650 °C, 200
sccm O2, function of thickness) is shown in Figure B.2. Film 9A (380 nm) has the highest
light transmission percentage. As the film thickness increases, the transmission
percentage through the film decreases as a result of scattering.
Figure B.2. UV-Vis transmission measurements for Gd2O3 films from set 9 (650 °C, 200
sccm O2, function of thickness) deposited on quartz.

280
Appendix B.2. Refractive index measurements
Ellipsometry was used to determine Gd2O3 film refractive index. The refractive
index was taken from the average of five locations across the wafer. Refractive index
measurements for select films are shown in Table B.1. Depending on deposition
conditions, the refractive index varied between 1.4 and 2.1.
Table B.1. Refractive index for select films measured by ellipsometry.
Film Refractive index
11A 1.76 ± 0.01
11B 1.92 ± 0.11
11C 1.94 ± 0.16
11D 2.08 ± 0.18
12G 2.15± 0.02
12C 1.45 ± .05

VITA
Daniel A. Grave was born on February 7th
, 1988 in Los Angeles, California. He was the
second child born to Ilan and Yarona Grave. He obtained his bachelor’s degree in
Materials Science and Engineering in May 2009 from Johns Hopkins University. Under
the guidance of Dr. Douglas Wolfe, he continued his studies at Penn State University
where he received his Ph.D. in Materials Science and Engineering in December of 2014.


![Fiber structure-property relationships: a disulfide … · Fiber Structure-Property Relationships: A Disulfide ... [3]. 1 Figures in brackets indicate the literature references at](https://img.dokumen.tips/doc/110x75/5ace18f57f8b9a56098b598a/fiber-structure-property-relationships-a-disulfide-structure-property-relationships.jpg)