Embed Size (px)
Citation preview
Structural Plays in Ellesmerian Sequence and Correlative Strata of the National Petroleum Reserve, Alaska
by Thomas E. Moore1 and Christopher J. Potter2
Open-File Report 03-253
2003 This report is preliminary and has not been reviewed for conformity with U.S. Geological Survey editorial standards or with the North American Stratigraphic Code. Any use of trade, firm, or product names is for descriptive purposes only and does not imply endorsement by the U.S. Government.
U.S. DEPARTMENT OF THE INTERIOR U.S. GEOLOGICAL SURVEY 1U.S. Geological Survey, Menlo Park, California. 2U.S. Geological Survey, Denver, Colorado.
TABLE OF CONTENTS Abstract Introduction Overview Structural Geology the Brooks Range Foothills In The Vicinity of NPRA
New Integrated Structural-Stratigraphic Model Thermal Evolution
Structural Plays in the Deformed Belt of NPRA THRUST-BELT PLAY Introduction Reservoir
Trap Hydrocarbon Charge Timing Thrust-Belt Play Attributes Volumetric and spatial distribution parameters Hydrocarbon parameters Probability of OccurrenceThrust-Belt Play Results ELLESMERIAN STRUCTURAL PLAY Introduction Reservoir Trap Charge Timing Ellesmerian Structural Play Attributes Volumetric and spatial distribution parameters Gas Parameters Probability of Occurrence Ellesmerian Structural Play Results CONCLUSION REFERENCES TABLES Table ES-1 Table ES-2 Table ES-3 Table ES4 Table ES5 Table ES6 Table ES7 FIGURES Figure ES1 Figure ES2
2

Figure ES3 Figure ES4 Figure ES5 Figure ES6 Figure ES7 Figure ES8 Figure ES9 Figure ES10 Figure ES11 Figure ES12 Figure ES13 Figure ES14 Figure ES15 Figure ES16 Figure ES17 Figure ES18
3
ABSTRACT
Reservoirs in deformed rocks of the Ellesmerian sequence in southern NPRA are assigned to two hydrocarbon plays, the Thrust-Belt play and the Ellesmerian Structural play. The two plays differ in that the Thrust-Belt play consists of reservoirs located in allochthonous strata in the frontal part of the Brooks Range fold-and-thrust belt, whereas those of the Ellesmerian Structural play are located in autochthonous or parautochthonous strata at deeper structural levels north of the Thrust-Belt play. Together, these structural plays are expected to contain about 3.5 TCF of gas but less than 6 million barrels of oil.
These two plays are analyzed using a two-stage deformational model. The first stage of deformation occurred during the Neocomian, when distal strata of the Ellesmerian sequence were imbricated and assembled into deformational wedges emplaced northward onto regionally south-dipping authochon at 140-120 Ma. In the mid-Cretaceous following cessation of the deformation, the Colville basin, the foreland basin to the orogen, was filled with a thick clastic succession. During the second stage of deformation at about 60 Ma (early Tertiary), the combined older orogenic belt-foreland basin system was involved in another episode of north-vergent contractional deformation that deformed pre-existing stratigraphic and structurally trapped reservoir units, formed new structural traps, and caused significant amounts of uplift, although the amount of shortening was relatively small in comparison to the first episode of deformation.
Hydrocarbon generation from source strata (Shublik Formation, Kingak Shale, and Otuk Formation) and migration into stratigraphic traps occurred primarily by sedimentary burial principally between 100-90 Ma, between the times of the two episodes of deformation. Subsequent burial caused deep stratigraphic traps to become overmature, cracking oil to gas,and some new generation to begin progressively higher in the section. Structural disruption of the traps in the Early Tertiary is hypothesized to have released sequestered hydrocarbons and caused remigration into newly formed structural traps formed at higher structural levels. Because of the generally high maturation of the Colville basin at the time of the deformation and remigration, most of the hydrocarbons available to fill traps were gas.
In the the Thrust-Belt play, the primary reservoir lithology is expected to be dolomitic carbonate rocks of the Lisburne Group, which contain up to 15% porosity. Antiformal stacks of imbricated Lisburne Group strata form the primary trapping configuration, with chert and shale of the overlying Etivluk Group forming seals on closures. Traps are expected to have been charged primarily with remigrated gas, but oil generated from local sources in the Otuk Formation may have filled some traps at high structural levels. The timing for migration of gas into traps is excellent, but only moderate for oil because peak oil generation for the play as a whole occurred 30 to 40 m.y. before trap formation. Reservoir and seal quality in the play are questionable, reducing the likelyhood of hydrocarbon accumulations being present in the play. Our analysis suggests that the play will hold 5.7 million barrels of technically recoverable oil and 1.5 TCF gas (mean values).
In the Ellesmerian Stuctural play, the primary reservoir lithologies will be dolomitic carbonate rocks of the Lisburne Group and, less likely, clastic units in the Ellesmerian sequence. Traps in the play are anticlinal closures caused by small amounts of strain in
4
the footwall below the basal detachment for most early Tertiary thrusting. Because these traps lie beneath the main source rock units (Shublik, Kingak, lower Brookian sequence), reservoirs that are juxtaposed by faulting against source-rock units are expected to have the most favorable migration pathways. The charge will be primarily remigrated gas; no oil is expected because of the great depths (15,000 to 26,000 ft) and consequent high thermal maturity of this play. Although the the probability of charge and timeliness of trap formation and gas remigration are excellent, seal and reservoir qualities are anticipated to be poor. Our analysis suggests that about 2.0 TCF of techncially recoverable gas can be expected in the play.
INTRODUCTION The Thrust-Belt and Ellesmerian Structural plays consist of structural traps developed
principally in rocks of the Ellesmerian sequence in the foothills and mountain front region of the Brooks Range in southern NPRA (Figure ES1). These structural closures were formed by folding and thrusting in the frontal part of the Brooks Range orogenic belt in the late Mesozoic and early Tertiary. The two plays differ in that the closures in the Thrust-Belt play are located in allochthonous strata at relatively shallow structural levels, whereas those of the Ellesmerian Structural play are located in autochthonous or parautochthonous strata at significantly deeper structural positions. Hydrocarbons in both plays are interpreted to be primarily gas, although oil accumulations are potentially present at shallow depths in the Thrust-Belt play.
Overview
The Mississippian to Early Cretaceous strata of the Ellesmerian and Beaufortian sequences (Lerand (1973) as modified by Hubbard and others (1992)), undeformed and gently south dipping in northern NPRA, lie at significantly deeper depths in southern NPRA where they are affected by contractional deformation caused by the north-directed Brooks Range orogen to the south (Figure ES2). Correlatives of these sequences are exposed at structurally high levels in the foothills of the Brooks Range in southernmost NPRA, where they are complexly deformed by thrust faults and folds. The deformation at both structural levels has produced numerous anticlinal closures that are evident in the field and on seismic profiles and that may be prospective for accumulations of hydrocarbons. The exploration potential of these structures led to bidding by the petroleum industry on more than a dozen large tracts featuring Ellesmerian structural targets in southern NPRA in the 1982-84 lease sales (Kornbrath and others, 1997, fig. 3), although no wells were ultimately drilled on these tracts. Similar exploration targets were tested at five localities outside of NPRA in the late 1970’s and early 1980’s (Figure ES1). The geologic results of only one of these wells (Lisburne-1 well) is available to the public at the present time.
In addition to the lack of well data and poor seismic resolution produced by the complex structure, a key impediment for accurate assessment of the hydrocarbon accumulations in structural traps in NPRA has been the challenge of understanding the structural geology of the northern Brooks Range and adjacent parts of the Colville basin.
5
Consequently, a key objective of our analysis has been to establish a structural-stratigraphic model that integrates field and subsurface data and observations throughout southern NPRA. Such a model is critical to determination of the timing of hydrocarbon maturation and trap development and thus, hydrocarbon potential for all structural plays in NPRA.
In the discussion that follows, we first summarize the structural model and then analyze the hydrocarbon potential of structural plays in Ellesmerian strata utilizing traditional exploration considerations such as charge, reservoir, trap, and timing for each of the two plays. These discussions are followed by description and scientific foundation of the input paramenters used in the assessment as well as the assessment results of each play. Structural Geology the Brooks Range Foothills In The Vicinity of NPRA
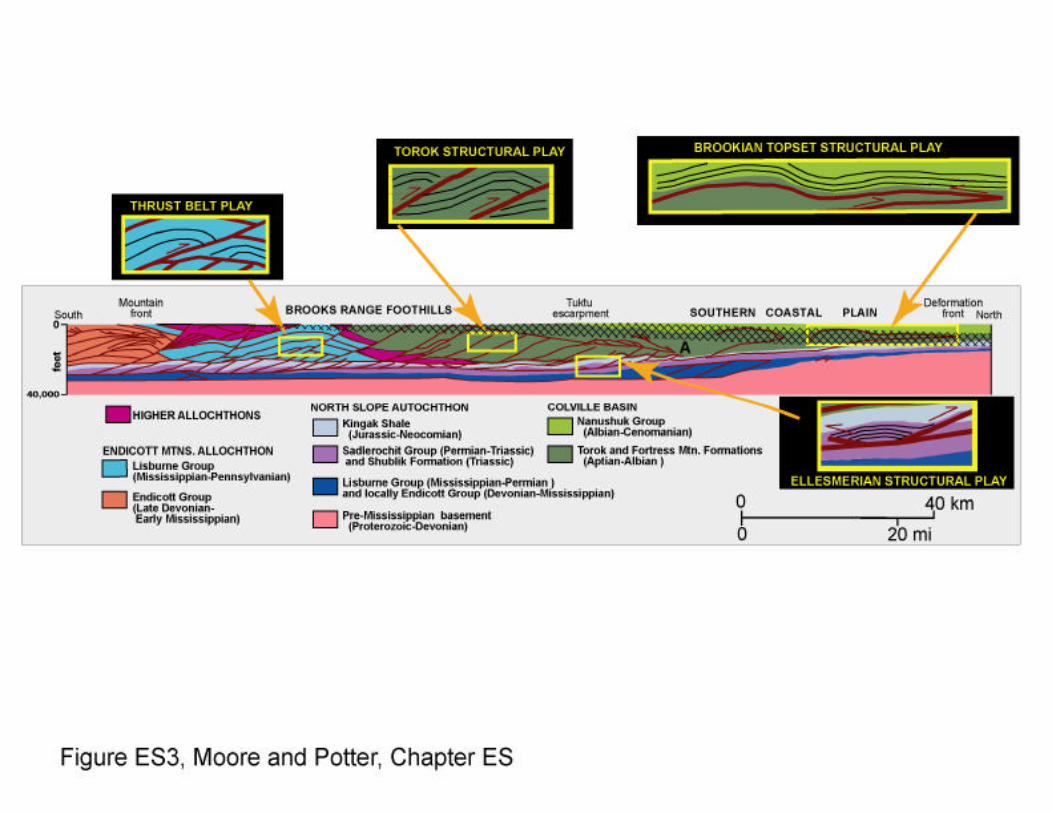
The northern Brooks Range is a north-directed foreland fold-and-thrust-belt that forms the southern boundary of the North Slope petroleum province of northern Alaska (Figures ES1 and ES3). Seismic-reflection data collected in the late 1970’s and early 1980’s and reprocessed for this assessment (Miller and others, 2000, 2001), show that from the front of the Brooks Range northward to the coastal plain the primary regional basal detachment for thrust faults and folds is located in the Jurassic and Lower Cretaceous Kingak Shale (Figure ES3). Near the mountain front, the hanging wall consists of a stacked series of thrust duplexes developed principally in Upper Devonian and Lower Mississippian(?) clastic rocks (Kanayut Conglomerate), Mississippian-Pennsylvanian carbonate rocks and chert (Lisburne Group), and Permian to Jurassic chert, silicified limestone, siltstone, and argillite (Etivluk Group). This stacked succession of duplexes composes the regionally extensive Endicott Mountains allochthon, which underlies much of the Brooks Range, including that part along the southern margin of NPRA (Mull, 1982; Mull and others, 1997; Mayfield and others, 1988; Moore and others, 1994; 1997).
To the north in the foothills, the Endicott Mountains allochthon is overlain by broken formation and melange of late Paleozoic through early Mesozoic basinal strata, oceanic allochthons, and Upper Jurassic and Neocomian (for the purpose of this paper, the Neocomian is defined as consisting of the Berriasian, Valanginian, Hauterivian, and Barremian) syntectonic strata. These strata compose one or more allochthons that are laterally discontinuous and are herein referred to in composite as “higher allochthons” (see Moore and others, 1994) for details of the stratigraphy of these allochthons). Proximal facies of the Aptian(?) and Albian clastic strata (Fortress Mountain Formation) rest in apparent unconformity on these rocks (Mull, 1985) and are deformed into broad, gentle “thumbprint” synclines and narrower, sharp anticlines cored by north-directed reverse faults.
Farther north in the Colville basin, mid-Cretaceous ( here and elsewhere, “mid-Cretaceous” is used as a designation for the Aptian, Albian, and Cenomanian) strata of the Brookian sequence (Lerand, 1973) are widespread in outcrop and in the subsurface and consist of large thicknesses of mostly south-dipping strata, including sandstone turbidites (Albian lower Torok Formation) and overlying mudstone slope deposits (Albian upper Torok Formation). These strata display north-directed folds and thrust faults in the southern part of the basin. At the Tuktu escarpment, the north-dipping Torok
6
Formation is overlain by a thick sequence of gently folded shelfal and deltaic sandstone, siltstone, and conglomerate (Albian and Cenomanian Nanushuk Formation). Between the Tuktu escarpment and the deformation front in central NPRA, the Nanushuk Formation displays valley and ridge topography controlled by upright open folds above local areas of tectonic thickening in the underlying Torok Formation.
New Integrated Structural-Stratigraphic Model
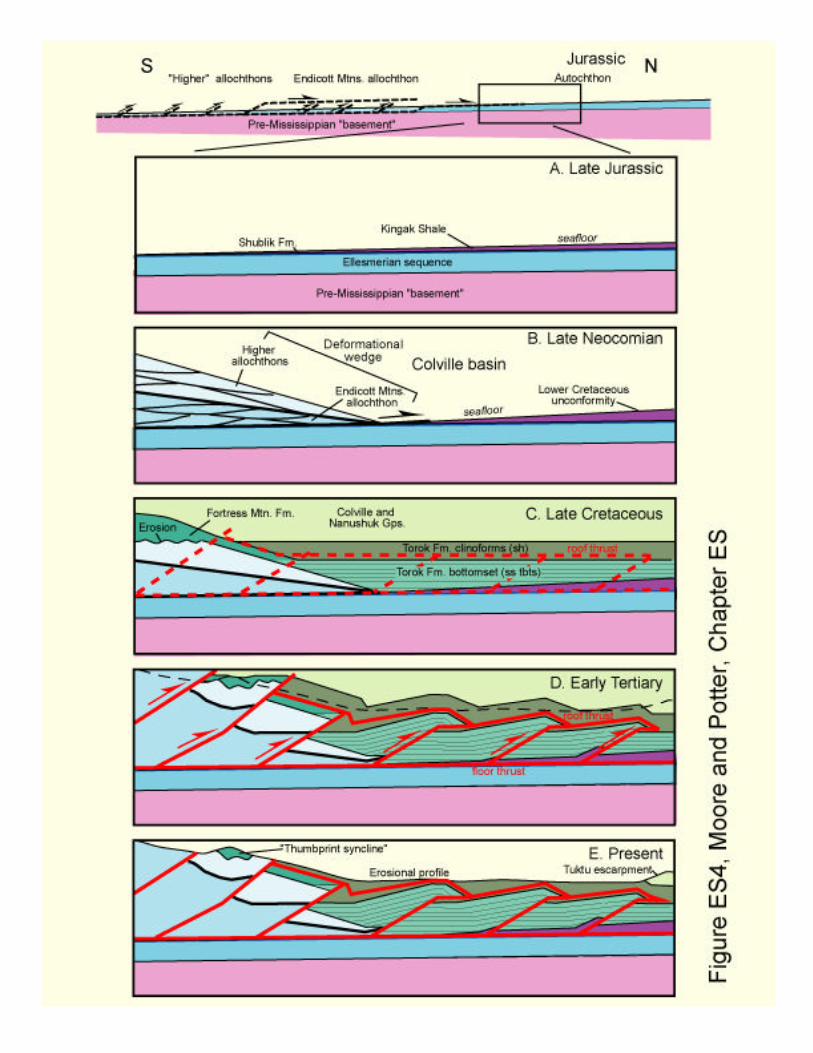
A model for the deformed, southern part of NPRA should provide explanations for the following key structural features: (1) exposure of progressively deeper structural levels to the south in the Brooks Range foothills despite generally southward dips observed in most outcrops, (2) fission-track evidence for at least two periods of contractional deformation and uplift-related cooling in the Cretaceous and Tertiary, (3) southward change in structural style, ranging from simple upright folds in the north to very complex folds and thrusts, including broken formation and melange in the south, and (4) rapid northward thickening and facies changes in mid-Cretaceous clastic units. Our new integrated structural-stratigraphic model (Figure ES4), based on field and seismic investigations, shows these features as the product of two superposed north-directed deformational belts: (1) a thin-skinned fold-and-Thrust-Belt formed in the Late Jurassic(?) to Early Cretaceous (Neocomian), and (2) a thin- to thick-skinned fold-and-Thrust-Belt that developed in the early Tertiary following sedimentary burial beneath the Colville basin.
The first episode of thrusting in northern Alaska was related to the Late Jurassic and Early Cretaceous north-facing arc-continent collision which emplaced the Endicott Mountains and higher allochthons beneath a Jurassic oceanic arc (e.g., Roeder and Mull, Box, Moore and others, 1994). During the deformation, allochthons of distal facies of the Ellesmerian and Beaufortian sequences were internally deformed and detached from their continental substrate and assembled by northward thrusting into shingled, north-thinning deformational wedges. Within the deformational wedges, the structural style was stratigraphically controlled, with mechanically competent stratigraphic units imbricated in duplexes and less competent units exploited as detachments that separated the duplexes (Wallace and others, 1997). Stratigraphic relations and zircon fission track data suggest the deformational wedges were emplaced onto the south-dipping autochthon in two major phases, with the higher allochthons being emplaced during the early Neocomian (140 Ma) and the Endicott Mountains allochthon (including overlying, previously emplaced higher allochthons) being emplaced in the late Neocomian (120 Ma) (O’Sullivan and others, 2002). Clastic sedimentary deposition associated with the thrusting is represented by debris-flow and turbidite deposits of the Okpikruak Formation, which was clearly involved in the thrusting principally in the Berresian and Valenginian (Mull, 1985; Moore et al 1994).
The thrusting resulted in construction by the Aptian of a structurally and topographically high-standing region, which became the south flank of the Colville basin. Tectonic loading produced by the thrusting caused subsidence of the basin (Cole and others, 1997). Deposition in the basin initially consisted of syntectonic strata, but following termination of thrusting, gave way to voluminous deposition in the Aptian to Cenomanian of Brookian sequence strata shed from the south and west. On the south flank of the basin, however, mid-Cretaceous sedimentary deposits (e.g., Fortress
7
Mountain Formation) are much thinner and coarser grained and consist in large part of fan-delta deposits shed northward into the basin along its southern margin. Deformation during this period appears to be restricted to slumping and normal faulting in the clastic wedge and local strike-slip faults such as that marked by the Carbon Creek anticline (Kirshner and Rycerski, 1988). Colville basin deposits showing possible evidence of syndepositional growth (Cole and others, 1997, fig 8b) are present along the southeastward projection of the Carbon Creek trend and may represent deformation related to a releasing bend or flower structure on the strike-slip fault.
The second episode of north-direct thrusting occurred principally at about 60 Ma but may have continued to about 45 Ma (O’Sullivan and others, 1997). This episode of thrusting was probably generated by plate interactions in southern Alaska that resulted in northward thrusting in northern Alaska. The thrusting occurred above a very deep detachment under the southern Brooks Range, which ramps up to the Kingak Shale beneath the northern flank of the Brooks Range (Fuis and others, 1997). In the southern Brooks Range where deformation was thick-skinnned, the shortening caused formation of a crustal scale duplex (Oldow and others, 1987; Fuis and others, 1997, O’Sullivan and others, 1998). In the northern foothills where the deformation was thin-skinned, thrusting resulted in formation of reverse faults that truncate structural units of the older deformational wedge and mid-Cretaceous deposits (Fortress Mountain Formation) that overlie the wedge.
Thermal Evolution
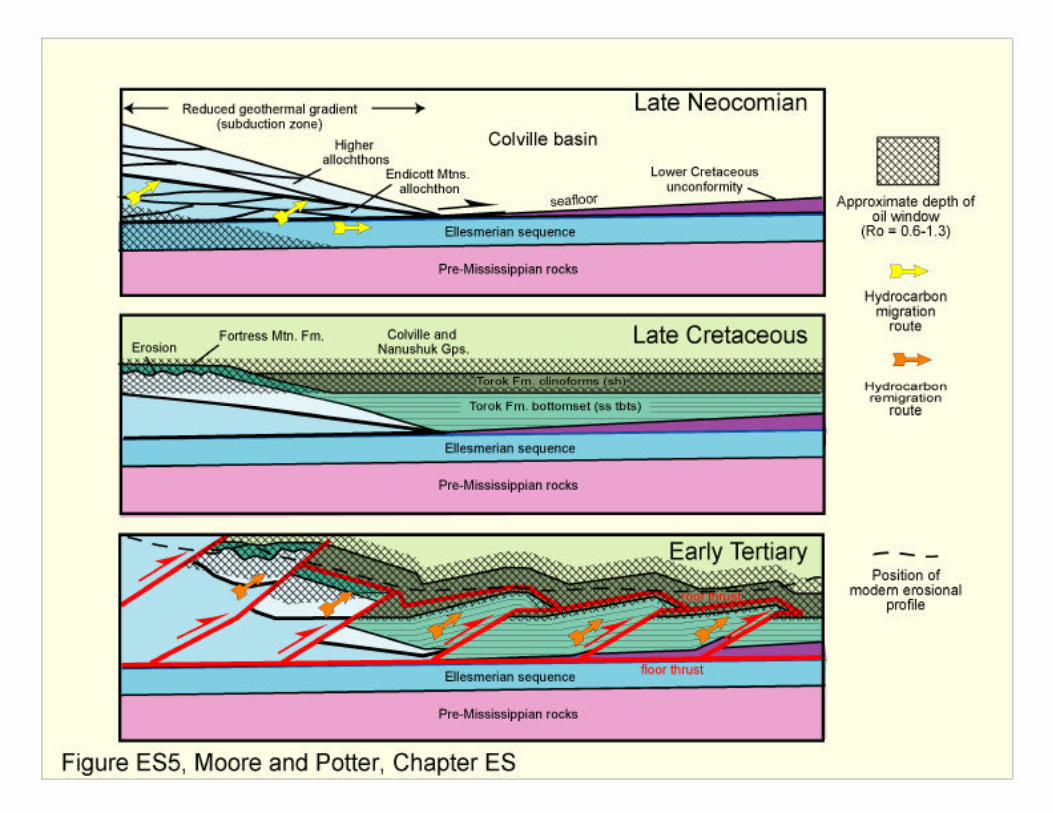
The integrated structural model (Figure ES4) can be used to explain the thermal evolution of the strata in the deformational belt in southern NPRA (Figure ES5). This interpretation sheds light on the timing of hydrocarbon generation and fluid migration pathways as well as the timeliness of structural trap development in the deformed belt in southern NPRA.
Prior to thrusting in the Jurassic(?) and Neocomian, the thermal structure of the Ellesmerian sequence was controlled by simple stratigraphic burial. Assuming a geothermal gradient typical for a long-standing passive margin (~30°C/km), the depth to the oil window (80°C to 120°C) was greater than the thickness of the entire Ellesmerian sequence (<3 km) in most areas. Thus, temperatures characteristic of the top of the oil window must have been in pre-Mississippian strata below the Ellesmerian sequence. The pre-Mississippian rocks, however, were deformed and mildly metamorphosed prior to Mississippian time and thus had high thermal maturity established before deposition of the Ellesmerian sequence (Kirschner and Rycerski, 1988). Thus, no hydrocarbons could have been generated at this time except possibly in the deepest parts of isolated Endicott basins where the Ellesmerian sequence is the thickest (e.g., Endicott Basin plays, Chapter EB).
Levels of thermal maturity sufficient for hydrocarbon generation in the Ellesmerian sequence could have been attained in the Late Jurassic(?) and Neocomian by tectonic burial beneath thrust sheets of allochthonous strata (Figure ES5, top left). Zircon fission track ages of 140-120 Ma demonstrate that temperatures in excess of 250°C were attained at least locally in the Neocomian thrust belt (O’Sullivan and others, 2002). These data suggest that source rocks present in overthrusted Ellesmerian strata probably reached sufficient maturity to generate hydrocarbons at the time of thrusting. These hydrocarbons
8
could have migrated along faults and fractures and been trapped in reservoir strata involved in thrust-related folds.
North of the Neocomian deformation front, stratigraphic thicknesses in most areas were insufficient to generate hydrocarbons from Mississippian and younger strata until after the onset of deposition of the Brookian sequence and infilling of the Colville basin in the late Early Cretaceous (Figure ES5, top right). As sediments of the Brookian sequence began to accumulate in the Colville basin, the oil window began to rise through the stratigraphic section. With increasing stratigraphic thickness, hydrocarbon generation began first in the Ellesmerian sequence followed successively by generation in the Beaufortian and lower Brookian (GRZ) sequences. Seismic profiles, well data, and structural restorations indicate that as much as 8 km of sediment was deposited in the deepest parts of the Colville basin between the Aptian and Cenomanian. By the time of maximum burial just prior to Tertiary deformation, the oil window lay entirely within the Brookian sequence and the major source units in the Ellesmerian and Beaufortian sequence had become overmature (Figure ES5, middle). Burial history calculations (Burns and others, 2002) suggest that peak generation for these units occurred at about 100-90 Ma, indicating that the petroleum systems were active while the basin was in the early stages of being filled. Hydrocarbons generated during this period mostly likely migrated into nearby stratigraphic traps developed primarily in Brookian sequence strata.
A key consideration is that isotherms present during filling of the Colville basin were generally concordant with stratigraphy because the thermal maturity of the basin sediments resulted from sedimentary burial (Figure ES5, middle). Vitrinite reflectance data from the West Kurupa well suggest that at the time of maximum burial in southern NPRA the top of the oil window was located in the lower part of the Nanushuk Group and its base in the lower part of the upper Torok Formation (Bird, written comm., 2002; Johnsson and others, 1999). To the south where Colville Basin strata onlap the southern flank of the basin, however, these isotherms transect the basin margin and extend into deformed Ellesmerian, Beaufortian, and Brookian source rocks that form the tectonic wedge on the southern flank of the Colville basin. For this reason, a significant volume of source rocks contained in the upper part of the Neocomian deformational wedges on the southern flank of the Colville basin did not see temperatures sufficient to cause hydrocarbon generation until much of the basin was filled. This interpretation is supported by relatively low thermal maturity (indicated by vitrinite reflectance, conodont alteration indicies, and apatite fission-track data) in the Neocomian and older strata in the Lisburne well (Cole and others, 1997). Thus, the amount of sedimentary burial seen by rocks lying beneath the entire Brookian sequence on the southern flank of the Colville basin basin was similar to the amount of burial experienced by just the uppermost part of the Torok Formation in the axial part of the basin. The thermal maturity data indicate that up to the time of the onset of thrusting in the Tertiary, source rocks within much of the upper part of the Neocomian deformational wedge on the southern flank of the Colville basin were probably still generating hydrocarbons (Figure ES5, middle).
Apatite fission-track ages across the deformational belt in southern NPRA show that cooling from maximum burial temperatures began at about 60Ma; this cooling is interpreted to have resulted from thrust-related uplift (O’Sullivan and others, 1997). Because the isotherms within the Colville basin were generally concordant with Brookian stratigraphy prior to thrusting, they probably were faulted and folded with the
9
stratigraphy that contained them (Figure ES5, bottom). This suggests that hydrocarbons generated from rocks in the oil window at the time of maximum burial near the onset of thrusting probably migrated into adjacent antiformal traps that formed during early stages of the deformation, both in the basin and in the Neocomian deformational wedge along its southern flank. Additionally, the seals for many hydrocarbon accumulations sequestered in stratigraphic traps at depth in the Colville basin probably were ruptured by the deformation. The hydrocarbons released by this process probably remigrated upwards into structurally higher culminations along faults or other fluid pathways or were lost to the surface (Figure ES5, bottom). Rocks above the basal detachment primarily experienced uplift and erosion-related cooling as a result of the deformation, although tectonic burial caused by the thrusting may have resulted in some additional heating at depth below the basal detachment in the Kingak Shale. More than 3 km of section has been removed by erosion from much of the deformation belt in southern NPRA following the deformation (O’Sullivan and others, 1997). Hydrocarbon generation probably largely ceased with the onset of deformation at 60 Ma in southern NPRA because any tectonic burial resulting from thrusting in the Tertiary would have occurred at very deep levels where strata were already thermally overmature and would have been quickly mitigated by the subsequent denudation. Structural Plays in the Deformed Belt of NPRA
For the purpose of assessing the hydrocarbon potential of structural traps in the deformed belt of NPRA, we have subdivided the deformed belt into four plays based primarily on stratigraphic position of the reservoirs. The reservoirs for the two plays discussed in this chapter, the Thrust-Belt play and Ellesmerian Structural play, are developed in primarily in strata of the Ellesmerian sequence. The Thrust-Belt play consists of structural traps in the Neocomian deformational wedge, primarily in thrust-imbricated Lisburne Group carbonate rocks within the Endicott Mountains allochthon and is distinguished by the presence of structures formed both in the Jurassic(?) and Early Cretaceous and early Tertiary deformational events. The Ellesmerian Structural play consists of structural closures developed below the regional basal detachment in the Kingak Shale where local subsidiary detachments have resulted in small displacement thrust faults and thrust-related folds in the Ellesmerian sequence. Structures in this play probably developed during thrusting in the Tertiary. Details of the two Brookian structural plays, the Topset Structural Play and the Torok Structural Play, are discussed in Potter and Moore (this volume, Chapter TS).
THRUST-BELT PLAY Introduction
The Thrust-belt play, the southernmost play in NPRA, consists of structural closures in the northern foothills and mountain front area of the Brooks Range (Figure ES1). The primary reservoir facies in this play are in dolomitic allochthonous strata of the Mississippian and Pennsylvanian Lisburne Group in the Endicott Mountains allochthon (Figure ES2). The closures were formed initially by thin-skinned thrusting and thrust-
10
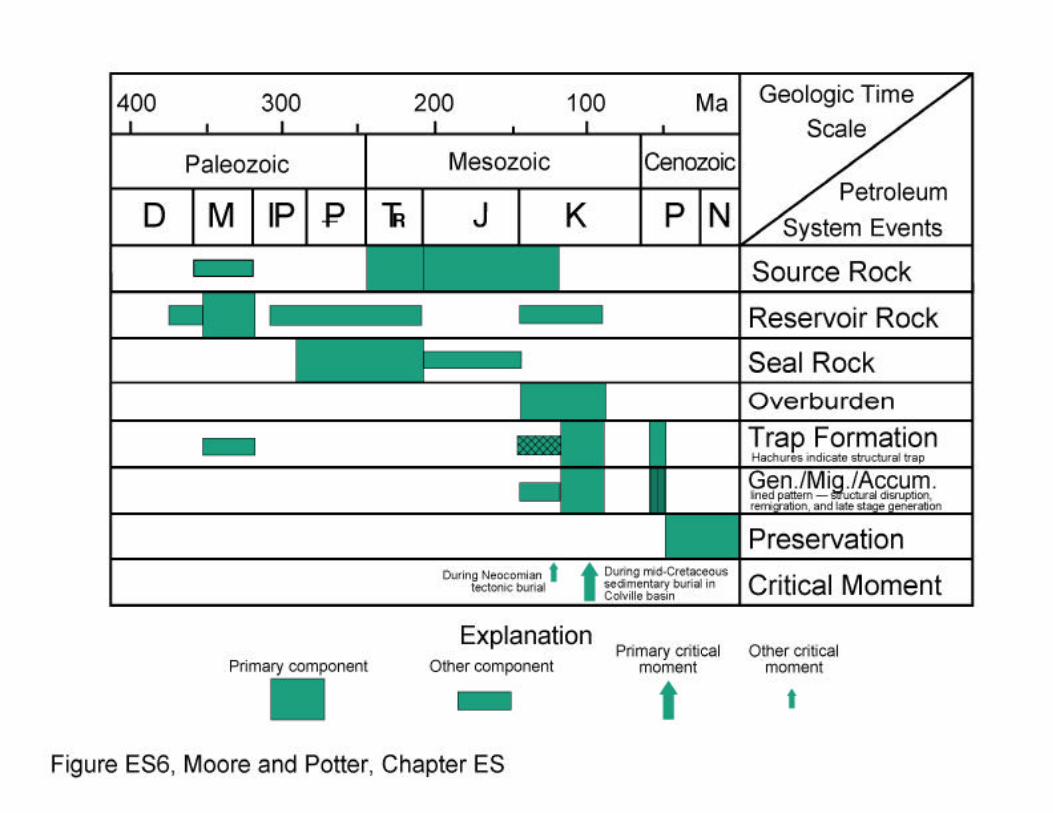
related folding in the Jurassic and Neocomian and later refolded by reverse faults developed during thrusting in the early Tertiary. Because of thermal maturity considerations, the play is anticipated to be mainly a gas play although oil may also be present in traps at shallow depths. The petroleum system for the Thrust-Belt play is summarized in an Events Chart (Magoon and Dow, 1994) in Figure ES6.
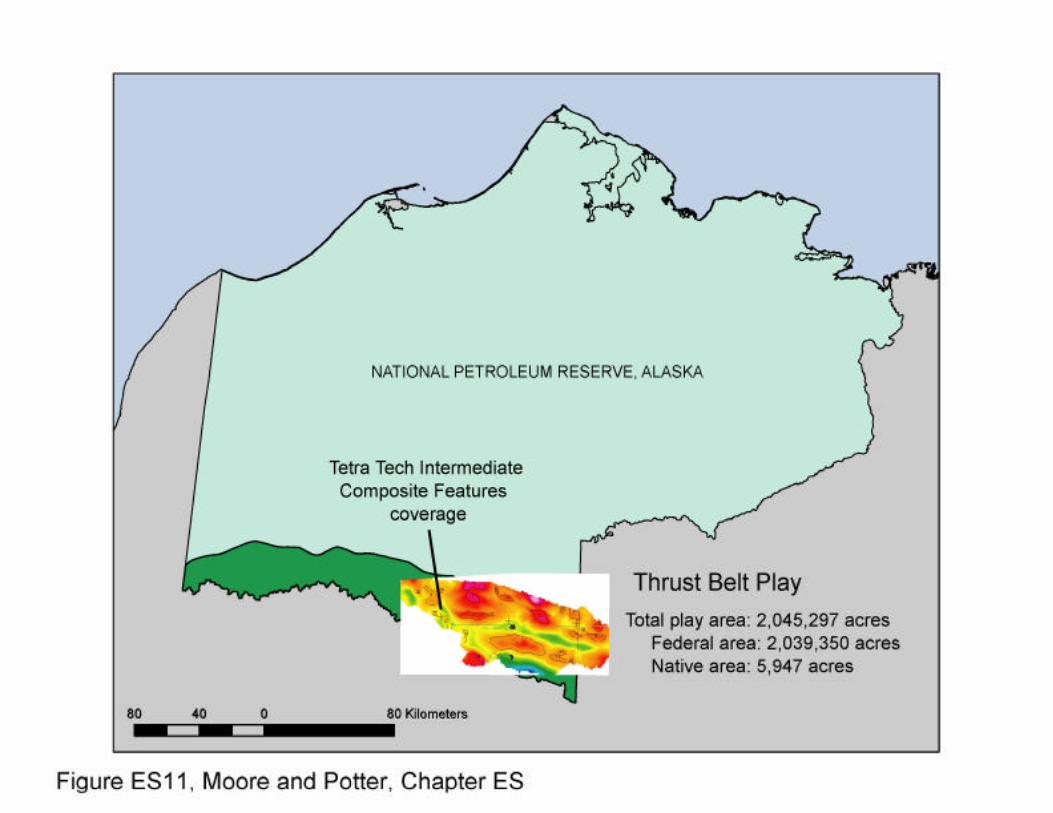
The area of this play is defined by the distribution of the Endicott Mountains allochthon and higher allochthons that were emplaced as part of the Late Jurassic and Neocomian Brooks Range orogen (Figure ES3). The primary location of the allochthons is in the northern foothills and mountain front area of the Brooks Range and extends along the length of the Brooks Range throughout the central and western North Slope. The southern, eastern, and western boundaries of the play are thus defined by the boundaries of NPRA. The northern boundary of the play area is defined by the northern limit of the Endicott Mountains and higher allochthons. Because these allochthons compose deformational wedges that tip out to the north under the Colville basin (Figure ES3), the northern extent of the play is located to the north of the surface exposure of the allochthons. In practice, the northern boundary is marked by the northernmost extent of allochthonous Lisburne Group strata interpreted from seismic data. The area of the Thrust-Belt play, shown in Figure ES1, is 2,578,744 acres of which 2,572,797 acres are Federal lands and 5,947 acres are Native holdings.
The surface expression of structures in the play area were mapped principally by Mull and others (1994); Mull and Werdon (1994); Tailleur and others (1966), Mayfield and others (1988), Kirschner and Rycerski (1988), and Mull (written commun., 1998a, b). A general cross section showing geologic interpretations across the play area was published by Kirschner and Rycerski (1988) and a balanced cross section along seismic line R-19, a few kilometers east of the play area, was the subject of Cole and others (1997). Oldow and others (1987) also published a balanced cross section across the foothills region about 150 km east of the play area. Our assessment of the Thrust-Belt play is based on examination of 2D seismic data, wire-line well logs, and outcrop studies, and subsurface maps originally interpreted and compiled by Tetra Tech, (1982) and revised by Saltus and others (Chapter SM, this volume).
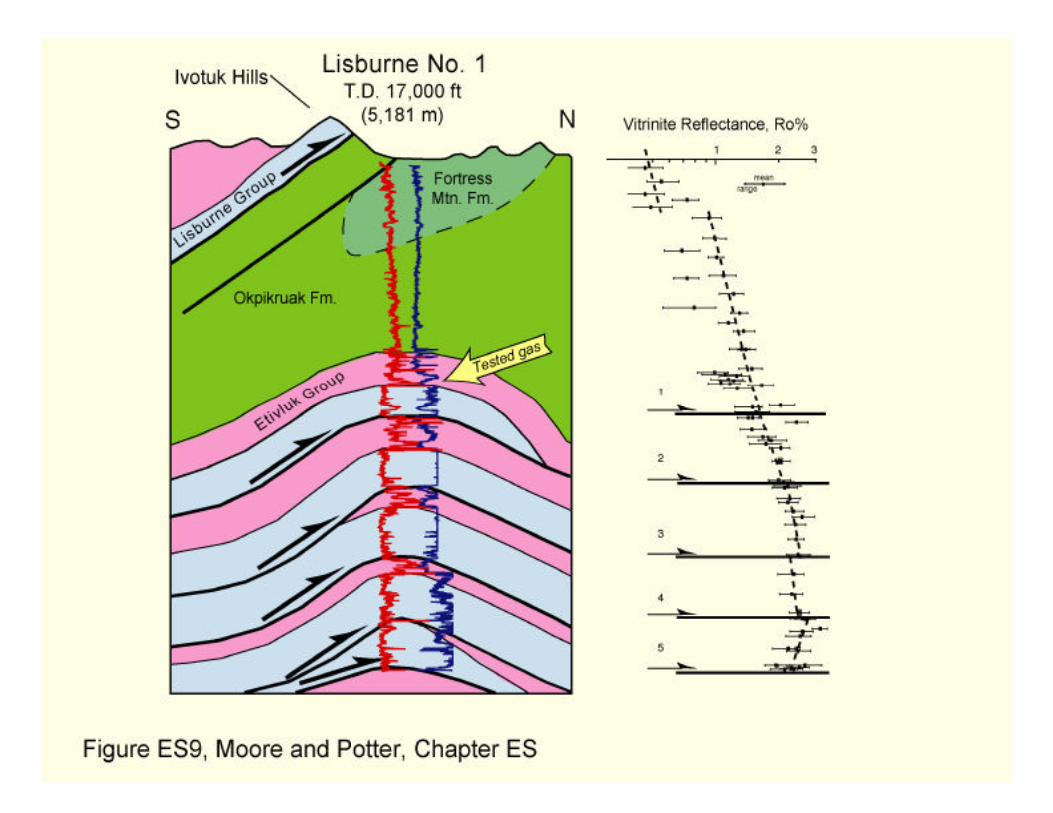
Structural traps were the target of the Lisburne Test well no. 1, drilled in 1979 and located just a few kilometers east of the play boundary (Legg, 1983) (Figure ES1). This well was drilled to a depth of 17,000 feet and tested a seismically delineated structural closure that proved to consist of five stacked thrust imbricates of the Lisburne Group (Legg, 1983; Cole and others, 1997; Dumoulin and Bird, 2002). Only minor gas shows were encountered in the well, but intervals with moderate to significant porosity were identified in dolomitic strata of the Lisburne Group (Legg, 1983). Other wells that tested structures in allochthonous rocks of the Brooks Range foothills outside NPRA include the Eagle Creek well to the west of NPRA and the Chevron Killik, Tiglukpuk, and Cobblestone wells east of NPRA. Although little geologic information is available about the results of these wells, they are considered here to have been unsuccessful tests for economically significant amounts of hydrocarbons.
The Thrust-Belt play appears to be prospective for hydrocarbon accumulations in structural traps because (1) large structural closures are evident in the field and in seismic data, (2) rich hydrocarbon source rocks with thermal maturity in the oil window are present in outcrop, and (3) solid hydrocarbons are present in outcrop, demonstrating that
11
oil has moved through the rocks. The presence of hydrocarbon accumulations may be limited, however, by the availability of reservoir and sealing facies.
Reservoir
Only dolomitized carbonate rocks of the Mississippian and Pennsylvanian Lisburne Group have been demonstrated to contain sufficient porosity to form a major reservoir, although it remains possible that several other units could conceivably be reservoirs in the Thrust-Belt play. Reservoir units in the Waterton Gas Field in the Canadian Rocky Mountains are possible analogs for the Lisburne reservoirs in the Thrust-Belt play because they consist of dolomitized Mississippian carbonate rocks that contain secondary porosity enhanced by fracturing associated with thrusting (Lewchuk and others, 1998). The secondary porosity is thought to have developed during dolomitization in supratidal environments (Lewchuk and others, 1998). The Waterton Gas Field is estimated to contain 4.2 TCF (trillion cubic feet) in place (Lewchuk and others, 1998). Mississippian carbonate units with porosities as low as 6% are sought as reservoirs for ongoing exploration for gas in structural plays in the Canadian Rockies (M. F. McGroder, Imperial Oil Company, oral commun., 2002),.
In southern NPRA, Dumoulin and Harris (1993) divided the Lisburne Group into three units of local extent that have a composite thickness of more than 880 ft (265 m) based on outcrop measurements near the Lisburne well. The lower and upper units are each about 295 ft (90 m) thick and consist of thin-bedded to laminated fine-grained mudstone, chert, and shale that are locally dolomitic, phosphatic, spiculitic, and organic-rich. The middle unit is 262 ft (80 m) thick and consists of massive skeletal wackestone to grainstone that are locally to completely dolomitized. Dumoulin and Bird (2002) interpreted the lower and middle units as having accumulated near the seaward margin of a shallow-water carbonate platform. Outer shelf to slope deposits are predominant in the upper unit of the Lisburne, indicating the platform drowned during the Late Mississippian (Dumoulin and Bird, 2002). No evidence of carbonate reefs are present anywhere in the Lisburne Group (Dumoulin and Bird, 2001).
Three drill stem tests were conducted on Lisburne Group strata in the Lisburne well, with recovery of formation water on one test and little or no recovery of water and gas on the other two tests (Legg, 1983). Porosity was encountered preferentially in dolomitized carbonate strata of the middle unit of the Lisburne in all five thrust imbricates penetrated by the Lisburne well (Legg, 1983). Although also dolomitized, the upper and lower units contain less porosity because they are fine-grained and chert-rich. Dumoulin (written comm., 1995) noted that the porosity is intercrystalline, moldic (crinoid ossicles), and within fractures and reported that some of the pores are filled or lined with solid hydrocarbons. These observations support the conclusion that the porosity is secondary porosity that developed as a result of dolomitization and was later exposed to hydrocarbon charge.
Armstrong (1970) described supratidal facies in outcrops of the Lisburne Group in the play area and suggested that the dolomitization of the Lisburne was caused by the reflux of hypersaline brines formed in the supratidal environment. Dumoulin (written comm., 1995), however, found no unequivocal lithologic or textural evidence (e.g., algal mats with antigravity structures, imbricated mud chips, birdseye structures) for supratidal facies in the Lisburne in the play area and pointed out that conodonts, even those
12
collected from the strata thought by Armstrong (1970) to contain supratidal facies, are indicative of normal marine deposition. She concluded that the dolomitization of the Lisburne was unlikely to have occurred in a supratidal environment and instead suggested that the dolomitization was the result of multiple episodes of alteration that occurred during burial similar to the process described by Jameson (1994) in Lisburne Group strata at Prudhoe Bay.
The middle unit of the Lisburne Group of Dumoulin and Harris (1993) is regarded as the most prospective reservoir interval in the play area because of its porosity, coarse grain size, and abundance of solid hydrocarbons in pores and fractures. The middle unit is widely distributed at the surface and subsurface in the eastern part of the play area, with thicknesses ranging from 262 to 394 ft (80 to 120 m) in outcrop (J.A. Dumoulin, written comm., 1995). Its extent in the western part of the play area is uncertain because of the absence of surface exposures and seismic reflection data. The Lisburne has been structurally duplicated by thrusting, so that net thicknesses of the middle unit can be at least as much as 5 times of that present in an undeformed stratigraphic section. For example, a composite thickness (unmodified for dip and internal structure) of 2,145 ft (654 m) of middle unit strata was encountered in the Lisburne well (out of a total thickness of 7,450 ft (2270 m) of Lisburne Group strata penetrated in the well) (J.A. Dumoulin, written comm., 2002). Porosity and permeability may be locally enhanced by fracturing associated with the thrusting in the thrust duplicated sections.
Other units that could potentially contain reservoir units in the Thrust-Belt play include (1) clastic rocks of the Upper Devonian and Lower Mississippian(?) Kanayut Conglomerate; (2) Brookian clastic rocks, including the Upper Jurassic and Lower Cretaceous Okpikruak Formation, Aptian-Albian Fortress Mountain Formation, and Aptian-Albian Torok Formation, and (3) chert and argillaceous limestone of the Pennsylvanian to Middle Jurassic Etivluk Group. Each of these units, however, have characteristics that significantly diminish their potential as reservoir units. The Kanayut Conglomerate, for example, is thoroughly cemented by quartz and contains little or no observable porosity despite its substantial thickness and coarse-grained character. Although the Brookian clastic units locally contain solid hydrocarbons as vein fillings and significant porosity, they have limited potential as reservoir units because of structural considerations, including broken formation and melange structural style (Okpikruak Formation), erosional breaching (Fortress Mountain Formation), and uncertain presence in traps in the subsurface (Fortress Mountain and Torok formations). One drill stem test on Etivluk Group strata in the Lisburne well tested gas (Legg, 1983) (Figure ES9). This suggests that fracture porosity in chert of the Etivluk Group may hold promise as a reservoir. The abundance, distribution, and thickness of such porosity-enhanced fracturing in the play area, however, is difficult to evaluate without further information. Trap
The most favorable structural trapping geometries in the Thrust-Belt play are antiformal culminations similar to the one tested by the Lisburne-1 well east of the play area (Figure ES1). The antiforms are composed primarily of duplicated carbonate strata of the Lisburne Group, the primary reservoir unit in the play. Seals for the closures are provided by siltstone and shale in the Etivluk Group that overlie the Lisburne Group.
13
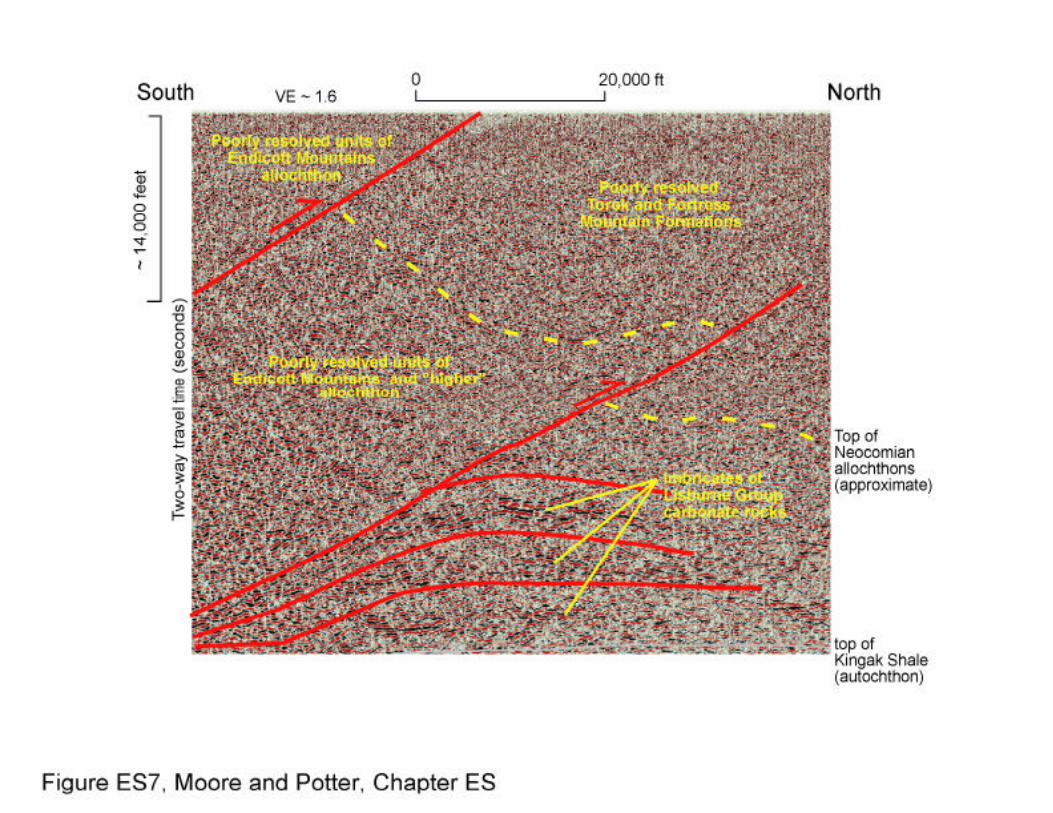
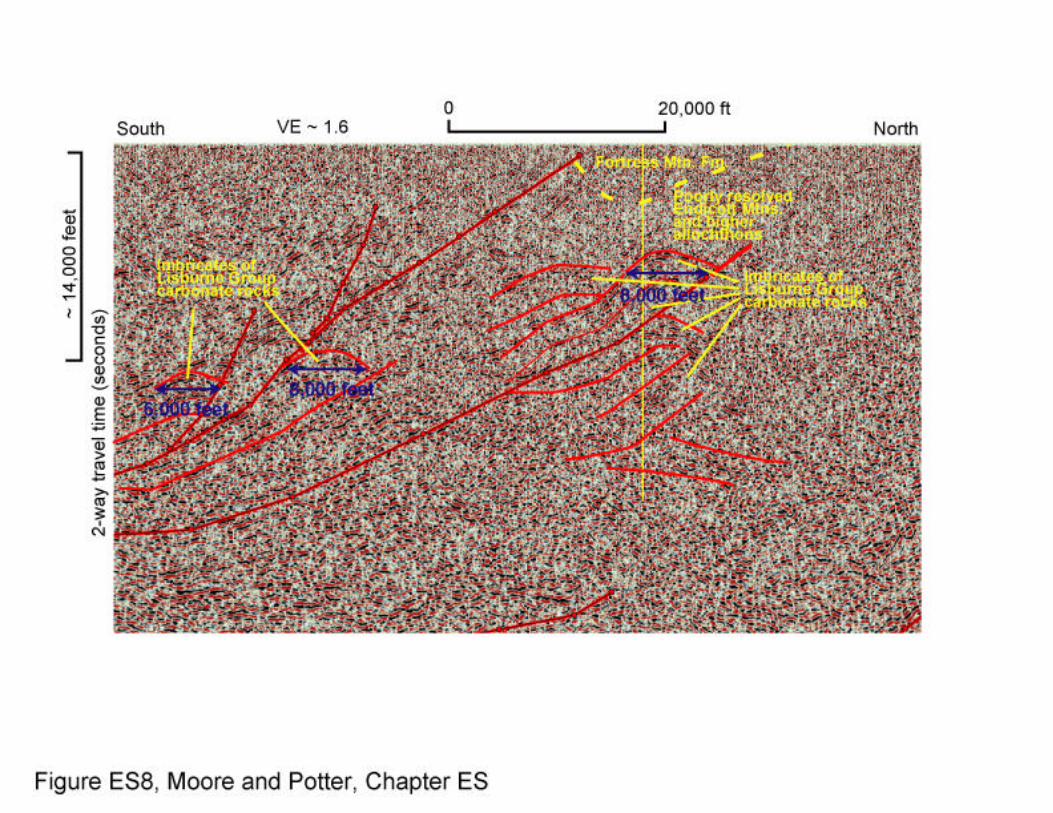
Because of the velocity contrasts between the Lisburne and Etivluk groups, the closures are commonly well imaged on seismic reflection data (Figures ES7, ES8).
The Lisburne-1 well was drilled to a depth of 17,000 ft (5,181 m) into the core of the antiform and encountered five repetitions of the Lisburne and Etivluk Groups in the lower 10,000 ft (3,048 m) of the well (Legg, 1983) (Figures ES8, ES9). The upper 7,000 ft (2,134 m) of the well consists of strata of the Brookian sequence (Okpikruak Formation and Fortress Mountain Formation). The Brookian strata are in turn overthrusted by other imbricates composed of Lisburne and Etivluk group strata in outcrop and which project to structural positions above the top of the well. Seismic reflection data indicate that other repetitions of Lisburne Group probably also lie beneath the bottom of the well. These relations led Cole and others (1997) to suggest that the Lisburne is repeated as many as nine times in the vicinity of the Lisburne-1 well. This analysis suggests that many structural repetitions of the Lisburne Group can be expected in similar antiforms in the play area.
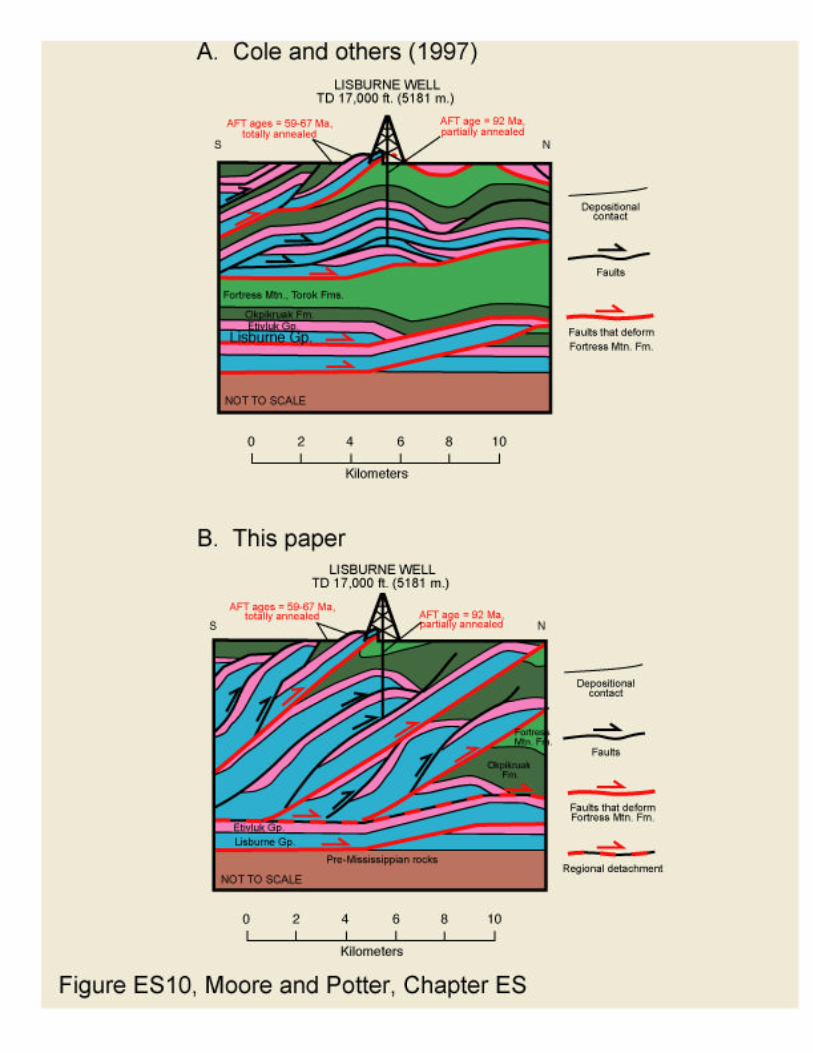
The duplication of Lisburne and Etivluk group strata is common where those strata are exposed in the Brooks Range east of NPRA (e.g., Brosgé and others, 1979; Kelley, 1988; Mull and others, 1994). In these areas, the duplication has been interpreted to be the product of duplexing above a floor thrust in the Mississippian Kayak Shale and a roof thrust in the upper part of the Etivluk Group as part of the emplacement of the Endicott Mountains allochthon in the Neocomian (Mull and others, 1997; Wallace and others, 1997; Moore and others, 1997). Cole and others (1997), noting the involvement of the Albian age deposits (e.g., Fortress Mountain Formation) in the deformation and possible Albian syndepositional tectonism near the Lisburne-1 well, suggested that the duplexing was initiated in the Neocomian but occurred primarily in Albian, Late Cretaceous, and Paleocene time. The structural model used for this assessment, in contrast, explains the duplication of the Lisburne to be the result of duplexing during the Neocomian, followed by erosion and deposition of the Fortress Mountain Formation in the Albian, and then truncation and repetition of the duplex by reverse faults in the early Tertiary (Figure ES4). The sequence of events is consistent with the observation of overthrusting of the Fortress Mountain Formation by duplexed Lisburne and Etivluk group strata south of the Lisburne well and with the timing of deformation as determined by fission-track data. The evidence cited by Cole and others (1997) for syndepositional thrusting is sparse and equivocal because alternate interpretations of the seismic data are possible. The two generations of deformation proposed here suggest that structural relations, trap geometry, and reservoir characteristics within individual antiformal culminations are likely to be complex.
An important question for resource appraisal involves the dip of the late stage faults that truncate the Fortress Mountain Formation. Cole and others (1997) modeled these faults as low angle thrust faults that display substantial amounts of displacement (Figure ES10A). If this configuration is correct, Fortress Mountain Formation or Torok Formation could be expected in sub-thrust structural traps. Our field and seismic observations, however, suggest that the late stage faults are mostly reverse faults that have steep southward dips (about 45-70°) (Figure ES10B) and probably have substantially less displacement than modeled by Cole and others (1997). This interpretation suggests that the potential for sub-thrust Fortress Mountain and Torok
14
hydrocarbon accumulations is not high and is limited only to the northern margin of the play area.
The integrity of seals for reservoir facies in the antiformal culminations is potentially a significant problem. The separation observed on the late-stage reverse faults in the field suggests that displacement for many faults probably is greater than the thickness of the Etivluk Group (705 ft; 215 m), the primary seal for the antiforms. Shale and broken formation in the Okpikruak Formation might also have acted as a sealing unit for some antiforms, but this unit is also breached by reverse faults (for example, south of the Lisburne-1 well in (Figure ES10). This observation suggests the possibility that the same faults that may have provided fracture enhancement of the carbonate reservoir facies in the antiforms and conduits for migration of hydrocarbons from deeper levels may have also breached any seals that existed and allowed the hydrocarbons to migrate upward into or through now largely eroded stratigraphic units such as the Fortress Mountain Formation. Seal integrity might be expected to be better if the late-stage faults are thrust faults with low dips as modeled by Cole and others (1997) because faults of this orientation would be less likely to truncate the apex of the structural closures.
Hydrocarbon Charge
The principal petroleum source-rock unit present in the Thrust-Belt play is the Triassic and Jurassic Otuk Formation. The Otuk consists of shelfal facies that are the condensed, distal correlatives of both the Triassic Shublik Formation and the Jurassic and Early Cretaceous Kingak Shale, the major source rock units in the Ellesmerian sequence in northern NPRA (Figure ES2). Although the Otuk is significantly thinner than either the Kingak Shale or the Shublik Formation, it contains very rich petroleum source rocks, with TOC values as high as 38% (Lillis, this volume Chapter GC) in the Blankenship Member, the uppermost member of the Otuk and the correlative of the Kingak Shale. The Otuk is widespread in the northern part of the play area where it has a maximum thickness of about 295 ft (90 m), and is commonly structurally repeated. As a result of the thrusting, its net thickness is significantly higher than its stratigraphic thickness in some areas. The Otuk has an average TOC of more than 5% based on 76 measurements (Bodnar, 1984; Mull, written commun., 2000, 2001; USGS unpublished data). Vitrinite reflectance measurements from the Otuk and adjacent units in outcrop have Ro values between 0.6-0.9, indicating these rocks were never buried beyond in the oil window (Cole and others, 1997; Johnsson, 1999).
A petroleum source-rock unit in the Thrust-Belt play judged to be of secondary importance is the Mississippian and Pennsylvanian Kuna Formation, the distal, basinal correlative of the Lisburne Group (Figure ES2). The Kuna consists of up to 200 m of sooty, phosphatic black shale, dolomite, and chert. TOC values as high as 14-18% have been reported from the Kuna in the western Brooks Range (Werner, 1998, p. 8; Pratt and Werner, 2000; Banet and Evans, 2002). In the play area, Kuna-like shale in the upper part of the carbonate platform deposits of the Lisburne Group near its transition into the Kuna has yielded TOC values of 20.15% and 22% (P. Lillis, written commun. to J. Dumoulin, 2001, J. Dumoulin, written commun, 2002). Vitrinite reflectance measurements from the Kuna in outcrop near the Lisburne well yield Ro values of approximately 2.0, indicating that the Kuna is overmature in outcrop. The thermal maturity of the unit, however, decreases to values that are within the oil window locally
15
in the western part of the play area (J. Dumoulin, written commun., 2002). The Kuna has been thrust on to carbonate platform deposits of the Lisburne Group over large areas in the Thrust-Belt play.
Other possible source rock units in the Thrust-Belt play include Lower Cretaceous Brookian strata, including the Torok and Okpikruak formations (Bird, this volume Chapter GS). These units are very thick, with TOC values typically ranging from 0.5 to 1.5% in outcrop. Although higher TOC is possible in the Torok because it could contain strata correlative with the condensed shale of the GRZ (Houseknecht, this volume, Chapter BK), the Brookian units in the play area are mostly coarse-grained and unlikely to contain source rock strata. Most outcrops of Brookian units in the play area have Ro values that range from 0.6-0.9 (Cole and others, 1997; Johnsson, 1999), indicating that these rocks were never buried beyond the oil window.
Fractures and secondary porosity in the Lisburne Group are commonly observed to contain solid hydrocarbons. The solid hydrocarbons may have originated from Otuk Formation source rocks because the Otuk lies stratigraphically near the Lisburne Group and migration pathways for hydrocarbons expelled from the Otuk were probably short. Migration might have been enhanced by thrusting because the Otuk is commonly overthrusted by Lisburne Group strata. In addition, thrusts along bedding planes (footwall flats), which commonly reside at the top of the Blankenship Member, may have provided migration pathways for hydrocarbons expelled at the time of thrusting.
Source rock strata in the Kuna Formation, on the other hand, are typically overmature and have mostly been removed by erosion. These strata probably were important source rocks primarily during the Neocomian phase of thrusting when the rocks might have passed through the oil window during tectonic burial. Hydrocarbons expelled at this time could have moved along fault-controlled pathways into carbonate reservoirs in the Lisburne Group. Solid hydrocarbons collected from some outcrops display geochemical affinity to Lisburne oils (P. Lillis, written commun. to J. Dumoulin, 2001), supporting the interpretation that they were derived from Kuna Formation and Lisburne Group sources.
Strata in the Brookian sequence may also have served as a hydrocarbon source for this play. This would depend on whether hydrocarbon-rich condensed facies were present in the play area and were placed in structural positions below reservoir strata by thrust faults active in the Tertiary so that migration pathways would be favorable.
Although source-rock strata in the Otuk Formation are oil prone (Lillis, this volume Chapter GC) and the Otuk is in the oil window in outcrops in most of the northern part of the play, the Thrust-Belt play is regarded as dominantly a gas play. This is because (1) the bottom of the oil window is located at moderate depths (7000 ft at Lisburne well) and there is little likelihood of less mature rocks being present beneath thrust faults at depth, (2) thrusting in the early Tertiary probably released significant volumes of hydrocarbons from accumulations in structurally lower, thermally overmature traps originally formed during Neocomian generation and thrusting, and (3) possible source rocks in Brookian sequence are deltaic strata and thus would most likely be gas prone. Stable isotopic data from calcite veins in Cretaceous and older rocks in the Lisburne-1 well area indicate that some fractures experienced high fluxes of methane during deformation (Shelton and others, 1994). These data support the interpretation that gas has migration has occurred in the play area.
16
Timing An early episode of hydrocarbon generation probably occurred in the Neocomian
when Kuna and Otuk formation source rocks were tectonically buried by thrusting in the Brooks Range. Hydrocarbons generated at this time would have migrated along thrust faults into actively forming anticlines in a regional duplex of the Lisburne Group strata formed in the frontal part of the orogen. Although thrusting ceased near the end of the Neocomian, generation probably continued through the late Early Cretaceous due to stratigraphic burial beneath voluminous Albian and Cenomanian strata in the Colville basin. This is supported by estimates for peak oil generation of Triassic, Jurassic and Early Cretaceous source rocks beneath the Colville basin at ~100-90 Ma (Burns and others, 2002). As sedimentation continued, higher parts of the structural and stratigraphic section in the Thrust-Belt play began generating. Hydrocarbons generated during this period probably filled structural and stratigraphic closures that were located near the generating source rocks.
Source rocks presently at the surface in the Thrust-Belt play were in the oil window and may have generated hydrocarbons as late as the early Tertiary when sedimentary burial ended due to the onset of thrusting. Hydrocarbons expelled from these rocks near or at the time of thrusting probably migrated into nearby antiforms that were formed by the thrusting. These are the most prospective traps for oil in the play. At depth, hydrocarbon charge probably was overmature by the time of renewed thrusting in the early Tertiary because most of the early-formed traps were buried by thick successions of Colville Basin deposits subsequent to their formation. As a result, the thrusting in the early Tertiary probably disrupted traps formed in Neocomian to Late Cretaceous time, liberating voluminous amounts hydrocarbons. For this reason, the hydrocarbon charge in the early Tertiary probably consisted predominantly of remigrated gas. The remigrated gas probably flooded migration pathways available at the time and constituted the principal charge for structural traps formed by thrust-related folding in the early Tertiary.
Thrust-Belt Play Attributes
Tables ES1 through ES3 summarize the play attributes used as assessment input for this play. All input values are conditional for accumulation of the minimum size considered in this assessment (50 mmboe in-place). A brief explanation of the origin of the input values for key attributes is provided below.
Volumetric and spatial distribution parameters
The volumetric and spatial distribution input values for both oil and gas accumulations in the Thrust-Belt play are shown in Table ES1. These parameters assume that dolostone of the middle unit of the Lisburne Group of Dumoulin and Harris (1993) is the primary reservoir unit in the play.
17
Table ES-1. Probability distribution of volumetric and spatial distribution parameters for oil and gas in Thrust-Belt Play. LTP is the left truncation point. Attribute Units Probability of attribute greater than: LTP 50 5 Max Other Net Reservoir Thickness (oil) feet 40 100 350 700 Net Reservoir Thickness (gas) feet 40 150 450 900 Area of Closure (oil) 1000 acres 1 4 10 12 Area of Closure (gas) 1000 acres 1 4 10 35 Trap Fill (oil) percent 30 40 80 100 Trap Fill (gas) percent 40 75 85 100 Porosity (oil) percent 4 5 8 13 Porosity (gas) percent 2 5 8 13 Hydrocarbon Pore Volume (oil) percent 3 4 7 12 Hydrocarbon Pore Volume (gas) percent 1 4 7 12 Trap Depth (oil) 1000 ft 1 5 9 10 Trap Depth (gas) 1000 ft 1 15 23 28 Number of Prospects 20 35 50 80 Porosity - Water Saturation Product (oil) percent 1Porosity - Water Saturation Product (gas) percent 1
Net reservoir thickness —The net reservoir input values were estimated by evaluating
the following independent factors: (1) the thickness of the middle unit of the Lisburne Group of Dumoulin and Harris (1993), (2) percent of reservoir quality strata that may be expected to be present in the middle unit, and (3) the number of repetitions of the Lisburne Group that might be expected to be present in typical closure. The thickness of the middle unit of the Lisburne is known to vary from 262 to 394 ft (80 to 120 m) in outcrop in the eastern part of the play. Oil reservoir quality strata in the middle unit consist of dolostones with porosities above 4% and compose about 5% of the middle unit of the Lisburne in the Lisburne-1 well. These strata might be expected to compose up to as much as 50% of the stratigraphic section of the middle unit, although the net thickness of reservoir strata might vary from one thrust imbricate to another within a single closure as well as from one closure to another because of facies, diagenetic, fracturing and/or other factors. Higher net reservoir thicknesses were allowed for gas reservoirs because they are considered viable at porosities as low as 2% (see below). Within a single antiform, the Lisburne Group could be expected to be repeated up to 10 times, with 5 repetitions, as found in the Lisburne-1 well, being not uncommon.
Various combinations of these factors were examined. From this analysis it was concluded that the most likely net reservoir thicknesses for an oil accumulation in a structural closure in this play will be about 100 feet, with as much as 700 ft of reservoir strata possible. For a gas accumulation, a typical net reservoir thickness is expected to be 150 ft, with a maximum of 900 ft of reservoir possible in the play.
Area of Closure —The area of closure input values were determined by evaluating
the area of known four-way closures in the play area and by applying an empirically-determined length-to-width aspect ratio to two-way closures observed in the seismic reflection data in the play area.
18
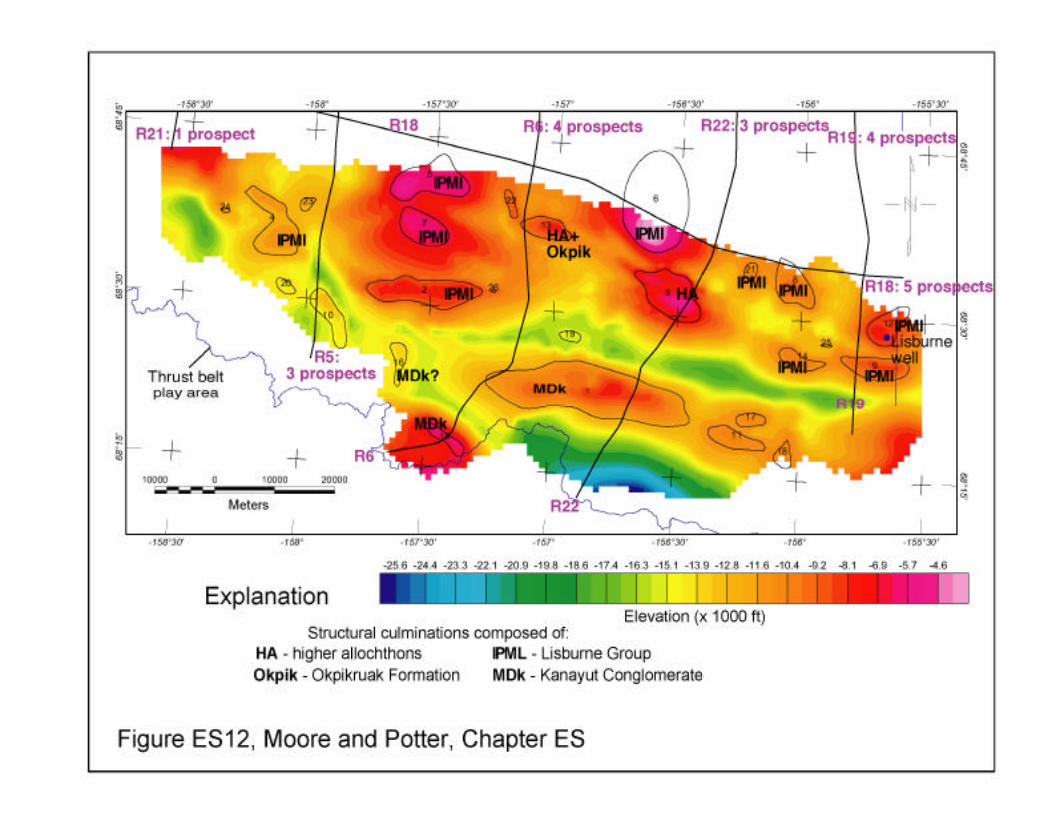
Four-way closures in the play area were identified from the Intermediate Composite Features (ICF) map (Tetra Tech, 1982), recently recompiled and digitized by Saltus and others (this volume, Chapter SM, map HRZICF) for this assessment (Figure ES11). Although the closures were originally interpreted as highs in seismic basement (Tetra Tech, 1982), we have examined the seismic reflection data, identified the mapped reflector, and reinterpreted its stratigraphic position based on its seismic character, outcrop information, and structural position (Figure ES12). Of the mapped closures, we identified eight as being antiformal culminations of Lisburne Group strata. The areas of these closures were calculated by computer and range from 1,250 to 16,500 acres and average 9,000 acres (Saltus, written comm., 2001).
Two-way closure was identified at an additional 15 antiformal culminations of Lisburne Group strata on the grid of reprocessed seismic reflection data in the play area. On dip lines, the width of closures ranged between 6,000 ft (1 829 m) to over 28,000 ft (8,534 m). One strike-line contained closures that were as long as 44,000 ft (13,411 m). Closures were observed at all depths in the seismic data, but the largest closures are at depths of 15,000 ft (4,572 m) to 30,000 ft (9,144 m) along the northern margin of the play area (Figure ES7). The area of the closures were estimated from their horizontal dimensions measured on the seismic data. An average length-to-width aspect ratio of 2.5 was determined from antiformal culminations of Lisburne Group strata identified on geologic maps, from the ICF map, and in one case from the seismic data. Applying this aspect ratio and assuming an elliptical shape, the areas of closure were determined to range from 1,000 acres to as much as 35,000 acres, although only three of these yielded areas above 9,000 acres. Because the largest closures are some of the deepest observed in the play area, larger closures are expected to contain only gas, whereas oil would be located at shallower depths where smaller closures are predominant (e.g. (Figure ES8).
We applied a +0.5 correlation between area of closure and net reservoir thickness for this play. Although Saltus and others (Chapter SM) determined a very strong positive correlation between the area and height of closures defined by the Tetra Tech (1982) this does not translate into a direct dependency between area of closure and net reservoir thickness for this play. This is because the distribution and geometry of the reservoir facies are controlled principally by attributes that may have local extent, including diagenetic alteration and fault-related fracturing, rather than by intitial depositional factors such as composition and grain size that would be expected to have widespread distribution and thus strong positive correlation with the size of the structure. Nonetheless, larger structural culminations qualitatively would be expected to contain more repetitions of the Lisburne Group and consequently have a greater likelihood of containing a larger net thickness of reservoir facies. The +0.5 correlation allows for some correlation of area of closure with net reservoir thickness as well as acknowledging that distribution patterns of reservoir facies within the structures may be complex and controlled in part by factors unrelated to the area of closure.
Porosity and hydrocarbon pore volume — Calculations from well logs indicate the
middle unit of the Lisburne Group in the Lisburne-1 well contains overall low porosity, averaging 4.5% porosity with a few intervals having 6 to 8% porosity (Legg, 1983). One 10-ft-thick interval was calculated to have porosity above 13% and a 17 ft-thick interval tested formation water (Legg, 1983). Overall porosity in the middle unit of the Lisburne
19
was highest in the uppermost imbricate, and decreased downward through successively deeper horses in the well, possibly due to local changes in facies, diagenesis, and/or fracturing in the unit. These porosity calculations are in good agreement with Boyles Law measurements of three samples collected by I.L. Tailleur from outcrops at Lisburne Ridge (Dumoulin, written comm., 1995), about 40 km northwest of the Lisburne well. Two of the samples had 2.6-4.1% porosity; the third had 9.8-10.4% porosity. Similar amounts of porosity were estimated by Dumoulin (written comm., 1995) from thin sections from the middle unit in the Lisburne well and from outcrops in eastern part of the play area. She estimated porosity to be a few percent in typical thin sections near the Lisburne well and 1 to15% in more westerly outcrops.
On the basis of this information, the average porosity of reservoir units in a typical closure in the Thrust-Belt play was estimated to be 5%, with a few (F05 value) closures having reservoirs averaging as much as 8% porosity, and the maximum being 13%. The range of porosities found in oil and gas accumulations are estimated to be identical. Oil and gas input values differ only in the lower truncation point for gas which reflect the possibility that gas reservoirs might be viable at lower porosities because gas has lower viscosity than oil. The value for water saturation is based on petrophysical properties of analogues and hydrocarbon pore volumes are calculated by subtraction.
We applied a –0.5 correlation between porosity and net reservoir thickness for this play. This is because we consider it unlikely that the thickest reservoirs specified under “net reservoir thickness” will be characterized by the maximum or F05 maximum porosity values. Reservoirs that are many hundreds of feet thick within large anticlinal traps would be expected to be characterized by lower average porosities. Specification of a –0.5 correlation will produce a preferential matching of lower porosity values with high thickness values, while still allowing the possibility of some thick reservoirs with high average porosities.
Trap fill— Input values for trap fill are typical for accumulations found in Thrust-
Belts where there is good charge potential and small trap size (Perry and others, 1999). The input values for gas are increased over those for oil because the lower viscosity of gas would allow porous strata with low permeabilitiy to be charged and, probably more importantly, gas is expected to be more abundant than oil in this play.
Trap depth — Closures were observed on seismic reflection data at a range of depths
from 1,000 ft (305 m) to as much as 28,000 ft (8,534 m). Input values for oil, however, have a maximum depth of 10,000 ft (3,048 m) because thermal data show strata are overmature below that depth.
Number of prospects — A total of 28 antiformal culminations of Lisburne Group
carbonate strata with either 2-way or 4-way closure were identified in the eastern part of the play area where seismic coverage is available. More extensive seismic studies may show that some of the antiforms with 2-way closure do not have 4-way closure. On the other hand, closures smaller than the spacing of the seismic grid (nominally 20 mile x 20 mile spacing are possible within this area.
In the western half of the play area, outcrops of the Lisburne Group are limited and the presence of the Lisburne in the subsurface cannot be evaluated because of a lack of
20
seismic data. Moreover, it is unclear whether antiformal culminations that might contain accumulations of hydrocarbons are present in that area. We have estimated that a minimum of 20 prospects with 4-way closure are present within the play area. If the western half of the play area contains antiformal culminations of Lisburne Group carbonate strata similar those observed in the eastern half, we estimate that as many as 80 prospects might be present. Hydrocarbon parameters
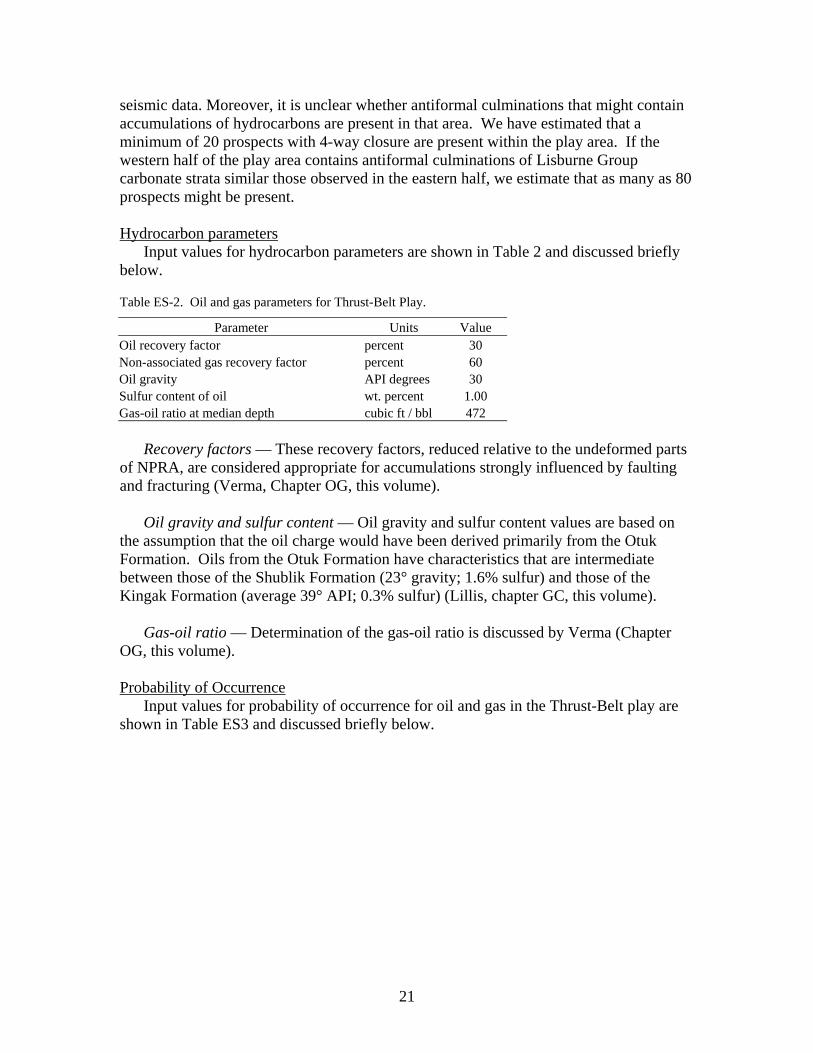
Input values for hydrocarbon parameters are shown in Table 2 and discussed briefly below. Table ES-2. Oil and gas parameters for Thrust-Belt Play.
Parameter Units Value Oil recovery factor percent 30 Non-associated gas recovery factor percent 60 Oil gravity API degrees 30 Sulfur content of oil wt. percent 1.00 Gas-oil ratio at median depth cubic ft / bbl 472
Recovery factors — These recovery factors, reduced relative to the undeformed parts of NPRA, are considered appropriate for accumulations strongly influenced by faulting and fracturing (Verma, Chapter OG, this volume).
Oil gravity and sulfur content — Oil gravity and sulfur content values are based on
the assumption that the oil charge would have been derived primarily from the Otuk Formation. Oils from the Otuk Formation have characteristics that are intermediate between those of the Shublik Formation (23° gravity; 1.6% sulfur) and those of the Kingak Formation (average 39° API; 0.3% sulfur) (Lillis, chapter GC, this volume).
Gas-oil ratio — Determination of the gas-oil ratio is discussed by Verma (Chapter
OG, this volume).
Probability of OccurrenceInput values for probability of occurrence for oil and gas in the Thrust-Belt play are
shown in Table ES3 and discussed briefly below.
21
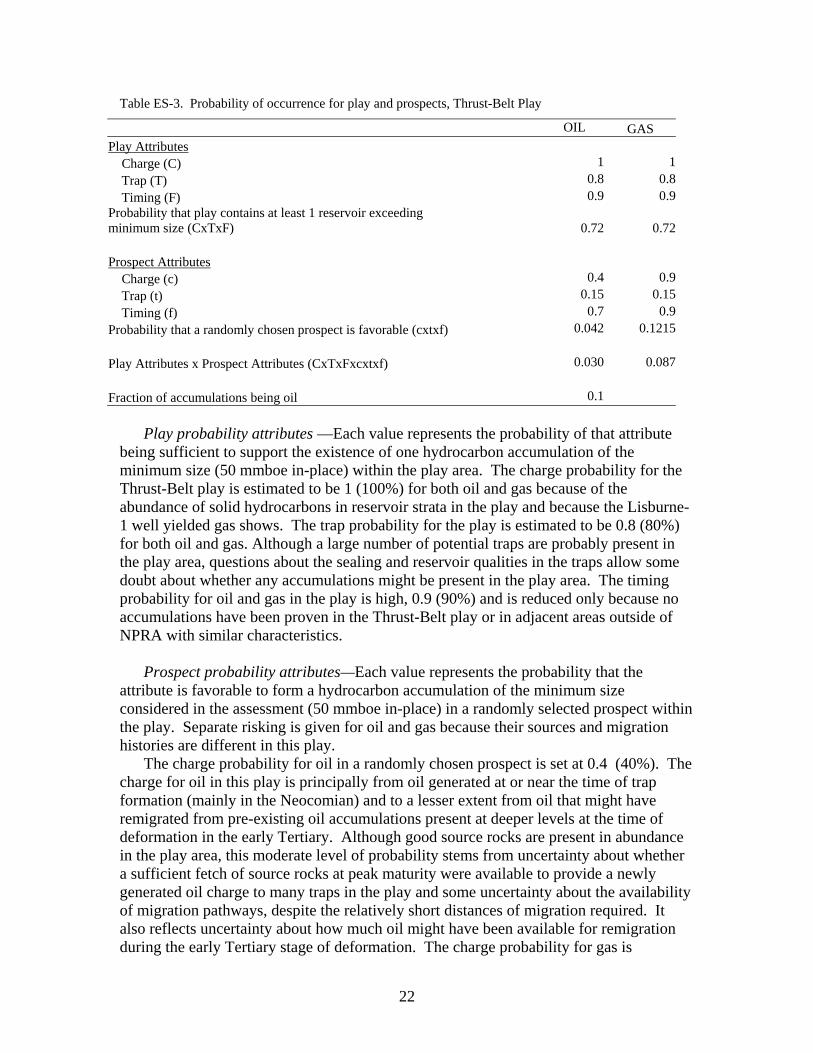
Table ES-3. Probability of occurrence for play and prospects, Thrust-Belt Play OIL GAS Play Attributes Charge (C) 1 1 Trap (T) 0.8 0.8 Timing (F) 0.9 0.9Probability that play contains at least 1 reservoir exceeding minimum size (CxTxF) 0.72 0.72 Prospect Attributes Charge (c) 0.4 0.9 Trap (t) 0.15 0.15 Timing (f) 0.7 0.9Probability that a randomly chosen prospect is favorable (cxtxf) 0.042 0.1215 Play Attributes x Prospect Attributes (CxTxFxcxtxf) 0.030 0.087 Fraction of accumulations being oil 0.1
Play probability attributes —Each value represents the probability of that attribute
being sufficient to support the existence of one hydrocarbon accumulation of the minimum size (50 mmboe in-place) within the play area. The charge probability for the Thrust-Belt play is estimated to be 1 (100%) for both oil and gas because of the abundance of solid hydrocarbons in reservoir strata in the play and because the Lisburne-1 well yielded gas shows. The trap probability for the play is estimated to be 0.8 (80%) for both oil and gas. Although a large number of potential traps are probably present in the play area, questions about the sealing and reservoir qualities in the traps allow some doubt about whether any accumulations might be present in the play area. The timing probability for oil and gas in the play is high, 0.9 (90%) and is reduced only because no accumulations have been proven in the Thrust-Belt play or in adjacent areas outside of NPRA with similar characteristics.
Prospect probability attributes—Each value represents the probability that the
attribute is favorable to form a hydrocarbon accumulation of the minimum size considered in the assessment (50 mmboe in-place) in a randomly selected prospect within the play. Separate risking is given for oil and gas because their sources and migration histories are different in this play.
The charge probability for oil in a randomly chosen prospect is set at 0.4 (40%). The charge for oil in this play is principally from oil generated at or near the time of trap formation (mainly in the Neocomian) and to a lesser extent from oil that might have remigrated from pre-existing oil accumulations present at deeper levels at the time of deformation in the early Tertiary. Although good source rocks are present in abundance in the play area, this moderate level of probability stems from uncertainty about whether a sufficient fetch of source rocks at peak maturity were available to provide a newly generated oil charge to many traps in the play and some uncertainty about the availability of migration pathways, despite the relatively short distances of migration required. It also reflects uncertainty about how much oil might have been available for remigration during the early Tertiary stage of deformation. The charge probability for gas is
22
significantly higher, 0.9 (90%), because it is very likely that a large gas charge was available to feed most prospects. Principal sources for the gas structural disruption of previously formed gas accumulations and from oil accumulations that were cracked to gas due to sedimentary burial and maturation in the late Early and Late Cretaceous. In addition, gas generated from source rocks that reached maturation at the time of trap formation due to thrust loading in the early Tertiary was probably available at many levels in the play.
The trap probabilities for accumulations at an individual prospect are set at a low probability—0.15 (15%)—for both oil and gas. Although the Lisburne-1 well shows that adequate reservoir facies are possible in the play, it is uncertain whether the amount and quality of reservoir strata present in a randomly chosen prospect will be sufficient to hold the minimum-sized accumulation. In addition, there is a substantial risk that stratigraphic seals at many prospects were disrupted by faulting.
The timing for gas is assigned a high probability value of 0.9 (90%). Our play concept is that the prospects were fed by abundant remigrated gas liberated by destruction of older traps at depth by faults active during early Tertiary deformation and by late-stage generation from source rocks. Because migration to higher structural levels is thought to have occurred along some of the same faults that formed the traps, the timing should be excellent at most prospects. The timing for oil is set at a somewhat lower level of 0.7 (70%). This level of probability reflects some uncertainty about the timing of any remigration of oil that might have occurred into newly formed traps.
Fraction of accumulations being oil— This value is set at 0.1 (10%) for this play.
This low value results from the overall high thermal maturity in the play area, which allows only relatively shallow prospects (<10,000 ft in depth) to be in the oil window and thus be prospective for oil.
Aggregate risking probabilities—The combination of the play attribute probabilities
for charge, trap, and timing indicates that there is a 72 percent chance that at least one hydrocarbon accumulation of the minimum size (50 mmboe in-place) exists in the play. The combination of play and prospect probabilities indicates there is an overall chance that 3 percent of the prospects in the play will contain at least 50 mmb of oil and a 9 percent chance that they will contain at least 50 mmboe of gas.
Thrust-Belt Play Results
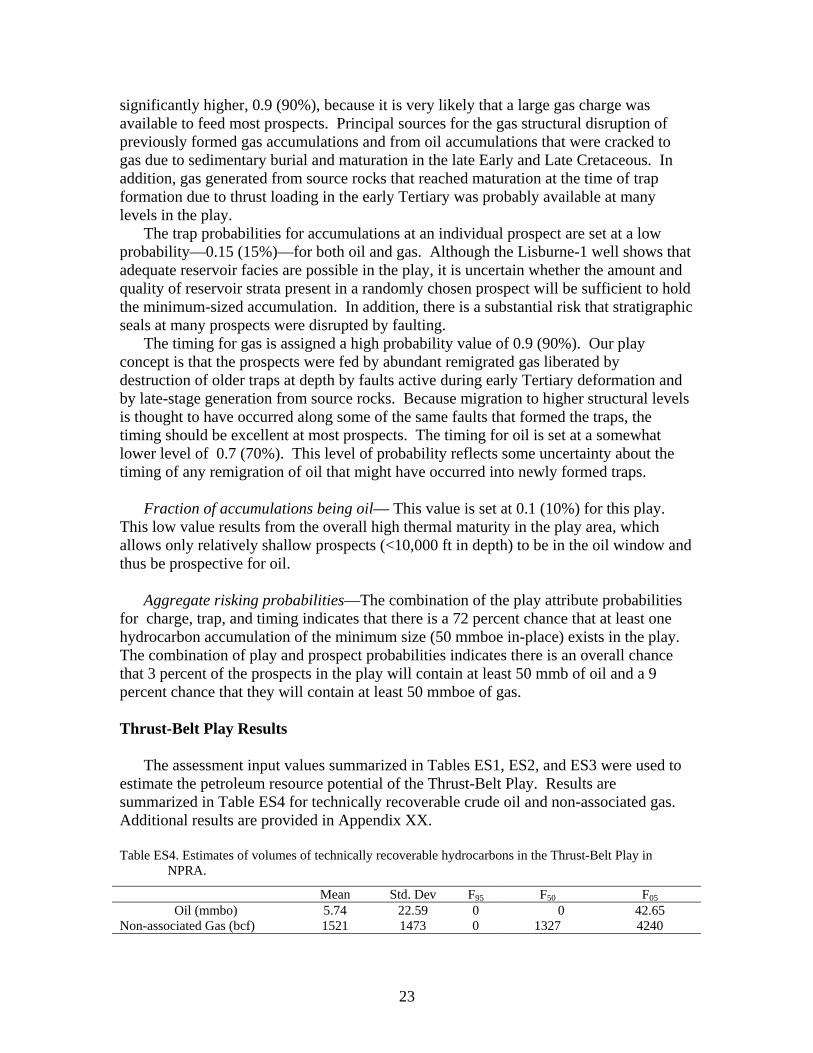
The assessment input values summarized in Tables ES1, ES2, and ES3 were used to estimate the petroleum resource potential of the Thrust-Belt Play. Results are summarized in Table ES4 for technically recoverable crude oil and non-associated gas. Additional results are provided in Appendix XX. Table ES4. Estimates of volumes of technically recoverable hydrocarbons in the Thrust-Belt Play in
NPRA. Mean Std. Dev F95 F50 F05
Oil (mmbo) 5.74 22.59 0 0 42.65 Non-associated Gas (bcf) 1521 1473 0 1327 4240
23
It is estimated that the Thrust-Belt play contains at least 5.7 million barrels of
technically recoverable oil and 1.5 trillion cubic feet of technically recoverable, non-associated natural gas, with both values representing the mean estimate (expected value).
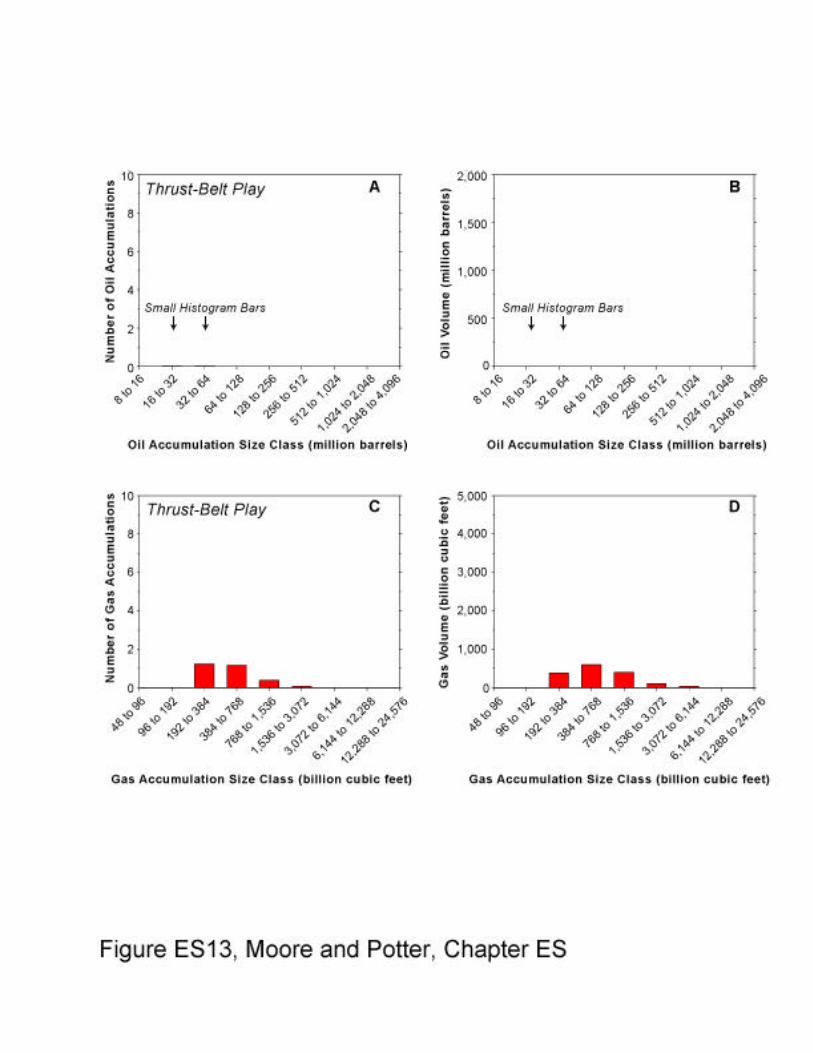
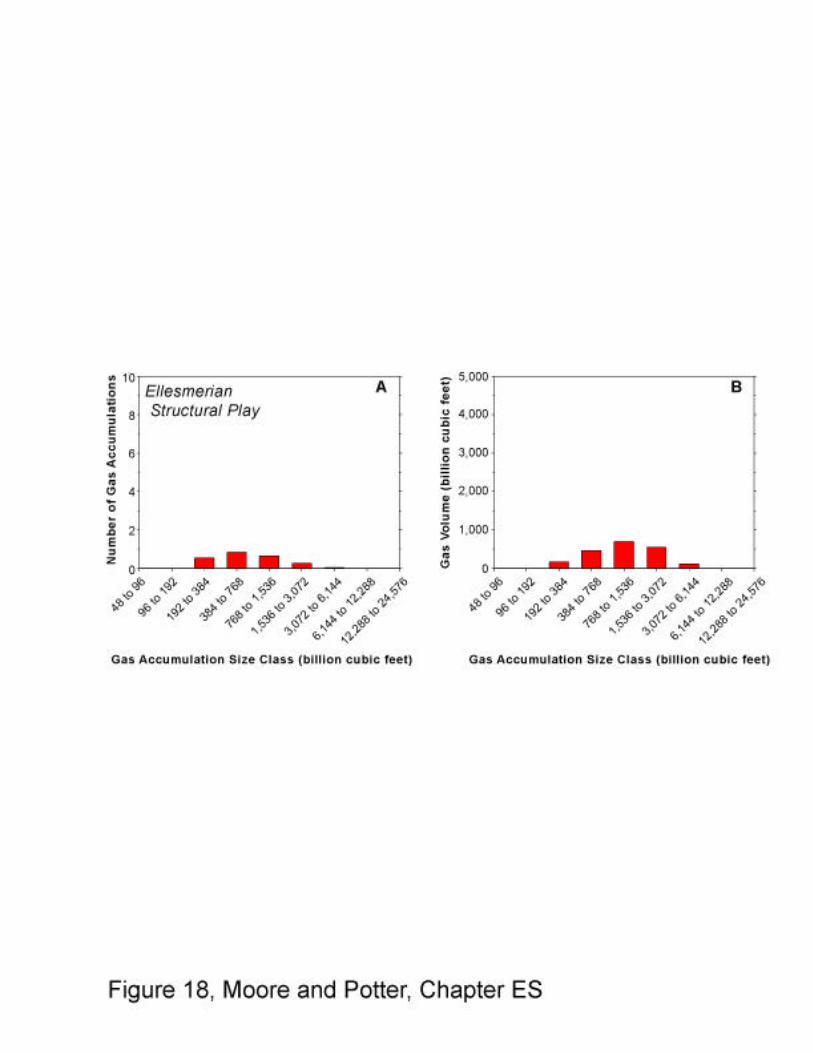
The oil and gas resources are estimated to found in accumulations of various size, as illustrated in Figures ES13A-D. Figure ES13A shows that there is an extremely small probability of the existence of one or more oil accumulations between 8 and 1024 mmbo in size within the Thrust-Belt Play. Figure ES13B shows that most of the volume of oil within this play is expected to be found in accumulations between 16 to 64 mmbo in size.
It is estimated that there is approximately one natural gas accumulation between 192 and 384 bcf, and one between 384 and 768 bcf in this play (Figure ES13C). There is a lesser probability of there being one accumulation between 768 and 1536 bcf and an even smaller probability of there being one accumulation between 1,536 to 3,072 bcf. Figure ES13D shows that the largest volume of gas in the play is expected to be found in the class of accumulations that range from 384 to 768 BCF in size.
In addition to volumes of crude oil and non-associated gas, this play also contains relatively small volumes of associated natural gas and natural gas liquids, and those values are reported in Appendix XX. ELLESMERIAN STRUCTURAL PLAY Introduction
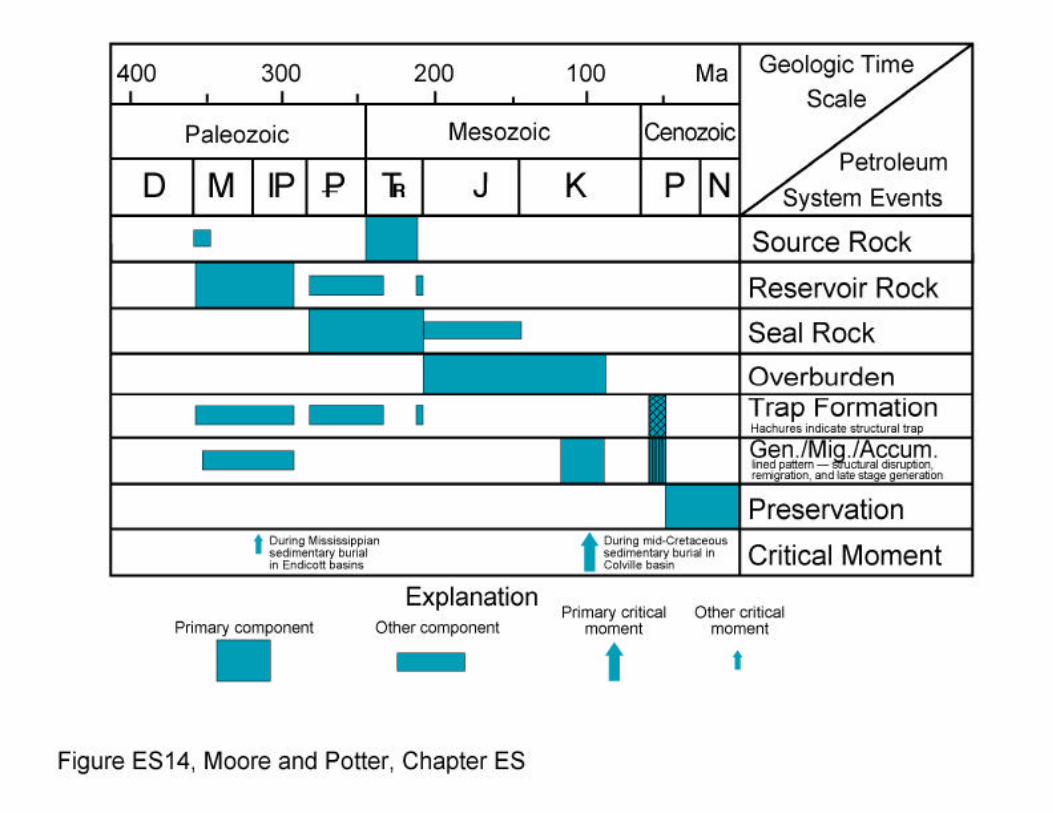
The Ellesmerian Structural play is situated to the north of the Thrust-Belt play (Figure ES1), and is defined by structural closures developed in autochthonous (or parautochthonous) rocks of the Ellesmerian sequence (Figure ES3). The northern boundary of this play is defined by the northern limit of significant fold-thrust deformation in the Ellesmerian sequence. The southern boundary of the Ellesmerian Structural play corresponds to the northern boundary of the Thrust-Belt play (Figure ES 1). The play area of the Ellesmerian Structural play is 8,125,054 acres of which 8,113,747 acres are Federal lands and 11,307 acres are Native holdings. The petroleum system for the Ellesmerian Structural play is summarized in an Events Chart (Magoon and Dow, 1994) in Figure ES14.
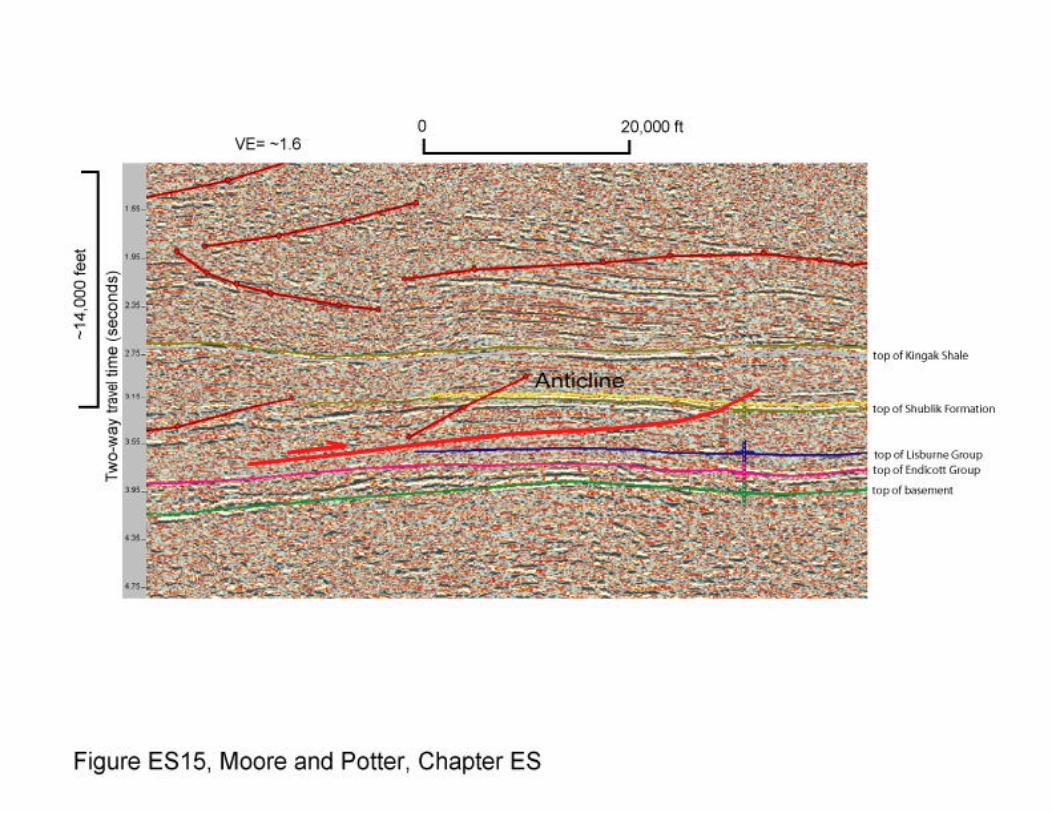
Although the principal regional detachment beneath the Brooks Range foothills and southern coastal plain lies in the Jurassic and Lower Cretaceous Kingak Shale, subsidiary detachments are present at deeper levels in the Mississippian through Triassic section (Figure ES3). This part of the section is largely autochthonous but the subsidiary detachments show that relatively small amounts of strain are distributed through the section below the primary detachment, causing the strata to be parautochthonous. The subsidiary detachments may be located in the Mississippian Kayak Shale, clastic or argillaceous intervals in the Mississippian to Permian Lisburne Group, the Permian-Triassic Sadlerochit Group, and the Triassic Shublik Formation. The vast majority of prospects in the Ellesmerian Structural play correspond to anticlinal closures developed above thrust faults that sole into these subsidiary detachment surfaces (Figure ES15).
24
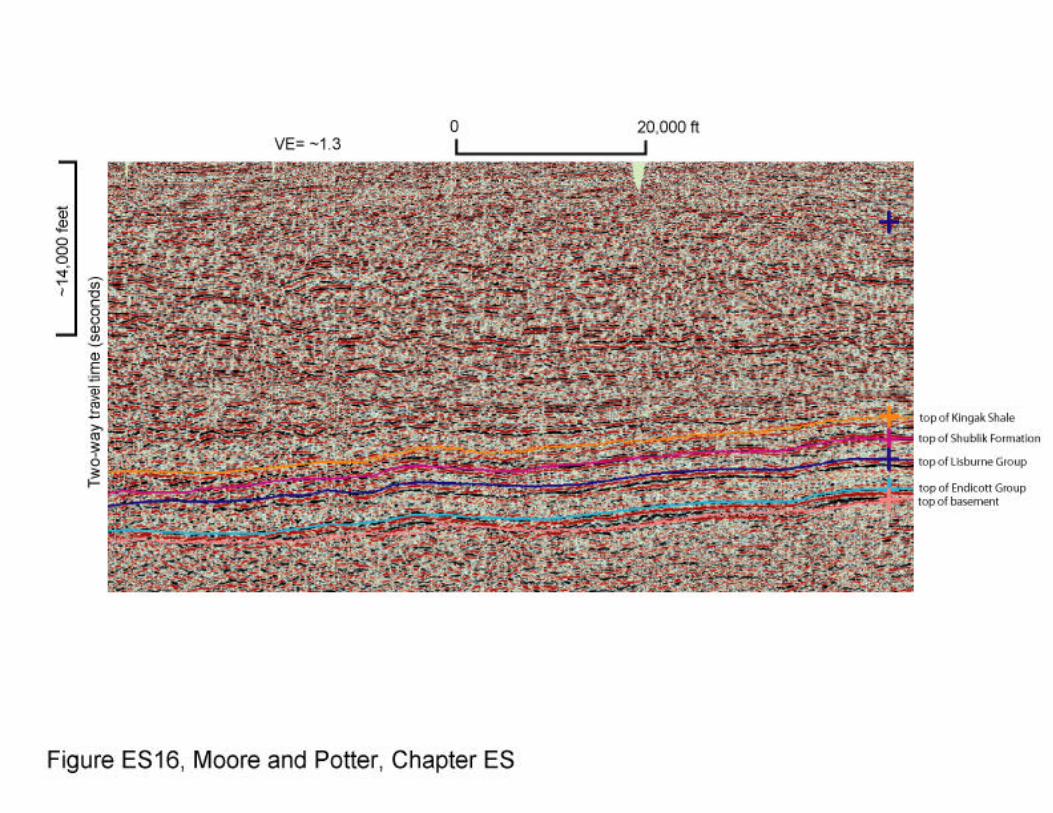
Other prospects correspond to basement-cored anticlines (Figure ES16), possibly controlled by poorly defined reverse faults or thrusts whose origin are uncertain.
This is one of the deepest plays considered in the NPRA assessment because it is located in strata of Ellesmerian sequence beneath the thickest part of the Brookian sequence in the axial region of the Colville basin. Trap depths range from 15,000 ft (4,572 m) in the northern part of the play area to 26,000 ft (7,927 m) in the southern part of the play area because of the gentle regional southward dip of the Ellesmerian sequence. There are no well penetrations or exposures of this play, so detailed physical properties and thermal history of reservoir rocks are poorly understood.
The Kavik and Kemik gas fields, over 200 km east of NPRA in the eastern part of the North Slope, are analogs for the Ellesmerian Structural play, as they involve parautochthonous Ellesmerian (Sadlerochit Group, Shublik Formation, and Sag River Sandstone) reservoirs in thrust-related structural traps. However, these fields do not demonstrate the viability of the Ellesmerian Structural play in NPRA because there are dramatic regional variations in the presence and quality of reservoir units in the Ellesmerian sequence (for example, significant reduction in the thickness and grain size of clastic units). In addition, the basement-involved structures at the Kavik and Kemik gas fields display a different structural style (for example, amplitude, closure area, and severity of internal faulting) than that found in NPRA, and the age of the Kavik and Kemik structures is considerably younger than those being considered in this play. Reservoir
Possible reservoir units in this play are present throughout the Ellesmerian sequence, including the Mississippian Kekiktuk Conglomerate of the Endicott Group, the Mississippian and Pennsylvanian carbonate platform deposits of the Lisburne Group, the Permian Echooka Formation and Triassic Ivishak Formation (Sandstone) of the Sadlerochit Group, and the Sag River Sandstone (Figure ES2). As discussed below, none of these units are likely to be ideal reservoirs, and the presence of some of them within the play area is questionable.
The Kekiktuk Conglomerate has variable thickness in the play area because it thickens markedly in local extensional basins. This unit is present only at depths well in excess of 15,000 ft (4,572 m) in the play area, and is expected to be very tight and well-cemented at these depths similar to that observed in the Inikok well. The carbonate rocks of the Lisburne Group may locally contain dolostones with reservoir-quality porosity, but reservoirs in this unit will primarily be in areas where porosity has been enhanced by fracturing. Sandstones (e.g., Ivishak and Echooka formations) that are present in the Sadlerochit Group in northern NPRA appear to “shale out” in, or north of, the Ellesmerian Structural play area, as demonstrated by the virtual absence of these sandstone in the Tunalik 1 and Inigok 1 wells (Bird, 1988a, b; Kirschner and Rycerski, 1988). The Sag River Sandstone may not have been deposited in the play area, or it may have been exceedingly thin (Bird, 1988b). In any case, at the depths applicable to this play (minimum depth 15,000 ft; 4,572 m), porosity values are expected to be low.
Trap
The prospects in this play are in sandstone and carbonate reservoirs, in anticlinal traps sealed by shaley or siliceous intervals that are draped over the tops of the structures.
25
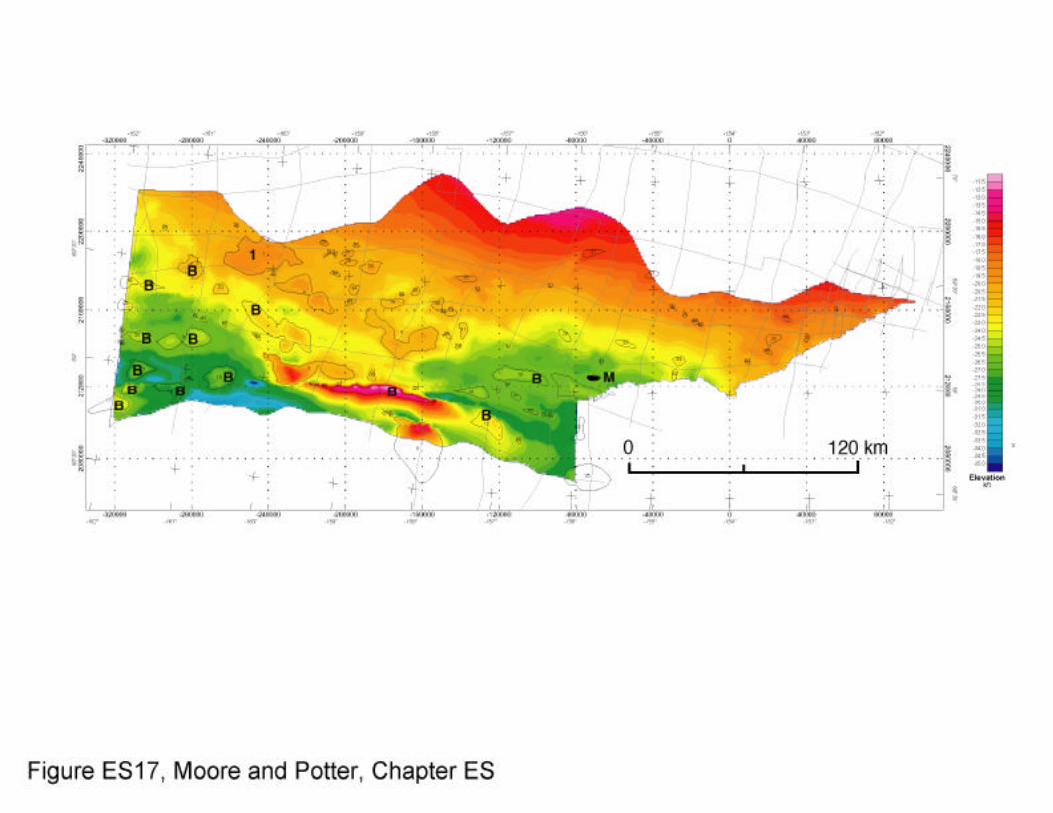
Our evaluation of Ellesmerian structural closures using regional seismic reflection lines indicates that many identified closures are breached by numerous closely spaced faults. Figure ES17 shows Saltus and others’ (Chapter SM, this volume) analysis of closures on the Tetra Tech (1982) “Sag River” horizon (quotes are here used to indicate reflector has been mapped beyond the likely depositional extent of the designated stratigraphic unit). This diagram contains annotations describing the nature of faulting observed for a large number of the closures, particularly in the southern and western parts of the play area. The large closure labeled “1” on Figure ES17, however, appears to be nearly undisturbed by faulting based on our interpretation of three regional seismic lines that cross this structure. It is an example of a very large structure that may contain one large prospect or several smaller fault-bounded prospects. At 115,000 acres, it is the largest closure identified for this play by Saltus and others (Chapter SM).
Charge
Possible source rocks include coal-bearing parts of the Kekiktuk Conglomerate, organic-rich intervals in the Lisburne Group, and the Shublik Formation. Some of the structures in this play involve thrust juxtaposition of possible reservoir units in the deeper parts of the Ellesmerian sequence against the Shublik Formation, and in these cases the Shublik is a viable source. The Kingak Shale is not juxtaposed against the reservoir rocks because it lies at a structurally higher level and thus is not considered to be a likely source for hydrocarbons in this play.
The great depth of this play indicates strongly that it lies in the gas window. Any pre-existing oil is likely to have been cracked to gas, and any hydrocarbons generated during thrusting, or subsequent to thrusting, are likely to be gas. The regional occurrence of overpressuring in southern NPRA (P. Nelson, oral commun., 2001) strongly suggests that a gas charge would be present through much of this play. For this reason, the play is assessed only for accumulations of gas. Timing
The anticlinal closures in this play were almost certainly formed during the early Tertiary, with the peak of deformation at about 60 Ma, and deformation possibly continuing until about 45 Ma (O’Sullivan and others, 1997). While this deformation postdates the primary phase of petroleum generation and migration in the mid-Cretaceous, it is highly likely that continued generation of gas and cracking of oil to gas occurred during the formation of these structures. In addition, the faults and folds that produced the structural traps in this play probably broke or disrupted pre-existing stratigraphic traps, allowing remigration of early-formed hydrocarbons. For this reason, timing is considered favorable for trapping of gas.
26
Ellesmerian Structural Play Attributes Tables ES5 and ES6 summarize the play attributes used as assessment input for this
play. All input values are conditional for accumulation of the minimum size considered in this assessment (50 mmbo in-place). A brief explanation of the origin of the input values for key attributes is provided below.
Volumetric and spatial distribution parameters
The volumetric and spatial distribution input values for gas accumulations in the Ellesmerian Structural play are shown in Table ES5.
Net Reservoir Thickness —This play was evaluated for two types of reservoirs: sandstone reservoirs (Kekiktuk Conglomerate, Sadlerochit Group, and perhaps the Sag River Sandstone, if present) and carbonate reservoirs (Lisburne Group). The net reservoir thicknesses for sandstone reservoirs are expected to be low because: (1) the great depth of the play should result in lower porosities, making few sandstones viable as reservoirs, (2) sandstone is scarce in the Sadlerochit Group because of the great distance of the play from the source area of this unit, and (3) the location of the play is at or beyond the depositional pinchout of the Sag River Sandstone. The thicknesses of the carbonate reservoirs are a function of the thickness of porous dolostone present in the Lisburne in the play area and are anticipated to be similar to those in the Lisburne South stratigraphic play (Bird and Nelson, this volume, Chapter LB), which adjoins the Ellesmerian structural play to the north.
The reservoir thicknesses estimated in Table ES5 represents sums of sandstone and carbonate reservoirs possible in prospects in the play. Because the net thicknesses of sandstone reservoirs are expected to be low and because the Lisburne Group carbonate rocks in the play area are quite thick, the net reservoir thicknesses are expected to be dominated by those of the Lisburne Group. Thus, the lower values (LTP, 50, and 5) shown in Table ES5 are similar to those estimated for the Lisburne South stratigraphic play (Bird and Nelson, this volume, Chapter LB). The maximum value (600 ft), however, is significantly higher than the maximum for the Lisburne South play (300 ft), reflecting the small possibility that sandstone reservoirs might provide a significant additional contribution to the net reservoir thickness and/or that the reservoir thicknesses might have been significantly increased due to fault-related fracture enhancement.
27
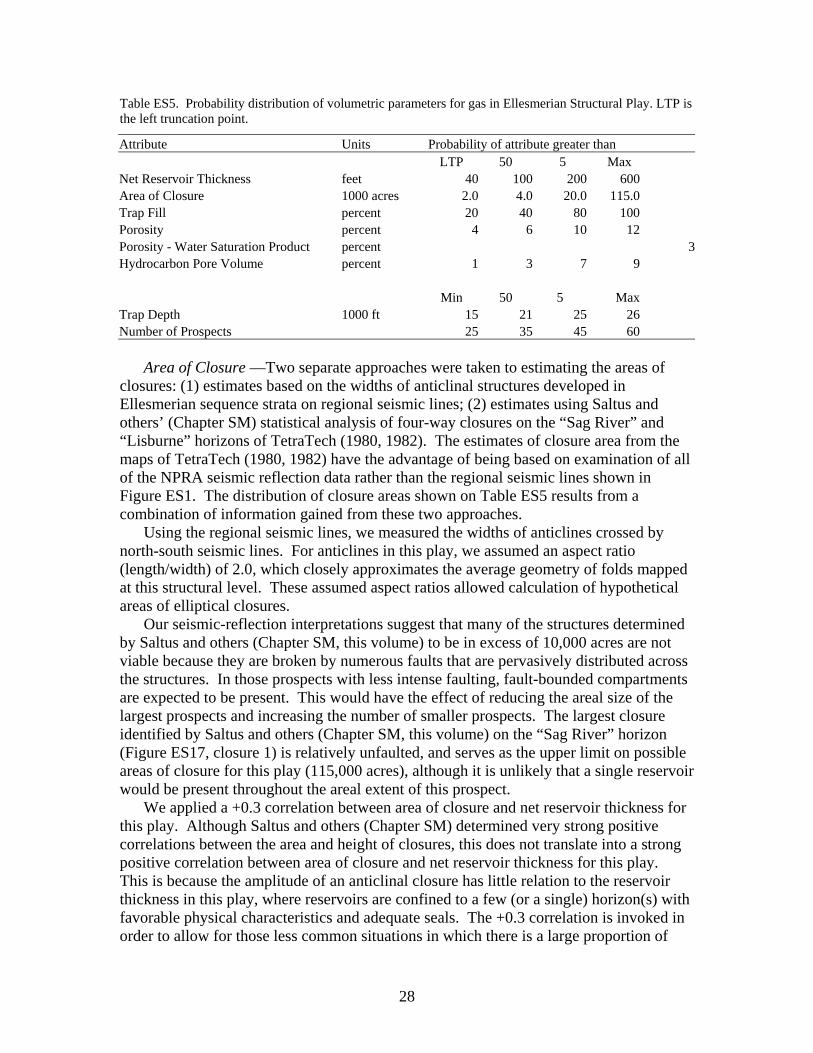
Table ES5. Probability distribution of volumetric parameters for gas in Ellesmerian Structural Play. LTP is the left truncation point. Attribute Units Probability of attribute greater than LTP 50 5 Max Net Reservoir Thickness feet 40 100 200 600 Area of Closure 1000 acres 2.0 4.0 20.0 115.0 Trap Fill percent 20 40 80 100 Porosity percent 4 6 10 12 Porosity - Water Saturation Product percent 3Hydrocarbon Pore Volume percent 1 3 7 9 Min 50 5 Max Trap Depth 1000 ft 15 21 25 26 Number of Prospects 25 35 45 60
Area of Closure —Two separate approaches were taken to estimating the areas of
closures: (1) estimates based on the widths of anticlinal structures developed in Ellesmerian sequence strata on regional seismic lines; (2) estimates using Saltus and others’ (Chapter SM) statistical analysis of four-way closures on the “Sag River” and “Lisburne” horizons of TetraTech (1980, 1982). The estimates of closure area from the maps of TetraTech (1980, 1982) have the advantage of being based on examination of all of the NPRA seismic reflection data rather than the regional seismic lines shown in Figure ES1. The distribution of closure areas shown on Table ES5 results from a combination of information gained from these two approaches.
Using the regional seismic lines, we measured the widths of anticlines crossed by north-south seismic lines. For anticlines in this play, we assumed an aspect ratio (length/width) of 2.0, which closely approximates the average geometry of folds mapped at this structural level. These assumed aspect ratios allowed calculation of hypothetical areas of elliptical closures.
Our seismic-reflection interpretations suggest that many of the structures determined by Saltus and others (Chapter SM, this volume) to be in excess of 10,000 acres are not viable because they are broken by numerous faults that are pervasively distributed across the structures. In those prospects with less intense faulting, fault-bounded compartments are expected to be present. This would have the effect of reducing the areal size of the largest prospects and increasing the number of smaller prospects. The largest closure identified by Saltus and others (Chapter SM, this volume) on the “Sag River” horizon (Figure ES17, closure 1) is relatively unfaulted, and serves as the upper limit on possible areas of closure for this play (115,000 acres), although it is unlikely that a single reservoir would be present throughout the areal extent of this prospect.
We applied a +0.3 correlation between area of closure and net reservoir thickness for this play. Although Saltus and others (Chapter SM) determined very strong positive correlations between the area and height of closures, this does not translate into a strong positive correlation between area of closure and net reservoir thickness for this play. This is because the amplitude of an anticlinal closure has little relation to the reservoir thickness in this play, where reservoirs are confined to a few (or a single) horizon(s) with favorable physical characteristics and adequate seals. The +0.3 correlation is invoked in order to allow for those less common situations in which there is a large proportion of
28
adequate reservoir strata within large structures, in which case larger structures would imply thicker reservoirs.
Porosity and hydrocarbon pore volume—The distribution of porosity values for the Ellesmerian Structural play, shown in Table ES5, are very similar to those for gas in the Lisburne-South Stratigraphic play and the Thrust-Belt play, reflecting the dominant influence of Lisburne Group carbonate reservoirs for the prospects of the play. The low porosity values are also appropriate for the clastic reservoirs in this play. Although porosity values estimated for clastic reservoirs in Ellesmerian stratigraphic plays to the north are higher (Bird and Nelson, Chapters EC and EB, this volume; Nelson and Bird, Chapter SR, this volume), lower porosities are expected for this play because it is deeper than the Ellesmerian stratigraphic plays and because the grain size, proportion and thickness of sandstones are lower in this play compared to those of the Ellesmerian stratigraphic plays.
We applied a -0.8 correlation between porosity and net reservoir thickness for this play. This is because we consider it highly likely that the thickest reservoirs specified under “net reservoir thickness” will be characterized by low-end porosity values. Specification of a -0.8 correlation will produce a preferential matching of lower porosity values with high thickness values, while still allowing a small probability of some thick reservoirs with high average porosities.
The hydrocarbon pore volume is specified as the difference between the porosity(Ø) and the porosity - water saturation product (ØSW). Water saturation is based on the assumption that there will be both clastic and carbonate reservoirs in this play.
Trap Fill—The trap-fill distribution defined for this play (Table ES5) is similar to
those defined for other structural plays in NPRA as discussed by (Potter and Moore, Chapter TS, this volume).
Trap depth—The range of trap depths for this play, 15,000 ft to 26,000 ft, is based on
our interpretation of regional seismic lines, and on the analysis of Saltus and others (Chapter SM, this volume). The shallowest prospects are located in the northern part of the play area, with prospect depths increasing to the south.
Number of prospects—Our inspection of the regional seismic data indicated that there
are at least eleven relatively unbroken structural closures that deform the Ellesmerian sequence. Saltus and others (Chapter SM, this volume), reported 48 closures larger than 2000 acres (LTP value for area of closure) in their closure analysis of the TetraTech (1980, 1982) “Sag River” horizon, and 61 closures larger than 2000 acres for the “Lisburne” horizon. Not all closures spatially coincide on the two maps, indicating that some closures were formed above local thrust fault detachments at somewhat different stratigraphic levels in the Ellesmerian sequence.
Our seismic-reflection analysis of the closures identified by Saltus and others (Chapter SM, this volume) indicates that a large percentage are badly broken by faulting, especially in the southern part of the play area. Thus, we set the minimum number of prospects at 25 prospects. The maximum of 60 prospects reflects the total number of spatially distinct closures identified on the “Sag River” and “Lisburne” horizons in the
29
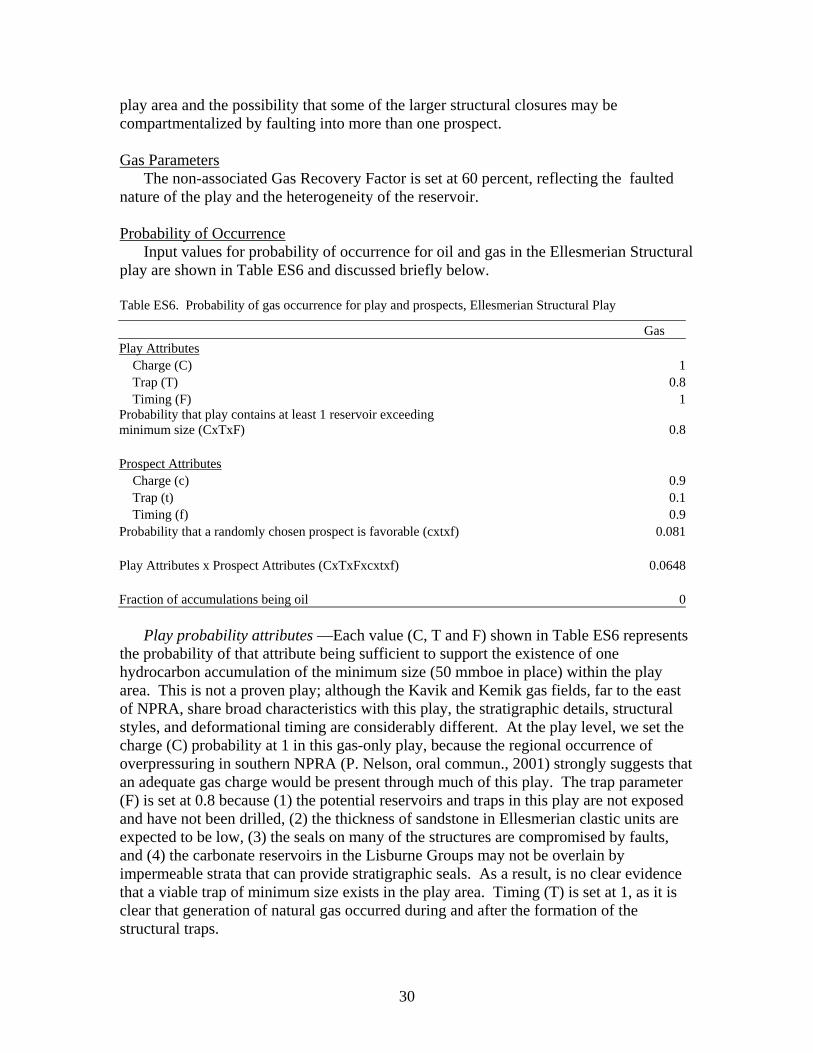
play area and the possibility that some of the larger structural closures may be compartmentalized by faulting into more than one prospect.
Gas Parameters
The non-associated Gas Recovery Factor is set at 60 percent, reflecting the faulted nature of the play and the heterogeneity of the reservoir.
Probability of Occurrence
Input values for probability of occurrence for oil and gas in the Ellesmerian Structural play are shown in Table ES6 and discussed briefly below.
Table ES6. Probability of gas occurrence for play and prospects, Ellesmerian Structural Play Gas Play Attributes Charge (C) 1 Trap (T) 0.8 Timing (F) 1Probability that play contains at least 1 reservoir exceeding minimum size (CxTxF) 0.8 Prospect Attributes Charge (c) 0.9 Trap (t) 0.1 Timing (f) 0.9Probability that a randomly chosen prospect is favorable (cxtxf) 0.081 Play Attributes x Prospect Attributes (CxTxFxcxtxf) 0.0648 Fraction of accumulations being oil 0
Play probability attributes —Each value (C, T and F) shown in Table ES6 represents
the probability of that attribute being sufficient to support the existence of one hydrocarbon accumulation of the minimum size (50 mmboe in place) within the play area. This is not a proven play; although the Kavik and Kemik gas fields, far to the east of NPRA, share broad characteristics with this play, the stratigraphic details, structural styles, and deformational timing are considerably different. At the play level, we set the charge (C) probability at 1 in this gas-only play, because the regional occurrence of overpressuring in southern NPRA (P. Nelson, oral commun., 2001) strongly suggests that an adequate gas charge would be present through much of this play. The trap parameter (F) is set at 0.8 because (1) the potential reservoirs and traps in this play are not exposed and have not been drilled, (2) the thickness of sandstone in Ellesmerian clastic units are expected to be low, (3) the seals on many of the structures are compromised by faults, and (4) the carbonate reservoirs in the Lisburne Groups may not be overlain by impermeable strata that can provide stratigraphic seals. As a result, is no clear evidence that a viable trap of minimum size exists in the play area. Timing (T) is set at 1, as it is clear that generation of natural gas occurred during and after the formation of the structural traps.
30
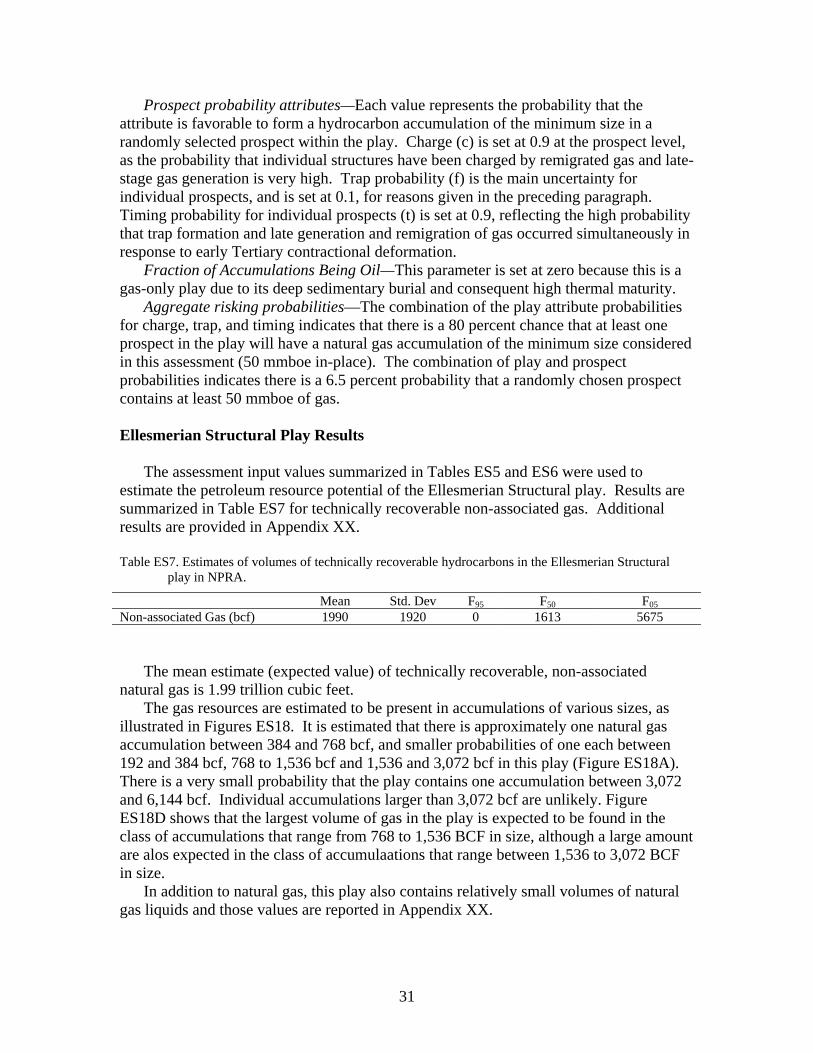
Prospect probability attributes—Each value represents the probability that the attribute is favorable to form a hydrocarbon accumulation of the minimum size in a randomly selected prospect within the play. Charge (c) is set at 0.9 at the prospect level, as the probability that individual structures have been charged by remigrated gas and late-stage gas generation is very high. Trap probability (f) is the main uncertainty for individual prospects, and is set at 0.1, for reasons given in the preceding paragraph. Timing probability for individual prospects (t) is set at 0.9, reflecting the high probability that trap formation and late generation and remigration of gas occurred simultaneously in response to early Tertiary contractional deformation.
Fraction of Accumulations Being Oil—This parameter is set at zero because this is a gas-only play due to its deep sedimentary burial and consequent high thermal maturity.
Aggregate risking probabilities—The combination of the play attribute probabilities for charge, trap, and timing indicates that there is a 80 percent chance that at least one prospect in the play will have a natural gas accumulation of the minimum size considered in this assessment (50 mmboe in-place). The combination of play and prospect probabilities indicates there is a 6.5 percent probability that a randomly chosen prospect contains at least 50 mmboe of gas. Ellesmerian Structural Play Results
The assessment input values summarized in Tables ES5 and ES6 were used to estimate the petroleum resource potential of the Ellesmerian Structural play. Results are summarized in Table ES7 for technically recoverable non-associated gas. Additional results are provided in Appendix XX. Table ES7. Estimates of volumes of technically recoverable hydrocarbons in the Ellesmerian Structural
play in NPRA. Mean Std. Dev F95 F50 F05Non-associated Gas (bcf) 1990 1920 0 1613 5675
The mean estimate (expected value) of technically recoverable, non-associated natural gas is 1.99 trillion cubic feet.
The gas resources are estimated to be present in accumulations of various sizes, as illustrated in Figures ES18. It is estimated that there is approximately one natural gas accumulation between 384 and 768 bcf, and smaller probabilities of one each between 192 and 384 bcf, 768 to 1,536 bcf and 1,536 and 3,072 bcf in this play (Figure ES18A). There is a very small probability that the play contains one accumulation between 3,072 and 6,144 bcf. Individual accumulations larger than 3,072 bcf are unlikely. Figure ES18D shows that the largest volume of gas in the play is expected to be found in the class of accumulations that range from 768 to 1,536 BCF in size, although a large amount are alos expected in the class of accumulaations that range between 1,536 to 3,072 BCF in size.
In addition to natural gas, this play also contains relatively small volumes of natural gas liquids and those values are reported in Appendix XX.
31
CONCLUSION
The analysis detailed in this report indicates that source rocks rich in hydrocarbons are widespread and voluminous in southern NPRA where the structural plays described in this report are located. Our observations indicate that structural traps in the Ellesmerian sequence are present at a variety of depths, both in allochthonous strata above, and in autochthonous and parautochthonous strata below, the regional detachment in the Kingak Shale. Reservoir-quality lithologies sufficient for a major hydrocarbon accumulation are largely unproven in these rocks but most likely are present in dolomitic carbonate rocks of the Lisburne Group or, less likely, in strata of other units.
Except at shallow structural levels, however, the timing of oil generation and migration is not favorable for these plays because it occurred primarily 30-40 m.y. earlier than the time of trap formation in the early Tertiary. The timing of gas migration on the other hand is excellent because gas probably was released by disruption from pre-existing stratigraphic and structural traps by the early Tertiary thrusting. Many of these hydrocarbon accumulations, which had formed during earlier periods of generation in the Neocomian and the mid-Cretaceous, became overmature by the early Tertiary due to continued sedimentary burial. The gas released from older traps by thrusting probably remigrated along active faults into newly formed structural traps forming at higher structural levels. The integrity of such traps, however, could have been limited by the uncertain presence and effectiveness of seals and because of breaching by the same thrust faults.
We conclude that the structural plays in strata of the Ellesmerian sequence in southern NPRA are largely gas plays. The total recoverable gas expected for the two plays totals about 3.5 TCF, whereas less than 6 million barrels of recoverable oil are expected. Because the thermal maturation in southern NPRA is generally high, the oil accumulations would be expected to be present at relatively shallow depths, whereas gas accumulations may be present at any depth. REFERENCES Armstrong, A.K., 1970, Mississippian dolomites from Lisburne Group, Killik River,
Mount Bupto region, Alaska: American Association of Petroleum Geologists Bulletin, v. 54, p. 251-264.
Banet, A.C., 2002, Source-rock characteristics of the Kuna Formation in the western
Brooks Range [abs.]: American Assoc. Petrol. Geologists Pac. Section, Anchorage, AK.
Bird, K.J., 1988, Alaskan North Slope stratigraphic nomenclature and data summary for
government-drilled wells, in Gryc, G., ed., Geology and exploration of the National Petroleum Reserve in Alaska, 974 to 1982: U.S., geological Survey Professional Paper 1399, p. 317-353.
32
Bodnar, D.A., 1984, Stratigraphy, age, depositional environments, and hydrocarbon source rock evaluation of the Otuk Formation, north-central Brooks Range, Alaska [M.S. thesis]: University Alaska, Fairbanks, AK, 232 p.
Brosgé, W.P., Reiser, H.N., Dutro, J.T., Jr., and Detterman, R.L., 1979, Bedrock geologic
Map of the Philip Smith Mountains quadrangle, Alaska: U.S. Geological Survey Miscellaneous Field Studies Map MF-897B, scale 1:250,000.
Burns, W.M., Hayba, D.O., Houseknecht, D.W., and Rowan, E.L., 2002, Timing of
hydrocarbon generation in the National Petroleum Reserve-Alaska (NPRA) from burial and thermal history modeling [abs.]: American Assoc. Petrol. Geologists Pac. Section, Anchorage, AK.
Cole, Frances, Bird, K.J., Toro, Jaime, Roure, Francois, O’Sullivan, P.B., Pawlewicz,
Mark, and Howell, D.G., 1997, An integrated model for the tectonic development of the frontal Brooks Range and Colville basin 250 km west of the Trans-Alaska Crustal Transect: Journal Geophysical Research, v. 102, p. 20,685-20,708.
Dumoulin, J.A., and Bird, K.J., 2002, Lithofacies and Stratigraphy of the Lisburne and
Etivluk Groups in the Lisburne 1 Well and Adjacent Outcrops, Central Brooks Range, Alaska [abs.]: American Assoc. Petrol. Geologists Pac. Section, Anchorage, AK.
Dumoulin, J.A., and Bird, K.J., 2001, Stratigraphy and lithofacies of Lisburne Group
carbonate rocks (Carboniferous-Permian) in the National Petroleum Reserve — Alaska, in D.W. Houseknecht, ed., NPRA Core Workshop, Petroleum plays and systems in the National Petroleum Reserve — Alaska, SEPM Core Workshop No. 21, Denver CO, June 7-8, 2001, p.141-166.
Dumoulin, J.A., and Harris, A.G., 1993, Lithofacies and conodonts of Carboniferous
strata in the Ivotuk Hills, Western Brooks Range, Alaska, in Cynthia Dusel-Bacon and A.B. Till, eds., Geologic Studies in Alaska by the U.S. Geological Survey, 1992, p. 31-47.
Fuis, G.S., Murphy, J.M., Lutter, W.J., Moore, T.E., Bird, K.J., and Christensen, N.I.,
1997, Deep seismic structure and tectonics of northern Alaska: crustal-scale duplexing with deformation extending into the upper mantle: Journal of Geophysical Research, v. 102, no B9, p. 20,873-20,896.
Jameson, Jeremy, 1994, Models of porosity formation and their impact on reservoir
description, Lisburne field, Prudhoe Bay, Alaska: American Assoc. Petrol. Geologists Bull., v.78, p. 1651-1678.
Johnsson, M.J., Evans, K.R., and Marshall, H.A., 1999, Thermal maturity of sedimentary
rocks in Alaska: digital resources: U.S. Geological Survey Digital Data Series DDS-54, Version 1.0.
33
Hubbard, R.J., Edrich, S.P., and Rattey, R.P., 1987, Geologic evolution and hydrocarbon
habitat of the Arctic Alaska microplate, in Tailleur, I., and Weimer, P., eds., Alaskan North Slope geology: Bakersfield, California, Society of Economic Paleontologists and Mineralogists, Pacific Section, and Alaska Geological Society, Book 50, p. 797-830.
Kelley, J.S., 1988, Preliminary geologic map of the Chandler Lake quadrangle, Alaska:
U.S. Geological Survey Open File Report 88-42, scale 1:125,000, 2 sheets. Kirschner, D.E., and Rycerski, B.A., 1988, Petroleum potential of representative
stratigraphic and structural elements in the National Petroleum Reserve in Alaska Chap. 9, in Gryc, George, ed., Geology and Exploration of the National Petroleum Reserve in Alaska, 1974 to 1982: U.S. Geological Survey Professional Paper 1399, p. 191-208.
Kornbrath, R.W., Myers, M.D., Krouskop, D.L, Meyer, J.F., Houle, J.A., Ryherd, T.J.,
and Richter, K.N., 1997, Petroleum potential of the eastern National Petroleum Reserve-Alaska: State of Alaska Div. Oil and Gas, 30 pages.
Legg, G.W., 1983, Geological report on the Lisburne Test Well No. 1, Husky Oil NPR
Operations Inc., 17p. Lerand, M., 1973, Beaufort Sea, in McCrossam, R.G., ed., The future petroleum
provinces of Canada—Their geology and potential: Canadian Society of Petroleum Geology Memoir 1, p. 315-386.
Lewchuk, M.T., Al-Aasm, I.S., Symons, D.T., and Gillen, K.P., 1998, Dolomitization of
Mississippian carbonates in the Shell Waterton gas field, southwestern Alberta: insights from paleomagnetism, petrology and geochemistry: Bulletin of Canadian Petroleum Geologists, v. 46, p. 387-410.
Magoon, L.B., and Dow, W.G., 1994, The petroleum system, in Magoon, L.B., and Dow,
W.B., The Petroleum System—From Source To Trap: American Assocation Petroleum Geologists Memoir 60, p. 3-24.
Mayfield, C.F., Tailleur, I.L., and Ellersieck, Inyo, 1988, Stratigraphy, structure, and
palinspastic synthesis of the western Brooks Range, northwestern Alaska, Chap 7, in Gryc, George, ed., Geology and Exploration of the National Petroleum Reserve in Alaska, 1974 to 1982: U.S. Geological Survey Professional Paper 1399, p. 143-186.
Miller, J.J., Agena, W.F., Lee, W.L., Zihlman, F.N., Grow, J.A., Taylor, D.J., Killgore,
M., Oliver, H.L., 2000, Regional seismic lines reprocessed using post-stack processing techniques: National Petroleum Reserve – Alaska (NPRA), United States Geological Survey Open File Report 00-286.
34
Miller, J.J, Agena, W. F., Lee, M.W., Zihlman, F.N., Grow, J.A., Taylor, D.J., Killgore, Michele, and Oliver, H.L, 2001, Four regional seismic lines: National Petroleum Reserve -- Alaska (Supplement to U.S. Geological Survey Open-File Report 00-286), U.S. Geological Survey Open-File Report 01-0337. (http://geology.cr.usgs.gov/pub/open-file-reports/ofr-01-0337/)
Moore, T.E., Wallace, W.K., Bird, K.J., Karl, S.M., Mull, C.G., and Dillon, J.T., 1994, Geology of northern Alaska, in Plafker, George, and Berg, H.C., eds., The geology of Alaska: Boulder, CO, Geological Society of America, The Geology of North America, v. G-1, p. 49-140.
Moore, T.E., Wallace, W.K., Mull, C.G., Adams, K.E., Plafker, George, and Nokleberg,
W.J., 1997, Crustal implications of bedrock geology along the Trans-Alaska Crustal Transect (TACT) in the Brooks Range, northern Alaska: Journal of Geophysical Research, v. 102, no. B9, p. 20,645-20,684.
Mull, C.G., 1982, Tectonic evolution and structural style of the Brooks Range, Alaska:
an illustrated summary, in R.B. Powers, ed., Geological Studies of the Cordilleran Thrust-Belt, vol. 1: Rocky Mountain Assoc. of Geologists, Denver, CO, p. 1-45.
Mull, C.G., 1985, Cretaceous tectonics, depositional cycles, and the Nanushuk Group,
Brooks Range and Arctic Slope, Alaska, in Huffman, A.C., Jr., ed., Geology of the Nanushuk Group and related rocks, North Slope, Alaska: U.S. Geological Survey Bulletin 1614, p. 7-36.
Mull, C.G., Glenn, R.K., and Adams, K.E., 1997, Tectonic evolution of the central
Brooks Range mountain front: evidence from the Atigun Gorge region: Journal Geophysical Research, v. 102, p. 20,749-20,772.
Mull, C.G., Moore, T.E., Harris, E.E., and Tailleur, I.L., 1994, Geologic map of the
Killik River quadrangle: U.S. Geological Survey Open-File Report 94-679, 1 sheet, scale 1:125,000.
Mull, C.G., and Werdon, M.B., 1994, Generalized geologic map of the western Endicott
Mountains, central Brooks Range, Alaska: Alaska Div. Of Geological and Geophysical Surveys Public Data File map 94-55, 1 sheet, scale 1:250,000.
Oldow, J.S., Seidensticker, C.M., Phelps, J.C., Julian, F.E., Gottschalk, R.R., Boler,
K.W., Handschy, J.W., and Ave Lallemant, H.G., 1987, Balanced cross sections through the central Brooks Range and North Slope, Arctic Alaska: American Association of Petroleum Geologists Special Paper, 19 p., 8 plates, scale 1:200,000.
35
O’Sullivan, P.B., Moore, T.E., and Murphy, J.M., 1998, Tertiary uplift of the Mt. Doonerak antiform, central Brooks Range, Alaska: apatite fission-track evidence from the Trans-Alaska crustal transect, in Oldow, J.S., and Avé Lallemant, H.G., eds., Architecture of the Central Brooks Range Fold and Thrust Belt, Arctic Alaska: Boulder, Colorado, Geological Society of America Special Paper 324, p. 179-193.
O’Sullivan, P.B., Moore, T.E., Potter, C.J., and Wallace, W.K., 2002, Constraints on the
Mesozoic and Cenozoic thermotectonic evolution of the northern Brooks Range and the North Slope foreland basin from fission track thermochronology [abs.]: American Assoc. Petrol. Geologists Pac. Section, Anchorage, AK.
O’Sullivan, P.B., Murphy, J.M., and Blythe, A.E., 1997, Late Mesozoic and Cenozoic
thermotectonic evolution of the central Brooks Range and adjacent North slope foreland basin, Alaska: including fission track results from the Trans-Alaska Crustal Transect (TACT): Journal Geophysical Research, v. 102, p. 20,821-20,845.
Perry, W.J., Potter, C.J., and Nelson, P.H., 1999, Thin-skinned thrust-belt play—Chapter
P8, in ANWR Assessment Team, The Oil and Gas Resource Potential of the 1002 Area, Arctic National Wildlife Refuge, Alaska: U.S. Geological Survey Open-File Report 98-34 (CD-ROM), p. P-34-P-40.
Pratt, L.M., and Werner, M.C., 2000, Roles of organic matter in shale and carbonate-
hosted base metal deposits, in Giordano, T.H., Ketter, R.M., and Wood, S.A., eds., Reviews in Economic Geology, v. 9, orogenesis and exploration: the roles of organic matter: Society of Economic Geologists, p. 281-299.
Roeder, Dietrich, and Mull, C.G., 1978, Tectonics of Brooks Range ophiolites, Alaska:
American Association Petroleum Geologists Bulletin, v. 62, p. 1696-1702. Shelton, K.L., Underwood, M.B., and Howell, D.G., 1994, Regional stable isotope
variations of calcite veins from Lisburne corridor, frontal Brooks Range, north-central Alaska: indicators of thermal maturity and hydrocarbon migration [abs.]: EOS, v 75, no. 44 (supplement), p. 647.
Tailleur, I.L., Kent, B.H., and Reiser, H.N., 1966, Outcrop geologic maps of the Nuka-
Etivluk region, northern Alaska: U.S. Geological Survey Open File Report 66-128, scale 1:63,360, 7 sheets.
Tetra Tech, 1980, Summary Geophysical Report, FY80: Tetra Tech Report No. 8003
(including maps at 1:250,000 scale). Tetra Tech, 1982, Petroleum exploration of NPRA 1974-1981 (Final Report): Tetra Tech
Report No. 8200 (including maps at 1:500,000 scale).
36
Wallace, W.K., Moore, T.E., and Plafker, George, 1997, Multi-story duplexes with forward-dipping roofs, north-central Brooks Range, Alaska: Journal of Geophysical Research, v. 102, no. B9, p. 20,773-20,796.
Werner, M.C., 1998, Geochemical characterization of sedimentary organic matter and
hydrothermal petroleum in the black shale-hosted Zn-Pb deposit at Red Dog Mine, western Brooks Range, Alaska [Ph.D. thesis]: Indiana University, 216 p.
TABLES Table ES-1. Probability distribution of volumetric and spatial distribution parameters for
oil and gas in Thrust-Belt Play. LTP is the left truncation point. Table ES-2. Oil and gas parameters for Thrust-Belt Play.
Table ES-3. Probability of occurrence for play and prospects, Thrust-Belt Play Table ES4. Estimates of volumes of technically recoverable hydrocarbons in the Thrust-
Belt Play in NPRA. Table ES5. Probability distribution of volumetric parameters for gas in Ellesmerian
Structural Play. LTP is the left truncation point. Table ES6. Probability of gas occurrence for play and prospects, Ellesmerian Structural
Play. Table ES7. Estimates of volumes of technically recoverable hydrocarbons in the
Ellesmerian Structural play in NPRA. FIGURES Figure ES1. Landsat image of NPRA showing the location and distribution of the
Thrust-Belt and Ellesmerian Structural plays, regional seismic grid, structural and geographical features, and selected wells.
Figure ES2. Stratigraphic ages, names, and rock types of the Brooks Range and nearby
foothills of the southern NPRA compared to time-equivalent strata of northern and central NPRA. Brooks Range and foothills stratigraphy shown is primarily that of the Endicott Mountains allochthon (Mull and others, 1982). GRZ, gamma-ray zone; LCU, Lower Cretaceous unconformity. (From Bird, this volume, Chapter GS).
Figure ES3. Schemmatic regional cross section across the sstructurally deformed part of
NPRA showing the structural position of the Endicott Mountains and higher allochthons, the North Slope autochthon, and the Colville basin and locations of
37
selected structural features. Insets schematically show the structural settings and style of traps found in the four structural plays in NPRA. Cross-hatched pattern indicates approximate position of oil window. Top of oil window defined by Ro=0.6; base of oil window defined by Ro=1.3.
Figure ES4. Conceptual diagram showing development of Colville basin. Top, location
of diagrams 4A-E on south-facing passive margin. Note restored positions of “higher allochthons” and Endicott Mountains allochthon. A., In Late Jurassic, location of diagram was in undeformed foreland with north-vergent thin-skinned deformation taking place outside diagram to south. B., By Late Neocomian time, a deformational wedge consisting of Endicott Mountains allochthon and overlying higher allochthons formed constructional high that becomes the south flank of the Colville basin and causes basin subsidence due to tectonic loading. Allochthons are composed of a stacked series of duplexes and broken formation C., In the late Early Cretaceous and Late Cretaceous, voluminous sediments shed from sources to west and south prograde longitudinally along basin from west and onlap deformational wedge to the south (duplex structure in deformational wedge not shown). By end of the Cretaceous, over 8 km of clastic sediments have been deposited. D. In early Tertiary, renewed north-vergent deformation forms duplex with floor thrust in Kingak Shale of autochthon and roof thrust in clinoform strata of upper Torok Shale. To the south, the Early Cretaceous deformational wedge is deformed by linking thrusts in the duplex, whereas to the north only Colville basin strata are deformed by linking thrusts. A triangle zone is developed near present Tuktu escarpment. Dashed line indicate position of modern erosional profile. E. Erosion since the Tertiary has removed about 3 km of strata and has exhumed upper part of duplex.
Figure ES5. Thermal analysis and relation to hydrocarbon generation of structural model
developed in Figure ES4. Approximate position of rocks in the oil window superposed on cross sections of Figures ES4B, ES4C, and ES4D. Top, in late Neocomian, oil window lies beneath deformational wedge in thrust belt. Hydrocarbon migration at this time is toward frontal part of deformational wedge and up depositional dip in underlying autochthon. Ellesmerian sequence in foreland is too thin to cause maturation due to sedimentary burial in most areas (underlying pre-Mississippian rocks are previously deformed and metamorphosed). Middle, during Late Cretaceous, position of oil window moves upward through section with increasing amounts of sedimentary burial under Torok and Nanushuk Groups of Colville basin,. To south, oil window intersects Neocomian deformational wedge due to sedimentary onlap of Colville basin strata, causing simultaneous maturation in allochthonous strata. Oil migration at this time is local, with accumulations forming principally in local stratigraphic and pre-existing structural traps. Bottom, oil window at time of maximum burial (shown by hatchures) is deformed and uplifted by thrusts during Early Tertiary deformation. At depth, early formed hydrocarbon traps, now overmature, are breached by faults releasing gas. Gas migrates upward along active faults into
38
newly formed traps. Oil generation (not shown) and local migration may be occurring in upper part of structural section.
Figure ES6. Event Chart showing the relation of essential elements and processes of the
petroleum system of the Thrust-Belt play. Figure ES7. Seismic reflection data (time display) from NPRA regional seismic line R-
22 at intersection with R-18 near northern limit of Thrust-Belt play (see Figure ES1 for location). Red lines indicate faults; dashed yellow line indicates approximate position of base of Torok and Fortress Mountain formations. This dip line show broad closures of Lisburne Group carbonate strata at depths of about 25,000 to 40,000 ft. Approximate width of 2-way closure of upper imbricate is 20,000 feet (6096 m).
Figure ES8. Seismic reflection data (time display) from NPRA regional seismic line R-
19 located about 2 miles (3.2 km) west of Lisburne-1 well (see Figure ES1 for location). Red lines are faults Many imbricates of Lisburne Group carbonate rocks are visible on this dip line, including the five penetrated by well, although only a few are mapped. The approximate widths of several well-imaged closures of Lisburne Group carbonate rocks, typical of those at relatively shallow depths in the Thrust-Belt play, are shown in purple. Because seismic line R-19 is located east of the present boundary of NPRA, these closures are not in the play area.
Figure ES9. Well logs and vitrinite reflectance data from Lisburne-1 well on interpreted
cross section. Five repetitions of Lisburne and Etivluk Groups were encountered in the lower part of the well. Diagram modified from Cole and others (1997) and Dumoulin and Bird (2002).
Figure ES10. Schematic cross sections through Lisburne-1 well with number of
imbrications in well reduced to simplify diagram. A., Model of Cole and others (1997) showing large overthrust of allochthonous Ellesmerian sequence rocks onto Brookian sequence strata. Some of the imbrication of Lisburne and Etivluk Group strata encountered in Lisburne-1 well could have occurred on Early Cretaceous faults (black), but many thrusts with the largest displacements in this model must be post Early Cretaceous (red). This model allows possibility of sub-thrust prospects in Brookian strata. B., Model preferred in this paper where structural section and faults formed by duplexing of Lisburne and Etivluk Groups in Neocomian (black) are imbricated by reverse faults active in early Tertiary. Amount of overthrusting of Brookian strata is limited in this model and restricted to northerly parts of the play. Note duplexing beneath regional detachment above basement, a characteristic of Ellesmerian Structural Play.
Figure ES11. Map showing coverage of Tetra Tech Intermediate Composite Features
(ICF) map in Thrust-Belt Play and NPRA.
39
Figure ES12. Our interpretation of rocks forming subsurface structural culminations in Tetra Tech “Intermediate Composite Features” (ICF) map (modified from Saltus and others, Chapter SM, this volume). Eight structural closures of Lisburne Group strata with four-way closure are identified in play area. Also shown are numbers of culminations of Lisburne Group strata with two way closure identified on reprocessed NPRA regional seismic reflection profiles in Thrust-Belt play (total = 15 culminations). See Figure ES1 for locations of seismic profiles. Numbers identify closures (see Saltus and others, Chapter SM, this volume).
Figure ES13. Histograms showing the expected (mean) numbers of undiscovered
technically recoverable oil and gas accumulations estimated to exist in various size categories in the Thrust-Belt play. A., Number of oil accumulations; B., Oil volume; C., Number of gas accumulations; and D., Gas volume.
Figure ES14. Event Chart summarizing the relation of essential elements and processes
of the petroleum system of the Ellesmerian Structural play. Figure ES15. Seismic reflection data (time display) from NPRA Regional line R-3, at
intersection with R-16, showing broad anticline that folds Ellesmerian strata (green through yellow line). This anticline corresponds to closure #1 (Saltus and others, Chapter SM) on the "Sag River" horizon of TetraTech (1982). Although anticline was constructed principally by underlying thrust fault (heavy red line), folding of the basement beneath the fault may indicate that deformation is basement involved. Red lines indicate faults.
Figure ES16. Seismic reflection data from northern end of NPRA regional line R-19 (see
Figure ES1 for location) showing basement-involved folds in Ellesmerian sequence.
Figure ES17. Map illustrating closure analysis by Saltus and others (Chapter SM) for the
"Sag River" horizon of TetraTech (1982). Closures labeled B (for broken) were found to be pervasively disrupted by faulting in our analyses of the regional seismic data; these closures (and probably other strongly faulted closures not crossed by the regional seismic lines) are considered unviable prospects. Closure labeled 1 is the largest closure identified for this horizon by Saltus and others (Chapter SM); closure #1 is relatively unbroken by faulting. Closure labeled M has approximately the median area of closure specified in the volumetric parameters for the Ellesmerian Structural play.
Figure ES18. Histograms showing the expected (mean) numbers of undiscovered
technically recoverable gas accumulations estimated to exist in various size categories in the Ellesmerian Structural play (no oil was assessed in this play). A., Number of gas accumulations; B., Gas volume.
40
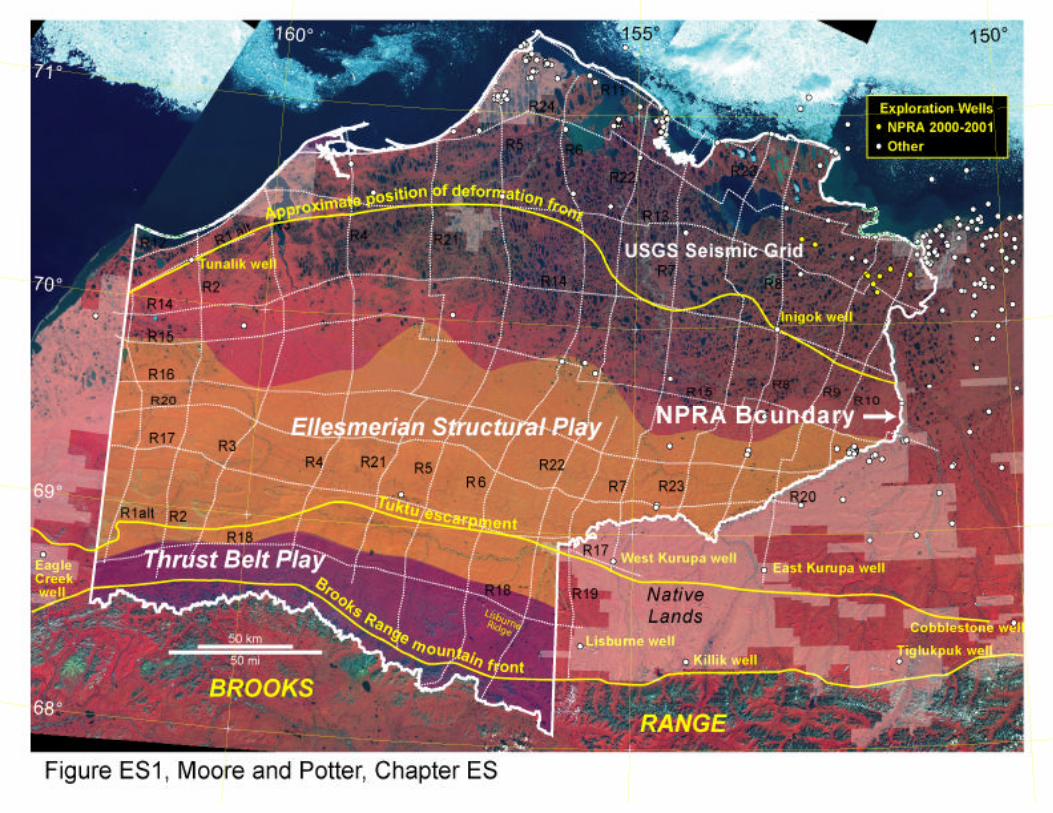
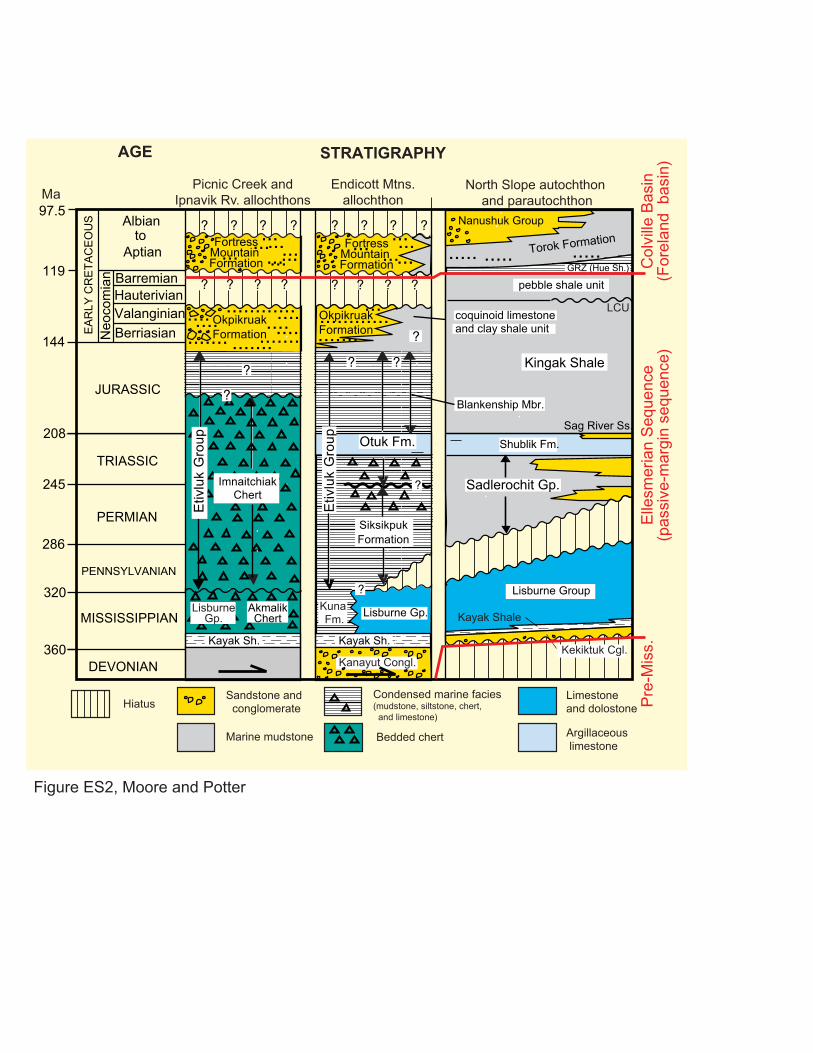
?
?
...............
...................
...
? ?
?
? ? ? ?
? ? ? ?
..... ..... .............................
................... ..............
....................
? ? ? ?
? ? ? ?
?
?
Sag River Ss.
GRZ (Hue Sh.)
LCU
Kekiktuk Cgl.
Kayak Shale
Limestone and dolostone
Argillaceous limestone
Bedded chert
Hiatus Condensed marine facies(mudstone, siltstone, chert, and limestone)
Sandstone and conglomerate
Marine mudstone
360
320
286
245
208
144
97.5
119
MaNorth Slope autochthon
and parautochthonEndicott Mtns.
allochthon
Blankenship Mbr.
coquinoid limestoneand clay shale unit
Torok Formation
Nanushuk Group
Kingak Shale
pebble shale unit
MISSISSIPPIAN
DEVONIAN
PENNSYLVANIAN
PERMIAN
TRIASSIC
JURASSIC
Berriasian
ValanginianHauterivianBarremian
Neo
com
ian
EA
RLY
CR
ET
AC
EO
US Albian
toAptian
Kayak Sh.
SiksikpukFormation
Etiv
luk
Gro
up
Lisburne Gp.
Shublik Fm.
Sadlerochit Gp.
Kuna Fm.
Lisburne Group
Otuk Fm.
Kanayut Congl.
FortressMountain Formation
OkpikruakFormation
Picnic Creek andIpnavik Rv. allochthons
Kayak Sh.
ImnaitchiakChert
AkmalikChert
LisburneGp.
FortressMountain Formation
OkpikruakFormation
AGE STRATIGRAPHY
Etiv
luk
Gro
up
Elle
smer
ian
Seq
uenc
e(p
assi
ve-m
argi
n se
quen
ce)
Col
ville
Bas
in(F
orel
and
bas
in)
Pre
-Mis
s.
Figure ES2, Moore and Potter