Embed Size (px)
Citation preview

May 2005
NASA/TM-2005-213761
Structural Health Monitoring Using
High-Density Fiber Optic Strain Sensor and
Inverse Finite Element Methods
Sixto L. Vazquez, Alexander Tessler, Cuong C. Quach, and Eric G. Cooper
Langley Research Center, Hampton, Virginia
Jeffrey Parks
Illinois Institute of Technology, Chicago, Illinois
Jan L. Spangler
Lockheed Martin Aeronautics Company, Hampton, Virginia
https://ntrs.nasa.gov/search.jsp?R=20050185211 2018-04-19T16:32:45+00:00Z

The NASA STI Program Office . . . in Profile
Since its founding, NASA has been dedicated to the
advancement of aeronautics and space science. The
NASA Scientific and Technical Information (STI)
Program Office plays a key part in helping NASA
maintain this important role.
The NASA STI Program Office is operated by
Langley Research Center, the lead center for NASA’s
scientific and technical information. The NASA STI
Program Office provides access to the NASA STI
Database, the largest collection of aeronautical and
space science STI in the world. The Program Office is
also NASA’s institutional mechanism for
disseminating the results of its research and
development activities. These results are published by
NASA in the NASA STI Report Series, which
includes the following report types:
• TECHNICAL PUBLICATION. Reports of
completed research or a major significant phase
of research that present the results of NASA
programs and include extensive data or
theoretical analysis. Includes compilations of
significant scientific and technical data and
information deemed to be of continuing
reference value. NASA counterpart of peer-
reviewed formal professional papers, but having
less stringent limitations on manuscript length
and extent of graphic presentations.
• TECHNICAL MEMORANDUM. Scientific
and technical findings that are preliminary or of
specialized interest, e.g., quick release reports,
working papers, and bibliographies that contain
minimal annotation. Does not contain extensive
analysis.
• CONTRACTOR REPORT. Scientific and
technical findings by NASA-sponsored
contractors and grantees.
• CONFERENCE PUBLICATION. Collected
papers from scientific and technical
conferences, symposia, seminars, or other
meetings sponsored or co-sponsored by NASA.
• SPECIAL PUBLICATION. Scientific,
technical, or historical information from NASA
programs, projects, and missions, often
concerned with subjects having substantial
public interest.
• TECHNICAL TRANSLATION. English-
language translations of foreign scientific and
technical material pertinent to NASA’s mission.
Specialized services that complement the STI
Program Office’s diverse offerings include creating
custom thesauri, building customized databases,
organizing and publishing research results ... even
providing videos.
For more information about the NASA STI Program
Office, see the following:
• Access the NASA STI Program Home Page at
http://www.sti.nasa.gov
• E-mail your question via the Internet to
• Fax your question to the NASA STI Help Desk
at (301) 621-0134
• Phone the NASA STI Help Desk at
(301) 621-0390
• Write to:
NASA STI Help Desk
NASA Center for AeroSpace Information
7121 Standard Drive
Hanover, MD 21076-1320

National Aeronautics and
Space Administration
Langley Research Center
Hampton, Virginia 23681-2199
May 2005
NASA/TM-2005-213761
Structural Health Monitoring Using
High-Density Fiber Optic Strain Sensor and
Inverse Finite Element Methods
Sixto L. Vazquez, Alexander Tessler, Cuong C. Quach, and Eric G. Cooper
Langley Research Center, Hampton, Virginia
Jeffrey Parks
Illinois Institute of Technology, Chicago, Illinois
Jan L. Spangler
Lockheed Martin Aeronautics Company, Hampton, Virginia

Available from:
NASA Center for AeroSpace Information (CASI) National Technical Information Service (NTIS)
7121 Standard Drive 5285 Port Royal Road
Hanover, MD 21076-1320 Springfield, VA 22161-2171
(301) 621-0390 (703) 605-6000
The use of trademarks or names of manufacturers in the report is for accurate reporting and does not
constitute an official endorsement, either expressed or implied, of such products or manufacturers by the
National Aeronautics and Space Administration.
Abstract
In an effort to mitigate accidents due to system and component failure, NASA’s Aviation Safety has partnered with industry, academia, and other governmental organizations to develop real-time, on-board monitoring capabilities and system performance models for early detection of airframe structure degradation. NASA Langley is investigating a structural health monitoring capability that uses a distributed fiber optic strain system and an inverse finite element method for measuring and modeling structural deformations.
This report describes the constituant systems that enable this structural monitoring function and discusses results from laboratory tests using the fiber strain sensor system and the inverse finite element method to demonstrate structural deformation estimation on an instrumented test article.
Introduction
NASA Langley Research Center has developed instrumentation based upon principles of Optical Frequency-Domain Reflectometry (OFDR) for the provision of large-scale, densely distributed strain sensors using optical fiber embedded with Bragg gratings. Fiber Optic Bragg Grating technology enables the distribution of thousands of sensors that are immune to moisture and electromagnetic interference and have negligible weight penalty. The theory and development of this technology, called FOSS (Fiber Optic Strain System) is described in [1]. The algorithms and methods for deriving strain from an OFDR measurement system are described in [2].
At NASA Langley, this technology provides a key component for research and development relevant to comprehensive aerospace vehicle structural health monitoring (SHM). It has been lab tested in various applications. Notably, FOSS was used during structural testing of an advanced composite transport wing box [3]. An integrated prototype system has been developed that includes hardware and software for the acquisition of data from an optical network and conversion of the data into strain measurements.
To enable a comprehensive structural health capability, an inverse finite element method (iFEM) has been developed that uses the measured strain data to compute the full-field displacements and, subsequently, internal loads experienced by the structure in real time. The technique is applicable to thin and moderately thick beams, plates, shells, and built-up structures. The mathematical foundation for iFEM is described in [5].
This report briefly describes the FOSS system and the inverse finite element method and demonstrates the capability of the approach using a simple structural test. The structural test was conducted on an instrumented beam test article subjected to tip deflection. The strain measurements were used by the inverse finite element model to reconstruct the deformed shape of the beam. Details of the configuration of the beam test article and the experimental results are described. The report concludes with a discussion of issues and potential areas of future research.
2
Sensor System
The FOSS system is based upon an optical frequency-domain reflectometry (OFDR) technique that allows the reading of thousands of Bragg grating sensors distributed along a single fiber. The technique entails writing diffraction gratings with equivalent periods into a fiber which is part of a network that includes a broadband reflector that, when interrogated with a swept-wavelength laser source, modulates each sensor by a unique frequency. Each grating’s reflected wavelength will vary according to the physical stresses experienced by the sensor, and a series of specialized digital signal processes are then applied to resolve a micro-strain commensurate with the tension or compression of the fiber [2].
Inverse Finite Element Method
Efficient and robust computational mechanics structural analysis capabilities and tools are required to (1) optimize the selection of the type of sensors as well as the sensor locations, and to (2) process, in real time, raw sensor data from hundreds or thousands of multiple types of sensors, to obtain reliable knowledge of structural conditions. Such technologies, therefore, are critical to enabling an effective SHM system.
One current area of structural analysis being pursued is real-time reconstruction of full-field structural displacements and internal loads. This is seen as an enabling technology for structural health monitoring and actuation and control systems feedback for the next generation of aerospace vehicles. To facilitate such capabilities, load-carrying structural members need to be instrumented with a network of strain sensors, e.g., fiber optic Bragg-grating sensors.
Reconstruction of a displacement vector at every material point of the structure from a set of discrete strain measurements constitutes an inverse mathematical problem. Inverse problems are ill posed in the sense that they do not necessarily satisfy conditions of existence, uniqueness, and stability. For this class of
mathematical problems (which use experimentally measured data known only approximately and containing random error), general methods for constructing approximate solutions that are stable under small changes in the measured data have been developed using the fundamental concept of a regularizing operator [4].
To address the modeling of complex aerospace structures densely instrumented with fiber optic strain sensors, Tessler and Spangler [5, 6] developed a novel variational principle that is well suited for this class of “reconstruction” inverse problems. The variational principle is used as a basis for formulating a computationally efficient inverse Finite Element Method (iFEM). The method computes the full-field displacements and internal loads using strain data from in-situ strain sensors. The formulation is based upon the minimization of a least squares functional that uses the complete set of strain measures corresponding to a first-order shear deformation theory. The error functional uses the least-squares-difference terms comprised of the strains that are expressed in terms of the displacements and the corresponding strains that are measured experimentally. All strain-displacement relations are enforced explicitly whereas the analytical and measured strains are matched in the least-squares sense. A penalty parameter controlled “regularization” term enforces physical constraints imposed on the transverse shear strains. By virtue of these assumptions, all strain compatibility relations are explicitly satisfied.
The methodology for reconstructing the displacements does not require elastic or inertial material properties. Thus, it is equally applicable for static and dynamic loadings, as well as a wide range of elastic materials. Once the displacements are reconstructed, the internal loads are readily computed using strain-displacement and material constitutive (stress-strain) relations.
A constant-strain inverse shell element, labeled iMIN3, was developed and implemented into NASA’s COMET-AR [7] finite element code. The element has three nodes and conventional shell-like six degrees-of-freedom at each node, i.e., three displacements and three

3
rotations. The displacement variables are interpolated using the lowest-order, C0-continuous anisoparametric shape functions adopted from a related Mindlin theory plate formulation [8].
Test Article
To validate the capability for predicting structural deformations using FOSS strain measurements, an aluminum beam test article was instrumented using both a FOSS fiber and thirteen foil gauges. The iFEM model estimated deflection based only on the FOSS strain values. The foil strain gauges were used strictly for independent validation of the FOSS measurements. The Instrumented Test Article (ITA) is an aluminum bar (7076 AL) which measures 1219.2 mm x 63 mm x 6 mm. The fiber and foils, mounted on the top surface, were positioned according to the diagram in Figure 1.
Figure 1: Dimensions and sensor layout for ITA. The FOSS fiber contains 333 Fiber Optics
Bragg Gratings (FOBG) that measure axial strain along the length of the ITA. The single fiber provides for two rows of FOBG sensors by looping back near the last foil strain gauge (Figure 2). It is attached to the optical circuitry through a fusion splice that is protected by a 2 mm diameter cylindrical sleeve that is about 50 mm in length. The sleeve is depicted in Figure 3 and Figure 4.
Figure 2: FOSS fiber looping back at the free end of ITA
Figure 3: Fiber bond site relative to mount screws and foil 1.
Figure 4: Gratings number 330-332. Grating number 332 is the last grating.
4
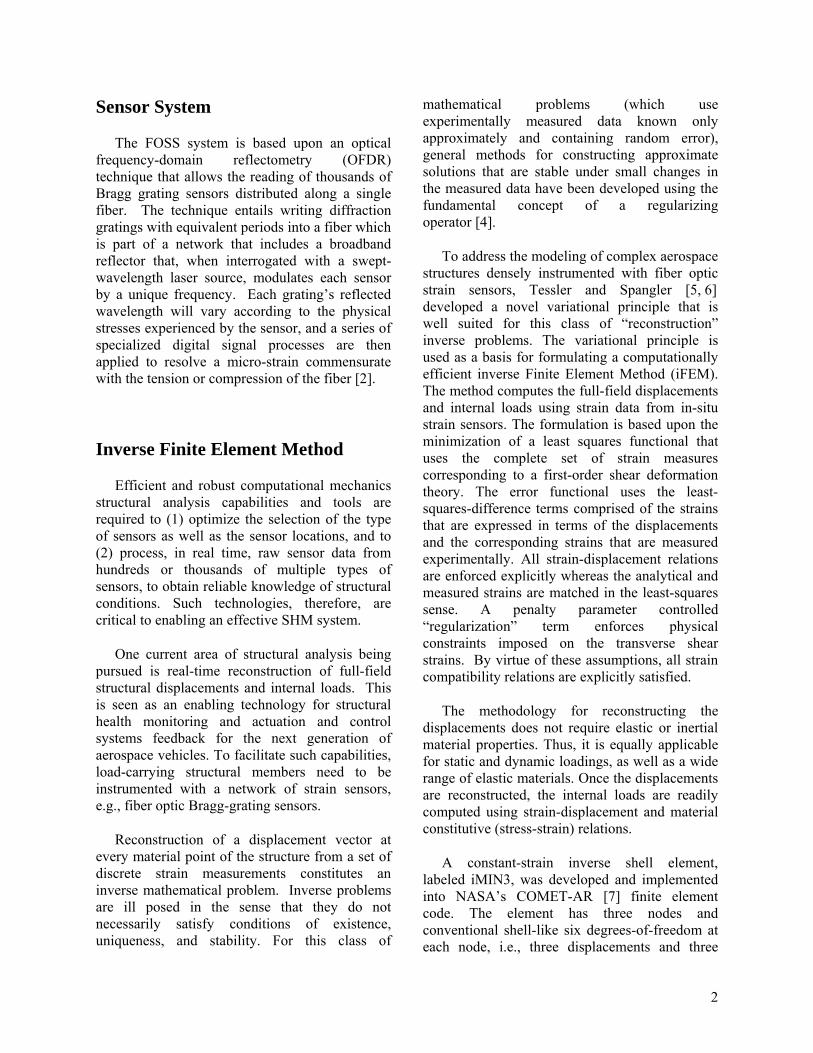
Each grating is approximately 4 mm long having centerlines spaced approximately 6.35 mm along the fiber. The first grating, labeled grating 0, is located inside the fusion splice sleeve. The sensing end of the fiber is suspended 1 mm above the ITA surface as it exits the sleeve, and is bonded to the ITA surface approximately 20 mm before grating 9. Figure 3 shows the approximate location of grating 9 relative to the fusion sleeve and foil gauge 1. The inset in Figure 3 shows the suspended segment of the test fiber exiting the fusion sleeve at one end and bonded to the ITA surface on the other. The gratings in this suspended section were omitted from the test analysis since they were not bonded to the ITA surface
Grating locations were determined using a thermal-based technique that proceeds by first locating 4 individual gratings (small segments of fiber were heated to induce localized strain), then calculating the location of remaining gratings through linear regression. Figure 4 shows the markings indicating approximate locations of the last three gratings in the fiber.
Thirteen single axis foil gauges were bonded along the centerline of the bar and oriented to measure strain along the length of the ITA. The centers of the active element in each foil are spaced 76.20 mm apart as illustrated in Figure 1. The first foil gauge is bonded at 146.05 mm from the fixed end of the bar as seen in Figure 3. Foil 13 is located near the loop in the FOSS fiber as depicted in Figure 2. The foils have a nominal resistance of 350 ohms at room temperature. The data acquisition system for the foil gauges was also calibrated at room temperature using a Fluke 702 Documenting Process Calibrator as a resistance source.
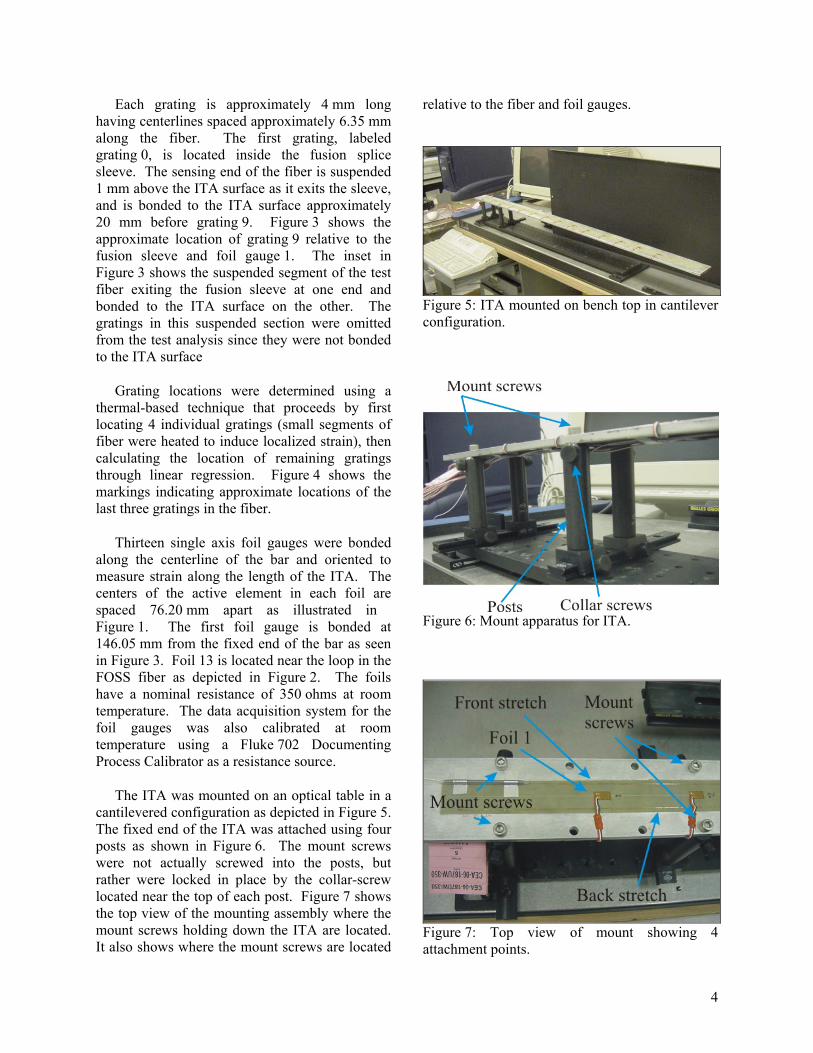
The ITA was mounted on an optical table in a cantilevered configuration as depicted in Figure 5. The fixed end of the ITA was attached using four posts as shown in Figure 6. The mount screws were not actually screwed into the posts, but rather were locked in place by the collar-screw located near the top of each post. Figure 7 shows the top view of the mounting assembly where the mount screws holding down the ITA are located. It also shows where the mount screws are located
relative to the fiber and foil gauges.
Figure 5: ITA mounted on bench top in cantilever configuration.
Figure 6: Mount apparatus for ITA.
Figure 7: Top view of mount showing 4 attachment points.

5
ITA Measurements
Strain measurements were taken with the free end (tip) of ITA subjected to various deflection conditions. For each imposed deflection condition, strain values were acquired from both the FOSS system and the foil gauges. Data were recorded with the beam under its own weight (Figure 5), and also with the tip depressed (downward deflection, Figure 8), and raised (upward deflection, Figure 9) at various magnitudes. The imposed deflections were achieved by actuating a screw lever mounted on the optical table at the free end of the bar. The lever contacts the ITA at 9 mm inboard of the end of the ITA. The screw lever is shown in Figure 10.
Figure 8: ITA with free end subjected to downward deflection (depressed tip).
Figure 9: ITA with free end subjected to upward deflection (raised tip).
Figure 10: Screw lever contacting ITA
Table 1 shows the load case number, direction of loading, and measured deflection for the measurements used in this study. Deflections were applied with the screw elevator, and measurements were made with respect to the top surface of the ITA at the clamped end. Since the lever contacts the ITA at 9 mm inboard from its tip, the imposed deflections, although very close, were not precisely tip deflections.
Table 1: ITA test cases Load case
Direction of Loading
Imposed DeflectionWa (mm)
7201 upward 59.22 7170 upward 46.52 7134 upward 33.82 7085 upward 21.12 7045 upward 8.42 6925 upward -4.28 7401 own weight -17.08 6783 own weight -17.31 7441 downward -23.33 7481 downward -36.03 7525 downward -48.73 7556 downward -61.43 7588 downward -74.13
Three load cases were selected from Table 1
for analysis. The cases are representative of the range of deflections induced on the ITA. Load case 7201 is the extreme upward case. 7401 was selected for the gravity induced effect. 7481 was selected for the downward case. For these cases, the FOSS surface strains were used as input to the inverse finite element method to compute deflections along the entire length of the ITA. Comparisons were made between the foil-gauge strains and those measured by the FOSS system. The following sections describe the analysis performed for the selected load cases.
Strain Validation and Verification
To ascertain the accuracy and correctness of the FOSS measured strains, The FOSS measured strains from the selected load cases were compared to the foil-gauge strains and strains obtained by analysis. Because the foil gauge data was acquired simultaneously with the FOSS

6
measurements, the foil sensors provide verification of FOSS strain measurements. To obtain analytical validation, the measured strains were compared with those computed using a finite element (FEM) model of the ITA as well as classical (Bernoulli-Euler) beam theory.
An ABAQUS FEM model of the ITA was developed using a three-node, triangular shell element. The mesh consists of 800 elements, 446 nodes and 2,676 degrees-of-freedom. Due to the complexity of the mounting apparatus, a detailed model of the mounting was not undertaken. Instead, the ITA was modeled as a cantilevered beam clamped at the location of the rightmost mounting screws, as depicted in Figure 6. This is the last attachment point before the cantilever. Figure 11 illustrates the top view of the ITA showing the alignment of the mesh start location with the rightmost set of screw holes corresponding to the cantilever attachment point. This model was used to compute the deflections corresponding to the loading conditions summarized in Table 1.
Figure 11: FEM plate model of ITA.
The ITA was also analyzed as a cantilever
beam using classical beam theory. There are essentially two load conditions of interest in this experiment. One describes the effects of the beam under its own weight (distributed load). The other describes the effect of the beam under a point load.
For the beam under its own weight, the gravitational (uniform) load per unit length,
gAq ⋅⋅= ρ , was computed as a product of the material density ( ρ ), cross sectional area ( A ), and gravitational acceleration ( g ). For this loading, the beam deflection, w , assumed positive in the upward direction, is readily obtained by integrating the moment-curvature relations subject to the clamped boundary conditions at x = 0. The resulting deflection
expression is given by:
( )222
6424
LLxxEI
qxw +−−= (1)
where L is the cantilevered beam length; E is the modulus of elasticity; 3/2 3btI = is the moment of inertia ( t is half of the beam thickness, and b is the beam width); and x denotes the beam’s axial coordinate whose origin is at the clamped end. The corresponding axial strains on the top (+) and
bottom (-) beam surfaces, ±xε , are obtained as
εx± = ± qt
2EI(L − x)2 (2)
For a beam under a vertical concentrated force,
aP , applied by the screw lever near the tip at
x = a , where aP is assumed positive in the
downward direction, the deflection expressions have the form:
( )
( )⎪⎩
⎪⎨
⎧
≤<−
≤≤−=
LxaxaEI
aP
axaxxEI
P
wa
a
36
036
2
2
(3)
The axial strains corresponding to this loading
have the form:
( )⎪⎩
⎪⎨⎧
≤<
≤≤−±=±
Lxa
axxaEItPa
x
0
0ε (4)
For load case 7401, the beam theory deflections and strains were computed using Equation (1) and (2), respectively.
For load cases 7481 and 7201, the above solutions for the distributed and concentrated loads were superposed to account for the total loading. The resulting strain and deflection for these cases are given by:
w = −x2
24EIq x2 − 4xL +6L2( )+ 4Pa 3a − x( )[ ] (5)

7
⎥⎦
⎤⎢⎣
⎡⎟⎠⎞
⎜⎝⎛ −+−±=± 12)(
22
a
xaPxLq
EI
taxε (6)
In these cases, the concentrated load aP is
expressed in terms of the prescribed deflection, Wa , imposed by the screw lever at x = a , and the uniform loading q as:
)64(8
3 223
LaLaa
q
a
EIWP a
a +−−−= (7)
Note that Wa is assumed positive in the upward direction; refer to Table 1 containing the loading cases and Wa measurements.
Table 2 and Table 3 summarize the pertinent dimensions and material parameters.
Table 2: ITA dimensional parameters
Parameter Value Total bar length, mm 1219.20 Width of beam (b, mm) 63.50 Thickness of beam (2t, mm) 6.00 Moment of inertia (I, mm4) 1143.00 Offset to cantilever, mm 222.25 Offset, tip to lever contact, mm 9.00 Test section length (L, mm) 996.95 Distance from cantilever to lever contact (a, mm)
987.95
Table 3: ITA material parameters (7076 AL) Parameter Value Elastic modulus (E, N/mm2) 6.700E+04 Density ( ρ , N s2/mm4 ) 2.84E-06 Poisson’s ratio 0.34 Uniform load due to gravity per unit length (q, N/mm)
10.6112
In Figure 12, the top-surface axial strains
measured experimentally by the FOSS and foil sensors for the beam under its own weight (load case 7401) are compared against the
corresponding strains computed using beam theory and the FEM model. The beam theory strains were computed using Equation (2). Note that both the FEM and beam theory results are in close agreement, and predict higher strains than the FOSS and foil data. Additionally, both the FOSS and foil data show compressive strains at the free end of the beam. This effect is not present in the FEM and beam theory predictions.
The potential causes for the discrepancy between the experimental and analytical strains can be related to the heating and cooling of the laboratory and the strain condition of the ITA while the baseline was taken. A regression analysis performed on the foil and fiber strain data showed that the top surface at the beam’s tip was undergoing a small compressive strain (-20 μstrain) under gravitational loading only, which is unphysical.
-50
0
50
100
150
200
250
200 400 600 800 1000 1200Distance along ITA (mm)
FOSSFoilBeam Theory for 7076 ALFEM for 7076 AL
Compression
Figure 12: Gravitational load (load case 7401): Comparison of FOSS and foil axial strain measurements to beam theory and FEM results.
To account for the discrepancy between
experimental and analytical strains, the experimental strains were shifted +20 μstrain, to satisfy, in the average sense, the physically required zero-strain condition at the beam’s tip. Figure 13 depicts the strain data of Figure 12 once the +20 μstrain adjustment to the FOSS and foil strains was introduced.
8
-50
0
50
100
150
200
250
200 400 600 800 1000 1200Distance along ITA (mm)
FOSSFoilBeam Theory for7076 ALFEM for 7076 AL
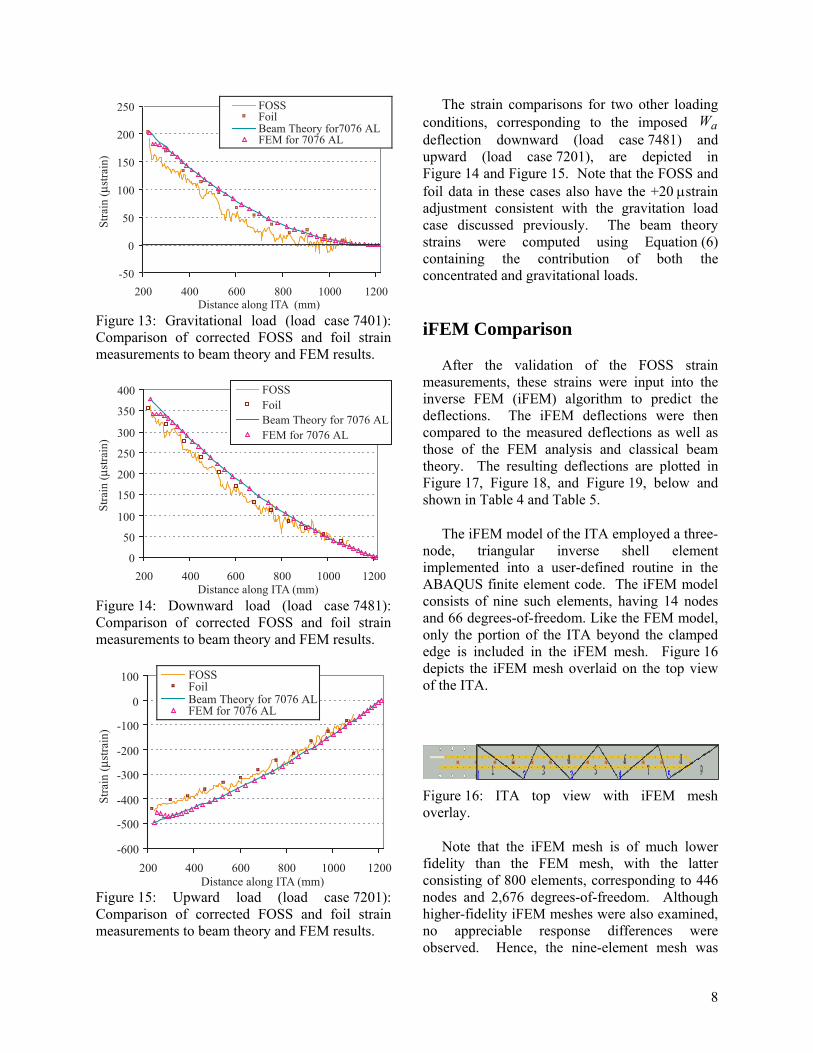
Figure 13: Gravitational load (load case 7401): Comparison of corrected FOSS and foil strain measurements to beam theory and FEM results.
0
50
100
150
200
250
300
350
400
200 400 600 800 1000 1200Distance along ITA (mm)
FOSSFoilBeam Theory for 7076 ALFEM for 7076 AL
Figure 14: Downward load (load case 7481): Comparison of corrected FOSS and foil strain measurements to beam theory and FEM results.
-600
-500
-400
-300
-200
-100
0
100
200 400 600 800 1000 1200Distance along ITA (mm)
FOSSFoilBeam Theory for 7076 ALFEM for 7076 AL
Figure 15: Upward load (load case 7201): Comparison of corrected FOSS and foil strain measurements to beam theory and FEM results.
The strain comparisons for two other loading conditions, corresponding to the imposed Wa deflection downward (load case 7481) and upward (load case 7201), are depicted in Figure 14 and Figure 15. Note that the FOSS and foil data in these cases also have the +20 μstrain adjustment consistent with the gravitation load case discussed previously. The beam theory strains were computed using Equation (6) containing the contribution of both the concentrated and gravitational loads.
iFEM Comparison
After the validation of the FOSS strain measurements, these strains were input into the inverse FEM (iFEM) algorithm to predict the deflections. The iFEM deflections were then compared to the measured deflections as well as those of the FEM analysis and classical beam theory. The resulting deflections are plotted in Figure 17, Figure 18, and Figure 19, below and shown in Table 4 and Table 5.
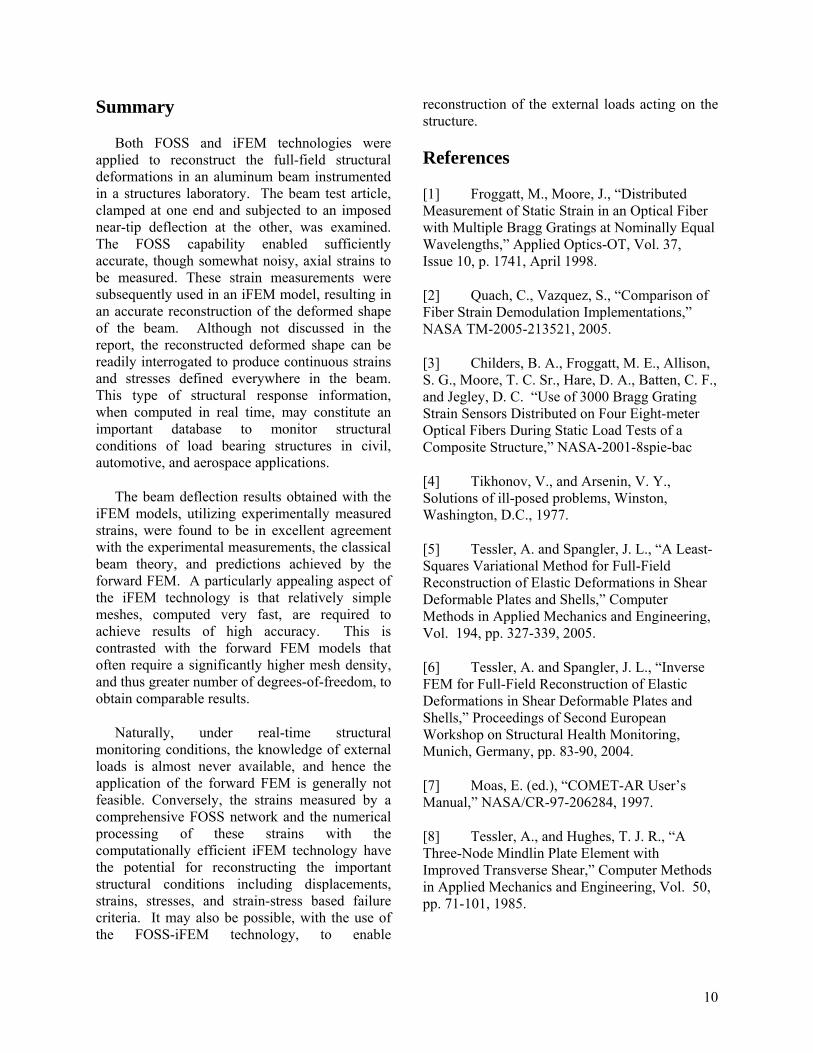
The iFEM model of the ITA employed a three-node, triangular inverse shell element implemented into a user-defined routine in the ABAQUS finite element code. The iFEM model consists of nine such elements, having 14 nodes and 66 degrees-of-freedom. Like the FEM model, only the portion of the ITA beyond the clamped edge is included in the iFEM mesh. Figure 16 depicts the iFEM mesh overlaid on the top view of the ITA.
Figure 16: ITA top view with iFEM mesh overlay.
Note that the iFEM mesh is of much lower fidelity than the FEM mesh, with the latter consisting of 800 elements, corresponding to 446 nodes and 2,676 degrees-of-freedom. Although higher-fidelity iFEM meshes were also examined, no appreciable response differences were observed. Hence, the nine-element mesh was

9
selected because of its simplicity and superior computational efficiency. The practical implication is that, without sacrificing accuracy, ultra-fast runtimes can be achieved – a necessary condition for real-time applications.
The computed deflections are shown in Figure 17, Figure 18, and Figure 19, for the load cases 7401 (gravity load), 7481 (downward point load), and 7201 (upward point load), respectively. In all three loading cases, the FEM results agree closely with those of beam theory. Both the beam theory computations and FEM results are slightly higher than the iFEM and experimental values. Note that in this test the deflection along the ITA was measured at only five locations. Although the measurements are somewhat sparse, they give an adequate sense of the deflection shape that compares well with the analytic predictions.
The screw lever gave the most accurate displacement measurement available. Table 4 gives the value at the screw lever contact point for the measured versus the analytical deflections. Table 5 gives the difference in those deflections. As seen in Table 5, the iFEM predicted deflections are within 5% of the experimental values. This correspondence between the measured and analytical deflections is consistent with the experimental measurement errors involved, and the simplified boundary conditions employed in the analysis.
Table 4: Deflection at screw lever.
Load Case
Exper. (mm)
iFEM (mm)
FEM (mm)
Beam Theory (mm)
7401 -17.1 -16.308 -16.920 -16.960 7481 -36.0 -34.492 -36.130 -36.184 7201 59.2 57.490 59.960 59.493
Table 5: Percentage difference between experimental and analytical deflections at screw
lever.
iFEM FEM Beam Theory Load
Case (mm) % (mm) % (mm) % 7401 -0.79 5 -0.18 1 -0.14 1 7481 -1.54 4 0.10 0 0.15 0 7201 1.73 3 -0.74 -1 -0.27 0
-20
-15
-10
-5
0
5
200 400 600 800 1000 1200Distance along ITA (mm)
Def
lect
ion
(mm
)
ExperimentaliFEMBeam Theory for 7076 ALFEM for 7076 AL
Figure 17: Displacement comparison for Load Case 7401
-40
-35
-30
-25
-20
-15
-10
-5
0
5
200 400 600 800 1000 1200
Distance along ITA (mm)
Def
lect
ion
(mm
)
ExperimentaliFEMBeam Theory for 7076 ALFEM for 7076 AL
Figure 18: Displacement comparison for Load Case 7481
0
10
20
30
40
50
60
70
200 400 600 800 1000 1200Distance along ITA (mm)
Def
lect
ion
(mm
)
ExperimentaliFEMBeam Theory for 7076 ALFEM for 7076 AL
Figure 19: Displacement comparison for Load Case 7201.
10
Summary
Both FOSS and iFEM technologies were applied to reconstruct the full-field structural deformations in an aluminum beam instrumented in a structures laboratory. The beam test article, clamped at one end and subjected to an imposed near-tip deflection at the other, was examined. The FOSS capability enabled sufficiently accurate, though somewhat noisy, axial strains to be measured. These strain measurements were subsequently used in an iFEM model, resulting in an accurate reconstruction of the deformed shape of the beam. Although not discussed in the report, the reconstructed deformed shape can be readily interrogated to produce continuous strains and stresses defined everywhere in the beam. This type of structural response information, when computed in real time, may constitute an important database to monitor structural conditions of load bearing structures in civil, automotive, and aerospace applications.
The beam deflection results obtained with the iFEM models, utilizing experimentally measured strains, were found to be in excellent agreement with the experimental measurements, the classical beam theory, and predictions achieved by the forward FEM. A particularly appealing aspect of the iFEM technology is that relatively simple meshes, computed very fast, are required to achieve results of high accuracy. This is contrasted with the forward FEM models that often require a significantly higher mesh density, and thus greater number of degrees-of-freedom, to obtain comparable results.
Naturally, under real-time structural monitoring conditions, the knowledge of external loads is almost never available, and hence the application of the forward FEM is generally not feasible. Conversely, the strains measured by a comprehensive FOSS network and the numerical processing of these strains with the computationally efficient iFEM technology have the potential for reconstructing the important structural conditions including displacements, strains, stresses, and strain-stress based failure criteria. It may also be possible, with the use of the FOSS-iFEM technology, to enable
reconstruction of the external loads acting on the structure.
References
[1] Froggatt, M., Moore, J., “Distributed Measurement of Static Strain in an Optical Fiber with Multiple Bragg Gratings at Nominally Equal Wavelengths,” Applied Optics-OT, Vol. 37, Issue 10, p. 1741, April 1998.
[2] Quach, C., Vazquez, S., “Comparison of Fiber Strain Demodulation Implementations,” NASA TM-2005-213521, 2005.
[3] Childers, B. A., Froggatt, M. E., Allison, S. G., Moore, T. C. Sr., Hare, D. A., Batten, C. F., and Jegley, D. C. “Use of 3000 Bragg Grating Strain Sensors Distributed on Four Eight-meter Optical Fibers During Static Load Tests of a Composite Structure,” NASA-2001-8spie-bac
[4] Tikhonov, V., and Arsenin, V. Y., Solutions of ill-posed problems, Winston, Washington, D.C., 1977.
[5] Tessler, A. and Spangler, J. L., “A Least-Squares Variational Method for Full-Field Reconstruction of Elastic Deformations in Shear Deformable Plates and Shells,” Computer Methods in Applied Mechanics and Engineering, Vol. 194, pp. 327-339, 2005.
[6] Tessler, A. and Spangler, J. L., “Inverse FEM for Full-Field Reconstruction of Elastic Deformations in Shear Deformable Plates and Shells,” Proceedings of Second European Workshop on Structural Health Monitoring, Munich, Germany, pp. 83-90, 2004.
[7] Moas, E. (ed.), “COMET-AR User’s Manual,” NASA/CR-97-206284, 1997.
[8] Tessler, A., and Hughes, T. J. R., “A Three-Node Mindlin Plate Element with Improved Transverse Shear,” Computer Methods in Applied Mechanics and Engineering, Vol. 50, pp. 71-101, 1985.

REPORT DOCUMENTATION PAGE Form ApprovedOMB No. 0704-0188
2. REPORT TYPE
Technical Memorandum 4. TITLE AND SUBTITLE
Structural Health Monitoring Using High-Density Fiber Optic Strain Sensor and Inverse Finite Element Methods
5a. CONTRACT NUMBER
6. AUTHOR(S)
Vazquez, Sixto L.; Tessler, Alexander; Quach, Cuong C.; Cooper, Eric G.; Parks, Jeffrey; and Spangler, Jan L.
7. PERFORMING ORGANIZATION NAME(S) AND ADDRESS(ES)
NASA Langley Research CenterHampton, VA 23681-2199
9. SPONSORING/MONITORING AGENCY NAME(S) AND ADDRESS(ES)
National Aeronautics and Space AdministrationWashington, DC 20546-0001
8. PERFORMING ORGANIZATION REPORT NUMBER
L-19083
10. SPONSOR/MONITOR'S ACRONYM(S)
NASA
13. SUPPLEMENTARY NOTESAn electronic version can be found at http://ntrs.nasa.gov
12. DISTRIBUTION/AVAILABILITY STATEMENTUnclassified - UnlimitedSubject Category 35Availability: NASA CASI (301) 621-0390
19a. NAME OF RESPONSIBLE PERSON
STI Help Desk (email: [email protected])
14. ABSTRACT
In an effort to mitigate accidents due to system and component failure, NASA’s Aviation Safety has partnered with industry, academia, and other governmental organizations to develop real-time, on-board monitoring capabilities and system performance models for early detection of airframe structure degradation. NASA Langley is investigating a structural health monitoring capability that uses a distributed fiber optic strain system and an inverse finite element method for measuring and modeling structural deformations. This report describes the constituent systems that enable this structural monitoring function and discusses results from laboratory tests using the fiber strain sensor system and the inverse finite element method to demonstrate structural deformation estimation on an instrumented test article
15. SUBJECT TERMS
Displacement estimation; Fiber optic strain; Gratings; Instrumented test; Onboard monitoring; Strain measurement; Vehicle health management
18. NUMBER OF PAGES
15
19b. TELEPHONE NUMBER (Include area code)
(301) 621-0390
a. REPORT
U
c. THIS PAGE
U
b. ABSTRACT
U
17. LIMITATION OF ABSTRACT
UU
Prescribed by ANSI Std. Z39.18Standard Form 298 (Rev. 8-98)
3. DATES COVERED (From - To)
5b. GRANT NUMBER
5c. PROGRAM ELEMENT NUMBER
5d. PROJECT NUMBER
5e. TASK NUMBER
5f. WORK UNIT NUMBER
23-728-30-11
11. SPONSOR/MONITOR'S REPORT NUMBER(S)
NASA/TM-2005-213761
16. SECURITY CLASSIFICATION OF:
The public reporting burden for this collection of information is estimated to average 1 hour per response, including the time for reviewing instructions, searching existing data sources, gathering and maintaining the data needed, and completing and reviewing the collection of information. Send comments regarding this burden estimate or any other aspect of this collection of information, including suggestions for reducing this burden, to Department of Defense, Washington Headquarters Services, Directorate for Information Operations and Reports (0704-0188), 1215 Jefferson Davis Highway, Suite 1204, Arlington, VA 22202-4302. Respondents should be aware that notwithstanding any other provision of law, no person shall be subject to any penalty for failing to comply with a collection of information if it does not display a currently valid OMB control number.PLEASE DO NOT RETURN YOUR FORM TO THE ABOVE ADDRESS.
1. REPORT DATE (DD-MM-YYYY)
05 - 200501-