Embed Size (px)
Citation preview

Structural determination of naturalproducts using spectral methods
Item Type text; Thesis-Reproduction (electronic)
Authors Tempesta, Michael Steven
Publisher The University of Arizona.
Rights Copyright © is held by the author. Digital access to this materialis made possible by the University Libraries, University of Arizona.Further transmission, reproduction or presentation (such aspublic display or performance) of protected items is prohibitedexcept with permission of the author.
Download date 07/05/2018 16:41:45
Link to Item http://hdl.handle.net/10150/566356

STRUCTURAL DETERMINATION OF NATURAL PRODUCTS . . USING SPECTRAL METHODS
Michael Stephen Tempesta
. A' Thesis Submitted- to the.Faculty of the;- DEPARTMENT OF CHEMISTRY
In Partial Fulfillment of the Requirements • ", For the Degree of
MASTER OF SCIENCEIn the Graduate College
. THE UNIVERSITY.OF ARIZONA .
1 9 8 0

STATEMENT BY AUTHOR
This thesis has been submitted in partial fulfillment of requirements for an advanced degree at The University of Arizona and is deposited in the University Library to be made available to borrowers under rules of the Library.
Brief quotations from this thesis are allowable without special permission, provided that accurate acknowledgment of source is made. Requests for permission for extended quotation from or reproduction of this manuscript in whole or in part may be granted by the head of the major department or the Dean of the Graduate College when in his judgment the proposed use of the material is in the interests of scholarship. In all other instances, however, permission must be obtained from the author.
SIGNED: *
/
APPROVAL BY THESIS DIRECTOR This thesis has been approved on the date shown below
- T x C .R. B. BATES
Professor of ChemistryDate

• ACKNOWLEDGMENTS '
.1 wish to thank Dr. R. B . Bates for his patience, ■ encouragement, and time. I also wish to give thanks to Dr. S. D. Jolad for his assistance in this work. I also wish to thank Dr. W. E . Noland for giving me a start in this business of chemistry. . .

TABLE OF CONTENTS
. . ' \ , . ■ . . ' ■ :r pa»e, LIST OF TABLES . . ... . .. V . . . . . . . . . . . viLIST OF ILLUSTRATIONS . . '. .V ,. . ■. •. . .. . . . . . . viiABSTRACT . ... . . . . L; . , . . - . . . . . .• viii
■ PART I: STRUCTURE OF LIRIODENDRIN . . ... 1INTRODUCTION .., . '. . \ . ... .. . . .' . .. . . . . . 2
; DISCUSSION ;. . . . . 4 . . . . . 3• EXPERIMENTAL ■• '. ,. . . . . .". .. . . . . . . . . . 10
U ' ' . PART II: THE STRUCTURE OF HISPIDINE:C13 n.m.r. ASSIGNMENTS FOR FOUR .TRITERPENOIDS FROM TRICHILIA HISPIDA
.. (MELIACEAE) • . , '. . . . . . . . . . ./L , ... ; 13'INTRODUCTION T . / ; . ' , . . . . . ' . . 14DISCUSSION , . . . . . . . . . . L.. .. .. . 15EXPERIMENTAL . . . ... . . . . . . . . . ... . .. . .• . . 21
Hispidone (3) . .. . . . . . . . . . . . '.. .. :. . 21Hispidone Diacetate (12) , . .• •. . ., . ... .. .... . , . 22Bourjotinolone A (2) . . ... . . . . . . . ......... .- 22Bourjotinolone Monoacetate (15) . . •• . 2 3
PART III: STRUCTURE OF ZEYLENOL AND ZEYLENA, CONSTITUENTS OF UVARIA ,-0:
.. .. :. - ZEYLANICA (ANNONACEAE) . . . . . . . I . 24. INTRODUCTION . .. \ I . '. . . , . ‘ . 25
DISCUSSION . . . '. . .'v-. ., ' . . . , • * •. . . , i . 2 6
. '. : ■ ' - iv ' '

' ■ , - ' - V
TABLE OF CONTENTS— Continued
- . . : ’ . ■ . : . . PageEXPERIMENTAL . . , ; ‘.L .: .. .. .. > . V • 4 7
Crystallographic Study of Zeylena (2a) .. . .. .. . . 48REFERENCES' . . . . . . . . 50

LIST OF TABLES
Table13 ■ - .1 . C n.m.r. chemical shifts of lignan (1)
compared with certain shifts in the eudesmin series . . . r . . . . . . . • .
2. Molecular rotation of model lignans compared v v ; with lignan (1) ■ • ; , „ . v
■ ; Majpr fragment ions in the mass spectrum of, • 1 rgnan (1) ■ * ■» . ■ ; * • • « * « * , • , « « • • * *: ; 13 ' .;;; ■' ; :■ , ' , : . : V . " • 34. C n.m.r. chemical shifts of hispidone (3)
and bourjotinolone A (2) compared with chemical shifts of sapelins A (4). and B (5)
-V . - . ' '5. H n.m.r.; chemical shifts (6, CDCi.g) of •zeylenol (6), zeylenyl diacetate (17), and
■r. seneol (18) . . . . . . . . . . - . . . . .• ...6. -C n.m.r. chemical shifts (6 , CDClg) of
' zeylenol (6) and zeylena (7) ... . ... . . , . .7. High resolution exact mass measurements on
. certain fragment ions from (6) and (7) . ., .8 . Final positional (x 10^) parameters with
estimated standard deviations in parentheses : ' . : . ■. . / . ■> - . ...- , . , >
9.; - Thermal parameters with estimated standarddeviations in parentheses . . . . . . . .
. '■. : ' o ' ■ ■ ■ : '' . ' ■10.' Bond lengths (A) with estimated standard. .' deviations in parentheses , . .. . . . .
11. • Bond angles (°) with estimated standarddeviations in parentheses' .. .. . . . . . . .
12. n.m.r. chemical shifts (6, CDClg) of. ■ zeylena (7) and zeylena acetate 120) with
... crystographically determined dihedralangles in parentheses after vicinal
; coupling constants . .. . . . . . . . . . . . .
' t ... ' . ' . ■ . ■ Vi ■
Page ■
7
9
17
28
31
32
' 36
„
39
” 40
. 43

LIST OFILLUSTRATIONS
1. Major fragment ions in the mass spectrum of ,- t - zeylenol (6) with % of base peak in v- ,
S • » • • • • '• ■ • ,! •• ; • e. • •
Page
302. MajOr- fragment ions in the mass spectrum of
zeylena. (7.) with % of base peak inparentheses . . . .■ . t i . . . ' . ' V 35:
3. Stereoscopic view of zeylena (7) . . . . . . . 414. Biosynthesis of Uvaria compounds from
. benzyl benzoate (24) . . . . . . . . . . . . . 4 5
. • :r;4-:v-
vii

.ABSTRACT
From Penstemon deust-us, a cytotoxic agent, lirio- dendrin, was shown on the basis of spectral data to have structure (1). The- stereochemistry of the lignan portion was demonstrated by three dif f erent methods
Two triterpinoids from Trichlia hispida (Meliaceae) were shown to be hourjotinolone A- (2) and a new isomer, hispidone (3). • Identification was based on spectral evidence and confirmed in the latter case by direct chemical
' . - ' : : - : ' :. ' ]3 ' : corre1atioh w11h sapelin B (5). Complete " C n.m.r. assign- .ments (except within gem-dimethyl.groups) were made for sap'elins A (4) and B (5), bqurjbtinoline A (2) , and hispidone (3):. . I; ' : :
.The structures of zeylenol (6) and cytotoxic zeylena (7) , both isolated from IJvaria zeylanica, were determined by spectral methods, and the latter structure was confirmed by X-ray analysis. Zeylena (7) is one: of few examples in nature of a compound arising from an intramolecular Diels- Alder reaction. - '\ ' '

• ' PART I . . '
STRUCTURE' OF LIRIODENDRIU

INTRODUCTION
/ From the- dried plan (roots, stems, leaves, flowers,and fruits) of Penstemon deustus, collected in California in May, 1973, a substance with anti-tumor‘activity and m p :2 65- 266°C was separated by Dr. S . D. Jolad and coworkers - in the College of Pharmacy of The University of Arizona.. . Little was known regarding its structure. The IR spectrum suggested the presence of a sugar portion, an aromatic portion, and methyl and other aliphatic groups.' The mass, spectrum showed an apparent molecular ion peak of 4 1 8 which, when coupled with the;elemental analysis, gave the molecular formula of C ^ H ^ O ^ . - - , ,

DISCUSSION ' ■
' We ran "H and C n.m.r. spectra of the substance, which- were at first confusing. The broad band decoupled
C n.m.r. spectrum contained only 14 peaks, which seemedreasonable for a compound with molecular weight 418, but no
- . ■ ■ ; ' ' ' " 1 3structure could be found which fit all the data. .The Cand H n.m.r. spectra did show the sugar to be a (3-D-glucose and did show CH_ 0- and 0-6-glucose substitution on the aromatic ring; Only when we decided to assume that the molecular ion.peak was too weak to. see, and that the compound had a molecular weight much larger than 41.8, were we able to deduce the structure. Finding syringin (8) as a model compound, and "dimerizirig" i.t in a common way for cinnamyl alcohols, we were led to structure (1 ), with molecular weight 74 2; both sugar units were evidently replaced by hydrogen to give the mass spectral peak at 418.
This constitution had been forwarded for a sub- stance, termed liriodendrin (mp 269-2.70°0) , from ' the bark of Liriodendrin tulipifera, by Dickey [1]; direct comparison of the substance from Penstemon deustus with liriodendrin kindly.provided by Dr . Dickey established their identity. However, the stereochemistry of the lignan portion of liriodendrin had not been determined by Dickey. He reported its hydrolysis to give three isomeric aglycones: .

4
0-8-D-G1ucose
OCH
' A.16(m) \ 3 .15 (n)\
4.64(d, J-4 Hz) 6 . 63 (s)
iCH„, 3.72(g)
0
OH
CH
D - (3-Glucose
H CO

Lirioresinol-A [ (+)-episyringaresino] (9a), Lirioresinol- B [ ( + )-syringaresinol] (10a), and Lirloresinol-C [( + )- diasyringaresinol] (11a). Acid hydrolysis gave (9a) and(10a) whereas enzymatic hydrolysis was claimed to yield (11a). He believed that epimerization accompanied the acid hydrolysis and left open the stereochemistry of 1iriodendrin itself.
Ar Ar
Ar Ar
(9) (10)a: AR = 4-hydroxy-3,5-dimethoxyphenylb : Ar = 3,4,5-trimethoxyphenylc: Ar = 3,4-dimethoxyphenyld: Ar = 3,4-methylenedioxyphenyl
(11)

\ T h e stereochemistry of liriosinols (9-lla) had been established,by B r i g g s G a m b l e , and.Couch [2], who isolated the. dimethyl ethers (10b) and (11b) from Macropiper excelsum •They.found that the substance believed by Dickey to be lirioresinol-C (11a) : was in fact, impure.lirloresinol-B (10a)
7 but had no liriodendrin and did not comment on its stereo- chemistry. • . h-p 7 ; Vg;'. 7: . /" ■ . 7': Y i •
: As mentioned above, .the C n.m. r . spectrum showed, only 14 peaks for the 34 carbons. : This finding precluded the possibility of an unsymme.trical (equatorial-axial) configuration (9) . The diaxial configuration (11) was ruled Out in three ways for the.lignan. First, comparison o f •the proton chemical shifts [see numbering on formula (.1) ] with • those of isomeric aglycones .(9a, 10a, 11a) reported by
. Briggs et al. [2] which follow the general, criteria established by Birch, Macdonald, and Pelter [3] and Atal, Dhar, and Pelter [4] with (10c) and (lid). According to Pelter, the signals for the benzylic protons in the diequatorial series appear between 6 3.75 and 4.7 whereas in the diaxial series they appear between 6 3.25 and 4.0. Thus, finding the signals due to protpns at C-2 and C-6 at 5 4.64 in the "4l n.m.r, spectrum of the lignan strongly suggests that it .
• is of the diequatorial type (10) ; the other "*"H n.m. r . shifts also fit well for this stereochemistry. Secondly, comparison of the C n.m.r. shifts (Table 1) of 1 1 carbon atoms, which are characteristic of the stereochemistry of

713 ' ■ . . ■Table 1. C n.m.r. chemical, shifts of lignan (1) comparedwith certain shifts in the eudesmin series . a
■ - - ■ , . ' C ■ ' ■ :Eudesmins .Atom ' : ' h Lignan (1) •EQ-AX.(9c) . DIEQ (lOc) DIAX (11c)
Fused furanc - i..C-5C-.40 8C-2C-6
53.6 (d)
71.3 (t)
■ 85.1 (d)
[54.44?t s o . i i j[70.941 { 69 , 84 j
15316 j
87 81.9
54.31
71.72
85.77
49.49
68 , 78
'■ : 8 3.96
Aromaticc - i 'C-2 '
: C-3' C-4' OCII.
133.9 (s)104.3 (d) 152.7 (.s) 137.2 (s)56.4 (q.)
133.51130.81 ] 134.04 131.38
Glucose'0-1"C-2"C-3"C-4"C-5"C-6"
102.7 (d) 74.2 (d)7 6.5 (d) 70.0 (d) 77 •2 (d) 60.9 (t)
Methyl 3-D-glucose104.0 (d) 74.1 (d)
: 76.8 (d)' 70.6 (d)
76.8 (dj: ;'V 61.8 (t)
aAll .values given as p.p.m. downfield from TMS (6) b.In GD-SGCD.,.3 3 ;■cIn CDCI3.

attachment to the central bicyclic skeleton, clearly established the diequatorial configuration for the lignan, in agreement with the deductions derived from . H n.m.r. 'spectrum discussed above. A similar comparison'of other.•i 3 ■ ' : -' \C n.m.r. shifts (Table 1) provides strong support forthis view. For all four types of carbons (C-l, C-2, C-4, and C-l1):which can. be used the values for lignan (1).are much closer to those for the diequatorial model (10c). Thirdly, the method of molecular rotation differences (which should work quite well here with the two sugars well separated from the central chiral portion of the molecule) . gives further support to the diequatorial arrangement for lignan (1 ) and in addition, shows its absolute configuration to be as shown; pertinent values are given in Table 2.

Table 2. Molecular 'rotation, of model lignans compared with • " lignan (1). • V :
Average ' value .
- Value for (1)Lignan , ; ' - Predicted3 , Observed10a210b2
+ 6 2° ’ +4 7°
+259° ; +210° ) /
DIEQ "3 > ■ +242° -118° '10c10d3
. +64° +71°
':+247° +251°, \ :
1 VO o '
o ;
(11b )2 +284° +1267° -•DIAX (He)3 +316° +1220° > +1283° ' +923°.
(llc)c +385° +1363° ■
^ - ' - ■ 'Estimated by adding the above average value to.twice the rotation of -63d .([MIq - 180°) observed for p-me thoxyphe ny1 g-D-glucoside [6].

.EXPERIMENTAL
Melting points were determined*on a Kofler hot-stage apparatus■and are uncorrected. Carbon and hydrogen analyses were carried out by Chemalytics, Inc., Tcmpe, Arizona, and University Analytical Center, Tucson, Arizona. Optical rotations were measured in pyridine using a. Perkin-Elmer ' ■ 241MC polarimeter.. Ultraviolet (UV) and infrared (IR) ; . spectra were run on Cary 15 and Beckman IR-3 3 spectrometers, respectively. . H n.m.r. spectra were run at 60 MHz on a
-v: ;; . . ■ ■■. - - ,Varian T-6 0 spectrometer and at 250 MHz on a Bruker Spectro- spin spectrometer and values are given as p.p.m. downfieId\ ' ' ' ITfrom TMS (6). C n.m.r. spectra were measured in d^-DMSO
at 90 MHz using a Bruker WH-90 MHz using a Bruker WH-90 spectrometer. Mass spectra were recorded on a Hewlett- Packard 5930A spectrometer. / ■ :■
: : Liriodendrin (1) did not dissolve in most solvents.but crystallized from pyridine a s 'colorless needles, mp 26 5-; 266°C, and was optically active, [a]D - 12.1°. Anal. calcd. for C34H46018: C, 54.98; H, 6.24. Found: C,' 55.26; H,.
6.15. / y ; p ; • . ' . : p. i b ' • ■ ■ ' .The masS spectrum (Table 9) was very informative.
The lower part of the spectrum (up to m/e 418) was very close, to that of lirioresinol’-B dimethyl ether (11b) with appropriate shifts to lower mass numbers. The lignan did

1 1
Table 3. Major fragment ions in the mass spectrum of• lignan; (1) -- 'Figures in parentheses represent
analogous ions in the mass spectrum of lirioresinol-B dimethylether (10b).
Fragment ions R . - m/e10a : ■418 (446)
• 10a. - CH2d . 388: (416)10a - OCHo . ■387. (415)
■ ' ' :Z --C5H6°2 . 251-g5h7o+: ■ ' - 2 36 (250)
:-C5H60+ ' -coch2ch2oii+
235 (249)' ■ HgCO 226
" HO " / 0 / " " R J -,CH=CHCH2OH+ 210 (224)
. ; % c o --:-ch2gh-ch2+ ;. -c=o+
193.m
(2 07) (195)
-CII2+ 16 7 (181)
X -H . ' : - ' 154, (16 8)

not display a recognizable molecular ion peak but did ■ exhibit an intense peak at m/e 418 (base peak) , correr ■ ■ spending to (11a) derived.presumably from the molecular ion by fission at the two glucoside linkage with transfer of two protons;. This aglycone (11a) then gives rise to all the principal fragment ions at m/e 388, 3 87, 251, 236, 235, 226, 210, 193, 181, 167, and 154 by a breakdown pattern charac- teristic 6f aryl substituted furofuranoid lignans [78)..
The IR spectrum of.the lignan suggested the presence of a 6-glucose moiety (890 cm , 6-sugar [9]). with a broad hydroxyl band centered at ■3400.cm , phenyl ring with an ' isolated H (1595, 1500, .1460, and 805 cm ) , CH^-O linkage(1416 cm ^ ) , and methyl (.13 65 cm ) groups. This was sup-
■ • ' ' ’ 13' ■ ' ' . .ported by the C n.m.r. spectrum (Table 1) of the lignan‘ ' ' ■■ ■ J_ ’which clearly indicated twofold symmetry. The H n.m.r.,
shifts, are given in structure (1.) . 'Lirioderidrin demonstrated an activity of 147 test/
: control (T/C) at 12.5 mg/kg in the PS test system.• Activityin the PS test systems is defined as an increase in the• survival of treated animals.over that of controls resulting ■ \in a T/C > 1 2 6 [ini. .

■PART ' II
THE STRUCTURE OF HISPIDINE: C n.m.rASSIGNMENTS ■ ; FOR FOUR TRITERPENOIDS ■ FROM TRICHILIA •;
HIS PI DA . (MELIACEAE)

INTRODUCTION
/ From the' leaves of Trichilla hispida, / sapelin A (4.) ,. sapelin B (5), hourjotinolorie A (2), .and a new triterpenoid , which we have named hispidone (3). [1.1 , 12] , were
• separated from the ethanol extract by Dr. S . D . Jolad.and . coworkers in the College of Pharmacy of The University of
Arizona.. . Two.were identified.from their physical properties as sapelins A (4.) and B (3) . The other two appeared to be closely related from the IR, but further work was '
' needed to elucidate their structures.- .
SfKi-v-S

: ' DISCUSSION ' '
Characterization of the four compounds was done' ■' 13 • ' ' ' ^mainly by ' C n.m.r. comparisons between them. Nearly
- . 2;" 3' " 3 ‘ -' - ;■ ' ■ " ■.1complete C n.m.r. assignments were made for all fourcompounds using their similarities and differences instructure. Also, we calculated the carbon shifts expectedfrom the following empirical formulas [13]:
Methyl = 6. 80 4- 9 5 6 ^ + 17.83g2 + 25.483^ “ 2.99y + 0.4 ; ;Methylene - 15.34 -1- 9. 7 5 ^ + 16. 70S2 + 21. 43(H3 - 2. 69y + .25
- ; Methinyl + 2 3.46 + 6 . 6031 + 11.1432_ + 14 . 703^ - 2 ; 07y'■ : Ouaternary :27y 7i + -2; 2 : 6 :+;3: <-9'6B 2; + 7 . 33 33 + 0. €87 ' / ,
' Sapelins A (+) and B (5) were compared with knownsamples and found to be identical in all respects. How- • ever, no C n.m.r. shifts had been reported. This fact, along with the close similarity in structure, led us to
■ 13 • - ' : V ■ ■ , ' ■ '■:choose C n.m.r. as. the best tool for fully characterizing hispidone (3) and identifying bourjotinolone A (2).
Hispidone (3) failed to crystallize but was• ■ ' ' . . y 3 ■ ' - ■; ■ - 'homogeneous as judged by TLC and C n.m.r. It displayed an intense molecular ion peak at m/e 472 correspondi-ng to a.molecular formula, C.^H.o0 ., consistent with its elemental . .. 3U 4 o 4 , • . : ■ ■analysis. The IR spectrum showed bands for the presence of . hydroxyl (344 0 cm "S , carbonyl (170 0 cm ) , gem-dimethyl . •

(1385 and 13 70 cm ), and trisubstituted double bond (835 cm ) groups. Except for the band due to carbonyl, the spectrum was very similar to that of sapelin B (M , which contains two more hydrogens. Similafly, hispidone.(3) provided a mass spectrum very close to that of sapelin B (5) but with appropriate shifts to mass numbers lower by two for almost all the major fragment ions in the upper mass region, (m/e 250-472) . The • H n .rrur. spectrum of hispidone. •, (3) indicated seven tertiary methyl groups, an olefinic . proton (85.3), and a primary-tertiary ether linkage (broadened AB pattern at 53.4 and 3.6, J - 10 Hz).
The formation of a crystalline diaootate [(12), M .556], with accompanying disappearance of the OH band i n •the IR spectrum and the appearance of signals for two acetate groups (62. 00 and 2.05) . in the "*"H n.m.r. spectrum, clearly suggested that both hydroxyl groups were secondary.
The above structural features suggested that ■ hispidone (3) might be the 3-^ketone corresponding to sapelin B? (5) . • C n.m.r. spectral comparison of (3.) and (5.) (Table ' 4) supported this view with almost perfect identity of the shifts except in the vicinity of ring A. This close correspondence,in shifts suggests that the stereochemistry at all centers is the same in the two compounds [14, 15] . . 'Since theastereochemistry of sapelin B (5) has been established [14, 15] hispidone must be (3).

17
Table 4. ■ c n.ra.r. chemical shifts of hispidone (3) and,hourjotinolone A (2) compared with chemical shifts of sape 1 ins A. (4) and B (5)'.
Atom . ' 4 2 5 ' .3c-i •. 31.3 ' .38.5 . 31.3 38. 6C-2 - 25.4 34.9 25.4 34.9G-3 : ; - v 76.3 217.1 . 76.3 217.1G-4 37,6 / 47.9 37.4 \ 47.9C-5 44.6 ;• 5 2.4 c;. : . 44.6 . : 52.4G-'G' 23.9 ' 24.3 23.9 24.4G-7 , ' 118.2 : ■ 118.1 f '.. 118:1 118.1C-8 ' 145.9 : 145.7 :: 14 6.0 ,14 5.8G-9 48.6 • 48.4 ; V i ' 48.6 4 8.4G-io : ■ 34.8 v 34.9 ' V. .. 34.8 34.9c-11 G . 17.9 18.2 17 . 9 18. 1C-12 • 33.1 - . 32.9 32, 8 . ' 32.6C-13 - 43.3 ' 43.2 : ' " 43.4 4 3.4C-14 . ' 51.4 51.2 51.4 51.3.C—15' : 33.9 33. 9 ■ / ' ■ 33.9 . 3 3.9C-I 6 ■ 27.3 27.4 28.2 2 8.2C-17 ' 44.8 44.7 47.7 4 7.5G-18 ' , 13.0 12,8 13.0 • 12.8C-l 9 • 21.9 ■ 21.6 21.9 21.6C-2 0 ■ 37.6 . 37.5 ' ; 38.6 -. 38 . 6G-21 . 70.2 - • 70.1 64. 6 64.4C-2 2 26.5- • ' 36.4 37.4 . 37.5C-2 3 64.7 ' 64.6 68.7 '' ' . " 68.7C-24. - ;. 86.5 86.4 80.8 • 80 . 8C-2 5 ' 74.2 ' : 74.1 76.3 76.2C-26 23.9 ; 23.9 : : : - 22.2 : 22.4C-27, > 28.5 28.4 26.5 26.3C-2 8 ' 27.4 ' l: :.t:'-'27 4'.i ' . . 27.3 • 27.4C-2 9 ' 27.8 : 24.5 ■ 2 7.8 ■ 2 4,6C-30 22.2 ' ... 22.3 : •:' 22,2 . 22.4

Direct proof for the suggested structure of hispidone (3) was' provided by Dr . Jo lad who converted, sapelin B (5)' to the corresponding acetonide (13) which when oxidized with Jones reagent yielded (14), identical in all respects .. [TLC,. mp, mixed mp (no depression) , and IR] with a sample prepared by treatment of hispidone (3) with acetone and a catalytic amount of concentrated H^SO^ at room temperature. It may be pointed out that the easy formation of hispidone acetonide fl4)under mild conditions precluded the possibility of a cis .(eryth.ro) . conf iguration for the 1,2-diol [12]. ■ : . '
. The other triterpenoid, isomeric with hispidone (3) was identified as- bourjotinolone A (2) as follows. Elemental analysis and a molecular ion peak at m/e 472 in the : mass spectrum.indicated molecular formula C3qH48°4 • The melting point (167~168°C) and specific rotation (-30.3°) were fairly close to those reported (17 6°C, -34°) for bourjotinolone A [12]. Except for the carbonyl peak, the IR spectrum of this triterpenoid was very similar•to that of sapelin A (1). and the mass spectrum exhibited a frag- ' mentation pattern nearly identical to that' of (&) but with appropriate shifts to mass numbers lower by two.
... The H n.m.r. spectrum of this triterpenoid and 1 its monoacetate (T5) [IR,: 3500 cm “S mass, M+ 514] closely matched the' values reported [12] for bourjotinolone A and its monoacetate. (15) had mp 145-146°C and;[a] -50°

(reported [12] for bourjotinolone A monoacetate: 148°C and13 ■ . ■ ' ' .
-107°). The C n.m.r. shifts given in Table 1 coupled withthe data presented above show clearly that our.triterpenoidhas structure (2); the shifts which should be similar in the■four compounds in Table .4 are all within 0. 2 ppm of. oneanother and in the vast majority of cases are within 0.1ppm. (2) is the structure proposed for bourjotinolone A.[12], which unfortunately was not available for direct com-
■parison. While we do. not understand the discrepancy of 57°• in the specific rotation of our monoacetate (T5) and that•reported [12] for boutjotinolone A monoacetate, the weight ',of evidence strongly indicates that our triterpenoid and •bourjotinolone A are indeed both (2). .

•oz\ L . z
x l v
X Y Z
4 11,a-OHRi H
2 0Ri H
1 5 0Ri Ac
5 ll .a-OHK2 H
3 uK2
II
1 2 0R2 Ac
1 3 H, ft-011R3
R31 4 0
fOO

EXPERIMENTAL
Melting points were determined on Kofler hot-stage apparatus and are uncorrected. ; Carbon and hydrogen analyses were.carried out by University Analytical Center, Tucson, 1 Arizona. Optical rotations were measured using a Perkin- Elmer 241MC polarimeter. ' Ultraviolet (UV).and infrared (IR) ' spectra were ru.n on Cary-15 and Beckman IR-33 spectrometers, respectively. II n.m.r. spectra were run at 60 MHz on a Varian EM360L spectrometer and' '^C n.m.r. spectra were run at 90 MHz using a Bruker WH-9 0 spectrometer; in both cases shifts are given as ppm down fie Id from TMS (6 )•. Mass spectra were recorded on Hewlett-Packard 5930A and Varian 311A spectrometers.
Hispidone (_3) . .v This substance remained amorphous but was homogeneous/ : : ■ 25 ‘ ; ' ' ■on TLC, [a] D -35° (c, 1.-355 CHClg) . . The IR [ (CHClg) 344 0,,1700, 138 5, 1370, and 835 cm"1], 1H n.m.r. [(CDCl^), 5.3 (m, 1H, 7-H) ; 3.3-3.9 (m, 4H, 21-211, 23-H, 24-H) , 1.3 (s, • .3H, 2 6-Me or 27-Me), 1.15 (s, 3H, 26-Me or 27-Me), 1.1 (s,3H, 19-Me) , 1.05 (s, 6H, 28-Me; and.r29-Me) , 1.0 (s, 3H, 30-,Me) , and 0 . 8 (s , ' 311,. 18-Me)]., and mass • [m/e 472 (M^) ] : spectra were in accord with structure (5). Anal, calcd. for
C30H4.8°4: C" 7 6 • 2; H ' 10.2. ’ Found: C, 7.5. 8; H, 10.6.

' '■ ; v ■ ' : ' , , ■ - ' '■ 22• . •’ Hispidone Diacetate (12) . ■ " ■ . 7 ;
Acetylation of hispidone (3) in pvridine-acetic anhydride at room temperature overnight yielded a residue. ,
„ which was crystallized from methanol as colorless rods, mp 210°C, [a]p5-45° (c, 1.4 CHCl^). The IR [(KBr) 1735, 1700,1380, 1365, 1240, and 830' cm""1] , 1H n.m.r. [ (CDClg) 5. 3 (m,1H, 7-H) , 5.05 (m, 211, 23-H and 24-H) , 3.75 (d, 1H, J = .13Hz, 2.1-H) , 3.5 (d, 1H, J = 13-Hz, ■ 21-H) , 2.05 (s, 3H, OAc) ,2.00 (s, 3H, OAc), 1.2 (s, 6H,•26-Me and 27-Me), 1.1 (s,3H). , 1.05 (s., 6H) , 1.0.; (s, 3H) , 0.8 (s, 3H, 3 0-Me) ] and mass[m/e 556 (M+ ) , 541; (base), 523, 496, .481, 463, 439, 436,42 3, 421, 403, 383, and 367] spectra were in accord with structure (12).. Anal. calcd. for C , 73.47; H,9.48. Found: C, 73.38; H, 9.35.
. Bourjotinolone A (2)= This substance, crystallized from isopropyl ether,
had mp 167-168°C (lit. [12] 176°C) and [a] i:3-30. 3° (c,; : : / : . : . ■ . ' ■ '■ ' \ • . ■ D . ' . • - ' .
; 1.575 CHC13; lit. ,[12] -34°) . The IR ,[ (KBr) 3330, 1700, ,■ : -1 ■ I - ' . •'1380, 1365, and 828 cm ], H n.m.r. [ (CDCl^) 5.3 (m, IE,
7-H) , 4. 05 (m, 1H, 23-H) , 3.95 (~d, 1H, .J f 11. 5Hz, 21-H) ,3.4 (~d, 1H, J = 11,5 Hz, 21-H) , 2. 9 (d, III, J = 9 Hz, 24-H) , 1-3. (s, 6I-I, 26-Me and 27-Me) , %l.)/s, 3H) , 1.05 (s, 9H)0.8 (s, 3H, 30-Me)], and mass [m/e 47 2 (M ), 457, 454, 43 9,4 25, 421) 396, 381 (base), 367, 363, 311, 299, and 297]

spectra were in accord with structure (2). Anal, calcd. forC onH.o0.: C, 76.2; H, 10.2. Found: C, 76.02, II.- 9.96.JO 4 8 4 . • . ; . . . '
This was prepared from pyridine-acetic anhydride at . room temperature overnight and crystallised.from pentane as colorless tiny rods, mp 145-146°C (lit. [12] .148°C) ,[a]25-50° (c, 1.035 CHCl^; lit. [12] -107°). The IR [ (KBr)3500, 1730, 1706, and 1239 cm"1], 1H n.m.r. [(CDCl^) 5.35 (m, 1H, H-7) , 5.1 (m. III, 23-11) , 3.95 (~d. III, J = 11 Hz; 21-H) , 3.55 (~ d ,’ III, J - 11 Hz, 21-H) , 3.2 (d. III, J = 9 Hz, /24-H), 2.05 (s, 311, OAc), 1.2 (s, 6H,. 2 6-Me and 2 7-Me) , . .1.15 (S, 311) , 1 .1 (s, 6H) , 105 (s, 3H) , 0.8 (s, 3H, 30-Me) ] ,and mass [m/e 514 (M ), 4 99, 4 81, 4 55, 454, 4 39, 421, 39 6,381 (base), 367, 3 63, 311, 29 9, and 297] spectra were in accord with structure (1:5">.. Anal, calcd. for C32H 5QO5 :C, 74.7; II, 9.8. Found: C, 74.8; H, 10.0. ■■
PART I IT
STRUCTURE OF ZEYLENOL' AND ZEYLENA, CONSTITUENTS \ OF UVARIA ZEYLANICA . (ANNONACEAE)

INTRODUCTION
Prom the methanol extract of the roots of Uvaria zeylanica (Annonaceae), .two new crystalline compounds, namedzeylenol and zeylen.a, ' have been. isolated. Evidence is presented that zeylenol, ^21^ 20^7 ' ^ominor constituent, has
v structure (R) and that zeylena, ^23^20^5' ^ major constituent, has structure (7) . , , Benzene oxide (16) :' is an apparent biogenetic.precursor for these two and other substances found in Uvaria species; its conversion,of zeylena (7) involves addition of E-cinnamic acid followed by an intramolecular Diels-Alder reaction. .

, . ... DISCUSSION - '
. . The methanol extract ;of the roots of Uvariazeylanica L. (Arinonaceae) yielded two new crystalline compounds y zeylendl •.(f:)' and zeylena (7-j - ■ Their characterization. and .biogenetic relationship to other Uvaria V'r' constituents are described herein. . - ;.r ■
Zeylenol , mp 114-145'°C, . analyzed for C21H20O71.v w t . by El and Cl mass spectra, 384) It exhibited
A 22 7 nm (e 16457), the high intensity suggesting.the ,: max ••' . - ' . ' . . r y - .. ... / ' ' - ;. :'presence of at least two chromophores. The IR. spectrum ; indicated secondary and tertiary hydroxyl groups (3590,3460, ' 1372, 1110, 1065 cm ), an alkene linkage (3080, 3 02 0 cm ), an ester group (17 20, 1270 cm ), and a monosubsti- tuted phenyl ring (1601, 1582, 1490, : 700 cm. ) . ; . The • fl.n.m.r spectrum of zeylenol■ (6) is summarized in Table 5; ' ■ tthe pattern of four aromatic protons absorbing at 6 8 . 0 and. ;.. at 6 7.55 . indicated two benzoyl groups. . - 'v .
, Zeylenol. (6) formed a diacetate (17) whose H .f..vn.m.r. spectrum.. (Table 5) was' very, similar to that of. seneol .
, a constituent of the fruits of Uvaria catocarpa [15] .The close correspondence in shifts (except, of course, inthe vicinity of C 6 , where, the substituents differ) coupledwith very similar molecular rotation (17, [M]n — 189°; ]8 ,
25 ■ v ■ - I.]... -484°) suggested that the stereochemistry at all ■.' - . ■ 26

7"
O
PHR' O R
R jV R2 * 3'
6 11 . O ) ^ ) , 7
17 Ac (CO) 4) 2018 Ac Me 21
2223
U
AcH; 5,6,l",2",3",4",5",6"-ocCnhydro
2-ketone2-ketone; 5,6 ,1",2" , 3",A" , 5" , 6"-oc t ahydr.
NJ

Table 5. H n.in. r .• chemical shifts (5, CDCI3) of zeylenol^■ ■' (6) , zeylenyl diacetate (17) , :and Seneol (18) .
i'T -.: - i' s -1'- ' -v' ; 17 ' isH2 , 4.16 ' ■■■ 5.45 i . ' 5.29 .H3 4.27 5.70 - 5.66114 ' / 5.89 ; . ' 5.95 ■ ' 5.84 ■.H5 5.89 ' 5.9 5 ' 5.70H6 5.67- ' ' 5.80 ' -4.08 .
f - ' / 1 :65 ) :: ' 4: ?5 (%)J=12 Hz J=13 Hz -
Aromatic 7.25-8.1 (10H) 7.30-810 (10H) —OH I 2.95. (3H) 2.92 (1H) — :OAc '' — 2.2 3 and 2.2 6 1.7 6 and 2.00

• centers is the same in,both compounds. . Since: the; stereochemistry of senedl (18) was established to be .as shown in(18) '[15], zeylenol and zeylenyl diacetate are presumably'
■ V . ■' ' ' ' - 13 ; ■ : • .(6) and (17), respectively. The Cn.m.r. chemical shiftsand off-resonance multiplicities (given by a letter afterthe shift value' in Table 5 supported structure. (6) .forzeylenol; corresponding data are not available for seneol(18) . r i ; : :
The mass spectral fragmentation pattern (Figure 1)of zeylenol (6), also supported, the proposed structure. Theelemental composition of all peaks shown in Figure 1 wereverified by high resolution exact mass measurements (Table7), and where indicated, metastable peaks substantiated theproposed transformations. The M-cfjCC^H species (m/e 262) :broke down by a pattern similar to that observed forseneopoxyde (19), another Uvaria catocarpa constituent [15],suggesting that a large portion of the m/e 262 ion was asimilar epoxide a s .shown. The mass spectral fragmentation'pattern of zeylenyl diacetate (17), which was very close tothat of seneopoxyde (19), conformed well to this scheme. -
. . '■ ■ ■ . ./■/ - . y . 25 ■ : ■. ,.Zeylena (7) , mp 204-205°C, . [a] D -13 6.3°, gave an elemental analysis corresponding to a molecular formula ^23^20^5 consistent with the molecular weight 37 6 provided '' by ElMS. The CIMS, however, displayed at 752,"suggesting . that zeylena either had molecular weight 752 or thermally "
formed a dimer in the ion source prior to ionization. The ■

30
Figurc
-II20002 <j'0zCc: •- a:
Oilm/e 2 IV ( 31)
r H Ull
M* 1134 (O.U)
[cGn5cocti I *m/c 122 (37\)
vllm/3 100 (141)
/I
1Cllm/e 262 (B*.)
C 6ll5C E O m/c 105 (1001)
C6"y»m/e 77 (001)
m/c :.3l ( 1G\)ii
V
m / ; 20) (2111
Ch"m/e 2 14 (41)
C:uHm/e 110 (111)
OlIC-/ ■ClIjO
<1 V"
BzQCH EOn/e 163 (261) m/v 1 I I (111) m/c 110 (241)
OHm/e 00 (711)
Major fragment ions in the mass spectrum of zeylenol (6) with % of base peak in parentheses.

3113 ' - - ■ ' ■ .. ; - v - .Table 6 . . C n .m . r . chemical shifts ' (<5, CDC1-,) of zeyl'enol
' (6) and zeylena (7) . ■ ■ .‘i ’ ; . I : ^
Atom; ■ ''"I. \ ' -6:; - " ;ci ■ ' : ' 76.0s ' : 51.2 sC2 . 68.7d . V ' 73.OdC3 70 . 9d . - 3 3.3dc4 ' ■ - 27.Od - . - ' V ' ' 47.3dC5' . : 129.dd . 1.2 7. 7dC6 ; 74.4d ' - 132.3 d-C 7 ' ' ' , . : 66 ..81 ' 62. 3tCl' : < . 128.5s ■ .. : 139.2sC2 ' 129.9d . ; 128.4dC3 ' 128.5d ' 12 9. 5 d-C4V • ' 133.5d . 127.5dcv 165;Os , : 45.9sC8 ' . 49. 2dC9 1 ,173.0sCl" ' ' -V 128.,5s . 128.4sC2" 129.9d . 12 9.9dC3" .. 12.8-.5d .128 . 8dC4" ' ■ ' . 133.54.- ■ .. / 133. 9dC7" 165.0s 16 7.3s

32Table 7. High resolution.exact mass ■ me a s urement s on certain
•' fragment ions from (6) and (7).
• Fragment' ions fError . ;
Mass observed ,: Mass calculated : ■ (mmu) Formula ■Zeylenol (6)
262.0850 - / 262.0841 : 0.9 \ Cl 4 « l 4 %249.0763 ; 249.0763 ' 0.0 C13II13052 44. 0742' '244.0736: ■ 0.6 ;C14xl204231.0660 2 31.065 7 0.3 ; C13H11°4203.0718 ' 2 31.0 7 08 / ■ 1.0 C12H1103190.0629 190.0629 0.0 . Cll1110O 3163.0400: 163.0395 0.5 : C9H7°3140.0501 140.0473 . 2 .8: • :C7H8°3111.0473 111.0446 2.7 ; ; C6H702110.0399 .110.0368 ■ . . . 3.1 . •C6H602 ' :
. 105.0369 105,0340 2.9 . G7H50 ■ .
■ 99.0457 . 99.0446Zeylena (7)
■ ' 1.1 - ': C5H702;:' :
- 254.0955 254.0943 1.2 C16II14°3210.0700 210.0681 1. 9 ■ C14li10°2210.1074 210.1045 : 2.9 . C15H14°209.0957 209.0967 -1.0 ci 5 % 3 o:;
; 208.0896 ; 208.0888 0.8 • ' C151I12°181.1003 :•181.1018 -1.5 C14II13-.179.0848 179. 0.836 ': -1.2 G14®11 'I168.0 914 168.0889 -2.5 C13U12'167.0854 167.0861 . . -0.7 C13U11
;152.0642 . 152.0626., ... -. //i.G C12U8131.0504 131.0497 r 0.7 . c9H7g 2p;
. 105.0364 1 105.0340 2.4 . C7H50103.0568 ' 103.0548 - 2.0 v ,

latter alternative was.favored by gel permeation chromatography and vapor pressure osmometry, both of which indicated a molecular weight.of about 380. The UV spectrum ofzeylena (7) provided the.same absorption maximum (227 nm) •and nearly the same intensity of absorption as zeylenol . ,•(6) • The TR spectrum showed bands for" the presence of
..'many of the structural elements of zeylenol (6) ; the moststriking difference was the appearance of a strong band at
. " ■ ■ . ' . 1780 cm in the new compound indicating-the presence of a.saturated 6-lactone ring. .. ' .
■ The .' H n . m , r . speQtf um : (table 5) of zeylena (7) , •like that of Zeylenol (6), displayed signals for 10aromatic protons, but- the splitting pattern indicated the tpresence of a monosubstituted phenyl (a 511 multiple!centered at n.7.2) and a benzoyl group (a 3H multiple!centered at 57.6 and 2H quartet centered at 68.0). A 2HAB quartet centered at 63.8 and 4*9 (J = 11.5 Hz) indicatedthat zeylena .(7) had also benzoyloxymethylene group as in(6) . Unlike (6) , it had signals (63. 08, d , 1H, J - 6.5 Hz)for only one secondary hydroxyl group, lost on deuterationas well as on acetylation [the acetate derivative, (20),■ . . - '. , ; > ' p . ' - ' ' • ■ v .
showed the expected IR and H n.m.r. features and anappropriate shift of the molecular ion peak to 418 in the -mass spectrum). The remaining seven protons were all inmethinyl groups (shown clearly by the C n.m.r. data inTable 6.) , two of which were in a cis-1,2-disubstituted.

/ ' - / : - : . ;v,' 34:-': ;alkene (J ~ 8 . 0 Hz) . The only biogenetically reasonable structure we could find which fit the data at the point was(7) • • ■ - ' '::V / .;:’i ' : y ^ ■ i
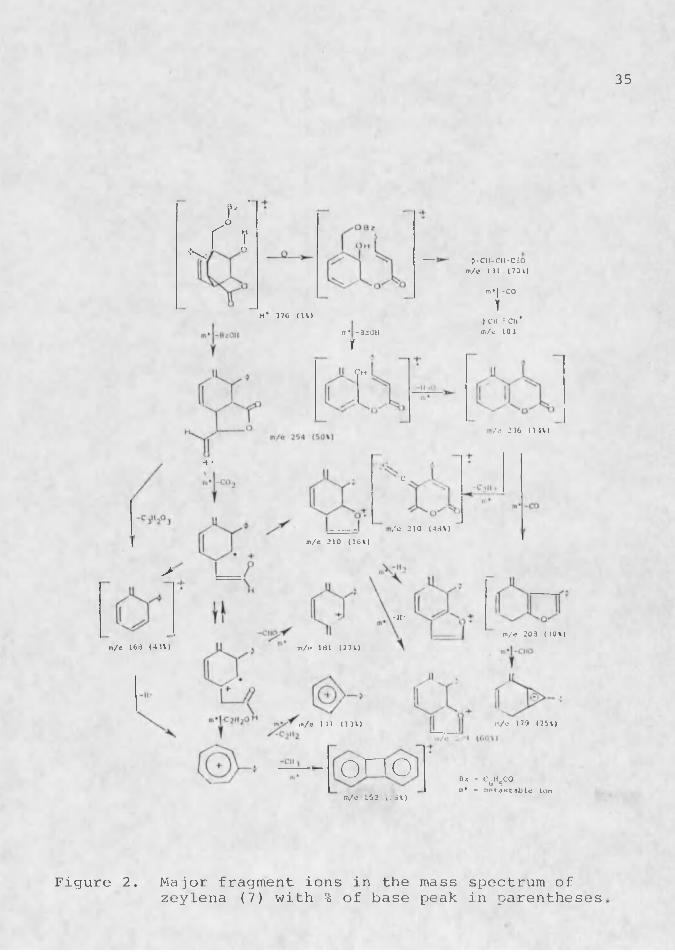
.The mass spectrum of zeylena (7) displayed fragment ions. which are interpretable as shown in Figure 2 . ; •Other structures are possible for many of the fragments, i 1 but the molecular formulas of all fragments are correct (high resolution MS) and in most cases, as indicated, the transitions shown are substantiated by metastable peaks (Table 7). Benzoic acid is lost in at least two ways to give the m/e 254 peak, since no single structure can reasonably give all of the further cleavages observed.High resolution showed the m/e 210 peak (64.% of base peak), to consist of C14H1qP2- and in a 3:1 ratio as shown
. in. Figure 2. The base peak at m/e 105 is due to q>C0 The peak at m/e 752 in CIMS probably comes from retro- Diels-Alder.reaction follwed by intermolecular Diels-Alder reaction during heating for volatilization.
. Structure (6) for zeylena was conclusively estab-lished (except for absolute configuration) by an X-ray study. Tables 8 , 9, 10, and 11 list fractional coordinates, and
. thermal parameters, bond lengths, and bond angles. Figure.3 depicts the molecule. The hydrogen positions were - successfully refined with the final R being 0.037. .Hydrogen bonding occurs intermolecularly from:the -OH to the lactone C=0 of the corresponding molecule in the next unit cell in
35
Sc
?’ ' r ° i
M*- 37G (IV)it, ■ -BzOII 1
■> -01-011 -C£0m/c 1)1 (70 ll
n*|-CO 1
>Cll : Cl/ m/u 10 3
>
m/e 168 (43V)
O n
,V» 316 (1 IV)
-t* •c
/e 210 (48V)m/e 210 (16V)
-1Cm/e 203 (40V)
m/e 181 (27V)
m / e 170 (25v)m/c III (1 31)
onom/e 162 (.St)
Bz = C^H^COm* = metastable ion
Figure 2. Major fragment ions in the mass spectrum ofzcylena (7) with % of base peak in parentheses

36Table 8. Final positional (x 10^) parameters with estimated
standard deviations in parentheses. •
X , : Y ' . : Z-01 ' 1579 (5) 10113 (2) 5524 (1) .02 . 954 (4) 9599. (2) : 4390 (1)03 / •3377 (4) 101.20 (2) . . 275 8 (2 ) ;04 -380 8 (4) 8.984 (2) 2181 (2005 . • -8 04 (4) , 9191 (3) ; 19.5 3 d)Cl : 558 (5) . 106.23 (3) , 3341 (2002 1476 (5). 9 8 95 (3) 2806 (2 )03 535 (6) . , 9974. (3) ' 2 039 (2)04 -663 (6) 10872 (3) 2009 (2)05 270 (6) • 1 1 7 2 3 (3) 2 3.4 4 (2.)06 895 (6) 1159 6 (3) ' ■ 3010 (.200 7- . 136 0 (6) 10545 (3)' . 4102 (20Cl' -2700 (4) ■ ' 11047 (2) .384 0 : (1)02 1 . -3105 (4) • 106 95 (2) .4550 (2)03' -4143 (5) 11237 (3) 5035 (2)04' -4818 (5) ' ' 12106. (3) 4 851 (2)05' • -4442 (5) 12477 (2) 413 5 (2)06 ' • -3386 (5) 1.1934 (2) 36 61 (2).0.7'. .. -1598 (5.) 10417 (2) . : : ' 33-19 (2)08' . ' -2267 (5) • . 10495 (3) 2496 (2)09 ' • ' -2470 (6) 9492 (3) ' 22 04 (2 )01" ' ' 6 65 (4) '. 8504. (2) ■ 5368 (2)02" 600 (5) ' 8328 (30 6132 (2)03" . ' '• 295 .(&) 7419 (3) 6 388 : (20.04" 53 (5) .6671 (3) 5909 (2005" 112. (5) ; 68 38 (2) 515 6 (2) .06" • ' 397 (5) . 7748. (2) 4 875 (2 )07" 1099 . 9481 (2) . . 5119 (2).HO 3 " 418 (4) ' 970 (2) • ' 251 (2)HO 2 126 :(4) 924 (2) 300 (1 )HO 3 ■ • 142■ (4) . 992 (2) 158 do:HO 4 ' • T -121 (4) 109 5 (2) , • 145 (20:HO 5 36 (4) 1229 (2) : . 201 (1 ),HO 6 140 (4) ' 1205 (2) 331 (2)H1C7 - V. T9 (4). ■ 1101 (2) , 1 - 442 (1).H2C7 ' ■ • 269 (4) : 1070 (2)5 . • . 399 (10HC 2 ' -262 (4) ' Tr P 68 (2) ' : 474, (1),HO 3' ' -4 32: (4) T ' ' " •' T o 9 8 (2) ’ , v 541 "'(•20#HO4' ■ . -557: (4) . ;. . 1257 (2) 514.• (20'HO 5 ' ■ —504 (4) ' .1316 (2) 394 (20:5HO 6 ' , ' . 330 (4) .1213 (2) , ■ . 313 (2)HOT' :• : . -176 (4) : 976 "(2) .. ■ 354 (1)HO 8' - , -34 2: (4) .. ; • 1087 (2) : 24 8 ■ (10:HOT" . , 96 (.4) . t' - ' : 8 8 2 (2) . , - 649 . (2)HO 3"- T35' (4) • • : 735 (2) . . 686 (2)

37Table 8.— Continued -
' ' x ' - . Y , „ ' ' - - z ;HC4" -8 (4) ' • 604 (2) . 614 (2)HC5" ' 3 (4) - 633 (2) ' 478 (2)HC6 " ' 26 (4) - 794 (2) . 430 (1)

Table 9. Thermal parameters- with estimated standard deviations in parentheses---Temperature-factors (x 10^) for nonhydrogen atoms are of the form:
; exp [-(B^h2 + 3 2 2— + • 8 3 3A -: +' 2131 2 ^ '+ ■ 2 61 s M * 2 $ 2 3 ]1^) I-
: &ir ^22 33 ■^12 3.L3-: 4Y : - B01 Y 433 (9) • / 54 (1) . 26 (!) -29 (3) ; ' -35 (2) • -2 (i) •: HO3 .. ■ 3.702 175. (6) 38 (1) 19 (1) 4 (2) -11 (2) : -1 (i) : ' HO 2 3.203: 115 (5) : 64 (2) . 34 .(.I) -6 (3) 9 (2) -6 (1) HO 3 • 3.204 . 171 (6) 61 (2) ' 26 (.1). *. -19 (3) . 3 (2) -13 (1) HO 4 3.705 153 (6) 63 (2) • 23 (1) ■ -5 (3) ■ . 7 (2) -.15 CD . HO 5 3.7Cl . 118 (7) - 34 (2) 19 (1) -1 (3) V " 2 (2) 0 (1) -• HO 6 ; 3.202 ; 133 (.7) . . 48 (2) 20 (.1) -11: (4) 4 ' (3) ; ' 1 (1) ■ H1C7 . 2.903 .151 (8) 56 (2) 18 (1) -10 - (4) 7 (3) . - -3 (1) ■H2C7 ‘ ■ 2.904 ' 174 (9) - 59 (2) . 17 (1) -9 (4) 8 (3) ■ 4. (1) " HG2-' 3.0os • 190 (10) ■ 48 (2) 24 (1) — 11 (.4) . 8 (3) - 11 (1) HC3 ' 3.806 139 (8) 37 (2) 29 (1) — 16 (3) . 5 (3) -2 (1) HO 4 ' •- 4.007 142 (8.) Y : 39 (2) •21 (1) -8 (4) . -8 . (3). ; -2 (1.) : - HO5' ■ 4.001' ' 114 (68" 41 (2) 14 Cl) ' -1 (3) . -3 (2) -4 CD . HC6' . 3.102' 135 (# ■ , 48 (2) 21 Cl) -5 (3) 3 (.2) ' 1 CD HO 7 ' . 2.203' . 173 (S. 67 (2) 14 (1) V -13 (4) . 10 (2) • -6 CD Y HC8 ' 2.404 ' 168 (8) : 61 (2) 27 ■■Cl) -7 (4) - 6 (3) -20 (D Y HO 2" 3.805' ' 191 (8) " 4 8 (2) 34 (1) "19 (4) , -13 (3) : -9 (D • -HC3" 4.506' 198 (7) ' 42 (2) 18 (i): ' -7 (3) V — 3 (2) , 2 (D HO 4" : 4.3CI 122 (7) 30 (2) . • 14 (i) •1, (3) 3 (2) 0 (D ' HO 5" 3.9OS' 133 (7) ' - 42 (2) 12 (i) 0 (3) \ -1 ; (2) ' ‘ -1 (1) ' ' HO6" .' 3.509' Y 151. (8) \ 54 (2) 12 (i) I. '-4 (4) . -1 (3) : "-4 CD :01" 1.31 (6) • ' 47 (2), 18 (i) : 1 (3). -2 -(2) -i (D02" ' 204 (8) 59 (2) - 22 . (i) i -8 (4) — 3 (2) , 0 (D03". : 251 (10) ■ 73 (3) 22 (i) —12 (4) ■ • '..S' (3) . . 8 (D '04" 180 (.8) 55 (2) .41 (2) . -6 (4) . 7 (3) 11 (2)05" 201 (8) 45 (2) 33 (2) ••' >5 (3) 3 (3) ' 0 CD06" 174 (8) - 47. (2) 25 (1) ' -7 ’ (3) -5 (2) —2 (D07" 167 w ■■ 44 (2) 17 Y d ) ; . ' 11 (3) "12 (2) -2 (D :
w00

39Table 10. Bond lengths (A) with, estimated standard devia
tions in 'parentheses.;.
01-C?" 1.203 (4) 1103-03 .95 (3)0-2-C 7 1.456 (4)' H02-C2 .. ' ' l.’OO (.3)02-07" 1.334 (4) H03-C3 • 1.05 (3)03-02 1.413 (5) HC4-C4 1.09 (3).04-091 1.203 (5) 1105-05. • 1.00 (3)05-03 1.473 (5) 1106-06 : .90 (3)05-091 1.355 (5) H1C7-C7 .97 (3)01-02 1.557 (5) II2C7-C7 1.01 (3)01-06 1.510 (5) ■ HO2'-02' .99 : (3)01-07 1.501 (5) HO3'-03' - 7 .78 (3)01-07’ 1.587 (4) ; HO4'-04' . ' .99 (31'02-03 1. 552 (5)7 : ' ' HC5'-05' : 1.11 (3)03-04 1.530 (5) HC6'-06 ' 1.01 (3)04-05. ■ 1.49 9 (6) HO7'-07' 1.01 (2)04-08" ’ 1.552 (5). HO8'-08' .99 , (3)05-06 1.301 (5) HC2"-C2" .98 (3)01"-02" 1. 409 (4) HG3 " -0.3 " ■ .86 (3)01"-06" 1.378 (4) ■ HC4"-C4" . .98 (3)01"-07" 1.519 (6) HO5"-05" .99 (3)0 2 1-031 1.384 (5) ; ' HO6"-06" - i . m (3)03'-04' , 1.355 (5)04'-05' 1. 424 (51 ■05'-06' 1.380 (5) .07'-08' 1.572 (9)08'-09' • 1.510 (5)01"-02" 1.408 (5)01"-06" 1.699 (5) .01"-07" 1.476 (4) .02"-03" . 1.374 (7)03"-04" 1.373 (5)04 "-05". 1.5 86 (Si .05"-06" 1.590 (:5)
A * * , .

40Table 11.. Bond angles (°) with estimated standard devia
tions in parentheses. ' •
C7-02-C7" 116.9 (3) - : ' C 4 '-C31-HC3' . 125 (1)C2-03-H03 ' 119 (1) C 3 '-C4'-C5' - 119. 0 (4)C3-05-C91 10 8.5; (3) C 3 '-C41-HC4' ■ 131 (1)C2-C1-C7 ■ 111.1 (4) ' ' ’ C 5 '-C4'-HC4 / 110 (1)C2-C1-C71 106.5;(3) C 4 '-C5'-C6' ' 118. 1 (4)C6-C1-G7 ' .. 111.7 (4),. C4'-C5'-HC5' , 122 (1)C6-C1-C7' , 108.3 (4) - C6 ' -C5 ' -HC5 120 (1)C7-C1-C71 ' ' 113.0 (4) ■ Cl'-C6'-C5' .123. 4 (4)C2-C1-C6 • 106.0 (4) : C l - C 6 1 -HC6.' 117 (1)C1-C2-03 :107.9 (3) G5 ' -C6 1 -IIC6 ' 119 (i). :C1-C2-C3 108.9 (4) ■ • Cl2>C7 '-Cl 113. 2 (3)C3-C2-0.3 . 110..9 (4) / Cl'-C7' -C8' ' 112. 8 (3)03-C2-HC2 113 (1) . C1-C71-C8' ■ 108. 3 (3)C3-C2-HC2' 109 (1) C1-C71-HC71 106 (1) .C1-C2-HC2 108 (1) Cl' -C7 ' -IIC7 ' 103 .(I)C2-C3-C4 109.8 (4) C8'-C7'-HC7' ; 114 (1)C2-C3-05 109.3 (3) . C4-C8’-C71 109. 5 (4)C4-C3-05' ■103.7 (3) C4-C8 ' -C9 ' I 101. 0 (4)C2-C3-HC3 116 (1) C7'-C8'-C9' 107. 3 (3).C4-C3-HC3 . ' 112 (1) C4-C8'-HC8' 116 (1)05-C3-HC3 105 (i): C7 1 -C8 1 -HC8 ' 109 •(1) .C3-C4-C5 . , 112.7 (4) C 9 '-C81-HC8' 114 (1)C3-C4-C81 97.1 (4) , ' C 8 '-C91-04 129. 9 (4)C5-C4-C8' • 112.1 (4) ; C 8 1-C91-05 108. 8 (4)C3-C4-HC4 .109. (1) : ■ 04-C91-05 ■ . 121. 3. (4)C5-C4-HC4 . 118 (1) , : C2"-C1"-C6" , 119. 4 (3)G8 1 -C4-IIC4 :• 107 (1) : ;. C2"-Cl"-C7" • 118. 1 (3)C4-C5-C6 ■ 115.1 (4) C6''':-Gl:" C7" 122. 5 (3)C4-C5-HC5 ' ■ - 115 (1) : : 1 Cl"-C2"-C3" 120. 0 (4)C6-C5-HC5 ' ; .-130 (1) . Cl" - C2 "-IIC2 " ■ 121 (1) .C1-C6-C5 ' 115.9 (4) C3"-C2"-HC2" . 118 (1)C1-C6-HC6 ■ 118 (1) C2"-C3"-C4" 121. 1 (4)C5-C6-HG6 • 127 (1) C2 " -C3 " -HC 311. ’' 116 (1)C1-C7-02 108,6 (4) C4 "-C3"-IIC3 " . 123 (1)C1-C7-H1C7 109 (1) C3"-C4"-C5" 119. 3 (4)C1-C7-H2C7 100 (1) ■ C3"-C4"-HC4" 116 (1)02-C7-H1C7 . I 108 (1) . C5"-C4"-HC4" . 125 (1)02-C7-H2C7 . 117 (1) C4"-C5"-C6" ' - 121. 3 (.3)H1C7-C7-H2C7 113 (1) C4"-C5"-HC5" 124 (1) :C 2 '-Cl'-C61 117.2 (4) .• tvC6t-C5"-HC5" . 114 (1)C2-C1'-C71 118.2 (3) : Cl"-C6"-C5" 118. 9 (3)C6'-C1'-C7' . 124.6 (3) ,Cl"-C6"-HC6" 116 (1)Cl'-C2'-C3' 120.1 (4) C5"-C6"-HC6" 125 (1)Cl '-C2'-HC21 123 (1) : Cl"-C7"-01 . 124. 0 (4)C3'-C2'-HC2' 117 (1) Cl"-C7"-02 113. 7 (3)C 2 '-C3'-C4' . 122.1 (4) 01-C7"-02 122. 3 (4)C 2 '-C31-HC31 113 (1)

41
•A
> r t h
Figure 3. Stereoscopic view of zeylena (7) -- Hydrogen atoms are shown as spheres and other atoms as 50% probability ellipsoids.

v' v: '' : . _ y-. - - ; ;-v'■ :;i; ■ . 42
the a direction. Dihedral angles pertinent for.correlation with vicinal H-II coupling constants in H n.m.r. spectrum of zeylena (7) are shown in parenthesis in Table 12.
Acetylation of (7) with acetic anhydride-pyridine gave a mono acetate (2.0) , rap 148 °C, confirmed by its. IR (no
' - - ■ : ' - . i .hydroxyl- band, new ester band at 1745 cm ) , H n.m.r.(Table 12), and mass (M 418) spectra. The. absence of / hydrpxyl in (2 0) directed the elimination of benzoic acid toward the reverse Diels-Alder path, in Figure 2 as expected. ' The C I M So f (20) displayed a molecular ion peak at m/e 836 indicating dimerization.
' , Catalytic (Pt00) hydrogenation of zeylena (7) ,,ln MeOH-AcOH at atmospheric pressure, yielded a mixture of' two compounds (TLC). The lower material (major product) was . 5, 6 , l'!, 2" , 3" , 4" , 5" , 6"-optahydrozeylena (21) , mo 16 8- .169°C, UV (rising end absorption), IR (weak phenyl bands),'H n.m.r. (only five aromatic protons). The ElMS of (2b),which exhibited a molecular ion peak at m/e 3 84 (768 byCIMS), showed that the phenyl ring of .the -CH^OBz group and the double bond had been reduced. Peaks associated -■ ■ .V• ( + . . +with M-'CgH11GOOH ' (4 3%).,. [GgH^^COOH] . ' (18%) , C ^ H ^CEO .(33%) , (base peak) , and C ^ H y + (64%) clearly . -provided evidence for the formation of (20). No further attempt was made to characterize the upper R^ material (minor product) in which both phenyl rings and double bond

Table 12. H n.na.r. .chemical shifts (6, CDChj) , of . zeylena (7) and zeylena acetate •(20) with crystographically determined dihedral angles in parentheses after vicinal coupling constants.:
20
H2 3. 85 (d) . ■J 2 , O E ~ 2 , 3 ~
6.5(53° 0(102°)
H3. ; v 4.38(dd) ’ ■ ^3 , 8 1 = 3,4 -
1.0 7 5.0(45?
H4 ; >. ; : 3 ,67 (dd) , J 4 ,5 - 4,8' "
6.5(2°) 4.5 (54°
H5 ' " ' ' .. 6.49(dd)• J5,6 = 8,0(9°)
H7 ■ - ■4.88(d) 1 : 3.83(d) " Jgem “ 11.5
H7 i . - ■’ . 3.23(d) : ' J7- ,8' = 2.0(108H 8 1 . 3.79(dd)H 2 1 to H6 1 - ’ '" ’ 7.19(m). .H2", H6" 8.02(dd) ' ^ortho-
^meta —8.0(0°) 2.o ;
H3" to H5" ’ 7.55(m)3.08(d)
OCOCHg
5.17 (s)
4. 30(dd)
3.65(dd)
6.50(dd)4.53(d) 3.90(d)3.38(d)2.80(dd)7.16(m)8.05(dd)
7.55(m) .
1.99 (s)
•Jq g 1 : - 1.0: 5;. 0 ;,7 =76 .5 " . = 4.5
J5 , 6 : II GO O
Jgem • ' 11. 5
COo'h) — . 2.0

appear to be reduced as judged from its IR spectrum which / showed no.unsaturation or phenyl bands.
Jones oxidation of zeylena (7.) also yielded a 'mixture of two compounds (TLC). The upper material, dehydro zeylena (22)'., mp 119-121 °C, new carbonyl band at .1715 cm in the IR spectrum, did not give a dimer peak.in the CIMS, presumably because its retro-Diels-Alder reation is rapidly followed by tautomerization to a phenol. An attempt to determine the absolute configuration of these substances from its CD curve at 29 0 nm was not definitive, due to strong absorption.by the benzoyl group in this region. Oxidation of the octahydro derivative (21), however, gave ketone (23.) with a positive CD curve at 290 nm, favoring the absolute configurations depicted for these substances.
The finding of zeylentil • (6) and zeylena (7) in a Uvaria species makes clearer the biogenetic routes to some related substances found in this genus as shown in Figure 4 . -: Benzyl benzoate (24) is epoxidized to key intermediate (16) which adds E-cinnamic acid to give (26), which undergoes an intramolecular Diels-Alder reaction to give zeylena'(7). (16) also adds water, and becomes further epoxidizedto (26), a precursor of these natural,products:: zeylenol ;(6), seneopoxyde; (19). [16], and seneol (18) [16] . • Via (27) , (16) is also the source of the o-hydroxybenzyl groups found in uvarinol [17] (which contains, three such groups and one cinnamic acid derived. group) , and chamahetin [18] , : '

OBz OBz
;o
(24)// (16)\
(7)
•OBz
.011
,0H
6 )
(25)
(27)
iBz
OAcOH
(18)OH •Ac
(26) (19
Figure 4. Biosynthesis of Uvaria compounds from benzyl benzoate (24).
en

isochamanetin- [18] , and uvaretin [19] (all three of which contain one o-hydroxybenzyl. group and. one cinnamic acid derived group) dilute 'acid should rearrange (16) into (27) since the intermediate cyclohexenyl cation leading to (27) • is more stable than the alternative one.

EXPERIMENTAL
- Melting points were determined on a Kofler hot-stage . apparatus and are.uncorrected. .Carbon and hydrogen analyses were carried out by the University Analytical Center, Tucson, Arizona.. •Optical rotations were measured using a Perkin- Elmer 241 polarimeter.. Ultraviolet (UV) and infrared (IR) - spectra were run on Cary-15 and Beckman IR-33.spectrometers, respectively. H n.m.r. spectra were run at 60 MHz on a .■V ' . ■■■■■ '' /: ' ' 1 3 ' ' ' . ’ ' ' : " V., ; . .... ' VVarian EM360L spectrometer and C n.m.r. spectra were run at 2 2.63 MHz on a Bruker WH-90 spectrometer; in both cases shifts are given as ppm downfield from TMS (6). Electron > impact (El) and chemical ionization (Cl) mass spectra (MS) Were recorded on a Varian MAT 311A spectrometer with aVarian SS 200 data system and the intensities of the ions,given'in parentheses, are expressed on a scale in which the :largest peak in the spectrum is assigned intensity of 100%. The high resolution data were obtained at a resolutiori of 7000 by scanning the mass range from m/z 100 to m/z 500, . repetitively at 25 sec/dec using PFK as the internal ; . ' 1 'standard. Metastable ion spectra we■ ' ■ O L i v ■ - N-'rscanning the magnetic (B) and electrconstant accelerating voltage with the B/E ratio constantto obtain.the daughters of parents or by scanning the accelerating voltage at constant D and E for.determining -
re recorded by either.ostatic (E) fields at

parents of daughters. Samples were introduced using a ,direct .probe. The normal ionizing voltage 'was 7 0 cv with, a source temperature of, 2 50°. Gel permeation chromatography (GPC) was carried out in THF using a Varian 50 00 HPLC equipped with RI detector and Micropak TSK Gel 2 000 H column. . , ' - ''
Crystallographic.Study of Zeylena (2a)A 0.2 x 0. 5-x 0.8 mm crystal grown from 1; 1 methanol-f
methylene chloride was mounted on a Syntex P2, Diffractometerwith a graphite monochromator *(MoK , X0.71069°) .- The cell -
. ' ■ ■ oc '• ■ v ' ' " . ' lengths determined by least squares treatment of 13 reflections were, a = 7.235 (2), b = 14.004 (6), c = 18.123 < 4)°; the spaced group was P2,2,2, with Z — 4. The -2- scan technique was used at variable scan ratio 2.0-29.3°/ min, 2° scan range, and background to scan time ratio 1.0.,1976 reflections with 20 < 50° were measured and 1914 > 30 {I} were considered observed. There were no' significant variations in the.intentions of check reflections. Standard deviations were assigned as described by Corficld, Deodens, and Ibers [20],.the value of p being 0.04./ E maps based on MULTAN [21] solutions using the top ■'300 E 1 s were unhelpful, but whbn: -tile top 200 E's were used/' f all non-hydrogen atoms, were located on the first E. map.Full matrix least .squares refinement using isotropic temperature factors produced R to 0.10; with anisotropic

factors, R dropped to 0.07. Hydrogen positions were calculated and when they were- included in further refinements with the isotropic:temperature factors of the atoms to which they' were attached, R dropped to its final value
■ of 0.037. The scattering factors■used were those of Hanson et al. [22]. -No correction was applied for extinction.

REFERENCES
1. Dickey, E. ;E..,. J. tirgy-Chem, ^ (1958).2. Briggs,• Lindsay H ., R. C. Gambia, and R. A. F . Couch■ ; , j. Chem. Soc., 3042 (1968).-3... Birch, A. J . , P. L. Macdonald, and A. Pelter, J.
. Chem. Boc;,'1968 (1967). ■ '4. Atal, C. • K . , K . L . D h a r a n d A. Pelter, J.. Chem. Soc
222 9 (196 7) . • r. 3 , ■ . ' . .5. Pefeffer, P. E., K. M. Valentine, and F. W. Parrish,
• J. Artver. Chem. Soc. , 101, 1265 (1979) .6.. Lindpaintner, E. , Arch. Pharm. , 2 77, 398 (1940 ) .7. Pelter, A., J. Chem. Soc., 1376 (1967).
C 8 ... . Duf f ieId, A. M. , J . Heterocyclic Chem. , 4 , 16 (19 67).. 9 . Nakanishi, Koj i , Infrared Absorption Spectroscopy., v \ Holden-Day, Inc., San Fr.ancisco, 1966 .10. Geran, R. I., N. H. Greenberg, M. N . McDonald, A'. M.
■ Schumacher., and B . J. Abbott, Cancer Chemother.Rep. > Part 3, 3(2) , 9 (1972) . > . . V '
11. JOlad, S . D., R. M. .Wiedhopf, and j. R. Cole, J.Pharm. Sci. , 6 6, 889 (1977) . • A. ' ;
12. Green, G. J. W . , E. .Ritchie, W. T. L. Sidwell, and ■W . C. Taylor, Aust. J. Chem., 19, 455 (1966).
.13 . Bates,, R.. ; B . , and W. A. Beavers , Carbon-13. NMR.Spectral Problems, Humana Press, Clifton, New • Jersey, 1980.
14. Chan, W. R., D. R. Taylor/ ahd\T. H. Yee, J. Chem.. SOC, (C) , 311 (1970) .A. . .
15. Lyons, C . W ., and Dp Ri fayiof,,J. Chem. Soc., Chem. Commun., 647 (1976).
50

5116.
17.
18.
19.
20.
21.
22.
Hollands, R., D . Becker, A. Gaudemer, J. Polonsky, and N. Ricroch, Tetrahedron, 24 , 1633 (1968).
Hufford, C. D., W. L. Lasswell, K. Hirotsu, and J . Clardy, J. Org. Chem. , 4_4, 4709 (1979).
Hufford, C. D., and W. L. Lasswell, J. Org. Chem.,41, 4052 (1976) .
Cole, J . R., S. J . Torrance, R. M. Wiedhopf, S. K. Arora, and R. B. Bates, J . Org. Chem. , 4 1, 1852 (1976).
Corfield, P. W. R., R. J . Deodens, and J. A. Ibers, Inorg. Chem. , 6, 197 (1967).
Germain, G ., P. Main, and M. M. Woolfson, Acta Crystallogr. , Sect. B . , 2_6 , 274 (1970).
Hanson, H. P., F. Herman, J. D. Lea, and S. Skillman, Acta Crystallogr., Sect. B , 17, 1040 (1964).