Embed Size (px)
Citation preview

1
Structural change and industrial linkages: a perspective on China’s sustained growth pattern1
Roberto Alexandre Zanchetta Borghi2 Abstract China’s successful growth experience has been subject to several analyses. This paper provides a perspective on China’s long-term economic growth from a Kaldorian-Structuralist framework that emphasises the importance of the consolidation of a large, diversified and integrated industrial base as central to economic growth without facing balance of payments constraints. Input-output indicators reveal key macrosectoral transformations of the Chinese productive structure and changes in interindustry linkages during the 1990s and 2000s. Results point that the Chinese sustained growth pattern so far can be described as an investment-cum-foreign exchange growth with diversification alongside a deeper integration of domestic industrial production. Keywords: China; economic growth; structural change; industrial sectors; input-output analysis. JEL Codes: C67; F43; O11; O14; O53. Resumo A bem-sucedida experiência de crescimento chinesa tem sido objeto de diversas análises. Este artigo oferece uma perspectiva acerca da trajetória de crescimento de longo prazo da China a partir de um arcabouço Kaldoriano-Estruturalista, que enfatiza a importância da consolidação de uma base industrial ampla, diversificada e integrada como central para o crescimento econômico sem restrições de balanço de pagamentos. Os indicadores de insumo-produto revelam as principais transformações da estrutura produtiva chinesa e as mudanças nos encadeamentos intersetoriais ao longo dos anos 1990 e 2000. Os resultados indicam que o sustentado crescimento chinês pode ser descrito a partir de um padrão que combina investimento, divisas estrangeiras e mudança estrutural com diversificação e integração da produção industrial doméstica. Palavras-chave: China; crescimento econômico; mudança estrutural; setores industriais; análise de insumo-produto. Classificação JEL: C67; F43; O11; O14; O53.
Área 7 – Economia Internacional
1 The author wishes to thank Capes, Brazilian Ministry of Education, for supporting his PhD studies. This paper is a result of the author’s PhD thesis “Growth trajectories in the globalisation era: a macrosectoral analysis of China and Brazil” (University of Cambridge, UK). 2 Lecturer in Economics at the Institute of Economics, University of Campinas, Brazil. PhD in Development Studies, University of Cambridge, UK. Contact: [email protected].

2
1. Introduction China’s growth miracle has been subject to several analyses. Undoubtedly, the fact that China has been growing around ten percent a year over the last thirty years, the most recent and long-lasting experience of sustained economic growth with major implications for the world economic order, raises many questions about its continuity and new policy directives, making important to understand the achievements thus far. As a great productive competitor and increasing consumer market, China has shifted trade and investment routes at a global level. This paper offers a perspective on China’s long-term economic growth by identifying key macrosectoral changes in the Chinese productive structure during the 1990s and 2000s. From the Kaldorian-Structuralist framework that is taken into consideration, the consolidation of a large, diversified and integrated industrial base is central to economic growth without facing balance of payments constraints. The strengthening of interindustry linkages contributes to a more compatible response of domestic supply to demand and, consequently, a sustained growth trajectory. Input-output analysis allows for a detailed view on major structural changes that the Chinese economy has experienced over the years. The following indicators are calculated by sector: output multipliers, backward and forward linkages, fields of influence and export-import coefficients. Data from the World Input-Output Database (WIOD) used in this paper cover the period 1995-2009. Results point that the Chinese growth pattern so far can be understood as an investment-cum-foreign exchange growth with diversification alongside a deeper integration of domestic industrial production. Large industrial sectors were the key economic sectors of the Chinese productive structure. They presented, in general, the highest output multipliers and the strongest interindustry linkages. In addition, the Chinese economy became more diversified and industrial production, more integrated, over the years, given the strengthening of interindustry linkages, particularly between industrial sectors. Finally, the analysis of China’s trade pattern reveals that, despite the increasing need of imports mostly for intermediate consumption, the economy as a whole and most sectors were able to raise exports and assure necessary foreign exchange. The paper is divided into three sections. The first section presents the main arguments related to the Kaldorian-Structuralist theoretical framework in the literature. The second section details the methodological approach based on input-output analysis. The third section discusses the main results of the paper concerning the macrosectoral transformations of the Chinese economy. Concluding remarks follow. 2. Productive structure and economic growth: a Kaldorian-Structuralist perspective Both Kaldorian and Structuralist traditions in the economic literature highlight the importance of industry for economic growth. According to these approaches, higher demand multiplier effects over the domestic economic system depend on how domestic production is organised in terms of sectoral composition, interindustry linkages, and domestic and foreign supply. A more diversified and integrated industrial productive structure with stronger interindustry linkages provides a more compatible response of domestic supply to demand, thus generating more income and accelerating domestic

3
growth from initial demand stimuli. It assures that multiplier effects are transmitted from one sector to another over the productive chain, such that they become interindustry domestic demand. Multiplier effects are also affected by the share of imports for meeting final and intermediate demand, once avoiding a demand leakage to foreign markets. Additionally, given different income elasticities of demand for exports and imports, structural changes in the productive structure of developing economies towards higher value-added industrial sectors are required to prevent them from structural disequilibrium for long-term economic growth. In the Structuralist tradition, based on either the Latin American or the Anglo-Saxon approach3, the process of industrialisation is widely recognised as essential to facing the bottlenecks and rigidities that may prevent low- and middle-income countries from achieving higher income levels. Patterns of sustained economic growth are generally associated with the promotion of industrialisation and the diversification of domestic manufacturing industries. Great emphasis is also placed on external constraints to industrialisation. This differs from the Ricardian comparative advantages argument, according to which countries should specialise in the production of goods in which they have greater resource endowments and trade them in the international market so that a more efficient allocation of resources would be achieved. As Chenery (1980, p.281) highlights, “sustained economic growth requires a transformation of the structure of production that is compatible with both the evolution of domestic demand and the opportunities for international trade. This transformation normally involves a substantial rise in the share of industry and [...] a shift away from dependence on primary exports towards manufactured goods as a source of foreign exchange”. According to this tradition, the consolidation of a diversified and integrated industrial productive structure with strong interindustry linkages is a necessary condition for furthering long-term economic growth. The establishment of a domestic productive system could increase income levels through the demand that one sector would generate to another. Complementarity of demand between sectors could break the “vicious circle of underdevelopment” but would require for some authors, such as Rosenstein-Rodan (1943) and Nurkse (1953), large-scale planned investments led by the State to be implemented at once, i.e. a “Big Push”, to assure inter-sectoral balance. For others, such as Hirschman (1958 and 1987), in support of an unbalanced growth strategy, efforts should focus on key sectors, i.e. those sectors with strong interdependence and linkages with other sectors in the economy. Two types of linkages between sectors are identified: backward and forward linkages. Backward linkage refers to the ability of a sector to stimulate production and investment of sectors that provide its inputs, whilst forward linkage relates to the ability of a sector to induce productive activities of sectors that demand its output. That “Big Push” to promote a balanced process of growth would require precisely what underdeveloped economies lack, such as the amount of financial resources, managerial capabilities and planning efforts to carry out large-scale investments and industrialisation across all sectors at once. Another key structural feature of developing economies, known in the Structuralist literature as the Prebisch-Singer hypothesis, refers to the deterioration in their terms of trade over time due to different income elasticities of demand for exports and imports. Peripheral economies tend to produce and export goods with low-income elasticity of 3 For details of these two different approaches, see Blankenburg et al. (2008) and Sanchez-Ancochea (2007).

4
demand, such as primary commodities, while importing high-tech industrialised goods, which are provided with a higher income elasticity of demand. The opposite relationship holds true for central economies. That means a world system where cheap unprocessed commodities flow from the periphery to the centre and more sophisticated industrialised goods flow from the centre to the periphery, reinforcing productivity and technological differentials between these groups of economies (Prebisch, 1949; Singer, 1950). In response to this dichotomy regarding the productive specialisation and export-import dynamics between central and peripheral economies that is advocated in the Structuralist tradition the continuous industrialisation of developing economies, in order to progressively internalise the production of manufacturing goods previously imported, including consumer durables, intermediate inputs and capital goods. The ongoing industrialisation would result in a diversified and interdependent domestic productive structure that could spread demand effects as well as technological and productivity gains over the economy, i.e. a supply composition able to respond with national production to final and intermediate demand. The Kaldorian economic tradition also discusses the importance of the supply composition for growth. On the one hand, it points out the sectoral supply composition, arguing that some sectors, namely manufacturing industries, are more capable of promoting dynamic growth. That implies sectors have different growth-enhancing properties. On the other hand, it addresses the supply composition in terms of domestic and foreign supply, given export-import demand differentials, concluding that the specialisation of trade and production structures in lower value-added sectors may lead to balance of payments growth constraints. The defence of manufacturing as the engine of economic growth is clear, as highlighted by Kaldor’s laws4. Manufacturing industries would be responsible for more technological progress and productivity increases in the economy, thus being able to promote more growth than any other sector when stimulated by demand. The first law states that the faster the rate of growth of output in manufacturing is, the faster the rate of growth of total output in the economy will be. In other words, growth in manufacturing is positively associated with economic growth. Connected with it, the second law, also known as Verdoorn’s law, stresses the existence of a positive relationship between the rate of growth of output in manufacturing and the rate of growth of labour productivity in manufacturing. This law accounts for the special properties of manufacturing industries, since they intrinsically embrace static and dynamic economies of scale or increasing returns to scale that generate more output and productivity growth than other sectors. The third law states that the faster the growth of manufacturing output is, the faster the rate of labour transference from non-manufacturing to manufacturing activities is, so that total productivity growth is positively associated with the growth of output and employment in manufacturing and negatively associated with the growth of output and employment outside manufacturing. Therefore, high growth of manufacturing output is important to the overall productivity growth. In other words, the faster the growth of output, the greater the rate of labour transference from other sectors in the economy where
4 See Kaldor (1966, 1968, 1977 and 1981), Thirlwall (1979, 1983 and 2002) and King (2009 and 2010).

5
productivity is lower to manufacturing industries where productivity is higher, thus resulting in an increasing overall rate of productivity growth. The fourth law, also known as Thirlwall’s law, places emphasis on balance of payments growth constraints, once the long-term growth rate of a country is regarded as given by the ratio between the rate of growth of exports and the income elasticity of demand for imports. During the process of economic development, there is a need for generating foreign exchange to import necessary inputs for promoting changes in the domestic productive structure and internalising higher value-added activities. Consequently, the lack of foreign exchange would impose constraints on further economic growth. Kaldorian contributions, therefore, have not only focused on the importance of the manufacturing sector per se as a dynamic source of growth, but also on its importance from an open economy perspective. Manufacturing industries embody increasing returns to scale and higher levels of labour productivity in the economy, from which results that manufacturing growth is the engine of GDP growth and that the higher the rate of growth of manufacturing output, the faster the overall rate of productivity growth. Additionally, due to different income elasticities of demand for exports and imports, exports of low value-added goods, mainly primary commodities, and imports of high value-added goods (especially manufacturing goods) would create a structural disequilibrium for economic development, thus requiring a migration to higher value-added manufacturing production in order to overcome balance of payments constraints on long-term economic growth. In conclusion, from a Kaldorian-Structuralist perspective, it is clear the importance of consolidating a large, diversified and integrated industrial base to long-term economic growth without facing balance of payments constraints. Demand multiplier effects over the productive structure would be higher depending on: (i) the complementarity of demand between sectors and, consequently, the strength of domestic interindustry linkages; (ii) the sectoral supply composition, particularly the prevalence of industrial sectors; and (iii) the dynamics between domestic and foreign supply, in order to avoid demand leakage to foreign markets. 3. Methodological notes on input-output analysis This section details the input-output methodology applied in this paper to depict the productive structure of the Chinese economy. Chinese input-output tables released by the World Input-Output Database (WIOD) cover the 1995-2009 period5. WIOD input-output tables are disposed at basic prices and industry-by-industry format. In order to make them comparable over the years, tables at current prices and previous year’s prices were used to transform current prices into constant prices of the last available year (2009). All input-output indicators to be presented are therefore based on data expressed in 2009 constant prices. Additionally, original 35-sectors tables were reduced to 17-sectors tables considering similarities of sectors’ productive structures and preserving a large number of industrial sectors. The Appendix of this paper presents the map of sectoral aggregation used for China, showing the correspondence between the original WIOD 35-sectors matrix and the calculated 17-sectors matrix.
5 Period when tables at both current prices and previous year’s prices were available at: http://www.wiod.org. For more information about WIOD tables, see Timmer (2012).

6
According to the input-output framework, total output in the economy (X) is given by the sum of output for intermediate consumption (Z) of different sectors and output for final demand (Y), as in (1). The matrix of interindustry flows (Z) and the total output allow for the calculation of the matrix of technical coefficients (A). The technical coefficient ( ija )
measures, in monetary terms, how much of goods the sector j has used from the sector i for its total output. In other words, it shows the proportion of inputs purchased by sector j from sector i in relation to the total output of sector j, as in (2)6. YZX (1)
j
ijij X
Za (2)
It follows that: YXAX (3) The solution to this equation gives the total output necessary to meet the final demand: YAIX 1)( (4)
where LAI 1)( is known as the Leontief inverse or the total requirements matrix. The basic Leontief model allows for several analyses of the productive structure. The output multiplier indicates, for each sector, the amount of production directly and indirectly generated in the economy for each unit of final demand. The bigger the multiplier of one sector in comparison to the multipliers of other sectors, the greater its impacts on the rest of the economy, thus pointing to its importance to stimulate total output. It is given as below: Limx ' (5) where 'i is a row vector of 1’s that adds up the values of each column of matrix L and mx is the vector of sectoral output multipliers. Input-output models allow for calculations of other indicators highlighting the linkages between sectors, such as Hirschman-Rasmussen backward and forward linkages. These indices contribute to the assessment of key sectors in the economy. The term “forward linkage” is used to indicate the interconnection of a particular sector with sectors to which it sells its output, i.e. it measures how much of its output is demanded by other sectors. In turn, the term “backward linkage” refers to the interconnection of a particular sector with those sectors from which it purchases inputs, i.e. it measures how much a sector demands from other sectors in the economy. This approach of identifying main sectors in the economy and calculating sectoral linkages dates back to the works of Hirschman (1958) and Rasmussen (1956). From the Leontief inverse, considering the elements ijl of matrix L and defining *L as the average
of all elements of L and jL* as the sum of a column of L, the Hirschman-Rasmussen
backward linkage can be calculated as: *
* )( LnLBL jj (6)
For the calculation of the forward linkage, however, the direct-output coefficients matrix (F) is used. It consists of allocation coefficients (rather than technical coefficients) 6 For more details, see Miller and Blair (2009).

7
obtained from the matrix of interindustry flows (Z) as expressed in (7). Instead of dividing the elements of each column of Z by the total output of the sector associated with that column, the elements of each row of Z are divided by the total output of the sector associated with that row. ZxF 1ˆ (7) Similar to the calculation of the Leontief inverse using A, the Ghosh matrix or output inverse (G) can be obtained from F: 1)( FIG (8) Hence, considering the elements ijg of matrix G and defining *G as the average of all
elements of G and *iG as the sum of a row of G, the Hirschman-Rasmussen forward
linkage can be calculated as: *
* )( GnGFL ii (9)
According to Miller and Blair (2009), sectors can be distributed over a four-way classification depending on the results of their backward and forward linkages. Sectors can be classified as: (a) generally independent of (or not strongly connected to) other sectors, when both linkages measure less than 1; (b) generally dependent on (or connected to) other sectors, when both linkages measure greater than 1; (c) dependent on interindustry supply, when only the backward linkage is greater than 1; and (d) dependent on interindustry demand, when only the forward linkage is greater than 1. Previous indicators contribute to assessing the importance of each sector in terms of their impacts on the economic system as a whole but do not offer a clear picture of how interconnected the sectors are. The analysis of fields of influence shows the main linkages between sectors, describing how changes in direct coefficients are distributed within the economic structure. It allows for the identification of the most important linkages between sectors in the productive process and how they have changed over time (Sonis and Hewings, 1989 and 1991; Guilhoto, 2009). Considering the matrix of technical coefficients A and defining a matrix of marginal changes in input direct coefficients as ][ ij , it follows that corresponding Leontief
inverses would be given by ][)( 1ijlAIL and )]([)()( 1 ijlAIL . Then,
considering a small change in only one direct coefficient, i.e.: if 11 , jjii
ij (10)
0 if 1ii or 1jj the field of influence of this change can be approximately expressed as:
ij
ijij
LLF
])([
)(
(11)
where )( ijF is the field of influence matrix of coefficient ija .
In order to identify those coefficients with the greatest fields of influence, a value given by ijS in equation (12) is associated with each matrix )( ijF .

8
n
k
n
lijklij fS
1 1
2)]([ (12)
In this approach, direct coefficients presenting the greatest values of ijS are those with
the largest fields of influence in the economy. The way chosen to illustrate results in this paper is to calculate both the average and standard deviation of ijS values and classify
each linkage as below the average, between the average and one standard deviation, between one and two standard deviations, between two and three standard deviations, or above three standard deviations. As the analysis is made in comparison with the average of all linkages, linkages that weakened in relative terms do not necessarily mean they reduced in absolute numbers. A colour-scale figure is used to represent the fields of influence between sectors throughout the economy according to this classification in different years, showing the relative transformations of the productive structure over time. The analysis of China’s productive structure is complemented by export-import coefficients that indicate the evolution of its trade pattern. That includes the composition of exports and imports, the share of total imports by domestic demand components, and both total and sectoral export and import penetration coefficients. Sectoral export coefficients ( jEXC ) can be calculated as any direct coefficient, i.e. by the
ratio between the value of exports of each sector ( jEX ) and the total output of the
corresponding sector, as shown by (13). In other words, they represent the share of total output of each sector that is exported. Similarly, the total export coefficient ( EXC ) is given by the share of the economy’s total output that is exported, as shown by (14). The bigger the export coefficient, the greater the orientation of domestic production to exports. It also provides a proxy to the ability of the economy or each sector to obtain foreign exchange from exports.
j
jj X
EXEXC (13)
xi
exiEXC
'
' (14)
where 'i is a row vector of 1’s that adds up the values of exports in the vector ex and the values of output in the vector x. Analogous to equation (1), there is a matrix of imports by sector (M) that shows how imports are distributed across the economy. Total imports are directed either to intermediate consumption of different sectors ( mZ ) or final demand ( mY ), as in (15).
mm YZM (15)
Import penetration coefficients account for the share of imports in non-exported total (both domestic and imported) production. That means, imports are added and exports subtracted from the denominator of total output, resulting in equations (16) and (17) for import penetration coefficients by sector ( jIMPC ) and for the whole economy ( IMPC ),
respectively. The bigger the import coefficient, the higher the share of imports to meet domestic demand. This analysis shows the degree of output dependence on imports and,

9
combined with the analysis of export coefficients, offers a perspective on eventual foreign exchange growth constraints.
jjj
jj EXIMX
IMIMPC
(16)
exiimixi
imiIMPC
'''
' (17)
where jIM represents the total imports by sector j, i.e. each value of the vector im , given
by iMim , where i is a column vector of 1’s that adds up each row of matrix M, and where 'i is a row vector of 1’s that adds up the values of output in the vector x, the values of imports in the vector im and the values of exports in the vector ex. As import penetration coefficients take into account imports for both final demand and intermediate consumption, it is useful to make explicit the share of total imports by domestic demand components (
zhshareIM ). Equation (18) expresses the share of each sort
of demand that total imports meet, whether intermediate demand for domestic production represented by lower case letter z or final demand components h (exports excluded).
100IM
IMIM zh
sharezh (18)
4. Macrosectoral transformations of the Chinese economy Investments have been key to the Chinese sustained growth trajectory. Investment rates have accounted for more than 40% and, in several years, nearly 50% of total GDP after the gradual opening up reforms. The importance of investment for economic growth is related not only to its spillovers and significant multiplier effects within the economic system as a source of demand, but also to its unique capacity to transform the productive structure. Investments are the condition for industrial transformations to take place as fast as they have been occurring in China7. Input-output indicators allow for the identification of key economic sectors in the economy to verify how far structural changes occurred. Output multipliers indicate, by sector, the amount of production generated in the economy for each unit of final demand, i.e. allow for highlighting those sectors whose production has a stronger response to demand stimuli given their direct and indirect effects over the economic system. For the 1995-2009 period, most sectors presented an average multiplier above 2, and all sectors, above 1.5. The main sectors able to stimulate total production from a given change in final demand were industrial sectors, in particular “transport equipments”, “electrical equipments”, “textiles and footwear” and “machinery” (Figure 1). In other words, these sectors presented deeper productive linkages in the economy as a whole, a sign of the large and diversified industrial base China developed. Several services and primary sectors ranked among the lowest output multipliers in the economy during this period.
7 See Flassbeck (2005), Lo (2006), Fang et al. (2009), Bibow (2010), Lin (2012) and Felipe et al. (2013) for different but complementary perspectives on the Chinese growth trajectory.

10
Figure 1. China – Output multipliers, average 1995-2009
Source: Own elaboration based on WIOD Chinese tables. This analysis of output multipliers is complemented by the degree of dependence between sectors provided by Hirschman-Rasmussen forward and backward linkages. In accordance with these results, sectors could be classified as generally dependent on other sectors, dependent on interindustry supply, dependent on interindustry demand or relatively independent of other sectors. Sectors with the highest output multipliers in the Chinese productive structure also presented the highest backward linkages, therefore classified as dependent on interindustry supply. They usually required supply of intermediate inputs from other sectors whilst their production was generally directed to meet final demand (Figure 2). Figure 2. China – Hirschman-Rasmussen backward and forward linkages, average
1995-2009
Source: Own elaboration based on WIOD Chinese tables. Note: The circle size represents the output multiplier of a sector proportional to other sectors’ multipliers in the economy, so that the bigger the circle, the higher the multiplier in relation to other multipliers.
0.0
0.5
1.0
1.5
2.0
2.5
3.0
3.5
Tra
nsp
ort E
quip
.
Ele
ctric
al E
qui
p.
Tex
tiles
& F
oot
wea
r
Mac
hine
ry
Met
als
& N
on-M
et.
Min
er.
Oth
er M
anu
fact
.A
ctiv
.
Foo
d &
Bev
erag
es
Che
mic
als
& P
last
ics
Con
stru
ctio
n
Util
ities
Ref
ined
Oil
& F
uels
Tra
nsp
ort &
Foo
dS
erv
.
Pu
blic
Adm
., E
duc.
&H
ealth
Tra
de
Min
era
l Co
mm
od
.
Ag
ricul
tura
lC
omm
od.
Fin
. Ser
v. &
Rea
lE
stat
e
0.4
0.6
0.8
1.0
1.2
1.4
1.6
0.4 0.6 0.8 1.0 1.2 1.4 1.6
FL
BL
Mineral Commod.
Utilities
Ref. Oil & Fuels
Chem. & Plastics
Met. & Non-Met. Miner.
Other Manuf. Act.
TradeFin. Serv. & Real Estate
Transp. & Food Serv.
Agric. Commod.
Public Adm., Educ. & Health
Construction
Food & Beverages
Text. & Foot.
MachineryTransp. Equip.
Elect. Equip.

11
Some other sectors with high output multipliers were “chemicals and plastics”, and “metals and non-metallic minerals”, which presented both forward and backward linkages above 1, thus considered as sectors generally dependent on other sectors, once important to the productive structure both as demanding and supplying inputs for other sectors in the economy. “Mineral commodities”, “utilities” and “refined oil and fuels” were dependent on interindustry demand, as they showed high forward linkages only. Some relatively independent sectors were some services and “agricultural commodities”, although they registered in average a considerable forward linkage. In this regard, “public administration, education and health” figured as the most independent sector in the economy (Figure 2). In order to depict how interconnected sectors are, the notion of fields of influence is applied, so that most important linkages between sectors become evident. Three major facts regarding relative transformations of the Chinese productive structure arise from the analysis of fields of influence over time in Figure 3. Firstly, linkages between traditional primary sectors, namely agriculture and mineral commodities, and other sectors in the economy weakened, although they remained important. Linkages between them as well as linkages between them and industrial sectors clearly attenuated in relation to linkages in the overall economy (see linkages between sectors 1 and 2 and the rest of the economy). Secondly, linkages between services sectors and other sectors in the economy changed their configuration and, in general, weakened as well. Linkages only between services sectors were not highly significant, as they were below the average every year, whilst linkages between services and industrial sectors relatively reduced (see linkages between sectors 14 to 17 and the rest of the economy). Thirdly, the Chinese economy became more diversified and industrial production became more integrated. Industrial linkages were mostly above the average of the economy every year and consistently presented the highest linkages. There were also fewer outlier points of very intense interconnection, such as between “metals and non-metallic minerals” and other industrial sectors, in favour of a relative strengthening of linkages between other industrial sectors. The relative intensity of linkages between key industrial sectors changed in the productive structure so that “metals and non-metallic minerals” (sector 7), “chemicals and plastics” (sector 6) and “textiles and footwear” (sector 4) experienced, for instance, relative weakness, maintenance and strengthening of their linkages with other sectors in the economy, respectively (Figure 3).

12
Figure 3. China – Fields of influence, selected years
Average = 3.03; SD = 1.36 Average = 2.95; SD = 1.27
Average = 3.16; SD = 1.34 Average = 3.48; SD = 1.63
Source: Own elaboration based on WIOD Chinese tables. Note: 1-2 as primary sectors; 3-13 as industrial sectors; 14-17 as services sectors. See Appendix for sectors correspondence to numbers in detail. The huge process of structural change that China promoted in its productive structure is reflected in its trade pattern. The share of manufactures exports in total merchandise exports continuously increased, passing from less than 60% in 1987 to more than 90% already in 2003. The share of manufactures imports in total merchandise imports followed an opposite trend, reducing from more than 80% in 1987 to approximately 55% in 2012 (Figure 4). These movements clearly show how sectoral composition changed in favour of industrial goods to the detriment of primary goods in the economy over the years. After 1994, the share of manufactures exports surpassed the share of manufactures imports. Not

13
by coincidence, China began registering systematic trade surpluses and, consequently, alleviating foreign exchange constraints on growth.
Figure 4. China – Manufactures exports and imports, 1987-2012 (% merchandise exports and imports)
Source: Own elaboration based on data from the World Bank – World Development Indicators. Note: Manufactures comprise commodities in the Standard International Trade Classification (SITC) sections 5 (chemicals), 6 (basic manufactures), 7 (machinery and transport equipment), and 8 (miscellaneous manufactured goods), excluding division 68 (non-ferrous metals). Non-manufactures refer to primary goods, which, by exclusion, correspond to commodities in the SITC sections 0 (food and live animals), 1 (beverages and tobacco), 2 (crude materials, except fuels), 3 (mineral fuels and related materials), 4 (animal and vegetable oils), and 9 (commodities and transactions not classified elsewhere in the SITC), including division 68 (non-ferrous metals). Exports of tradable sectors – mostly manufacturing industries – generated the necessary foreign exchange to assure imports to carry on with the process of economic development. Total import penetration coefficient also rose, meaning that a higher share of imports was used to meet domestic demand (Figure 5). Nonetheless, it accounted for less than 10% of domestic demand and was consistently lower than the export coefficient.
Figure 5. China – Trade coefficients, 1995-2009 Source: Own elaboration based on WIOD Chinese tables. Notes: TEC = Total Export Coefficient; TIPC = Total Import Penetration Coefficient.
0
10
20
30
40
50
60
70
80
90
100
1987
1988
1989
1990
1991
1992
1993
1994
1995
1996
1997
1998
1999
2000
2001
2002
2003
2004
2005
2006
2007
2008
2009
2010
2011
2012
Manufactures exports (% merchandise exports)
Manufactures imports (% merchandise imports)
0.00
0.02
0.04
0.06
0.08
0.10
0.12
0.14
0.16
0.18
1995 1996 1997 1998 1999 2000 2001 2002 2003 2004 2005 2006 2007 2008 2009
TEC TIPC

14
Imports complemented the process of economic growth once providing necessary inputs while promoting continuous industrial deepening as observed in the Chinese productive structure. As Figure 6 shows, the share of imports to meet intermediate consumption increased whilst imports for final demand, such as household consumption and especially investment, relatively reduced when the total import penetration coefficient was higher.
Figure 6. China – Share of total imports by components of domestic demand, 1995-2009 (%)
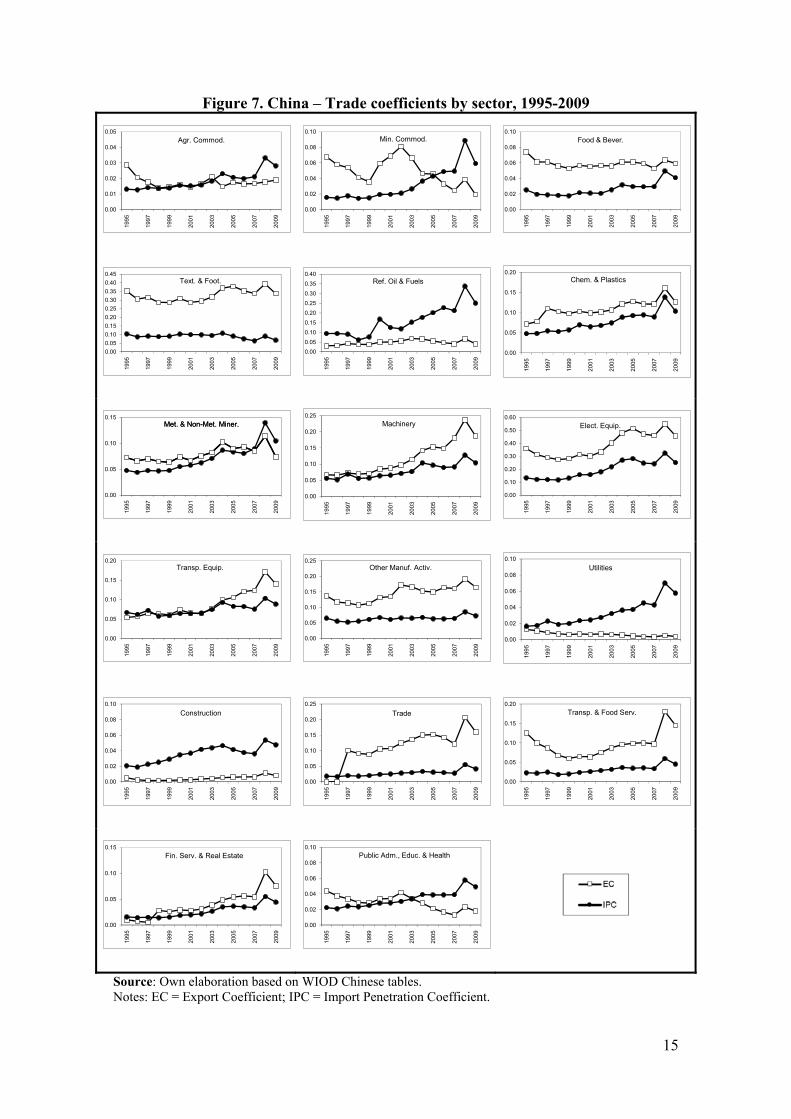
Source: Own elaboration based on WIOD Chinese tables. Most sectoral export and import penetration coefficients followed the pattern observed for the overall economy that the import penetration coefficient increased but to a lesser extent than the export coefficient, therefore preventing the economy from foreign exchange constraints in the short-term. This was the pattern for most industrial sectors. Sectoral analysis shows, however, some important differences among them. The trend of imports to meet domestic demand significantly increased for sectors such as “mineral commodities”, “refined oil and fuels”, “metals and non-metallic minerals”, “electrical equipments”, “utilities”, and “construction”. Most of them are sectors that supply inputs for other sectors and infrastructure-related sectors. Given the massive infrastructure expansion and investments in general in China over the period, it was expected that the proportion of imports to meet domestic demand for these sectors would increase. However, the level of the import penetration coefficient was considerably high only for a highly export-oriented sector (“electrical equipments”) and a less integrated sector in the domestic productive structure (“refined oil and fuels”), as for the great majority of sectors the coefficient was lower than 10% (Figure 7). Apart from “refined oil and fuels”, “utilities”, and “construction”, export coefficients were in general higher than import penetration coefficients. Among these sectors, two of them, which were more integrated into the domestic productive structure, namely “construction” and “utilities”, presented a low level of import penetration, as they were relatively small sectors in the Chinese import structure. Sectors whose import penetration coefficients surpassed their export coefficients were “mineral commodities”, “agricultural commodities”, and “public administration, education and health”. However, their level were not very high (Figure 7). Among them, one should remark that “mineral commodities” became an increasingly large import sector in the mid-2000s.
0
10
20
30
40
50
60
70
80
90
100
1995 1996 1997 1998 1999 2000 2001 2002 2003 2004 2005 2006 2007 2008 2009
Total Intermediate Consumption Household Consumption
Government Expenditure Investment
15
Figure 7. China – Trade coefficients by sector, 1995-2009
Source: Own elaboration based on WIOD Chinese tables. Notes: EC = Export Coefficient; IPC = Import Penetration Coefficient.
0.00
0.01
0.02
0.03
0.04
0.051
99
5
19
97
19
99
20
01
20
03
20
05
20
07
20
09
Agr. Commod.
0.00
0.02
0.04
0.06
0.08
0.10
19
95
19
97
19
99
20
01
20
03
20
05
20
07
20
09
Min. Commod.
0.00
0.02
0.04
0.06
0.08
0.10
1995
1997
1999
2001
2003
2005
2007
2009
Food & Bever.
0.00
0.05
0.10
0.15
0.20
0.25
0.30
0.35
0.40
0.45
1995
1997
1999
2001
2003
2005
2007
2009
Text. & Foot.
0.00
0.05
0.10
0.15
0.20
0.25
0.30
0.35
0.40
199
5
199
7
199
9
200
1
200
3
200
5
200
7
200
9
Ref. Oil & Fuels
0.00
0.05
0.10
0.15
0.20
19
95
19
97
19
99
20
01
20
03
20
05
20
07
20
09
Chem. & Plastics
0.00
0.05
0.10
0.15
1995
1997
1999
2001
2003
2005
2007
2009
Met. & Non-Met. Miner.Met. & Non-Met. Miner.
0.00
0.05
0.10
0.15
0.20
0.25
19
95
19
97
19
99
20
01
20
03
20
05
20
07
20
09
Machinery
0.00
0.10
0.20
0.30
0.40
0.50
0.60
1995
1997
1999
2001
2003
2005
2007
2009
Elect. Equip.
0.00
0.05
0.10
0.15
0.20
1995
1997
1999
2001
2003
2005
2007
2009
Transp. Equip.
0.00
0.05
0.10
0.15
0.20
0.25
1995
1997
1999
2001
2003
2005
2007
2009
Other Manuf. Activ.
0.00
0.02
0.04
0.06
0.08
0.10
199
5
199
7
199
9
200
1
200
3
200
5
200
7
200
9
Utilities
0.00
0.02
0.04
0.06
0.08
0.10
1995
1997
1999
2001
2003
2005
2007
2009
Construction
0.00
0.05
0.10
0.15
0.20
0.25
1995
1997
1999
2001
2003
2005
2007
2009
Trade
0.00
0.05
0.10
0.15
0.20
1995
1997
1999
2001
2003
2005
2007
2009
Transp. & Food Serv.
0.00
0.05
0.10
0.15
1995
1997
1999
2001
2003
2005
2007
2009
Fin. Serv. & Real Estate
0.00
0.02
0.04
0.06
0.08
0.10
1995
1997
1999
2001
2003
2005
2007
2009
Public Adm., Educ. & Health

16
Export coefficients were higher than import penetration coefficients for most of other large import sectors, such as “machinery”, “chemicals and plastics”, “metals and non-metallic minerals”, “textiles and footwear”, and “electrical equipments” (Figure 7). They were, indeed, also large export sectors in the trade structure, although their production was not necessarily directed mostly to foreign markets, which was only the case of “electrical equipments” and “textiles and footwear”. The Chinese trade pattern, therefore, reflected the structural composition in favour of industrial sectors, given the large industrial base built up over the years, as well as the fact that, despite the increasing need of imports mostly for intermediate consumption, the economy and most of its sectors were able to meet this need by raising exports. In this regard, the Chinese economy was able to promote sustained growth without facing balance of payments constraints8. 5. Concluding remarks This paper provided a perspective on China’s sustained growth trajectory from a Kaldorian-Structuralist framework. These approaches emphasise the importance of the consolidation of a large, diversified and integrated industrial base as central to economic growth without facing balance of payments constraints. Higher demand multiplier effects over the domestic economic system depend on the organisation of the productive structure in terms of sectoral composition, interindustry linkages, and domestic and foreign supply. Input-output analysis of the Chinese economy allowed for the identification of major structural changes over the years. Results showed evidence for the understanding of China’s growth pattern as an investment-cum-foreign exchange growth with diversification alongside a deeper integration of domestic industrial production. The key economic sectors of the Chinese productive structure were large industrial sectors. In general, they presented the highest output multipliers and the strongest interindustry linkages. Furthermore, the strengthening of interindustry linkages, particularly between industrial sectors, reveals that the Chinese economy became more diversified and industrial production, more integrated, in the period between 1995 and 2009. The process of structural change that China experienced in its productive structure towards larger industrial sectors and stronger industrial linkages was reflected in its trade pattern, breaking with the particular Kaldorian-Structuralist concern for developing economies of balance of payments constraints on long-term economic growth. Manufacturing exports substantially increased over time, while manufacturing imports reduced, indicating the changes in the sectoral composition of production. Trade coefficients also showed that, in spite of an increasing need of imports, which were mostly directed to intermediate consumption – as expected in case of a growing and changing economy such as China –, the economy as a whole and most sectors were able to raise exports. That meant they were able to assure necessary foreign exchange to meet the need of imports and continue the process of strengthening domestic industrial production. These conclusions for China are aligned with the Kaldorian-Structuralist arguments for long-term economic growth discussed in this paper. The Chinese economy succeeded in promoting a sustained growth trajectory without facing balance of payments constraints, 8 These constraints were further reduced once considering the large amount of capital inflows that occurred in the period particularly in the form of foreign direct investments.
17
given the important changes made towards the consolidation of a large and diverse productive structure. New challenges, however, may come ahead to direct the complex Chinese economy in a world that is continuously changing. References BIBOW, J. (2010) “How to sustain the Chinese economic miracle? The risk of unraveling
the global rebalancing”, Levy Economics Institute Working Paper, n.617, Levy Economics Institute of Bard College, September.
BLANKENBURG, S.; PALMA, J. G.; TREGENNA, F. (2008) “Structuralism”. In: DURLAUF, S.; BLUME, L. (Eds.) The new Palgrave dictionary of economics, v.8. Basingstoke: Palgrave Macmillan, pp.69-74.
CHENERY, H. B. (1980) “Interactions between industrialisation and exports”, American Economic Review, v.70, n.2, May, pp.281-287.
FANG, C.; YANG, D.; MEIYAN, W. (2009) “Crise ou oportunidade: resposta da China à crise financeira global”, Revista Tempo do Mundo, v.1, n.1, December, pp.97-119.
FELIPE, J.; KUMAR, U.; USUI, N.; ABDON, A. (2013) “Why has China succeeded? And why it will continue to do so”, Cambridge Journal of Economics, v.37, pp.791-818.
FLASSBECK, H. (2005) “China’s spectacular growth since the mid-1990s – macroeconomic conditions and economic policy changes”. In: UNCTAD, China in a globalising world. New York and Geneva: United Nations, pp.1-44.
GUILHOTO, J. J. M. (2009) Análise de insumo-produto: teoria, fundamentos e aplicações. São Paulo: FEA-USP.
HIRSCHMAN, A. O. (1958) The strategy of economic development. New Haven: Yale University Press.
HIRSCHMAN, A. O. (1987) “Linkages”. In: EATWELL, J.; MILGATE, M.; NEWMAN, P. (Eds.) The new Palgrave: a dictionary of economics. London: Macmillan, pp.206-211.
KALDOR, N. (1966) Causes of the slow rate of economic growth of the United Kingdom. Cambridge: Cambridge University Press.
KALDOR, N. (1968) “Productivity and growth in manufacturing industry: a reply”, Economica, New Series, v.35, n.140, November, pp.385-391.
KALDOR, N. (1977) “Capitalism and industrial development: some lessons from Britain’s experience”, Cambridge Journal of Economics, v.1, n.2, June, pp.193-204.
KALDOR, N. (1981) “The role of increasing returns, technical progress and cumulative causation in the theory of international trade and economic growth”, Économie Appliquée, Cahiers de l’ISMEA, v.34, n.4, pp.593-617.
KING, J. E. (2009) Nicholas Kaldor. Basingstoke: Palgrave Macmillan. KING, J. E. (2010) “Kaldor and the Kaldorians”. In: SETTERFIELD, M. (Ed.) Handbook
of alternative theories of economic growth. Cheltenham and Northampton: Edward Elgar, pp.157-172.
LIN, J. Y. (2012) Demystifying the Chinese economy. Cambridge: Cambridge University Press.
LO, D. (2006) “Making sense of China’s economic transformation”, SOAS Economics Working Papers, n.148, Department of Economics, School of Oriental and African Studies (SOAS), University of London, March.

18
MILLER, R. E.; BLAIR, P. D. (2009) Input-output analysis: foundations and extensions, 2nd edition. Cambridge: Cambridge University Press.
NURKSE, R. (1953) Problems of capital formation in underdeveloped countries. Oxford and New York: Oxford University Press.
PREBISCH, R. (1949) The economic development of Latin America and its principal problems (From the original in Spanish El desarrollo económico de América Latina y algunos de sus principales problemas). Lake Success: United Nations, 1950.
RASMUSSEN, P. (1956) Studies in intersectoral relations. Amsterdam: North Holland. ROSENSTEIN-RODAN, P. N. (1943) “Problems of industrialisation of Eastern and
South-Eastern Europe”, Economic Journal, v.53, n.210/211, June-September, pp.202-211.
SANCHEZ-ANCOCHEA, D. (2007) “Anglo-Saxon versus Latin American structuralism in development economics”. In: CALDENTEY, E. P.; VERNENGO, M. (Eds.) Ideas, policies and economic development in the Americas. London and New York: Routledge, pp.208-226.
SINGER, H. W. (1950) “The distribution of gains between investing and borrowing countries”, American Economic Review, v.40, n.2, May, pp.473-485.
SONIS, M.; HEWINGS, G. J. D. (1989) “Error and sensitivity input-output analysis: a new approach”. In: MILLER, R. E.; POLENSKE, K. R.; ROSE, A. Z. (Eds.) Frontiers of input-output analysis. New York: Oxford University Press, pp.232-244.
SONIS, M.; HEWINGS, G. J. D. (1991) “Fields of influence and extended input-output analysis: a theoretical account”. In: DEWHURST, J. H. L.; JENSEN, R. C.; HEWINGS, G. J. D. (Eds.) Regional input-output modelling: new developments and interpretations. Avebury: Aldershot, pp.141-158.
THIRLWALL, A. P. (1979) “The balance of payments constraint as an explanation of international growth rate differences”, Banca Nazionale del Lavoro Quarterly Review, v.128, pp.45-53.
THIRLWALL, A. P. (1983) “A plain man’s guide to Kaldor’s growth laws”, Journal of Post Keynesian Economics, v.5, n.3, Spring, pp.345-358.
THIRLWALL, A. P. (2002) The nature of economic growth: an alternative framework for understanding the performance of nations. Cheltenham: Edward Elgar.
TIMMER, M. (Ed.) (2012) The World Input-Output Database (WIOD): contents, sources and methods, version 0.9. Groningen: University of Groningen, April.

19
Appendix. Map of sectoral aggregation for China 1. Agricultural Commodities: 1. Agriculture, Hunting, Forestry and Fishing 2. Mineral Commodities: 2. Mining and Quarrying 3. Food and Beverages: 3. Food, Beverages and Tobacco 4. Textiles and Footwear: 4. Textiles and Textile Products 5. Leather, Leather and Footwear 5. Refined Oil and Fuels: 8. Coke, Refined Petroleum and Nuclear Fuel 6. Chemicals and Plastics: 9. Chemicals and Chemical Products 10. Rubber and Plastics 7. Metals and Non-Metallic Minerals: 11. Other Non-Metallic Mineral 12. Basic Metals and Fabricated Metal 8. Machinery: 13. Machinery, Nec 9. Electrical Equipments: 14. Electrical and Optical Equipment 10. Transport Equipments: 15. Transport Equipment 11. Other Manufacturing Activities: 6. Wood and Products of Wood and Cork 7. Pulp, Paper, Paper, Printing and Publishing 16. Manufacturing, Nec; Recycling 12. Utilities: 17. Electricity, Gas and Water Supply 13. Construction: 18. Construction 14. Trade: 19. Sale, Maintenance and Repair of Motor Vehicles and Motorcycles; Retail Sale of Fuel 20. Wholesale Trade and Commission Trade, Except of Motor Vehicles and Motorcycles 21. Retail Trade, Except of Motor Vehicles and Motorcycles; Repair of Household Goods 15. Transport and Food Services: 22. Hotels and Restaurants 23. Inland Transport 24. Water Transport 25. Air Transport 26. Other Supporting and Auxiliary Transport Activities; Activities of Travel Agencies 27. Post and Telecommunications 16. Financial Services and Real Estate: 28. Financial Intermediation 29. Real Estate Activities 30. Renting of M&Eq and Other Business Activities 17. Public Administration, Education and Health: 31. Public Admin and Defence; Compulsory Social Security 32. Education 33. Health and Social Work 34. Other Community, Social and Personal Services 35. Private Households with Employed Persons Source: Own classification transforming original 35-sectors matrix into 17-sectors aggregated matrix.