Embed Size (px)
Citation preview
Structural and Functional Evaluation of Flexible Pavement in Indonesia
Case Study: Ciasem-Pamanukan Section
Bambang Sugeng SUBAGIOa,Frisky RAMC
b,Harmein RAHMAN
c, Aine KUSUMAWATI
d
aProfessor,Graduate School of Highway Engineering and Development, Institut Teknologi
Bandung, Jalan Ganeca 10, Bandung, Indonesia bAssistant, Graduate School of Highway Engineering and Development, Institut Teknologi
Bandung, Jalan Ganeca 10 Bandung, Indonesia c,d
Lecturer, Faculty of Civil Engineering and Environment, Institut Teknologi Bandung,
Bandung, Jalan Ganeca 10 Bandung, Indonesia aE-mail: [email protected]
bE-mail: [email protected]
cE-mail: [email protected]
dE-mail: [email protected]
Abstract : The purpose of this research is to evaluate the Structural and Functional
performance of one section of the National Road (PANTURA) located in the North Java’s
Corridor. Two methods were used in this evaluation, the IRMS or Bina Marga’s method and
the AASHTO-93 method. The Bina Marga’s method focused on the evaluation of the
Functional Performance, while the AASHTO-93 method was used to analyze the Structural
Condition. Some parameters were considered in the Functional analysis that is: IRI
(International Roughness Index), PSI (Present Serviceability Index) and SDI (Surface Distress
Index), while in the Structural analysis the SN (Structural Number) was used. The result of
Functional Analysis using Bina Marga’s method showed that all segments in Ciasem-
Pamanukan were in good and fair condition, and do not need any structural treatment.
However, the results of Structural Analysis show that some points have “zero” Remaining
Life and require a 25cm overlay thickness.
Key Words: Present Serviceability Index, International Roughness Index, Surface Distress
Index, Bina Marga’s method, AASHTO-93 method.
1. INTRODUCTION
The Pavement Management System (PMS) has been defined by AASHTO as a set of tools or
methods that assist decision-makers in finding optimum strategies for providing, evaluating
and maintaining pavements in a serviceable condition over a period of time (AASHTO, 2001
in Huang, 2012). The Directorate General of Highways, has been implemented the Pavement
Management System for National roads In Indonesia since many years ago, with the name of
IRMS (Inter-urban Road Management System) (DGBM, 1992).
The objective of this study is to compare the results of pavement evaluation between the
IRMS method, which focused only on Functional Performance, with another method which
combines the Functional and Structural evaluation, based on the AASHTO-93 method.
PANTURA’s Highway is a National-Arterial road, located in North corridor of Java
Island, and has a very strategic role in the Transportation mobility from West Java to East
Proceedings of the Eastern Asia Society for Transportation Studies, Vol.9, 2013

Java vice versa, as shown in Figure 1. This condition will impose a very high of traffic
volume and consequently, a very high cumulative axle loading to the pavement structure.
Referring to AASHTO-93 method (AASHTO, 1993), there are two main types of failure
which associated to pavement deterioration; those are functional failure and structural failure.
Functional failure is a failure where the pavement is unable to carry traffic without causing
discomfort to the road users. This failure depends primarily upon the degree of surface
roughness or IRI value. Structural failure indicates a breakdown of one or more pavement
components, making it incapable of sustaining the loads imposed upon its service life.
The purpose of this research is to evaluate the structural and functional performance of
one section in the PANTURA’s national road, that is : Ciasem-Pamanukan. In the analysis of
Functional Performance, some parameters were used, that is : IRI (International Roughness
Index), PSI (Present Serviceability Index) and SDI (Surface Distress Index), while in the
analysis of Structural performance using the AASHTO-93 method, the SN (Structural
Number) value is calculated and used to analyze the Remaining Life and Overlay Thickness.
2. RESEARCH METHODOLOGY
The working plan of this study can be seen in Figure 2, which is divided into two parallel
programs: Functional Analysis and Structural Analysis.
Figure 1. Location of Ciasem to Pamanukan Section
The methodology of Functional analysis consists of:
- The collection of visual condition data from field survey which represents the
pavement surface condition.
CASE STUDY
KM 117+000 to KM 123+000
Proceedings of the Eastern Asia Society for Transportation Studies, Vol.9, 2013

- The collection of the latest Roughness data (IRI), resulting from IRMS’s program,
which represent the smoothness of pavement surface.
- Using the formula from Sayers et al. (1986) (see equation 1), the PSI value for each
survey-point of IRI can be calculated.
Functional Condition
Compound Analysis
Functional-Structural
(for each Line and Direction)
Analysis of IRI Data
IRI-SDI Analysis Using
Bina Marga’s Standard
PSI Calculation Using AASHTO
Method
Visual Survey Data Roughness Data
Data Collection
Traffic Data
Structural Analysis Using
AASHTO 1993 Method
SN future & SN effective
Structural Analysis
Functional Analysis
START
Analysis of Functional
Condition
Analysis of Structural
Condition
SDI Calculation Using
Bina Marga’s Standard
Functional Condition
Comparison of Functional
Condition
Street Map
Deflection Data Pavement Thickness Data
Remaining Life Overlay Thickness
Street Map
Data Collection
Conclusion
FINISH
Figure 2. Flow Chart of Research Method
- Using the result of visual condition survey, the SDI (Surface Distress Index) value for
each survey-point can be determined ( see Table 1 ).
Proceedings of the Eastern Asia Society for Transportation Studies, Vol.9, 2013

- In the same section ( Ciasem-Pamanukan ), the PSI value and the IRI-SDI value were
applied in order to obtain the Functional condition for each survey-point.
- Finally the Functional condition based on the PSI value and the IRI-SDI value can be
compared and analyzed, in order to determine the Pavement Maintenance Strategy for
those sections, with an objective to carry traffic safely, conveniently and economically
over its extended life. Three options of Pavement Maintenance Strategy are Routine
Maintenance, Periodic Maintenance and Reconstruction.
The Methodology of Structural analysis consists of :
- The collection of some principal data in the Ciasem-Pamanukan section, which
consists of traffic data (AADT) for two directions, the axle-loading data resulted from
WIM survey in 2010, the FWD’s deflection data, the pavement thickness data and the
pavement temperature data.
- The average Traffic Growth was calculated based on the “time series” AADT data.
- The Truck Factor for each vehicle type was calculated using the axle-loading data.
- The cumulative ESAL actual and the “future” cumulative ESAL will be determined
considering the AADT data, the average growth factor and the Truck Factor for each
vehicle.
- Hence, the AASHTO-93 method can be applied to obtain the SNf and SNeff (future
and effective values, respectively), the Remaining life (RL) of those sections, and the
overlay thickness for several survey-point.
3. DATA PRESENTATION
3.1 Roughness Data
Roughness data, in the form of “International Roughness Index” (IRI), was collected every
year using NAASRA Roughometer and then compiled in the IRMS Database Program. The
IRI data will be transformed to PSI value, considering the formula proposed by Sayers et al.
(1986) as shown in equation 1.
Source: PUSJATAN 2011
Figure 3.IRI Values for Pamanukan Direction – Fast Lane
Proceedings of the Eastern Asia Society for Transportation Studies, Vol.9, 2013
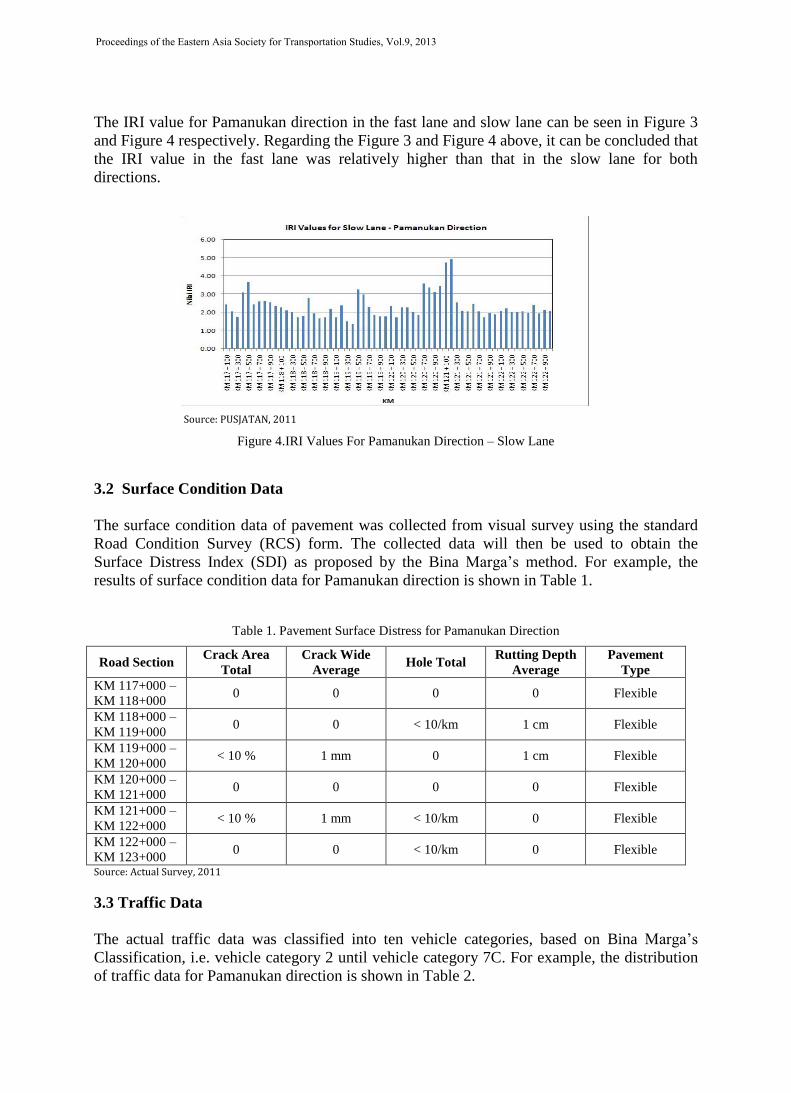
The IRI value for Pamanukan direction in the fast lane and slow lane can be seen in Figure 3
and Figure 4 respectively. Regarding the Figure 3 and Figure 4 above, it can be concluded that
the IRI value in the fast lane was relatively higher than that in the slow lane for both
directions.
Source: PUSJATAN, 2011
Figure 4.IRI Values For Pamanukan Direction – Slow Lane
3.2 Surface Condition Data
The surface condition data of pavement was collected from visual survey using the standard
Road Condition Survey (RCS) form. The collected data will then be used to obtain the
Surface Distress Index (SDI) as proposed by the Bina Marga’s method. For example, the
results of surface condition data for Pamanukan direction is shown in Table 1.
Table 1. Pavement Surface Distress for Pamanukan Direction
Road Section Crack Area
Total
Crack Wide
Average Hole Total
Rutting Depth
Average
Pavement
Type
KM 117+000 –
KM 118+000 0 0 0 0 Flexible
KM 118+000 –
KM 119+000 0 0 < 10/km 1 cm Flexible
KM 119+000 –
KM 120+000 < 10 % 1 mm 0 1 cm Flexible
KM 120+000 –
KM 121+000 0 0 0 0 Flexible
KM 121+000 –
KM 122+000 < 10 % 1 mm < 10/km 0 Flexible
KM 122+000 –
KM 123+000 0 0 < 10/km 0 Flexible
Source: Actual Survey, 2011
3.3 Traffic Data
The actual traffic data was classified into ten vehicle categories, based on Bina Marga’s
Classification, i.e. vehicle category 2 until vehicle category 7C. For example, the distribution
of traffic data for Pamanukan direction is shown in Table 2.
Proceedings of the Eastern Asia Society for Transportation Studies, Vol.9, 2013
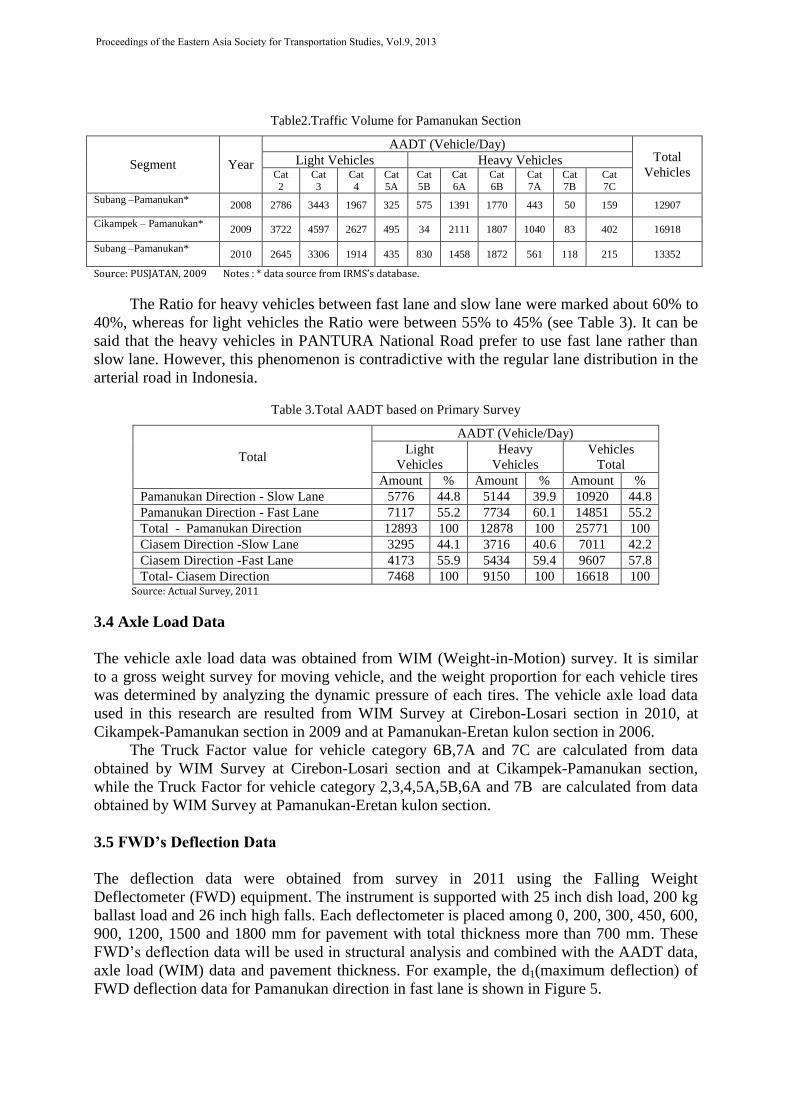
Table2.Traffic Volume for Pamanukan Section
Segment Year
AADT (Vehicle/Day) Total
Vehicles Light Vehicles Heavy Vehicles
Cat 2
Cat 3
Cat 4
Cat 5A
Cat 5B
Cat 6A
Cat 6B
Cat 7A
Cat 7B
Cat 7C
Subang –Pamanukan* 2008 2786 3443 1967 325 575 1391 1770 443 50 159 12907
Cikampek – Pamanukan* 2009 3722 4597 2627 495 34 2111 1807 1040 83 402 16918
Subang –Pamanukan* 2010 2645 3306 1914 435 830 1458 1872 561 118 215 13352
Source: PUSJATAN, 2009 Notes : * data source from IRMS’s database.
The Ratio for heavy vehicles between fast lane and slow lane were marked about 60% to
40%, whereas for light vehicles the Ratio were between 55% to 45% (see Table 3). It can be
said that the heavy vehicles in PANTURA National Road prefer to use fast lane rather than
slow lane. However, this phenomenon is contradictive with the regular lane distribution in the
arterial road in Indonesia.
Table 3.Total AADT based on Primary Survey
Total
AADT (Vehicle/Day)
Light
Vehicles
Heavy
Vehicles
Vehicles
Total
Amount % Amount % Amount %
Pamanukan Direction - Slow Lane 5776 44.8 5144 39.9 10920 44.8
Pamanukan Direction - Fast Lane 7117 55.2 7734 60.1 14851 55.2
Total - Pamanukan Direction 12893 100 12878 100 25771 100
Ciasem Direction -Slow Lane 3295 44.1 3716 40.6 7011 42.2
Ciasem Direction -Fast Lane 4173 55.9 5434 59.4 9607 57.8
Total- Ciasem Direction 7468 100 9150 100 16618 100 Source: Actual Survey, 2011
3.4 Axle Load Data
The vehicle axle load data was obtained from WIM (Weight-in-Motion) survey. It is similar
to a gross weight survey for moving vehicle, and the weight proportion for each vehicle tires
was determined by analyzing the dynamic pressure of each tires. The vehicle axle load data
used in this research are resulted from WIM Survey at Cirebon-Losari section in 2010, at
Cikampek-Pamanukan section in 2009 and at Pamanukan-Eretan kulon section in 2006.
The Truck Factor value for vehicle category 6B,7A and 7C are calculated from data
obtained by WIM Survey at Cirebon-Losari section and at Cikampek-Pamanukan section,
while the Truck Factor for vehicle category 2,3,4,5A,5B,6A and 7B are calculated from data
obtained by WIM Survey at Pamanukan-Eretan kulon section.
3.5 FWD’s Deflection Data
The deflection data were obtained from survey in 2011 using the Falling Weight
Deflectometer (FWD) equipment. The instrument is supported with 25 inch dish load, 200 kg
ballast load and 26 inch high falls. Each deflectometer is placed among 0, 200, 300, 450, 600,
900, 1200, 1500 and 1800 mm for pavement with total thickness more than 700 mm. These
FWD’s deflection data will be used in structural analysis and combined with the AADT data,
axle load (WIM) data and pavement thickness. For example, the d1(maximum deflection) of
FWD deflection data for Pamanukan direction in fast lane is shown in Figure 5.
Proceedings of the Eastern Asia Society for Transportation Studies, Vol.9, 2013

Source: PUSJATAN, 2011
Figure 5. Deflection d1 for Pamanukan Direction – Fast Lane
3.6 Pavement Thickness Data
Regarding the result of test-pit survey in 2008 and the report of pavement maintenance
program in 2011, the pavement thickness in Ciasem-Pamanukan section ( Km 117+000 to Km
123+000) consist of Subgrade layer, Subbase layer, Surface layer and an overlay thickness
applied in 2011. For example, the pavement thickness for Pamanukan direction - fast lane is
shown in Figure 6.
Source: PUSJATAN, 2011
Figure 6.Pavement Thickness for Pamanukan Direction - Fast Lane
4. DATA ANALYSIS
4.1 Functional Analysis using Bina Marga’s Method
CBR 9.9 %
Sirtu 710 mm CBR 8.7 %
Laston (ATB) 290 mm
Laston 50 mm
Proceedings of the Eastern Asia Society for Transportation Studies, Vol.9, 2013
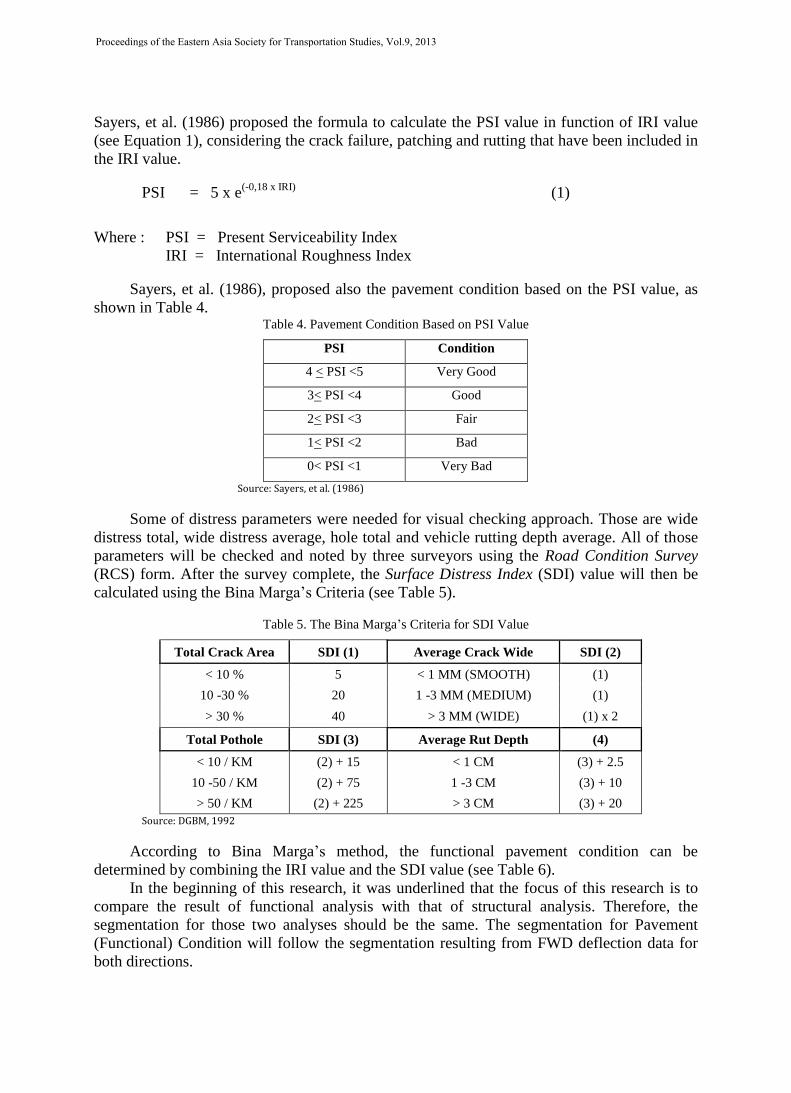
Sayers, et al. (1986) proposed the formula to calculate the PSI value in function of IRI value
(see Equation 1), considering the crack failure, patching and rutting that have been included in
the IRI value.
PSI = 5 x e(-0,18 x IRI)
(1)
Where : PSI = Present Serviceability Index
IRI = International Roughness Index
Sayers, et al. (1986), proposed also the pavement condition based on the PSI value, as
shown in Table 4. Table 4. Pavement Condition Based on PSI Value
PSI Condition
4 < PSI <5 Very Good
3< PSI <4 Good
2< PSI <3 Fair
1< PSI <2 Bad
0< PSI <1 Very Bad
Source: Sayers, et al. (1986)
Some of distress parameters were needed for visual checking approach. Those are wide
distress total, wide distress average, hole total and vehicle rutting depth average. All of those
parameters will be checked and noted by three surveyors using the Road Condition Survey
(RCS) form. After the survey complete, the Surface Distress Index (SDI) value will then be
calculated using the Bina Marga’s Criteria (see Table 5).
Table 5. The Bina Marga’s Criteria for SDI Value
Total Crack Area SDI (1) Average Crack Wide SDI (2)
< 10 % 5 < 1 MM (SMOOTH) (1)
10 -30 % 20 1 -3 MM (MEDIUM) (1)
> 30 % 40 > 3 MM (WIDE) (1) x 2
Total Pothole SDI (3) Average Rut Depth (4)
< 10 / KM (2) + 15 < 1 CM (3) + 2.5
10 -50 / KM (2) + 75 1 -3 CM (3) + 10
> 50 / KM (2) + 225 > 3 CM (3) + 20
Source: DGBM, 1992
According to Bina Marga’s method, the functional pavement condition can be
determined by combining the IRI value and the SDI value (see Table 6).
In the beginning of this research, it was underlined that the focus of this research is to
compare the result of functional analysis with that of structural analysis. Therefore, the
segmentation for those two analyses should be the same. The segmentation for Pavement
(Functional) Condition will follow the segmentation resulting from FWD deflection data for
both directions.
Proceedings of the Eastern Asia Society for Transportation Studies, Vol.9, 2013
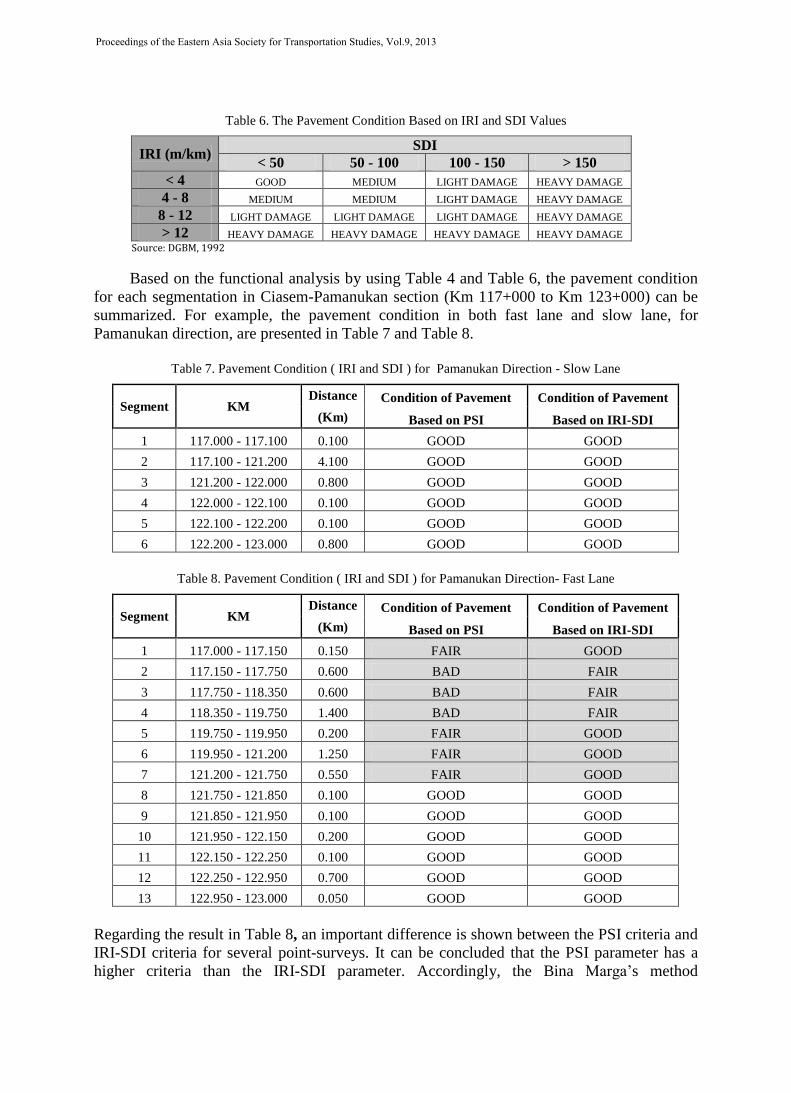
Table 6. The Pavement Condition Based on IRI and SDI Values
IRI (m/km) SDI
< 50 50 - 100 100 - 150 > 150
< 4 GOOD MEDIUM LIGHT DAMAGE HEAVY DAMAGE
4 - 8 MEDIUM MEDIUM LIGHT DAMAGE HEAVY DAMAGE
8 - 12 LIGHT DAMAGE LIGHT DAMAGE LIGHT DAMAGE HEAVY DAMAGE
> 12 HEAVY DAMAGE HEAVY DAMAGE HEAVY DAMAGE HEAVY DAMAGE Source: DGBM, 1992
Based on the functional analysis by using Table 4 and Table 6, the pavement condition
for each segmentation in Ciasem-Pamanukan section (Km 117+000 to Km 123+000) can be
summarized. For example, the pavement condition in both fast lane and slow lane, for
Pamanukan direction, are presented in Table 7 and Table 8.
Table 7. Pavement Condition ( IRI and SDI ) for Pamanukan Direction - Slow Lane
Segment KM Distance Condition of Pavement Condition of Pavement
(Km) Based on PSI Based on IRI-SDI
1 117.000 - 117.100 0.100 GOOD GOOD
2 117.100 - 121.200 4.100 GOOD GOOD
3 121.200 - 122.000 0.800 GOOD GOOD
4 122.000 - 122.100 0.100 GOOD GOOD
5 122.100 - 122.200 0.100 GOOD GOOD
6 122.200 - 123.000 0.800 GOOD GOOD
Table 8. Pavement Condition ( IRI and SDI ) for Pamanukan Direction- Fast Lane
Segment KM Distance Condition of Pavement Condition of Pavement
(Km) Based on PSI Based on IRI-SDI
1 117.000 - 117.150 0.150 FAIR GOOD
2 117.150 - 117.750 0.600 BAD FAIR
3 117.750 - 118.350 0.600 BAD FAIR
4 118.350 - 119.750 1.400 BAD FAIR
5 119.750 - 119.950 0.200 FAIR GOOD
6 119.950 - 121.200 1.250 FAIR GOOD
7 121.200 - 121.750 0.550 FAIR GOOD
8 121.750 - 121.850 0.100 GOOD GOOD
9 121.850 - 121.950 0.100 GOOD GOOD
10 121.950 - 122.150 0.200 GOOD GOOD
11 122.150 - 122.250 0.100 GOOD GOOD
12 122.250 - 122.950 0.700 GOOD GOOD
13 122.950 - 123.000 0.050 GOOD GOOD
Regarding the result in Table 8, an important difference is shown between the PSI criteria and
IRI-SDI criteria for several point-surveys. It can be concluded that the PSI parameter has a
higher criteria than the IRI-SDI parameter. Accordingly, the Bina Marga’s method
Proceedings of the Eastern Asia Society for Transportation Studies, Vol.9, 2013

recommends the treatment action resulting from the combination of the IRI value and SDI
value as shown in Table 9.
Table 9. Treatment Strategy Based on IRI and SDI Values
IRI (m/km) SDI
< 50 50 - 100 100 - 150 > 150
< 4 ROUTINE ROUTINE PERIODIC IMPROVEMENT
4 - 8 ROUTINE ROUTINE PERIODIC IMPROVEMENT
8 - 12 PERIODIC PERIODIC PERIODIC IMPROVEMENT
> 12 IMPROVEMENT IMPROVEMENT IMPROVEMENT IMPROVEMENT Source: DGBM, 1992.
Referring to the results of functional analysis using the IRI and SDI parameters, it is
obtained that the entire segment in Ciasem-Pamanukan section needs only a treatment of
Routine Maintenance.
The street map of pavement condition based on the PSI's parameter and IRI-SDI's
parameter for Ciasem-Pamanukan section is shown in Figure 7 and Figure 8.
Figure 7. The Street Map of Pavement Condition Based on PSI's Parameter
Figure 8.The Street Map of Pavement Condition Based on IRI-SDI's Parameter
Proceedings of the Eastern Asia Society for Transportation Studies, Vol.9, 2013

4.2 Traffic Analysis
The average traffic growth was calculated based on traffic volumes (AADT) from 2008 until
2011 using the Increment Method. This traffic analysis considered the traffic growth for both
light vehicles and heavy vehicles. The light vehicles consist of "category vehicle 2" until
"category vehicle 5A", whereas the heavy vehicles consist of "category vehicle 5B" until
"category vehicle 7C". For example, the result of traffic growth calculation for Pamanukan
direction is presented in Table 10.
Regarding the result of traffic analysis, it was obtained that the percentage of Heavy
Vehicles was very high, that was more than 50% of volume of light vehicles. Apparently,
there was an “extremely high” traffic growth in 2011, especially for Heavy vehicles. The
decision taken to the average 34% of traffic growth in that period can be assumed “sufficient”.
Table 10.Traffic Growth from 2008 to 2011 for Pamanukan Direction
Total Year
AADT (Vehicle/Day)
Annual Traffic
Growth (%) Light
Vehicle
Heavy
Vehicle
Total
Vehicle
Subang –Pamanukan 2008 8,520 4,387 12,907
Ciasem - Pamanukan 2009 11,441 5,477 16,918 31.08
Subang –Pamanukan 2010 8,299 5,053 13,352 -21.08
Ciasem - Pamanukan 2011 12,893 12,878 25,771 93.02
Average( 2008 – 2011 ) 34.34
4.3 Axle Load Analysis
The Truck Factor for vehicle category 2, 3, 4, 5A, 5B, 6A and 7B (see Table 11) were
obtained from WIM Survey at Pamanukan-Eretankulon section, while for vehicle category
6B, 7A and 7C were obtained from WIM Survey at Cirebon-Losari and Cikampek-
Pamanukan sections. The summary of Truck Factor (TF) value for vehicle category 6B, 7A
and 7C are shown in Table 12.
Table 11.The Average Truck Factor for Light vehicles
Vehicle
Category
Axle
Type
Truck Factor
Pamanukan Direction
Truck Factor
Ciasem Direction
2 1.1 0.0021 0.0061
3 1.1 0.0021 0.0061
4 1.1 0.0021 0.0061
5A 1.1 1.1070 1.7800
5B 1.2 3.7417 2.4396
6A 1.1 1.1070 1.7800
7B 1.2 + 2.2 10.3720 15.6257 Source: DGBM,2011
The cumulative ESAL value can be determined by multiplying the AADT value for one-
year with the lane distribution factor and the average Truck Factor (TF) for each vehicle. The
prediction of cumulative ESAL from 2011 to 2014 is calculated using the AASHTO 1993
equation. This value is important in order to obtain the remaining life (RL) and the overlay
thickness of that section.
Proceedings of the Eastern Asia Society for Transportation Studies, Vol.9, 2013

Table 12. The Average Truck Factor for Heavy vehicles
Vehicle
Category
Pamanukan Direction Ciasem Direction
Year 2009 Year 2010 Year 2009 Year 2010
6B 9.59 5.09 6.26 5.40
7A 13.28 16.32 12.60 21.56
7C-1 62.89 26.17 57.62 43.99
7C-2 57.28 42.20 53.59 41.07
7C-3 87.57 91.54 82.98 40.14 Source: DGBM, 2011
The actual Cumulative ESAL from 2008 to 2011 is shown in Table 13, while the
prediction of Cumulative ESAL from 2011 to 2013 can be seen in Table 14.
Table 13.The Actual Cumulative ESAL from 2008 to 2011
Year Pamanukan Direction Ciasem Direction
Fast Lane Slow Lane Fast Lane Slow Lane
2008 9,059,328 6,039,552 7,696,710 5,131,140
2009 12,170,301 8,113,534 8,414,813 5,609,876
2010 13,983,720 9,322,480 8,217,661 5,478,441
2011 18,785,729 12,523,819 8,984,369 5,989,579
Table 14.The Cumulative ESAL predicted from 2011 to 2014
Year Pamanukan Direction Ciasem Direction
Fast Lane Slow Lane Fast Lane Slow Lane
2011 37,765,558 25,177,039 28,234,914 18,823,276
2012 50,734,251 33,822,834 30,869,232 20,579,488
2013 68,156,393 45,437,595 33,749,331 22,495,045
2014 91,561,298 61,040,866 36,898,144 24,589,324
4.4. Structural Analysis Using AASHTO 1993 Method
4.4.1 Calculation of actual cumulative ESAL
The actual cumulative ESAL for Terminate (WT) condition will be computed by using the
AASHTO 1993 equation. However, several requirements are also needed:
- The calculation will refer to the average deflection which was influenced by the value of
relative strength (a1) and layer thickness (D). Moreover, those two variables could affect
the cumulative ESAL value because they create the different Original Structural Number
(SNO) value.
- The value of 2.5 which describes the critical condition for arterial road will be used as P1a
value in Terminate condition (WT).
- The MR value was compared between the MR value obtained from test-pit calibration
result in 2008 and the MR value obtained from FWD’s back-calculation result in 2011. In
Proceedings of the Eastern Asia Society for Transportation Studies, Vol.9, 2013

this case, the MR value from test-pit CBR calibration was chosen because its value was
smaller than the other one.
Figure 9. Segmentation of d1 Deflection for Pamanukan Direction- Fast Lane
The next calculation will refer to the average deflection from the segmentation of FWD
deflection data. For example, the segmentation for Pamanukan direction (fast lane) is shown
in Figure 9, while the actual cumulative ESAL for WT condition is presented in Table 15.
Table 15.Actual Cumulative ESAL for Pamanukan Direction- Fast Lane
Segment KM Distance WT
(km) (ESAL)
1 117.000 – 117.150 0.150 2,260,973
2 117.150 – 117.750 0.600 5,855,831
3 117.750 – 118.350 0.600 1,962,919
4 118.350 – 119.750 1.400 4,495,933
5 119.750 – 119.950 0.200 1,699,116
6 119.950 – 121.200 1.250 6,644,294
7 121.200 – 121.750 0.550 1,922,706
8 121.750 – 121.850 0.100 420,141
9 121.850 – 121.950 0.100 1,068,779
10 121.950 – 122.150 0.200 3,858,894
11 122.150 – 122.250 0.100 420,141
12 122.250 – 122.950 0.700 3,367,152
13 122.950 – 123.000 0.050 1,068,779
4.4.2 Deflection analysis
Referring to Subagio et al. (2011) and the AASHTO-93 method (1993) as shown in Figure 10,
the value of deflection d1 reflects the main condition of pavement layer from surface course to
subgrade layer. Therefore, the segmentation of deflection data will be carried out by
considering the deflection d1 visually. The level of uniformity is highly considered during the
segmentation process, because it can cause an over design calculation for overlay thickness.
The uniformity for each segment shall be less than 30 percent, which indicates that the
uniformity is good enough.
Proceedings of the Eastern Asia Society for Transportation Studies, Vol.9, 2013
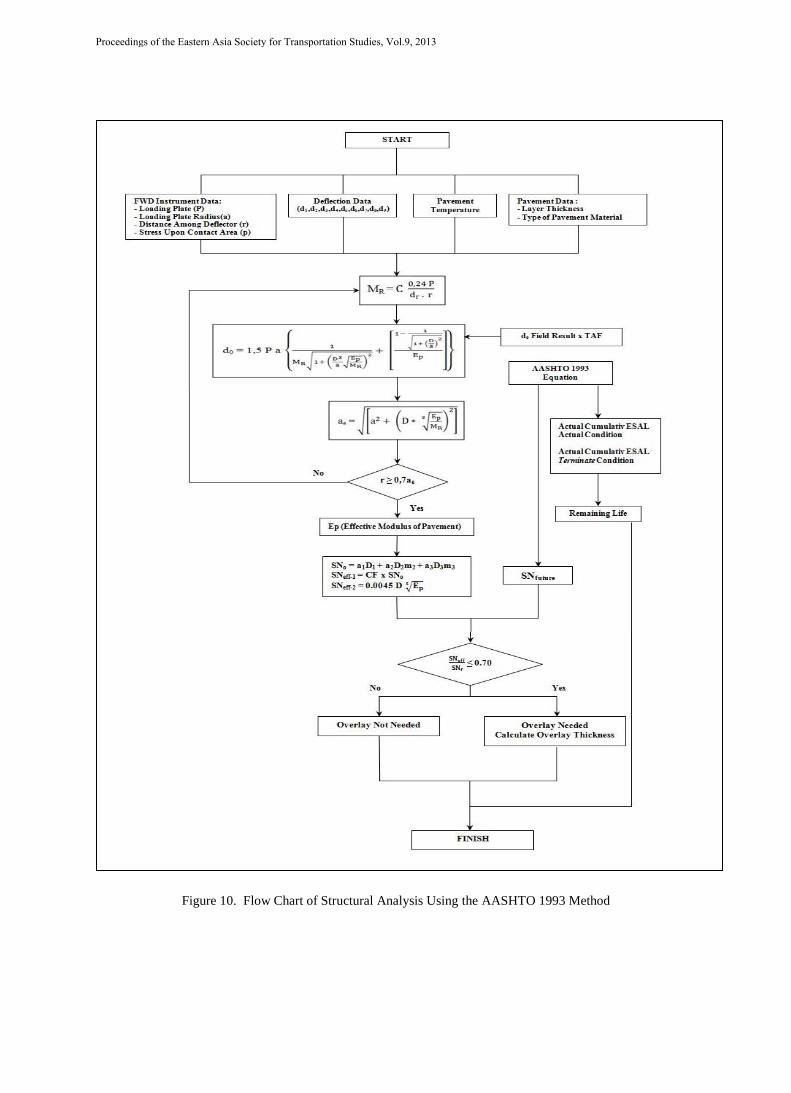
Figure 10. Flow Chart of Structural Analysis Using the AASHTO 1993 Method
Proceedings of the Eastern Asia Society for Transportation Studies, Vol.9, 2013

Figure 11. Remaining Life of Pavement for Pamanukan Direction- Fast Lane
The Remaining Life (RL) of pavement structure is shown in Figure 11 and Figure 12.
There are two types of Remaining Life, which is based on the Actual condition (WA) and
Terminate condition (WT). The difference between their calculations resides in the P1
(terminal condition) value. The Terminate condition used the value of 2.5, while the Actual
condition used the PSI value obtained from functional analysis.
Figure 12. Remaining Life of Pavement for Pamanukan Direction- Slow Lane
Pavement structural capacity consists of SNf (Future Structural Number), SNo (Initial
Structural Number) and SNeff (Effective Structural Number). SNf represents the Structural
capacity based on traffic volume prediction in 2014, while SNo is the Structural capacity based
on the initial pavement condition in 2008, and SNeff is the actual Structural capacity at the
time of analysis in 2011.
The overlay thickness required (Dov) is calculated based on the difference between SNf
and SNeff-min value and the result is divided by the layer coefficient of wearing course (AC-
WC). The overlay thickness was calculated for each survey-point and its result was shown in
Figure 13, while the Street Map obtained from that calculation is presented in Figure 14.
Proceedings of the Eastern Asia Society for Transportation Studies, Vol.9, 2013
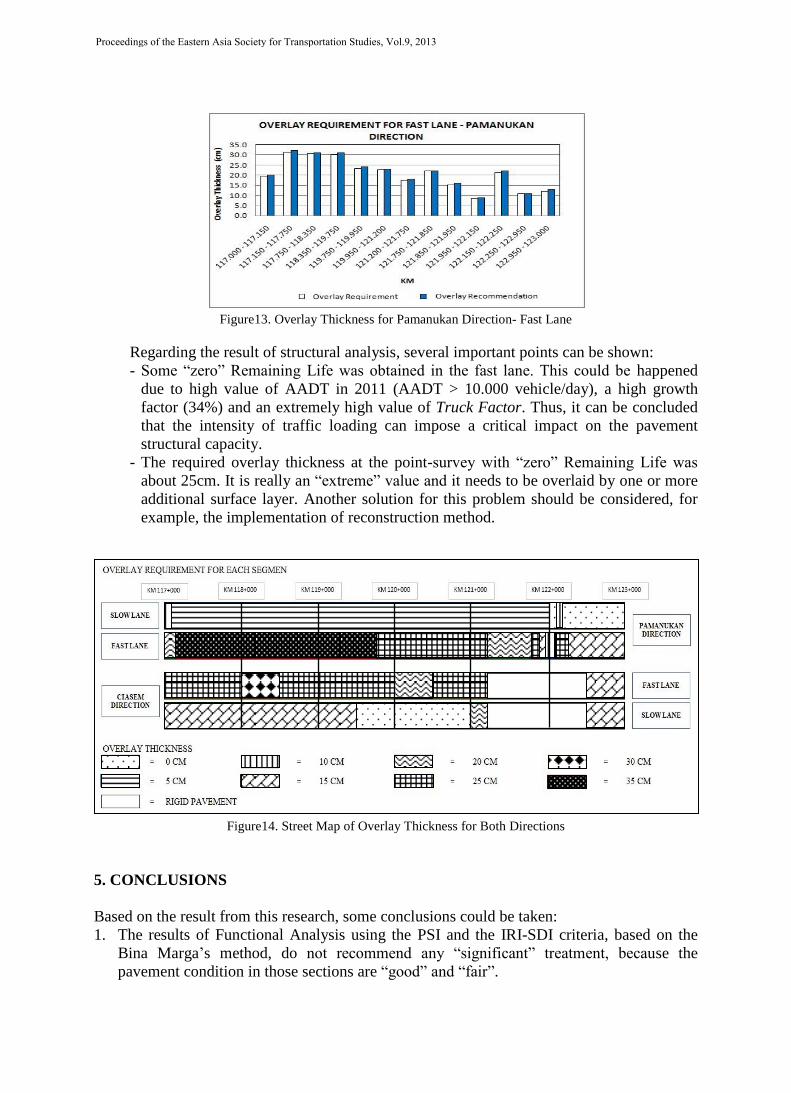
Figure13. Overlay Thickness for Pamanukan Direction- Fast Lane
Regarding the result of structural analysis, several important points can be shown:
- Some “zero” Remaining Life was obtained in the fast lane. This could be happened
due to high value of AADT in 2011 (AADT > 10.000 vehicle/day), a high growth
factor (34%) and an extremely high value of Truck Factor. Thus, it can be concluded
that the intensity of traffic loading can impose a critical impact on the pavement
structural capacity.
- The required overlay thickness at the point-survey with “zero” Remaining Life was
about 25cm. It is really an “extreme” value and it needs to be overlaid by one or more
additional surface layer. Another solution for this problem should be considered, for
example, the implementation of reconstruction method.
Figure14. Street Map of Overlay Thickness for Both Directions
5. CONCLUSIONS
Based on the result from this research, some conclusions could be taken:
1. The results of Functional Analysis using the PSI and the IRI-SDI criteria, based on the
Bina Marga’s method, do not recommend any “significant” treatment, because the
pavement condition in those sections are “good” and “fair”.
Proceedings of the Eastern Asia Society for Transportation Studies, Vol.9, 2013

2. On the contrary, the results of Structural Analysis using FWD’s deflection data and the
AASHTO-93 method confirm that all of the pavement sections were in “fair to weak”
conditions. Some survey-points in those sections have “zero” Remaining Life and those
sections require a “very high” overlay thickness, i.e. more than 25 cm.
3. In general, the analysis of “very heavy” trafficked road, such as : the National road in
North Java corridor (PANTURA), needs a very special method. The implementation of
the Functional analysis (only) cannot show the “real” pavement condition in-situ.
Alternatively, the Structural analysis offers the best and accurate solution.
4. In order to obtain a more accurate result in the Pavement Analysis for the PANTURA
National road, another method could be recommended, such as : the use of EVERSERIES
program (WSDOT,2005) which is based on the Mechanistic method, as presented in
Subagio et al.( 2011 ).
REFERENCES
AASHTO, (1993), AASHTO guide for design of pavement structures, The American
Association of State Highway Transportation Officials, Washington DC.
PUSJATAN, (2009), Final Report on Monitoring and Evaluation of Flexible and Composite
Pavement, Center for Development of Road and Bridge, Ministry of Public Works,
Bandung.
PUSJATAN, (2011), Final Report of Roughness data for Ciasem-Pamanukan Section of
PANTURA, Center for Development of Road and Bridge , Ministry of Public Works,
Bandung.
DGBM, (2005), Guidance of Visual Survey for Flexible Pavement, Directorate General of
Bina Marga (Highways), Ministry of Public Works, Jakarta.
DGBM, (1992), Integrated Road Management System Planning Module, Directorate General
of Bina Marga (Highways), Ministry of Public Works, Jakarta.
DGBM, (2011), Report on Technical Data of Ciasem-Pamanukan Section of PANTURA,
Directorate General of Bina Marga (Highways), Ministry of Public Works, Jakarta.
Sayers, M.W., Gillespie, T.D. & Peterson W.D.O. (1986),’Guidelines for Conducting and
Calibrating Road Roughness Measurements’, Technical Paper 46, Washington DC, The
World Bank.
Subagio, B.S., Wibowo, S.S., Ferdian. T., Sufanir. A.M.S. (2011), Comparison of Overlay
Design Analysis using Mechanistic and Semi-Analytical Methods, case study : Jakarta-
Cikampek Toll Road, Proceedings of 9th
Conference EASTS, Jeju, South Korea.
WSDOT, (2005), EVERSERIES User’s Guide : Pavement Analysis Computer Software and
Case Studies, Washington, USA.
Proceedings of the Eastern Asia Society for Transportation Studies, Vol.9, 2013


![Pavementdesign 141218071414-conversion-gate02[1]](https://img.dokumen.tips/doc/110x75/5a655bf57f8b9a931a8b475f/pavementdesign-141218071414-conversion-gate021.jpg)
