Embed Size (px)
Citation preview

Structural and chemical characterization of
corals grown under present day and naturally
elevated pCO2 conditions in Papua New
Guinea – a window into the future
Nina Rothe (n° 49079)
Dissertation for the Master degree course (M.Sc.) in Marine
Biology
Under the guidance of Prof. Dr. Tomasz Boski and Dr. Gernot Nehrke
September 2015

II
Declaração de autoria de trabalho
Declaro ser a autora deste trabalho, que é original e inédito. Autores e trabalhos consultados
estão devidamente citados no texto e constam da listagem de referências incluída.
Copyright em nome do estudante da Ualg
A Universidade do Algarve tem o direito, perpétuo e sem limites geográficos, de arquivar e
publicitar este trabalho através de exemplares impressos reproduzidos em papel ou de forma
digital, ou por qualquer outro meio conhecido ou que venha a ser inventado, de o divulgar
através de repositórios científicos e de admitir a sua cópia e distribuição com objetivos
educacionais ou de investigação, não comerciais, desde que seja dado crédito ao autor e
editor.
Nina Rothe (n° 49079)
_____________________________________________
III
Acknowledgements
First of all I would like to express my sincerest thanks to Dr. Gernot Nehrke and Prof.
Dr. Tomasz Boski for their time and expertise in supervising my work.
I thank Dr. Gernot Nehrke and Dr. Marlene Wall for providing me with the opportunity
to contribute to their work in the course of this project. I am grateful for having received an
insight into areas of research that are crucial in the process of obtaining further understanding
on how environmental changes will affect coral reefs in the future.
I would like to thank the three of them for their great patience with every of my
questions, their advice and excellent supervision.
A great thank you goes to Volker Simon and Peter Bamfaste from Mettler Toledo for
their help with data evaluation.
Furthermore, I thank Dr. Katharina Fabricius for the provision of data and pictures in
relation to my study.
Lastly I want to thank my family for their continuous support throughout my life and
for their constant encouragement to pursue my goals in science.
IV
Abstract
Ocean acidification terms the process of increased CO2 uptake by surface ocean waters
and a subsequent decrease in pH and carbonate ion concentration. The average pH has
decreased by 0.1 since preindustrial times and is expected to drop by a further 0.3 - 0.4 until
the end of the century if current anthropogenic CO2 emissions persist. This in turn will further
decrease the degree of aragonite saturation in the seawater and affect the thermodynamic
equilibrium of carbonate minerals (aragonite and calcite).
Coral biomineralization is assumed to be strongly sensitive to the degree of saturation
in the surrounding seawater, however marine carbonates are affected differently by ocean
acidification and responses vary among different studies. Coral skeletons are composed of
both inorganic components, usually aragonite, and organic compounds. The exact role of these
organic compounds is still unknown but they are assumed to be involved in the control of
carbonate precipitation. Some studies suggest, that the amount of organic compounds
increases when corals grow under high CO2 and low pH conditions. In this study, the long-term
effects on corals growing under high CO2 conditions at natural CO2 seeps in Papua New Guinea
and under ambient CO2 conditions (control sites) were investigated as a case study and
compared in terms of the amount of organic compounds in their skeletons. Three coral species
were sampled and analyzed: Acropora millepora, Pocillopora damicornis and Seriatopora
hystrix.
Two analytical methods were investigated for their suitability to obtain information on
the amount and type of organic compounds inside coral skeletons and whether any differences
exist in samples collected from sites with ambient CO2 compared to increased CO2 conditions.
Thermogravimetric Analysis (TGA) was used to record weight losses of powdered coral
skeleton to determine the amount of hydrated organic compounds lost during gradual heating.
Confocal Raman microscopy (CRM) mapping was used to investigate the microstructural
arrangement and organic matrix distribution within the coral skeleton. Both analytical
techniques were optimized in this study as no standardized technique was available.
Here we show that four weight losses are recorded by TGA during the gradual heating
of powdered coral skeleton, around 100 °C, 200 °C, 300 °C and 430 °C. The heating rate used

V
during TGA measurements influences the reaction temperature which means that with
increasing heating rate, the reaction is shifted to higher temperatures. We show that the ‘true’
temperature of a reaction can be determined by plotting different heating rates against the
respective reaction temperature obtained by the TGA measurements.
A combination of TGA with IR (infrared spectroscopy) and MS (mass spectrometry)
shows that the highest amount of water in coral skeletons is lost around 300 °C and that CO2
released from the calcium carbonate skeleton is continuously rising with a gradual increase in
temperature, however the release of CO2 peaks at 300 °C and 430 °C which indicates the
release of organic compounds. The amount of organic compounds released during TGA does
not differ for corals grown under high and low CO2 conditions in Papua New Guinea which may
be explained by acclimatization via different processes obviating the necessity to alter the
organic matrix. There are however differences between species comparing the weight losses
of their skeleton during TGA: the weight loss from 30 °C until 550 °C (prior to decomposition)
is highest in P. damicornis samples from both control and seep sites which suggests the highest
amount of organic matrix for this species.
Loss of matter during calcium carbonate decomposition is calculated to be 44% of
weight, however in the coral standard sample used in this study it constitutes less (42.5 –
43.3%). This may be explained by organic compounds which are retained in the skeleton during
heating and are only released during calcium carbonate decomposition. The heating rate used
during TGA was found to additionally influence the amount of weight which is lost during
decomposition, meaning a decreased weight loss with higher heating rates.
CRM did not result in any differences in organic compound distribution or relative
crystallographic orientation for corals from high and low CO2 sites. Raman point measurements
resulted in small signals corresponding to CH-bands and OH-bands which indicate organic
compounds, however no differences were obtained when comparing samples from control
and seep sites or from different coral species.
The results obtained by a combination of TGA and CRM show that aragonite conversion
in biogenic carbonates occurs at lower temperatures than for inorganic aragonite. The coral

VI
standard used in this study transforms into calcite at ~430 °C, the inorganic aragonite only at
~470 °C.
The data presented in this case study propose new approaches using both TGA and
CRM to obtain information on the organic matrix inside coral skeletons. Combining TGA with
IR and MS would additionally allow the investigation of compounds released during TGA and
hence increase the possibility to chemically determine the compounds that are involved in
weight loss during heating. Additional information on the organic matrix could aid in
determining their role in biomineralization and whether differences in the amount exist
between corals grown under different CO2 conditions.

VII
Resumo
A acidificação do Oceano é causada pelo aumento da absorção de CO2 da superficíe da água e
do subsequente decréscimo de pH e da concentração do ião carbonato na água marinha . Em
média, o pH tem decrescido em 0.1 desde os tempos pré-industriais e é esperado que decresça
0.3 – 0.4 unidades até ao final do século se as emissões antropogénicas de CO2 continuarem a
tendência atual. Isto, por sua vez, irá reduzir ainda mais grau de saturação de aragonite das
àguas do mar e afectar o equilíbrio termodinâmico de minerais carbonatados, nomeadamente
calcite e aragonite. A biomineralização de corais é fortemente sensível ao grau de saturação
das àguas do mar circundantes, no entanto os carbonatos marinhos são afectados de uma
forma distinta pela acidificação do Oceano e os efeitos variam conforme os diferentes estudos
efetuados.
Esqueletos coralinos são compostos por componentes inorgânicos, fundamentalmente
aragonite e componentes orgânicos. A função exata destes componentes orgânicos é ainda
pouco conhecida mas supõe-se estarem envolvidos no controlo da precipitação de carbonato
de calcio. Alguns estudos sugerem que o teor de material de orgânicos aumenta quando os
corais crescem em regime de crescente concentração de CO2 e pH em queda. Neste estudo
foram investigados os efeitos, de longo-prazo, no crescimento de corais sujeitos a altas
concentrações de CO2 dissolvido em proximidade das exalações subaquáticas de CO2 no Papua-
Nova Guiné comparados com situação de concentrações normais de CO2 (site de controlo). A
comparação foi feita com base na quantidade de componentes orgânicos nos esqueletos
coralinos. Três espécies de corais foram analisadas: Acropora millepora, Pocillopora damicornis
e Seriatopora hystrix.
Dois métodos analíticos foram utilizados e apreciados em termos da sua adequação
para obter informação sobre a quantidade e tipo de compostos orgânicos contidos nos
esqueletos de corais e para avaliar as diferenças entre amostras colectadas em zonas com CO2
dissolvido “normal”, em comparação com condições de aumento de CO2. A Análise
Termogravimétrica (TGA) foi utilizada para registar as perdas de peso de esqueleto de coral
em pó durante um aquecimento controlado e assim determinar a quantidade de compostos
orgânicos hidratados volatilizados durante este processo. A microscopia confocal Raman

VIII
(MCR) de mapeamento foi utilizada para investigar o arranjo microestrutural e distribuição da
matriz orgânica dentro do esqueleto de coral. Ambas as técnicas de análise foram optimizadas
neste estudo face a ineesistência de procedimentos padronizados.
Demonstrou-se que verificam-se quatro etapas de perdas de peso durante TGA
durante o aquecimento gradual do esqueleto de coral pulverizado. Estes etapas correspondem
a temperaturas de cerca de 100 °C, 200 °C, 300 °C e 430 °C. A taxa de aquecimento utilizada
durante as medições de TGA influencía a temperatura de reacção, no sentido do seu
crescimento em função do aumento da taxa de aquecimento. Foi provado experimentalmente
que a temperatura "verdadeira" de uma reacção pode ser determinada através da
representação gráfica de diferentes taxas de aquecimento contra a respectiva temperatura de
reação obtidas pelas medições de TGA.
A combinação de TGA com IR (espectroscopia de infravermelho) e MS (espectrometria
de massas) mostra que a maior quantidade de água em esqueletos de coral é perdida a cerca
de 300 °C e que o CO2 libertado a partir do esqueleto de carbonato de cálcio é continuamente
crescente, com um aumento gradual da temperatura. No entanto, o pico de emissão de CO2
verifica-se entre 300 °C e 430 °C indicando a principal fase de decaimento de compostos
orgânicos. A quantidade de material orgânico determinado através da análise TGA não diferia
entre os corais que cresceram sujeitos a concetrações altas e baixas de CO2 na Papua-Nova
Guiné, o que pode ser explicado por diferentes processos de adaptação que não se refltiram
na quantidade da matriz orgânica. No entanto, há diferenças entre espécies e a perda de peso
desde 30 °C até 550 °C (antes da decomposição de carbonato de cálcio) é maior em ambas as
amostras de controle e de sítios de exalações de P. damicornis, propondo a maior quantidade
de matriz orgânica para a espécie.
A perda de peso na sequência da termodissociação de carbonato de cálcio
teoricamente calculada como representa 44% do peso incial. No entanto verificou-se que a
amostra padrão de coral utilizado neste estudo produziu uma perda de peso de 42,5 - 43,3%.
Isto pode ser explicado pela presença de compostos orgânicos que são retidos no esqueleto
carbonatado durante o aquecimento e só são libertados durante a decomposição de carbonato
de cálcio. Provou-se que a taxa de aquecimento utilizada durante TGA influenciava

IX
adicionalalmente o resultado final da perda de peso ocorrida durante a decomposição,
mostrando uma diminuição em funão do aumento das taxas de aquecimento.
A microscopia confocal de Raman não detectou quaisquer diferenças na distribuição
de material orgânico ou orientação cristalográfica preferencial relativamente a corais de locais
de alto e baixo teor de CO2. Varreduras individuais de Raman resultaram em pequenos sinais
correspondentes a bandas CH e banda OH produzidas por compostos orgânicos, porém
nenhuma diferença foi observada ao se comparar amostras de controle com as dos sítios de
exalações ou a entre diferentes espécies de corais.
Os resultados obtidos pela combinação de TGA e MCR mostram que a conversão de
aragonite em calcite ocorre a temperaturas mais baixas do que para aragonite de origem
inorgânica (sintética). O coral padrão utilizado neste estudo transformou-se em calcite em
temperatura de 430 °C, enquanto a aragonite inorgânica sofreu a transformação a 470 °C.
Os dados apresentados neste estudo indicam novas possíveis abordagens das questões
acima referidas por meio TGA e MCR para obter informações acerca da matriz orgânica dentro
de esqueletos de corais. A combinação de TGA com IR e MS poderá permitir adicionalmente a
análise de compostos libertados durante a TGA e, consequentemente, aumentar a
possibilidade de determinar os compostos que estão envolvidos na perda de peso durante o
aquecimento. Informação adicional sobre a matriz orgânica pode ajudar a determinar o seu
papel na biomineralização e sobre a existência de diferenças na quantidade desta matriz em
corais que crescem sob diferentes condições, em termos da concentração de CO2 dissolvido
na água.
Keywords
Scleractinian Corals, Ocean Acidification, Skeletal Organic Matrix, Thermogravimetric Analysis,
Confocal Raman Microscopy

X
Contents
Abstract ................................................................................................................................. IV
Resumo ............................................................................................................................... VII
Keywords ............................................................................................................................... IX
1 Introduction ......................................................................................................... 1
1.1 Ocean acidification .................................................................................................. 1
1.2 Coral biomineralization ........................................................................................... 4
1.3 Analytical methods for the determination of organic compounds in coral
skeletons .................................................................................................................. 6
1.4 Aim of the study .................................................................................................... 11
2 Materials and Methods ...................................................................................... 12
2.1 Thermogravimetric Analysis ................................................................................. 12
2.2 Confocal Raman Microscopy ................................................................................ 13
2.3 Study site ............................................................................................................... 13
2.4 Coral genera used for analysis .............................................................................. 16
2.5 Sampling and preparation .................................................................................... 17
2.5.1 Sample preparation for TGA and CRM ................................................................. 18
2.6 Statistical Analysis ................................................................................................. 18
3 Results and Discussion ....................................................................................... 19
3.1 Thermogravimetric Analysis ................................................................................. 19
3.1.1 Organic compounds in coral samples from Papua New Guinea ......................... 29
3.1.2 Loss of organic matter during decomposition of CaCO3 ..................................... 36
3.2 Confocal Raman Microscopy ................................................................................ 40
3.3 Aragonite conversion ............................................................................................ 45
4 Conclusion ......................................................................................................... 54

XI
References ............................................................................................................................ 55
Appendix ............................................................................................................................... 60
List of Figures........................................................................................................................ 66
List of Tables ......................................................................................................................... 69
Introduction
1
1 Introduction
1.1 Ocean acidification
Since 250 years, carbon dioxide (CO2) levels in the atmosphere have increased by almost
40% from 280 ppmv (parts per million volume) to approximately 400 ppmv (Mauna Loa
Observatory, July 2015). This excess of atmospheric CO2 is mostly driven by anthropogenic
emissions such as fossil fuel combustion or deforestation and causes a shift in seawater
carbonate chemistry (Doney et al., 2009). Ocean surface waters constitute a large reservoir
that equilibrates with the atmosphere in terms of CO2 concentration. The dissolved CO2 reacts
with water (H2O) to carbonic acid (H2CO3) according to the following reaction.
CO2 (atmos) ↔ CO2(aq) + H2O ↔ H2CO3 ↔ H+ + HCO3− ↔ 2H+ + CO3
2−
H2CO3 in turn dissociates either into bicarbonate (HCO3-) by losing one hydrogen ion (H+) or
into carbonate ion (CO32-) by losing two H+. With an increase in CO2 uptake by surface ocean
waters, HCO3- and H+ increase as well. The increase in hydrogen ions lowers the pH and
additionally decreases carbonate ion concentration and calcium carbonate (CaCO3) saturation
states (Bernstein et al., 2007; Doney et al., 2009; Feely et al., 2004; Orr et al., 2005). These
processes are commonly referred to as ocean acidification.
Since preindustrial times, the average pH of surface ocean water has decreased by
about 0.1 from 8.21 to 8.10 and is expected to drop by a further 0.3-0.4 units until the end of
this century if anthropogenic CO2 emissions continue the present trend (Orr et al., 2005; Royal
Society, 2005). As a consequence CO32- concentrations in tropical oceans are expected to drop
by 35-50% by 2100 (Orr et al., 2005).
The degree of saturation (Ω) of marine waters with respect to a mineral substance
describes its thermodynamic potential for crystallization or dissolution and for CaCO3 is defined
by the product of Ca2+ and CO32- ion activities, divided by their solubility constant at equilibrium
(Ksp).

Introduction
2
Ω =[Ca2+] [CO3
2−]
Ksp
After the introduction of corrections for activity coefficients and ion pairing, the
theoretical value of Ω in warm surface waters is ~ 3. It is largely dependent on increasing CO2
uptake by the surface ocean water which decreases Ω (Doney et al., 2009) and affects the
thermodynamic equilibrium of carbonate minerals. Some studies suggest that the formation
of shells and skeletons depends on the degree of saturation of the seawater with the respective
CaCO3 polymorph (aragonite or calcite). Shell and skeleton formation may occur when Ω > 1
and hence, the ability of marine calcifiers to precipitate their shells could be affected in the
future.
Scleractinian corals are reef-building corals which thrive best in clear tropical oceans
owing to their symbiotic relationship with photosynthetic zooxanthellae. Their exoskeleton is
mainly composed of aragonite, which is secreted by the coral polyps (Allemand et al., 2004;
Cohen et al., 2009; Tambutté et al., 2011). The aragonite saturation degree (Ωaragonite) in
surface ocean waters is expected to decrease throughout the tropics, from a present 3-5 to 2-
2.5 in the course of this century and is expected to affect coral reefs (Orr et al., 2005).
Biological responses to ocean acidification
Some studies suggest that the growth of marine calcifying organisms like corals
depends on the degree of saturation in respect to aragonite in the surrounding seawater and
coral reefs have been found to be dramatically impacted by increasing CO2 concentrations in
the ocean by several studied (Gattuso et al., 1998; Langdon et al., 2000; Marubini and Atkinson,
1999; Marubini and Davies, 1996). Coral reefs are one of the most biologically diverse and
ecologically complex ecosystem in the ocean and characterized by high primary productivity
(Allemand et al., 2011)
The impact of decreasing CO32- concentrations in the surrounding seawater on the
calcification rates of tropical corals does not draw a uniform picture. Some studies report no
change in calcification (Schoepf et al., 2013), others even a parabolic behavior (Castillo et al.,

Introduction
3
2014) for different coral species. In most cases however, calcification rates show a roughly
linear decline with decreasing CO32- concentrations under controlled experimental conditions
(e.g. Langdon and Atkinson, 2005). Biomineralization is significantly slower at pH levels of 7.8
which matches the projected levels of ocean acidification for the end of the century (Langdon
and Atkinson, 2005). As an example, calcification for corals of the Great Barrier Reef have
declined by 11.4% between the years 1999 and 2005 which suggests a rather dark future for
corals due to climate change (De’ath et al., 2013). However, calcification responses to a
changing environment are of complicated nature and may be due to changes in CO2
concentration and pH combined with other factors like light, temperature or nutrient
availability (Schiermeier, 2011). As an example, corals seem to become less sensitive to
decreases in Ωaragonite when nutrients are available in increased concentrations (Atkinson and
Cuet, 2008).
Calcification changes in laboratory studies can be directly attributed to the altered
variable, e.g. CO2 concentration, however they do not take into account these co-limiting
factors which are difficult to simulate ex situ (Atkinson and Cuet, 2008; Langdon and Atkinson,
2005). Additionally, short-term laboratory studies are not performed for long enough time
scales to allow organism acclimatization to occur. An opportunity to investigate long-term
effects of ocean acidification on coral reefs is given by submarine cool CO2 seep sites. Coral
reefs at these sites are acclimatized to prevailing conditions and provide information on natural
exposure to low pH and high CO2 seawater environments (Fabricius et al., 2011). Whether
marine organisms are able to adapt to increasing CO2 conditions is not well known but may
provide important implications for ocean acidification scenarios and should be of high priority
for future research (Doney et al., 2009).
Several studies reveal the complicated nature of calcification responses and their
dependency on different factors and the degree of severity in terms of reduced calcification
rates varies among species (e.g. Doney et al., 2009; Langdon and Atkinson, 2005). In order to
be able to predict future effects of ocean acidification and climate change on coral reefs,
sufficient understanding of calcification mechanisms in corals is crucial. Currently, various
assumptions on how coral biomineralization is controlled exist and the exact understanding of

Introduction
4
calcium carbonate calcification may help in explaining species specific differences and
acclimatization mechanisms.
1.2 Coral biomineralization
The study of the formation, structure and properties of inorganic solids deposited in
biological systems is termed biomineralization (Lowenstam and Weiner, 1989; Mann, 2001).
Coral biomineralization is assumed to be an extracellular process which occurs in a so called
calcifying compartment which is located between the tissue base and the existing skeleton
(Cohen et al., 2009). The aragonite saturation degree inside the calcifying compartment is
assumed to be high above the saturation degree of seawater, which enhances aragonite
precipitation and crystal growth. One proposed mechanism for this process is by Ca2+ - H+
exchange, meaning that H+ is pumped out of the calcifying space when Ca2+ is transported into
the calcifying compartment, thus elevating the degree of saturation and pH and in turn CO32-
concentrations (Cohen et al., 2009). Other models consider a passive processes (e.g. Cohen
and McConnaughey, 2003). Despite elevated carbonate ion concentrations in the calcifying
region, coral calcification is suggested to be strongly sensitive to small changes in the degree
of saturation in the surrounding seawater (Langdon et al., 2000).
It has been recognized that coral skeletons are constituted of both inorganic components
(in this case aragonite) and organic compounds (Falini et al., 2013; Tambutté et al., 2011;
Wilfert and Peters, 1969; Young, 1971), however the level of control these compounds exert
over coral calcification is still unclear (Holcomb et al., 2009). The organic matrix of coral
skeletons is characterized by high concentrations of amino acids and has been assumed to play
an important role in biomineralization (Constantz and Weiner, 1988; Goffredo et al., 2011;
Mitterer, 1978).
Recent studies demonstrate, that organic compounds derived from coral skeletons can
influence the polymorphism and morphology of calcium carbonate in precipitation
experiments (Falini et al., 2013; Goffredo et al., 2011). Even though the exact role of organic
compounds in coral skeletons stays enigmatic, they potentially play an important role in coral
biomineralization processes. A few studies so far addressed the organic matrix composition

Introduction
5
and function in coral skeletons. For instance, it was indicated that the amount of organic matrix
differs between coral species (Cuif et al., 2004) and emphasizes that specific types of organic
compounds can be involved in the control of calcium carbonate precipitation (Falini et al.,
2013). It is important to obtain further information on organic compounds of different species
in order to explore their role in coral biomineralization. Recent studies suggest that under
increased pCO2 conditions corals upregulate genes which code for protein production (Vidal-
Dupiol et al., 2013) and it was observed that the skeletal protein content increased (Tambutté
et al., 2015). Detailed understanding on how corals react to projected future changes in pCO2
derives mainly from controlled laboratory studies (e.g. Atkinson and Cuet, 2008; Gattuso et al.,
1998; Langdon and Atkinson, 2005; Marubini and Atkinson, 1999) and the few sites where
pCO2 is increased naturally (Barkley et al., 2015; Crook et al., 2013; Fabricius et al., 2011). The
CO2 seeps in Papua New Guinea are ideal to investigate coral response to increased pCO2 in
their natural environment with a focus on skeletal organic content. The high CO2 seepage sites
are characterized by a shift in coral communities which indicates that species are differentially
sensitive to changes in pCO2 (Fabricius et al., 2011; Strahl et al., 2015). Hence, species growing
under low pH conditions seem to be able to deal with this limiting conditions via different
trajectories:
a) they are acclimated and maintain growth, skeletal structure and composition
b) they are able to compensate the limiting conditions, but with associated costs in terms
of reduced growth and/or structural changes, or
c) they cannot compensate changing conditions, resulting in a decline of growth and
structural integrity.
One potential compensation mechanism could be seen in an increase in organic skeletal
proteins (Tambutté et al., 2015; Vidal-Dupiol et al., 2013).

Introduction
6
1.3 Analytical methods for the determination of organic compounds
in coral skeletons
Thermogravimetric analysis (TGA)
TGA is an analytical technique where the weight loss of a sample is analyzed as a
function of temperature (and time). The results usually display a curve where the sample mass
(in [mg] or [%]) is plotted against temperature (or time). Figure 1.3.1 shows the schematic of a
Mettler Toledo TGA/DSC 1 instrument which was used in this study.
Figure 1.3.1 Schematic of a Thermogravimetric Analyzer (Mettler Toledo TGA/DCS 1): (1) baffle; (2) reactive gas capillary; (3) gas outlet; (4) temperature sensors; (5) furnace heater; (6) furnace temperature sensor; (7) adjustment ring weights; (8) protective and purge gas connector; (9) thermostated balance chamber (from Mettler Toledo)
Weight losses during chemical reactions are recorded by a horizontal compensation
ultra-microbalance with a resolution of 0.1 µg. Temperature sensors (4) are directly placed
under the balance arm to determine the exact temperature of the sample. A crucible
containing the sample is placed on the right side of the balancing arm and a reference, usually
an empty crucible of the same kind, on the left side, to be able to deduce only the behavior of
the sample, not the crucible it is contained in. An inert, dry protective gas (usually N2) flows

Introduction
7
over the balance to prevent corrosion. The reactive gas capillary (2) is placed directly above
the balance arm so the purge gas flows directly over the sample into the furnace chamber.
To correct for buoyancy effects due to density changes in the sample that may occur
during heating, blank measurements are performed using the same temperature program,
reactive gas and a crucible without a sample. The resulting blank curve can be automatically
subtracted from the sample measurement curve. Mass changes occur due to thermal
dissociation of minerals or the thermal decomposition of organic compounds which is termed
pyrolysis (Wagner, 2009).
A combination of TGA with Differential Scanning Calorimetry (DSC) allows to
additionally measure the heat flow (in [W g-1]) which occurs in the sample during heating.
Endothermic and exothermic reactions in the sample are recorded by a measuring cell with
ceramic sensors and negative or positive peaks are displayed in the DSC curve respectively. The
DSC signal gives the heat flow in the sample which corresponds to the difference between the
heat flow of the sample and the reference (Wagner, 2009). DSC signals enable the calculation
of transition or reaction enthalpies due to the measurement of peak areas and the
determination of the specific heat capacity of a sample.
DSC signals help in referring mass losses to specific reactions as they give additional
information on the behavior of the sample. Also, reactions that are not accompanied by a
change in mass can be detected via heat flow profiles, an example being solid-solid transitions
or polymorphisms. Aragonite as a metastable form of calcium carbonate is transformed into
calcite upon heating (e.g. Brown et al., 1962) which represents a solid-solid transition. No loss
in mass is detected during the transition, however the endothermic reaction is detectable in
the heat flow profile.
Figure 1.3.2 shows an example of a typical TGA and DSC profile of powdered coral skeleton.

Introduction
8
Figure 1.3.2 Example of a TGA weight loss profile (dark blue) and a DSC heat flow profile (light blue) from powdered coral skeleton (30 °C to 550 °C, heating rate: 10 °C min-1; gas flow: 20mL N2 min-1)
Figure 1.3.2 shows the change of the sample weight [%] (dark blue curve) and the heat
flow [W g-1] (light blue curve) in function of temperature. The weight loss profile shows several
significant mass changes with the most prominent one occurring around 300 °C accompanied
by a distinct endothermic peak in the heat flow profile. A reaction resulting in loss of mass is
endothermic which is indicated by the negative peak in the DSC curve. Using both TGA and DSC
signals of a sample during heating, the type of reaction occurring at a specific time or
temperature can be deduced.
Factors that may alter the resulting TGA and DSC curves that have to be considered are
for example heating rate, sample preparation, sample morphology, composition of the
atmosphere within the reaction chamber and the type of crucible. The morphology, shape and
size of a sample influences its heat transfer and these characteristics have to be considered
and kept equal throughout measurements to ensure the comparability of results. Usually,
samples are ground into fine powders with similar grain size. The temperature region in which
chemical reactions in the sample occur depends on the heating rate. Higher heating rates cause
a shift to higher temperatures. If unsuitable heating rates are used, usually fast heating rates,
two reactions may overlap and therefore be missed in the TGA and DSC signal (Wagner, 2009).
Sample crucibles have to be open to the gas atmosphere to enable the exchange of
material with immediate surroundings and the release of gaseous compounds. The choice of

Introduction
9
the crucible depends on the respective temperature program and purpose of TGA
measurements. Aluminum oxide crucibles have the advantage that they can be heated up to
1600 °C, in contrast to aluminum crucibles which will melt around 660 °C. However, aluminum
crucibles can be hermetically sealed before measurements to prevent the sample from
drawing water or reacting with air which is not possible for aluminum oxide crucibles. The
sealed crucible is perforated by a needle when it is placed on the sensor by an automatic
sample changer to allow volatile substances to be released during measurements. The reaction
atmosphere is determined by the mixture of protective gas and purge gas in the furnace
chamber. The purge gas flows through the furnace chamber and removes gaseous reaction
products through the gas outlet (Figure 1.3.1 (3)). The type of purge gas and the flow rate
influence TGA and DSC signals and have to be kept constant throughout experiments to be
able to compare results.
TGA is used as a method to determine the amount of organic compounds inside coral
skeletons (Cuif et al., 2004). A further technique to obtain information on amount and also
type of organic compounds is Confocal Raman Microscopy.
Confocal Raman Microscopy
Confocal Raman Microscopy (CRM) is a widely used technique in studies of biomineral
samples (Nehrke and Nouet, 2011; Wall and Nehrke, 2012). Raman spectroscopy allows the
identification and characterization of many mineral and non-mineral compounds. It is based
on the interaction of monochromatic light with molecules and Raman signals result from
inelastic light scattering of photons due to molecular vibrations (Nehrke and Nouet, 2011).
Figure 1.3.3 shows the schematic of a confocal Raman microscope.
Introduction
10
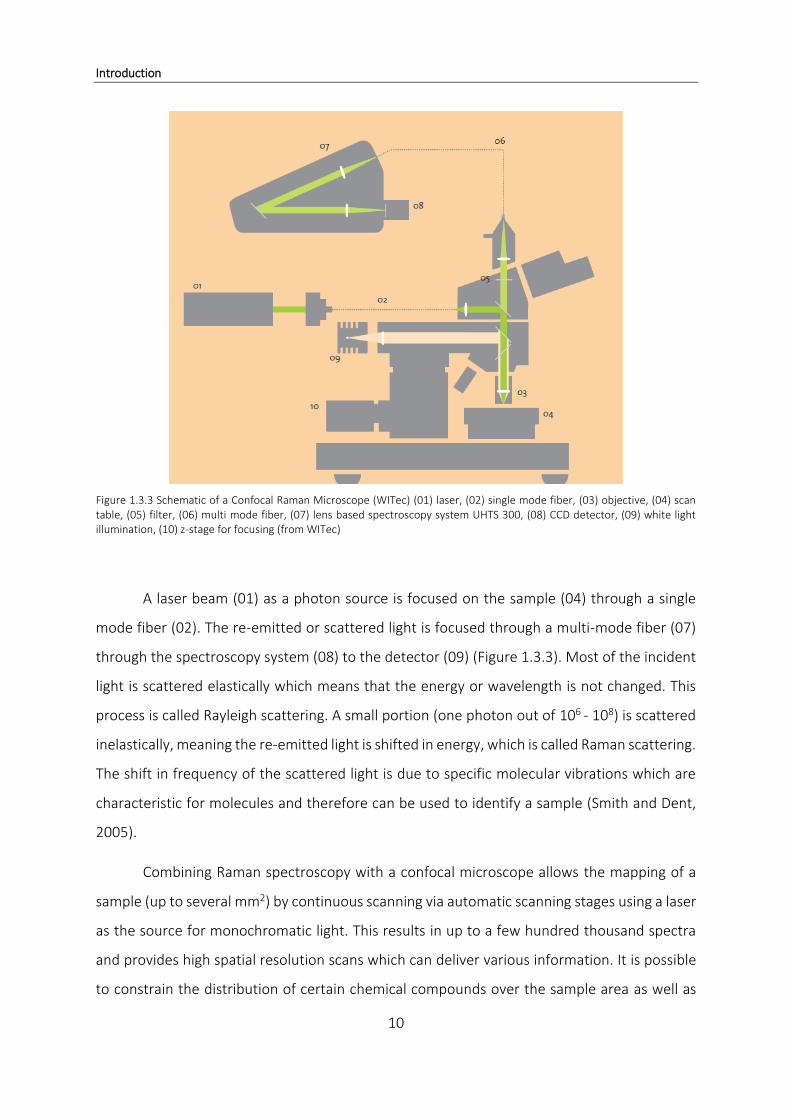
Figure 1.3.3 Schematic of a Confocal Raman Microscope (WITec) (01) laser, (02) single mode fiber, (03) objective, (04) scan table, (05) filter, (06) multi mode fiber, (07) lens based spectroscopy system UHTS 300, (08) CCD detector, (09) white light illumination, (10) z-stage for focusing (from WITec)
A laser beam (01) as a photon source is focused on the sample (04) through a single
mode fiber (02). The re-emitted or scattered light is focused through a multi-mode fiber (07)
through the spectroscopy system (08) to the detector (09) (Figure 1.3.3). Most of the incident
light is scattered elastically which means that the energy or wavelength is not changed. This
process is called Rayleigh scattering. A small portion (one photon out of 106 - 108) is scattered
inelastically, meaning the re-emitted light is shifted in energy, which is called Raman scattering.
The shift in frequency of the scattered light is due to specific molecular vibrations which are
characteristic for molecules and therefore can be used to identify a sample (Smith and Dent,
2005).
Combining Raman spectroscopy with a confocal microscope allows the mapping of a
sample (up to several mm2) by continuous scanning via automatic scanning stages using a laser
as the source for monochromatic light. This results in up to a few hundred thousand spectra
and provides high spatial resolution scans which can deliver various information. It is possible
to constrain the distribution of certain chemical compounds over the sample area as well as

Introduction
11
crystallinity and relative crystal orientation of mineral compounds which is why CRM is a very
suited method to study biogenic structures (Nehrke and Nouet, 2011). CRM is a non-invasive
method which makes it additionally attractive, especially for the study of biological samples
and heterogeneous systems (Everall, 2004). In coral skeletal samples, CRM allows to determine
the biochemical composition of mineral materials like aragonite and organic compounds that
are entrapped within the skeletal matrix and performing large area scans provides maps of
their distribution throughout the skeleton on a micrometer scale (Everall, 2004; Nehrke and
Nouet, 2011; Wall and Nehrke, 2012).
In this study, CRM was used to investigate for differences in organic compounds of corals
grown under ambient and high CO2 conditions as well as to determine the mineral part of their
skeleton.
1.4 Aim of the study
The aim of this study was to determine structural and compositional differences in coral
skeletons grown under different pCO2 conditions, focusing on the amount and type of organic
matter contained in the skeleton. Both CRM and TGA were investigated for their suitability to
answer such questions. Both analytical techniques were optimized in this study since no
standardized technique is available for either method.
As a case study, three scleractinian coral species growing under both ambient and
increased CO2 concentration were investigated: Acropora millepora, Pocillopora damicornis
and Seriatopora hystrix. The cool CO2 seeps at Upa-Upasina Reef (Papua New Guinea) provide
a natural laboratory and the opportunity to investigate changes in coral skeletons after long-
term acclimation since the vents already existed for decades (Fabricius et al., 2011). Low pH
values (~7.8) near the seep sites are similar to pH conditions expected for the year 2100
(Haugan and Drange, 1996), thus observed differences in corals growing there may help
predict alterations due to pH and CO2 changes associated with ocean acidification. Assuming
that organic compounds in coral skeletons facilitate calcification at low saturation states and
generally act as a catalyzer for aragonite precipitation (Mann, 2001), an increase in the amount
of organic compounds in skeletons of corals growing under high CO2 conditions can be

Materials and Methods
12
assumed. By comparing different species of scleractinian corals from the same sample location,
interspecies differences in their response to ocean acidification can be examined.
2 Materials and Methods
2.1 Thermogravimetric Analysis
Thermogravimetric analysis (TGA) was performed with a TGA/DSC 1 instrument
equipped with a sample changer (Mettler Toledo, Germany). Powdered samples of
approximately 15 mg (+/- 0.05 mg) were gradually heated from 30 °C to 550 °C or 900 °C
depending on the experiment and desired information. Aluminum crucibles (100 µL) were used
for all measurements up to 550 °C. Samples were weighed into the crucibles and hermetically
sealed (cold-welded) with a perforable aluminum lid directly after grinding. A hole (0.7 mm in
diameter) was pierced into the lid with a needle by the sample changer right before
measurements. Samples subjected to higher temperatures were weighed into aluminum oxide
crucibles (70 µL) which cannot be hermetically sealed. The coral powder was weighed into the
crucibles shortly before measurements and a lid with a pre-punched hole was placed on top.
Three replicates were measured for each sample unless indicated otherwise.
Variable heating rates were used to test for their influence on the analysis. Both heating
rate, purge gas and respective flow rate were adjusted for each analysis to fit the respective
experimental purpose. An in-house coral standard powder (ST-1) made from bleached
Pocillopora sp. skeleton was used for all experiments with the purpose of method
standardization. Measurements with various heating rates were performed using this ST-1
powder to ensure that no reaction remained undetected during TGA and to obtain further
information on how reactions in coral samples depend on the heating rate.
For samples from Papua New Guinea, 10 ° min-1 was chosen as a heating rate and applied
to all samples. Nitrogen (N2) as an inert gas was generally used as a protective gas at a flow
rate of 20 mL min-1. The quantification of the weight loss in samples from Papua New Guinea
due to the release of organic compounds follows the example given in Figure 3.1.2. TGA weight
Materials and Methods
13
loss profiles and DSC heat flow profiles are given after normalization to sample weight. The
software STARe Excellence Version 11 (Mettler Toledo) was used for all measurements and
evaluations.
2.2 Confocal Raman Microscopy
In this study a WITec alpha 300R Confocal Raman Microscope (WITec GmbH, Germany)
was used for analysis. High resolution spatial scans were performed with a piezoelectric
scanner table with a maximum scan range of 200 µm x 200 µm (minimum step size lateral: 4
nm; vertical: 0.5 nm). Large area scans were performed by a motorized scan table with a
maximum range of 2.5 cm x 2.5 cm and a minimum step size of 100 nm. A laser with an
excitation wavelength of 488 nm was used for all scans performed in this study as well as an
ultra-high throughput spectrometer (UHTS 300, WITec GmbH, Germany) with an EMCCD
camera and a grating of 600 grooves mm-1 blazed at 500 nm. The spectral range was 0-3600
cm-1. Large Area scans were performed using a Nikon 50x objective (NA=0.6), 0.5 µm spacing
and an integration time of ~30 ms.
Raman point measurements were obtained using a Nikon 100x objective (NA=0.9) with
10 accumulations per spectrum and an integration time of 0.5 seconds. The grating was
changed to one with 2400 grooves mm-1 blazed at 500 nm to obtain a high spectral resolution
to follow changes in peak position during the aragonite to calcite transformation (see 3.3).
2.3 Study site
This study was conducted using coral samples collected at a volcanic CO2 seep site at
Upa-Upasina Reef, a clear-water coral reef at northwestern Normanby Island, Milne Bay
Province in Papua New Guinea (Figure 2.3.1). Along the slope of the reef numerous CO2 bubble
streams emerge over a wide area, down to a depth of 5 m. These CO2 have been confirmed to
exist since at least ~ 70 years ago (Fabricius et al., 2011). Samples of three coral species were
collected from both CO2 seep sites and sites with ambient CO2 concentrations. At the CO2 seep
sites collection was limited to areas characterized by a pH of ~7.8 as projected for the end of
the century. These samples are referred to as taken from seep sites. The pH at sites with

Materials and Methods
14
ambient CO2 is ~8.1 and samples are referred to as taken from control sites. The control site
with ambient pH and CO2 concentration is located about 500m from the seep site.
Figure 2.3.1 Maps of Papua New Guinea showing Milne Bay Province and the location of the study site (Upa-Upasina reef) (Fabricius et al., 2011)
Figure 2.3.2 shows seascapes and location of the different sampling sites along the reef.
High CO2 sites are characterized by gas streams composed to >99% of CO2, additionally 0.5%
O2, 0.1% N2 and 87ppm CH4 (Fabricius et al., 2011).

Materials and Methods
15
Figure 2.3.2 Volcanic CO2 seeps at Upa-Upasina Reef, Milne Bay. Picture a-c show seascapes of the different sampling sites along the reef: (a) control site (pH: ~ 8.1), (b) and (c) seep sites (pH: ~ 7.8). The map (bottom right) shows pH levels along the Upa-Upasina reef by color and the approximate sampling locations are indicated by letters a-c. (from Fabricius et al., 2011).
The distribution of seawater pH along the Upa-Upasina reef is depicted in the lower right
picture (Figure 2.3.2). Picture (a) shows a typical seascape at control sites and pictures (b) and
(c) show the bubble streams emerging along seep sites. The seawater parameters at both
control and seep sites are given in Table 2.3.1 and Table 2.3.2 (Fabricius et al., 2011).
Table 2.3.1 Seawater parameters (medians) at study site (Upa-Upasina Reef) (from Fabricius et al., 2011)
Exposure Temperature
[°C] Salinity [PSU] pH CO3 [µmol 1] pCO2 [ppm] Ωaragonite
Control 27.7 34.5 8.01 212.5 419 3.48
Seep 27.6 34.5 7.77 139.3 502 2.28

Materials and Methods
16
Temperature and salinity are similar between control and seep sites but CO2 concentration,
aragonite saturation and pH differ. The median pH at seep sites is 7.77 and the median at
control sites is 8.01. (average: 7.8 and 8.1 respectively). Aragonite saturation is significantly
decreased at seep sites with Ωaragonite 2.28 instead of 3.48.
Table 2.3.2 Seawater parameters (medians): elemental concentration at study site (Upa-Upasina Reef) (from Fabricius et al., 2011)
Exposure Ca2+[mg L-1] Ba [mg L-1] Cl [mg L-1] K [mg L-1] Mg [mg L-1] Na [mg L-1] S [mg L-1] Sr [mg L-1]
Control 421 0.002 22428 365.0 1366 10151 901.0 8.58
Seep 421 0.001 21702 364.8 1364 10151 899.4 8.60
Elemental concentrations are relatively comparable between both seep and control sites
(Table 2.3.2).
With increasing distance to the CO2 vents, pH gradually rises as well as the number of
coral genera characterized by high structural complexity. However, overall coral cover remains
constant between control and seep site.
2.4 Coral genera used for analysis
Corals are marine invertebrates of the class Anthozoa. They typically occur in colonies
consisting of genetically identical polyps. Scleractinian corals, also called stony corals, form a
complex exoskeleton made of solid calcium carbonate and belong to the subclass of
Hexacorallina (Daly et al., 2003). They are hermatypic corals meaning their colonies in high
quantities make up coral reefs. They mostly thrive in clear tropical oceans and live in symbiosis
with zooxanthellae, photosynthetic microalgae that provide the coral with energy.
The scleractinian coral species used in this study are Pocillopora damicornis, Acropora
millepora and Seriatopora hystrix (Figure 2.4.1).

Materials and Methods
17
Figure 2.4.1 Coral species used in study
Pocillopora damicornis is characterized by an aragonite skeleton with low porosity and
belongs to the phylogenic clade of ‘robust’ corals (Romano and Cairns, 2000). It is widely
distributed in the Indo-Pacific Ocean and can have colorations including greenish, pale brown
and pink.
Acropora millepora belongs to the ‘complex’ clade of corals with a less heavily calcified
skeleton and rather porous corallite walls (Romano and Cairns, 2000). Its skeleton is comprised
of aragonite (Clode et al., 2011; Ramos-Silva et al., 2014). A. millepora is a widely used model
organism for biomineralization studies and its settlement, development and calcification have
been widely studied (Ramos-Silva et al., 2014). It occurs in different colorations from green and
orange to pinkish and blue.
Seriatopora hystrix also belongs to the clade of ‘complex’ corals with very thin branches
and needle-like appearance. Its coloration ranges from pink and blue to green or a common
cream color.
2.5 Sampling and preparation
Coral samples were collected alive at a depth of 3-5 m by means of SCUBA diving.
Branches were clipped off, subsequently dried and stored until further use.
Materials and Methods
18
2.5.1 Sample preparation for TGA and CRM
To remove coral tissue from the skeletons, all specimens of the three species were
submerged in a 5% sodium hypochlorite solution for 24 h, followed by thorough rinsing with
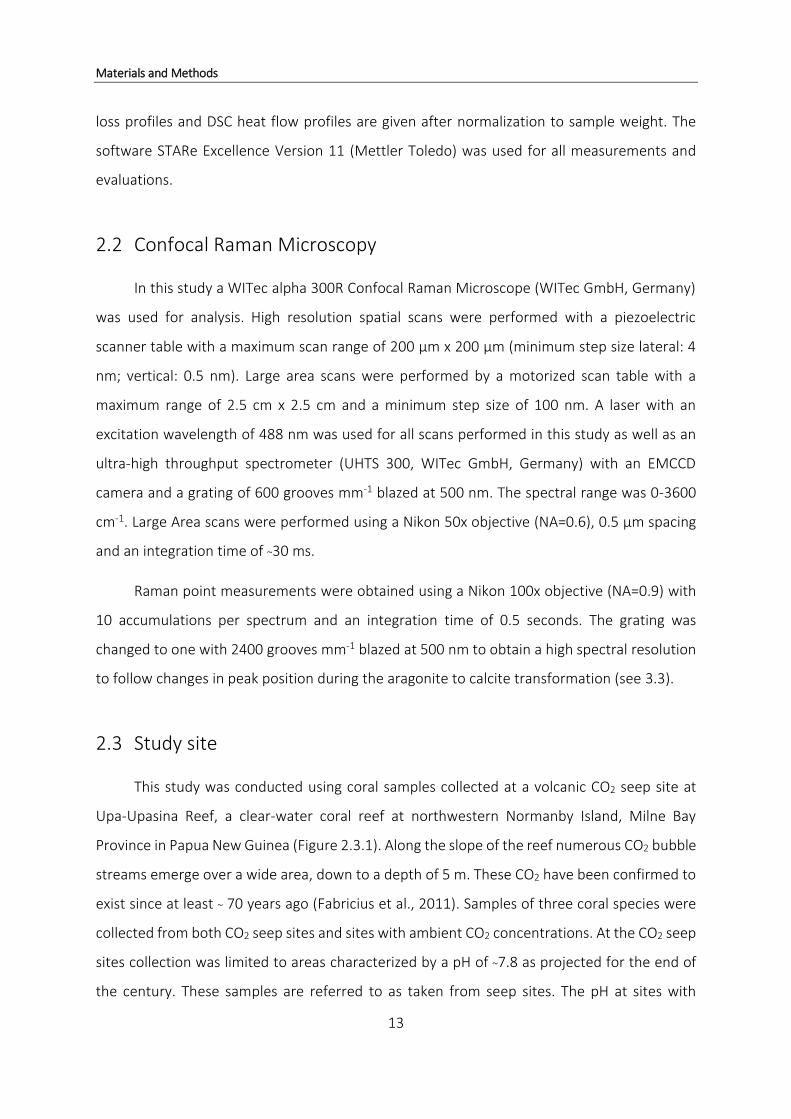
purified water. Both steps were repeated twice prior to drying the skeletons at 50 °C for 24 h.
Figure 2.5.1 shows bleached and dried skeletons of A. millepora, P. damicornis and S. hystrix
(from left to right).
Figure 2.5.1 Coral skeletons after bleaching; A. millepora, P. damicornis, S. hystrix (from left to right)
Samples for Thermogravimetric Analysis were ground using an agate-mortar and sieved
afterwards to obtain powder of 40-63 µm grain size. The powder was stored in small glass vials
until further use.
Skeletons to be used with Confocal Raman Microscopy were embedded in epoxy resin
(Araldite 2020, Huntsmann) and cut into thin slices resulting in longitudinal sections of the
coral skeletons. Slices were glued onto glass slides and ground using HERMES water grinding
papers (grain size: P1200, P2400 and P4000 (in order)) and subsequently polished with a 0.3
µm aluminum oxide suspension. Samples were rinsed with purified water in-between each
grinding and polishing step. Samples were checked visually in between grinding and polishing
steps using binoculars and the slices were processed until no more scratches in the epoxy resin
could be observed.
2.6 Statistical Analysis
Statistical analysis was done using the software RStudio (Version 3.1.0). All data sets were
checked for normal distribution using Lilliefors (based on Kolmogorov-Smirnov) normality test.
Results and Discussion
19
Comparison of species between sites for different amounts of weight loss was done using
Student’s t-Test for normally distributed data and Kolmogorov-Smirnov test for non-normally
distributed data.
3 Results and Discussion
3.1 Thermogravimetric Analysis
The change in mass of coral aragonite when heated from ambient to elevated
temperatures can give valuable information on the amount of organic matter and water
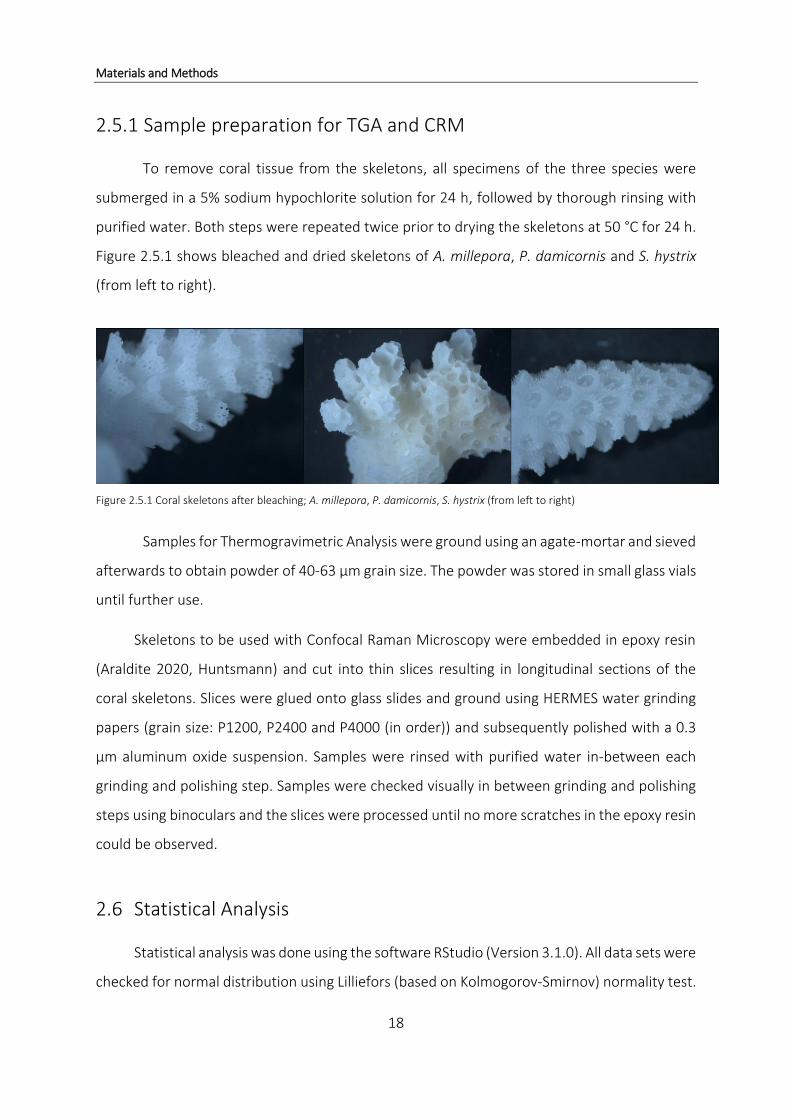
present within the sample. The following diagrams show an example of typical weight loss
(TGA) and heat flow (DSC) profiles of a coral aragonite powder heated from 30 °C to 900 °C
and 30 °C to 550 °C (Figure 3.1.1).
Figure 3.1.1 Example of TGA and DSC profiles of coral powder heated until 900 °C (left) and until 550 °C (right)
The TGA and DSC curves on the left side show the evolution of a powdered coral skeleton
sample heated until 900 °C (Figure 3.1.1) in terms of weight loss and thermal reactions. The
most prominent weight loss starting at approximately 650 °C is related to the decomposition
of CaCO3 to CaO (Cuif et al., 2004). The curves on the right side show the temperature range
between 30 °C to 550 °C in magnification. This temperature range is characteristic for the
decomposition of organic material.
The mass loss in coral skeletons in this range is reported to lie between 2.5 and 3% (Cuif
et al., 2004). Altogether, four weight losses can be observed in both the TGA and the DSC curve
Results and Discussion
20
(Figure 3.1.1 (right) gray areas). The most noticeable transition in the TGA profile occurs at 300
°C and is accompanied by a negative peak in the DSC curve which indicates an endothermic
reaction (see 1.3). Prior to this, two lesser weight losses are recorded in the TGA and DSC signal,
the first around 100 °C and the second at about 200 °C. A fourth distinctive weight loss occurs
at 430 °C. Apart from these steps, the profiles show a low and continuous decrease in weight
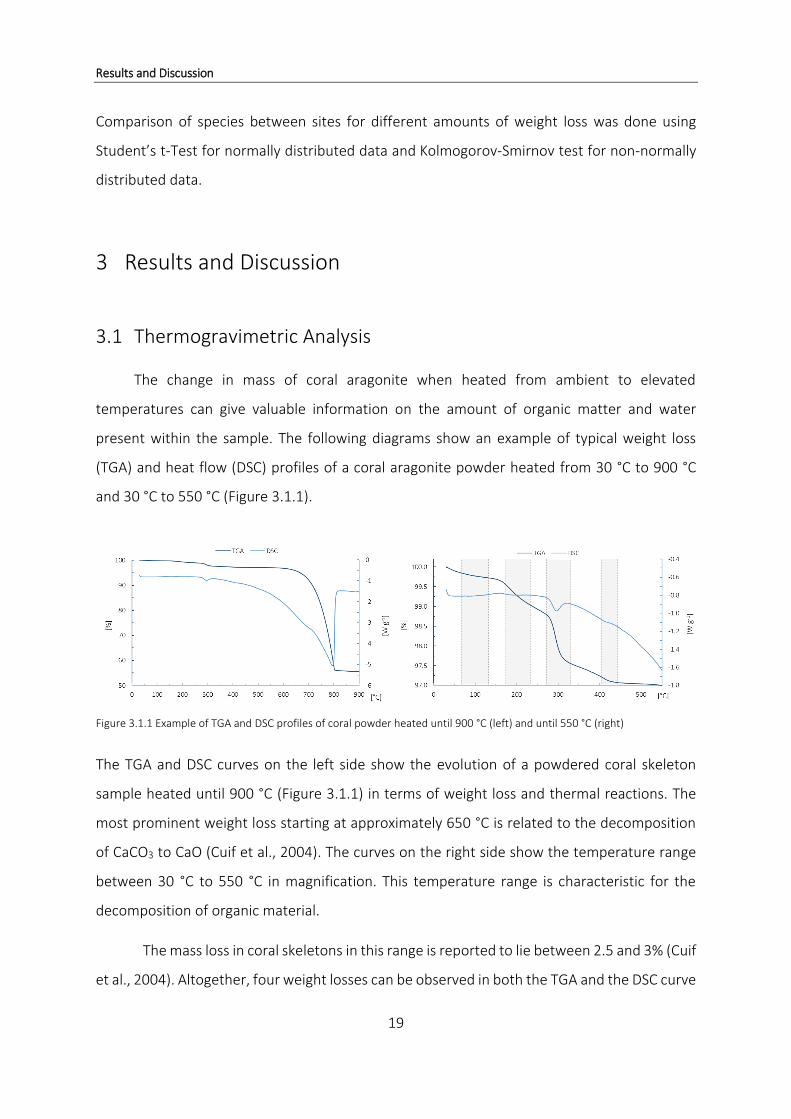
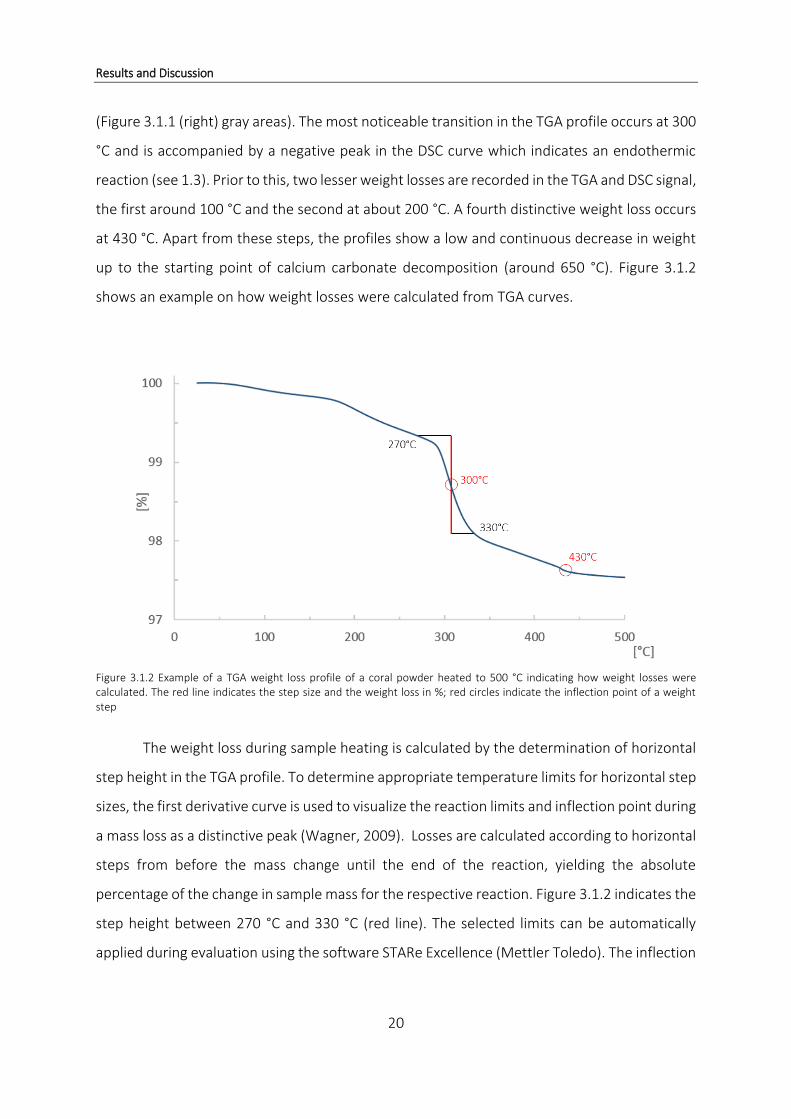
up to the starting point of calcium carbonate decomposition (around 650 °C). Figure 3.1.2
shows an example on how weight losses were calculated from TGA curves.
Figure 3.1.2 Example of a TGA weight loss profile of a coral powder heated to 500 °C indicating how weight losses were calculated. The red line indicates the step size and the weight loss in %; red circles indicate the inflection point of a weight step
The weight loss during sample heating is calculated by the determination of horizontal
step height in the TGA profile. To determine appropriate temperature limits for horizontal step
sizes, the first derivative curve is used to visualize the reaction limits and inflection point during
a mass loss as a distinctive peak (Wagner, 2009). Losses are calculated according to horizontal
steps from before the mass change until the end of the reaction, yielding the absolute
percentage of the change in sample mass for the respective reaction. Figure 3.1.2 indicates the
step height between 270 °C and 330 °C (red line). The selected limits can be automatically
applied during evaluation using the software STARe Excellence (Mettler Toledo). The inflection

Results and Discussion
21
point of this horizontal weight step is at 300 °C. For the following smaller weight loss the
inflection point is 430 °C.
In a TGA study of different scleractinian coral species, a correlation between the release
of H2O and CO2 was found for the major weight loss at 300 °C and the minor loss at 430 °C
using IR spectroscopy as a method to analyze gaseous emissions resulting from thermal decay
of the coral powder components. CO2 releases at these relatively low temperatures can only
result from the decay of coral organic matrix and not from the thermal dissociation of the
CaCO3 skeleton (Cuif et al., 2004). The simultaneous release of water can be explained either
by the decomposition of hydrated organic compounds, or by water molecules strongly bound
to the skeletal matrix which cannot be released at lower temperatures. Since the main aim of
this study was to determine the amount of organic compounds in coral skeletons, heating was
limited to 550 °C during TGA as the oxidative breakdown of hydrated organic matrix is assumed
to occur prior to calcium carbonate decomposition (Cuif et al., 2004).
Impact of the heating rate on measured temperature values
It is important to notice that temperature values determined by TGA, e.g. the
temperature at which H2O or CO2 is released from the sample, are strongly dependent on the
applied heating rate. The temperature at which a chemical reaction in the sample (in this case
a decrease in mass) occurs, varies with the chosen heating rate since it determines the kinetics
of the reaction. Generally, higher heating rates cause reactions to shift towards higher
temperatures (Wagner, 2009). Therefore, the applied heating rate has to be taken into account
if different measurements and data from the literature are compared to each other. The choice
of the heating rate is of particular importance if reactions occur at relatively similar
temperatures. The possibility that those reactions cannot be resolved increases with increasing
heating rate. In those cases lower heating rates are usually the best choice (Wagner, 2009).
Figure 3.1.3 shows the results of measurements with different heating rate using ST-1 powder.

Results and Discussion
22
Figure 3.1.3 TGA-weight loss (top) and DSC-heat flow (bottom) signal of ST-1 powder subjected to different heating rates (increase in heating rate results in a shift of the curve to the right; blue: 1 °,4 °,16 ° and 30 ° min-1; red: 2°,8°,20° and 40° min-
1)
Figure 3.1.3 shows the TGA (top) and DSC (bottom) profile of ST-1 powder samples run
with different heating rates (1°,2°,4°,8°,16°,20°,30° and 40° min-1; two replicates each, only
one measurement for heating rate 40° min-1) under a purge gas flow of 20 mL min-1 using N2.
Besides the shift in onset temperature towards higher temperatures as the heating rate is
increased, both TGA and DSC profiles are very comparable for all measurements and no further
differences can be detected. No additional reactions are observed in either profile and
therewith a possible overlap of is unlikely.

Results and Discussion
23
The influence of different heating rates on obtained results was not discussed in Cuif et al.,
2004, but the results in Figure 3.1.3 clearly show that the temperature range for weight losses
depends on the applied heating rate.
The ‘true’ temperature of a reaction
The reaction temperature inferred from TGA curves depends on the heating rate. A
comparison between different samples, measured with the same heating rate, will allow to
reveal relative differences between samples, but not the ‘true’ temperature defining the
physio-chemical conditions of the reaction. Using the same heating rate for all samples ensures
comparability. An absolute result in terms of the temperature at which weight losses occur
could however provide information and aid in determining the type of compound released at
a given time during measurements. A plot of the onset temperatures of the measurements
shown in Figure 3.1.3 against the corresponding heating rate is shown in Figure 3.1.4.
Figure 3.1.4 Polynomial fit (2nd order) for heating rate vs. onset of weight loss for ST-1 samples
A polynomial fit allows the determination of a hypothetical onset temperature at
heating rate 0° min-1 which is 266.63 °C. Subjecting the same sample to various heating rates
Results and Discussion
24
and using the onset temperatures of reactions to obtain the equation of regression, would
allow the determination of specific and ‘true’ onset temperatures for individual reactions
during heating of a sample. These ‘true’ temperatures would allow a better characterization of
the type of compounds that are released during TGA and therewith allow a comparison
between studies. It is however very time consuming and cost-intensive and therefore was not
possible in the course of this study. For the purpose of this study, a heating rate of 10° min-1
was adopted for all TGA measurements. The heating rate was chosen based on empirical
knowledge.
Combining TGA with additional analytical methods
TGA gives information about changes in sample mass while heated, but does not allow
the chemical identification of gaseous compounds released during the thermal reactions.
However, there are possibilities to combine TGA with other methods like e.g. Infrared
Spectroscopy (IR) or Mass Spectrometry (MS). Both IR and MS allow the investigation of
gaseous compounds released from the sample during TGA and the detection of compounds
like H20 and CO2. Unfortunately, a coupled TGA-IR or -MS instrumental setting was not
available for this study. However, one sample of ST-1 powder was sent to the application
laboratory of Mettler Toledo (Giessen, Germany) and subjected to TGA analysis coupled with
both IR and MS. The obtained results allow a comparison with the relevant information
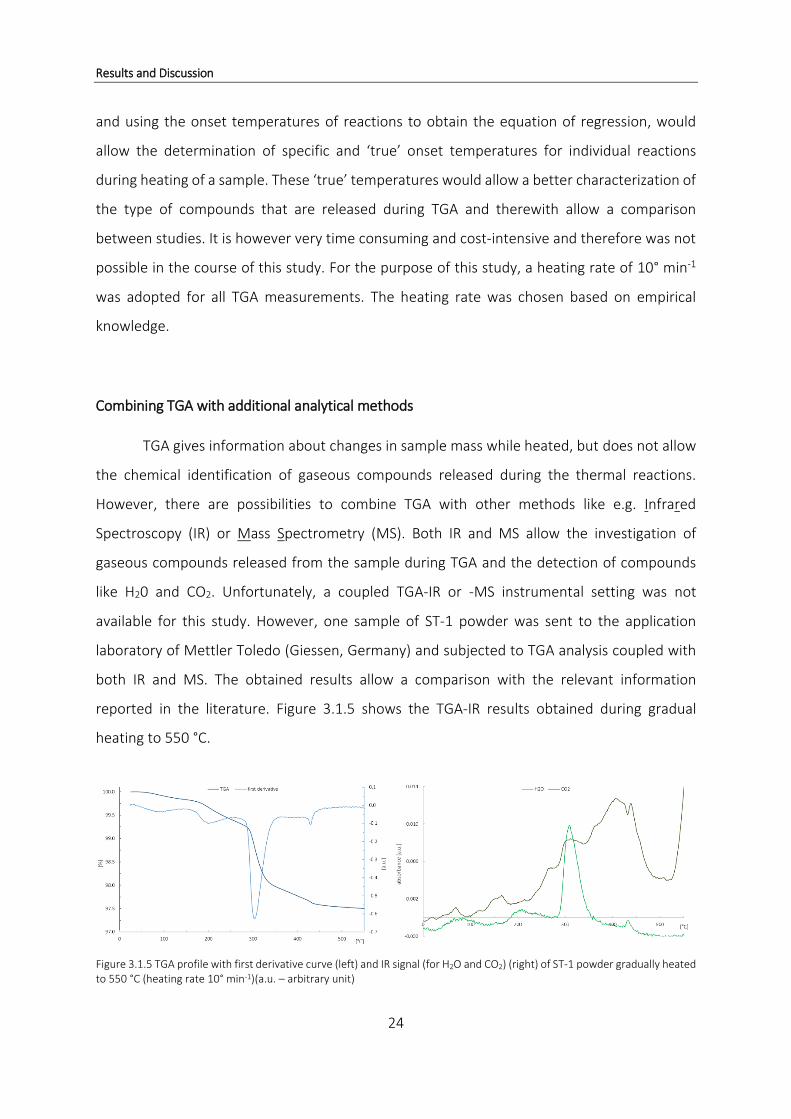
reported in the literature. Figure 3.1.5 shows the TGA-IR results obtained during gradual
heating to 550 °C.
Figure 3.1.5 TGA profile with first derivative curve (left) and IR signal (for H2O and CO2) (right) of ST-1 powder gradually heated to 550 °C (heating rate 10° min-1)(a.u. – arbitrary unit)

Results and Discussion
25
The left diagram shows the typical TGA profile of coral powder during heating including
the first derivative curve which highlights the four weight loss reactions (see also Figure 3.1.1).
The most prominent weight loss occurs at 300 °C shown by a distinct negative peak in the
derivative curve. The three smaller weight losses at 100 °C, 200 °C and 430 °C are also visible
in both curves. In the right diagram, a prominent peak at ~300 °C indicates the release of H2O
(Figure 3.1.5). Additional information derived from this spectrum is the distinct increase in CO2
releases commencing at about 250 °C and reaching their maximum at about 430 °C which
correlates with the small weight step at 430 °C (Figure 3.1.5 (left)). The results shown in Figure
3.1.5 are in agreement with previous assumptions about the cause of weight loss during TGA
measurements on coral powders. Both increased H2O and CO2 releases are recorded during
the main weight loss around 300 °C indicating the release of hydrated organic compounds.
More water is lost during the weight loss at 300 °C compared to the smaller weight loss
at 430 °C. On the contrary, CO2 releases at 430 °C are higher than at 300 °C (Figure 3.1.5). The
obtained results are in good agreement with previous published measurements on Porites
australiensis (Cuif et al., 2004). Apart from the peaks at 300 °C and 430 °C, the CO2 profile rises
constantly after 100 °C which suggests a continuous release of CO2 during the heating process.
It can be hypothesized that different types of organic compounds are present within the coral
skeleton and that one type of organic compounds inside the skeletal matrix is released
continuously after reaching 100 °C, independent of a certain temperature, whereas for other
organic compounds a certain temperature has to be reached before they can be released from
the sample. Figure 3.1.6 combines the first derivative curve of the TGA profile and IR H2O signal
of the ST-1 powder during gradual heating to 550 °C.

Results and Discussion
26
Figure 3.1.6 first derivative of TGA profile and IR H2O signal combined. Gray areas indicate water releases (IR) and concurrent weight losses indicated in the first derivative curve (a.u. – arbitrary unit)
The IR signal shows four increases related to the release of water throughout the TGA
measurement, one at 100 °C, 200 °C, 300 °C and 430 °C. The overlay of both curves in this
diagram shows that these peaks fit with the four negative peaks in the derivative curve which
indicate the endothermic weight loss reactions during TGA (see gray areas). Therefore it can
be concluded, that water is released during all four weight loss steps, however in different
quantities (see TGA profile Figure 3.1.1 for weight loss steps). The first weight loss around 100
°C can be attributed to drying of coral powder and evaporation of adsorbed water. The second
decline in mass around 200 °C is assumed to be related to the loss of water sufficiently bonded
to the skeletal matrix to prevent evaporation at lower temperatures. The most significant
weight loss at 300 °C as well as the smaller weight loss at 430 °C are most likely caused by the
release of water from the hydrated organic matrix inside the coral skeleton (Cuif et al., 2004;
Dauphin et al., 2006). The TGA-MS results for ST-1 powder are given in Figure 3.1.7.

Results and Discussion
27
Figure 3.1.7 TGA profile with first derivative curve (left) and MS signal (for mass number 17 and 18) (right) of ST-1 powder gradually heated to 550 °C (heating rate 10° min-1) (a.u. – arbitrary unit)
Increased signals for mass number 18 (black) and 17 (light gray) (Figure 3.1.7 (right))
both indicate the release of water during the TGA measurement. For both spectra, distinctive
water peaks are recorded at 300 °C and 430 °C during weight losses, most likely caused by the
release of hydrated organic matrix from coral skeletons (Cuif et al., 2004; Dauphin et al., 2006).
Water peaks at 300 °C are higher for both mass numbers than at 430 °C which fits with previous
TGA and IR results. A spectrum indicating the release of CO2 during heating is not included in
this analysis.
The measurements performed in the application laboratory of Mettler Toledo showed
that a combination of both IR and MS in combination with TGA would allow for a much more
detailed characterization of the coral samples from Papua New Guinea. Due to time and
financial constraints the coupled TGA-IR/-MS methodology was not available in the framework
of this study but will be essential to obtain the quantitative information about the ratio
between water and organics released during the heating of coral samples.
The main aim of this study was to find differences in the amount and type of organic
matter in coral skeletons grown under ambient and increased CO2 conditions. TGA without
additional methods for the identification of the released compounds (IR or MS) does not allow
separating the mass loss related to water from the mass loss related to organics. Therefore,
the sum of both is used as a proxy for the amount of organic compounds in coral skeletons. As
from now on, the compounds released between 270 °C and 330 °C as well as between 400 °C
and 440 °C during heating of the coral powder will be attributed to the breakdown of the
hydrated organic matrix.

Results and Discussion
28
Variables influencing results obtained by TGA
The amount of hydrated organic matrix lost during thermal decay of coral skeleton
samples is used as a proxy for the amount of organic compounds. A strict protocol of sample
preparation is crucial to ensure comparability of the measured data (Dauphin et al., 2006).
Coral skeletons were usually bleached three times for 24 h in sodium hypochlorite (5%)
to remove coral tissue. In order to determine whether bleaching for different periods of time
can have an effect on the results obtained by TGA, two random samples of P. damicornis were
chosen for testing, one from the control site and one from the seep site. Parts of these samples
were additionally bleached for another 24 h and afterwards treated exactly like the rest of the
samples. Figure 3.1.8 compares changes in mass during TGA for samples subjected to three or
four (indicated by + in Figure 3.1.8) bleaching steps.
Figure 3.1.8 Average weight loss (from 30 °C to 550 °C) in P. damicornis samples from control and seep sites, bleached three times (Control; Seep) and four times (Control +; Seep +) (three replicates for each sample, error bars represent standard deviation)
Samples that were bleached for a fourth time show a significantly decreased weight
loss during TGA compared to samples that were only bleached three times. This holds for both
the sample from the control and from the seep site (control: p=0.004; seep p<0.001). For the
control sample, additional bleaching caused a decrease in weight loss by about 0.05%, for the
3.00
3.05
3.10
3.15
3.20
3.25
3.30
3.35
3.40
Control Control + Seep Seep +
[%]

Results and Discussion
29
sample from the seep site the difference is approximately 0.2% of sample weight. For these
examples this corresponds to a loss of approximately 1.4% of the total weight loss (3.23%) at
the control site and approximately 6.8% of the total weight loss (3.33%) at the seep site.
The number of samples used for this additional experiment is very small and it is
therefore difficult to deduce the exact effect additional bleaching has on the amount of
hydrated organic matrix lost during TGA. Results indicate however, that the method of
preparation and removal of coral tissue plays an important role and has to be considered when
comparing different studies. Since the same treatment was applied to all samples measured
within this study a reliable comparison of the data obtained in this study is given.
3.1.1 Organic compounds in coral samples from Papua New Guinea
TGA was performed using powdered coral skeleton samples from both control (pH 8.1)
and seep sites (pH 7.8) to obtain information on the amount of hydrated organic matrix lost
during the controlled heating of the sample.
Differences in TGA profiles of coral species
Comparing weight loss profiles of the three different species, clear differences can be
observed. Figure 3.1.9 shows one typical TGA weight loss curve for all three coral species
obtained by averaging the curves of all replicates of the respective species used in this study.
Species are expected to emit slightly differing profiles, suggesting specific and unique skeletal
compositions (Cuif et al., 2004).
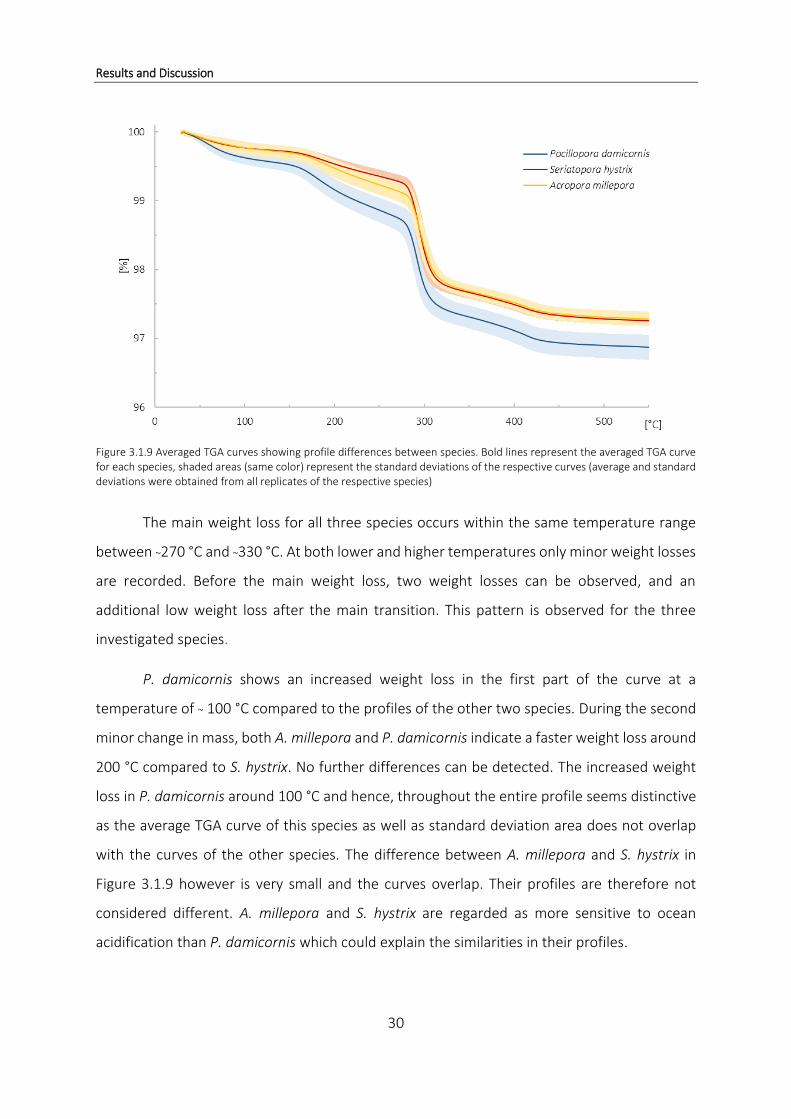
Results and Discussion
30
Figure 3.1.9 Averaged TGA curves showing profile differences between species. Bold lines represent the averaged TGA curve for each species, shaded areas (same color) represent the standard deviations of the respective curves (average and standard deviations were obtained from all replicates of the respective species)
The main weight loss for all three species occurs within the same temperature range
between ~270 °C and ~330 °C. At both lower and higher temperatures only minor weight losses
are recorded. Before the main weight loss, two weight losses can be observed, and an
additional low weight loss after the main transition. This pattern is observed for the three
investigated species.
P. damicornis shows an increased weight loss in the first part of the curve at a
temperature of ~ 100 °C compared to the profiles of the other two species. During the second
minor change in mass, both A. millepora and P. damicornis indicate a faster weight loss around
200 °C compared to S. hystrix. No further differences can be detected. The increased weight
loss in P. damicornis around 100 °C and hence, throughout the entire profile seems distinctive
as the average TGA curve of this species as well as standard deviation area does not overlap
with the curves of the other species. The difference between A. millepora and S. hystrix in
Figure 3.1.9 however is very small and the curves overlap. Their profiles are therefore not
considered different. A. millepora and S. hystrix are regarded as more sensitive to ocean
acidification than P. damicornis which could explain the similarities in their profiles.
Results and Discussion
31
Cuif and colleagues (Cuif et al., 2004) report that each coral species exhibits a specific
TGA profile which indicates a unique composition of the skeletal organic matrix. It is not clear
whether this result was obtained by means of one TGA measurement alone or by merging the
TGA profiles of several replicates and samples of the same species. The TGA profiles for each
species in this study (Figure 3.1.9) were obtained by averaging curves from all samples (a
minimum of n=32) and replicates of the same site and therefore constitute a reliable result.
The question arises whether profiles differ for other biogenic aragonites (e.g. mollusks,
mussels) and are specific for coral calcium carbonate only or whether it is a general pattern,
common for all biogenic carbonates. This is an interesting issue which should be investigated
in future work.
Weight losses during TGA for different temperature ranges
Three different temperature ranges have been defined for which the weight loss was
determined. The temperature range from 270 °C to 300 °C represents the main change in mass
for all three species. The second temperature range embraces the interval from 400 °C to 440
°C and according to Mettler Toledo TGA-IR results, attributed also to the breakdown of
hydrated organic matrix (Figure 3.1.5). Lastly, the loss of sample weight during the whole
measurement from 30 °C to 550 °C was calculated as it takes into account the continuously
occurring weight loss which is not expressed as pronounced steps. The minor weight losses at
100 °C and 200 °C were not individually evaluated as they can be attributed to the release of
water absorbed by the sample powder and not related to the hydrated organic matrix (Cuif et
al., 2004).
The following diagrams depict the results of the average weight loss during TGA for different
temperature ranges of all powdered coral samples, both from control and seep sites (Figure
3.1.10, Figure 3.1.11 and Figure 3.1.12). All weight losses are standardized to sample weight
and given in %.

Results and Discussion
32
Figure 3.1.10 average weight loss [%] between 270 °C and 330 °C of A. millepora, P. damicornis and S. hystrix from both sites (error bars show the standard deviation of all samples from one species at one site; average weight losses for each sample were calculated from three replicates)
Figure 3.1.10 shows the average weight decline between 270 °C and 330 °C. Step sizes
in weight loss curves result in a 1.35-1.55% decrease in sample weight during the chosen
temperature range. No significant difference is detected between control and seep site for all
three species, however interspecies differences are observed. Weight loss in S. hystrix samples
differs significantly from A. millepora and P. damicornis samples from both sites. Samples show
increased mass losses in S. hystrix compared to A. millepora (control: p<0.001; seep: p<0.001)
and compared to P. damicornis (control: p<0.001; seep: p<0.001).
Results and Discussion
33
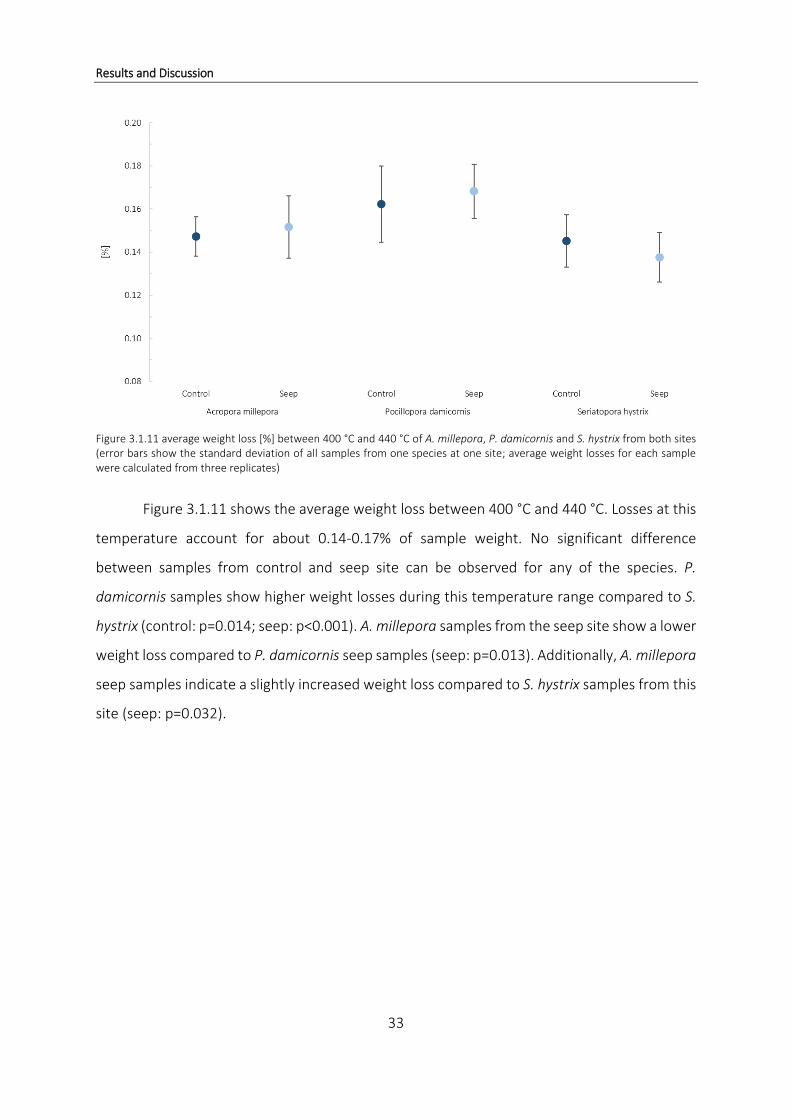
Figure 3.1.11 average weight loss [%] between 400 °C and 440 °C of A. millepora, P. damicornis and S. hystrix from both sites (error bars show the standard deviation of all samples from one species at one site; average weight losses for each sample were calculated from three replicates)
Figure 3.1.11 shows the average weight loss between 400 °C and 440 °C. Losses at this
temperature account for about 0.14-0.17% of sample weight. No significant difference
between samples from control and seep site can be observed for any of the species. P.
damicornis samples show higher weight losses during this temperature range compared to S.
hystrix (control: p=0.014; seep: p<0.001). A. millepora samples from the seep site show a lower
weight loss compared to P. damicornis seep samples (seep: p=0.013). Additionally, A. millepora
seep samples indicate a slightly increased weight loss compared to S. hystrix samples from this
site (seep: p=0.032).

Results and Discussion
34
Figure 3.1.12 average weight loss [%] between 30 °C and 550 °C of A. millepora, P. damicornis and S. hystrix from both sites (error bars show the standard deviation of all samples from one species at one site; average weight losses for each sample were calculated from three replicates)
Figure 3.1.12 illustrates the average overall weight loss between 30 °C and 550 °C for
all samples. During the entire TGA measurement coral samples lose about 2.6-3.2% in weight
which is consistent with literature results (Cuif et al., 2004). Again, no significant difference is
detectable between control and seep samples of the same species, however great interspecies
differences exist. P. damicornis control and seep samples show a higher weight loss than
samples from A. millepora from the respective site (control: p<0.001; seep: p<0.001) and S.
hystrix (control: p<0.001; seep: p<0.001) with an increase in weight loss of ~ 0.4% and ~ 0.3%,
respectively. A. millepora samples from the seep site experience a slightly but significant lower
weight loss compared to S. hystrix seep samples (seep: p=0.001).
Evaluation of weight loss results for coral samples from Papua New Guinea
TGA results do not indicate any difference in amount of hydrated organic matrix of coral
skeletons between samples grown under ambient and increased CO2 conditions. Only
interspecies variations can be observed. A recent laboratory study, exposing specimens of the
coral Stylophora pistilla to different CO2 and pH conditions for over a year, finds an increase in
organic matrix proteins for corals incubated at pH 7.2, accompanied by a change in skeletal

Results and Discussion
35
architecture (Tambutté et al., 2015). Assuming the hypothesis that one of the primary roles of
organic compounds in coral skeletons is to enable calcification at low degrees of saturation and
to act as a catalyzer for aragonite precipitation (Mann, 2001) an increase in the amount of
organic matrix inside skeletons of coral specimens grown under high CO2 conditions is highly
plausible. Significant increases in the Stylophora pistilla study however are only recorded for
treatments with a pH of 7.2 compared to pH 8. Samples incubated under pH 7.2 have ~7 µg g-
1 (3.5 µg cm-3) more organic matrix proteins than samples at ambient pH conditions (Tambutté
et al., 2015). The results in this study were obtained via dissolving the skeleton and extracting
the organic matrix. Afterwards, a protein assay was carried out to determine the protein
content.
The obtained differences, while significant, are very small and therefore not detectable
by means of TGA. Another factor to take into account is that coral specimens from seep sites
in this study were sampled directly at the sites with a pH of 7.8. In the laboratory study, samples
from the pH 7.8 treatment did also not show a significant increase in organic matrix proteins
(Tambutté et al., 2015). Furthermore, our data were obtained from specimens growing under
ambient and increased pCO2 conditions for decades and most probably their entire life span
rather than from corals collected at ambient pH and put to elevated CO2 conditions only for a
relatively short time of their life span. Corals from Papua New Guinea may have adapted to
altered CO2 conditions (Fabricius et al., 2011), obviating the necessity of increased organic
matrix to facilitate calcification. In field studies it is nearly impossible to control all parameters
such as light, temperature, salinity etc. over an increased time span while in the laboratory
study only pH and carbonate chemistry varied between treatments so any change can directly
be assigned to acidification (Tambutté et al., 2015) which is not possible for field studies.
Additionally, the co-variation of factors will potentially result in a high variability in organic
matrix content and likely mask the small change due to the change of only one factor.
Tambutté and colleagues (Tambutté et al., 2015) only used the fraction < 5 kDa for
analysis. Some larger organic compounds are therefore excluded from analysis which may
explain the relatively small changes in organic content between corals from control and low
pH treatment. Also, the coral powders were additionally bleached in sodium hypochlorite
(10%) to remove potential contaminations by endoliths. This additional bleaching step of fine

Results and Discussion
36
powder grains (~30 µm) could remove part of the organic compounds embedded in the
skeleton and hence, alter the extent of organic matrix.
Our data did not show significant differences in weight loss between specimens from
control and seep site, however interspecies variations can be observed during heating. The
highest average overall amount of hydrated organic matrix was found for P. damicornis
samples (Figure 3.1.12). This species is known to be less structurally complex and more resilient
to high CO2 conditions (Fabricius et al., 2011) which may indicate higher adaptive capacities
than in other species. A naturally higher content of organic compounds in the skeleton may aid
to ensure calcification at low degrees of saturation for aragonite and corals may use more
energy to maintain linear extension (e.g. by building organic compounds) at the cost of skeletal
density (Crook et al., 2013). During the main transitional phase at 300 °C the weight loss of S.
hystrix is significantly higher than in P. damicornis, overall weight loss until 550 °C however is
significantly smaller. Between 400 °C and 440 °C P. damicornis samples lose more weight
compared to S. hystrix samples. These variations in weight loss depending on the temperature
range could be explained by a difference in type of organic compounds or a different ratio of
hydrated compounds within the nonmineral part of the skeleton. However, without additional
analytical methods it is not possible to explain these variations between temperature ranges
and assign them to differences between species.
3.1.2 Loss of organic matter during decomposition of CaCO3
In this study the temperature range until 550 °C was used to determine the amount of
hydrated organic material within the coral skeleton. According to the study of Cuif and co-
workers (Cuif et al., 2004) all organic material is removed if a temperature of 500 °C is reached,
leaving only CaCO3. If the sample is further heated, the thermal dissociation of CaCO3 into CaO
and CO2 will occur.
According to the chemical reaction:
CaCO3 → CaO + CO2

Results and Discussion
37
the loss of mass is solely due to the CO2 release and amounts to 44% (the molar mass of CaCO3
is ~100 g mol-1 and for CO2 it is ~44 g mol-1 which results in 44% weight loss during calcium
carbonate decomposition).
In contrast to the study of Cuif and co-workers (Cuif et al., 2004), a study done by
Dauphin and co-workers (Dauphin et al., 2006) suggests that some organic material within
coral skeletons is only released at temperatures much higher than the suggested 500 °C (they
suggest temperatures of up to over 800 °C). In order to find out if this holds for coral samples
from Papua New Guinea, a few TGA measurements were performed until a final temperature
of 900 °C. The amount of mass released during decomposition should be lower than 44% if the
organic compounds would remain in the skeleton (their density is generally lower than that of
CaCO3).
Prior to measuring the samples from Papua New Guinea, the ST-1 powder was used to
test the effect of the heating rate (see 3.1 for heating rate effects (Figure 3.1.3)).
Measurements using the inorganic aragonite have been performed to test if organic free
aragonite indeed results in the predicted 44% of weight loss. Organic free reference powder
was made from natural aragonite single crystals. N2 was chosen as an inert purge gas and a
flow rate of 20 mL min-1 was applied. The loss of mass determined for ST-1 and inorganic
aragonite samples for the temperature range between 550 °C and 900 °C is shown in Figure
3.1.13. The temperature range was chosen, since according to the study of Cuif and coworkers
(Cuif et al., 2004) only ‘organic free’ CaCO3 should be present within the coral sample at
temperatures above 500 °C. Therefore, the mass at 550 °C is assumed to represent 100%
CaCO3 in this experiment. The approximate weight loss of 3% that occurs prior to
decomposition is not included when calculating the mass loss after 550 °C. Therewith, a direct
comparison between the inorganic and coral aragonite should be possible.
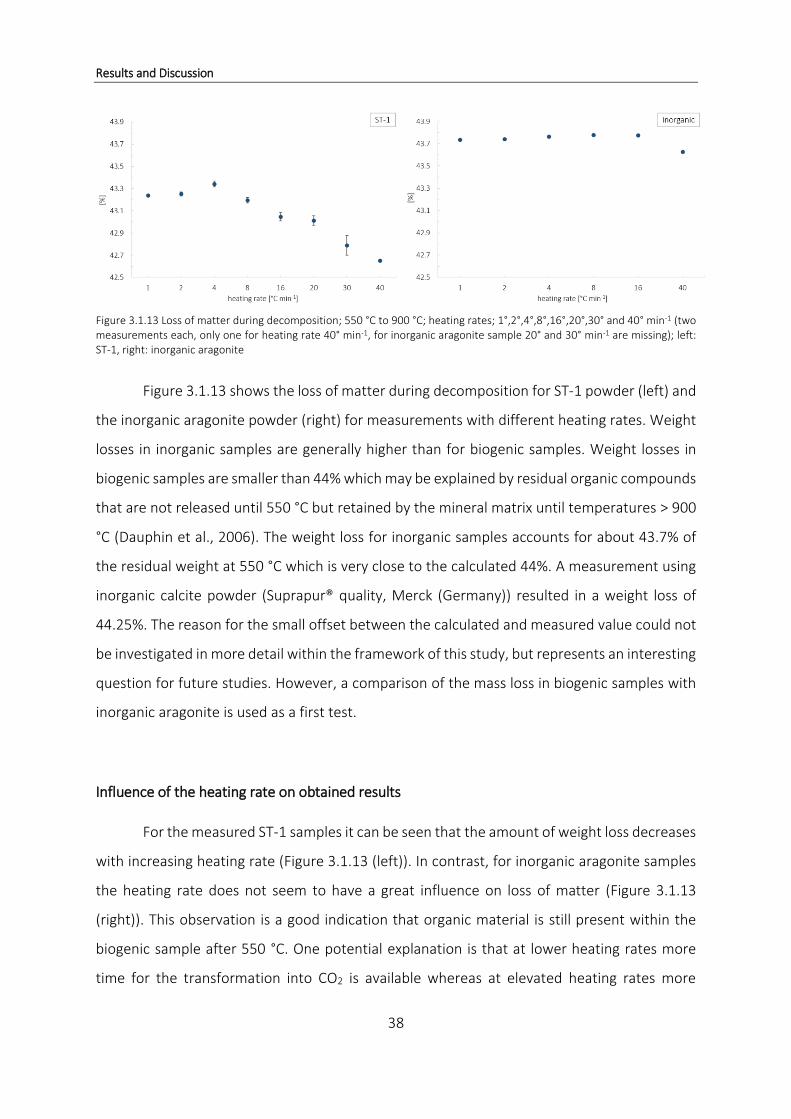
Results and Discussion
38
Figure 3.1.13 Loss of matter during decomposition; 550 °C to 900 °C; heating rates; 1°,2°,4°,8°,16°,20°,30° and 40° min-1 (two measurements each, only one for heating rate 40° min-1, for inorganic aragonite sample 20° and 30° min-1 are missing); left: ST-1, right: inorganic aragonite
Figure 3.1.13 shows the loss of matter during decomposition for ST-1 powder (left) and
the inorganic aragonite powder (right) for measurements with different heating rates. Weight
losses in inorganic samples are generally higher than for biogenic samples. Weight losses in
biogenic samples are smaller than 44% which may be explained by residual organic compounds
that are not released until 550 °C but retained by the mineral matrix until temperatures > 900
°C (Dauphin et al., 2006). The weight loss for inorganic samples accounts for about 43.7% of
the residual weight at 550 °C which is very close to the calculated 44%. A measurement using
inorganic calcite powder (Suprapur® quality, Merck (Germany)) resulted in a weight loss of
44.25%. The reason for the small offset between the calculated and measured value could not
be investigated in more detail within the framework of this study, but represents an interesting
question for future studies. However, a comparison of the mass loss in biogenic samples with
inorganic aragonite is used as a first test.
Influence of the heating rate on obtained results
For the measured ST-1 samples it can be seen that the amount of weight loss decreases
with increasing heating rate (Figure 3.1.13 (left)). In contrast, for inorganic aragonite samples
the heating rate does not seem to have a great influence on loss of matter (Figure 3.1.13
(right)). This observation is a good indication that organic material is still present within the
biogenic sample after 550 °C. One potential explanation is that at lower heating rates more
time for the transformation into CO2 is available whereas at elevated heating rates more
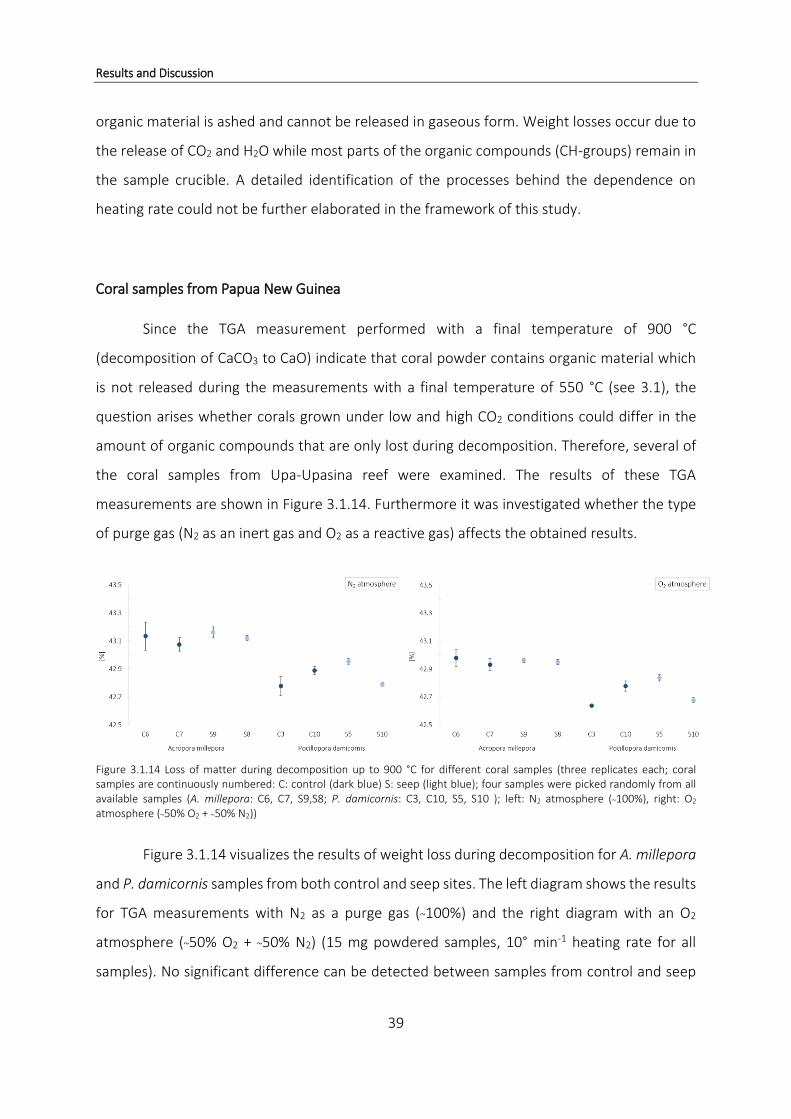
Results and Discussion
39
organic material is ashed and cannot be released in gaseous form. Weight losses occur due to
the release of CO2 and H2O while most parts of the organic compounds (CH-groups) remain in
the sample crucible. A detailed identification of the processes behind the dependence on
heating rate could not be further elaborated in the framework of this study.
Coral samples from Papua New Guinea
Since the TGA measurement performed with a final temperature of 900 °C
(decomposition of CaCO3 to CaO) indicate that coral powder contains organic material which
is not released during the measurements with a final temperature of 550 °C (see 3.1), the
question arises whether corals grown under low and high CO2 conditions could differ in the
amount of organic compounds that are only lost during decomposition. Therefore, several of
the coral samples from Upa-Upasina reef were examined. The results of these TGA
measurements are shown in Figure 3.1.14. Furthermore it was investigated whether the type
of purge gas (N2 as an inert gas and O2 as a reactive gas) affects the obtained results.
Figure 3.1.14 Loss of matter during decomposition up to 900 °C for different coral samples (three replicates each; coral samples are continuously numbered: C: control (dark blue) S: seep (light blue); four samples were picked randomly from all available samples (A. millepora: C6, C7, S9,S8; P. damicornis: C3, C10, S5, S10 ); left: N2 atmosphere (~100%), right: O2 atmosphere (~50% O2 + ~50% N2))
Figure 3.1.14 visualizes the results of weight loss during decomposition for A. millepora
and P. damicornis samples from both control and seep sites. The left diagram shows the results
for TGA measurements with N2 as a purge gas (~100%) and the right diagram with an O2
atmosphere (~50% O2 + ~50% N2) (15 mg powdered samples, 10° min-1 heating rate for all
samples). No significant difference can be detected between samples from control and seep
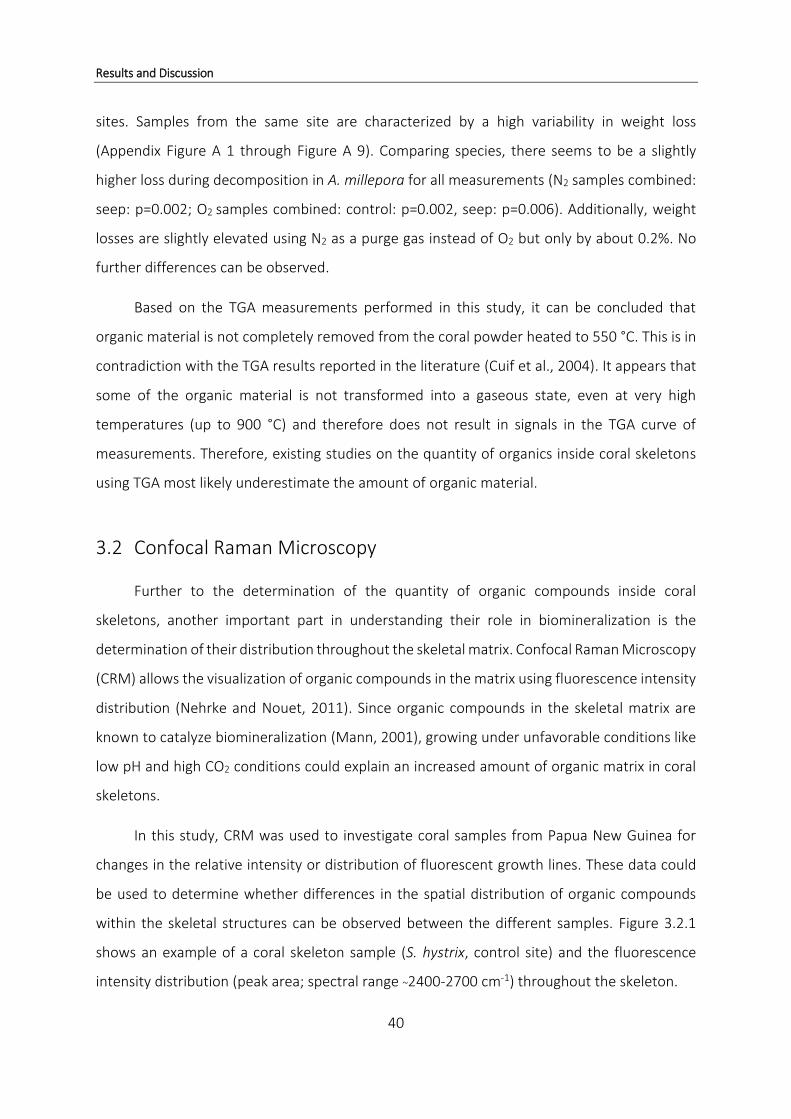
Results and Discussion
40
sites. Samples from the same site are characterized by a high variability in weight loss
(Appendix Figure A 1 through Figure A 9). Comparing species, there seems to be a slightly
higher loss during decomposition in A. millepora for all measurements (N2 samples combined:
seep: p=0.002; O2 samples combined: control: p=0.002, seep: p=0.006). Additionally, weight
losses are slightly elevated using N2 as a purge gas instead of O2 but only by about 0.2%. No
further differences can be observed.
Based on the TGA measurements performed in this study, it can be concluded that
organic material is not completely removed from the coral powder heated to 550 °C. This is in
contradiction with the TGA results reported in the literature (Cuif et al., 2004). It appears that
some of the organic material is not transformed into a gaseous state, even at very high
temperatures (up to 900 °C) and therefore does not result in signals in the TGA curve of
measurements. Therefore, existing studies on the quantity of organics inside coral skeletons
using TGA most likely underestimate the amount of organic material.
3.2 Confocal Raman Microscopy
Further to the determination of the quantity of organic compounds inside coral
skeletons, another important part in understanding their role in biomineralization is the
determination of their distribution throughout the skeletal matrix. Confocal Raman Microscopy
(CRM) allows the visualization of organic compounds in the matrix using fluorescence intensity
distribution (Nehrke and Nouet, 2011). Since organic compounds in the skeletal matrix are
known to catalyze biomineralization (Mann, 2001), growing under unfavorable conditions like
low pH and high CO2 conditions could explain an increased amount of organic matrix in coral
skeletons.
In this study, CRM was used to investigate coral samples from Papua New Guinea for
changes in the relative intensity or distribution of fluorescent growth lines. These data could
be used to determine whether differences in the spatial distribution of organic compounds
within the skeletal structures can be observed between the different samples. Figure 3.2.1
shows an example of a coral skeleton sample (S. hystrix, control site) and the fluorescence
intensity distribution (peak area; spectral range ~2400-2700 cm-1) throughout the skeleton.

Results and Discussion
41
Figure 3.2.1 S. hystrix skeleton, left: confocal microscopy stitched image; right: Raman large area scan (red rectangle in stitched image), fluorescence intensity distribution (spectral range ~2400-2700 cm-1)
The large area scan (right) reveals the fluorescence intensity distribution and visualizes
organic rich growth lines and structural patterns inside the coral skeleton.
Further to growth lines via fluorescence intensity, CRM also allows the visualization of
relative crystal orientation inside the coral skeleton via the intensity distribution (peak area) of
the lattice peaks of aragonite in translation mode at ~153 cm-1 and liberation mode at ~207 cm-
1 (Figure 3.2.4). Low pH conditions are known to alter the crystal structure of aragonite (Cohen
et al., 2009) so skeleton samples from control and seep sites were compared for their crystal
structure and orientation.
Figure 3.2.2 S. hystrix skeleton, left: confocal microscopy stitched image, right: map (false color) calculated from the ratio of maps with intensity distribution of aragonite lattice peaks (translation mode ~153 cm-1 and liberation mode at ~207 cm-1)
Figure 3.2.2 shows the confocal microscopy image of a S. hystrix skeleton (left) and a
combined map of Raman large area scans showing the intensity distribution of aragonite lattice
peaks (right), visualizing the crystal orientation of aragonite within the skeletal matrix. The map

Results and Discussion
42
on the right nicely visualizes growth patterns of aragonite crystals within the skeleton depicting
a needle like appearance.
Figure 3.2.3 S. hystrix skeleton (control): (a) confocal microscopy stitched image (b) fluorescence intensity distribution (spectral range ~2400-2700 cm-1) (c) intensity distribution of aragonite lattice peak (translation mode ~153 cm-1) (d) combined map (false color) calculated from the ratio of aragonite lattice peaks (translation mode ~153 cm-1 and liberation mode ~207 cm-1)
Figure 3.2.3 is another example for S. hystrix skeleton Raman area scans. Picture (b)
shows a fluorescence intensity scan of the middle part of the skeleton (see red rectangle in
picture (a)) depicting fluorescent growth lines which indicate the distribution of the organic
matrix throughout the skeleton. Picture (c) shows the relative crystallographic orientation of
aragonite in the skeletal matrix indicating fiber orientation (Wall and Nehrke, 2012). Picture (d)
is the superimposed picture of the maps of aragonite lattice peaks showing the difference in
crystal orientation of aragonite.
Fluorescence intensity scans and maps of the intensity distribution of aragonite lattice
peaks of skeletons were performed for samples from both control and seep site of all three
species. No difference in distribution and thickness of fluorescent lines (indicating high organic
content) could be determined between samples from control and seep sites. No visible
difference in relative crystallographic orientation of aragonite was detected between skeletal

Results and Discussion
43
samples from control and seep sites which is not in agreement with the literature. Several
studies report positional disorder and an overall decreasing structural control over the calcium
carbonate skeleton for corals growing under increased CO2 conditions as well as a decreased
constrain in crystallographic orientation (Fitzer et al., 2014; Kamenos et al., 2013; Pauly et al.,
2015). The differences in relative crystallographic orientation between coral samples from
control and seep in Papua New Guinea (this study) may simply be too small to be detected by
the applied analytical method. Further analysis with different techniques is necessary to obtain
information on possible differences in relative crystallographic orientation as used in the above
cited studies.
Comparison of samples from different species is not straight forward as the structure
of their skeletons naturally differs. A. millepora is structurally more complex than S. hystrix and
P. damicornis, especially P. damicornis being more massive. For A. millepora skeletons it is
difficult to obtain large area Raman scans of areas without holes that could give information
on the distribution of organic compounds (Figure A 10; Appendix). Their skeletons are
characterized by an extremely high porosity and it is difficult to obtain nice and informative
fluorescence intensity scans. The visualization of crystal structure in A. millepora is easier to
obtain. For P. damicornis and S. hystrix, both approaches can be addressed nicely using CRM.
For P. damicornis samples, crystal orientation could be visualized nicely (Figure A 11; Appedix)
however fluorescence intensity scans did not result in good distribution maps compared to
scans of S. hystrix skeletons.
Comparing both the fluorescence intensity distribution scans as well as the relative
crystallographic orientation of the different species, no significant differences were found.
Possible reasons may include, that patterns of organic compounds are more difficult to find in
some species than for others, for example A. millepora and S. hystrix skeletons are structurally
more complex than Porites lutea which is used in a study showing distinctive patterns for the
distribution of organic compounds inside the skeleton (Wall and Nehrke, 2012). CRM analyses
of other marine biogenic carbonate organisms also resulted in positive and distinct findings
(Nehrke and Nouet, 2011).

Results and Discussion
44
One approach to obtain information on the type of organic compounds in coral
skeletons are Raman point measurements (Wall and Nehrke, 2012). Measurements were
performed in areas with high and low fluorescence of skeletons from control and seep sites to
investigate differences in the spectra of areas indicating high organic content (high
fluorescence intensity). Differences in peak position or peak intensity may hint to different
types or different amounts of organic compounds within the scanned area. Raman spectra
were obtained with an integration time of 6 seconds and 10 accumulations. Figure 3.2.4 shows
an example of the obtained Raman spectra.
Figure 3.2.4 Example of a Raman point measurement of S. hystrix powdered skeleton (control site) showing aragonite lattice peaks and indications of peaks corresponding to CH-bands (~2800-3000) and OH-bands (~3250-3550).
Raman spectra show high resemblance among all coral species from both control and
see site. All scans result in the spectral lines attributed to aragonite which is identified based
on two lattice modes (translation and liberation mode) and two vibration modes (C-O
symmetric stretch and in-plane bend). Additionally two smaller peaks corresponding to CH-
bands (2850-3080 cm-1) and OH-groups (3200-3400 cm-1) can be detected (Figure 3.2.4)
(Jolivet et al., 2008; Perrin and Smith, 2007). Both CH- and OH-groups are common
constituents of organic compounds and the obtained peaks hint to their existence in the
scanned area. No significant difference in terms of peak intensity or position was found

Results and Discussion
45
between high intensity fluorescent parts and low intensity fluorescent parts of the skeleton or
between samples from control and seep sites. Additionally, the comparison of Raman point
measurements from different species did not show distinctive changes.
No differences between corals from control and seep sites could be obtained in the
course of this analysis. Evaluating the results, it can either be said that no differences are
present between samples from control and seep site or that existing differences are simply too
small to be detected by the selected analytical method.
3.3 Aragonite conversion
The main aim of the TGA measurements performed in this study was the determination
of the weight losses that occur during heating of coral samples in order to obtain information
on the amount of hydrated organic matrix inside the aragonite skeletons. However, another
interesting feature that can be investigated is the aragonite to calcite transformation. The
motivation for investigating the transformation behavior within the framework of this study is
related to the observation that biogenic aragonite is mechanically tougher than inorganic
aragonite (Sellinger et al., 1998). This is hypothesized to be caused by organic molecules within
the biogenic aragonite which exert a considerable tensile stress on the calcium carbonate
skeleton (Zolozoyabko and Pokroy, 2007).
Aragonite is a metastable form of CaCO3 and is known to transform to calcite around 450
°C ((Brown et al., 1962; Wardecki et al., 2008). Several studies indicate, that biogenic aragonite
starts conversion to calcite at lower temperatures than inorganic aragonite (Antao and Hassan,
2010; Dauphin et al., 2006; Wardecki et al., 2008) even though biogenic aragonite is considered
mechanically tougher than mineral aragonite. This too could be explained by the organic
compounds embedded in the calcium carbonate skeleton. For powdered samples they are
assumed to be close to the grain surface and therefore easily released during heating, which
may facilitate or catalyze aragonite conversion. Assuming that the amount of organic
compounds inside coral skeletons differs between samples from high CO2 and low CO2 sites,
the tensile stress on the aragonite skeleton could be influenced as well. Such alterations may
be revealed in the temperature of conversion from aragonite to calcite, expecting samples with
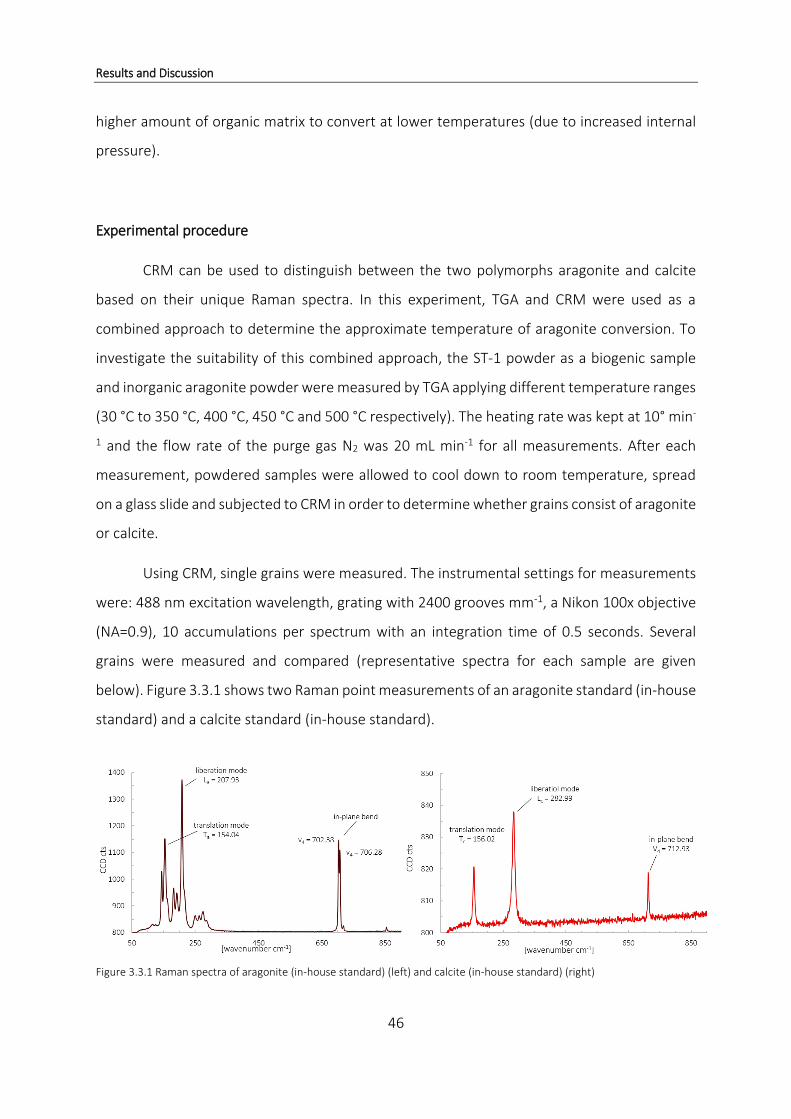
Results and Discussion
46
higher amount of organic matrix to convert at lower temperatures (due to increased internal
pressure).
Experimental procedure
CRM can be used to distinguish between the two polymorphs aragonite and calcite
based on their unique Raman spectra. In this experiment, TGA and CRM were used as a
combined approach to determine the approximate temperature of aragonite conversion. To
investigate the suitability of this combined approach, the ST-1 powder as a biogenic sample
and inorganic aragonite powder were measured by TGA applying different temperature ranges
(30 °C to 350 °C, 400 °C, 450 °C and 500 °C respectively). The heating rate was kept at 10° min-
1 and the flow rate of the purge gas N2 was 20 mL min-1 for all measurements. After each
measurement, powdered samples were allowed to cool down to room temperature, spread
on a glass slide and subjected to CRM in order to determine whether grains consist of aragonite
or calcite.
Using CRM, single grains were measured. The instrumental settings for measurements
were: 488 nm excitation wavelength, grating with 2400 grooves mm-1, a Nikon 100x objective
(NA=0.9), 10 accumulations per spectrum with an integration time of 0.5 seconds. Several
grains were measured and compared (representative spectra for each sample are given
below). Figure 3.3.1 shows two Raman point measurements of an aragonite standard (in-house
standard) and a calcite standard (in-house standard).
Figure 3.3.1 Raman spectra of aragonite (in-house standard) (left) and calcite (in-house standard) (right)

Results and Discussion
47
Both standards show the typical peaks for the respective calcium carbonate polymorph.
Aragonite is characterized by distinctive peaks in translation mode (Ta = 105.04 cm-1) and
liberation mode (La = 207.93 cm-1). Additionally, a double peak (v4 = 702.38 cm-1 and v4 = 706.28
cm-1) represents the in-plane bending in vibration mode of aragonite. Typical calcite peaks are
present at 156.02 cm-1 (translation mode (Tc)) and 282.99 cm-1 (liberation mode (Lc)). The in-
plane bend is represented by a single peak at 712.93 cm-1 (v4). The following figures show the
Raman spectra of powder grains after continuous heating during TGA measurements until
different temperatures (Figure 3.3.2, Figure 3.3.3, Figure 3.3.4 and Figure 3.3.5). The calcium
carbonate polymorph of the measured grains is determined based on the scans obtained from
aragonite and calcite standard samples (Figure 3.3.1).
Figure 3.3.2 Raman spectra of powder after heating until 350 °C (+0.5 h) left: ST-1 right: inorganic aragonite
Figure 3.3.2 shows examples of Raman scans of ST-1 powder (left) and inorganic
aragonite powder (right) after heating to 350 °C followed by an isothermal segment at 350 °C
for 30 minutes. In both spectra typical aragonite peaks can be observed, indicating that at 350
°C, conversion is not in process yet and both the biogenic and inorganic sample are still
aragonite.
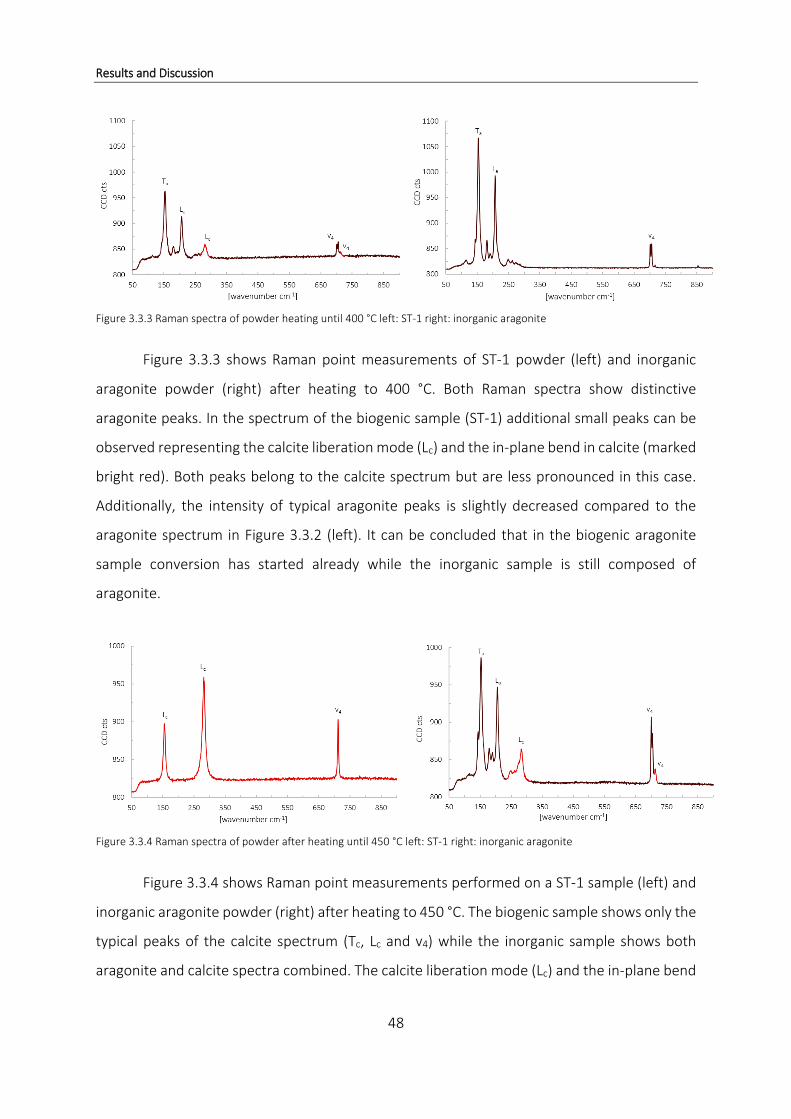
Results and Discussion
48
Figure 3.3.3 Raman spectra of powder heating until 400 °C left: ST-1 right: inorganic aragonite
Figure 3.3.3 shows Raman point measurements of ST-1 powder (left) and inorganic
aragonite powder (right) after heating to 400 °C. Both Raman spectra show distinctive
aragonite peaks. In the spectrum of the biogenic sample (ST-1) additional small peaks can be
observed representing the calcite liberation mode (Lc) and the in-plane bend in calcite (marked
bright red). Both peaks belong to the calcite spectrum but are less pronounced in this case.
Additionally, the intensity of typical aragonite peaks is slightly decreased compared to the
aragonite spectrum in Figure 3.3.2 (left). It can be concluded that in the biogenic aragonite
sample conversion has started already while the inorganic sample is still composed of
aragonite.
Figure 3.3.4 Raman spectra of powder after heating until 450 °C left: ST-1 right: inorganic aragonite
Figure 3.3.4 shows Raman point measurements performed on a ST-1 sample (left) and
inorganic aragonite powder (right) after heating to 450 °C. The biogenic sample shows only the
typical peaks of the calcite spectrum (Tc, Lc and v4) while the inorganic sample shows both
aragonite and calcite spectra combined. The calcite liberation mode (Lc) and the in-plane bend
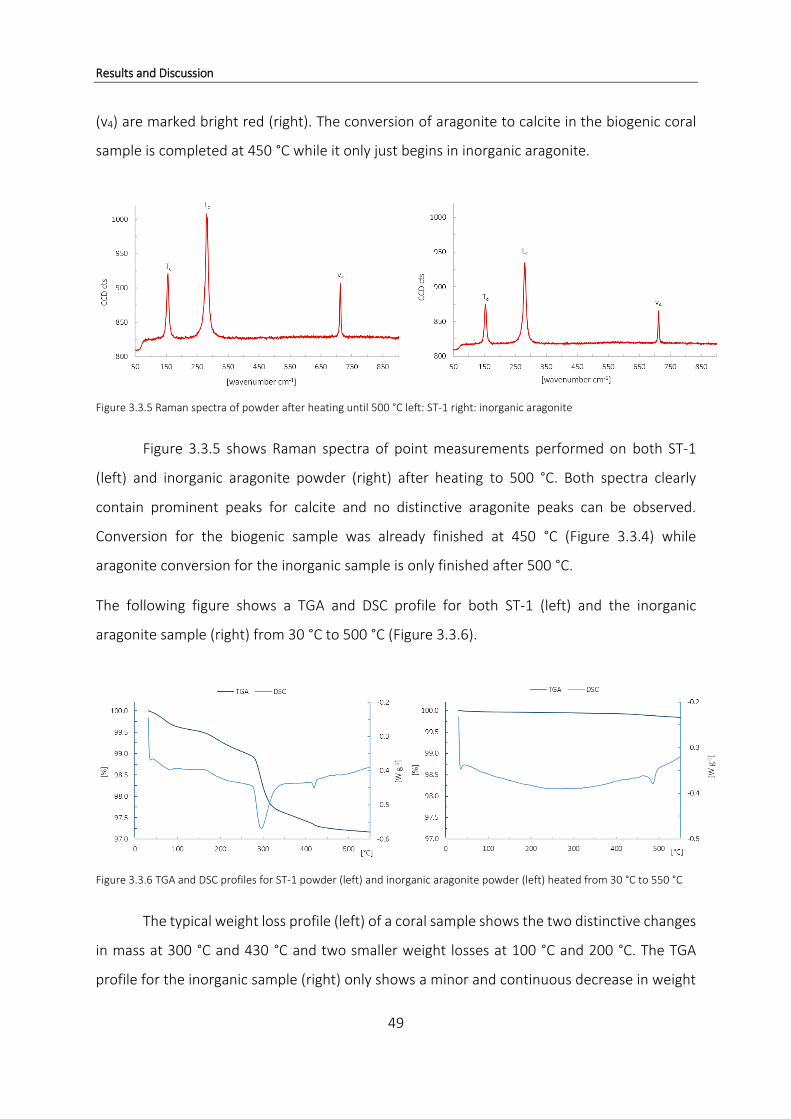
Results and Discussion
49
(v4) are marked bright red (right). The conversion of aragonite to calcite in the biogenic coral
sample is completed at 450 °C while it only just begins in inorganic aragonite.
Figure 3.3.5 Raman spectra of powder after heating until 500 °C left: ST-1 right: inorganic aragonite
Figure 3.3.5 shows Raman spectra of point measurements performed on both ST-1
(left) and inorganic aragonite powder (right) after heating to 500 °C. Both spectra clearly
contain prominent peaks for calcite and no distinctive aragonite peaks can be observed.
Conversion for the biogenic sample was already finished at 450 °C (Figure 3.3.4) while
aragonite conversion for the inorganic sample is only finished after 500 °C.
The following figure shows a TGA and DSC profile for both ST-1 (left) and the inorganic
aragonite sample (right) from 30 °C to 500 °C (Figure 3.3.6).
Figure 3.3.6 TGA and DSC profiles for ST-1 powder (left) and inorganic aragonite powder (left) heated from 30 °C to 550 °C
The typical weight loss profile (left) of a coral sample shows the two distinctive changes
in mass at 300 °C and 430 °C and two smaller weight losses at 100 °C and 200 °C. The TGA
profile for the inorganic sample (right) only shows a minor and continuous decrease in weight

Results and Discussion
50
as it contains neither organic compounds nor water bound to the matrix. In the heat flow
profile of the inorganic sample (right) we can see a distinct negative peak at ~470 °C indicating
an endothermic reaction. This most likely indicates the conversion of aragonite to calcite as no
mass is lost during the reaction. The observed temperature fits with the results obtained by
Raman point measurements, stating that conversion only starts at ~450 °C and is finished by
500 °C (Figure 3.3.4). The DSC profile of the biogenic sample (left) shows two endothermic
reactions one around 300 °C accounting for the main weight loss during TGA and another one
at about 430 °C related to the smaller weight loss at this temperature. No additional peaks are
observed in the heat flow profile around 400 °C. The temperature of 430 °C fits with results
obtained by Raman point measurements, therefore the second endothermic peak in the heat
flow profile most likely indicates the conversion of aragonite to calcite. Since both aragonite
conversion and weight loss in the biogenic sample seem to take place at the same time and
temperature, the correlating peaks are superimposed and not distinguishable.
Figure 3.3.7 shows the IR signals for H2O and CO2 of ST-1 powder during heating to 550 °C
(from Mettler Toledo).
Figure 3.3.7 IR signal for H2O and CO2 of ST-1 powder gradually heated to 550 °C (see Figure 3.1.5)
The IR H2O signal shows four water releases which are in agreement with the four
weight losses that occur during TGA (Figure 3.3.6). The IR CO2 signal indicates a rather

Results and Discussion
51
continuous release of CO2 throughout the TGA measurement with increased absorbance at
300 °C and 430 °C. The highest CO2 release occurs at 430 °C and after 550 °C when calcium
carbonate decomposition to CaO starts. CO2 releases at 430 °C could be explained by the
conversion of aragonite to calcite. During the process of conversion, organic compounds that
may have been retained by the skeleton at lower temperatures can be released from the
calcium carbonate skeleton as its polymorph changes.
Biogenic samples are assumed to start conversion to calcite at lower temperatures due
to nanosized crystals and a poor crystallization compared to well-crystallized sedimentary
aragonite samples (Antao and Hassan, 2010). This fits with the findings of TGA and CRM
analyses. In other studies however, the conversion for biogenic powdered samples was
determined to occur at much lower temperatures than 430 °C. Conversion of aragonite to
calcite was found to be associated with the main weight loss and water release at 280 °C
(Wardecki et al., 2008) which does not fit with results obtained in this study. Possible reasons
for discrepancies could lie within the different species used to obtain powdered calcium
carbonate. Wardecki et al. used Desmophyllum samples (Wardecki et al., 2008) while in this
study Pocillopora standard ST-1 was used. Also, the heating method as well as the heating rate
differed, 2.5° min-1 in contrast to 10° min-1 in this study.
Biogenic aragonite samples are assumed to be mechanically more stable than
sedimentary aragonite samples due to an internal pressure exhibited by organic compounds
between the crystals. For powdered samples organic inclusions are assumed to lie close to the
grain surface, therefore able to easily evaporate and provide less stability (Wardecki et al.,
2008). Therefore, differences in grain size may also play an important role and affect the results
for temperature of conversion and sample preparation has to be taken into account during
evaluation.
A slow transition into the conversion of aragonite however may start at lower
temperatures than 430 °C in biogenic samples. CRM does not allow the acquisition of
quantitative data and aragonite-calcite ratios since the scanning of small grains may not be
representative for the whole sample. However, heat flow profiles of biogenic samples do not
depict an additional endothermic reaction and the conversion is very likely to occur at 430 °C.

Results and Discussion
52
The lower conversion temperature for the biogenic sample (430 °C) compared to the inorganic
sample (470 °C) may be due to the release of water from the skeleton occurring around 430
°C (see Figure 3.3.7). The release of water from the coral skeleton at this temperature could
enable aragonite conversion in biogenic aragonite at lower temperatures.
Examining the obtained results it can be concluded, that a combination of TGA and CRM
is a suitable method to determine an approximate temperature for aragonite conversion. In
the course of this study only the suitability of the method was examined. Due to lack of time it
was not possible to perform measurements with coral samples from Papua New Guinea. The
method may help in determining possible differences in the temperature of aragonite
conversion between coral samples from control and seep sites which may result from
differences in amount and type of organic compounds in coral skeletons. Furthermore, it could
reveal additional species specific differences, however the sensibility of this analytical method
is rather low and only approximate temperatures can be determined. Small differences may
not be noticed due to the imprecision of this approach. The accuracy of results can be
enhanced by using smaller temperature steps between different measurements (here 50 °C
were used).
When organic compounds are released during heating, the morphology of calcium
carbonate powder is likely to be changed. In order to get a small insight into how the
morphology of powdered coral skeleton changes during heating, ST-1 samples were examined
via Scanning Electron Microscopy after TGA measurements to different temperatures (Figure
3.3.8).

Results and Discussion
53
Figure 3.3.8 SEM images of ST-1 powder: pre-heating (left column); after 450 °C (middle column); after 900 °C (right column)
Figure 3.3.8 shows ST-1 powder before heating (left column) and after heating to 450 °C
(middle column) and 900 °C (right column) at different magnifications. Prior to heating the
grains show a rather irregular appearance with rough edges and an uneven surface. After 450
°C they still seem rather irregularly shaped with no smooth surface but edges appear softened.
After 900 °C the grains look like they are made up of numerous evenly shaped small grains with
a smooth surface and almost spherical appearance.

Conclusion
54
4 Conclusion
The results obtained in this study show that the amount of hydrated organic matrix in coral
skeleton differs between the studied species but not significantly between samples from low
CO2 and high CO2 sites in Papua New Guinea. TGA analyses show that most of the hydrated
organic matrix in coral skeletons is volatilized at 300 °C and 430 °C. Small amounts of organic
material may remain retained in the coral skeleton until temperatures above 550 °C and are
only released during calcium carbonate thermal dissociation. TGA results are influenced by
numerous factors such as heating rate, sample preparation and texture and the choice of purge
gas. Therefore, the amount of organic matrix in coral skeletons obtained in previous TGA
studies requires confirmation through complementary analysis under thoroughly controlled
conditions.
Coral species have unique profiles, however with a similar pattern, which raises the
question whether other biogenic aragonites have similar profiles as well or differ completely.
TGA in combination with CRM is a suitable method to determine the approximate
temperature of aragonite to calcite conversion which starts at lower temperatures in biogenic
coral samples (~430 °C) compared to inorganic aragonite (~450 °C). Possible differences in
conversion temperature due to structural diversities or different amounts of organic matrix in
coral skeletons may be indicative of environmental conditions and should be further
investigated.
Organic compounds are hypothesized to play a crucial role in biomineralization of corals
as is the case for other exoskeletal organisms and should be characterized by a combination of
TGA-IR/-MS among other methods. Additional information on coral samples from Papua New
Guinea may provide insights into processes allowing corals to grow and coral reefs to persist
in high CO2 and low pH environments expected in future ocean acidification scenarios.

55
References
Allemand, D., Ferrier-Pagès, C., Furla, P., Houlbrèque, F., Puverel, S., Reynaud, S., Tambutté, É., Tambutté, S. and Zoccola, D.: Biomineralisation in reef-building corals: From molecular mechanisms to environmental control, Comptes Rendus - Palevol, 3(6-7 SPEC.ISS.), 453–467, 2004
Allemand, D., Tambutté, É., Zoccola, D. and Tambutté, S.: Coral calcification, cells to reefs, in Coral reefs: an ecosystem in transition, edited by Z. Dubinsky and N. Stambler, pp. 119–150, Springer., 2011.
Antao, S. M. and Hassan, I.: Temperature dependence of the structural parameters in the transformation of aragonite to calcite, as determined from in situ synchrotron powder X-ray-diffraction data, Can. Mineral., 48(5), 1225–1236, 2010.
Atkinson, M. J. and Cuet, P.: Possible effects of ocean acidification on coral reef biogeochemistry: Topics for research, Mar. Ecol. Prog. Ser., 373, 249–256, 2008.
Barkley, H. C., Cohen, A. L., Golbuu, Y., Starczak, V. R., Decarlo, T. M. and Shamberger, K. E. F.: Changes in coral reef communities across a natural gradient in seawater pH, , (June), 1–7, 2015.
Bernstein, L., Bosch, P., Canziani, O., Chen, Z., Christ, R., Davidson, O., Hare, W., Huq, S., Karoly, D., Kattsov, V., Kundzewicz, Z., Liu, J., Lohmann, U., Manning, M., Matsuno, T., Menne, B., Metz, B., Mirza, M., Nicholls, N., Nurse, L., Pachauri, R., Palutikof, J., Parry, M., Qin, D., Ravindranath, N., Reisinger, A., Ren, J., Riahi, K., Rosenzweig, C., Rusticucci, M., Sch-Neider, S., Sokona, Y., Solomon, S., Stott, P., Stouffer, R., Sugiyama, T., Swart, R., Tirpak, D., Vogel, C., Yohe, G., Nottage, R. and Madan, P.: Climate Change 2007 Synthesis Report The Core Writing Team Rajendra K. Pachauri Andy Reisinger Synthesis Report Chairman Head, Technical Support Unit IPCC IPCC Synthesis Report, IPCC Core Writing Team Technical Support Unit for the Synthesis Report., 2007.
Brown, W. H., Fyfe, W. S. and Turner, F. J.: Aragonite in california glaucophane schists, and the kinetics of the aragonite - calcite transformation, J. Petrol., 3(3), 566–582, 1962.
Castillo, K. D., Ries, J. B., Bruno, J. F. and Westfield, I. T.: The reef-building coral Siderastrea siderea exhibits parabolic responses to ocean acidification and warming., Proc. R. Soc. B Biol. Sci., 281(1797), 2014.
Clode, P. L., Lema, K., Saunders, M. and Weiner, S.: Skeletal mineralogy of newly settling Acropora millepora (Scleractinia) coral recruits, Coral Reefs, 30(1), 1–8, 2011.
Cohen, a L. and McConnaughey, T. a: Geochemical perspectives on coral mineralization, Biomineralization, 54(Smith), 151–187, 2003.

56
Cohen, A. L., McCorkle, D. C., De Putron, S., Gaetani, G. a. and Rose, K. a.: Morphological and compositional changes in the skeletons of new coral recruits reared in acidified seawater: Insights into the biomineralization response to ocean acidification, Geochemistry, Geophys. Geosystems, 10(7), 2009.
Constantz, B. and Weiner, S.: Acidic macromolecules associated with the mineral phase of scleractinian coral skeletons, J. Exp. Zool., 248(3), 253–258, 1988.
Crook, E. D., Cohen, A. L., Rebolledo-Vieyra, M., Hernandez, L. and Paytan, A.: Reduced calcification and lack of acclimatization by coral colonies growing in areas of persistent natural acidification., Proc. Natl. Acad. Sci. U. S. A., 110(27), 11044–9, 2013.
Cuif, J. P., Dauphin, Y., Berthet, P. and Jegoudez, J.: Associated water and organic compounds in coral skeletons: Quantitative thermogravimetry coupled to infrared absorption spectrometry, Geochemistry, Geophys. Geosystems, 5(11), 1–9, 2004.
Daly, M., Fautin, D. G. and Cappola, V. a: Systematics of the Hexacorallia (Cnidaria:Anthozoa), Zool. J. Linn. Soc., 139, 419–437, 2003.
Dauphin, Y., Cuif, J. P. and Massard, P.: Persistent organic components in heated coral aragonitic skeletons-Implications for palaeoenvironmental reconstructions, Chem. Geol., 231(1-2), 26–37, 2006.
De’ath, G., Fabricius, K. and Lough, J.: Yes - Coral calcification rates have decreased in the last twenty-five years!, Mar. Geol., 346, 400–402, 2013.
Doney, S. C., Fabry, V. J., Feely, R. a and Kleypas, J. a: Ocean acidification: the other CO2
problem., Ann. Rev. Mar. Sci., 1, 169–192, 2009.
Everall, N.: Depth Profiling With Confocal Raman microscopy is one of the techniques of choice for investigating heterogeneous sys-, Spectroscopy, 19(11), 16–24, 2004.
Fabricius, K. E., Langdon, C., Uthicke, S., Humphrey, C., Noonan, S., De’ath, G., Okazaki, R., Muehllehner, N., Glas, M. S. and Lough, J. M.: Losers and winners in coral reefs acclimatized to elevated carbon dioxide concentrations, Nat. Clim. Chang., 1(3), 165–169, 2011.
Falini, G., Reggi, M., Fermani, S., Sparla, F., Goffredo, S., Dubinsky, Z., Levi, O., Dauphin, Y. and Cuif, J. P.: Control of aragonite deposition in colonial corals by intra-skeletal macromolecules, J. Struct. Biol., 183(2), 226–238, 2013.
Feely, R. a, Sabine, C. L., Lee, K., Berelson, W., Kleypas, J., Fabry, V. J., Millero, F. J. and Anonymous: Impact of anthropogenic CO2 on the CaCO3 system in the oceans, Science (80-. )., 305(5682), 362–366, 2004.

57
Fitzer, S. C., Cusack, M., Phoenix, V. R. and Kamenos, N. a.: Ocean acidification reduces the crystallographic control in juvenile mussel shells, J. Struct. Biol., 188(1), 39–45, 2014.
Gattuso, J. P., Frankignoulle, M., Bourge, I., Romaine, S. and Buddemeier, R. W.: Effect of calcium carbonate saturation of seawater on coral calcification, Glob. Planet. Change, 18(1-2), 37–46, 1998.
Goffredo, S., Vergni, P., Reggi, M., Caroselli, E., Sparla, F., Levy, O., Dubinsky, Z. and Falini, G.: The skeletal organic matrix from Mediterranean coral Balanophyllia Europaea influences calcium carbonate precipitation, PLoS One, 6(7), 2011.
Haugan, P. M. and Drange, Effects of CO2 on the ocean environment, Energy Convers. Manag., 37(6-8), 1019–1022, 1996.
Holcomb, M., Cohen, A. L., Gabitov, R. I. and Hutter, J. L.: Compositional and morphological features of aragonite precipitated experimentally from seawater and biogenically by corals, Geochim. Cosmochim. Acta, 73(14), 4166–4179, 2009.
Jolivet, A., Bardeau, J. F., Fablet, R., Paulet, Y. M. and de Pontual, H.: Understanding otolith biomineralization processes: New insights into microscale spatial distribution of organic and mineral fractions from Raman microspectrometry, Anal. Bioanal. Chem., 392(3), 551–560, 2008.
Kamenos, N. a., Burdett, H. L., Aloisio, E., Findlay, H. S., Martin, S., Longbone, C., Dunn, J., Widdicombe, S. and Calosi, P.: Coralline algal structure is more sensitive to rate, rather than the magnitude, of ocean acidification, Glob. Chang. Biol., 19(12), 3621–3628, 2013.
Langdon, C. and Atkinson, M. J.: Effect of elevated pCO2 on photosynthesis and calcification of corals and interactions with seasonal change in temperature/ irradiance and nutrient enrichment, J. Geophys. Res. C Ocean., 110(9), 1–16, 2005.
Langdon, C., Takahashi, T., Sweeney, C., Chipman, D. and Atkinson, J.: rate of an experimental coral reef responds to manipulations in the concentrations of both CaCO3 , 14(2), 639–654, 2000.
Lowenstam, H. A. and Weiner, S.: On Biomineralization, Oxford University Press, New York., 1989.
Mann, S.: Biomineralization, Principles and Concepts in Bioinorganic Materials Chemistry, Oxford University Press., 2001.
Marubini, F. and Atkinson, M. J.: Effects of lowered pH and elevated nitrate on coral calcification, Mar. Ecol. Prog. Ser., 188, 117–121, 1999.
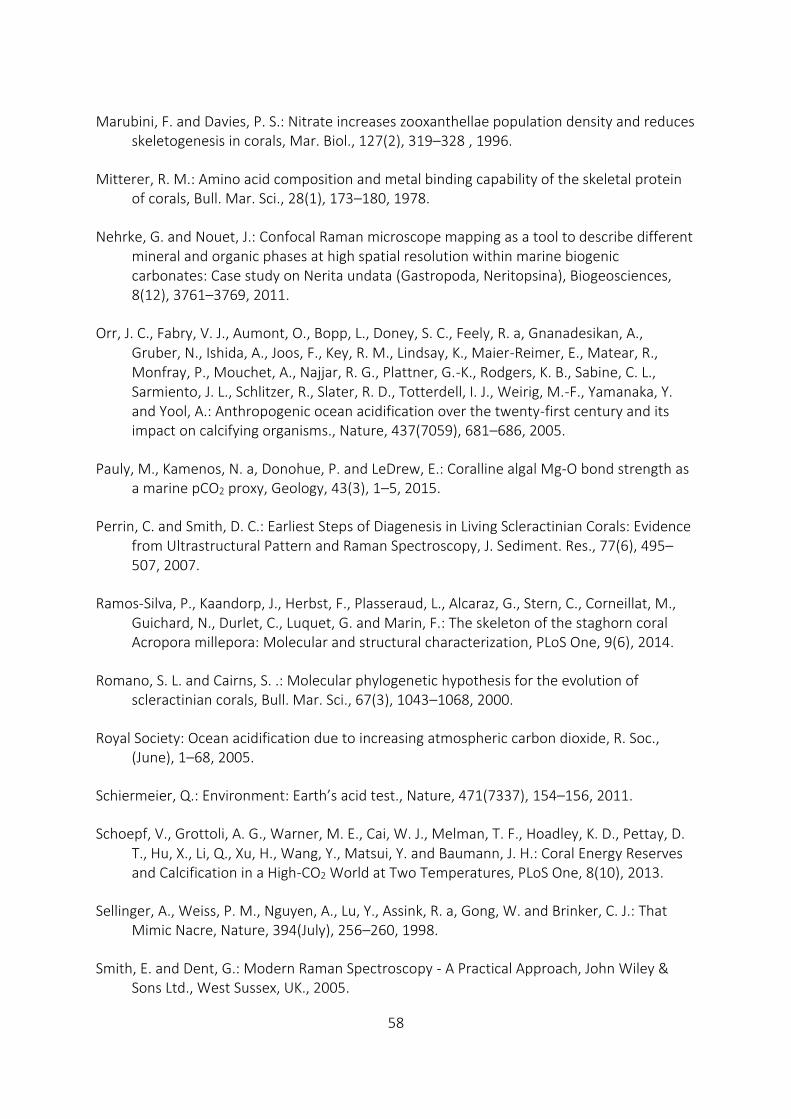
58
Marubini, F. and Davies, P. S.: Nitrate increases zooxanthellae population density and reduces skeletogenesis in corals, Mar. Biol., 127(2), 319–328 , 1996.
Mitterer, R. M.: Amino acid composition and metal binding capability of the skeletal protein of corals, Bull. Mar. Sci., 28(1), 173–180, 1978.
Nehrke, G. and Nouet, J.: Confocal Raman microscope mapping as a tool to describe different mineral and organic phases at high spatial resolution within marine biogenic carbonates: Case study on Nerita undata (Gastropoda, Neritopsina), Biogeosciences, 8(12), 3761–3769, 2011.
Orr, J. C., Fabry, V. J., Aumont, O., Bopp, L., Doney, S. C., Feely, R. a, Gnanadesikan, A., Gruber, N., Ishida, A., Joos, F., Key, R. M., Lindsay, K., Maier-Reimer, E., Matear, R., Monfray, P., Mouchet, A., Najjar, R. G., Plattner, G.-K., Rodgers, K. B., Sabine, C. L., Sarmiento, J. L., Schlitzer, R., Slater, R. D., Totterdell, I. J., Weirig, M.-F., Yamanaka, Y. and Yool, A.: Anthropogenic ocean acidification over the twenty-first century and its impact on calcifying organisms., Nature, 437(7059), 681–686, 2005.
Pauly, M., Kamenos, N. a, Donohue, P. and LeDrew, E.: Coralline algal Mg-O bond strength as a marine pCO2 proxy, Geology, 43(3), 1–5, 2015.
Perrin, C. and Smith, D. C.: Earliest Steps of Diagenesis in Living Scleractinian Corals: Evidence from Ultrastructural Pattern and Raman Spectroscopy, J. Sediment. Res., 77(6), 495–507, 2007.
Ramos-Silva, P., Kaandorp, J., Herbst, F., Plasseraud, L., Alcaraz, G., Stern, C., Corneillat, M., Guichard, N., Durlet, C., Luquet, G. and Marin, F.: The skeleton of the staghorn coral Acropora millepora: Molecular and structural characterization, PLoS One, 9(6), 2014.
Romano, S. L. and Cairns, S. .: Molecular phylogenetic hypothesis for the evolution of scleractinian corals, Bull. Mar. Sci., 67(3), 1043–1068, 2000.
Royal Society: Ocean acidification due to increasing atmospheric carbon dioxide, R. Soc., (June), 1–68, 2005.
Schiermeier, Q.: Environment: Earth’s acid test., Nature, 471(7337), 154–156, 2011.
Schoepf, V., Grottoli, A. G., Warner, M. E., Cai, W. J., Melman, T. F., Hoadley, K. D., Pettay, D. T., Hu, X., Li, Q., Xu, H., Wang, Y., Matsui, Y. and Baumann, J. H.: Coral Energy Reserves and Calcification in a High-CO2 World at Two Temperatures, PLoS One, 8(10), 2013.
Sellinger, A., Weiss, P. M., Nguyen, A., Lu, Y., Assink, R. a, Gong, W. and Brinker, C. J.: That Mimic Nacre, Nature, 394(July), 256–260, 1998.
Smith, E. and Dent, G.: Modern Raman Spectroscopy - A Practical Approach, John Wiley & Sons Ltd., West Sussex, UK., 2005.
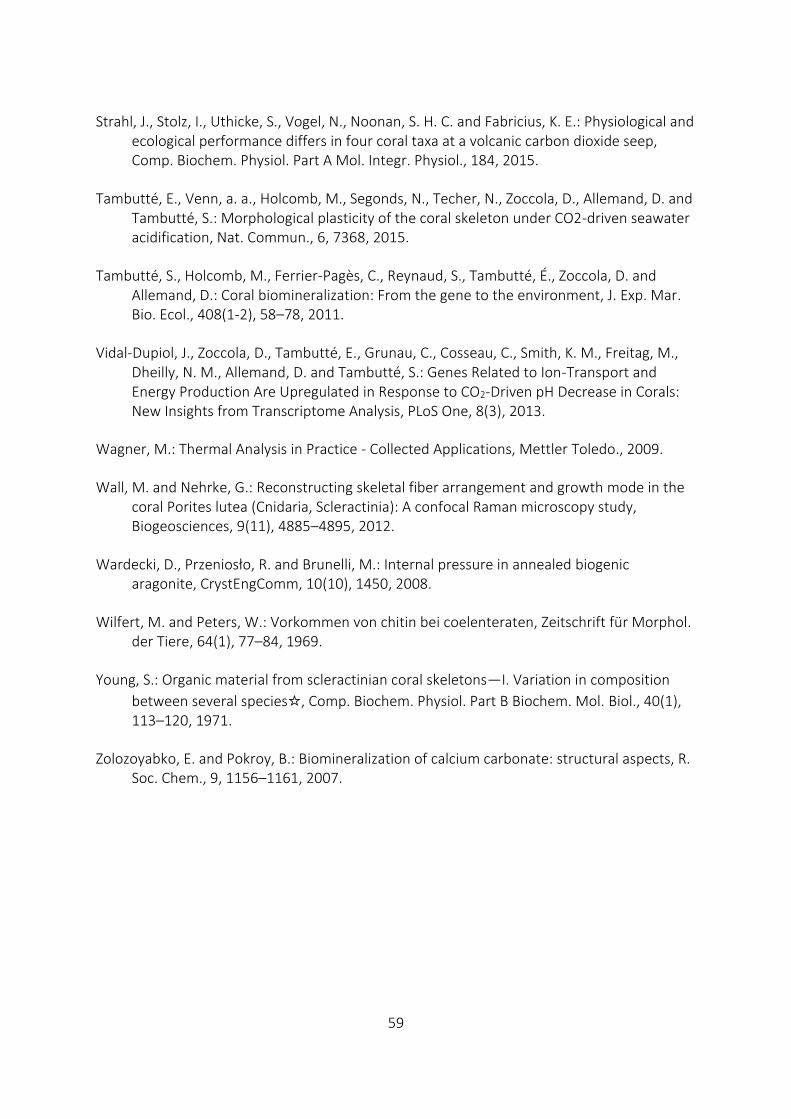
59
Strahl, J., Stolz, I., Uthicke, S., Vogel, N., Noonan, S. H. C. and Fabricius, K. E.: Physiological and ecological performance differs in four coral taxa at a volcanic carbon dioxide seep, Comp. Biochem. Physiol. Part A Mol. Integr. Physiol., 184, 2015.
Tambutté, E., Venn, a. a., Holcomb, M., Segonds, N., Techer, N., Zoccola, D., Allemand, D. and Tambutté, S.: Morphological plasticity of the coral skeleton under CO2-driven seawater acidification, Nat. Commun., 6, 7368, 2015.
Tambutté, S., Holcomb, M., Ferrier-Pagès, C., Reynaud, S., Tambutté, É., Zoccola, D. and Allemand, D.: Coral biomineralization: From the gene to the environment, J. Exp. Mar. Bio. Ecol., 408(1-2), 58–78, 2011.
Vidal-Dupiol, J., Zoccola, D., Tambutté, E., Grunau, C., Cosseau, C., Smith, K. M., Freitag, M., Dheilly, N. M., Allemand, D. and Tambutté, S.: Genes Related to Ion-Transport and Energy Production Are Upregulated in Response to CO2-Driven pH Decrease in Corals: New Insights from Transcriptome Analysis, PLoS One, 8(3), 2013.
Wagner, M.: Thermal Analysis in Practice - Collected Applications, Mettler Toledo., 2009.
Wall, M. and Nehrke, G.: Reconstructing skeletal fiber arrangement and growth mode in the coral Porites lutea (Cnidaria, Scleractinia): A confocal Raman microscopy study, Biogeosciences, 9(11), 4885–4895, 2012.
Wardecki, D., Przeniosło, R. and Brunelli, M.: Internal pressure in annealed biogenic aragonite, CrystEngComm, 10(10), 1450, 2008.
Wilfert, M. and Peters, W.: Vorkommen von chitin bei coelenteraten, Zeitschrift für Morphol. der Tiere, 64(1), 77–84, 1969.
Young, S.: Organic material from scleractinian coral skeletons—I. Variation in composition
between several species☆, Comp. Biochem. Physiol. Part B Biochem. Mol. Biol., 40(1), 113–120, 1971.
Zolozoyabko, E. and Pokroy, B.: Biomineralization of calcium carbonate: structural aspects, R. Soc. Chem., 9, 1156–1161, 2007.

60
Appendix
Figure A 1: average weight loss [%] between 30-550 °C for A. millepora from control and seep sites (C1-C11: control; S2-S10: seep); average weight loss and standard deviation were calculated from three replicates per sample
Figure A 2: average weight loss [%] between 30-550 °C for P. damicornis from control and seep sites (C1-C13: control; S1-S13: seep); average weight loss and standard deviation were calculated from three replicates per sample
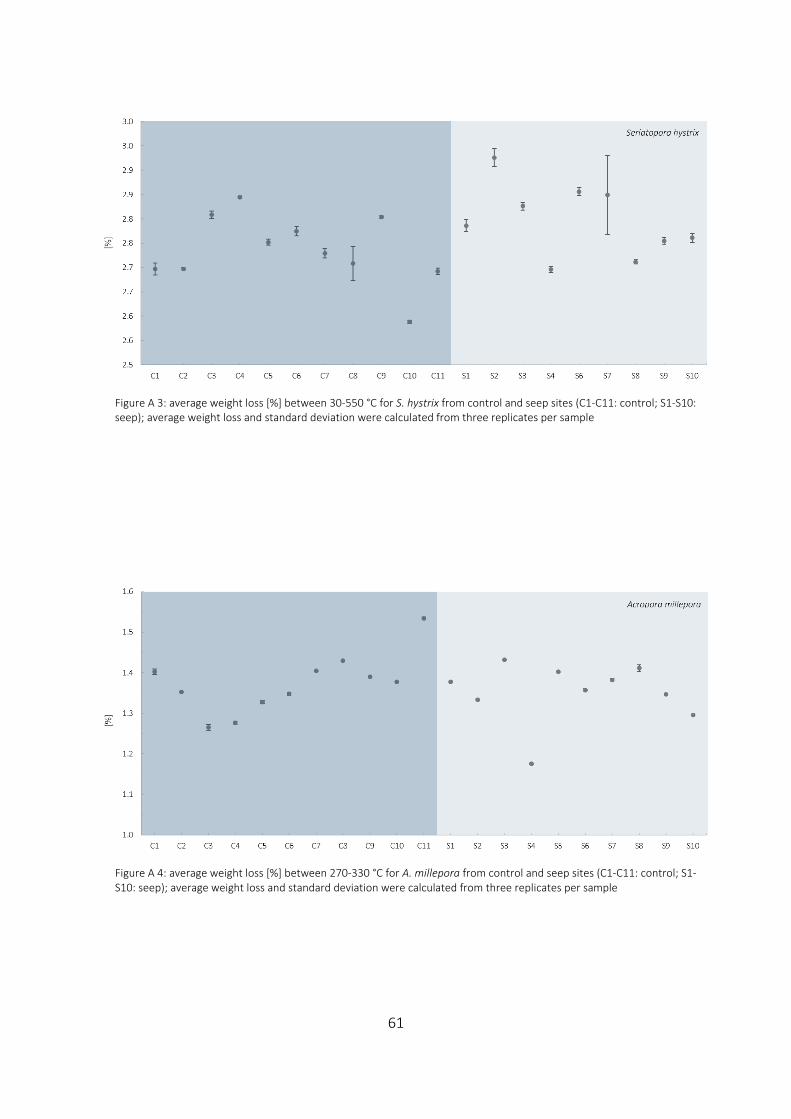
61
Figure A 3: average weight loss [%] between 30-550 °C for S. hystrix from control and seep sites (C1-C11: control; S1-S10: seep); average weight loss and standard deviation were calculated from three replicates per sample
Figure A 4: average weight loss [%] between 270-330 °C for A. millepora from control and seep sites (C1-C11: control; S1-S10: seep); average weight loss and standard deviation were calculated from three replicates per sample

62
Figure A 5: average weight loss [%] between 270-330 °C for P. damicornis from control and seep sites (C1-C13: control; S1-S13: seep); average weight loss and standard deviation were calculated from three replicates per sample
Figure A 6: average weight loss [%] between 270-330 °C for S. hystrix from control and seep sites (C1-C11: control; S1-S10: seep); average weight loss and standard deviation were calculated from three replicates per sample
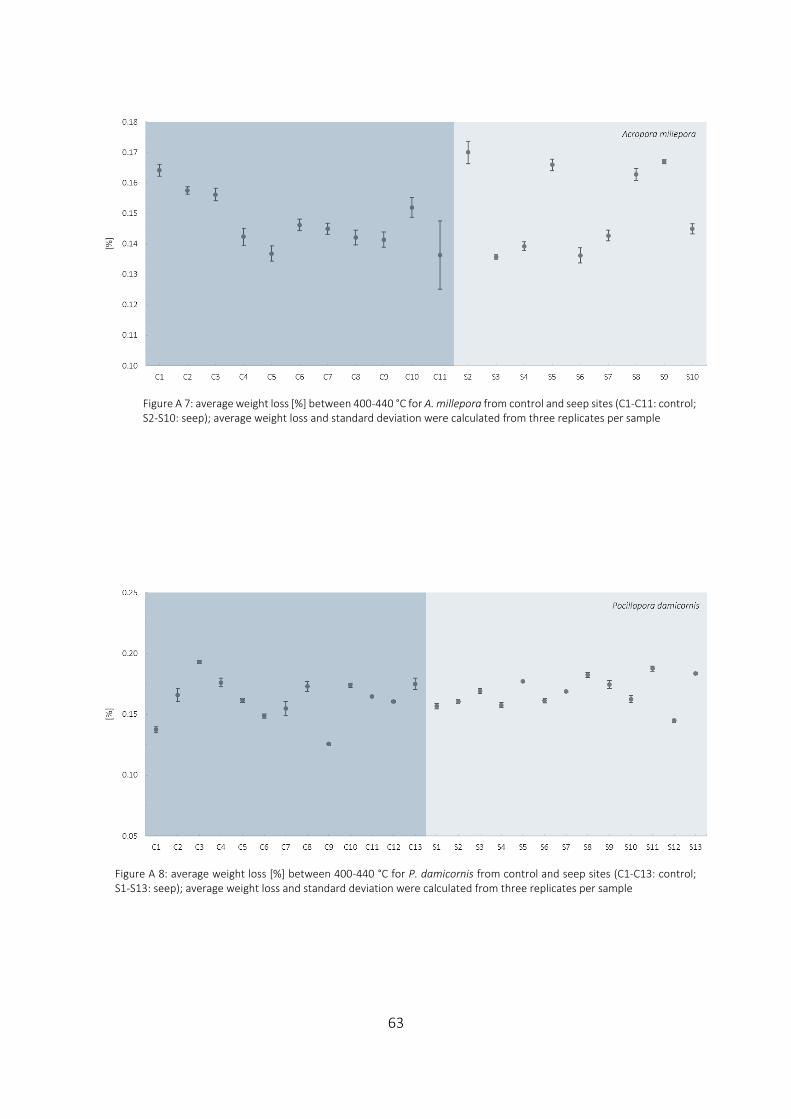
63
Figure A 7: average weight loss [%] between 400-440 °C for A. millepora from control and seep sites (C1-C11: control; S2-S10: seep); average weight loss and standard deviation were calculated from three replicates per sample
Figure A 8: average weight loss [%] between 400-440 °C for P. damicornis from control and seep sites (C1-C13: control; S1-S13: seep); average weight loss and standard deviation were calculated from three replicates per sample

64
Figure A 9: average weight loss [%] between 400-440 °C for S. hystrix from control and seep sites (C1-C11: control; S1-S10: seep); average weight loss and standard deviation were calculated from three replicates per sample
Figure A 10 A. millepora skeleton, left: confocal microscopy stitched image; right: Raman large area scan (red rectangle in stitched image) showing the intensity distribution of the aragonite lattice peak at 1085 cm-1 (symmetric stretch)

65
Figure A 11 P. damicornis skeleton: (a) confocal microscopy stitched image, (b) intensity distribution of aragonite symmetric stretch (1085 cm-1), (c) fluorescence intensity distribution (spectral range ~2400-2700 cm-1), (d) combined map (false color) calculated from the ratio of aragonite lattice peaks (translation mode ~153 cm-1 and liberation mode ~207 cm-1)

66
List of Figures
Figure 1.3.1 Schematic of a Thermogravimetric Analyzer (Mettler Toledo TGA/DCS 1): (1) baffle;
(2) reactive gas capillary; (3) gas outlet; (4) temperature sensors; (5) furnace
heater; (6) furnace temperature sensor; (7) adjustment ring weights; (8) protective
and purge gas connector; (9) thermostated balance chamber (from Mettler
Toledo) ........................................................................................................................ 6
Figure 1.3.2 Example of a TGA weight loss profile (dark blue) and a DSC heat flow profile (light
blue) from powdered coral skeleton (30 °C to 550 °C, heating rate: 10 °C min-1; gas
flow: 20mL N2 min-1) ................................................................................................... 8
Figure 1.3.3 Schematic of a Confocal Raman Microscope (WITec) (01) laser, (02) single mode
fiber, (03) objective, (04) scan table, (05) filter, (06) multi mode fiber, (07) lens
based spectroscopy system UHTS 300, (08) CCD detector, (09) white light
illumination, (10) z-stage for focusing (from WITec) .............................................. 10
Figure 2.3.1 Maps of Papua New Guinea showing Milne Bay Province and the location of the
study site (Upa-Upasina reef) (Fabricius et al., 2011) ............................................. 14
Figure 2.3.2 Volcanic CO2 seeps at Upa-Upasina Reef, Milne Bay. Picture a-c show seascapes of
the different sampling sites along the reef: (a) control site (pH: ~ 8.1), (b) and (c)
seep sites (pH: ~ 7.8). The map (bottom right) shows pH levels along the Upa-
Upasina reef by color and the approximate sampling locations are indicated by
letters a-c. (from Fabricius et al., 2011). ................................................................ 15
Figure 2.4.1 Coral species used in study ...................................................................................... 17
Figure 2.5.1 Coral skeletons after bleaching; A. millepora, P. damicornis, S. hystrix (from left to
right) .......................................................................................................................... 18
Figure 3.1.1 Example of TGA and DSC profiles of coral powder heated until 900 °C (left) and
until 550 °C (right)..................................................................................................... 19
Figure 3.1.2 Example of a TGA weight loss profile of a coral powder heated to 500 °C indicating
how weight losses were calculated. The red line indicates the step size and the
weight loss in %; red circles indicate the inflection point of a weight step ........... 20

67
Figure 3.1.3 TGA-weight loss (top) and DSC-heat flow (bottom) signal of ST-1 powder subjected
to different heating rates (increase in heating rate results in a shift of the curve to
the right; blue: 1 °,4 °,16 ° and 30 ° min-1; red: 2°,8°,20° and 40° min-1)............... 22
Figure 3.1.4 Polynomial fit (2nd order) for heating rate vs. onset of weight loss for ST-1 samples
................................................................................................................................... 23
Figure 3.1.5 TGA profile with first derivative curve (left) and IR signal (for H2O and CO2) (right)
of ST-1 powder gradually heated to 550 °C (heating rate 10° min-1)(a.u. – arbitrary
unit) ........................................................................................................................... 24
Figure 3.1.6 first derivative of TGA profile and IR H2O signal combined. Gray areas indicate
water releases (IR) and concurrent weight losses indicated in the first derivative curve (a.u. –
arbitrary unit) ................................................................................................................................ 26
Figure 3.1.7 TGA profile with first derivative curve (left) and MS signal (for mass number 17
and 18) (right) of ST-1 powder gradually heated to 550 °C (heating rate 10° min-1)
(a.u. – arbitrary unit) ................................................................................................ 27
Figure 3.1.8 Average weight loss (from 30 °C to 550 °C) in P. damicornis samples from control
and seep sites, bleached three times (Control; Seep) and four times (Control +;
Seep +) (three replicates for each sample, error bars represent standard deviation)
................................................................................................................................... 28
Figure 3.1.9 Averaged TGA curves showing profile differences between species. Bold lines
represent the averaged TGA curve for each species, shaded areas (same color)
represent the standard deviations of the respective curves (average and standard
deviations were obtained from all replicates of the respective species) .............. 30
Figure 3.1.10 average weight loss [%] between 270 °C and 330 °C of A. millepora, P. damicornis
and S. hystrix from both sites (error bars show the standard deviation of all samples
from one species at one site; average weight losses for each sample were
calculated from three replicates)............................................................................. 32
Figure 3.1.11 average weight loss [%] between 400 °C and 440 °C of A. millepora, P. damicornis
and S. hystrix from both sites (error bars show the standard deviation of all samples
from one species at one site; average weight losses for each sample were
calculated from three replicates)............................................................................. 33

68
Figure 3.1.12 average weight loss [%] between 30 °C and 550 °C of A. millepora, P. damicornis
and S. hystrix from both sites (error bars show the standard deviation of all samples
from one species at one site; average weight losses for each sample were
calculated from three replicates)............................................................................. 34
Figure 3.1.13 Loss of matter during decomposition; 550 °C to 900 °C; heating rates;
1°,2°,4°,8°,16°,20°,30° and 40° min-1 (two measurements each, only one for
heating rate 40° min-1, for inorganic aragonite sample 20° and 30° min-1 are
missing); left: ST-1, right: inorganic aragonite ........................................................ 38
Figure 3.1.14 Loss of matter during decomposition up to 900 °C for different coral samples
(three replicates each; coral samples are continuously numbered: C: control (dark
blue) S: seep (light blue); four samples were picked randomly from all available
samples (A. millepora: C6, C7, S9,S8; P. damicornis: C3, C10, S5, S10 ); left: N2
atmosphere (~100%), right: O2 atmosphere (~50% O2 + ~50% N2)) ........................ 39
Figure 3.2.1 S. hystrix skeleton, left: confocal microscopy stitched image; right: Raman large
area scan (red rectangle in stitched image), fluorescence intensity distribution
(spectral range ~2400-2700 cm-1) ............................................................................ 41
Figure 3.2.2 S. hystrix skeleton, left: confocal microscopy stitched image, right: map (false
color) calculated from the ratio of maps with intensity distribution of aragonite
lattice peaks (translation mode ~153 cm-1 and liberation mode at ~207 cm-1) ..... 41
Figure 3.2.3 S. hystrix skeleton (control): (a) confocal microscopy stitched image (b)
fluorescence intensity distribution (spectral range ~2400-2700 cm-1) (c) intensity
distribution of aragonite lattice peak (translation mode ~153 cm-1) (d) combined
map (false color) calculated from the ratio of aragonite lattice peaks (translation
mode ~153 cm-1 and liberation mode ~207 cm-1) ................................................... 42
Figure 3.2.4 Example of a Raman point measurement of S. hystrix powdered skeleton (control
site) showing aragonite lattice peaks and indications of peaks corresponding to CH-
bands (~2800-3000) and OH-bands (~3250-3550). ................................................. 44
Figure 3.3.1 Raman spectra of aragonite (in-house standard) (left) and calcite (in-house
standard) (right) ........................................................................................................ 46

69
Figure 3.3.2 Raman spectra of powder after heating until 350 °C (+0.5 h) left: ST-1 right:
inorganic aragonite ................................................................................................... 47
Figure 3.3.3 Raman spectra of powder heating until 400 °C left: ST-1 right: inorganic aragonite
................................................................................................................................... 48
Figure 3.3.4 Raman spectra of powder after heating until 450 °C left: ST-1 right: inorganic
aragonite ................................................................................................................... 48
Figure 3.3.5 Raman spectra of powder after heating until 500 °C left: ST-1 right: inorganic
aragonite ................................................................................................................... 49
Figure 3.3.6 TGA and DSC profiles for ST-1 powder (left) and inorganic aragonite powder (left)
heated from 30 °C to 550 °C .................................................................................... 49
Figure 3.3.7 IR signal for H2O and CO2 of ST-1 powder gradually heated to 550 °C (see Figure
3.1.5) .......................................................................................................................... 50
Figure 3.3.8 SEM images of ST-1 powder: pre-heating (left column); after 450 °C (middle
column); after 900 °C (right column) ....................................................................... 53
List of Tables
Table 2.3.1 Seawater parameters (medians) at study site (Upa-Upasina Reef) (from Fabricius et
al., 2011) .................................................................................................................... 15
Table 2.3.2 Seawater parameters (medians): elemental concentration at study site (Upa-
Upasina Reef) (from Fabricius et al., 2011) ............................................................. 16