Embed Size (px)
Citation preview
R E B E K A H M A R T I N 1 J O H N H A N E S I A K 1
A Y R T O N Z A D R A 2
R O N G O O D S O N 3
1 U n i v e r s i t y o f M a n i t o b a , 2 R P N - A , 3 E n v i r o n m e n t C a n a d a
Strong wind events in Iqaluit: model and observation
Outline
Motivation General synoptics of the northeasterly Model output and comparison Summary and conclusions
Motivation
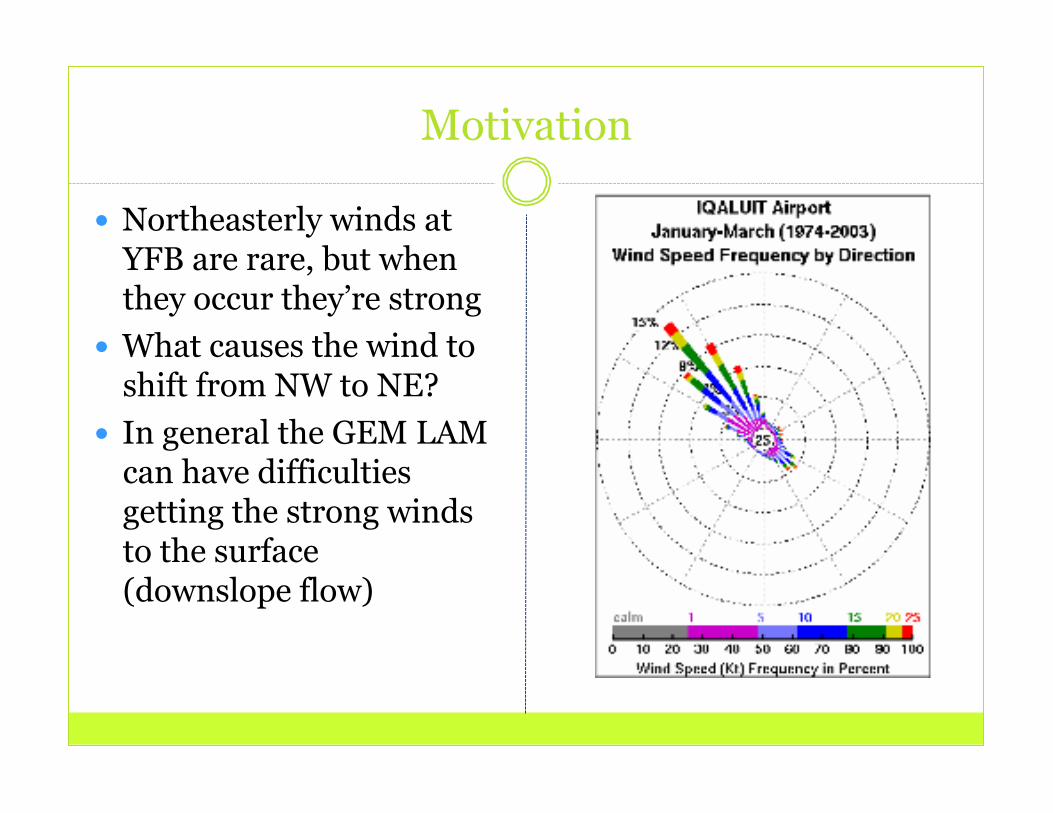
Northeasterly winds at YFB are rare, but when they occur they’re strong
What causes the wind to shift from NW to NE?
In general the GEM LAM can have difficulties getting the strong winds to the surface (downslope flow)

February 4, 2007 blizzard A significant severe weather event in February 2007 was a northeasterly storm.
Video from youtube: http://www.youtube.com/watch?v=esOa-w53e8o
Winds gusted to 130 km/h
Synoptic Overview
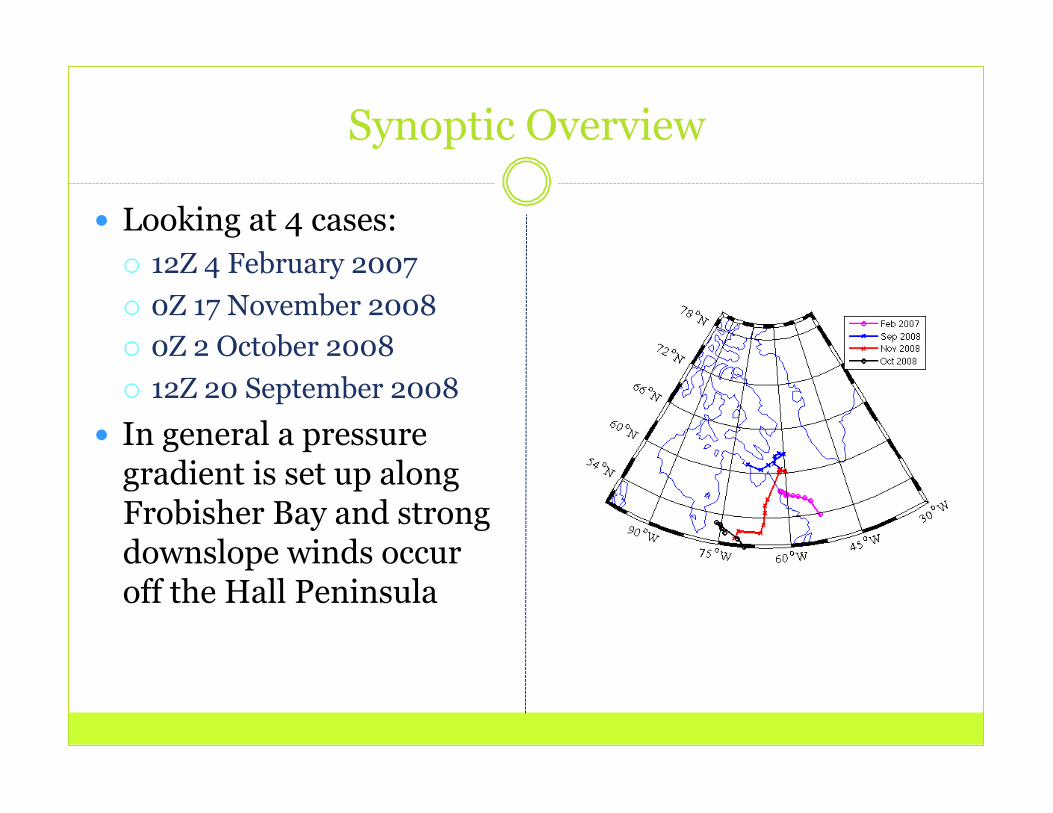
Looking at 4 cases: 12Z 4 February 2007 0Z 17 November 2008 0Z 2 October 2008 12Z 20 September 2008
In general a pressure gradient is set up along Frobisher Bay and strong downslope winds occur off the Hall Peninsula
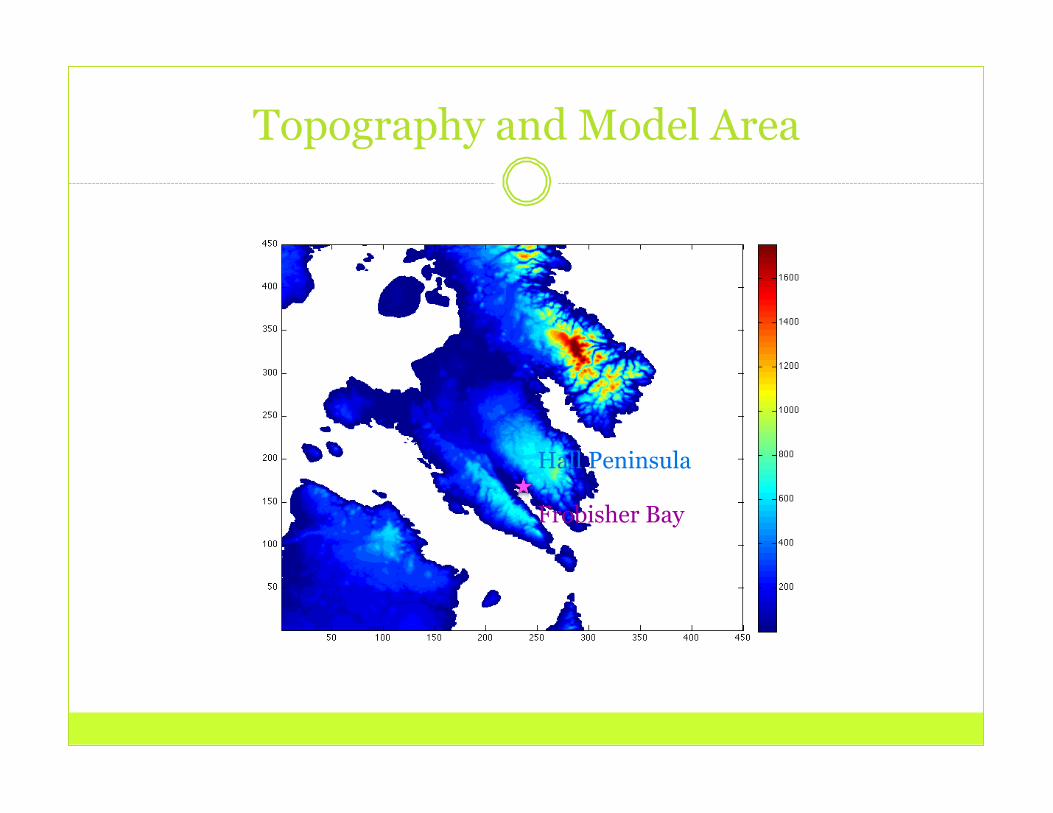
Topography and Model Area
Hall Peninsula
Frobisher Bay

February 2007 YFB Comparisons
12 18 00 06 12
Surface Pressure
Temperature
Wind Speed
Wind Direction
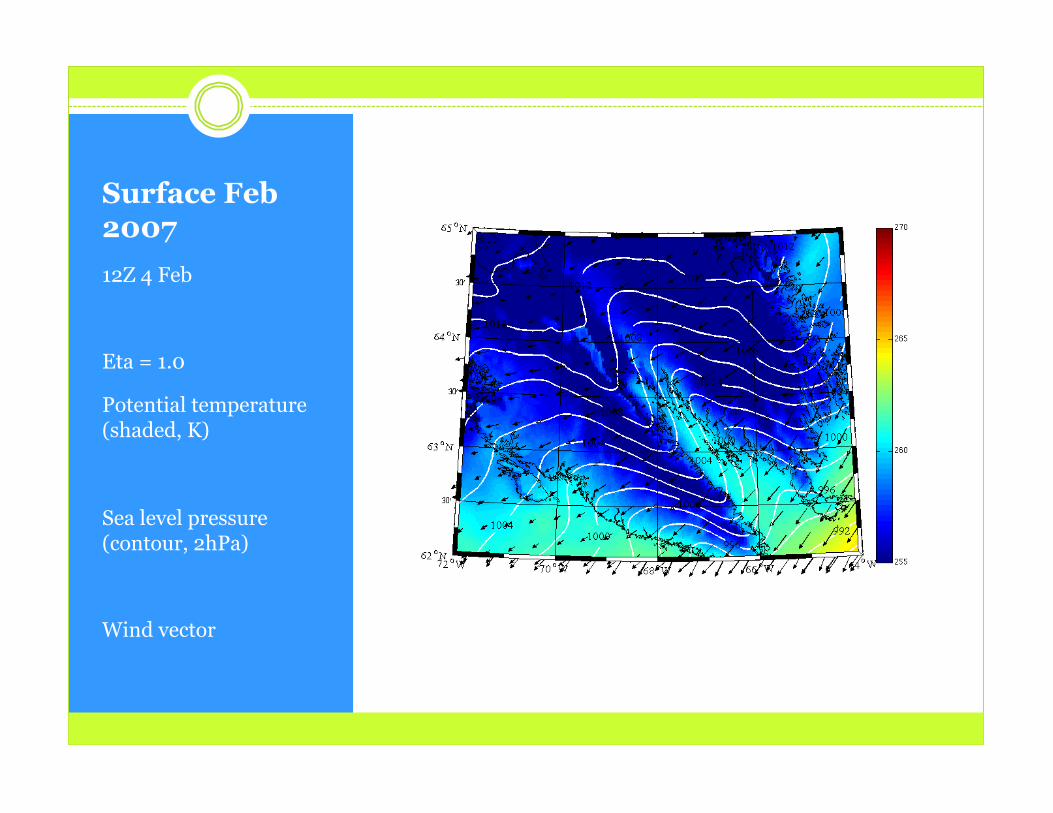
Surface Feb 2007 12Z 4 Feb
Eta = 1.0
Potential temperature (shaded, K)
Sea level pressure (contour, 2hPa)
Wind vector
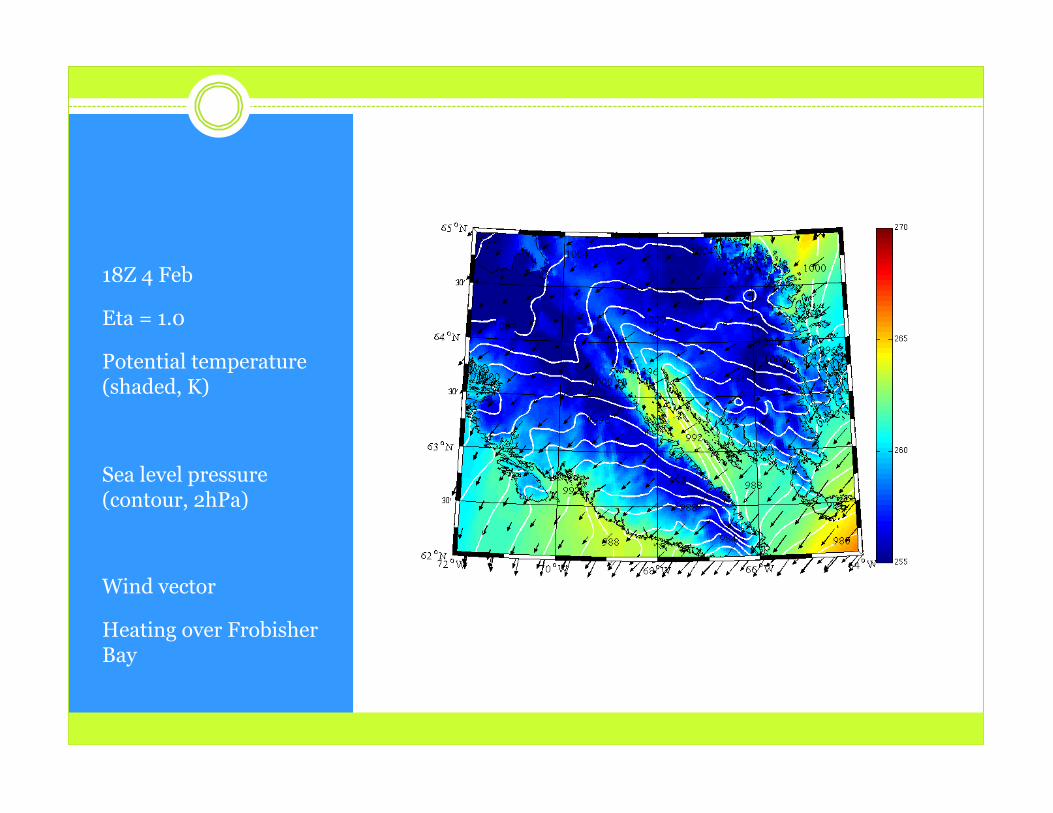
18Z 4 Feb
Eta = 1.0
Potential temperature (shaded, K)
Sea level pressure (contour, 2hPa)
Wind vector
Heating over Frobisher Bay

Profiles 18Z 4 Feb

0Z 5 Feb
Eta = 1.0
Potential temperature (shaded, K)
Sea level pressure (contour, 2hPa)
Wind vector
Time of maximum observed winds
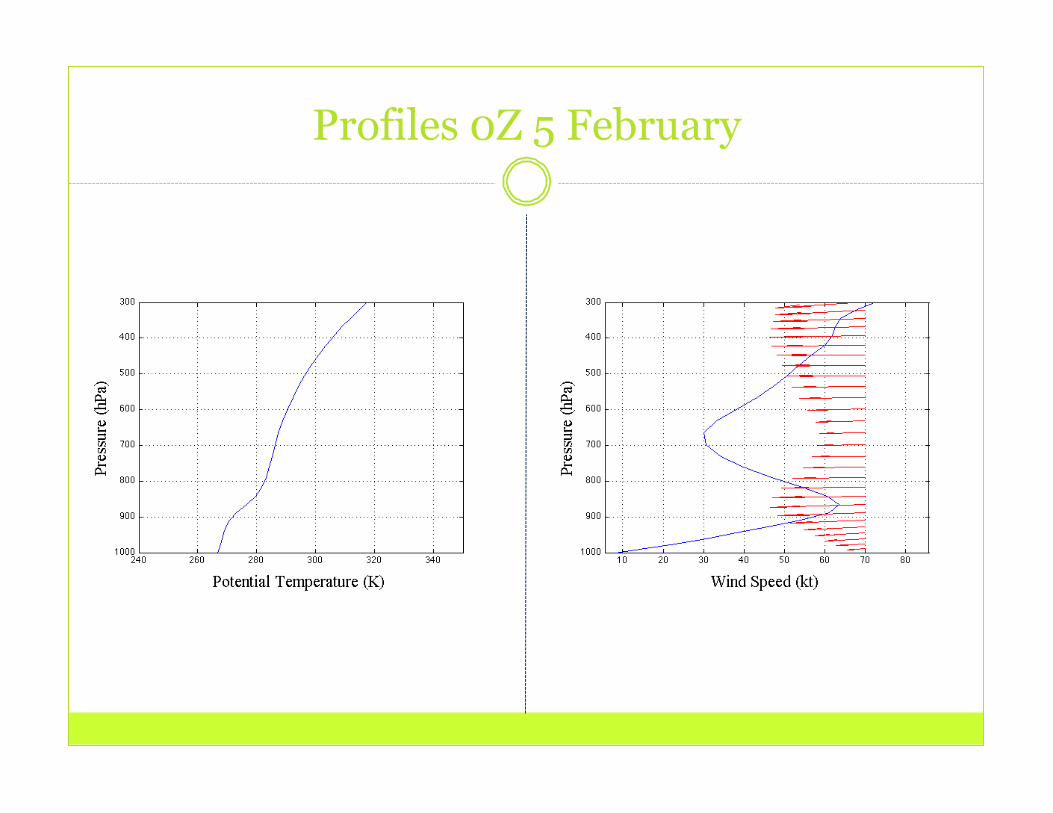
Profiles 0Z 5 February
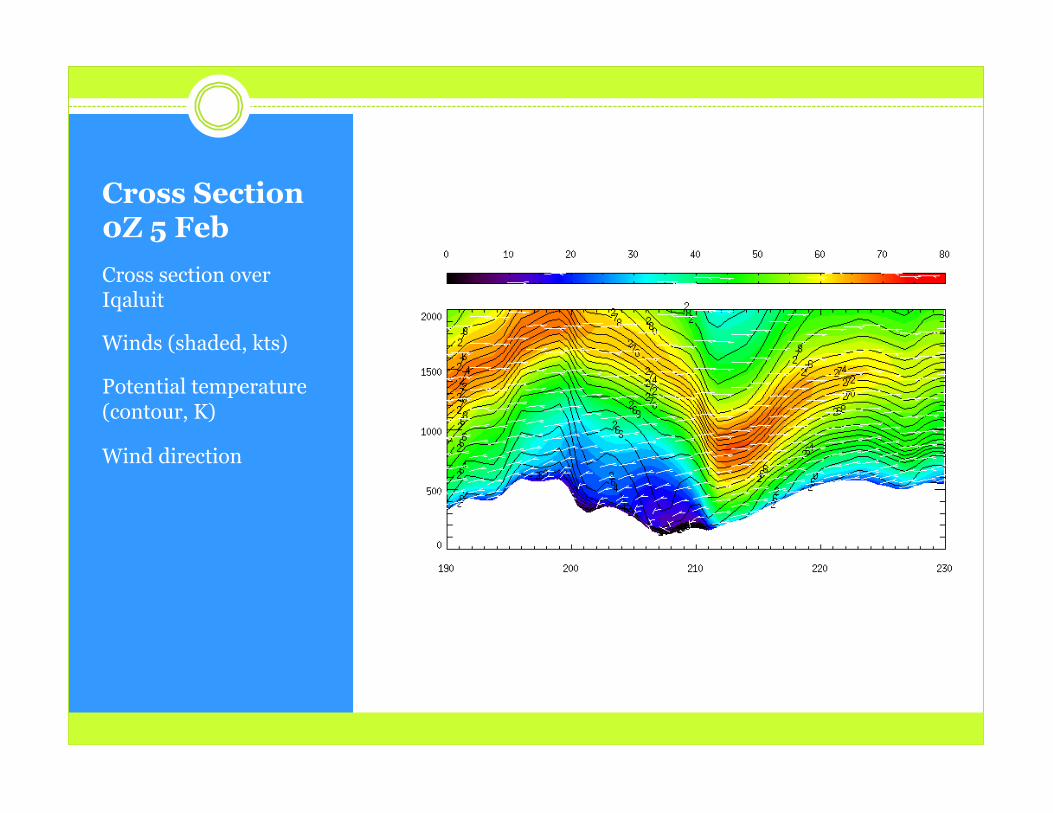
Cross Section 0Z 5 Feb Cross section over Iqaluit
Winds (shaded, kts)
Potential temperature (contour, K)
Wind direction
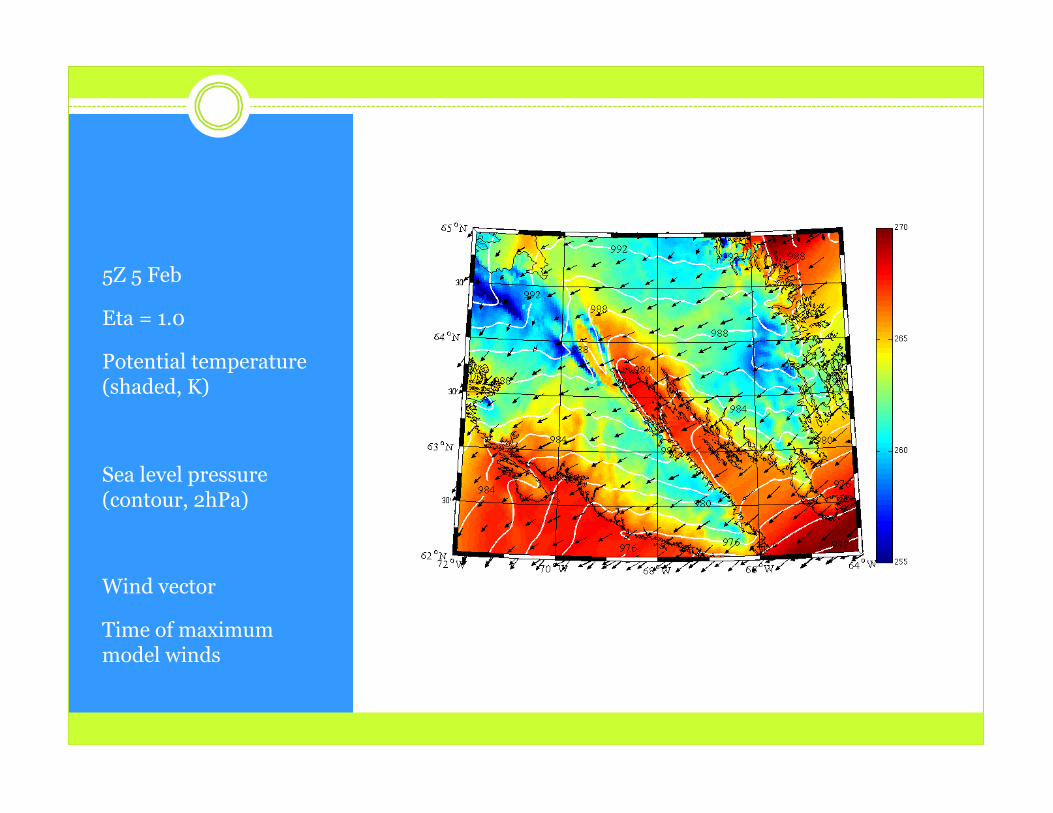
5Z 5 Feb
Eta = 1.0
Potential temperature (shaded, K)
Sea level pressure (contour, 2hPa)
Wind vector
Time of maximum model winds

Profiles 5Z 5 February
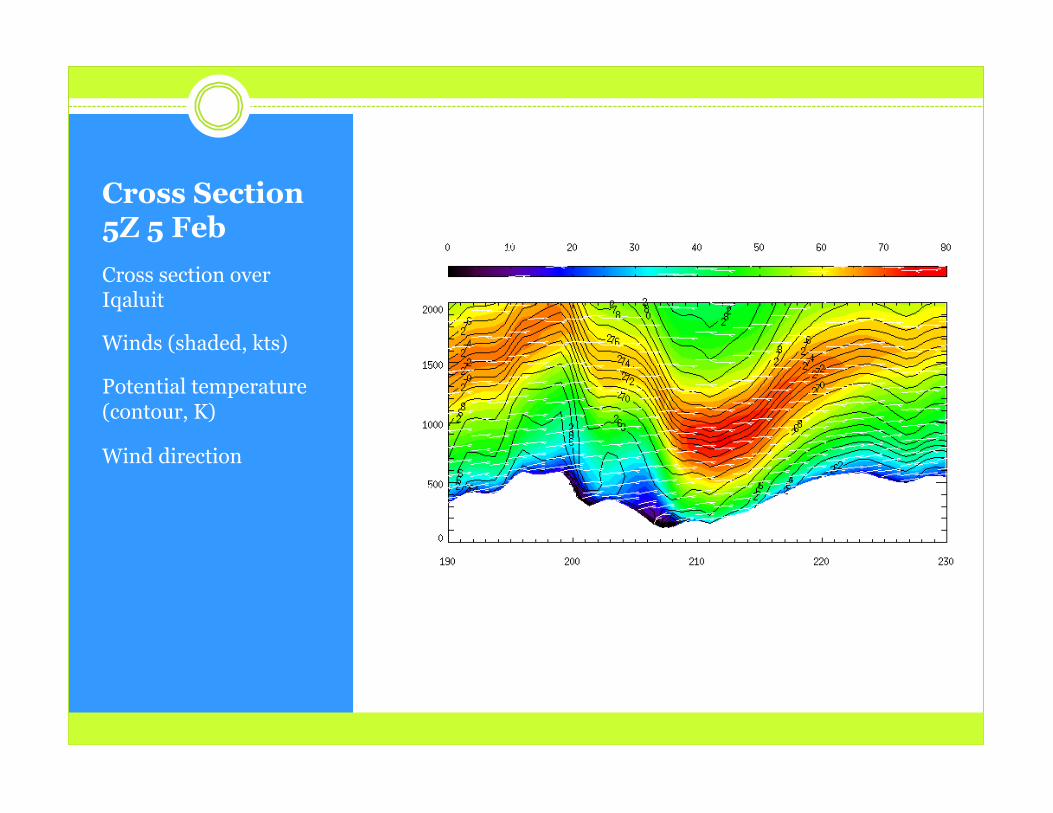
Cross Section 5Z 5 Feb Cross section over Iqaluit
Winds (shaded, kts)
Potential temperature (contour, K)
Wind direction

November 2008 YFB Comparison
00 06 12 18 00
Surface Pressure
Temperature
Wind Speed
Wind Direction

Surface Nov 2008 0Z 17 Nov
Eta = 1.0
Potential temperature (shaded, K)
Sea level pressure (contour, 2hPa)
Wind vector
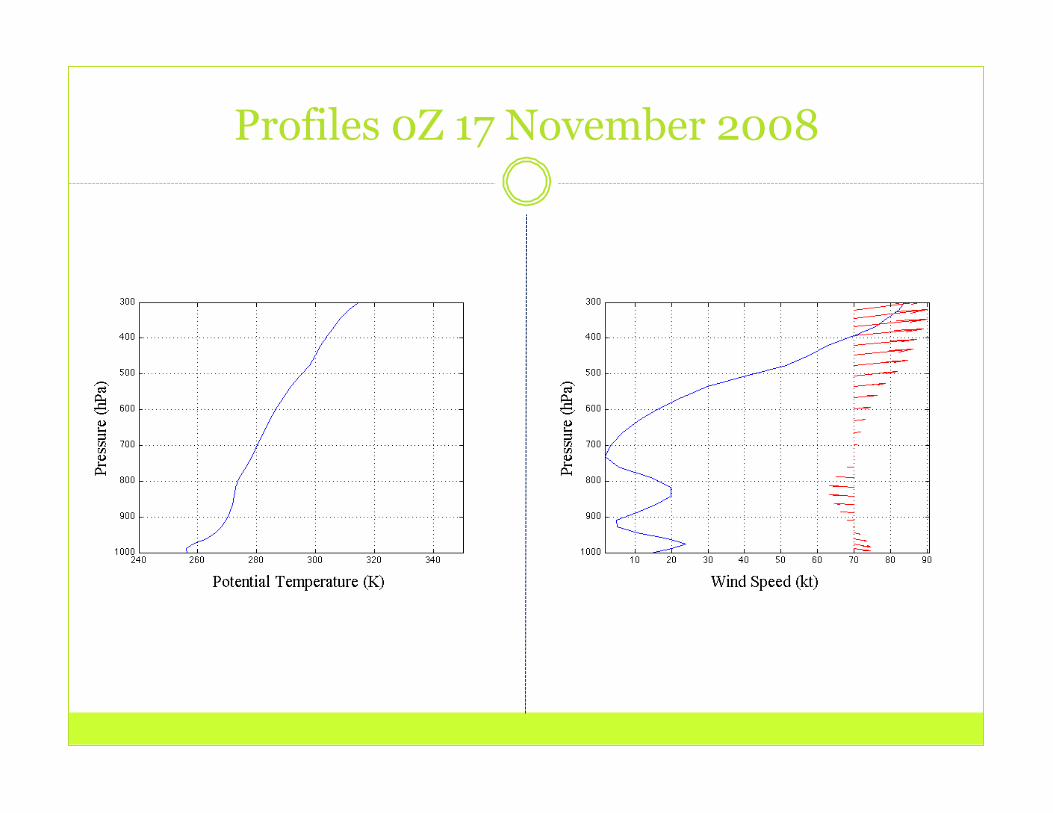
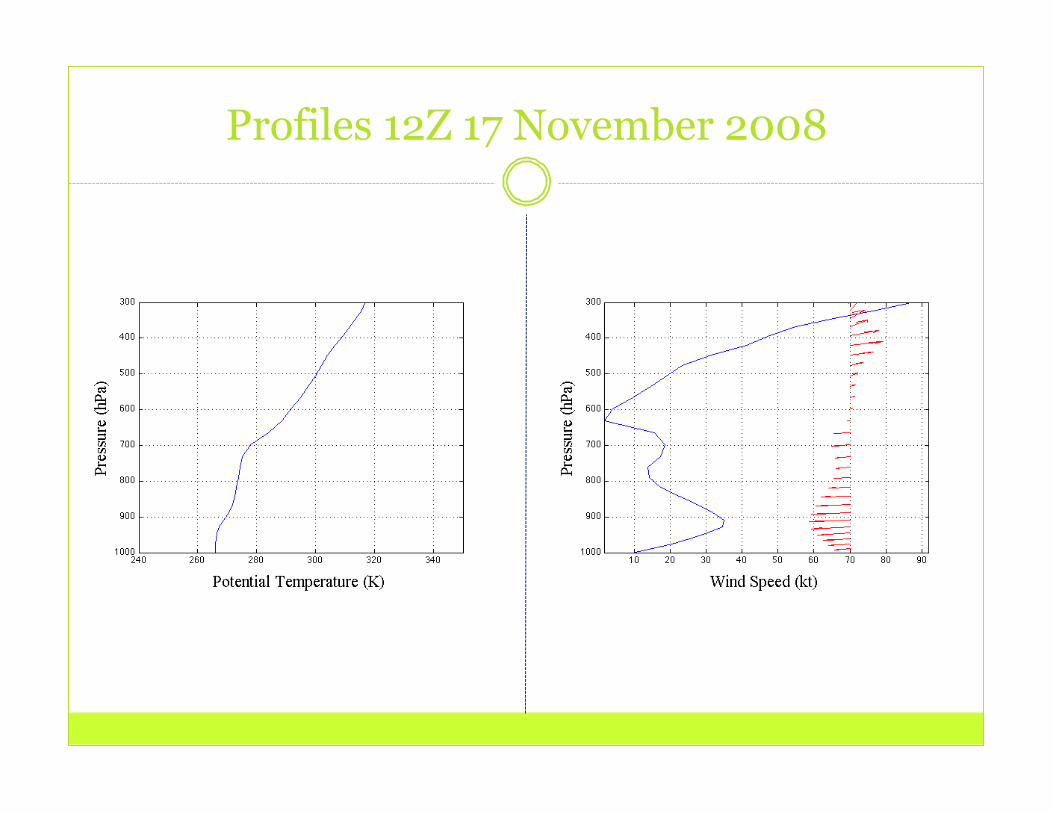
Profiles 0Z 17 November 2008
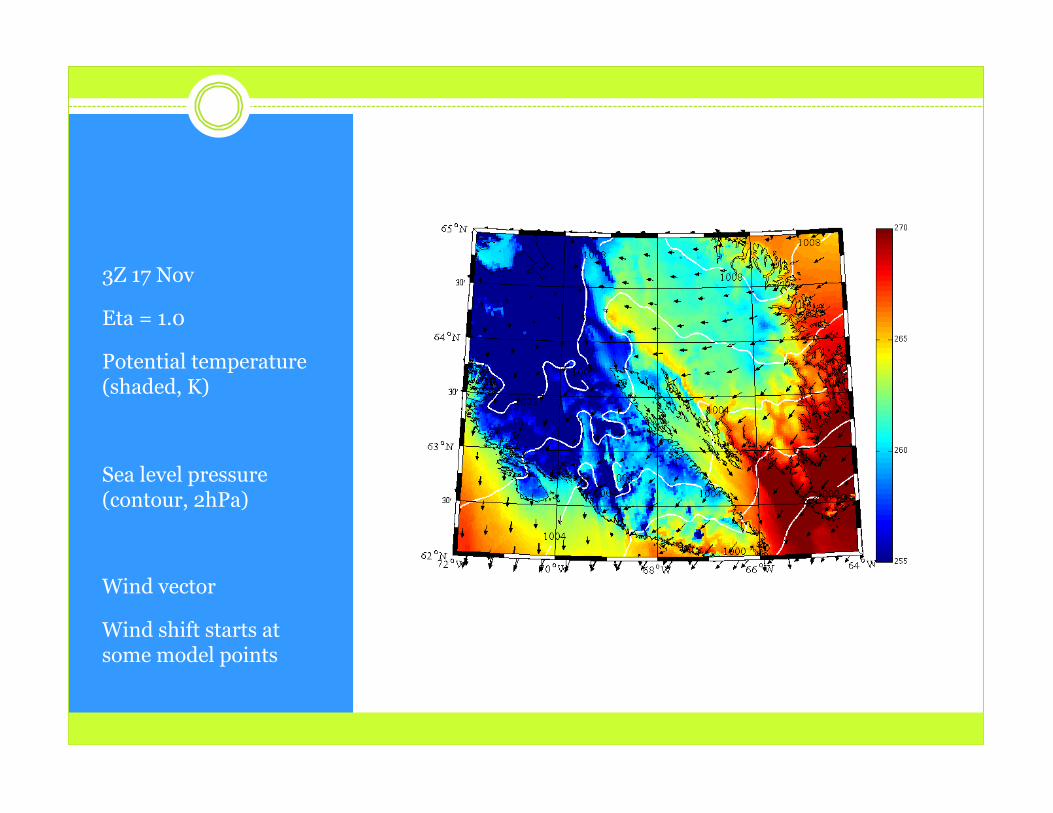
3Z 17 Nov
Eta = 1.0
Potential temperature (shaded, K)
Sea level pressure (contour, 2hPa)
Wind vector
Wind shift starts at some model points
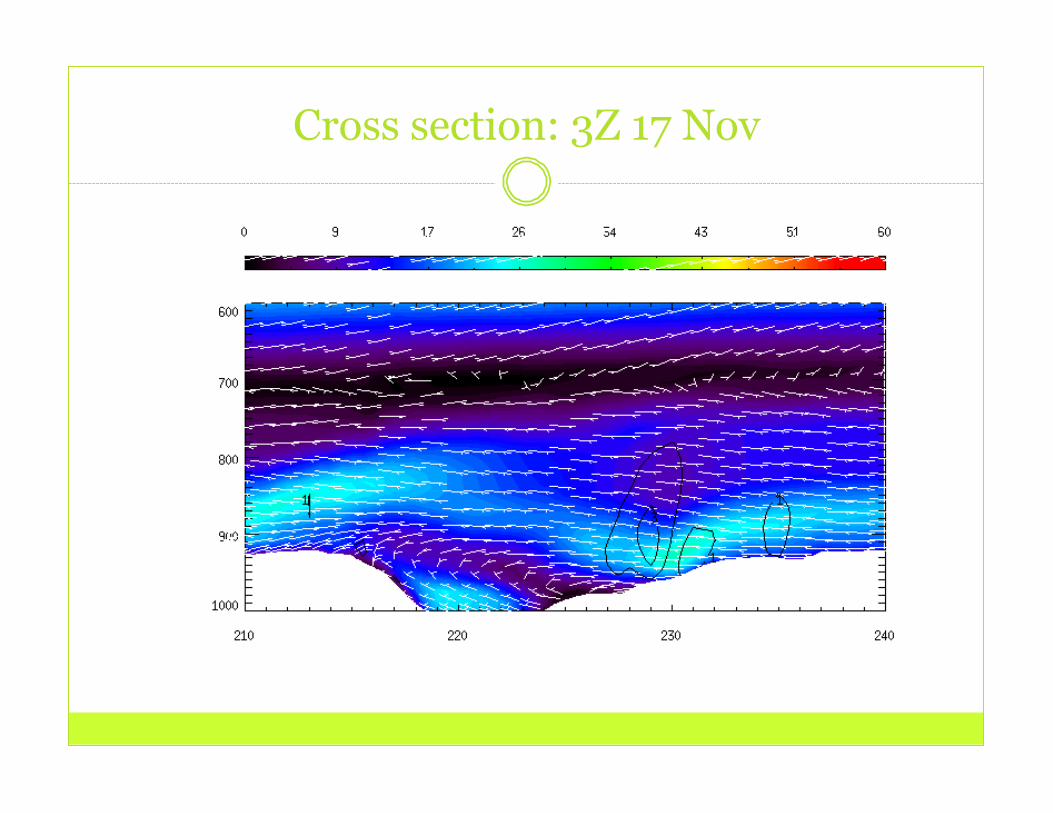
Cross section: 3Z 17 Nov
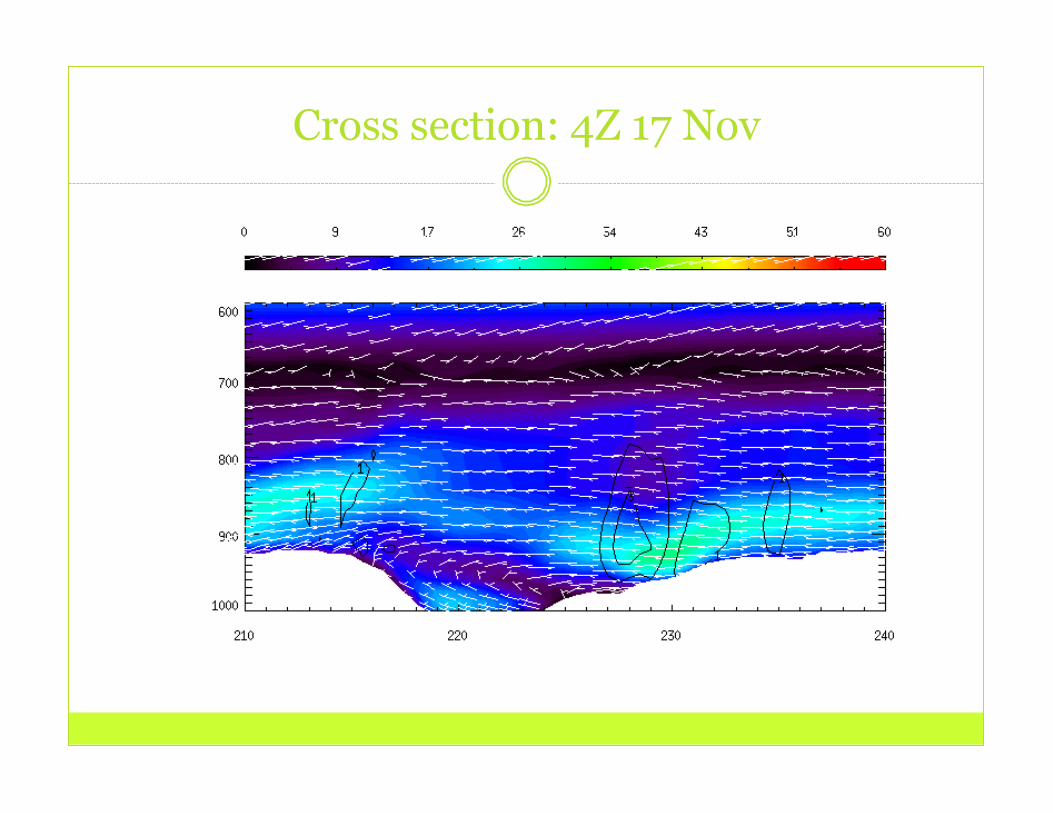
Cross section: 4Z 17 Nov

Cross section: 5Z 17 Nov

Cross section: 6Z 17 Nov
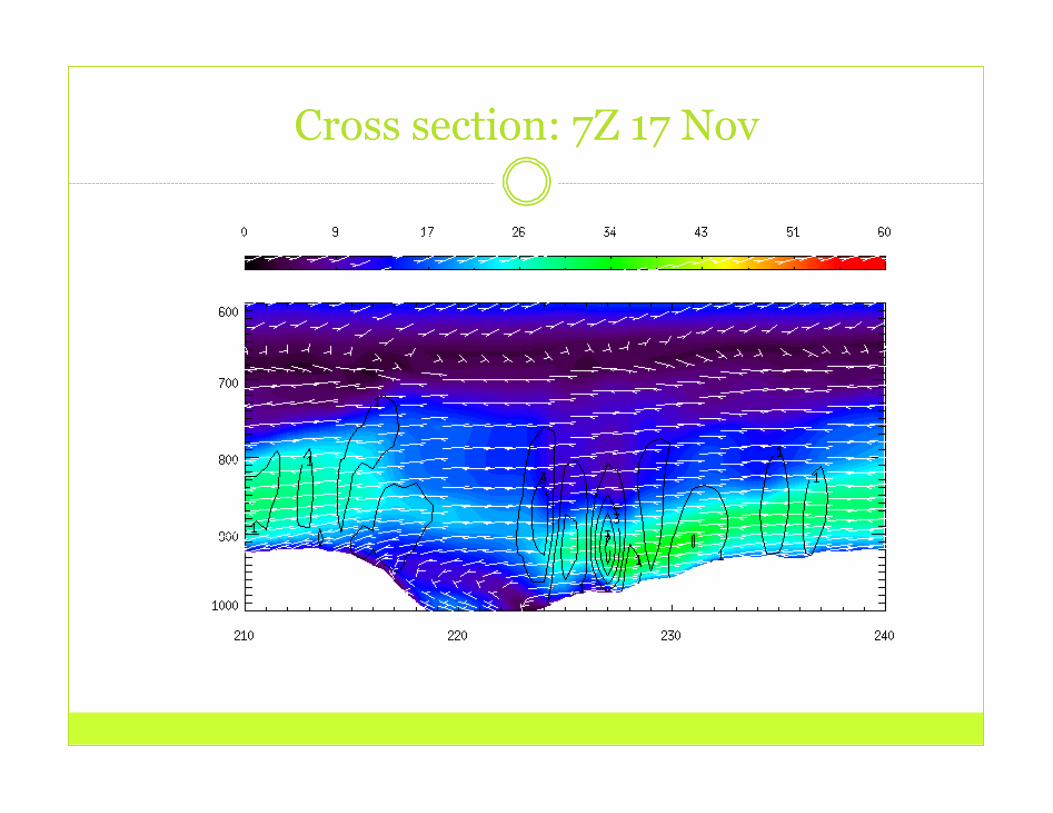
Cross section: 7Z 17 Nov
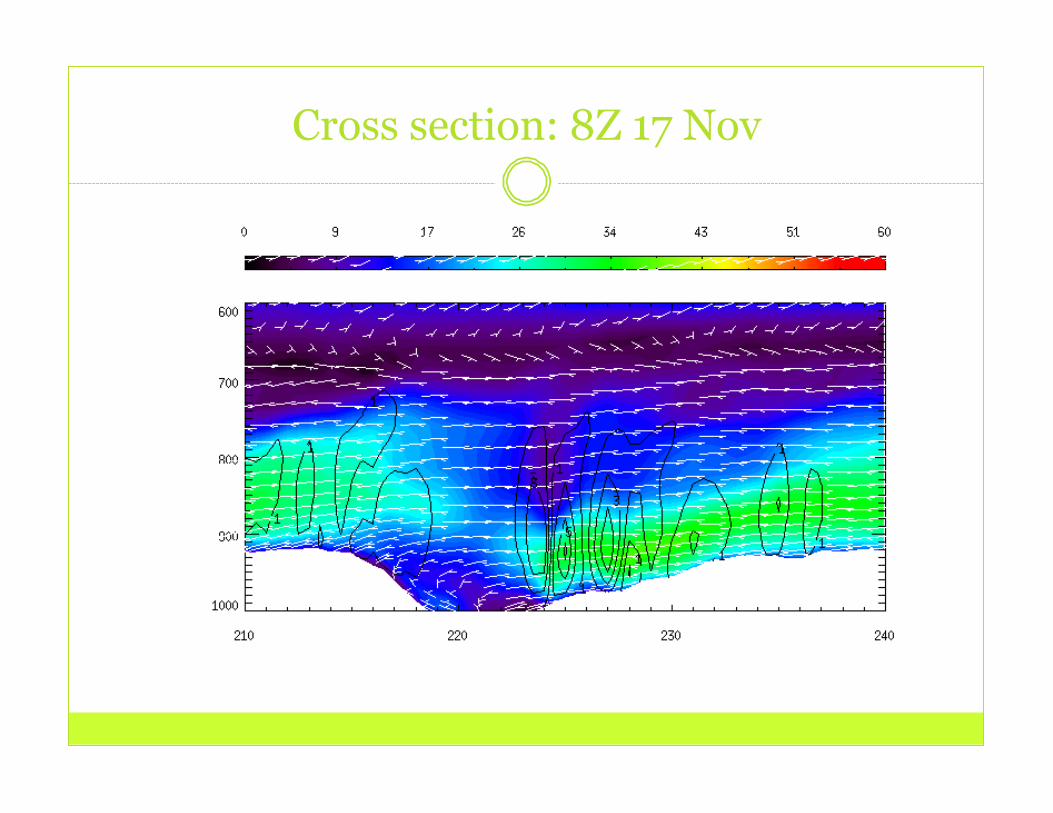
Cross section: 8Z 17 Nov
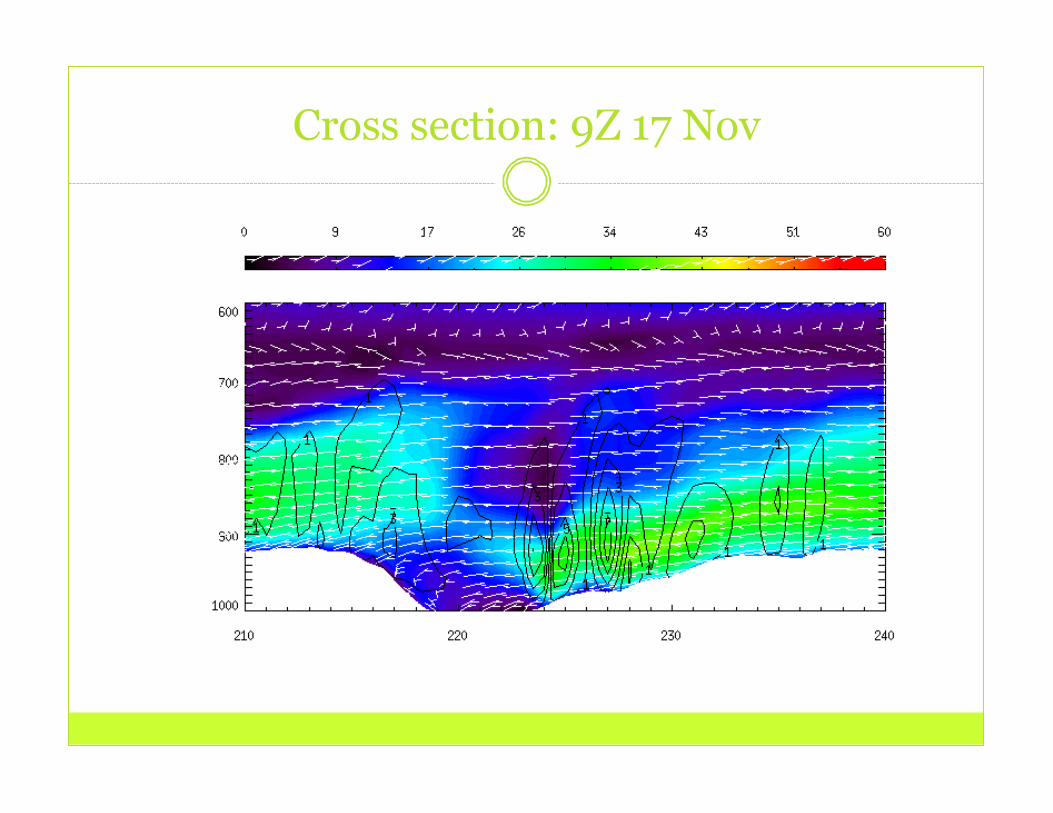
Cross section: 9Z 17 Nov

6Z 17 Nov
Eta = 1.0
Potential temperature (shaded, K)
Sea level pressure (contour, 2hPa)
Wind vector
Time of observed wind shift
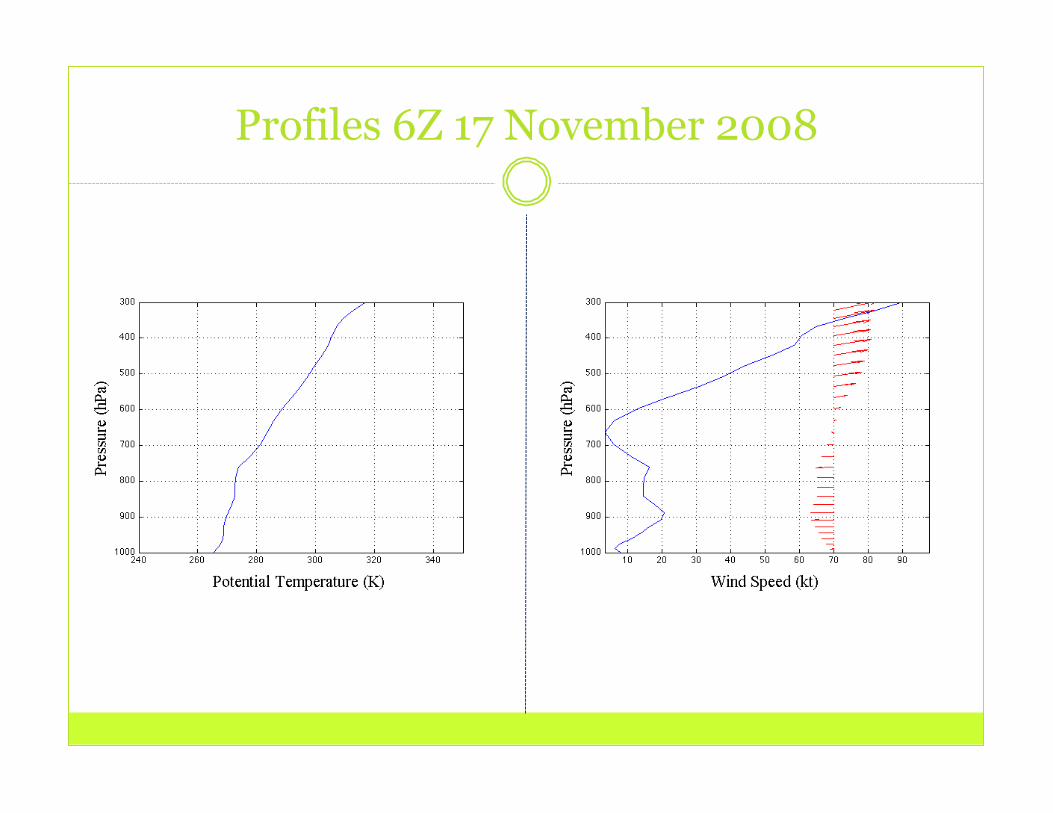
Profiles 6Z 17 November 2008
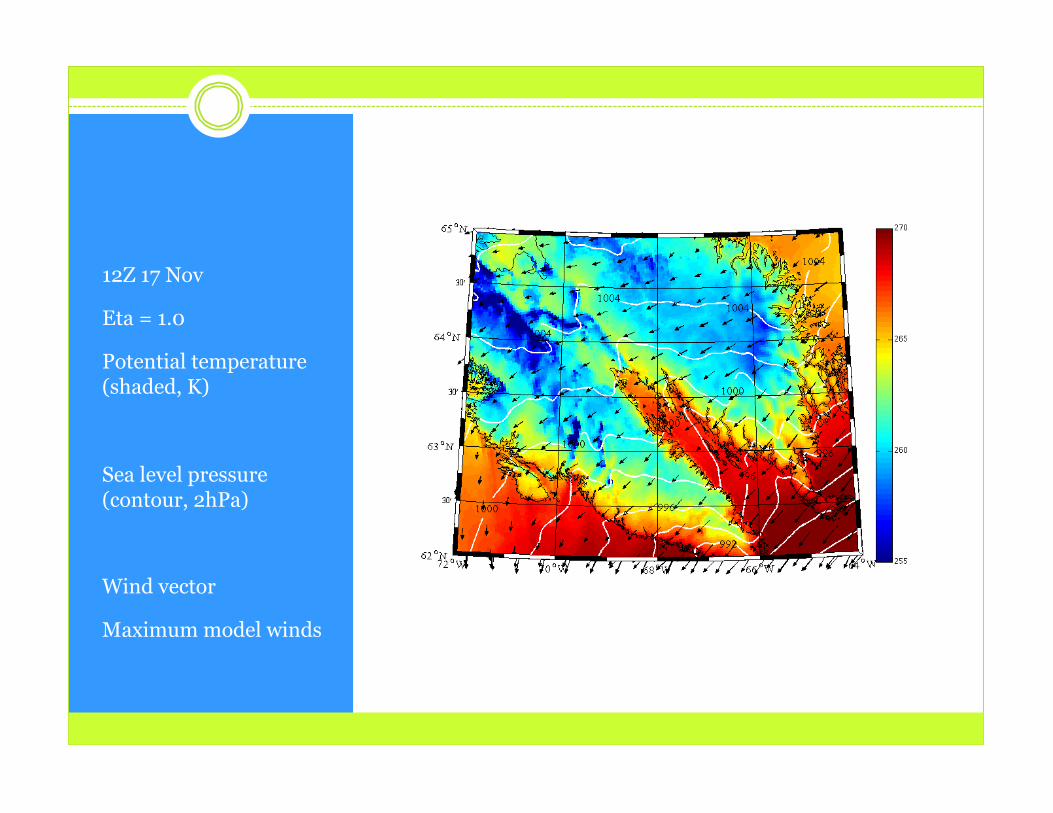
12Z 17 Nov
Eta = 1.0
Potential temperature (shaded, K)
Sea level pressure (contour, 2hPa)
Wind vector
Maximum model winds
Profiles 12Z 17 November 2008

Cross section 12Z 17 Nov Wind speed (shaded, kts)
Vertical velocity (contour, hPa s-1)
Wind direction

18 Z 17 Nov
Eta = 1.0
Potential temperature (shaded, K)
Sea level pressure (contour, 2hPa)
Wind vector
Observed wind shift back to NW

Profiles 18Z 17 November 2008

Profiles 19Z 17 November 2008

Profiles 20Z 17 November 2008
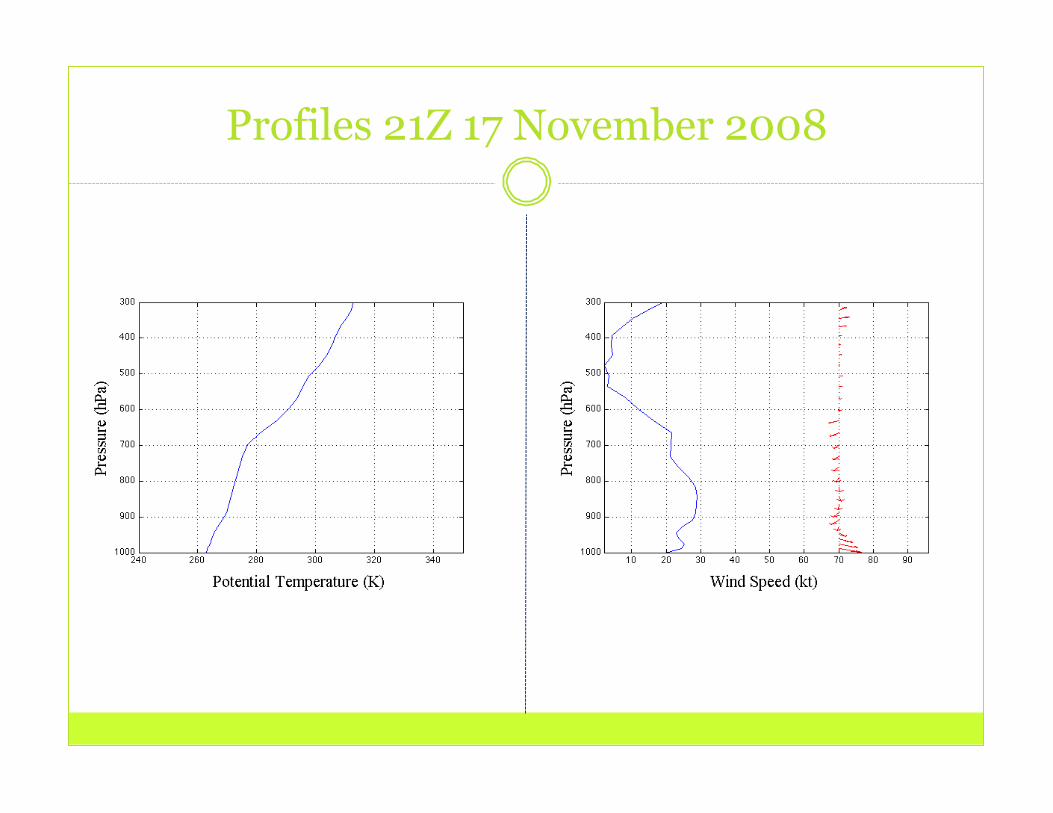
Profiles 21Z 17 November 2008
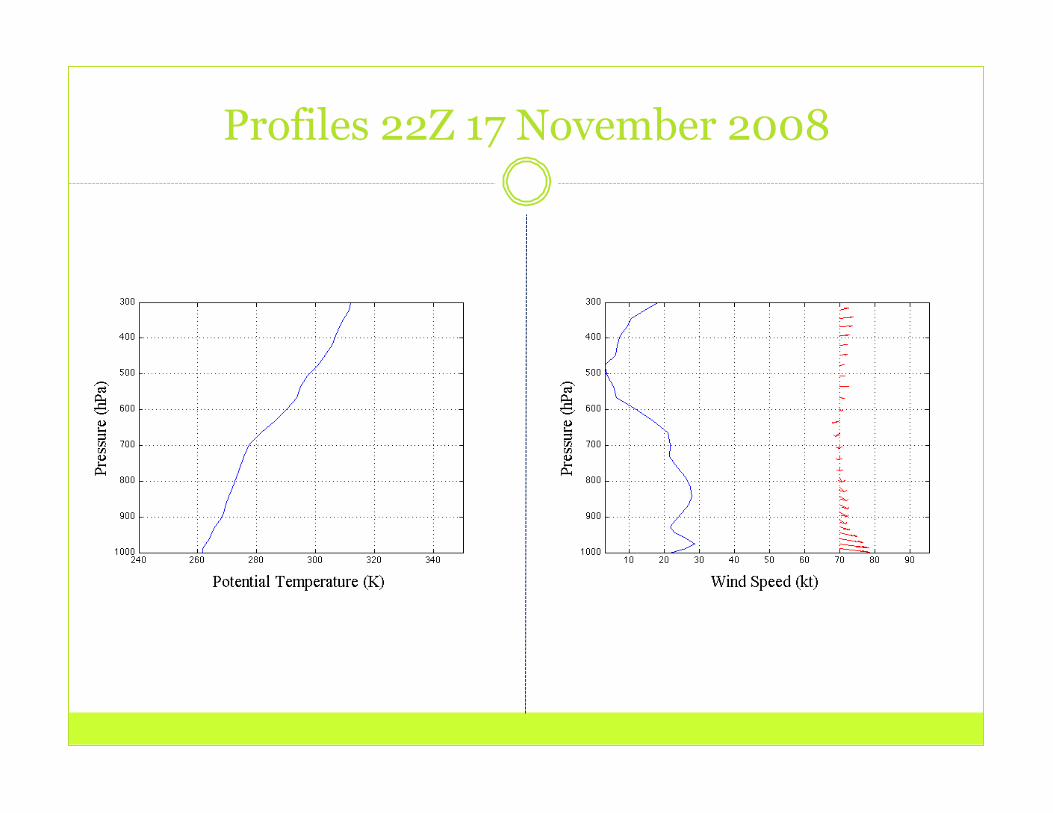
Profiles 22Z 17 November 2008
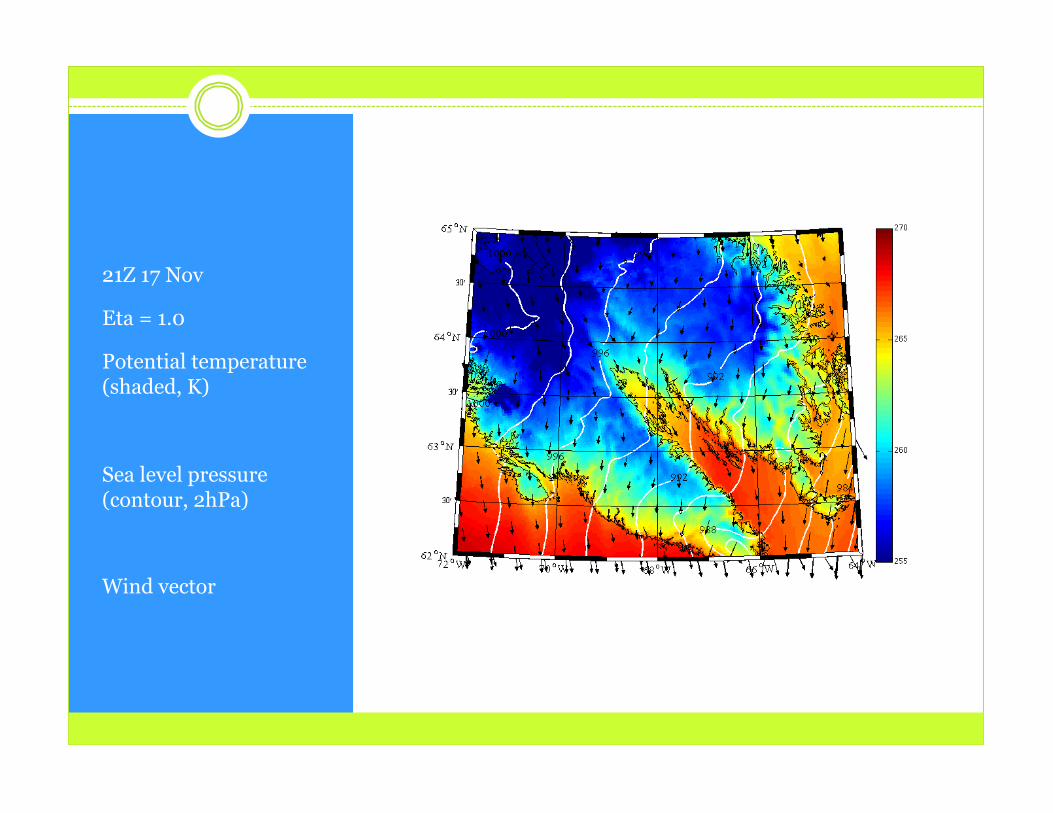
21Z 17 Nov
Eta = 1.0
Potential temperature (shaded, K)
Sea level pressure (contour, 2hPa)
Wind vector

Cross section 21Z 17 Nov Wind speed (shaded, kts)
Vertical velocity (contour, hPa s-1)
Wind direction
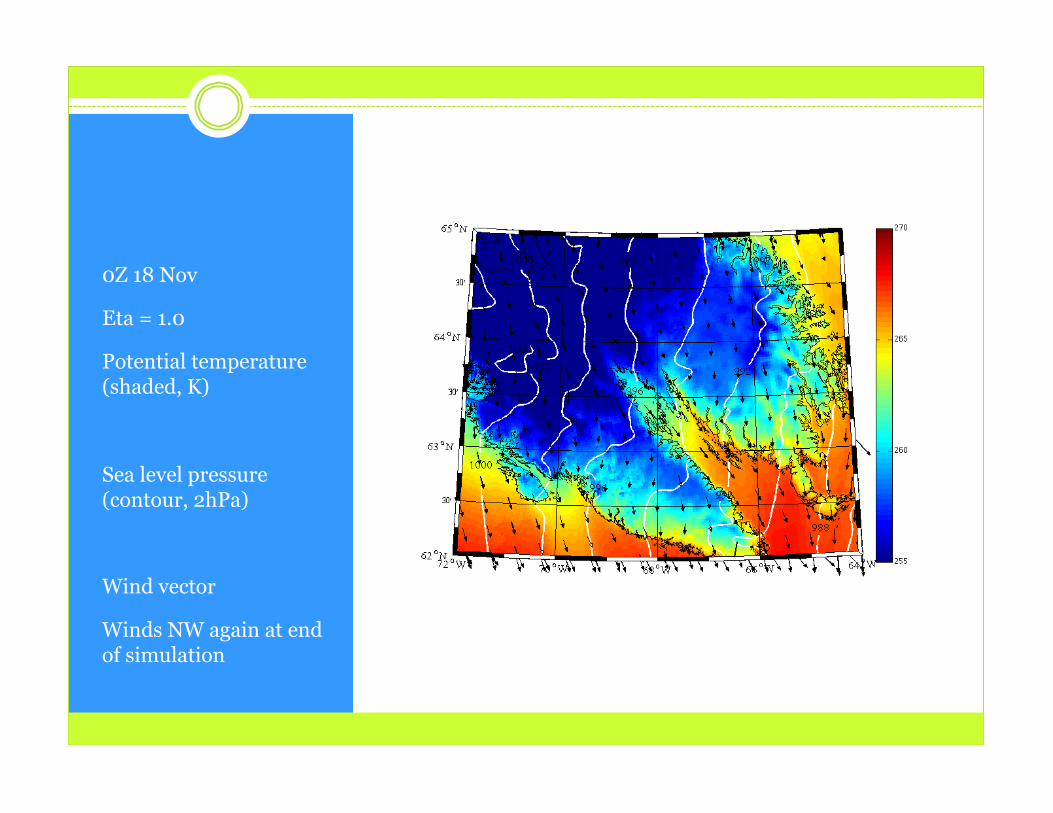
0Z 18 Nov
Eta = 1.0
Potential temperature (shaded, K)
Sea level pressure (contour, 2hPa)
Wind vector
Winds NW again at end of simulation
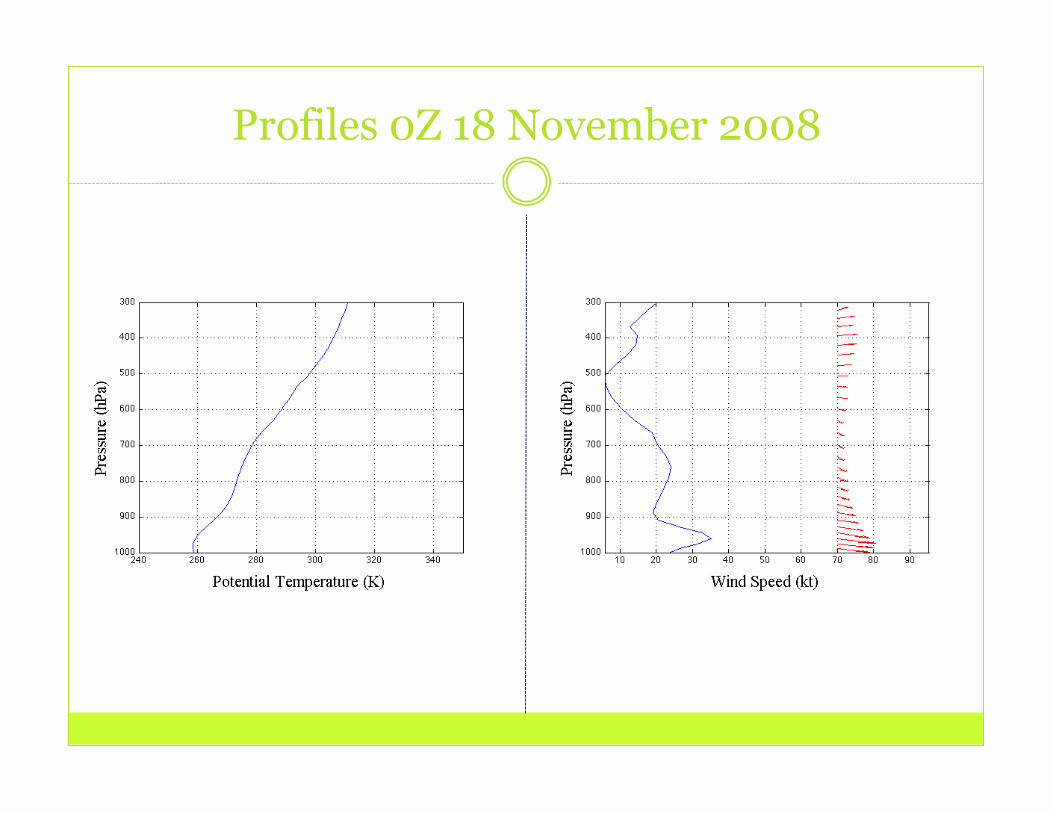
Profiles 0Z 18 November 2008

September 2008 YFB Comparison
12 18 00 06 12
Surface Pressure
Temperature
Wind Speed
Wind Direction
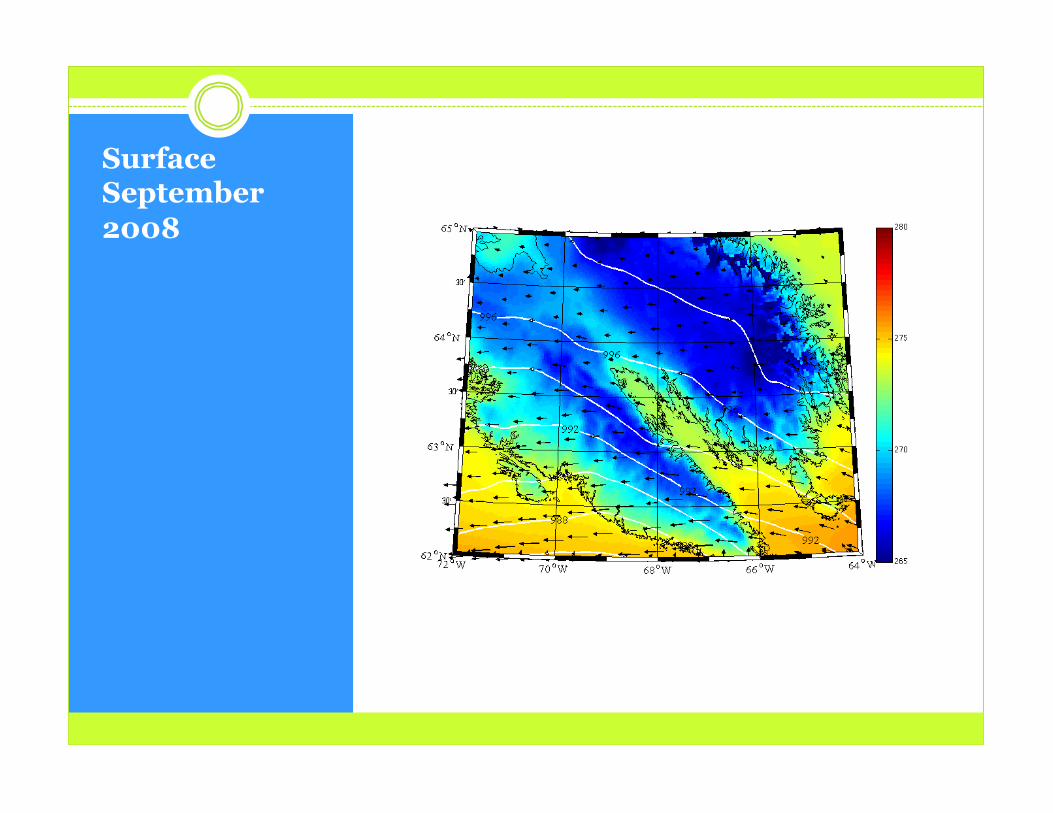
Surface September 2008
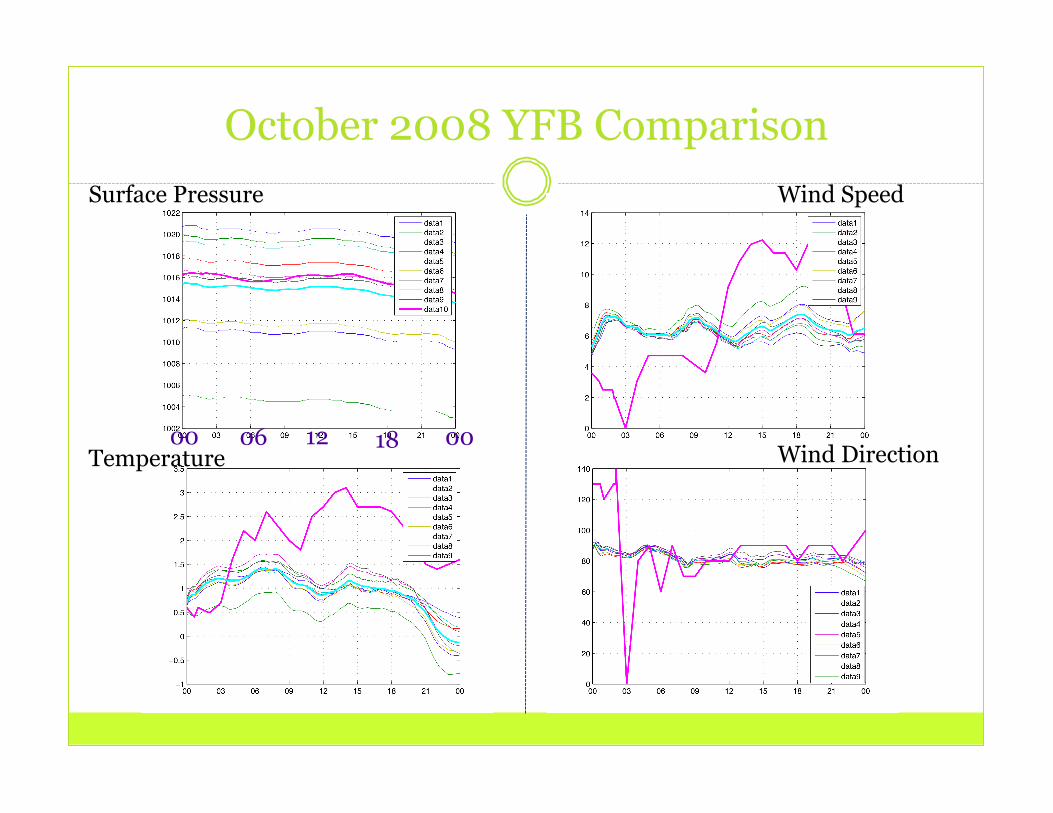
October 2008 YFB Comparison
00 06 12 18 00
Surface Pressure
Temperature
Wind Speed
Wind Direction
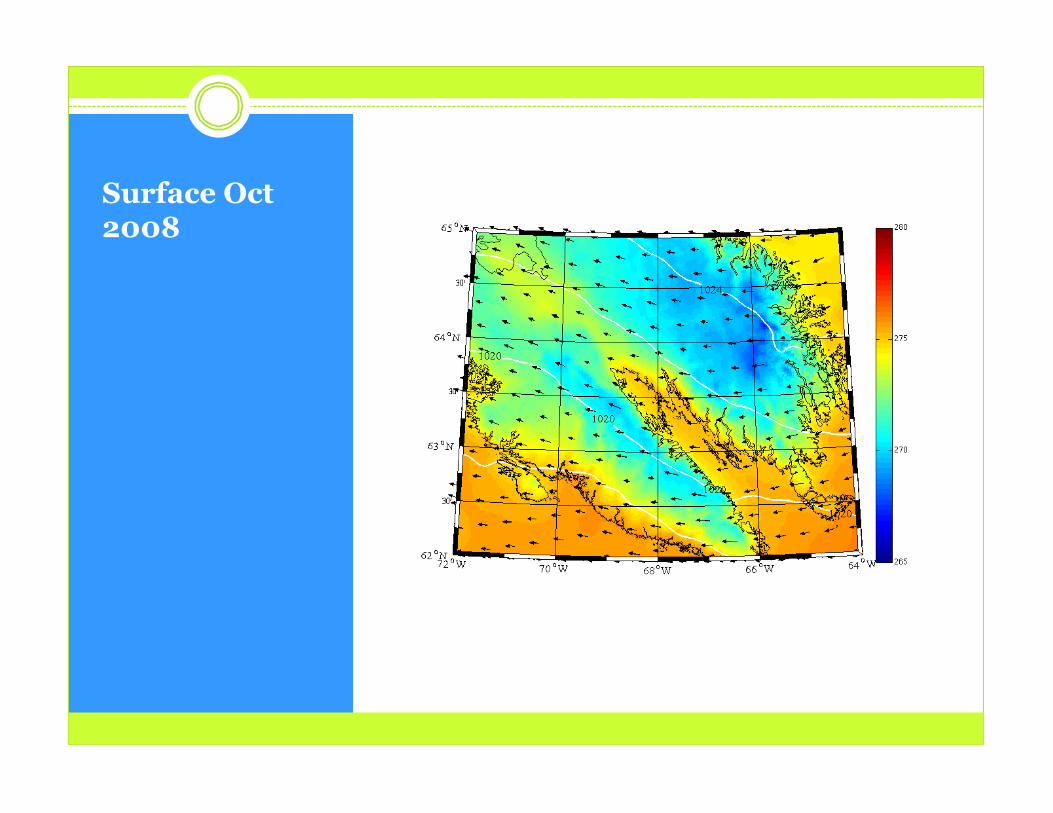
Surface Oct 2008
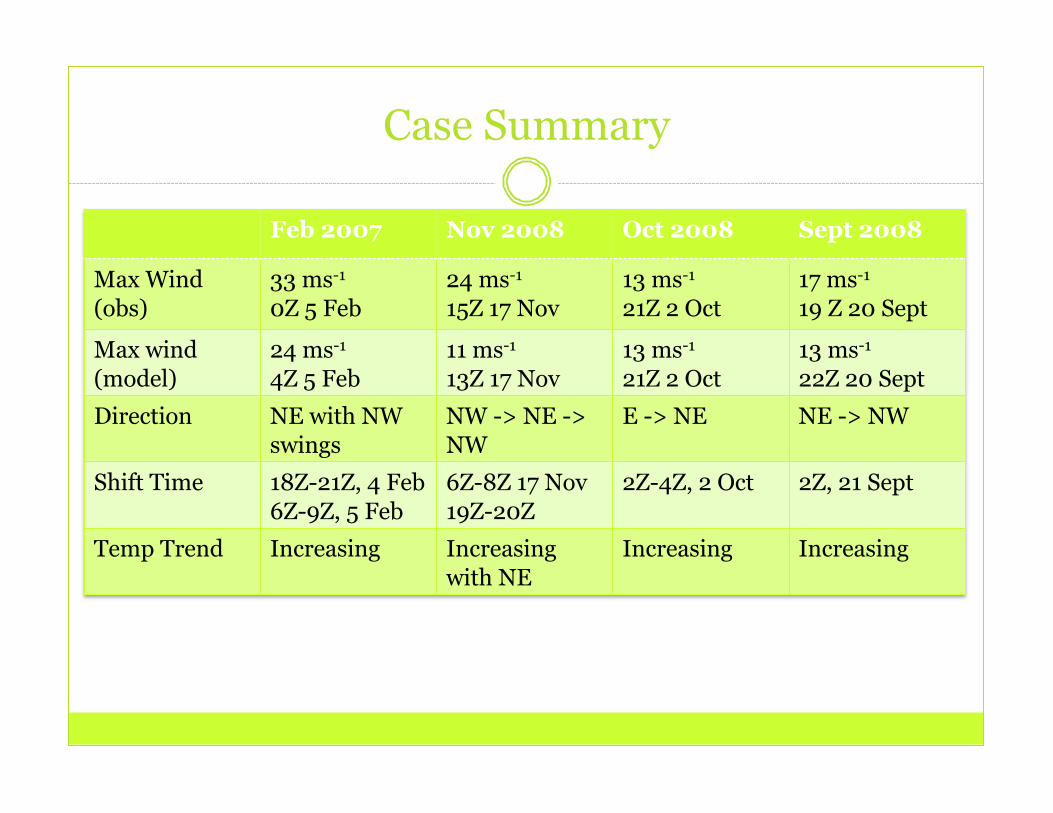
Case Summary
Feb 2007 Nov 2008 Oct 2008 Sept 2008
Max Wind (obs)
33 ms-1 0Z 5 Feb
24 ms-1 15Z 17 Nov
13 ms-1 21Z 2 Oct
17 ms-1 19 Z 20 Sept
Max wind (model)
24 ms-1 4Z 5 Feb
11 ms-1 13Z 17 Nov
13 ms-1 21Z 2 Oct
13 ms-1 22Z 20 Sept
Direction NE with NW swings
NW -> NE -> NW
E -> NE NE -> NW
Shift Time 18Z-21Z, 4 Feb 6Z-9Z, 5 Feb
6Z-8Z 17 Nov 19Z-20Z
2Z-4Z, 2 Oct 2Z, 21 Sept
Temp Trend Increasing Increasing with NE
Increasing Increasing
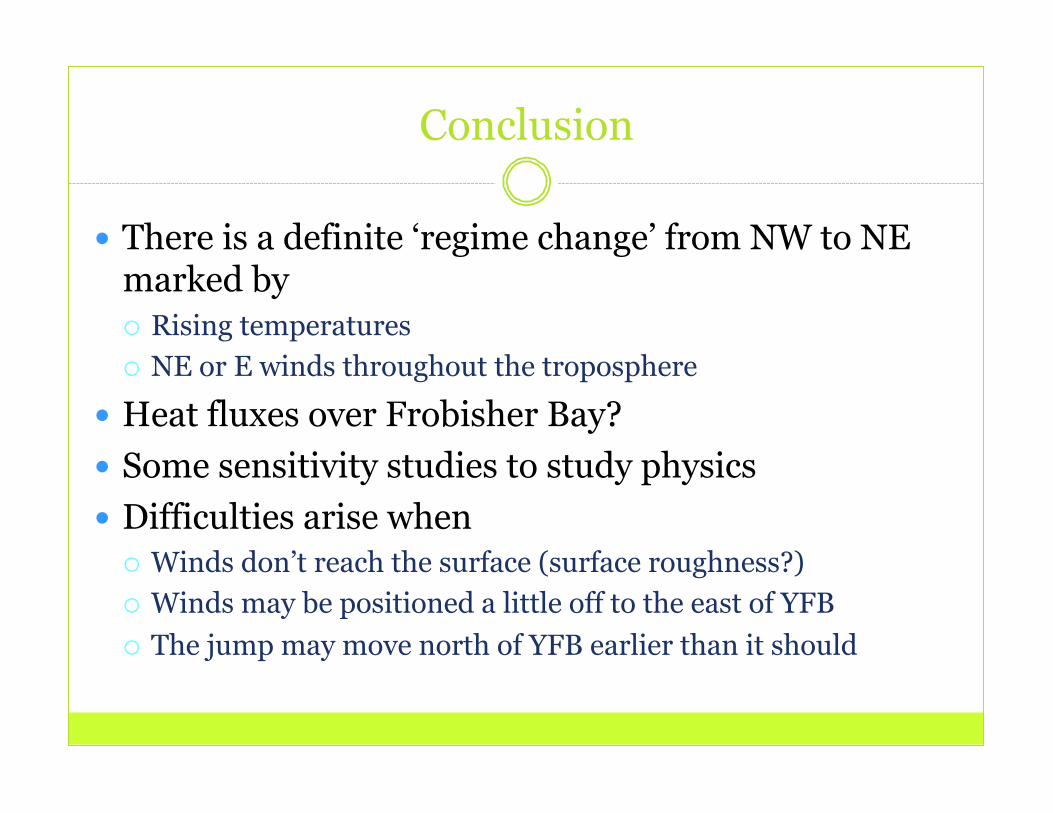
Conclusion
There is a definite ‘regime change’ from NW to NE marked by Rising temperatures NE or E winds throughout the troposphere
Heat fluxes over Frobisher Bay? Some sensitivity studies to study physics Difficulties arise when
Winds don’t reach the surface (surface roughness?) Winds may be positioned a little off to the east of YFB The jump may move north of YFB earlier than it should