Embed Size (px)
Citation preview
STRESS GRADIENT ON TENSILE
STRENGTH FROM THREE-POINT BENDING
TEST OF SANDSTONE
MR.NARAWIT KATHANCHAROEN
D6110307
MISS.PRATABJAI PRASUJAN
M6110833
A PRAJECT OF ADVANCED ROCK MECHANICS
INSTITUTE OF CIVIL, TRANSPORTATION AND
GEO-RESOURCES ENGINEERING
SURANAREE UNIVERSITY OF TECHNOLOGY
ACADEMIC YEAR 2018
I
TABLE OF CONTEVTS
Page
TABLE OF CONTENT........................................................................................................I
LIST OF TABLE ............................................................................................................... III
LIST OF FIGURES ........................................................................................................... IV
CHAPTERT
I INTRODUCTION ................................................................................... IV
1.1 Background and rationale ................................................................... 1
1.2 Research objectives ............................................................................ 1
1.3 Scope and limitations.......................................................................... 1
1.4 Research methodology ....................................................................... 1
1.4.1 Literature review .................................................................. 2
1.4.2 Sample preparation .............................................................. 2
1.4.3 Laboratory testing ................................................................ 3
II LITERATURE REVIEW ......................................................................... 4
2.1 Introduction ........................................................................................ 4
2.2 Three-point bending test ..................................................................... 4
2.3 Researcher on bending test ................................................................. 5
2.4 Stress gradient effect .......................................................................... 9
2.5 Tensile strength of rock ...................................................................... 9
III SAMPLE PREPARATION .................................................................... 11
3.1 Introduction ...................................................................................... 11
3.2 Sample preparation ........................................................................... 11
IV LABORATORY TESTING AND TEST RESULTS ............................ 14
4.1 Three-point bending test ................................................................... 14
4.2 Test result ......................................................................................... 16
VI DISCUSSIONS AND CONCLUSIONS................................................. 17
5.1 Discussions and conclusions ............................................................ 17
5.2 Recommendation for future studies .................................................. 17
REFERENCES .................................................................................................... 20
II
LIST OF TABLES
Table Page 3.1 Physical properties of specimen for bending tests ................................................. 13 4.1 Results of three-point bending test ........................................................................ 19
III
LIST OF TABLES
Figure Page 1.1 Research methodology ............................................................................................ 1
2.1 Schematic of a suitable apparatus for flexure test by center-point loading method
(ASTM (C293–02)) ................................................................................................. 4
2.2 Difference specimen size utilized (Cardani and Meda,2004) .................................. 5
2.3 Three (a) and four (b) point bending configuration (Cardani and Meda,2004) ...... 7
2.4 Elastic beam with (a) fixed ends and (b) simple (pin) supports (Diederichs and
Kaiser,1998). ........................................................................................................... 7
2.5 Variation of the stresses along the height of a beam (Exadaktylos et al.,2001). ..... 8
3.1 a) Rectangular specimen with dimensions 50x30x200 mm3 ................................ 12
b) Rectangular specimen with dimensions 50x50x200 mm3 ................................ 12
c) Rectangular specimen with dimensions 50x70x200 mm3 ................................ 12
d) Rectangular specimen with dimensions 50x90x200 mm3 ................................ 13
e) Rectangular specimen with dimensions 50x110x200 mm3 .............................. 13
4.1 Bending test equipment ......................................................................................... 14
4.2 Loading diagram for three-point bending test ....................................................... 15
4.3 Pre and post-test some PWSS specimens of three-point bending test ................... 15
4.4 Relation between tensile stress ( t) versus deflection of PWSS specimens.......... 16
4.5 Relation between tensile strength ( t) versus thickness of PWSS specimens ....... 17
4.6 Stress gradient from tensile strength of the various thickness PWSS specimens . 18
CHAPTER I
INTRODUCTION
1.1 Background and rationale Bend testing (e.g.,ASTM C293-02,ASTM D790-17) has been widely used to
determine the tensile strength. The tensile strength can be obtained from the laboratory by
various methods but the bending test is more preferable than other for design and stability
analysis of underground structure such as the tunnel roof. This is primarily due to the
stresses variation along the height of a roof that can find from tensile strength.
1.2 Research objectives The objectives of this study are to determine the stress gradient of specimens that
are sandstone in Phra Wihan formations. The tensile strength is made in the laboratory by
three-point bending test. Mathematical relationship between the thickness of specimen,
deflection and tensile strength.
1.3 Scope and limitations The scope and limitations of the research include as follows.
1) Laboratory experiments are conducted on specimens from Phra Wihan.
2) Laboratory testing made under constant rate loading and static loading.
3) Different specimen thickness are 30 mm, 50 mm, 70 mm, 90 mm and 110 mm.
4) All test rocks are prepared in the laboratory.
5) Up to 1 samples 5 size are tested for sandstone.
6) No field testing is conducted.
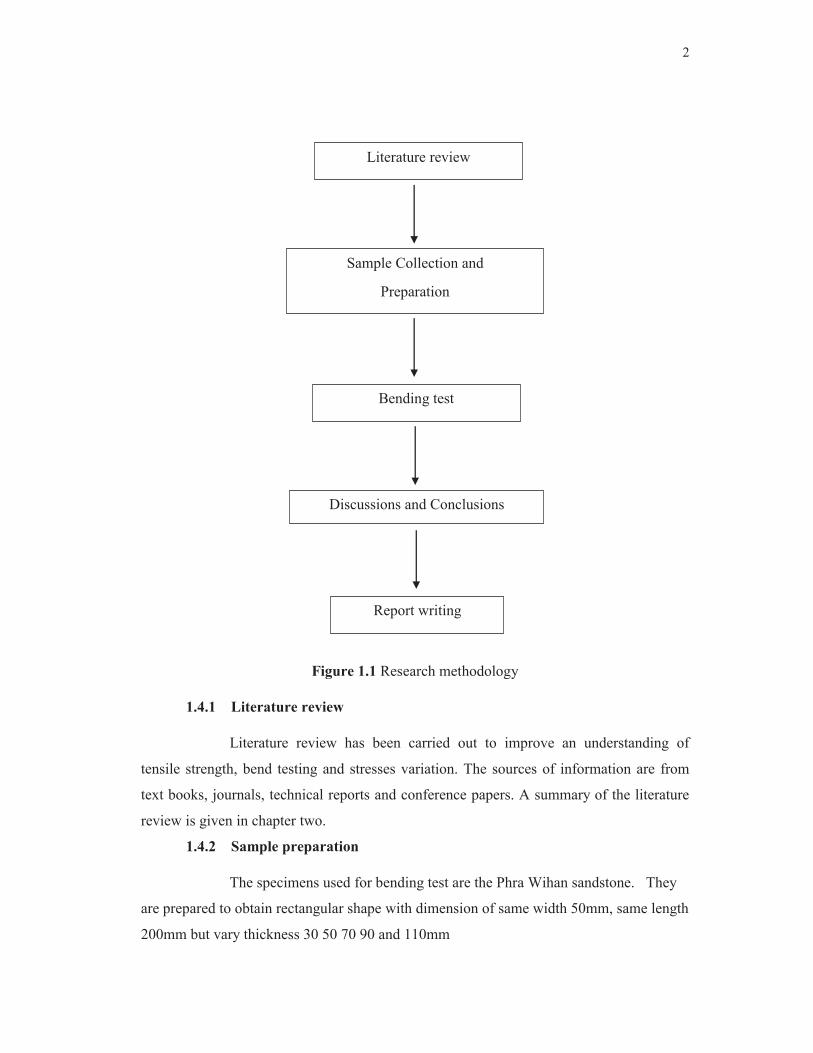
1.4 Research methodology
As shown in Figure 1.1, the research methodology comprises 5 steps’ including
literature review, sample collection and preparation, laboratory testing (bending test),
discussions and conclusions and report writing.
2
Literature review
Sample Collection and
Preparation
Bending test
Discussions and Conclusions
Report writing
Figure 1.1 Research methodology
1.4.1 Literature review
Literature review has been carried out to improve an understanding of
tensile strength, bend testing and stresses variation. The sources of information are from
text books, journals, technical reports and conference papers. A summary of the literature
review is given in chapter two.
1.4.2 Sample preparation
The specimens used for bending test are the Phra Wihan sandstone. They
are prepared to obtain rectangular shape with dimension of same width 50mm, same length
200mm but vary thickness 30 50 70 90 and 110mm
3
1.4.3 Laboratory testing
Laboratory testing made under constant rate loading and static loading. The
test procedure is in accordance with the ASTM (C293-16, D6272-17) standard practice.
1.5 Report contents
This report is devices into five chapters. The first chapter includes background and
rationale, scope and limitations, and research methodology. Chapter II present results of
the literature review to improve an understanding of tensile strength, bend testing and
stresses variation. Chapter III describes sample collection and preparation. Chapter IV
describes the laboratory testing. Chapter V is discussions, conclusions and future studies.
CHAPTER 2
LITERATURE REVIEW
2.1 Introduction
The topic reviewed here include three point bending tests, research bending test,
stress gradient effect and tensile strength of rock.
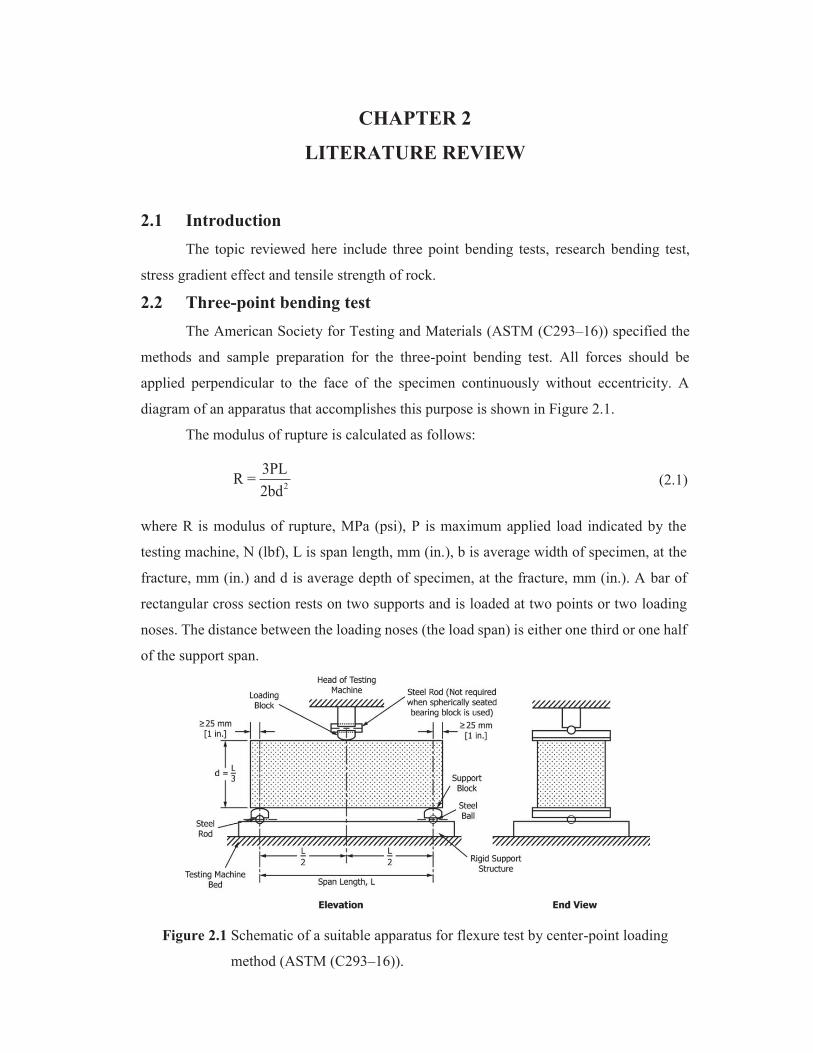
2.2 Three-point bending test The American Society for Testing and Materials (ASTM (C293–16)) specified the
methods and sample preparation for the three-point bending test. All forces should be
applied perpendicular to the face of the specimen continuously without eccentricity. A
diagram of an apparatus that accomplishes this purpose is shown in Figure 2.1.
The modulus of rupture is calculated as follows:
23PLR =2bd
(2.1)
where R is modulus of rupture, MPa (psi), P is maximum applied load indicated by the
testing machine, N (lbf), L is span length, mm (in.), b is average width of specimen, at the
fracture, mm (in.) and d is average depth of specimen, at the fracture, mm (in.). A bar of
rectangular cross section rests on two supports and is loaded at two points or two loading
noses. The distance between the loading noses (the load span) is either one third or one half
of the support span.
Figure 2.1 Schematic of a suitable apparatus for flexure test by center-point loading
method (ASTM (C293–16)).
5
2.3 Research on bending test Cardani and Meda (2004) study The tensile behavior of marble at failure is analysed.
A series of monotonic and cyclic bending tests were carried out in the laboratory on
geometrically similar specimens of different size. The strain distribution was monitored with
strain gauges and laser interferometry techniques. Three and four-point bending
configuration was considered. It is shown that cyclic loads in a three-point bending
configuration induce permanent tensile deformation.
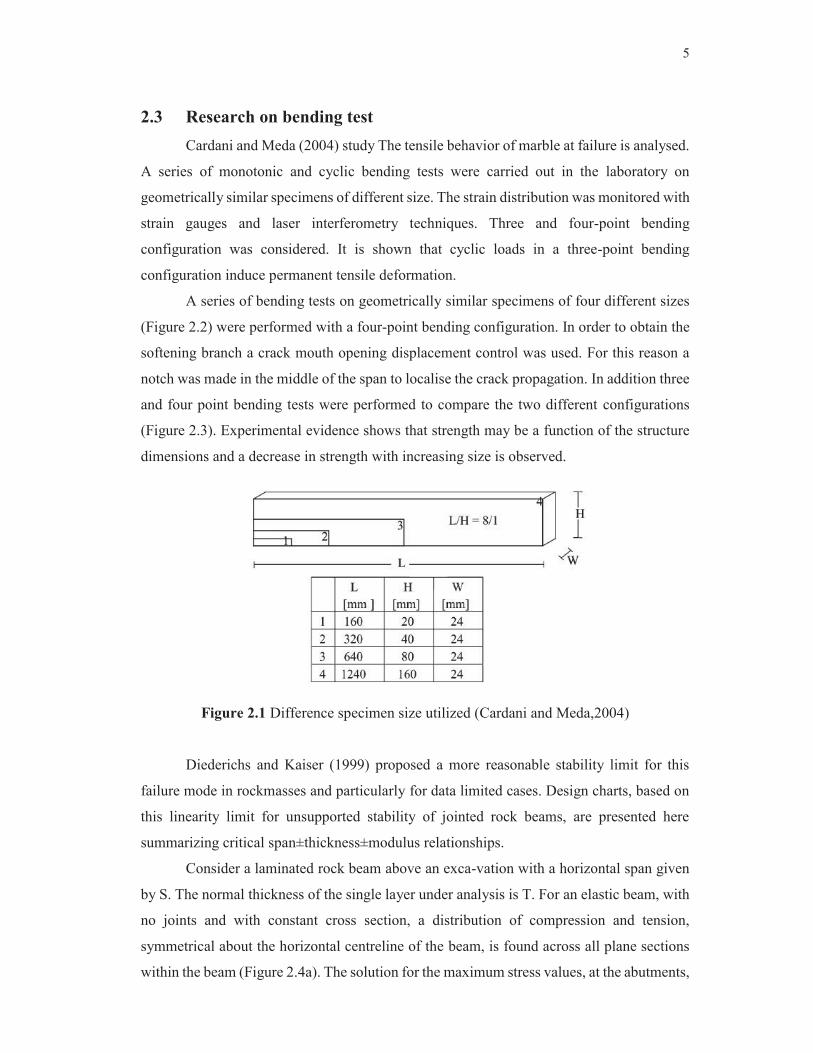
A series of bending tests on geometrically similar specimens of four different sizes
(Figure 2.2) were performed with a four-point bending configuration. In order to obtain the
softening branch a crack mouth opening displacement control was used. For this reason a
notch was made in the middle of the span to localise the crack propagation. In addition three
and four point bending tests were performed to compare the two different configurations
(Figure 2.3). Experimental evidence shows that strength may be a function of the structure
dimensions and a decrease in strength with increasing size is observed.
Figure 2.1 Difference specimen size utilized (Cardani and Meda,2004)
Diederichs and Kaiser (1999) proposed a more reasonable stability limit for this
failure mode in rockmasses and particularly for data limited cases. Design charts, based on
this linearity limit for unsupported stability of jointed rock beams, are presented here
summarizing critical span±thickness±modulus relationships.
Consider a laminated rock beam above an exca-vation with a horizontal span given
by S. The normal thickness of the single layer under analysis is T. For an elastic beam, with
no joints and with constant cross section, a distribution of compression and tension,
symmetrical about the horizontal centreline of the beam, is found across all plane sections
within the beam (Figure 2.4a). The solution for the maximum stress values, at the abutments,
6
for compression (bottom of beam) or tension (top of beam), max, as well as the maximum
beam deection, , can be easily calculated using closed form beam equartion as follows:
2
maxγSσ =2T
(2.2)
4
2γSδ =
32ET (2.3)
where E is the Young's modulus of the rock and g is the speci®c weight. The maximum
stress at the mid-span is one half of the maximum stress at the abutments. Therefore, for
such a beam with fixed ends and distributed loading, yield is assumed when the maximum
tensile stress, in the upper part of the beam at the abutments, exceeds the tensile strength of
the rock. Vertical tensile fractures form at the abutments and the beam becomes simply
supported (assuming no slip at the abutments), as shown in Fig. 4(b), with a maximum
tensile stress at the midspan given by
2
max2γSσ =3T
(2.4)
This stress is higher than the previous abutment stress, and therefore higher than
the rock tensile strength. This leads to subsequent fracturing centered about the mid span as
shown by Stimpson and Ahmed (1992). This process of progressive cracking at the
abutments, followed by cracking at the midspan and other parts of the beam can be
responsible for a flurry of low-level seismic emissions (rock noise), often encountered in
newly developed underground spans at low to moderate depth. This initial elastic phase fol-
lowed by progressive fracture and deformation of laminated hangingwalls has been observed
and is described in detail by Milne (1996)
7
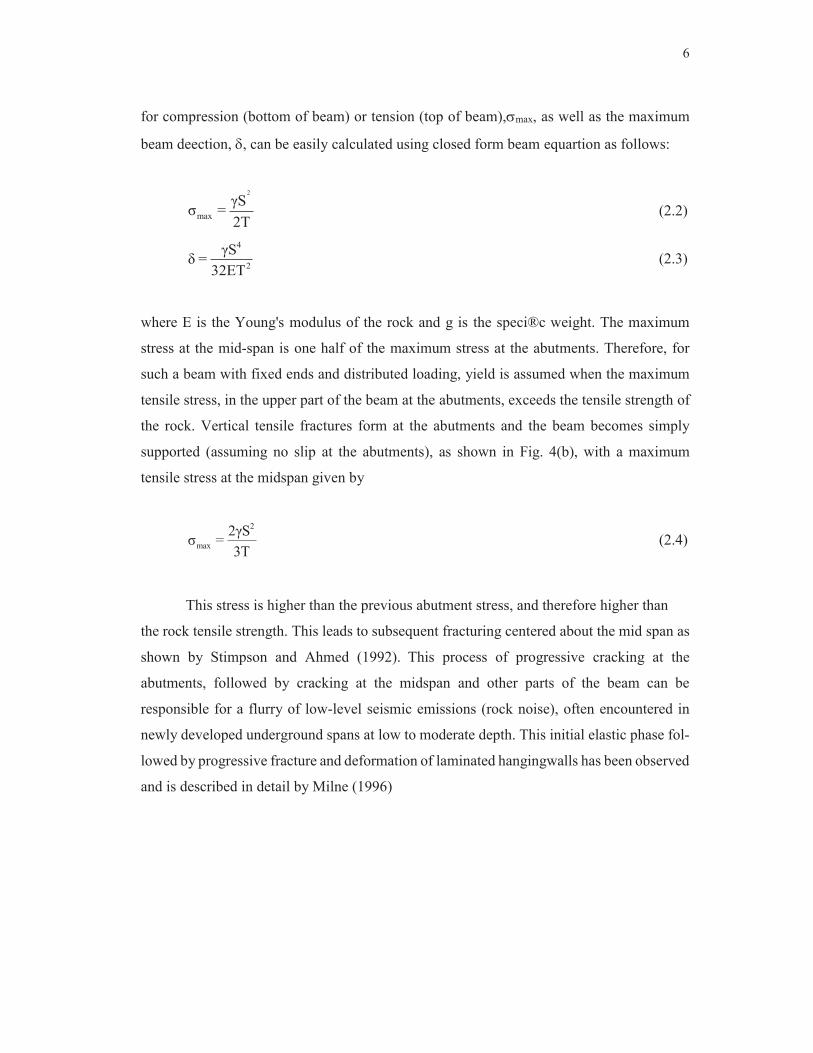
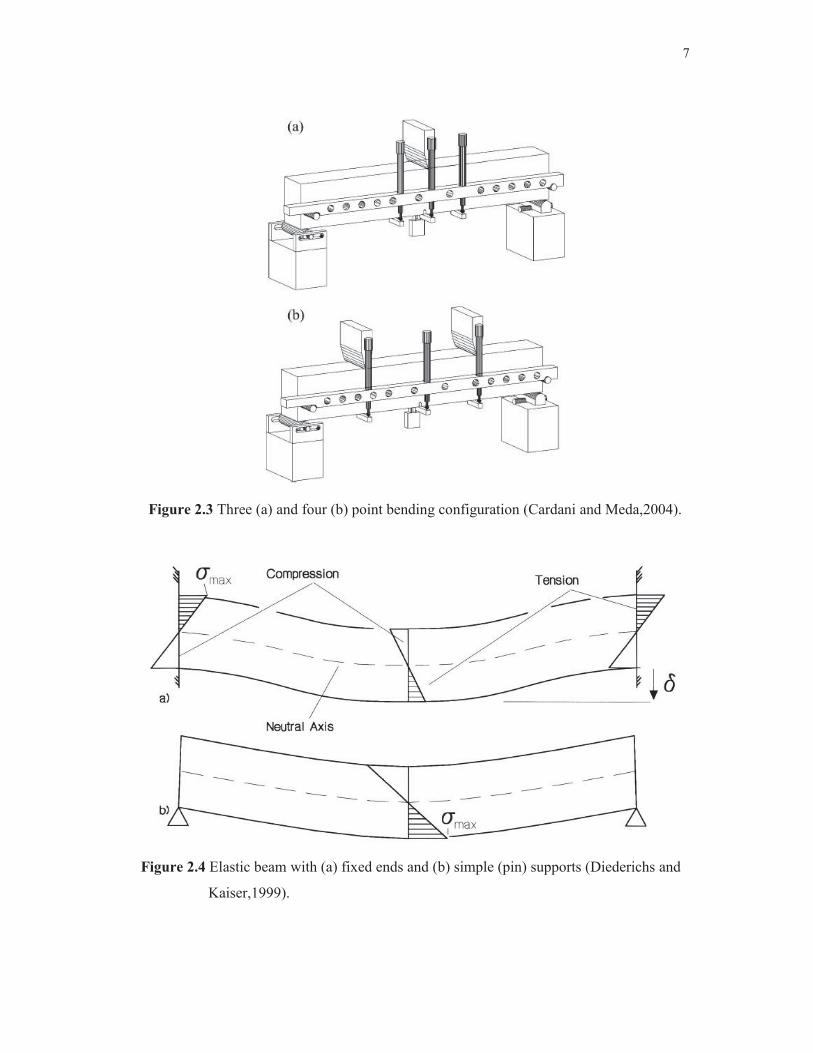
Figure 2.3 Three (a) and four (b) point bending configuration (Cardani and Meda,2004).
Figure 2.4 Elastic beam with (a) fixed ends and (b) simple (pin) supports (Diederichs and
Kaiser,1999).
8
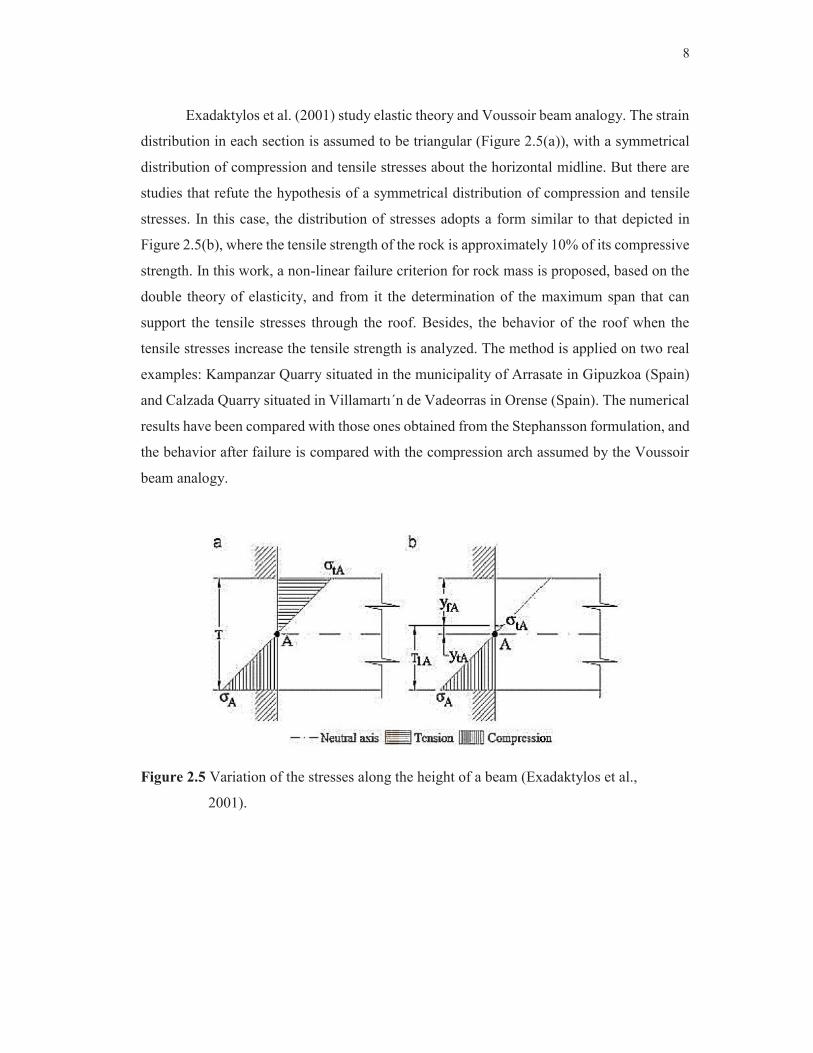
Exadaktylos et al. (2001) study elastic theory and Voussoir beam analogy. The strain
distribution in each section is assumed to be triangular (Figure 2.5(a)), with a symmetrical
distribution of compression and tensile stresses about the horizontal midline. But there are
studies that refute the hypothesis of a symmetrical distribution of compression and tensile
stresses. In this case, the distribution of stresses adopts a form similar to that depicted in
Figure 2.5(b), where the tensile strength of the rock is approximately 10% of its compressive
strength. In this work, a non-linear failure criterion for rock mass is proposed, based on the
double theory of elasticity, and from it the determination of the maximum span that can
support the tensile stresses through the roof. Besides, the behavior of the roof when the
tensile stresses increase the tensile strength is analyzed. The method is applied on two real
examples: Kampanzar Quarry situated in the municipality of Arrasate in Gipuzkoa (Spain)
and Calzada Quarry situated in Villamartı´n de Vadeorras in Orense (Spain). The numerical
results have been compared with those ones obtained from the Stephansson formulation, and
the behavior after failure is compared with the compression arch assumed by the Voussoir
beam analogy.
Figure 2.5 Variation of the stresses along the height of a beam (Exadaktylos et al.,
2001).
9
2.4 Stress gradient effect Claesson and Bohloli (2002) state that the tensile strength of rock is among the most
important parameters influencing rock deformability, rock crushing and blasting results. To
calculate the tensile strength from the indirect tensile (Brazilian) test, one must know the
principal tensile stress, in particular at the rock disc center, where a crack initiates. This
stress can be assessed by an analytical solution. A study of this solution for anisotropic
(transversely isotropic) rock is presented.
Liao et al. (1997) study the tensile behavior of a transversely isotropic rock by a
series of direct tensile tests on cylindrical argillite specimens. To study the deformability of
argillite under tension, two components of an electrically resistant type of strain gage with
a parallel arrangement, or a semiconductor strain gage, are adopted for measuring the small
transverse strain observed on specimens during testing. The curves of axial stress and axial
strain and average volumetric strain are presented for argillite specimens with differently
inclined angles of foliation. Experimental results indicate that the stress-strain behavior
depends on the foliation inclination of specimens with respect to the loading direction. The
five elastic constants of argillite are 13 calculated by measuring two cylindrical specimens.
Based on theoretical analysis results, the range of the foliation inclination of the specimens
tested is investigated for feasibility obtaining the five elastic moduli. A dipping angle of the
foliations (φ) of 30-60° with respect to the plane normal to the loading direction is
recommended. The final failure modes of the specimens are investigated in detail. A saw
toothed failure plane occurs for the specimens with a high inclination of foliation with
respect to the plane perpendicular to the loading direction. On the other hand, a smooth plane
occurs along the foliation for specimens with low inclination of foliation with respect to the
plane normal to the loading direction. A conceptual failure criterion of tensile strength is
proposed for specimens with a high inclination of foliation.
2.5 Tensile strength of rock
The tensile strength is the maximum amount of tensile stress that can be applied
before the rock fails, and is a characteristic property of the rock. Anisotropic strength
characteristics very common for rocks that have pronounced directional features such as
flow structure, are ation and lamination. The tensile strength parallel to the bedding is
usually higher than the foli ensile strength perpendicular to the bedding. There is however
no guarantee that the tensile strength at an angle to the bedding has a value that is between
10
the strength parallel and perpendicular to the bedding. because all fractures across the
bedding planes are caused by tension. Tensile strength of rock is an important parameter
used in the design and stability analysis of underground structures Rock tensile strength
dictates the maximum roof span of underground openings, the stability of boreholes, and the
minimum borehole pressures for hydraulic fracturing process (Klanphumeesri, 2010).
CHAPTER III
SAMPLE PREPARATION
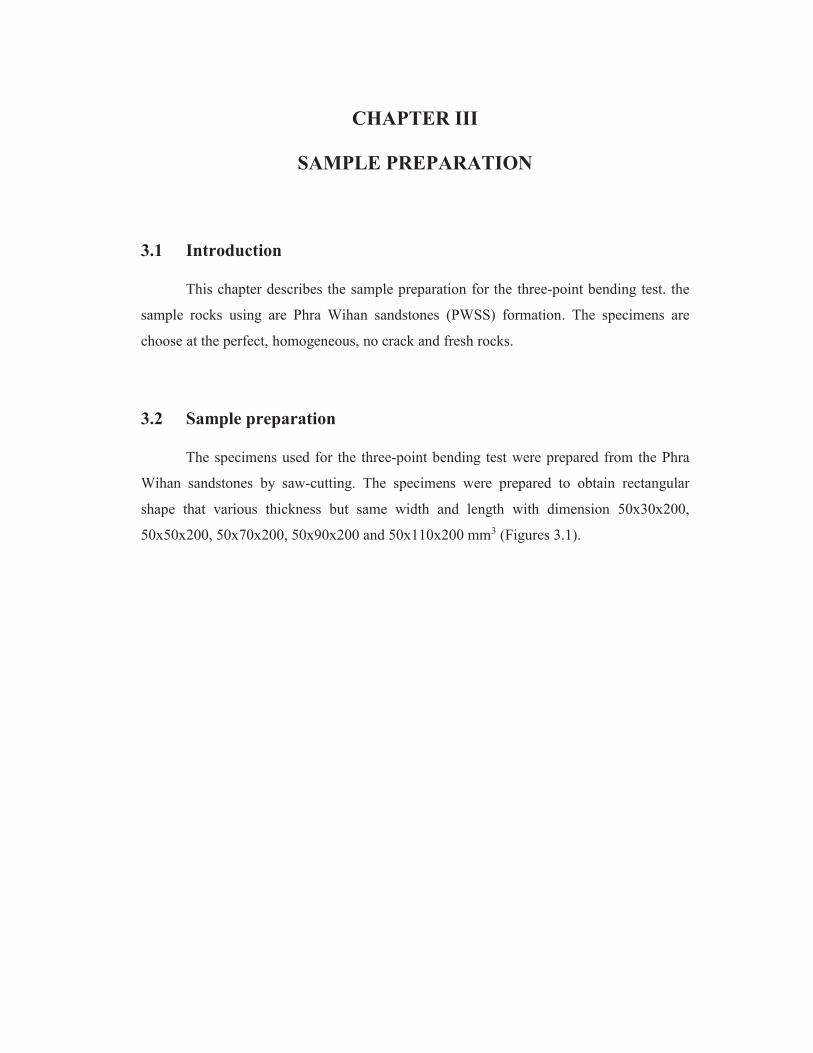
3.1 Introduction
This chapter describes the sample preparation for the three-point bending test. the
sample rocks using are Phra Wihan sandstones (PWSS) formation. The specimens are
choose at the perfect, homogeneous, no crack and fresh rocks.
3.2 Sample preparation
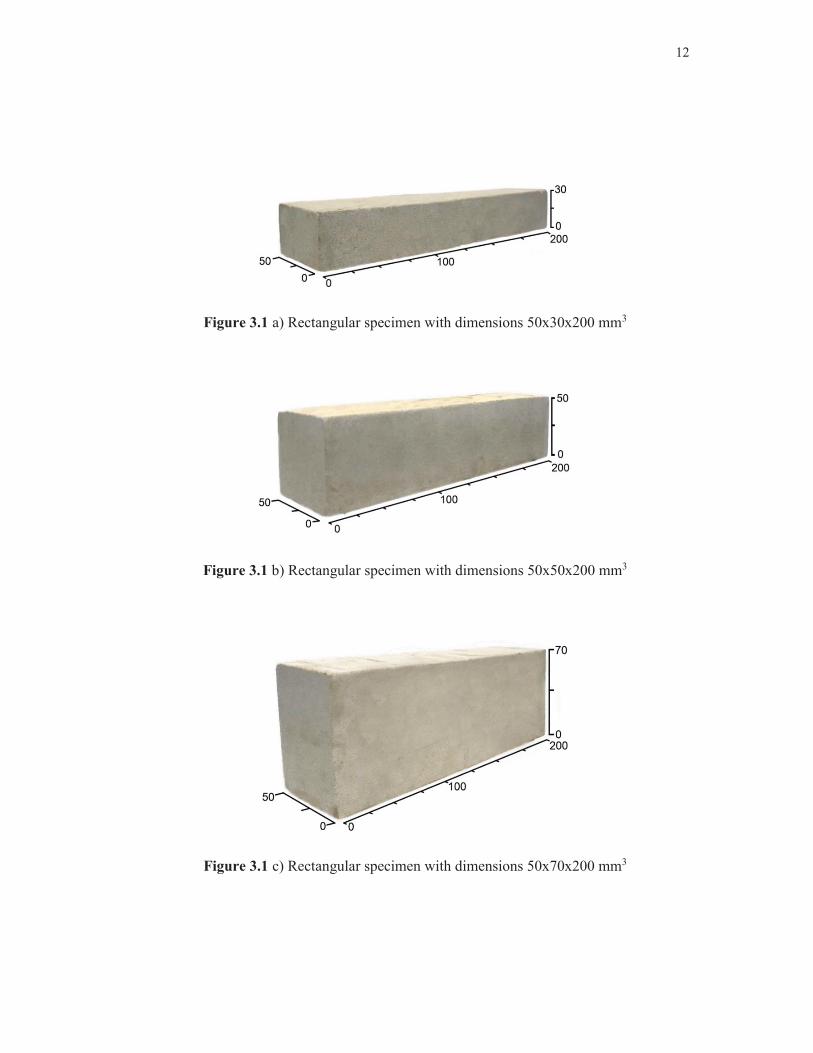
The specimens used for the three-point bending test were prepared from the Phra
Wihan sandstones by saw-cutting. The specimens were prepared to obtain rectangular
shape that various thickness but same width and length with dimension 50x30x200,
50x50x200, 50x70x200, 50x90x200 and 50x110x200 mm3 (Figures 3.1).
12
Figure 3.1 a) Rectangular specimen with dimensions 50x30x200 mm3
Figure 3.1 b) Rectangular specimen with dimensions 50x50x200 mm3
Figure 3.1 c) Rectangular specimen with dimensions 50x70x200 mm3
13
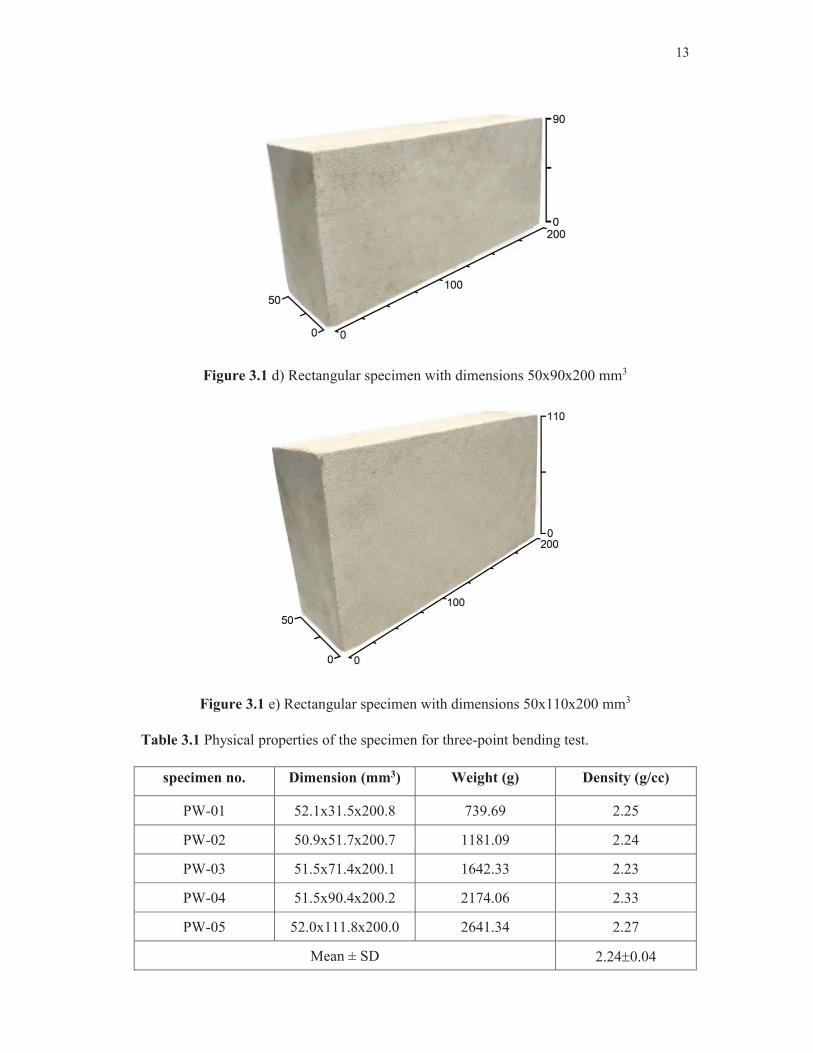
Figure 3.1 d) Rectangular specimen with dimensions 50x90x200 mm3
Figure 3.1 e) Rectangular specimen with dimensions 50x110x200 mm3
Table 3.1 Physical properties of the specimen for three-point bending test.
specimen no. Dimension (mm3) Weight (g) Density (g/cc)
PW-01 52.1x31.5x200.8 739.69 2.25
PW-02 50.9x51.7x200.7 1181.09 2.24
PW-03 51.5x71.4x200.1 1642.33 2.23
PW-04 51.5x90.4x200.2 2174.06 2.33
PW-05 52.0x111.8x200.0 2641.34 2.27
Mean ± SD 2.24 0.04
CHAPTER IV
LABORATORY TESTING
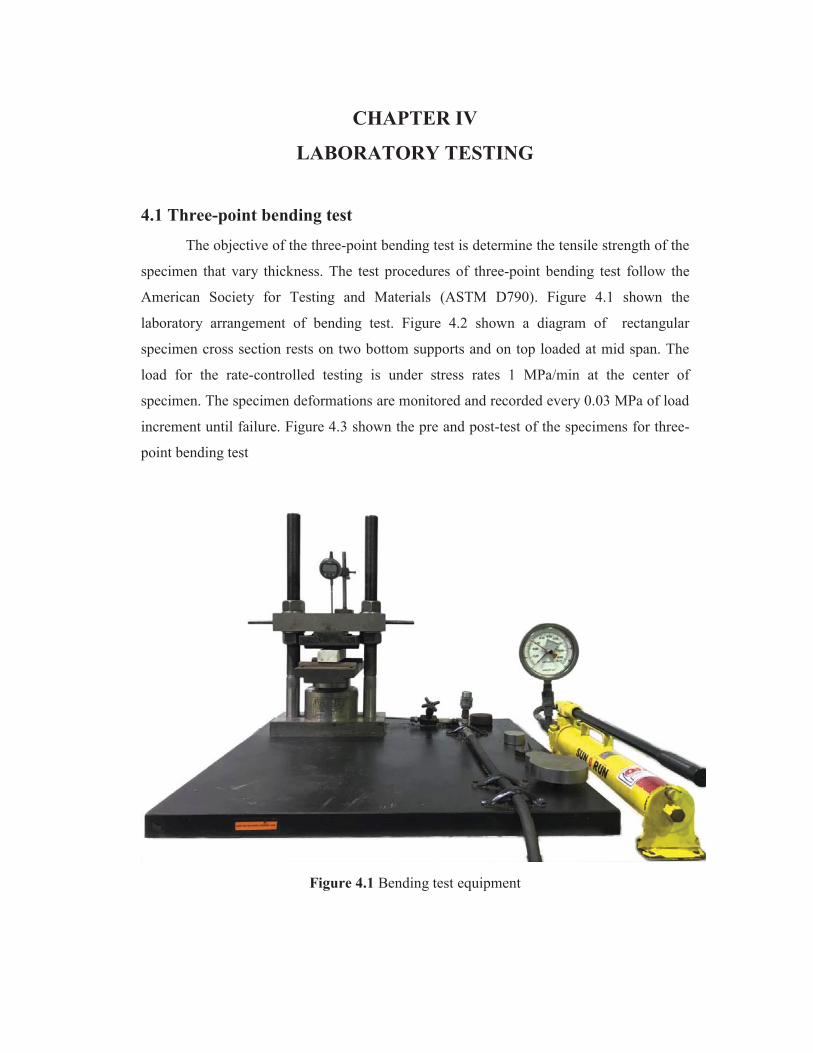
4.1 Three-point bending test
The objective of the three-point bending test is determine the tensile strength of the
specimen that vary thickness. The test procedures of three-point bending test follow the
American Society for Testing and Materials (ASTM D790). Figure 4.1 shown the
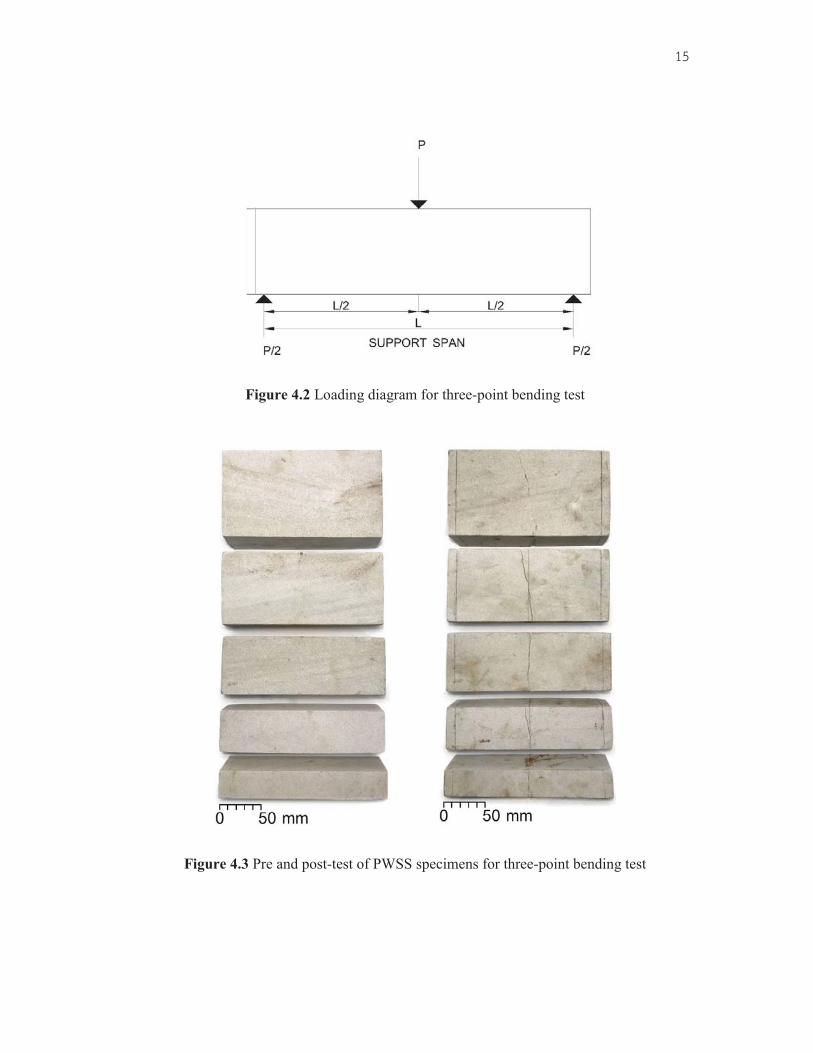
laboratory arrangement of bending test. Figure 4.2 shown a diagram of rectangular
specimen cross section rests on two bottom supports and on top loaded at mid span. The
load for the rate-controlled testing is under stress rates 1 MPa/min at the center of
specimen. The specimen deformations are monitored and recorded every 0.03 MPa of load
increment until failure. Figure 4.3 shown the pre and post-test of the specimens for three-
point bending test
Figure 4.1 Bending test equipment
15
Figure 4.2 Loading diagram for three-point bending test
Figure 4.3 Pre and post-test of PWSS specimens for three-point bending test
16
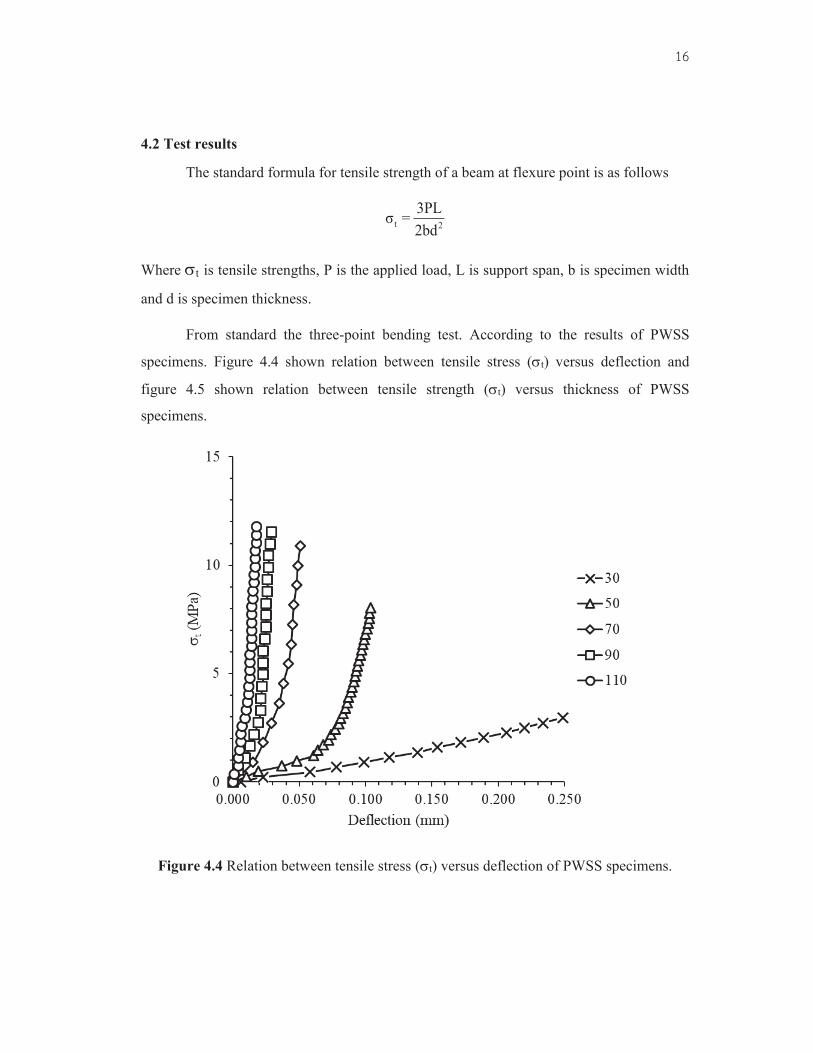
4.2 Test results
The standard formula for tensile strength of a beam at flexure point is as follows
t 2
3PLσ =2bd
Where t is tensile strengths, P is the applied load, L is support span, b is specimen width
and d is specimen thickness.
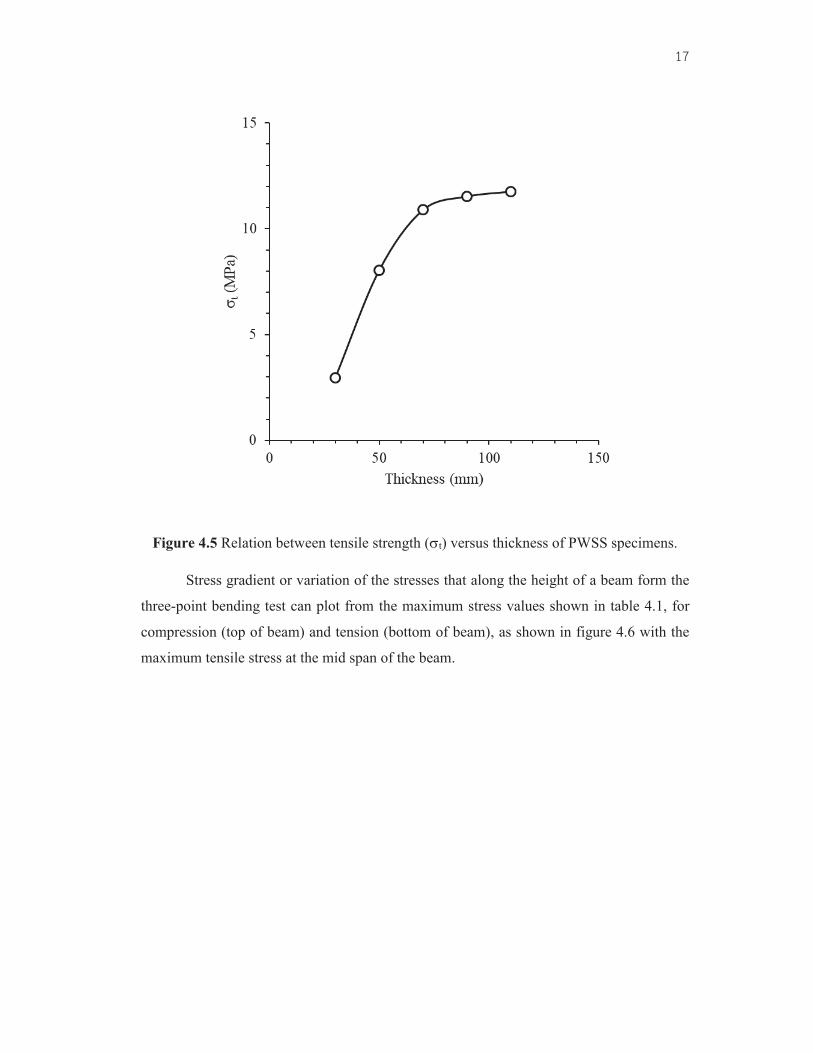
From standard the three-point bending test. According to the results of PWSS
specimens. Figure 4.4 shown relation between tensile stress ( t) versus deflection and
figure 4.5 shown relation between tensile strength ( t) versus thickness of PWSS
specimens.
Figure 4.4 Relation between tensile stress ( t) versus deflection of PWSS specimens.
17
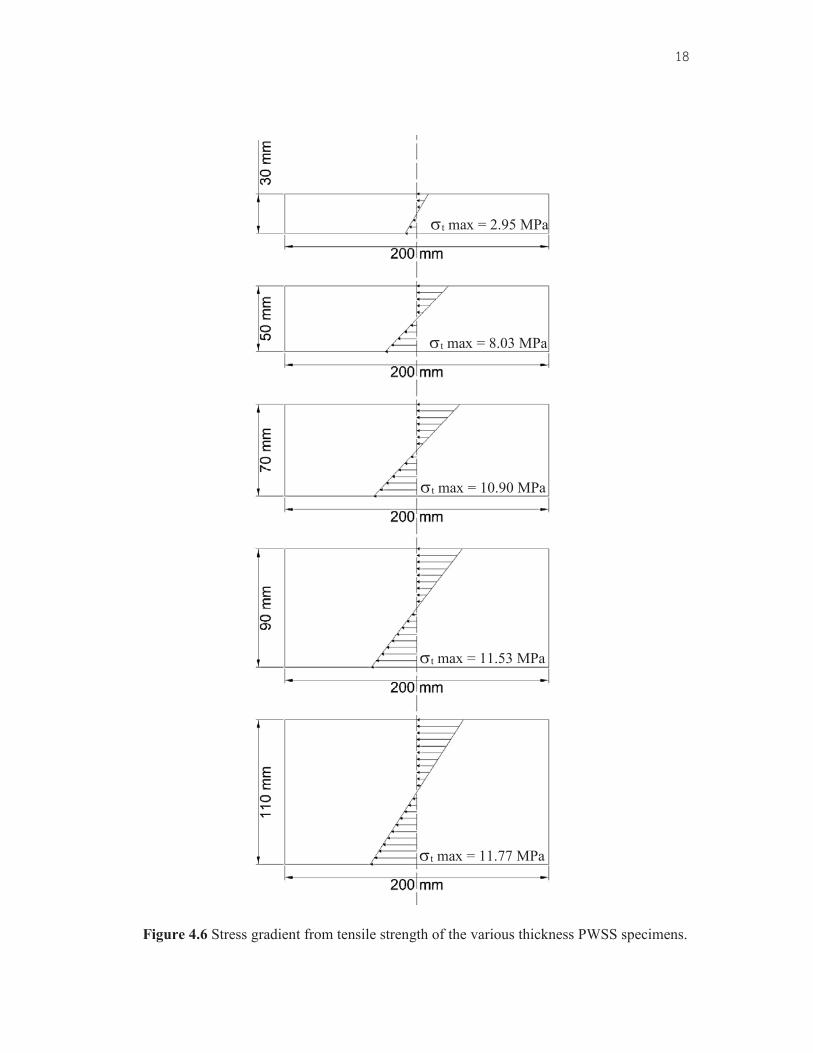
Figure 4.5 Relation between tensile strength ( t) versus thickness of PWSS specimens. Stress gradient or variation of the stresses that along the height of a beam form the
three-point bending test can plot from the maximum stress values shown in table 4.1, for
compression (top of beam) and tension (bottom of beam), as shown in figure 4.6 with the
maximum tensile stress at the mid span of the beam.
18
Figure 4.6 Stress gradient from tensile strength of the various thickness PWSS specimens.
t max = 2.95 MPa
t max = 8.03 MPa
t max = 10.90 MPa
t max = 11.53 MPa
t max = 11.77 MPa
19
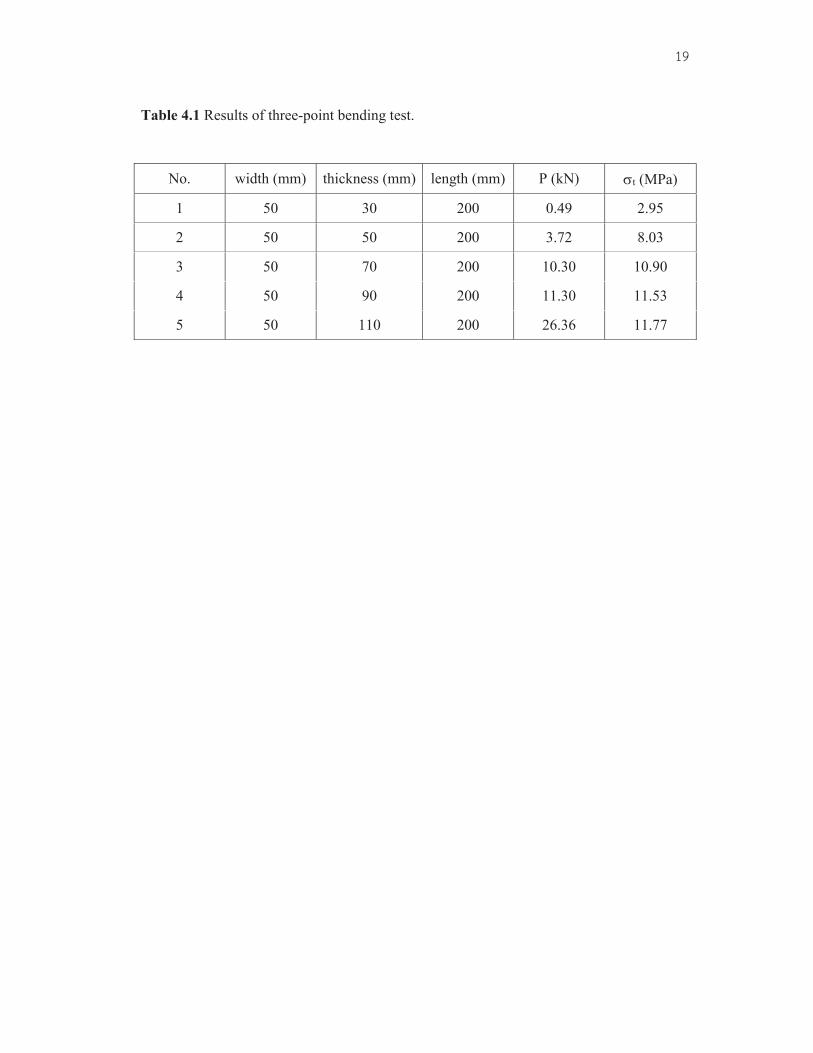
Table 4.1 Results of three-point bending test.
No. width (mm) thickness (mm) length (mm) P (kN) t (MPa)
1 50 30 200 0.49 2.95
2 50 50 200 3.72 8.03
3 50 70 200 10.30 10.90
4 50 90 200 11.30 11.53
5 50 110 200 26.36 11.77
CHAPTER V
DISCUSSIONS, CONCLUSION AND RECOMMENDATIONS FOR FUTURE STUDIES
5.1 Discussions and conclusions
The post-test specimens obtained from the three-point bending test show that the
fractures occur at the center of specimen for all testing. This is because this point is under
maximum tensile stresses. The specimen with high thickness (110 mm) show higher
tensile strengths at failure than those with lower thickness (30 mm) indicate that the
thickness of specimen affect on tensile strength. The thickness increases, the tensile
strength is increased but stresses variation is decreased due to the effect of thickness is
greater than tensile strength.
5.2 Recommendations for future studies
More testing is required on a various rock type and specimen size. May be change
width or length only or both for test about the stress gradient and more type of laboratory
testing should be performed.
21
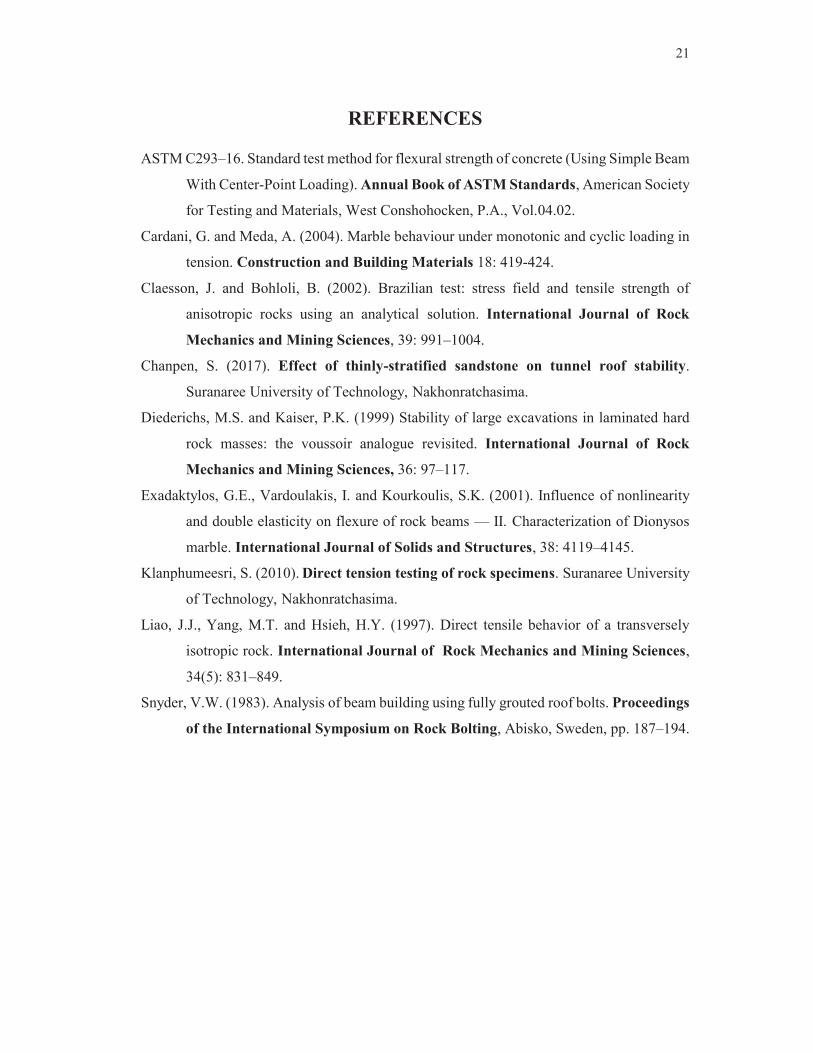
REFERENCES
ASTM C293–16. Standard test method for flexural strength of concrete (Using Simple Beam
With Center-Point Loading). Annual Book of ASTM Standards, American Society
for Testing and Materials, West Conshohocken, P.A., Vol.04.02.
Cardani, G. and Meda, A. (2004). Marble behaviour under monotonic and cyclic loading in
tension. Construction and Building Materials 18: 419-424.
Claesson, J. and Bohloli, B. (2002). Brazilian test: stress field and tensile strength of
anisotropic rocks using an analytical solution. International Journal of Rock
Mechanics and Mining Sciences, 39: 991–1004.
Chanpen, S. (2017). Effect of thinly-stratified sandstone on tunnel roof stability.
Suranaree University of Technology, Nakhonratchasima.
Diederichs, M.S. and Kaiser, P.K. (1999) Stability of large excavations in laminated hard
rock masses: the voussoir analogue revisited. International Journal of Rock
Mechanics and Mining Sciences, 36: 97–117.
Exadaktylos, G.E., Vardoulakis, I. and Kourkoulis, S.K. (2001). Influence of nonlinearity
and double elasticity on flexure of rock beams — II. Characterization of Dionysos
marble. International Journal of Solids and Structures, 38: 4119–4145.
Klanphumeesri, S. (2010). Direct tension testing of rock specimens. Suranaree University
of Technology, Nakhonratchasima.
Liao, J.J., Yang, M.T. and Hsieh, H.Y. (1997). Direct tensile behavior of a transversely
isotropic rock. International Journal of Rock Mechanics and Mining Sciences,
34(5): 831–849.
Snyder, V.W. (1983). Analysis of beam building using fully grouted roof bolts. Proceedings
of the International Symposium on Rock Bolting, Abisko, Sweden, pp. 187–194.