Embed Size (px)
Citation preview

2017 2027Strategy for Inclusion and Reducing Social Inequality in Barcelona

The Strategy on Inclusion and the Reduction
of Social Inequality in Barcelona 2017-2027
is the result of joint work between Barcelona City
Council and entities from the city’s civil society,
within the framework of the Citizen Agreement
for an Inclusive Barcelona.
Management
Department of Social Participation.
Area of Social Rights.
Barcelona City Council
Drafted by
Technical Secretariat for the Citizen Agreement
for an Inclusive Barcelona
(Urban Quality Strategies)
Albert Sales
Josep Villarreal
Emi Pallàs
Publishing coordinated by
Department of Communication
Area of Social Rights.
Barcelona City Council
April 2018
3
Social Rights
2017-2027 Strategy for Inclusion and Reducing Social Inequality in Barcelona
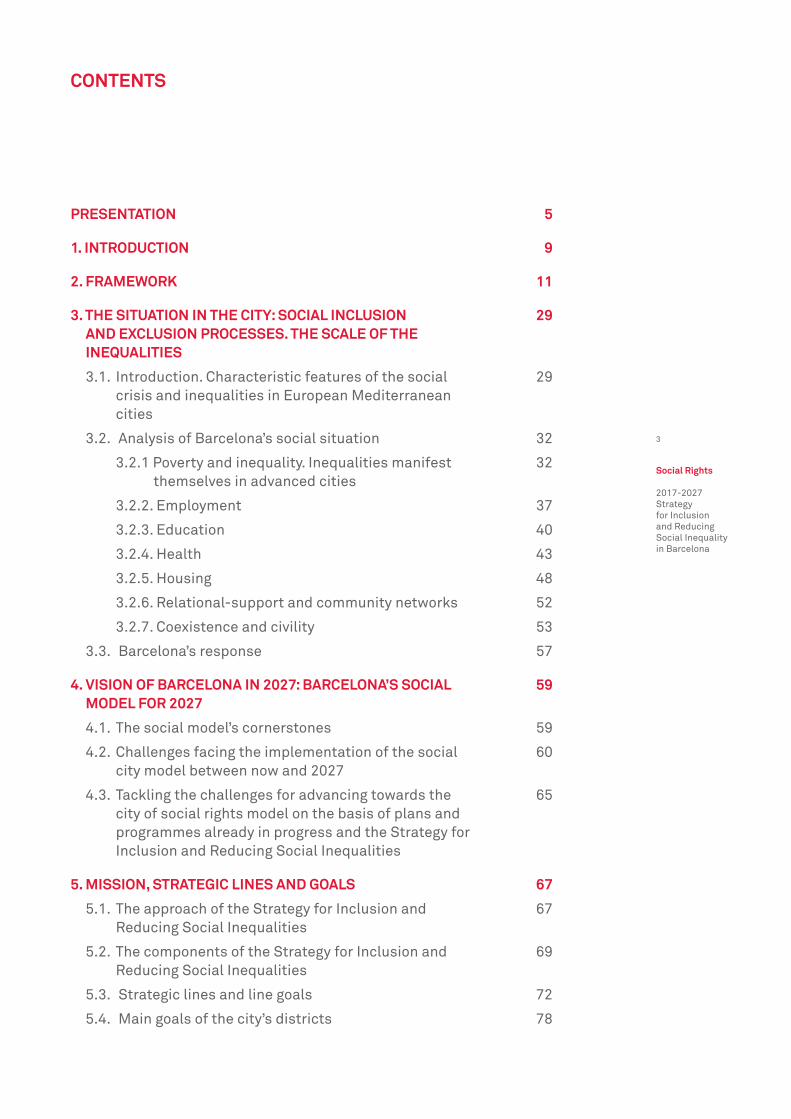
CONTENTS
PRESENTATION 5
1. INTRODUCTION 9
2. FRAMEWORK 11
3. THE SITUATION IN THE CITY: SOCIAL INCLUSION 29 AND EXCLUSION PROCESSES. THE SCALE OF THE INEQUALITIES
3.1. Introduction. Characteristic features of the social 29 crisis and inequalities in European Mediterranean cities
3.2. Analysis of Barcelona’s social situation 32
3.2.1 Poverty and inequality. Inequalities manifest 32themselves in advanced cities
3.2.2. Employment 37
3.2.3. Education 40
3.2.4. Health 43
3.2.5. Housing 48
3.2.6. Relational-support and community networks 52
3.2.7. Coexistence and civility 53
3.3. Barcelona’s response 57
4. VISION OF BARCELONA IN 2027: BARCELONA’S SOCIAL 59MODEL FOR 2027 4.1. The social model’s cornerstones 59
4.2. Challenges facing the implementation of the social 60 city model between now and 2027
4.3. Tackling the challenges for advancing towards the 65 city of social rights model on the basis of plans and programmes already in progress and the Strategy for Inclusion and Reducing Social Inequalities
5. MISSION, STRATEGIC LINES AND GOALS 67
5.1. The approach of the Strategy for Inclusion and 67 Reducing Social Inequalities
5.2. The components of the Strategy for Inclusion and 69 Reducing Social Inequalities
5.3. Strategic lines and line goals 72
5.4. Main goals of the city’s districts 78

4
Social Rights
2017-2027 Strategy for Inclusion and Reducing Social Inequality in Barcelona
6. IMPLEMENTING THE STRATEGY THROUGH PROJECTS 83 AND INITIATIVES
7. THE STRATEGY ACTION PLAN 95
8. COMMUNICABLE MILESTONES FOR 2027 99
9. EVALUATING AND RESCHEDULING THE STRATEGY 103
9.1. The Strategy evaluation levels 103
9.2. The Strategy monitoring and evaluation indicators 105
9.3. The temporary nature of the evaluation 111
10. THE STRATEGY DRAFTING PROCESS 113
11. LIST OF ENTITIES AND ORGANISATIONS TAKING PART 117

5
Social Rights
2017-2027 Strategy for Inclusion and Reducing Social Inequality in Barcelona
PRESENTATION
The last decade’s social policies have been marked by the economic crisis. Austerity policies and the erosion of social protection mechanisms have compelled a large, diverse range of social players to look for solutions to the daily problems of city residents. We have come across front-line emergencies on a local level. We have had to deal with them far too often, without the support of other authorities, and to do more with less as the cuts have reduced the resources at our disposal.
The delegation of responsibilities to municipal authorities and organised civil society has forced us to focus our attention on the people worst hit by impoverishment and on social emergencies. Local authorities such as ours have teamed up with civil society to offer people specific responses, and that has empowered us just as municipalism has become empowered in the aftermath of the crisis. Once again, we have seen how the capacity of local policies yielded better results than the political-engineering measures applied on a State and European level.
Today, the effects of the change in trend of macro-economic indicators are are being spread very unequally among Barcelona’s population. Despite the economic recovery that has been announced, serious problems persist that have been growing at an alarming rate over the last ten years and they will not go away unless decisive action is taken to fight against inequality.
This City Council has prioritised co-production of the city’s strategies and public policies since the start of its term of office, an approach that is absolutely necessary if we want to talk about sustainable policies. Public participation in defining the problems, designing their solutions and then applying them enables us to obtain sounder projects with greater possibilities of success. The horizontal relationship between the local authority and the general public leads to stronger communities.
That is why Barcelona City Council and the more than 700 signatory organisations to the Citizen Agreement for an Inclusive Barcelona, are launching a Strategy for Inclusion and Reducing Inequalities for 2017-2027. The city’s social partners spent a year putting together a roadmap that views Barcelona’s policies from an inclusive perspective. We considered how to build a more inclusive city and create suitable spaces for everyone to be able to develop their life project in, while continuing to respond to the social emergencies of Barcelona’s neighbourhoods. This is the path for achieving a fairer and more democratic society.
The targets set out under this strategy for 2027 and the city model we are heading for are the result of a consensus from a wide range of social players. Under this strategy, Barcelona considers it a priority to reduce inequalities in income and safeguard the social rights of its residents, as a means to increasing fairness and training and educational opportunities, and to strengthening social and community support networks for eradicating stigmatisation and segregation and reducing territorial inequalities.

6
Social Rights
2017-2027 Strategy for Inclusion and Reducing Social Inequality in Barcelona
More than declarations of intent, the signatory organisations to the Citizen Agreement for an Inclusive Barcelona and the various Areas of Barcelona City Council are putting forward nearly 900 projects to help achieve the strategy goals. These are projects that are already or will soon be under way and which will lead to new collaboration spaces between civil society and the municipal authority.
This strategy reaffirms our joint commitment to ensuring a city of rights and opportunities for everyone. But if this milestone is to be achieved, other authorities will also need to accept joint responsibility for it, or provide us with the powers and resources so we can make progress in reducing inequalities. Key issues such as access to housing, the fight against child poverty and looking after the elderly have to be priorities in Catalonia, Spain and Europe just as they already are in Barcelona. We shall only achieve inclusion if all of us, as public authorities, make the effort to put people at the centre of our policies. This is the response that our citizens expect of us.
Ada Colau BallanoMayor of Barcelona
7
Social Rights
2017-2027 Strategy for Inclusion and Reducing Social Inequality in Barcelona
The drafting of the 2017-2027 Strategy for Inclusion and Reducing Inequalities for opens up a new era in Barcelona’s social policies. Barcelona City Council, the signatory organisations to the Citizen Agreement for an Inclusive Barcelona and the city’s other social players worked for a year to define a strategy for the coming ten years, so that Barcelona would be a benchmark city by 2027 that safeguards the social rights of all its citizens, with public responsibility through collaboration and a commitment from social and citizen initiative.
The 41 goals, classed under 5 strategic lines, direct the activity of the city’s social players towards a city model that has made substantial progress in safeguarding social rights. We want Barcelona to be a socially just city by 2027, which guarantees rights, where differences are respected and appreciated, and which acts as a benchmark for fairness, respect, positive community life and solidarity. A habitable and hospitable city that welcomes every one working and living in it, that socially revitalises its neighbourhoods and tackles the processes of eviction caused by financial globalisation. An educating city that opens up a wide range of opportunities for everyone throughout their life. A feminist city, where gender fairness is a reality. And a healthy city, that looks after everyone and where sustainability and environmental justice are inalienable.
The more than 700 signatory organisations to the Citizen Agreement have marked out the course: a series of goals and milestones to be achieved that will take Barcelona closer and closer to the model agreed, following a process of debate and deliberation. This process, in itself, has been a very enriching path for the entire city. In a scenario where improved macroeconomic indicators are having a very unequal impact on the city’s areas and diverse social groups, the debate has s putting it on served to put it on record that a more inclusive city has of necessity to be a less unequal one. This strategy therefore focuses on reducing the inequalities that have grown during the crisis and suggests that inclusive policies should be aimed at all Barcelona’s residents and not just the most vulnerable groups.
But the drafting process does not end with the commitment of all the players to a roadmap for 2027. Organisations, unions, enterprises, local residents’ groups and all the municipal authority’s units and departments have presented nearly 900 projects that are now under way and contributing to one or more of the strategy’s goals. These projects include various initiatives to ensure access to training opportunities for children and young people, housing-access support programmes (created by organisations assisting the homeless) for people in vulnerable situations, support initiatives for carers, initiatives for strengthening social-relation and community-support networks for the elderly and so on This very long list of specific programmes is sewing the seeds for what will steadily grow into involvement over the coming years and increase the impact of the initiatives of a city constantly on the move.

8
Social Rights
2017-2027 Strategy for Inclusion and Reducing Social Inequality in Barcelona
In a context of transforming urban policies, Barcelona aims to be a benchmark. One of the priorities that the European Commission has set out for the coming years is the introduction of SDGs (Sustainable Development Goals. The 2017-2027 Strategy for Inclusion and Reducing Social Inequalities is our roadmap for contributing to them. We focus on people and reducing inequalities, and use inclusive policies aimed at all city residents rather than just the most vulnerable groups. Overcoming inequalities and reducing the impact of exclusion factors is the only way towards the cohesive city we want.
Laia Ortiz CastellvíDeputy Mayor Area of Social Rights

9
Social Rights
2017-2027 Strategy for Inclusion and Reducing Social Inequality in Barcelona
1. INTRODUCTION
1. The space shared between the city’s municipal government and civil society for social inclusion. For further information consult the Agreement website at: barcelona.cat/barcelonainclusiva
This document contains Barcelona’s Strategy for Inclusion and Reducing Social Inequalities for 2017-2027, the city’s new inclusion plan launched by Barcelona City Council under the framework of the Citizen Agreement for an Inclusive Barcelona.1
This Strategy aims to coordinate the social inclusion initiatives of Barcelona City Council and the city’s other players within a ten-year time frame for achieving shared goals, and to promote co-production through networking and giving an impetus to collaborative projects.
The following sections describe this city strategy, which has involved work from all the city’s municipal areas and districts, the Citizen Agreement networks and the city’s associations, organisations and social movements.
The second section looks at the Strategy’s political framework, which focuses on the fight against inequality-generating dynamics in their various aspects. The third section then describes the situation in the city with regard to social inclusion and exclusion processes and Barcelona’s response.
The fourth section describes the vision of Barcelona we want for 2027, which was created by all the players and considers how to tackle the city’s current challenges in order to move towards the model of a city of social rights.
The fifth section examines the Strategy’s mission, strategic lines and goals while the next spells out the projects and services being incorporated into the Strategy within the framework of the various goals.
The seventh section explains the approach of the Strategy’s Action Plan, that is, the projects and co-production networks that need to be boosted in the city.
The eighth section centres on the big milestones that we aim to achieve by 2027, and continues with a description of the Strategy’s evaluation and rescheduling system.
Finally, the last two sections discuss the Strategy’s drafting process and provi-des a list of associations and organisations taking part through their own pro-jects and initiatives.

10
Social Rights
2017-2027 Strategy for Inclusion and Reducing Social Inequality in Barcelona

11
Social Rights
2017-2027 Strategy for Inclusion and Reducing Social Inequality in Barcelona
2. FRAMEWORK
2. C. BORRELL, J. R. VIALLALBÍ, E. DÍEZ, T. BRUGAL, J. BENACH (2002), “Municipal policies. The Example of Barcelona (Chapter 5)”, in Martijntje BAKKER, Johan MACKENBACH (ed.), Reducing Inequalities in Health: A European Perspective, London [and New York], Routledge.
3. BARCELONA PUBLIC HEALTH AGENCY (ASPB), La Salut a Barcelona 2015, Barcelona, Barcelona Public Health Agency, 2016.
Social inequalities show how the resources and opportunities available to people so they can play a full part in society, in the economic, labour, political, cultural and health-care spheres, among others, are becoming fewer and fewer as the social class or socio-economic level worsens; and this is happening exponentially.
The existence of social inequalities in Barcelona has been known for many years, as has the impact of these inequalities. For example, there have been numerous reports and publications since the 1990s showing inequalities in life expectancy and other health indicators, with a clear link to the existing social inequalities in the city.2,3
These inequalities worsened during the financial crisis years and led to an increase in situations of vulnerability and social exclusion. Economic poverty, unemployment and job insecurity, obstacles to accessing decent housing or the loss of such housing, difficulties in accessing health-care services, lack of access to education and training, among many other factors, have extended social exclusion and made our city more unequal and unjust.
The crisis hit a city with a long history of implementing inclusion policies. The first Barcelona Municipal Inclusion Plan, which was approved in 2005, already considered how to contribute a new perspective to the City Council’s policies, with a capacity for describing the new and complex realities of inequality and vulnerability. The City Council later launched and implemented the Barcelona Plan for Social Inclusion, which was rolled out from 2012 to 2015 in a new context of crisis and adapting inclusion policies to a new social and economic environment. Barcelona civil society’s commitment to inclusive policies has been growing at the same time. Since 2005, the Citizen Agreement for an Inclusive Barcelona has provided a participatory and co-production space made up by civil society institutions and organisations working for inclusion and to improve the quality of life of city residents. The development of that Agreement enabled the Joint Strategy for a More Inclusive City to be drafted under the 2012-2015 Plan for Social Inclusion, an experience of governance through shared policies that have gradually been implemented with projects from all the players involved or through the Agreement’s networks and Barcelona City Council.
The complex social and economic context left by the crisis and the maturity of the city’s inclusive policies pose the challenge of drafting a strategy for inclusion and reducing social inequalities where the efforts of civil society, organised in various ways, and the City Council, are geared towards shared goals.
Introduction
12
Social Rights
2017-2027 Strategy for Inclusion and Reducing Social Inequality in Barcelona
Despite the gravity of the crisis and the importance of managing it politically, there is nothing new in the way that the inequalities and exclusion processes are affecting the public. Since 2008, we have experienced social phenomena caused by global and local changes that began over three decades ago particularly strongly. In the context of post-industrial societies there has been an increase in the factors that prevent more and more people from carrying out their life projects under conditions of personal independence and in line with their values. As a result, social and institutional concern regarding economic poverty has gradually extended to formulating policies aimed at reducing social exclusion.
The European institutions, the various public authorities and the academic world have adopted the expression social exclusion as a concept that rounds our and extends the classic definition of poverty, though when we speak of social exclusion we should remember that it is a dynamic, changing process, with many factors that can trigger it, such as those linked to the series of resources and opportunities that people need before they can play a full part in society in the economic, labour and training, political, cultural, health-care spheres, and which are becoming scarcer among some social groups owing to the worsening of social and economic levels or of social classes themselves, which is manifested in social inequalities. The extension of the classic concept of poverty to exclusion allows new lines of inequality and new forms social polarisation which interact with each other to define the structure of the people’s opportunities Social exclusion associated with deep social inequalities is considered to deprive people of the capacity to take part in economic, social, political and cultural life and to arise from the inability of institutional subsystems to safeguard citizens’ rights. An accumulation of failures in the educational and health-care systems, the social services, civic and political participation institutions, the family, and the labour market, leads to hardships such as these unfair differences which exclude people from a society’s majority way of life.

13
Social Rights
2017-2027 Strategy for Inclusion and Reducing Social Inequality in Barcelona
4. S. PAUGAM (2007), Las formas elementales de la pobreza, Madrid, Alianza.
5. H. GANS (1990), “Deconstructing the Underclass: The Term’s Dangers as a Planning Concept”, Journal of the American Planning Association, 177, pp. 271-277.
6. C. RUGGERI, R. SAITH y F. STEWART (2003), “Everyone Agrees We Need Poverty Reduction, but Not What This Means: Does This Matter?”, in Paper for WIDER Conference on Inequality, Poverty and Human Wellbeing, Helsinki. researchgate.net
From the fight against poverty to inclusive policies
The term social exclusion was originally used for highlighting the existence of a polarisation of society between people who follow the majority or integrated lifestyles and a minority kept on the margins of these socially and institutionally accepted life projects.4 The initial use of the concept social exclusion in France in the 1970s defined the situation of people and social groups that developed their daily activities outside the prevailing social norms of industrial society and who remained outside the public social protection network.
Despite the expansion of welfare states and the prevailing economic growth after the Second World War, every industrial society saw to a greater or lesser extent how poverty persisted among specific sectors of the population. Under this framework the problematisation of poverty led to a search for people experiencing it so that they could explain their situations. The designs for social intervention on impoverished populations in the middle decades of the 20th century were meant to have an effect on the situations of individuals and families resulting from physical or mental health problems, poor professional skills, consumption of toxic substances or a combination of these and other factors. The persistence of urban marginality within a strong development framework of social policies was often attributed to the system of values and inappropriate forms of behaviour of a large part of the population in a situation of poverty.5 This conception of poverty leads to blaming and stigmatising the victims. Misfortune is attributed to their own biographies and the policies that are proposed consist in applying individual assistance and social-education strategies.
The civil rights’ movement in the United States and the cultural revolution of May 1968 in Europe gave rise to critical discourses against the treatment of marginality reclaiming the concern for structural impoverishment factors within the framework of welfare states. The French academic and activist environment proposed using the expression social exclusion. Sectors committed to championing subproletarian collectives used this term for referring to the situation of marginalisation from the benefits of economic growth that “traditionally poor” or “always poor” groups found themselves in. The notion of exclusion at the time referred much more to the active process of marginalisation of these groups than to the individual situation of breaking with the labour market and social-support networks. From this perspective, a broad sector of people with functional diversity, part of the elderly people in precarious financial situations, economically impoverished people with health problems, consumers of illegal drugs, people permanently evicted from the housing market and individuals linked to criminal environments, were regarded as making up the bulk of the socially excluded population.6
14
Social Rights
2017-2027 Strategy for Inclusion and Reducing Social Inequality in Barcelona
7. K. DUFFY (1995), Social Exclusion and Human Dignity in Europe, Estrasburg, Council of Europe.
8. R. ATKINSON, S. DAVUDI (2003), “The Concept of Social Exclusion in the European Union”, Journal of Comon Market Studies, 38 (3), pp. 427-448.
The concept of social exclusion came to take on two meanings during the 1980s. On the one hand, the original version that put the emphasis on the structural conditions that forced sectors of the industrial proletariat to the margins of mainstream society and attempted to look beyond the one-dimensional vision of the analysis of economic poverty. On the other hand, another version that looked for the explanatory factors of exclusion in forms of behaviour and individual values that led a small part of the population to marginal lifestyles based on criminal activities, dependence on social assistance and public subsidies, as well as a progressive distancing from the values shared by mainstream society.
It is the first of these meanings, the one that focuses attention on the relationship of individuals with social structures, rights and institutions, that has inspired the promotion of social inclusion policies. The multidimensional nature of the concept of social exclusion has legitimised its gradual replacement of the concept of poverty in European institutions. The definition adopted by some of these institutions considers exclusion as a lack of participation in economic, social, political and cultural life, and a distancing from the mainstream lifestyle in the society referred to.7 Social exclusion would arise where individuals did not see their rights safeguarded in one or more of these areas at the same time.8
This perspective ought to provide the impetus for a transformation of public policies: instead of putting the emphasis on designing insertion mechanisms aimed at people and groups with individual trajectories of impoverishment or breaking with mainstream society, inclusion policies pose the challenge of building receptive social and institutional structures with diverse life projects. Insertion-centred policies give rise to inclusive policies which do not focus on attending to part of the population but rather seek to have an impact on the structural causes of social inequalities.

15
Social Rights
2017-2027 Strategy for Inclusion and Reducing Social Inequality in Barcelona
The social, political and economic changes we have experienced over the last few decades, which have outlined a new era of modernity characterised by constant change, have helped to extend and diversify social risks.9 Industrial modernity has been giving way to what the Polish thinker Zygmunt Bauman called, over a decade ago, liquid modernity.10 The changes that triggered this transition are strongly interrelated and affect the economic and productive, socio-demographic and socio-cultural spheres.11
Technological advances and globalisation have changed the productive structures of industrialisation. The states that were industrial powers decades ago have undergone a sharp process of de-industrialisation with production transferred to other parts of the world. Fordist companies, which were the centre of the economic system, have become post-Fordist companies where productive structures organised into big work centres have become obsolete. The concepts of specialisation, stability and continuity, which defined the labour relations of industrial modernity, have been replaced with flexibility, adaptability and instability.12 People’s relations with the labour market, the stability of financial income over adult life and households’ relations with social protection systems have undergone profound changes as a result of all this.
Socio-demographic transformations have also affected social risks and trajectories of impoverishment and social exclusion. Longer life expectancies and falling birth-rates have led to an ageing of the population that affects how social needs are shaped. Breaking with the exclusion mechanisms that turn ageing into a risk factor is a challenge that will become more serious when people who have spent their working lives in the unstable environment typical of recent times, and the last decade in particular, reach an advanced age. The life stages of childhood and adolescence are particularly affected by inequalities and impoverishment. Children face a higher risk of poverty or social exclusion than the population in general in most countries in the European Union and this is affecting their life trajectories. The lack of adequate support for families with children who are minors, the excessive housing costs that particularly hit the economies of young families, and the job insecurity of parents have also turned child-raising into a risk factor for impoverishment or social exclusion. Preventing these inequality factors from being passed on between generations requires prioritising early interventions in this strategic stage of the life cycle.
Social transformations, exclusion and inequality factors
9. U. BECK (1998), La sociedad del riesgo: hacia una nueva modernidad, Barcelona, Paidós, vol. 78.
10. Z. BAUMAN (2015), Modernidad líquida, México [etc.], Fondo de cultura económica.
11. Marta FERNÁNDEZ, Andreu CAMPRUBÍ and Àlex CARAMÉ (2010), “Noves polítiques per a les noves transformacions socials”, in Polítiques d’inclusió social, Barcelona, Generalitat de Catalunya, Institut Català d’Assistència i Protecció Social (Inclusió Social), pp. 19-30.
12. S. PAUGAM (2007), Las formas elementales de la pobreza, Madrid, Alianza.

16
Social Rights
2017-2027 Strategy for Inclusion and Reducing Social Inequality in Barcelona
13. S. SASSEN (2014), Expulsions: brutality and complexity in the global economy, Cambridge (Mass.), The Belknap Press, an imprint of Harvard University Press.
The international mobility and growth of migratory flows whose destinations are post-industrial societies have also changed the factors of social exclusion and the structure of inequalities. The impetus to the dynamics for expelling people from their homeland has been accompanied by increasingly restrictive policies for controlling migratory movements.13 Administrative situations and nationality have become decisive elements in defining the opportunities people have for developing their life projects. Reducing migrants to the state of manual workers condemns the residents of our cities to situations of social vulnerability and permanent inequality on the grounds of their origins or place of birth.
Finally, socio-cultural changes are occurring that are rooted in a questioning of the traditional division of the public and private spheres. In industrial modernity, the public sphere constituted the area where productive activities were carried out while the private sphere was the family and caring sphere. These spaces, which were separated according to the modern construct of gender roles, represented the basis of the sexual division of labour. The end of industrial modernity has also erased the dividing lines between the public and private spaces with the opening up of the former to female participation and to the marketing of many activities traditionally regarded as within the private sphere. Despite that, gender roles have not substantially changed and double work days have become the norm for many working women. The patriarchal society we live in, with its persistent inequalities and gender discrimination in politics, the economy, work (productive and reproductive), culture and in the organisation of time and jobs, presupposes less power and an overload for women.
These changes make even clearer the need for a multi-dimensional and dynamic approach to the obstacles to exercising full citizenship and social rights. The struggle against social exclusion in all its forms is becoming crucial for building less unequal and, as a consequence, fairer and more cohesive societies.

17
Social Rights
2017-2027 Strategy for Inclusion and Reducing Social Inequality in Barcelona
The crisis that started in 2008 has created a major social concern for poverty due to the intensity with which the job losses and lack of income had affected Catalan households in recent years. Although the term new poverty has been used colloquially for referring to a drastic reduction in the quality of life of Catalan citizens, the truth is that the crisis has highlighted the impact of the social transformations we have experienced in recent decades on the trajectories of social exclusion.
In contrast to previous periods of crisis, the job losses our country has seen over the last few years have affected every level of the working population.14 Unemployment has become a massive phenomenon that has eroded the income of many families. Job losses have affected every level of the labour structure and every sector, especially the building sector, and this has had a severe impact on people from abroad.15 With a weaker network of social relations, occupations that are more insecure and a weaker link to social protection mechanisms, unemployment is a particularly strong factor in the social exclusion of foreign nationals.
Labour policies and the economic situation have accelerated the growth of labour poverty. The proportion of employed people with income below the poverty threshold has grown owing to the rise in part-time and temporary employment. The fall in salaries has been more pronounced in those sectors where they were already low and where a good part of the economic activity is concentrated (such as the retail trade, the hotel and catering industry, personal services and so on). While the first effects of the crisis were felt by the immigrant population, the second wave affected the entire employment structure, which hampered young people’s access to work and life opportunities and forced out of the labour market many people and households that had been enjoying a certain material stability.
The social problems resulting from difficulties in realising the right to housing were considerably worsened from 2008 on and helped to spread the risks of exclusion. But the phenomenon is hardly new. Miloon Kothari, the United Nations Special Rapporteur on Adequate Housing, visited the Spanish State in 2006 and subsequently issued a report in which he concluded that the right to housing had been systematically violated in collaboration and connivance with the public authorities.16 The report criticised the extreme commercialisation that the public housing stock had been subjected to. A life cycle shaped by the
Crisis and consolidation of the new factors of exclusion
14. FOESSA FOUNDATION (2015), Empleo precario y protección social: análisis y perspectivas 2015, FOESSA Foundation. Retrieved from: eapn.es
15. R. M. CASADO and R. DE ARCE BORDA (2010), “Impacto de la crisis laboral sobre la población inmigrante”, Análisis del Real Instituto Elcano (ARI), (21) 1: realinstitutoelcano.org
16. ALEMANY, A. and COLAU, A. (2013), Vidas hipotecadas: de la burbuja immobiliaria al derecho a la vivienda, Barcelona, Cuadrilátero de Libros.

18
Social Rights
2017-2027 Strategy for Inclusion and Reducing Social Inequality in Barcelona
17. S. SARASA and A. SALES (2009), Itineraris i factors d’exclusió social, Barcelona, Barcelona City Council, Ombudsman.
impossibility of having decent housing leads in all probability to exclusion in other aspects of human relations.17 If the lack of access to housing constitutes a factor of social exclusion, undergoing a mortgage foreclosure and eviction or losing a primary residence for failing to pay rent are events that have a harsh impact on people’s life cycle. The sharp rise in the number of households affected by these extreme situations has forced us to rethink the social and institutional responses to exclusion.
The notion and situation of precariousness have likewise gained momentum in this multi-dimensional crisis. Besides the elements of economic inequality and social exclusion linked in particular to the world of employment, a range of problems around worsening health, lack of or difficulties in accessing quality housing, the crisis in caring, energy poverty and lack of personal time or time for taking part in society are shaping new vulnerabilities that have to be taken into consideration for action by the public authorities.

19
Social Rights
2017-2027 Strategy for Inclusion and Reducing Social Inequality in Barcelona
Responses to the impact of the crisis have changed the approaches of social policies. The erosion of the welfare state’s social protection mechanisms and the growth of social emergency situations affected the local authority. Due to its proximity to the general public and the distribution of powers that puts municipal social services in the front line of attention in critical social situations, Catalan local authorities in general and Barcelona City Council in particular have launched policies focusing on halting the most evident effects of the crisis, by providing income for and covering basic needs in the most impoverished households, through emergency aid.
While the initiatives aimed at reducing the impact of the crisis on the various forms of social exclusion are necessary, the city’s inclusive policies need to put greater effort than ever into reviving the mission to change the socio-economic structures in order to realise the social rights of every resident, by strengthening proactive policies for reducing the inequalities and barriers that confront the population worst hit by the processes of impoverishment and social exclusion, so they can develop independent and decent life projects.
Inclusive policies in a post-crisis context

20
Social Rights
2017-2027 Strategy for Inclusion and Reducing Social Inequality in Barcelona
Fighting against exclusion and inequalities in every area of life
Reducing inequalities and fighting against exclusion mean having an effect on a wide range of areas in people’s lives. We can distinguish eight areas in a life that is developed in a social and institutional context where social exclusion factors may operate: the economic and financial situation; the relationship with work (whether or commercialised or not); the spaces for exercising citizenship and participation; health and personal independence; social and family relations; spaces for training and education; housing and the urban environment.
Many exclusion factors can be identified in each of these areas which, when accumulated, force people into situations where neither their rights nor their participation can be realised in mainstream social dynamics. In the economic and financial area, having a low income, an unstable source of income and an inability to deal with unplanned expenses would be factors of exclusion. In the area of work, relevant factors of exclusion would be unemployment, job insecurity, unequal distribution of domestic and care work between men and women, difficulty in making such work compatible with paid work. In exercising citizenship and in the area of participation, factors of exclusion would be limitations on recognising foreign residents’ rights, unawareness of the civic and association civic network, or lack of time to take part in it. In the area of health and personal independence, we could highlight lack of access to the health-care system, situations of dependence and suffering from physical or mental disorders. As for social and family relations, notable exclusion factors include an absence of ties, situations of intra-family violence or a deterioration in the relationship, social-support and community networks. In the area of education and training, relevant factors of exclusion would be having a low level of studies, having poor professional skills and lack of knowledge of working languages. As regards housing and the urban environment, we could consider exclusion factors to include living in an overcrowded dwelling; allocating a disproportionately high amount of income to pay for housing; living in a neighbourhood with poor public transport links or living in a rundown urban environment. The lack of physical and communicative accessibility is another strand of inequality and an exclusion factor in accessing services and citizen participation.
These and many other exclusion factors affect everyone to a varying degree and in various ways. The accumulation of factors and the way in which they interact with each other determine people’s opportunities of enjoying a satisfactory life project. Exercising social, economic and cultural rights is conditional on this structure of opportunities.
The possibility of experiencing these factors of exclusion is conditional on four large determinants of inequality that condition the structure of people’s opportunities. Added to family class origins are sexual orientation, gender identity, age and cohort, place of birth, geographical or national origins and cultural identity, territory, neighbourhood or place of residence.

21
Social Rights
2017-2027 Strategy for Inclusion and Reducing Social Inequality in Barcelona
The logic behind the inclusion policies driven by the European Union since the start of the 21st century suggested that in each of the areas that social exclusion factors operate a division would arise between citizens with and without access to an institutional environment and to realising their social rights. Following that logic, there is a catalogue of actions traditionally linked to the inclusion policies that focus on the population more seriously and obviously affected by social exclusion factors. The paradigm for inclusion, however, suggests going further and embarking on policies aimed at breaking down access barriers by creating an institutionalism that makes more diverse life projects possible.
However, these barriers cannot be regarded dichotomously. The relationship of individuals and families with the social environment depends on a gradient of inequalities that condition opportunities. Therefore, we understand that a more inclusive society is a city with fewer inequalities18 and that reducing inequalities has to be at the heart of policies aimed at making institutions more
Figure 1. Areas of life that social exclusion factors operate in
Context:
social policies, macroeconomic policies, labour market, housing market
Determinants of exclusion processes
Social class
Gender identity and
sexual orientation
Age and cohort
Work Citizenship and participation
Health and personal
independence
Urban environmentSocial and
family relations
Personal and family
economic and financial
situation
HousingTraining and education
Cultural, ethnic or
geographic origins

22
Social Rights
2017-2027 Strategy for Inclusion and Reducing Social Inequality in Barcelona
18. STIGLITZ, J. E. (2012), El precio de la desigualdad: el 1 % de población tiene lo que el 99 % necesita. Madrid, Taurus.
accessible and enabling people to exercise their social rights. What is required are generalist policies directed at the entire population and initiatives that combat the dynamics which create social inequalities in their main aspects:
• Inequality in income.
• Inequality in education and access to culture.
• Inequality in access to association and community assets and to interpersonal networks.
• Stigmatisation and social segregation of individuals and collectives.
• Territorial inequalities.

23
Social Rights
2017-2027 Strategy for Inclusion and Reducing Social Inequality in Barcelona
Research and empirical evidence generated from the 1990s onwards show that social exclusion processes are dynamic and that they are expressed in different ways and degrees throughout people’s lives. Assuming a dynamic conception of social exclusion involves abandoning the idea that people in a situation of exclusion suffer relative hardships that put them outside mainstream living standards and seeking explanations that put the emphasis on interactions between the social structure, institutional context and the circumstances of each individual in each stage in the cycle of life.
Classic studies on social exclusion analyse the absence or weakness of capacities and skills necessary for developing an independent life. Educational level, state of health, economic resources, relationship networks and social skills, access to full citizenship, professional qualifications, etc., were seen as variables explaining situations of social exclusion. Dynamic analyses of social exclusion allow us to observe the relationship between individual hardships and how social institutions operate.19 For example, a serious health problem can constitute a factor of exclusion, although it will have a different effect on each person depending on their relationship with the labour market, access to health-care services, family and social support networks and the social protection mechanisms they can access. These interactions will be very different in the case of someone who suffers a health problem at the start of their working life and someone else who does so after they have retired.
A dynamic view of social exclusion throughout the life cycle compels us to focus our attention on three concepts: events, transitions and trajectories.20 Events are one-off occurrences such as changing job, having a child, the death of a member of the household and being evicted. Transitions are changes that arise in the life situation of individuals. Many of these changes, such as finishing school education, starting work, retiring and raising a family are socially normalised. Others are unpredictable, such as widowhood or losing one’s job and become unemployed. Finally, trajectories are the sequences of transitions that lead from one stage to another in the life cycle.
From the life-cycle analysis perspective, inclusive policies should consider how to have an impact on preventing unpredictable events in people’s lives and how to encourage resilience at times of rupture, to remedy transitions that shape life trajectories in order to prevent exclusion trajectories. That means strengthening the inclusive perspective of the institutions that accompany the people in these transitions.
Tackling the risks of exclusion at every stage of the life cycle
19. H. SILVER (2007), The process of social exclusion: the dynamics of an evolving concept, Department of Sociology Brown University Providence, Rhode Island, USA, CPRC Working Paper 95. chronicpoverty.org
20. G. H. ELDER Jr. (1985), “Time, Human Agency, and Social Change: Perspectives on the Life Course”, Social Psychology Quarterly, Vol. 57, 1 (1994), pp. 4-15.

24
Social Rights
2017-2027 Strategy for Inclusion and Reducing Social Inequality in Barcelona
21. FERNÁNDEZ, J. M. (2000). “La construcción social de la pobreza en la sociología de Simmel”, Cuadernos de Trabajo Social, 13, pp. 15-32.
The main characteristics of new poverty arising from the transformation of European industrial societies is the process of social “disqualification” that people suffering from new poverty go through. When someone who has based their life on paid work is left outside the labour market, the trajectories of social exclusion and impoverishment constitute disqualification factors. Insofar as our societies accepted the myth of equal opportunities as a reality without question, poverty became a disqualifying category. If social success needs to result from work, falling into poverty is an unequivocal symptom of a failure that individuals have to learn to manage.21
According to Paugam (2007), people go through three stages in the process of disqualification. In the first, that of fragility, people who do not manage to enter the labour market and who lose the capacity to generate their own income become conscious of the distance that separates them from the bulk of society or of the situation that the society in question deems desirable. They begin to be identified as people with social problems and have the impression their environment points them out as “poor”. During the fragility stage, such individuals and households attempt to keep away from the social services or social assistance organisations. They feel that entering such circuits as benefit recipients implies a tacit recognition of their situation of poverty and a loss of their personal independence.
By gradually accepting various forms of aid and becoming consciousness of their own social vulnerability, they then enter the stage of dependency. Households that receive assistance from the social services or social assistance organisations are considered to be in a situation of dependency. People who are in this stage are conscious of having given up any prospect of practising a profession, owing to exclusion from the labour market and, having gone through a process of psychological adaptation, assume the need for outside support for their household. It is usual during this stage for people to attribute their situation of need to family responsibilities or blame it on outside circumstances (such as the crisis) so they can reinterpret their own situation and attempt to maintain their self-esteem.
The dependency stage can end up as the precursor to the third stage of the process of disqualification: that of rupture. This is typified by the disappearance of links with most of the social services and assistance organisations and by the adoption of deprived life styles geared to mere survival. The step to a rupture stage can be triggered when financial benefits are lost, by tense situations with the social services that become traumatic, from illnesses or from an accumulation of frustrations that lead individuals to stop seeing the social services or entities as a support (Paugam, 2007). During the rupture stage, people seek financial aid
Fighting against stigmas and disqualifying poverty

25
Social Rights
2017-2027 Strategy for Inclusion and Reducing Social Inequality in Barcelona
or food through informal circuits and social charities and develop mechanisms for rejecting institutional interventions in their own lives and decisions.
Avoiding these trajectories of social disqualification and chronic exclusions is essential if we are to prevent the further widening of the social gap caused by the crisis. Social support mechanisms for the impoverished families and individuals have to coexist with transformational and universalist policies that highlight the link between the difficulties and interests of all the city’s residents.

26
Social Rights
2017-2027 Strategy for Inclusion and Reducing Social Inequality in Barcelona
22. SASSEN, S. (2014). Expulsions: brutality and complexity in the global economy. Cambridge (Mass.), Belknap Press, an imprint of Harvard University Press.
Preventing urban segregation, inequalities between neighbourhoods and the dynamics of expulsion
Expressions of social exclusion are distributed unequally in urban spaces. Besides the inter-neighbourhood inequalities traditionally present there are also new population mobility, expulsion and attraction dynamics that are having profound changes on the make-up of neighbourhoods. The pressure of demand for tourist accommodation, the interest that Barcelona creates for property investors and the gentrification processes being experienced in an increasing number of areas in the city are forcing more and more families to move to other municipalities.
These are identified phenomena which have been rapidly spreading in some neighbourhoods over the last two decades and creating an expulsion dynamic of expulsion due to the difficulties families have in meeting their housing expenses. The forced mobility of families on average or low incomes outside Barcelona is accentuating the social polarisation and eroding neighbourhood relationships. As in many other cities around the world, inequalities are becoming more and more extreme due in part to housing commercialisation and financialisation.22
Halting expulsions and polarisation requires a strong link between social and housing policies, as well as plans for creating a social housing stock and generating housing solutions for groups and individuals in situations of risk spread equally around the city.

27
Social Rights
2017-2027 Strategy for Inclusion and Reducing Social Inequality in Barcelona
Ensuring the gender perspective in inclusion policies
Diversification of family forms and transformations in labour markets in post-industrial societies have confirmed new forms of gender inequality that are finding their full expression in the feminisation of poverty. Women are over-re-presented among the planet’s poorest.23 Women in Barcelona and Catalonia are far more vulnerable when faced with poverty than men are.24
Even in the 1980s there were authors who warned that the neoliberal reforms of welfare states were having a differential impact on men and women and strengthening arguments legitimising the commercialisation of carer jobs and the removal of the public sector from household support in the form of family and child assistance services, educational services and health-care services. It has been asserted that the neoliberal project has maintained the masculine face of the State, while considerably reducing considerably its female face, by limiting services aimed at citizen care.25
The impact of the crisis has not been confined to the productive sphere. It has also had a significant impact on the reproductive sphere. Reductions in household resources have increased the need for all members to take part in the labour market and an increased burden of domestic and care work, borne especially by women owing to cuts in public services and benefits, has also been noted.26 The austerity policies rolled out in Europe in response to the crisis have therefore made gender inequalities worse.27
Policies aimed at reducing inequalities and fighting against exclusion need to incorporate specific initiatives that will correct this European and global trend. Otherwise the patriarchal organisation of society will keep on getting stronger.28
23. UN, Economic and Social Council, “Review and appraisal of the implementation of the Beijing Declara-tion and Platform for Action and the outcomes of the twenty-third special session of the General Assembly”. Report of the Secretary-General.
24. A. BELZUNEGUI and F. VALLS (2014) show in the report La pobreza en España desde una perspectiva de género chow the convergence of the rate of risk of poverty between men and women that has appeared in Spain over the last few years of the crisis is due to the worsening economic situation of families and does not consider the intra-family distribution of resources. Using methodologies that approach the risk of po-verty under the supposition of personal independence, the authors conclude that the rate of risk of poverty is hardly noticeable in the inequalities between men and women and that women continue to suffer from poverty more intensely and frequently.
25. P. BOURDIEU, (2000), La dominación masculina, Barcelona, Anagrama.
26. N. ROSETTI, (2016), “El concepte d’exclusió social: enfocaments, perspectiva de gènere i polítiques d’inclusió”, in DE LA FUENTE, M. (2015), Exclusió social i gènere a l’àmbit local: Transversalitat, intersecciona-litat i empoderament, Barcelona, Institute of Political and Social Sciences.
27. M. KARAMESSINI, J. RUBERY, (2013), Women and austerity: The economic crisis and the future for gender equality, Abingdon, Routledge, Vol. 11.
28. N. ROSETTI (2016), “El concepte d’exclusió social: enfocaments, perspectiva de gènere i polítiques d’inclusió”, in M. de la FUENTE (2015), Exclusió social i gènere a l’àmbit local: Transversalitat, interseccionali-tat i empoderament, Barcelona, Institute of Political and Social Sciences.

28
Social Rights
2017-2027 Strategy for Inclusion and Reducing Social Inequality in Barcelona

29
Social Rights
2017-2027 Strategy for Inclusion and Reducing Social Inequality in Barcelona
3. THE SITUATION IN THE CITY: SOCIAL INCLUSION AND EXCLUSION PROCESSES. THE SCALE OF THE INEQUALITIES
This section aims to briefly put the analysis of the social situation in the context of the social crisis, so we can understand it better and, above all, clarify the challenges it poses and the possibilities and capacities we have in Barcelona for meeting them.
The first thing we need to consider is that we are facing an extremely important social crisis that has been described as structural and which is at the same time an expression of a change of era towards a society that is known as the internet or digital society and affects every social and institutional structure.
This important change is starting in the heart of an old social, economic, cultural and institutional structure and involves serious contradictions and social ruptures. One of the best known is the one that has led to the arrival of global flows of people expelled from their countries by poverty, war or political persecution, among other things, and who are seeking refuge in the more developed European cities. The receiving populations in those cities are in worsening situations of inequality and poverty with fewer social investments as a result of unsuitable supranational macroeconomic policies. These contradictions are used, not infrequently, by xenophobic ideologies seeking confrontation among vulnerable people.
The shape of the new era is not decided. The length and process of change, along with the results, will be very different according to the policies that are implemented and it is for that reason that the future is fundamentally open.
It should also be borne in mind that we cannot confuse the social crisis with the economic recession. In structural crises, the latter usually begins after the social crisis and ends unstably before it. The last example can be seen from the European crisis of 1929, when the economic recession starting that year had already disappeared by the middle and end of the 1930s in many European countries. But the social crisis which triggered it did not start to be overcome until 1945, with the advent of the welfare state, which involved a change in every sphere with regard to the Europe of the previous 30 years.
In the current crisis, and within the framework of the European Union, quite a few countries are now out of the economic recession, although the situation is unstable because the inequalities and poverty that created it not only continue but are getting worse. There is therefore a need for a comprehensive social response in every city.
Cities have not caused the social crisis (even if quite a few urban policies have made it worse), rather it is the result of national and macro-national economic policies centred on reducing social expenditure, the pressure of financial globalisation and specific cultural (money-centred individualist values) and institutional (understanding the public authority as a company) policies.
3.1. Introduction. Characteristic features of the social crisis and inequalities in European Mediterranean cities

30
Social Rights
2017-2027 Strategy for Inclusion and Reducing Social Inequality in Barcelona
The social crisis basically manifests itself in cities, where 78% of Europe’s population lives. By the same token, cities are key to providing a comprehensive response to the crisis, for their capacity to coordinate policies that involve the whole social order and citizens in building the city as a shared asset while realising the right to the city for everyone.
So, we need to ask: what are the main critical issues currently affecting the social situation of cities in Mediterranean Europe?
1. Social inequalities are the main factor of the social crisis and economic instability and one of the determining factors in the direction that the change of era will take.
2. Inequalities of income manifest themselves in advanced cities and specifically in Barcelona, in four key aspects that concern the right to the city and right to the neighbourhood for many people and social groups:
a) Social dualisation: high-income sectors are hardly growing, low-income ones are expanding considerably, while middle incomes are on the wane.
b) Social polarisation: the wealthiest sectors are become wealthier and the poorer ones poorer.
c) Expulsion of the most vulnerable sectors from housing: expulsion in some neighbourhoods causes desertification of the residence function (more tourist accommodation, for example) and, in others, gentrification, that is, the replacement of low-income sectors with higher-income ones.
d) The dynamics of inequality are having an asymmetrical affect on the following variables: gender, age, functional diversities, geographic and cultural origins of the population.
3. Social inequality manifests itself as a multi-dimensional fact; it is not just about income. From the knowledge and internet society perspective, there are three inequalities that are emerging strongly: in education, culture and access to technology (digital gap).
4. Inequalities make vulnerability and social exclusion processes worse. Polarisation, social dualisation and expulsion in particular have a bearing on the spread of vulnerability and exclusion processes, given that they put at risk or directly remove more and more people from areas considered apt for taking part in: sufficient income level, housing, employment, social ties, health, education and social well-being.
5. There is a correlation in practically every city between the poorest neighbourhoods and the weakness of their association network, which affects the capacity for a resilient response. (In other words, it confirms what is known as a lack of social capital).

31
Social Rights
2017-2027 Strategy for Inclusion and Reducing Social Inequality in Barcelona
6. The dynamics of inequality are giving rise to “new” social phenomena: poverty among salaried workers, prolonged periods of unemployment, massive exclusion from housing, their impact on health inequalities – in particular the dependence of life expectancy on the social situation people live in – and in gender and family violence (children and elderly people).
7. The tendency to suffer from mental disorders, such as anxiety or depression, increases in adults during years of recession and a deepening of the social crisis.
8. The number of people in a situation of residential exclusion has grown since the recession of 2008 and the higher figure persists today. It is estimated that 12,904 people are living in this situation in Barcelona.
9. There is a lack of skills among young people for achieving a guaranteed income that would ensure their independence and life projects.
10. The emergence of exclusive attitudes is producing a situation of widespread precariousness which, together with cuts in social investments, is turning into a rejection of others finding themselves in similar social situations, with an increase in racist and xenophobic attitudes against people from third-world countries, as well as a stigmatisation of the poorest and most vulnerable people.
11. Uncertainties and turmoil unleashed by the globalisation of what is social owing to the instability of public policies: development of the European Union’s agreement on refugees, the dynamic of restriction/expansion policies on public and social investment, political developments in the governments of EU countries, and of the EU itself, as well as the countries with the most influence on the economy, society and global sustainability.
12. The need to rethink public policies and direct them towards the new governance of networks and co-production – in the city sphere too – consisting in coordinating public resources and social and private initiatives, as well as citizen commitment and community dynamics, to give resilient and synergistic responses to social challenges and make progress on social rights.

32
Social Rights
2017-2027 Strategy for Inclusion and Reducing Social Inequality in Barcelona
3.2.1. Poverty and inequality. Inequalities manifest themselves in advanced cities
Social polarisation and unequal income distribution
In 2015, disposable family income (DFI) was €19,775. From 2008 to 2015, the difference in per capita disposable family income between the city’s wealthiest and poorest neighbourhoods continued to grow at a sustained rate despite small decreases in 2012 and 2013. The biggest difference in this period was in 2015, when the neighbourhood with the highest DFI had an income that was 7.26 times that of the poorest neighbourhood.
That underlines the unequal income distribution and, therefore, economic inequality seen in Barcelona. Furthermore, it can be seen that the extreme inequalities between the highest and lowest incomes are continuing to grow, with very low and low incomes representing 39.2% (see Figure 2). A look at Figure 2 shows how, beginning in 2007, low incomes expanded considerably during the first four years and, since 2011, have remained at around 40%.
However, and in line with the Barcelona City Council Department of Studies and Planning (2016), grouping the population according to the three main income bands enables us to continue regarding Barcelona as an middle-income city, with 44.2% of the population belonging to this segment.
If we focus on their territorial distribution, we can say that there is an unequal distribution between the districts and neighbourhoods that make up the city. According to data from the Department of Research and Knowledge published by Barcelona Economia (2015)30, we can observe the following: Eixample, Les Corts and Sarrià - Sant Gervasi make up the three districts with the highest disposable family income index throughout the 2006-2015 period. The Sarrià - Sant Gervasi district stands out here, with an average disposable family income index of 188 during that period.31
29. To prepare this section, data have been used from the following surveys, among others:
• Statistical data on Barcelona. Barcelona City Council: estadistica.bcn.cat
• Barcelona Victimisation Survey: ajuntament.barcelona.cat/prevencio
• Survey on social values in Barcelona: bcnroc.ajuntament.barcelona.cat
• Barcelona Public Health Agency Survey on Risk Factors in Secondary Schools (FRESC): www.aspb.cat
• Barcelona Public Health Agency Barcelona Health Survey: aspb.cat
• Barcelona Economia municipal statistics and magazines: barcelonaeconomia.bcn.cat
• Idescat, Catalan Institute of Statistics: idescat.cat
• National Institute of Statistics: ine.es
30. Barcelona Economia (2014). Territorial distribution of disposable family income per capita in Barcelona. Retrieved from: ajuntament.barcelona.cat/barcelonaeconomia
31. See the data in: ajuntament.barcelona.cat/barcelonaeconomia
3.2. Analysis of Barcelona’s social situation29

33
Social Rights
2017-2027 Strategy for Inclusion and Reducing Social Inequality in Barcelona
2015Año 2007 20092008 2010 2012 20142011 2013
% of population
100
90
80
70
60
50
40
30
20
10
0
Very high
Medium-high
Medium-low
Very low
Low
High
Figure 2. Development of Barcelona’s population by broad band of disposable family income (DFI) per capita
Source: Dictamen Desigualtats i vulnerabilitats a Barcelona. City Participation Council. April 2017
On the other hand, Nou Barris, Ciutat Vella and Sants-Montjuïc are the districts with the lowest disposable family income index during the 2006-2010 period, when Sant Andreu replaced Ciutat Vella as the district with the third lowest index. These three districts saw their disposable family income index drop between 2006 and 2015, reaching 22.5%, 12.7% and 4.2%, respectively.
The territorial distribution of the disposable family income index shows a high territorial concentration according to the neighbourhood: in 2015, six of the ten neighbourhoods with the highest disposable family income index were located in the districts of Sarrià - Sant Gervasi and Les Corts. Whereas nine of the ten neighbourhoods with the lowest disposable family income index were located in the Nou Barris district.
Another inequality index, S80/20, measures inequality in income distribution in terms of distance. This indicator is interpreted as the income that is obtained by the top quintile (that is, the 20% of the population with the highest economic level) with respect to that of the lowest quintile (the 20% of the population at the lowest economic level). In 2011 it took a value of 6.1, and showed that 20% of the population with the highest income was 6.1 times wealthier than the 20% of the population with the lowest income. This degree of inequality was greater than that for the rest of the Barcelona Metropolitan Area (AMB), which presented a value of 5.2. Finally, compared to 2006, the S80/20 index has increased by 27% in Barcelona (and by 40.5% in the rest of the metropolitan area).
34
Social Rights
2017-2027 Strategy for Inclusion and Reducing Social Inequality in Barcelona
A third inequality indicator used is the Gini index. This allows us to quantify the difference in income between people of the same country (from 0, perfect equality, to 1, absolute inequality). In 2011, Barcelona was a significantly unequal territory according to the Gini coefficient (0.346), above Catalonia (0.332) and the Province of Barcelona (0.323). According to the Department of Research and Knowledge (2013), inequality in Barcelona is mainly explained by the distance between the highest incomes and the average income of the city’s population. In fact, compared to 2006, years before the start of the economic crisis, the distance has risen considerably, by 3.8 percentage points.
Increased risk of poverty and social exclusion
Poverty and social exclusion are measured from the at-risk-of poverty or social exclusion rate (AROPE, which stands for at risk of poverty and social exclusion). This rate is one of the indicators for the European Union’s EUROPE 2020 Strategy. It is defined under criteria established by Eurostat, which translates into the percentage of the population that is in at least one of these situations: being at risk of poverty, having severe material deprivation32 or having a low labour intensity.33
The percentage of people who were poor or at risk of social exclusion in Barcelona in 2011 rose to 27.7%, a rate below those of the Province of Barcelona (28.4%) and Catalonia (29.4%). In 2016, 22.5% of the Catalan population was at risk of poverty or social exclusion As regards territorial information, the AROPE rate was 19% in the Barcelona Metropolitan Area (AMB) and 16.9% in Barcelona (reduced by 10.8 percentage points).
Another way of measuring poverty is based on the at-risk-of poverty rate for the population aged 16 and over, which is the percentage of people remaining below the poverty threshold. In 2011, the at-risk-of poverty rate for the population aged 16 and over in Barcelona was 18.6%.34 There was an increased risk of poverty among Barcelona’s population during the 2006-2011 period, although this increase differed according to the intensity of the poverty measured.
32. A population with severe material deprivation is one that presents an enforced inability to pay for at least four of the following nine items: 1. Housing-related expenses without arrears (mortgage or rent, gas-utility or community bills) or hire-purchase instalments; 2. An annual holiday away from home for at least one week; 3. A meal consisting of meat, chicken or fish (or vegetarian equivalent) every other day; 4. Unexpected expen-ses; 5. A telephone (including a mobile phone); 6. A television; 7. A washing machine; 8. A car, and 9. Keeping their home at an adequate temperature. idescat.cat
33. Labour intensity in a household is calculated by dividing the sum of the months that the working-age members have worked by the sum of the months during which those members would have been able to work, in the year before the survey. Working-age people are those who are between the ages of 18 and 59 and are not dependent children (dependent children are minors below the age of 16 and people aged between 16 and 24 who live with at least one of their parents and are economically inactive). This variable, then, does not apply to people aged 60 and over. Labour intensity is measured in values ranging from 0 to 1. (Idem).
34. Value expressed according to the Catalan threshold.

35
Social Rights
2017-2027 Strategy for Inclusion and Reducing Social Inequality in Barcelona
In 2016, the relative at-risk-of poverty indicator (which measures the proportion of people with a low income compared to the rest of the population) was 15.4% for the whole Barcelona Metropolitan Area (AMB) and as high as 12.2% in Barcelona. These rates were below the Catalan average, which was 19.2%.
The proportion of the population at risk of poverty, calculated by officially accepted standards on a European scale – with income below 60% of the average of the total distribution of the equivalent disposable income – went up in the city by 2.5 percentage points (from 16.1% to 18.6%). However, the rates within the city differ according to people’s sex. The relative risk of poverty is higher for women (19.7%) than it is for men (17.4%), which shows the effect of the feminisation of poverty.
And that is because inequalities make the vulnerability and social exclusion processes worse. In particular, polarisation, dualisation and social expulsion help to increase inequalities and to spread vulnerability and exclusion processes, given that they are putting at risk or directly removing more and more people from spheres it is considered they should be involved in: housing, employment, social ties, health, education, social well-being, etc.
Finally, the summary social development/vulnerability index (ISDVS) is intended to be a support tool for evaluating and monitoring social inequalities in the city’s various neighbourhoods from 2011 to 2015 and subsequent years. This is an index that summarises the state of each geographical area analysed by combining three basic development/vulnerability aspects: health, education and economy. The ISDVS is calculated from four indicators corresponding to those three aspects: health (life expectancy at birth), education (percentage of the population with a primary education or less and percentage of the population with higher education) and economy (per capita disposable family income). The following table shows the city reference values:
Table 1. Minimum and maximum average value of the indicators that make up the ISDVS. Barcelona, 2015
Neighbourhood
Life expectancy (2009-2013)
% Primary education
or less (2015)
Rate of higher
education (2015)
Disposable family
income (2015, en €)
Summary social
vulnerability index
Average value Barcelona 83,4 24,7 29,4 19.775 802,5
Minimum value
Marina del Prat Vermell -
AEI Zona Franca
75,2 53,9 4,2 7.306 564,8
Maximum value Tres Torres 85,9 8,3 51,7 42.334 956
Source: Department of Research and Knowledge in the Area of Social Rights.

36
Social Rights
2017-2027 Strategy for Inclusion and Reducing Social Inequality in Barcelona
In 2015, the value of the summary social vulnerability index was 802.5.
The city neighbourhood with the lowest vulnerability index (more vulnerable) was Marina del Prat Vermell (564.8). Tres Torres was the neighbourhood with the highest value, at 956 (less vulnerability). There was also a marked geographical concentration according to ISDVS levels. More than half of the neighbourhoods with a smaller ISDVS value were located on the edge of the city.
Finally, it should be noted that in 2011, the value of the index was 1.73 times higher for all the 5 best located neighbourhoods than for the 5 worst located ones. In 2015 this figure was 1.61 times bigger (calculations made taking into account the ratio between the ISDVS average of the 5 neighbourhoods with a highest index and the 5 neighbourhoods with a lower index).
Figure 3. Barcelona Social Development/Vulnerability Index, 2015
ISDVS 2015
(564 - 714)
(714 - 782)
(782 - 855)
(855 - 957)
Source: Dictamen Desigualtats i vulnerabilitats a Barcelona. City Participation Council. April 2017.

37
Social Rights
2017-2027 Strategy for Inclusion and Reducing Social Inequality in Barcelona
35. CIIMU - CONSORCI INSTITUT D’INFÀNCIA I MÓN URBÀ (2014), Baròmetre de la infància i les famílies, 2014, Barcelona, Barcelona City Council.
Inequalities during childhood make social vulnerability processes worse
In analysing inequality and social exclusion we can focus on a specific group, the child population below the age of 16. In 2016, this group included 201,896 children aged 0 to 15, representing 12.6% of the total population.
According to the Barometer of Children and Families (CIIMU, 2014)35, the situation for families changed during the last years of the economic crisis. By way of example, the at-risk-of-monetary-poverty rate for children below the age of 16 was 20.4% in 2011, and showed a higher vulnerability rate for the city’s youngest population over the rest (18.6%). If the variables defining severe material deprivation are analysed in detail, it can be observed that the rate climbed to 12.5% among the youngest population.
Even if we focus on the values reached by the rate of people who are poor or at risk of social exclusion among the population of children under the age of 16, it rose to 29.2% in 2011, meaning almost 3 out of every 10 minors were poor or socially excluded. This rate, as happens in cases of entire populations, was slightly below that for the whole of Catalonia (33.8%).
According to the Barometer of Children and Families (CIIMU, 2014), situations of vulnerability in childhood have a negative effect on certain aspects of a person’s development. For example, living in a household with low levels of income, in a dwelling with poor conditions or being exposed to unsuitable nutrition during childhood, has a negative effect on people’s health as well as their cognitive development, educational results and predisposition to asocial behaviour.
Finally, and following the conclusions reached by the Barcelona Public Health Agency (2015), the proportion of families in neighbourhoods with the lowest incomes who stated they had difficulties reaching the end of the month came to 37.2%, in contrast to the neighbourhoods with higher incomes, where the figure dropped to 14.8%. Another example: 13.3% of children under the age of 16 in the city live in households where they cannot keep their home at a suitable temperature during the winter months and, in the neighbourhoods with lower incomes, the percentage is as high as 25.9%.
3.2.2. Employment
Inequalities affect the job market and job opportunities
In 2016, the number of people unemployed in Barcelona was 82,597, representing an unemployment rate of 11.6%. It should be noted that the rate doubled between

38
Social Rights
2017-2027 Strategy for Inclusion and Reducing Social Inequality in Barcelona
2007 and 2016, from 5.5% to the current rate of 11.6%. Registered unemployment in the city during that period rose from 2007 to 2012, when it reached 18.8%. From then on, it began a downward trend but it has not returned to the pre-crisis levels. No significant differences in unemployment were observed between men and women in 2016, although the unemployment rates were higher for men than they were for women from 2010 to 2012. However, unemployment had a much bigger impact on young people aged 16 to 24, with 19.6% unemployed in 2016 and a maximum of 43.6% in 2012. It can therefore be said that there is a lack of opportunities for young people to achieve a guaranteed income that ensures their independence and life project.
Furthermore, the percentage of very long-term unemployed has not followed the same trend as that of general unemployment (rising from 2007 to 2012 and dropping since then). On the contrary, the same upward trend has continues since 2009, when it stood at 8.1%, to the present day, when very long-term unemployment affects 40.3% of unemployed people.
The number of women out of work for over a month grew by 34.1% between December 2009 and April 2016. The increase for men was 32.5% during the same period. Note that long-term unemployment was higher for women than for men during this period, with percentages that never dropped below 52.5% and which broke the 56% limit in April 2016.
It should also be pointed out that 19.6% of employment contracts were temporary in 2016. That represented an increase of 2 percentage points on 2008, indicating that almost 1 out of 5 wage earners were on temporary contracts. The number of temporary contracts for women was twice that of men, and the number of part-time contracts triple that of men (25.2% compared to 7.9%). A bias directly linked to the need for looking after children, elderly people, adults with an illness or disability, as well as other family and personal obligations. Only 1.8% of men claimed this as a reason.
Table 2. Trend in the specific unemployment rate for Barcelona
Source: Barcelona City Council Municipal Statistics Department, based on a survey of the working population. INE.
2012 2013 2014 2015 2016
Specific unemployment rate in Barcelona 18,8% 17,2% 16,4% 13,3% 11,6%
By sex
Men 21,3% 16,9% 15,8% 12,4% 11,5%
Women 16,1% 17,5% 17,0% 14,1% 11,7%

39
Social Rights
2017-2027 Strategy for Inclusion and Reducing Social Inequality in Barcelona
The reduction in the number of unemployed spread throughout the whole of Barcelona and Catalonia compared to 2012 (see tables 2 and 3). So, the number of unemployed people in Barcelona and Catalonia during this period dropped by 7.2 and 9 percentage points respectively.
Insufficient cover and working poverty
At the same time, data on the rate of unemployment cover (relationship between the number of unemployment benefit recipients and the number of registered unemployed) shows a downward trend in cover since 2009. In other words, it has declined 30.7%, from 71.1% cover for the unemployed population in 2009 to 49.3% today. At-risk-of poverty or social exclusion rate data36 both in Catalonia and in Spain, prepared for the INE Survey on Living Conditions (ECV), have remained high and with a slightly upward trend since 2011.37
The rate of unemployment cover fell by 11 points between 2011 and 2015, as can be observed in the following table:
Source: Survey of the working population. INE.
Table 3. Trend in the specific unemployment rate for Catalonia
2012 2013 2014 2015 2016
Specific unemployment rate in Catalonia 24,0% 22,0% 20,0% 17,9% 15,0%
36. The ECV-2014 at-risk-of poverty rate is the percentage of people whose income is below the poverty threshold.
37. Source: ine.es
Table 4. Trend in the rate of unemployment cover, 2009-2015
Source: Catalan Ministry of Labour, Social Affairs and Families. Generalitat of Catalonia Prepared by the Department of Statistics. Barcelona City Council. NB: Annual data referring to the month of December. Latest data referring to January 2015.
2009 2010 2011 2012 2013 2014 2015
Rate of unemployment
cover in Barcelona71,1% 66,4% 60,4% 58,1% 55,0% 52,8% 49,3%

40
Social Rights
2017-2027 Strategy for Inclusion and Reducing Social Inequality in Barcelona
The latest data on unemployment benefits, according to the union Commissions Obreres (2016),38 show a drop in the number of benefit recipients, both contributory and social security, whereas long-term and very long-term unemployment increased. Social security benefits (those received once unemployment benefits are exhausted, but only where certain requirements are met), are currently gaining ground in the benefits system, having reached 54% of the total, according to CCOO data from 2016. That was different in the years before the crisis, where contributory benefits took up a larger proportion of the benefits system for unemployment and accounted for up to 73% of the total number of benefit recipients, leaving social security-type benefits in second place (26% subsidies and 1.2% non-contributory job seeker’s allowance).
In addition, the percentage of employed persons living on incomes below the at-risk-of poverty threshold in Barcelona more than doubled in 2011. The rate of working poverty that year was 12.8%, having been 5.6% in 2006.
Wage inequality between men and women. The persistence of the wage gap
The wage gap shows the breakdown of the gross annual salary according to sex. In 2015, the average gross annual salary of Barcelona residents was €28,861. That figure did not vary significantly throughout the 2010-2015 period, when it was around €28,700. Despite that, wage differences between men and women persisted. The average wage for men and women during that period was €32,803 and €24,717 respectively, i.e. an average €8,086 less.
Yet the gender gap was down 6.83% compared to 2010. The average salary for women that year was 75.5% of that for men, whereas in 2015 it was 77.24%. It should be noted, however, that the data only refer to the wage-earning population who are not self-employed.
3.2.3. Education
Growth of educational inequality and school segregation
Besides having an unequal distribution of wealth, Barcelona is also a city seriously lacking in equality from an educational perspective, according to the report Oportunitats educatives a Barcelona. It says the poor territorial distribution and socio-economic conditions of the families living in each district are the main causes of this inequality. The study notes that there are areas with lower recorded school attendance for children aged 0 to 2, with more school segregation and with worse educational results.
38. Comissions Obreres press release (2016): ajuntamentbarcelona.ccoo.cat
41
Social Rights
2017-2027 Strategy for Inclusion and Reducing Social Inequality in Barcelona
The school attendance index for children aged 0-2, the relationship between the total number of children in the city and the number of children attending school, experienced an upward trend between 2006 and 2015. It was 42.3% during the 2014-2015 school year, 13.4% than in 2006-2007 (37.3%).
Although children have a right to schooling and the public administration has a responsibility to see it is enforced, educational inequalities and an unequal degree of public intervention are still evident when it comes to guaranteeing the full development of children and teenagers in the area of education (CDE, 2017).39
In short, and according to the report Oportunitats educatives a Barcelona (2017), the family contexts of Barcelona children and teenagers present several levels of education and income, which determine educational access and choice while social diversity affects such phenomena as school segregation.
Significant truancy and early school leaving
Truancy is both an educational and a social problem, as it highlights the econo-mic, social and cultural inequalities of our society. It also reflects the situations of disaffection and conflict that some teachers experience. Such disaffection towards learning is usually expressed through truancy, which ends up as early school leaving (Valiente, Zancajo and Tarriño, 2014).40 However, it should be noted that truancy and early school leaving are not just presented as the consequences of school failure but also its anticipation.
In 2017, Barcelona’s early school leaving index (percentage of young people aged 18 to 24 who have achieved at most the first stage of secondary school education, compared to the entire population of the same age group, and who in the last four weeks have not followed any type of study or training included in official curricula) was 9.5%. This figure represents a growth of 11.8% compared to the previous year, although a 7.8% decrease compared to 2014.
Truancy (referring to the repeated and unjustified absence of a child or young person subject to compulsory schooling or in second stage of infant education at the school where they enrolled) showed a downward trend from the 2007-2008 school year (at 1.49%) to 2011-2012 (0.63%), when the trend reversed and rose to 0.77% during the 2014-2015.
39. CDE - Commissioner for Education and Universities, Oportunitats educatives a Barcelona: l’educació de la infància i l’adolescència a la ciutat [Educational opportunities in Barcelona: children’s and teenagers’ educa-tion in the city], Barcelona, Barcelona Institute for Children and Adolescents, C.
40. O. VALIENTE, A. ZANCAJO and A. TARRIÑO (2014), La formació professional i l’ocupació a Catalunya: Una ullada als indicadors des d’una perspectiva comparada, Barcelona, Jaume Bofill Foundation. Retrieved from fbofill.cat
42
Social Rights
2017-2027 Strategy for Inclusion and Reducing Social Inequality in Barcelona
As regards territorial distribution, it can be seen that the three districts with the highest truancy index were Nou Barris (2.29%), Sants-Montjuïc (1.84%) and Ciutat Vella (1.33%); and the three districts with the lowest were Sarrià - Sant Gervasi (0.12%), Les Corts (0.20%) and Eixample (0.38%).
School failure: a problem that goes beyond the educational system
School failure is one of the problems that not only concern the various educational systems but also society itself.
The percentage of students who failed their basic skills tests in their 4th year of compulsory secondary education (ESO) in Barcelona was 11.5% during the 2013-2014 school year. The difference between the city average and the district with the highest value, Ciutat Vella (35.5%), was over 25 percentage points. Ciutat Vella (35.5%), Nou Barris (20.6%) and, to a lesser extent, Sants-Montjuïc (17.3%), were the districts with the highest percentage of students who failed to achieve basic skills when they finished their 4th year of ESO.
The success rate in the 4th year of ESO (number of students obtaining a general education certificate over number of enrolled students) has been growing throughout the various school years for the last decade, reaching 88.8% in 2015-2016.
From a territorial perspective, it can be observed that Sarrià - Sant Gervasi (94.3%), Les Corts (93.7%) and Eixample (90.2%) had the highest success rates in the city in 2014-2015, in contrast to the Ciutat Vella (75.9%), Nou Barris (80.9%) and Sant Martí (83,1%), which had the lowest rates. As can be seen, the difference between the district with the highest rate of success in the 4th year of ESO, Sarrià - Sant Gervasi (94.3%), and the district with the lowest rate, Ciutat Vella (75.9%), was practically 19 percentage points.
For descriptive purposes we can say the population rate with higher education (university and advanced vocational training) has followed an upward trend over the last seven years, reaching 29.98% in the city in 2016, up almost 8 points on 2009. We also find differences according to sex. For example, in 2016 the rate for women exceeded the city average at 30.7%, while the rate for men only reached 29.1%. More specifically, Ciutat Vella was the district with the biggest difference between the population rate with higher education among women (31.81%) and among men (26.51%), at 5.3 percentage points.
As for territorial distribution, we are talking about almost 35 points of difference between the district with the highest population rate with higher education (Sarrià - Sant Gervasi, with 49.18%) and the district with the lowest rate (Nou Barris, with 13.3%).
For descriptive purposes, we can say the population rate with primary education or less in Barcelona was 22.12% in 2016, a fall o over 13 percentage points over

43
Social Rights
2017-2027 Strategy for Inclusion and Reducing Social Inequality in Barcelona
the last 7 years. In general terms, Nou Barris (34.85%), Ciutat Vella (29.31%) and Sants-Montjuïc (27.15%) have the city’s highest rate. In short, the differential between the district with the highest rate – Nou Barris, 34.85% – and the district with the lowest rate – Sarrià - Sant Gervasi, 7.44% – was 27.41 percentage points in 2016.
Finally, in 2016 the population rate for women with primary education or less was 24.21%, more than 4 differential points compared to the rate for men in the whole of Barcelona; with the exception of the district of Ciutat Vella, where the rate for women was less than that for men (28.35% and 30.17% respectively.
3.2.4. Health
Life expectancies show a positive trend throughout the city, but with large territorial differences
According to data from the Barcelona Public Health Agency,41 in 2014 life expec-tancy at birth had risen to 80.7 for men and 86.6 for women (compared to 80 for men and 86.2 for women in 2011). Over the years, life expectancy for both sexes has shown an ongoing positive trend. For example, life expectancy in Barcelona for the period 2009-2013 was 83.44 and for 2007-2011 it was 82.83.
Barcelona shows an upward trend compared to Catalonia and obtained higher values throughout the periods studied. For example, during the 2009-2013 pe-riod, Catalonia’s population achieved a life expectancy of 82.65 years (compared to Barcelona’s, which was 83.44 years), and during the 2077-2011 period, a va-lue of 82.20 (in contrast to Barcelona, which achieved 82.83).
In particular, it should be pointed out that Les Corts was the district with the highest life expectancy (with values of 85.6 years), while Ciutat Vella was the district that showed the lowest value (81 years).
Note that there were difficulties in comparing life expectancy in the 73 neigh-bourhoods owing to issues of statistical instability, above all in neighbourhoods with small populations, although several methods compared inequalities in life expectancy between the neighbourhoods. For example, aggregating the 5 neigh-bourhoods with the highest and lowest life expectancies for the 2010-2012 pe-riod shows a range of 73.7 to 83.1 in men and 82.4 to 88.8 in women. Another, more robust method, which uses information from all the neighbourhoods to build a linear regression model and adapts it to disposable family income, quan-tified the two extreme life-expectancy values at 6.5 years in men and 1.8 in wo-men (2010-2012 period).
41. Source: aspb.cat

44
Social Rights
2017-2027 Strategy for Inclusion and Reducing Social Inequality in Barcelona
The life-expectancy indicator, like the disposable family income index, shows a high territorial concentration with the highest values in the western part of the city, namely, the districts of Les Corts and Sarrià - Sant Gervasi, and the lowest in the northern area, basically the Nou Barris district.
Similarly, if we focus on the standardised rate of years of potential life lost, that is, the premature mortality rate, it has experienced a downward trend over the last few years. In 2015 the rate had a value of 2,388.5 in Barcelona, 25% lower than the figure for 2006, which was 3,183.6. This rate also presented territorial inequalities.
In this case, the districts of Sants - Montjuïc, Nou Barris and Eixample were the ones that saw the biggest drop over the 2006-2015 period. As for the neighbou-rhoods, 66 of the city’s 73 saw a drop in the premature mortality rate between 2011 and 2015.42
A drop in births among teenage women
Preventing unplanned pregnancies allows teenage women to complete their education and acquire basic knowledge for personal growth. Becoming a parent while a teenager puts extra limits on future job and economic opportunities as well as serious material and social difficulties (ASPB, 2015).43
The teenage fertility rate is defined as the number of live births divided by the population of women aged 15 to 19 (per 1,000). In other words, with regard to the number of births for every 1,000 women aged 15 to 19, from 2008 to 2015, a drop can be seen in the number of births among teenage women throughout Barcelona.
However, the rate of pregnancies among teenage women from low-income countries was triple that for women born in the city: in 2015 the rates were 17.8 and 3.4 per 1,000 women, respectively.
Pregnancies among teenage women show a clear inequality gradient according to their level of education: those with a primary education show the highest fertility rate (13.1 per 1,000 women in the 2007-2015 period), while teenage women with a post-compulsory education level have the lowest fertility rate (5.8 per 1,000 women).
42. Neighbourhood data has been available since 2007 and the observations are made on the basis of five-year periods. It should be borne in mind that in areas where the population volume is lower, the significance of the data is lower as, despite working with five-year data, there are fewer samples.
43. BARCELONA PUBLIC HEALTH AGENCY (ASPB) (2015), La salut a Barcelona 2014, Barcelona Public Health Agency, Barcelona Health Consortium.

45
Social Rights
2017-2027 Strategy for Inclusion and Reducing Social Inequality in Barcelona
The distribution of fertility among teenage women is not homogeneous in the city and shows a pattern linked to neighbourhood poverty. The most disadvantaged neighbourhoods, such as Vallbona, Torre Baró, Trinitat Nova, Ciutat Meridiana and Les Roquetes in the Nou Barris district, Baró de Viver in Sant Andreu, Marina del Prat Vermell in Sants-Montjuïc, and El Besos i el Maresme neighbourhood in Sant Martí were the ones that presented the highest rate of births among teenage women. By contrast, the neighbourhoods with the lowest rate were as follows: Sant Gervasi - la Bonanova (0.3), Sant Gervasi - Galvany (0.7), Putxet i el Farró (1.2), Maternitat i Sant Ramon (1.4), La Salut (1.6), of which three were located in the Sarrià - Sant Gervasi district.
In other words, 6 of the 10 neighbourhoods with the lowest teenage fertility rate were concentrated in the districts of Sarrià - Sant Gervasi and Les Corts. Seven out of the 10 neighbourhoods with the highest rate, on the other hand, were located in the districts of Nou Barris and Sant Andreu. In short, there was a difference of 35.8 births per 1,000 women between the neighbourhood with the lowest rate, Sant Gervasi - la Bonanova (0.3), and the neighbourhood with the highest, Trinitat Nova (36.1).
As for districts, the one that presented the highest teenage fertility rate in 2015 was Nou Barris (14.5), followed by Ciutat Vella (10.4). Sarrià - Sant Gervasi is the one with the lowest rate, ongoing since 2010.
If we compare that with the overall situation in Catalonia, we can see that the fertility rate there has also fallen since 2008, although it reached higher values than in Barcelona, except during the 2010-2014 period, when it reached a value of 7.5 (compared to 8.6 in Barcelona). The teenage fertility rates for the 2011-2015 period both in Catalonia and in Barcelona were similar: 6.9 and 6.7, respectively.
Finally, it needs to be said that not just pregnancy rates and voluntary termination rates (VTP)44 but also fertility rates fell, especially between 2011 and 2015.45 More specifically, it was during this period that the VTP rate was 15.4 per 1,000 women aged between 15 and 19 and the fertility rate was 6.7 per 1,000 women aged 15 to 19.
Note that the drop in the voluntary termination of pregnancy rate has not been followed by a rise in fertility. In other words, teenage women have reduced the number of unplanned pregnancies (Pérez, Llimona, Rodríguez-Sanz, Miranda,
44. The pregnancy rate for women aged 15 to 19 was defined as the number of live births given by women aged 15 to 19 and the VTP of women aged 15 to 19 per 1,000 women in that age group. By contrast, the rate of voluntary interruptions of pregnancy (VIP) at fertile age is the number of abortions divided by the population of women aged 15 to 19 per 1,000.
45. Source: Barcelona Public Health Agency and Department of Statistics. Barcelona City Council (data on fertility).

46
Social Rights
2017-2027 Strategy for Inclusion and Reducing Social Inequality in Barcelona
Prats, Pasarin, 2015).46 Despite this overall reduction, teenage pregnancies are distributed unequally round the city’s neighbourhoods and show a pattern associated with greater vulnerability and poverty in the neighbourhoods.
Drug use also shows territorial differences: higher in the more vulnerable dis-tricts and neighbourhoods
The problem drug use index (ICPD) is a numerical value that orders neighbourhoods according to their drug-use problems, based on several indicators (starts of treatment for substance-use disorder, mortality for adverse reaction to drug use, hospital emergencies for substance use and syringes collected from the streets). The neighbourhoods or districts with higher points are the ones that present greater problems associated with drug use.
So, the district that presented the biggest problems in Barcelona in 2016 was Ciutat Vella, followed by Nou Barris and Sants-Montjuic. The districts that presented the least problems were the districts of Les Corts, Gràcia and Eixample.
So neighbourhoods such as Marina del Prat Vermell, Baró de Viver, Torre Baró, La Barceloneta, El Raval and Canyelles were the ones that presented the worst problems, whereas the neighbourhoods of Pedralbes, Diagonal Mar and La Maternitat i Sant Ramon presented very few problems associated with drug use.
Tuberculosis is more frequent in low-income neighbourhoods
The incidence of tuberculosis in the city shows a downward trend. The incidence of tuberculosis fell by 41.7% during the 2006-2016 period. In 2016 it fell by over 7% compared to the previous year (from 17.4 cases per 100,000 residents in 2015 to 16.16 in 2016).
According to data from the Epidemiology Service of the Barcelona Public Health Agency, the sharpest drop has occurred in the immigrant population. The disease is more common among men than women. In 2016, the rate was 68.9% higher among men than among women.
The disease was more common in the district of Ciutat Vella, with 43.84 cases for every 100,000 residents in 2016.
According to the report La Salut a Barcelona 2015 [Health in Barcelona 2015], if the city’s neighbourhoods are grouped by disposable family income, it can be seen that the illness is more common in low-income neighbourhoods and
46. G. PÉREZ, P. LLIMONA, M. RODRÍGUEZ-SANZ, M. MIRANDA, A. PRATS, M. PASARIN (2015), La salut sexual i reproductiva a la ciutat de Barcelona: Any 2014, Barcelona, Barcelona Public Health Agency. Retrieved from: aspb.cat

47
Social Rights
2017-2027 Strategy for Inclusion and Reducing Social Inequality in Barcelona
becoming less common as incomes rise, in both men and women. In recent years neighbourhoods such as Marina del Prat Vermell and Trinitat Vella top the rankings of neighbourhoods with a high incidence of tuberculosis.47
Perceptions of health, as with many other health indicators, are influenced by social and demographic variables, especially educational and economic levels
The percentage of people in Barcelona in 2016 who said they were perceived to be in poor health was 18.8%, which coincides with the that of 2011.
The percentage differs according to sex. Thus, the value among women (20.6%) was higher than the one for men (16.9%) by over 3.5 percentage points. This difference between men and women represented a drop from 2011, when the difference was 6.2 percentage points.
An age gradient can also be seen for self-perceived poor health: the older a person, the worse their declared state of health. In other words, people over the age of 65 were the ones with the highest self-perception of poor health (42.1%).
As regards socio-economic indicators, educational level and class of work, there is an clear social gradient. People with less training or at a low social and economic level show worse indicators of self-perceived health. In other words, depending on the level of training, people without educational qualification are the ones with the highest self-perceived rate of poor health (56.5%), more specifically, 46.4 percentage points higher than university graduates (10.1%). It should be remembered that people without formal qualifications are concentrated in the higher-age bracket.
Likewise, people with a less privileged employment class of work are the ones with the highest self-perception of poor health (28.10%); 16.7 points higher than those with a privileged employment class.
In relation to mental health, we can speak of the rate of people with self-perceived poor mental health. In this case, the rate of people with self-perceived poor health in 2016 was 18.1%, an 18.3% rise on the original figure from 2006.
Women present worse health indicators than men every year, even though the difference between the sexes has been diminishing over the last few years. In 2006, there was a 9.1% difference in the rate of perceived poor health between men and women. The difference was 2.9 percentage points by 2016, due to the increase in men’s self-perceived poor mental health.
47. When it comes to interpreting the data, it should be taken into account that in areas where the population is smaller, the significance of the data is lower because, despite working with five-year data, the samples are fewer.
48
Social Rights
2017-2027 Strategy for Inclusion and Reducing Social Inequality in Barcelona
In 2016, the highest percentage of poor mental health corresponded to the age bracket of 65 and over (20.5%). A social gradient can also be distinguished in this rate, that is, the people with less training and with a low social and economic level present worse indicators both in self-perceived health and in mental health than for people with a higher educational or economic level. More specifically, in 2016, there was a 24% difference between people with and without university studies . As for class of employment, the highest and lowest were separated by 12.1%.
Finally, we should point out that the population of Catalonia and developed countries had better indicators than the population of the rest of the Spanish State and developing countries.
3.2.5. Housing
One out of every five households allocates over 40% of their annual income to housing expenses
First of all, we can talk about the indicators which measure the percentage of family disposable annual income that is allocated to acquiring housing, that is, the economic effort dedicated to housing. We can see that the cost of rent compared to disposable family income (DFI) fell from 2009, when the property crisis was at its height, and went down by 30.8% in 2012 (from 26% to 18% ).
In relation to rent, we can also observe the change in average monthly rental prices (that is, the price per square metre). This can be divided up into two parts. The first, with a drop of 11%, that lasted from 2007 to 2014; and the second, which began in 2015 and continues to this day, during which prices have recovered their 2008 levels (the highest point of the period) reaching 12.2 euros/m2. The total increase for that period was 6.3%.
As for the territorial breakdown of rental prices, every district followed the trend described above, but with differences. The district with the highest prices for the period, Sarrià - Sant Gervasi, saw them grow by 12% between 2007 and 2016 and experienced hardly any downturn. The district that saw the biggest drop in prices was Nou Barris (10%). Finally, the district that experienced the biggest increase during the period was Ciutat Vella (19.8%).
On the other hand, if we talk about buying, it is worth mentioning in relation to acquiring new property and, therefore, the mortgage percentage with regard to DFI, that the DFI allocated to purchasing new-build housing fell from 57.8% in 2009 to 35.3% in 2016, i.e. 38.9% less, according to the data provided by the Municipal Housing Trust. However, it needs to be borne in mind that this was the market with the least transactions in 2015.
49
Social Rights
2017-2027 Strategy for Inclusion and Reducing Social Inequality in Barcelona
If we focus on second-hand property, we see the economic effort families dedicate to buying fell by 19.4% from 2009 to 2015 (from 35.5% to 28.6%). This market was more dynamic than the new-build property market.
In relation to new housing, and according to data published on the Barcelona Economia website,48 the economic effort, measured by the monthly mortgage instalment as a percentage of DFI, fell by 35.5% from 2007 (51%) to 2015 (33%). Nevertheless, it should be said that this indicator has remained stable since 2012, even rising slightly. In relation to second-hand housing, the economic effort, measured by monthly mortgage instalments as a percentage of the DFI, fell from 33.95% in 2007 (44.6%) to 2015 (29.5%), although it has remained stable since 2009 with values close to 30%.
At the same time, the overload rate for housing expenses, that is, the percentage of households that dedicate more than 40% of their annual family income to housing, was 21.9% in 2011. In other words, 1 out of every 5 households was in this situation. The overload rate for those with fewer resources affected 35% of families with less income compared to 1.9% of those on higher incomes.
That means the percentage of households which experienced arrears in their mortgage or rental payments was 5.9% in 2011. In the case of utility bill arrears, the figure was 9.3% of households. Similarly, there was a 9.2% drop in households finding it hard or very hard to make ends meet at the end of the month from 2011 to 2016 (27.9% to 25.5%), reflecting a slight improvement in households with more economic problems.
Also worth mentioning is the percentage of people unable to keep their home at a suitable temperature (whether during the winter or summer months).49 According to the Enquesta de salut de Barcelona [Barcelona Health Survey], conducted by the Barcelona Public Health Agency, the percentage of people unable to maintain their home at a suitable temperature during the winter months in 2016 was 9.1%. The difference between the districts with the highest and lowest percentages of people unable to maintain their home at a suitable temperature was 16.5 percentage points. It should also be mentioned that in 2016, the percentage of buildings in Barcelona that had some sort of defect, that is, leaks, damp, insect or rat infestation, smoke and gases, among other things, was 19.2%.
Finally, as mentioned in the section on health with data from the Enquesta de condicions de vida [Living conditions survey] from the Barcelona Institute of Regional and Metropolitan Studies (IERMB), in 2011, 9.1% of households in Barcelona were unable to maintain their home at a suitable temperature (during the winter or summer months).
48. Barcelona Economia: barcelonaeconomia.bcn.cat49. This indicator is equivalent to the concept used for the energy poverty rate.

50
Social Rights
2017-2027 Strategy for Inclusion and Reducing Social Inequality in Barcelona
Housing in Barcelona is one of the main factors in social exclusion
The data on legal evictions provide information on evictions from primary homes, second residences and commercial premises. In 2015, the number of legal evictions was 3,098. The period we have data on, 2013-2015, saw a 5.8% drop, representing 191 fewer evictions.
The number of homeless people (following the ETHOS categories of rooflessness, houselessness, living in inadequate housing, living in insecure housing and living in other situations, such as shelters and hostels) likewise saw significant variations during the 2008-2015 period. There was a general increase of 38.8% (from 2,017 people in 2008 to 2,799 in 2015), although a maximum of 3,126 people were registered in 2012. It should be stressed that the most frequent situation for homeless people is staying in shelters (hostels, etc.) which give refuge to somewhere between 50% and 60% of all homeless people.
It should also be noted that there has been a slight increase in the city’s public and social housing stock. The number of social rented dwellings increased by 3.7% from 20011 to 2016, in absolute terms, from 10,201 to 10,583. At the same time, and compared to 2015, the percentage of social rented dwellings grew by 0.6% in relation to the main housing stock.
Even so, these figures are still low when compared to other EU countries. A mere 10,583 of the 680,000 primary homes in the city, which represents roughly 1.5% of the main residential stock, are social rented. The percentage of rented dwellings allocated to social policies increases by nearly 6% if we take into account those handed over to the City Council under various programmes, the city’s inclusion flats, flats owned by banks with customers who are unable to continue paying their mortgage and pay a social rent instead, old-style, rent-controlled flats, and dwellings that receive financial aid when rented out. Nevertheless, the percentage still falls far short of the affordable rents in EU cities such as Amsterdam (48%), Berlin (30%), London (23%) and Paris (17%).
Further information on the demand for public social housing in the city can be seen in data from the Register of Applicants for Social Housing (RSHPOB), given that registration with it is an essential condition for gaining access to social housing (whether public or private) in the city. At the end of 2015 there were 53,889 people entered in the Register, making up 28,238 household units (HUs). Of these, 18,838 (66.70%) were in a severely vulnerable economic situation which, together with other factors, could trigger situations of residential exclusion: 4,936 HUs (17.5%) declared annual incomes of between 0 and 0.37 times the Catalan Income Sufficiency Index (IRSC) (i.e. between €0 and €3,976.07) and 13,902 HUs (49.2%) declared annual incomes of between 0.37 and 1.40 the IRSC (between €3,976.07 and €14,910.28). On the other hand, 6,387 HUs (22.6%) declared annual incomes of between 1.40 and 2.33 times the IRSC (i.e. between €14,910.28 euros and €24,850.48).
51
Social Rights
2017-2027 Strategy for Inclusion and Reducing Social Inequality in Barcelona
Taken together, the demand for public social housing registered in the RSHPOB mainly corresponds to what is known, under Act 18/2007 on the Right to Housing, as a special quota and accounts for 89.3% of the applicant households with incomes less than 2.33 times the IRSC.
Barcelona has a low residential vulnerability average but serious territorial imbalances
Residential vulnerability has been calculated on the basis of a summary index incorporating socio-economic indicators (expressing economic fragility, the need for financial help with subsistence or keeping a home, etc.), socio-spatial indicators (profiling the areas of diversity and the need to manage cultural coexistence to move towards interculturality, social and generational change, over-ageing, senile dependency etc.) and urban planning and socio-urban planning indicators (which add the spatial and functional features of the dwellings, the quality and category of the building, its state of conservation and maintenance, the type of property holding, capacity for access to housing, etc.) A study of this index shows a large part of the city has a low level of vulnerability.
If we observe the territorial distribution, the districts of Eixample and Les Corts do not present areas with a moderate or low level of vulnerability, except for the Colònia Castells block, which is in the process of redevelopment. Leaving aside its outer areas, the Sants-Montjuïc district includes some vulnerable areas concentrated in Poble-sec and Hostafrancs, while the central area of Sarrià - Sant Gervasi presents a low level of vulnerability. There is also a sector with a pronounced risk in the mountain part of this district, specifically in Vallvidrera and Les Planes. Gràcia also offers a fairly resistant image almost in its entirety.
The situation throughout the central stretch of Sant Andreu is one of low or moderate vulnerability and only the north and east of the Front Marítim del Besòs, Bon Pastor and Baró de Viver, where areas of extreme fragility have been identified, stand out.
A significant part of the most disadvantaged areas are concentrated in the districts of Horta-Guinardó and Nou Barris. There is a situation of pronounced vulnerability that affects several neighbourhoods owing to their socio-economic fragility and the physical-urban planning fragility of their buildings and housing, which still calls for improvement channels that need to be rolled out.
Other districts in a situation with a higher level of vulnerability include Ciutat Vella, in particular, El Raval and the south end of the Barri Gòtic, as well as the north-east edge of the city: Ciutat Meridiana, Torre Baró, Vallbona, Trinitat Vella, Can Peguera and La Clota, plus some of the parts of Trinitat Nova, Les Roquetes and El Carmel. El Besòs i el Maresme and El Bon Pastor too, as well as Les Marines and some parts of the Sants-Montjuïc district. The latter is noted for being a

52
Social Rights
2017-2027 Strategy for Inclusion and Reducing Social Inequality in Barcelona
district undergoing transformation, so its future development still needs to be explored. The most vulnerable areas are in the Besòs sector, whereas the sectors being transformed in the central areas present more moderate situations..
3.2.6. Relational-support and community networks
Relational-support and community networks are important for preventing so-cial exclusion processes
In 2011, the percentage of people aged 16 and over who did not turn to anyone when lacking financial resources represented 7.5% of the total population in this age bracket, 6% lower than in 2006. In the case of women, the figure was 10.1%, more than twice that for men (4.9%). It should be noted that there was practically no difference in 2006, before the social, political and economic crisis. In terms of age, the percentage of people who did not turn to anyone when lacking economic resources was lowest for the 50-64 age bracket.50
In 2011, the percentage of people aged 16 and over who did not turn to anyone when ill was 2.3% of the total population in this age bracket, half the corresponding percentage for 2006 (4.5%). The percentage for women (3.4%) was much higher than that for men (0.5%). As mentioned above with the previous indicator, this differential was practically non-existent in 2006. In this case, the age bracket where the percentage of people who do not turn to anyone when ill is much smaller (50-64 years). .
In 2016 the percentage of people aged 16 and over who did not have anyone to speak to about their personal or family problems as much as they would have liked was 8.8%, higher than it was in 2011 (7.8%) and 35% higher than it was 2006 (6.5%).
Finally, the percentage of people belonging to some type of association in 2011 (35.3%) was down on 2006, when practically half of the population did (48.7%). The gap between men and women taking part in some sort of association widened from 8 to 10.8 percentage points from 2006 (men 53.20%, women 44.80%) to 2011 (men 41%, women 30.20%). At the same time, the age bracket showing the highest participation in some entity or association was 75 and over (39.17%).
We can see here that the percentage of people excluded from social relations represented 18.20% of the population in 2011 and 11.6% in 2006. This growing trend has affected both men and women, reaching 19.20% in the case of the former and 17.20% the latter.
50. It needs to be borne in mind that some methodological changes were introduced which prevent the series from being strictly comparable. The size of the sample does not guarantee that the data broken down by age group is significant.

53
Social Rights
2017-2027 Strategy for Inclusion and Reducing Social Inequality in Barcelona
As for number of people over the age of 80 living alone, this has steadily grown over the last 7 years and reached 42,797 in 2016. Of these, 81% are women, a proportion that is roughly the same throughout the districts. The three districts with the greatest concentration of people over the age of 80 living alone are Eixample (7,967), Sant Martí (5,587) and Nou Barris (4,880). Ciutat Vella is the district with the smallest number of people over the age of 80 living alone, totalling 2,143. It may be added here that the percentage of people aged 65 and over without anyone to speak to about their personal and family problems as much as they would have liked was 10.6% in 2016. This figure is similar to the one observed for 2006 (10%), but 28% less than the one for 2011 (14.7%).
In 2016, the percentage of households where there was someone in need of help owing to their being elderly or because they had a chronic illness and who did not have their care requirements met in their home was 34.7%.
Finally, data from the Duke functional social support questionnaire51 suggested that the average value for Barcelona on the Duke social support scale was 85.8 in 2016; a higher value than in 2011 and 2006, when it was 84 and 82.1, respectively.
The purpose of the Duke functional social support questionnaire is to measure perceived functional social support on the assumption that the quality of social support is an indicator of people’s state of health and well-being. The value of the indicator can range from 0 to 100; the higher the value, the larger the perceived social support.
3.2.7. Coexistence and civility
Positive trend towards an increased perception of safety and civility
The perceived level of safety in Barcelona can be seen from data from the Enquesta de victimització [Victimisation Survey].
The data show that the perceived level of safety remained fairly stable between 2009 and 2015, with a trend towards a greater perception of safety, especially in 2014 (see table 5). It should be noted that the level of safety in the neighbour-hoods was usually higher than the level of perceived safety in the city.
The level of safety in both the neighbourhoods and the city rose between 2006 and 2016 by 6.8% and 19.2% respectively. However, it is worth highlighting the drop in the perceived level of safety recorded in 2013 in such districts as Gràcia,
51. Source: Enquesta de salut de Barcelona [Barcelona Health Survey] (2011) following W. E. BROADHEAD, S. H. GEHLBACH, F. V. DEGRUY and B. H. KAPLAN, “The Duke-UNC functional social support questionnaire: measurement of social support in family medicine patients”, Medical Care.

54
Social Rights
2017-2027 Strategy for Inclusion and Reducing Social Inequality in Barcelona
Horta-Guinardó, Nou Barris, Sant Andreu and Sant Martí. A reduction in the level of safety was also observed in some of the city’s districts in 2015: Ciutat Vella, Sants-Montjuïc, Sarrià - Sant Gervasi, Gràcia and Sant Andreu.
Sant Andreu residents were the people with the lowest perceived level of safety in the city (5.8 in 2016). As for neighbourhoods, Ciutat Vella residents were the people with the lowest perceived level of safety in their neighbourhood (5.2 in 2016).
In 2006, the gap between the levels of safety in the neighbourhood and the city was 0.7 points. This narrowed over time to 0.1 in 2016. If we look at this in detail, we can see that men had a higher perceived level of safety than women did, while young people aged 16 to 29 usually had the highest perceived levels of safety.
The perceived level of civility or civic behaviour over the years has been very similar between sexes and between the various districts. The index has remained very stable since 2008. In 2015 it was 5.7 points on a scale from 0 (not civil at all) to 10 (very civil).
Source: Enquesta de victimització 2014 [2014 Victimisation Survey] Note: The perceived level of safety can range from 0 to 10, 0 representing “not safe” and 10 “very safe”.
Table 5. Development of the level of safety in the city and by district
2008 2009 2010 2011 2012 2013 2014 2015 2016
Level of safety in the city 5,6 5,7 5,6 5,4 5,6 5,7 6,0 6,1 6,2
By district
Ciutat Vella 5,7 5,8 5,5 5,4 5,6 5,6 6,1 6,3 nd
Eixample 5,5 5,7 5,7 5,5 5,7 5,8 6,0 6,2 nd
Sants-Montjuïc 5,6 5,7 5,4 5,6 5,6 5,6 5,8 6,1 nd
Les Corts 5,5 5,6 5,5 5,4 5,7 5,7 5,9 6,2 nd
Sarrià-Sant Gervasi 5,4 5,5 5,4 5,2 5,6 5,6 6,1 6,0 nd
Gràcia 5,8 5,7 5,8 5,6 5,8 5,7 6,1 6,1 nd
Horta-Guinardó 5,6 5,7 5,6 5,3 5,5 5,8 6,0 6,1 nd
Nou Barris 5,6 5,7 5,7 5,6 5,4 5,6 5,9 6,2 nd
Sant Andreu 5,6 5,8 5,5 5,5 5,6 5,7 5,9 5,8 nd
Sant Martí 5,5 5,6 5,5 5,4 5,6 5,6 6,0 6,1 nd

55
Social Rights
2017-2027 Strategy for Inclusion and Reducing Social Inequality in Barcelona
The index for perceived civic behaviour in the neighbourhoods was similar but always above the city index. For instance, it was 6.1 points in 2015. Here the di-fferences between the sexes are not significant, although the ones observed at the district level are. Ciutat Vella residents have the lowest perception of civility. In 2015 it was 4.5 points, 1.6 points above the city score.
La convivencia sigue siendo positiva a pesar de la crisis
In 2014, the percentage of people interviewed who believed immigrants were taking resources away from the public services52 was 22.5%, a very similar figure to the percentage observed in 2006 (22.9%). In 2010, in the context of an economic crisis, the percentage of people who thought immigrants were taking resources away from public services was 30.1%.
On the other hand, the percentage of people who experienced a civic behaviour-related or community coexistence-related dispute in their neighbourhood in the previous year was marked by an upward trend between 2011 and 2015, climbing 65.2% from 9.2% to 15.2%.
The percentage of people who believe it is better for a country to have people with different customs and traditions living together also followed an upward trend and reached 83.1% in 2014, i.e. 34% higher than in 2006 (62%).
Discrimination is a phenomenon with a female profile
According to the Enquesta de salut de Barcelona [Barcelona Health Survey], 12.8% of the people surveyed in Barcelona in 2016 said they had experienced some type of discrimination. The type of discrimination that most people stated they had suffered was on the grounds of sex (7.3%).
In 2016, 26.1% of teenagers (13-19 years old) confirmed they had suffered discrimination (on the grounds of sex, country of origin or ethnicity, sexual orientation or capacity) over the previous 12 months. The percentage of women who confirmed they had experienced discrimination (30.7%) was higher than that for men (21.7%).
The percentage of young victims of school bullying was 4.6% of teenagers (13-19 years old) in 2016. The percentage of women who stated they had been bullied (5.4%) was higher than the figure for men (3.8%). At the same time, it can be
52. Enquesta de valors socials [Survey on social values] is conducted every four years. The available data correspond to the years 2006, 2010 and 2014.

56
Social Rights
2017-2027 Strategy for Inclusion and Reducing Social Inequality in Barcelona
observed that teenagers in the 17-19 age bracket suffered less bullying (2.8%), roughly half that for teenagers aged 13 to 17 (5.7%).
If we focus on cyberbullying, in other words, the percentage of young victims bullied at school through the internet, the figure was 8.4% for teenagers (13-19 years old) in 2016. The percentage of women who stated they had been bullied (12.2%) was higher than the figure for men (4.8).

57
Social Rights
2017-2027 Strategy for Inclusion and Reducing Social Inequality in Barcelona
As has been shown, Barcelona, like every other European Mediterranean city, has seen an increase in social inequality and insecurity since 2008.
Since then, the city has reacted as follows:
• Barcelona City Council substantially increased its budget for tackling social exclusion. For example, the budget for the Area of Social Rights – not inclu-ding staff expenditure – went up from €262,147,378 in 2015 to €343,686,600 in 2016 and €415,544,199 in 2017. At the same time, the various Council areas have been implementing numerous sectoral plans and programmes relating to social inclusion.53
• Social organisations have increased the services they offer people by taking on extra staff and channelling the general public’s social commitment through social volunteering.
• New social movements geared towards fulfilling the right to the city, and people’s social rights in particular, have been rolled out and strengthened.
However, what really makes Barcelona stand out is its response to various challenges common to all European Mediterranean cities.
The 2017-2027 Strategy for Inclusion and Reducing Social Inequalities will serve to coordinate 892 projects and services driven by 167 social entities, networks and municipal departments or bodies around shared goals and promote the roll-out of new action networks and projects to drive the coproduction of social inclusion projects on cross-cutting issues that are key to reducing social inequalities in the city.
This capacity for joint organisation and action under the Citizen Agreement for an Inclusive Barcelona is what sets Barcelona’s social action apart from that of any other city.
Social action in the city has managed to resist the social exclusion processes better than the Barcelona Metropolitan Area, Catalonia and the other big cities of the Spanish State, as explained in the evaluation of the 2012-2015 Barcelona Plan for Social Inclusion and the Joint Strategy of the Citizen Agreement.
3.3. Barcelona’s response
53. Consult the TOP Document: a summary of plans on social inclusion in Barcelona on the Citizen Agreement’s website: barcelona.cat/barcelonainclusiva

58
Social Rights
2017-2027 Strategy for Inclusion and Reducing Social Inequality in Barcelona

59
Social Rights
2017-2027 Strategy for Inclusion and Reducing Social Inequality in Barcelona
4. VISION OF BARCELONA IN 2027: BARCELONA’S SOCIAL MODEL FOR 2027
Within the framework opened up by Barcelona City Council’s previous Plan for Social Inclusion (2012-2015) and the Citizen Agreement’s Joint Strategy for a more Inclusive City (2014), we are ready to go further and renew, strengthen and expand the commitments to action between the signatories to the Agreement and the various areas of the City Council with plans and programmes that affect the social inclusion/exclusion process, with the goal of making Barcelona a European and Mediterranean benchmark city by 2027, that guarantees the social rights of all its citizens, with public responsibility and the collaboration and commitment of social and citizen initiative, where new opportunities for social equality are coproduced.
We aim to ensure in 2027 this is a city that has made substantial advances in social rights, where the cornerstones have been laid for Barcelona to be:
• A socially fair, diverse and intercultural city, safeguarding social and civil rights, which respects and values differences, and sets the benchmark for fairness, respect, community harmony and solidarity.
• A habitable and welcoming city, that receives everyone living and working in it with dignity and cooperation, that socially revitalises its neighbour-hoods and which tackles the processes of residential expulsion and gentri-fication (caused by the financial globalisation processes) that change the social make-up of their residents.
• An educating city, that opens up a wide range of opportunities for everyone throughout their lives.
• A feminist city, where gender fairness is a reality and a benchmark city for making universal the right to diversity in sexual orientation and gender identity.
• A healthy city that looks after everyone, which offers accessible services and the right environment for personal and collective development, with environmental sustainability and justice, cohesion, and empowered, active and socially committed citizens.
4.1. The social model’s cornerstones

60
Social Rights
2017-2027 Strategy for Inclusion and Reducing Social Inequality in Barcelona
In order to make substantial progress on the city model, we are preparing to tackle the following challenges in a coordinated and synergistic fashion:
A. The challenges for creating a socially fair, diverse and intercultural city, safeguarding social and civil rights, a city which respects and values differences, and is a benchmark for fairness, respect, community harmony and solidarity, are:
Ensuring people receive an income and have their basic needs covered
• Through income-transfer policies for people and families at social risk as a result of long-term unemployment, wage instability and other situations that make economic poverty worse and put their subsistence in the city at risk.
• Ensuring basic needs in terms of food, access to basic utilities for households under a model for energy sustainability and for physical and financial access to mobility for the entire city.
• Establishing plans and programmes with positive action measures in the social sectors worst hit by situations of inequality and poverty.
Quality employment and the social economy
• Increasing investment in the city that can promote a diverse and plural economic model to generate more and better-quality jobs, with equal employment opportunities for women, young people and adults over the age of 45 or with disabilities as a priority, while maintaining employment and social opportunities for the long-term unemployed.
• Implementing active employment policies that intervene in the labour market to improve it by tackling unemployment and the specific job insecurity of young people, women and people over the age of 45.
• Making the City Council and all the players involved in the Strategy for Inclusion key stakeholders in generating employment with decent conditions, both in the value content of the jobs and the quality of the contracts and salaries.
• Boosting entrepreneurial and social collaboration to introduce economic activities with added value, establishing minimum standards for peripheral jobs with decent contracts and salaries that people with fewer educational or training skills can live on.
• Promoting the development of the social and solidarity economy as a socially inclusive alternative economy, as well as creating the necessary regulatory conditions for such kinds of enterprises to have more opportunities for securing public contracts.
4.2. Challenges facing the implementation of the social city model between now and 2027

61
Social Rights
2017-2027 Strategy for Inclusion and Reducing Social Inequality in Barcelona
Citizen rights
• Covering the basic rights for a decent, independent and healthy life for everyone, from the perspective of social rights and personal and community empowerment, in particular, for people who are vulnerable and at risk of exclusion.
• Establishing Barcelona as a global benchmark for citizen rights and the values of fairness, respect, community harmony, solidarity and individual and community empowerment. A city that fights against any type of stigmatisation, discrimination and social segregation, and which gives priority to preventing violence against people.
• Strengthening the processes developed in civil society to ensure we have active citizens committed to solidarity and community harmony, checking the rights of citizens are fulfilled, with responsibilities for the authorities, civil society and the market too.
• Recognising the rights of all those people living on the streets.
• Promoting projects that overcome every type of stigmatisation and social marginalisation affecting the lives of people and groups as a consequence of the diversity of their origins, individual identities and cultural beliefs, without any further restrictions than the ones derived from fundamental and universal human rights.
• Guaranteeing every citizen’s accessibility to the services offered by the municipality, so no one is excluded, whether for legal-political reasons (regularisation of residency status), functional diversity, economic vulnerability, temporary or permanent dependency (for reasons of health or diminished independent capacity).
• Tackling the various forms of isolation and social segregation, by promoting, on a local level, the coordination of community networks, relational spaces, and the participation of people in a situation of severe social exclusion in designing their own projects and social inclusion services.
B. The challenges of making this a habitable and welcoming city, that re-ceives everyone living and working here with dignity and cooperation, which socially revitalises its neighbourhoods and tackles the processes of residential expulsion and gentrification (caused by the financial globalisation processes) that change the social make-up of their residents, are as follows:
• Substantially reducing residential expulsion, whether in the form of evictions and loss of housing or through the inaccessibility of broad social sectors, especially young people, to the right to housing, by guaranteeing housing accessibility and maintenance, and by expanding and renovating the public and affordable rented housing stock, promoting new types of

62
Social Rights
2017-2027 Strategy for Inclusion and Reducing Social Inequality in Barcelona
housing, strategies for tackling gentrification and reducing the use of apartments for tourist purposes.
• Concentrating urban development interventions on neighbourhood habi-tability and generating a public housing stock that ensures people have access to this common asset. Strengthening, specifically, assistance services for cases of severe residential exclusion, homelessness and the most vulnerable victims of gentrification processes.
• Improving and smartening up neighbourhoods, putting everyday life at the centre, by strengthening the association network, cohesion, community harmony, social capital, connectivity and creating elements of centrality in the most vulnerable neighbourhoods. When it comes to urban planning, investing in the most disadvantaged neighbourhoods, to create environments that boost residents’ quality of life.
• Promoting active mobility (walking, cycling, using public transport) in every neighbourhood, to ensure better air quality and foster health.
• Fighting against climate change and its effects, by ensuring envi-ronmental justice criteria in the territorial sphere.
C. The challenges of creating an educating city, that opens up a broad range of opportunities for everyone throughout their life, are as follows:
• Increasing investment in children to overcome the perpetuation of inequalities, by guaranteeing the best interests of children under the Convention on the Rights of the Child, in order to ensure equal opportunities in education in all the neighbourhoods, reduce school segregation and promote inclusive and integrated education.
• Guaranteeing life-long education, as well as quality socio-educational assistance for young children aged 0 to 6, especially 0 to 3, and their families, as a decisive factor in preventing future social inequalities and as one of the tools for gender equality.
• Strengthening and ensuring universal access to public resources in children’s education and in other child-rearing support services. Promoting the right to informal or free-time education and, as a result, creating the conditions for providing these services all around the city.
• Putting the emphasis on educational strategies and implementing services to ensure educational success, especially among the teenage and youth population, by considering special needs and social and cultural factors as well as the educational model itself and youth interest in formal education. Incisive initiatives among the 12-16 year-old age bracket.
• Developing more educational and training lines in the professional sphere that are linked to the demand for labour from local businesses,

63
Social Rights
2017-2027 Strategy for Inclusion and Reducing Social Inequality in Barcelona
and ensuring support for personal itineraries, especially among young people getting their first taste of work.
• Reducing the digital gap for reasons of age, gender, purchasing power and lack of accessible digital products.
D. Challenges of making a feminist city, where gender fairness is a reality, and a benchmark city for making universal the right to diversity of sexual orientation and gender identity, are as follows:
• Promoting gender equality in the use of time, productive and reproductive work, political participation, advertising, education, etc.
• Promoting professional qualifications and accreditation, as well as permanence in the labour market for women and trans women in vulnerable situations.
• Boosting the dignity of the most feminised sectors and combating job segregation.
• Implementing an institutional change for reducing gender inequalities and achieving institutions fully open to sexual diversity.
• Gearing the economy towards life and a better and more egalitarian organisation of time and distribution of assistance.
• Deploying positive action in every public policy in the city with LGBTI groups to guarantee a fully open city and access to citizen rights for everyone.
• Guaranteeing a Barcelona free of violence against anyone and, in parti-cular, the LGBTI collective.
E. The challenges for a healthy city that takes care of everyone, that offers accessible services and a suitable environment for individual and collective development, with environmental sustainability and justice, cohesion and empowered, active and socially committed citizens, are as follows:
• Significantly reducing inequalities in health, based on prioritising initia-tives in the neighbourhoods identified with the worst socio-economic and health indicators.
• Creating extra opportunities for the life-long pursuit of sport, especially among young people and people with functional diversity, for its health benefits, the values it conveys and social integration.
• Increasing social services and initiatives to meet the needs of people with illnesses or dependency and their carers.
• Guaranteeing respect for the rights of people with mental health problems to safe and efficient accessible services that meet their needs, to access

64
Social Rights
2017-2027 Strategy for Inclusion and Reducing Social Inequality in Barcelona
to opportunities for achieving a good quality of life, and fighting against the stigmatisation and discrimination they are subjected to.
• A friendly city that promotes healthy active ageing based on the personal and social independence of elderly people and their central role in shaping the city.
• Promoting an active and socially committed population by rolling out forms of collaboration for citizen co-production of projects and initiatives for social justice.
• Innovation in the form of democratic participation from a local level, taking the neighbourhood as a basic intervention unit, so that all the city’s public policies enjoy significant social consensus beyond that of the organisations and associations that usually take part.

65
Social Rights
2017-2027 Strategy for Inclusion and Reducing Social Inequality in Barcelona
54. For a more detailed description of these plans, see the TOP Document: a summary of plans on social inclusion in Barcelona on the Citizen Agreement’s website: barcelona.cat/barcelonainclusiva
55. Social inequality processes cannot be tackled from a local perspective alone because there are many factors – wages, pensions, education policy, macroeconomic aspects, etc. – which do not depend on the city but on the State, EU and rest of the world. We therefore understand the fight against inequalities in terms of the skills and duties that we can develop between all of us in the city.
4.3. Tackling the challenges for advancing towards the city of social rights model on the basis of plans and programmes already in progress and the Strategy for Inclusion and Reducing Social Inequalities
Two major types of action will be implemented to tackle the city’s challenges and advance towards the social model of an inclusive city envisaged for 2027: one extensive and sectoral, and another intense and cross-cutting.
The extensive sectoral action consists of sectoral plans and programmes aimed at a specific area of action (housing, employment, social action, mental health, sports, drug addictions, education, etc.) or at a special social group (elderly people, children, youth, immigrants, the homeless, etc.) which are already being or are intended to be implemented by public bodies or through social initiative and the Citizen Agreement’s impetus and monitoring groups and networks.
This extensive sectoral action corresponds to the following framework:
The main sectoral plans and programmes in progress, which are part of the ex-tensive sectoral action for achieving the social city model aspired to and which have been analysed for implementing this strategy, number 37 in total and fea-ture in the TOP Document: Critical issues, goals and proposals.54
This range of actions is seen as absolutely necessary for achieving the social city model, but it is insufficient. We need to make further progress if we are to have a coordinated, complementary and synergistic impact on the processes of social inequality,55 which are within our scope in the city sphere and at the origin of the inclusion processes.
Social city model
Plan A Plan B Plan n

66
Social Rights
2017-2027 Strategy for Inclusion and Reducing Social Inequality in Barcelona
We therefore need a second action model, an intense, strategic, cross-cutting action model, centred on the key issues which are at the root of the social inequalities that affect everyone living in Barcelona.
We need to coordinate and synergise all the projects and actions of the social players that have more effect on cross-cutting goals for reducing inequalities. In other words, we need a strategy for inclusion and reducing inequalities which operates in the way shown under this framework:
All the plans and programmes in progress in our city are moving in parallel directions, so the Strategy for Inclusion and Reducing Social Inequalities points those plans and programmes in a single direction, coordinating the strengths of each one in a synergistic fashion. The Strategy’s resulting strength is then greater than the sum of each of the plans, which means we can advance more rapidly without losing sight of the vision or inclusive social model we have to achieve.
Plan A Plan B Plan n
Social city model
Strategy for Inclusion and Reducing Social Inequalities
67
Social Rights
2017-2027 Strategy for Inclusion and Reducing Social Inequality in Barcelona
5.MISSION, STRATEGIC LINES AND GOALS
Section 4 pointed out that all the plans and programmes under way are ne-cessary but insufficient for advancing decisively towards the social city model. It is a matter of having a cross-cutting strategy centred on clearly strategic or key high-impact and measurable goals.
The intention is not to put all the projects and initiatives in the area of inclusion that are already being implemented under the above-mentioned sectoral plans by the City Council and the Citizen Agreement’s social entities, but rather focus on the ones that:
1. Have the most impact on the key determinants of social inclusion and health.
2. Involve co-production between Council areas, third sector entities, or-ganisations, universities, professional associations, social movements, etc.
3. Result in a clear commitment to coordinating resources in the projects.
In that regard, it is important for us to adopt the perspective of reducing inequalities, to find strategic, high-impact goals in the key determinants of social inclusion and health, for the following reasons:
a) It is a widely known fact, and comes under this framework, that the inequalities which appeared in Europe and the United States during the second half of the 1980s are the main cause of the social crisis that is still ongoing and the economic recession that has now come to an end for cyclical reasons, although it may revive following a rise in oil prices or a change in the European Central Bank’s current monetary policy. So, our focus on inequalities has a widely confirmed analytical basis to it.
b) Focusing on social exclusion determinants, as well as the goals that have an impact on the factors that generate exclusion, to overcome/reduce their effects, will enable us to switch from an all-inclusive strategy that covers everything to a strategy that is focused on what is more important.
Inequalities determine the public’s participation (or non-participation) in the spheres of social inclusion/exclusion: economic, employment, training, socio-health, residential, relational, citizen, participation and districts, as we set out in the framework.
Those spheres are precisely the ones that are regarded as determinants of health, so inequalities are the main determinants for both inclusion and health. This is an approach that targets the roots rather than the consequences of social exclusion processes in the city sphere.
c) This Strategy for Inclusion and Reducing Social Inequalities is clearly different and stands out from other strategies and previous plans, for the range of the players involved and the focus of its goals on the origins of the exclusion processes.
5.1. The approach of the Strategy for Inclusion and Reducing Social Inequalities

68
Social Rights
2017-2027 Strategy for Inclusion and Reducing Social Inequality in Barcelona
With the perspective of coordinating the synergies of the various plans and programmes and the new goals that have come out of the Strategy preparation process, the five aspects of social inequality with the most impact on social inclusion/exclusion processes have been identified as:
• Income inequality, in income and spending terms, for its negative impact in obstructing citizen access to basic rights (guaranteed income, housing, basic utilities, decent jobs).
• Inequality in education and access to culture throughout life, arising from the economic, social, territorial and family environment that people live in and which conditions their life-long learning capacities. It is a key aspect in a society that is shaped as a network and knowledge society.
• Inequalities in access to association or community assets or networks between people that are basic for the progress of people and communities in the territory. The territories with the most capacity for progress and resilience are the ones that have a more extensive association network and people with a greater ability to collaborate in building the common good.
• The stigmatisation and social segregation of people and collectives in a distinct way as regards income, education, culture or the area they live in. There are individuals or collectives that are subject to rejection and segregation by broad social groups. Such social segregation, by itself, prevents or hinders these individuals or collectives from exercising the rights and responsibilities of collective life. The fight against such inequalities is linked to the extent we have a more pluralistic, caring city that respects differences and fosters community harmony.
• Territorial inequalities, which result from other inequalities and the territory itself which, as the immediate environment that people live and relate to one other in, constitutes an independent factor creating inequalities.
The aspects of the inequalities that constitute the main determinants of social inclusion and health are shaped asymmetrically depending on other variables such as gender, age, functional diversity, geographical, cultural or ethnic provenance and sexual diversity that will also be subject to treatment through the strategic lines or cross-cutting action criteria.

69
Social Rights
2017-2027 Strategy for Inclusion and Reducing Social Inequality in Barcelona
12 line goals
9 line goals
8 line goals
5 line goals
8 line goals
Line 1.Reducing the
inequality in income
distribution and ensuring social rights, in particular,
access to housing, quality
employment and basic
needs
Line 2.Increasing
educational fairness
and training and cultural
activities throughout life
Line 3.Strengthening
and coordinating
relational and community
support services and
networks facilitating
personal and collective
empowerment
Line 4.Eliminating
stigmatisation and social
segregation
Line 5.Reducing territorial
social inequalities
Vision Barcelona Model
for 2027
Cross-cutting action criteria
Action networks and structuring projects
Mission of the Strategy
5.2. The components of the Strategy for Inclusion and Reducing Social Inequalities
The Strategy consists of the following components:
a) Vision of the future model or social model of Barcelona in 2027 that we have already specified in the previous section, and which was drafted during the Strategy creation process.

70
Social Rights
2017-2027 Strategy for Inclusion and Reducing Social Inequality in Barcelona
b) Mission. Its operational purpose is to:
1. Ensure that all the plans drawn up by Barcelona City Council and the organisations that have signed the Citizen Agreement take the aims described and identified in the Barcelona Social Model for 2027 as their reference framework.
2. Coordinate the projects, initiatives and resources of Barcelona City Council (municipal areas and districts) and the city’s social entities in the strategic lines and line goals.
3. Manage co-production through networking to roll out new networks and new structuring projects.
c) Strategic lines. Lines coinciding with those aspects of inequalities which constitute the itineraries that have to be followed if an impact is to be made on the Barcelona Social Model for 2027:
1. Reducing inequality in income distribution and guaranteeing social rights, in particular, housing access, quality jobs and basic needs.
2. Increasing educational fairness and training and cultural opportunities throughout life.
3. Strengthening and coordinating relational and community support services facilitating personal and collective empowerment.
4. Eliminating stigmatisation and social segregation.
5. Reducing territorial social inequalities.
d) Cross-cutting action criteria. Criteria that apply to all strategic line goals, so that for the purposes of describing and rolling out the line goals in projects and actions, it will have to be demonstrated that they meet the following seven cross-cutting action criteria:
d.1. Strengthening the fair and inclusive nature of the City Council and the Citizen Agreement’s social players: job quality, recruitment quality, social clauses and equal opportunities.
d.2. The criteria for ensuring gender equality set out in the Gender Justice Plan (2016-2020).
d.3. The promotion of democratic governance and networks: co-produc-tion of services, networking projects, mainstreaming, citizen parti-cipation and social commitment, cooperative culture and community organisation among the general public.

71
Social Rights
2017-2027 Strategy for Inclusion and Reducing Social Inequality in Barcelona
Strategic goal
Strategic goal
Strategic goal
Cross-cutting Criteria
Networks and “tractor” or structuring projects
d.4. , which demands recognition of differences and respect for the dignity of people with different capacities, by ensuring the environment is adapted to allow easy access for all, with universal accessibility criteria.
Functional diversity
d.5. Boosting the social and solidarity economy as an agent for change from the socio-economic perspective of urban reality.
d.6. Adopting a metropolitan perspective to reducing social inequalities. This means coordinating the line goals and structuring projects with other, similar city plans in the metropolitan region and also on an international level.
d.7. Taking the life cycle into account. Reducing inequalities has to follow the trajectory of the life cycle, since social needs and demands have different expressions according to the age reached, in other words, they require a diachronic perspective.
e) Line goals. Lines are the itineraries or routes that have to be followed to reach the Barcelona Social Model for 2027. Each of these lines contains line goals (42 goals in all) which will be the ones that have a strong impact on the various strategic lines.
f) Structuring projects: new networks, new “tractor” projects and promo-tional and monitoring projects. These will be key projects for reducing social inequalities in the city, and cross-cutting projects in the strategy lines. As the following diagram shows, these projects and networks will coordinate action social entities and municipal areas and departments so they are coproduced.
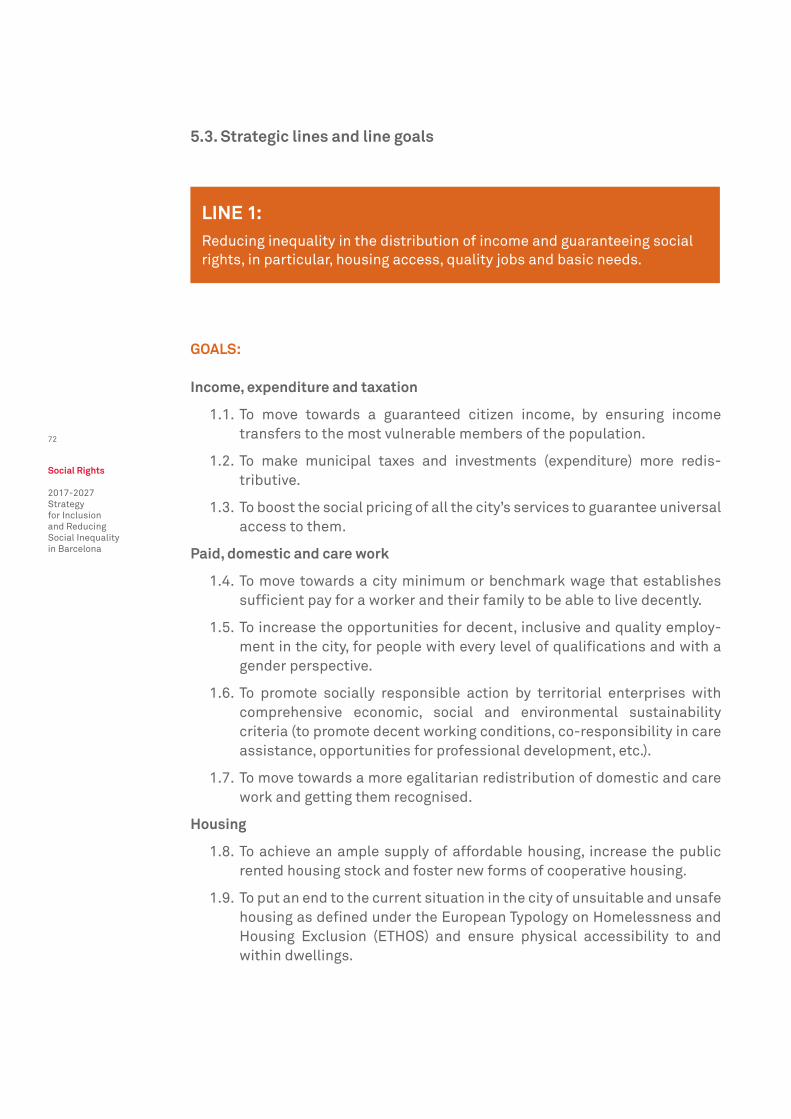
72
Social Rights
2017-2027 Strategy for Inclusion and Reducing Social Inequality in Barcelona
LINE 1:Reducing inequality in the distribution of income and guaranteeing social rights, in particular, housing access, quality jobs and basic needs.
GOALS:
Income, expenditure and taxation
1.1. To move towards a guaranteed citizen income, by ensuring income transfers to the most vulnerable members of the population.
1.2. To make municipal taxes and investments (expenditure) more redis- tributive.
1.3. To boost the social pricing of all the city’s services to guarantee universal access to them.
Paid, domestic and care work
1.4. To move towards a city minimum or benchmark wage that establishes sufficient pay for a worker and their family to be able to live decently.
1.5. To increase the opportunities for decent, inclusive and quality employ-ment in the city, for people with every level of qualifications and with a gender perspective.
1.6. To promote socially responsible action by territorial enterprises with comprehensive economic, social and environmental sustainability criteria (to promote decent working conditions, co-responsibility in care assistance, opportunities for professional development, etc.).
1.7. To move towards a more egalitarian redistribution of domestic and care work and getting them recognised.
Housing
1.8. To achieve an ample supply of affordable housing, increase the public rented housing stock and foster new forms of cooperative housing.
1.9. To put an end to the current situation in the city of unsuitable and unsafe housing as defined under the European Typology on Homelessness and Housing Exclusion (ETHOS) and ensure physical accessibility to and within dwellings.
5.3. Strategic lines and line goals

73
Social Rights
2017-2027 Strategy for Inclusion and Reducing Social Inequality in Barcelona
1.10. To tackle the residential and relational exclusion of the most vulnerable groups by supporting them on their inclusion itineraries.
Basic needs
1.11. To make suitable, healthy food more accessible and affordable by promoting a city food policy.
1.12. To combat energy poverty by promoting the city’s energy transition.

74
Social Rights
2017-2027 Strategy for Inclusion and Reducing Social Inequality in Barcelona
LINE 2:Increasing educational fairness and training and cultural opportunities throughout life.
GOALS:
2.1 To increase success at school and reduce truancy and early school leaving by levelling rates between the various neighbourhoods, improving schooling conditions and reducing school segregation.
2.2 To expand, diversify and provide fairer access to educational and fostering services for young children and their families, by boosting co-education at the city’s schools.
2.3 To reorganise and promote life-long learning and adult education with gender equality.
2.4 To strengthen educational, social and health-care programmes and activities with positive action criteria in favour of the most vulnerable individuals and families, taking into account children’s opinions, and their participation and empowerment.
2.5 To improve the employment capacities of unemployed people and their rights to equal access, with special emphasis on the long-term unemployed.
2.6 To promote and ensure equal, universal access to leisure, cultural, sports and game activities, especially among children and teenagers.
2.7 To reduce the digital gap to ensure access to culture and education.
2.8 To foster culture as a common, diverse and collective good, ensuring everyone has access to it as a veritable driving force for individual and collective progress.
2.9 To foster equality and non-discrimination, and ensure all young children and teenagers enjoy opportunities for education, to prevent social inequalities from arising and reduce existing ones.

75
Social Rights
2017-2027 Strategy for Inclusion and Reducing Social Inequality in Barcelona
LINE 3:Strengthening and coordinating relational and community support services and networks facilitating personal and collective empowerment.
GOALS:
3.1. To strengthen support and carer services and guarantee every citizen’s access to them, so that no one is excluded for legal-political reasons or due to functional diversity, dependency or economic vulnerability.
3.2. To empower citizens in defence of their rights by developing their capa-city to organise and establish collective improvement goals and actions, strengthening their commitment to social action, especially in the most vulnerable neighbourhoods.
3.3. To promote a better, more equal organisation of time and the democra-tisation of carer work.
3.4. To add a community dimension to all people-care services in order to make progress in building a community system of social policies.
3.5. To provide the conditions so people who are frail or at social risk can stay in their homes with the necessary logistical, professional and social support, and promote independent living among people with functional disabilities/diversity.
3.6. To ensure the city is a living space by offering public spaces and facilities with diverse uses that encourage relations with others, as well as posi-tive community life and intergenerational and intercultural relations.
3.7. To increase coordinated action by civil society and the local authority in order to improve people’s health and meet carer needs.
3.8. To increase support for people caring for ill and dependent family members.

76
Social Rights
2017-2027 Strategy for Inclusion and Reducing Social Inequality in Barcelona
LINE 4:Eliminating stigmatisation and social segregation.
GOALS:
4.1. To put an end to violence in all its forms and fight against xenophobia, aporophobia, Islamophobia, LGBTI-phobia, ageism and other discrimi-natory attitudes.
4.2. To generate knowledge and communication strategies for transforming stigmatising social perceptions, debunking stereotypes and fighting against discrimination, based on positive action models.
4.3. To guarantee the rights of people with social-stigmatisation problems.
4.4. To jointly and inclusively build community harmony and perceptions of safety in all areas and from a life-cycle perspective.
4.5. To prevent and avoid people’s isolation in institutions and segregated spaces.

77
Social Rights
2017-2027 Strategy for Inclusion and Reducing Social Inequality in Barcelona
LINE 5:Reducing territorial social inequalities.
GOALS:
5.1. To keep residential uses and residents who want to stay in neighbour-hoods undergoing urban improvement, and avoid people being expelled from neighbourhoods because they cannot afford to live there.
5.2. To block speculative practices in housing and urban spaces in general.
5.3. To implement the Neighbourhood Plan in neighbourhoods with a higher index of social inequality and carry out comprehensive improvements there.
5.4. To ensure fair and sustainable mobility for everyone and fight against climate change and its effects, by applying environmental justice cri- teria.
5.5. To develop more socially resilient neighbourhoods, with a capacity for proactively tackling challenges, impacts and crisis situations.
5.6. To promote economic development plans in the districts with a higher vulnerability index, by incorporating the social and solidarity economy there as well as productive, cooperative and community enterprises and a commercial network of small and medium-sized businesses.
5.7. To bring services closer to the districts and people’s needs.
5.8. To ensure the right to health by reducing social inequalities in the districts.

78
Social Rights
2017-2027 Strategy for Inclusion and Reducing Social Inequality in Barcelona
5.4. Main goals of the city’s districts
The process for drawing up this strategy also involved Barcelona’s various districts, which identified the main goals and actions need to be promoted in the city during the coming ten years, depending on their realities, needs and priorities.
The main goals and priority issues for inclusion and reducing social inequalities in each district are listed below:
Ciutat Vella
• Guaranteeing the right to housing, preventing situations of social exclusion and promoting conditions for decent housing.
• Promoting equal opportunities both in formal and non-formal education among people in the 0-18 age bracket.
• Promoting community harmony in public spaces by strengthening community life and preventing or avoiding exclusive uses.
• Applying an intercultural approach as a cross-cutting basis to all the district’s initiatives.
• Guaranteeing social assistance at social services centres (CSSs) by improving waiting times in accessibility and service provision.
• Boosting networking for children at risk.
• Promoting prevention, detection and care in situations of risk and isolation among elderly people.
• Fostering positive community life in resident communities with serious health and social problems and whose buildings suffer from structural pathologies.
• Implementing the actions provided for under the Neighbourhood Plan.
Eixample
• Guaranteeing the right to decent, active, diverse, independent and healthy ageing.
• Promoting networking, community work and work in the neighbourhoods.
• Cross-cutting approach to violence issues (elderly people, bullying, harass-ment, etc.).

79
Social Rights
2017-2027 Strategy for Inclusion and Reducing Social Inequality in Barcelona
Sants-Montjuïc
• Promoting quality jobs, improving those of people with more difficulties in entering the labour market in particular, by boosting networking and coordination between municipal services and third sector organisations, and improving the strategies, tools, methodology and protocols of the various district players working on job placements.
• Promoting the social responsibility of the enterprises and sectors present in the district and creating training circuits that enable the business community to recruit locally.
• Fighting against gender impoverishment under programmes for fostering the implementation of social and solidarity initiatives launched by women.
• Developing the local economy, by providing individual support and advice to local traders and improving access for people with functional and visual diversity to shops and cultural facilities.
• Promoting support for children aged 0 to 16, by boosting networking among formal and informal education entities to foster equal opportunities and improve educational indicators.
• Promoting, extending and fostering support networks to increase the pre-vention and detection of elderly people who are isolated and at risk, and provide care.
• Providing support for community work, strengthening the association move-ment and working with various entities on returning their activity to the district.
• Improving, fostering and promoting participation in and equal access to local festivals, especially for people from other cultures, by encouraging association involvement in running them and by improving their transparency, evaluation and management.
• Fostering the right to housing by boosting cooperative work and networking among the various players involved, by strengthening housing renovation and by fighting against gentrification.
• Fostering the right to mobility and equal access to means of transport.
• Fostering the right to sport through equal-access grants.
• Implementing the initiatives provided for under the Neighbourhood Plan and PDE.

80
Social Rights
2017-2027 Strategy for Inclusion and Reducing Social Inequality in Barcelona
Les Corts
• Promoting innovation in the line of work of the triangle formed by the Centre Cívic Joan Oliver Pere Quart, specialising in social innovation, the Ateneu de Fabricació de les Corts fab lab and the new Montserrat Abelló district library.
• Promoting local culture and the possibility for all the district’s citizens to access culture.
• Promoting active ageing among the district’s population.
• Fighting against the isolation of elderly people.
• Working with local entities to create an environment for community collaboration and their return to the district.
• Promoting free-time education and supporting regulated education.
• Reducing the prevalence of drug consumption and associated problems through selective preventive activities that make the most of community and solidarity ties.
• Giving group and individual support to carer families, ensuring the right of families to take care of their members.
• Strengthening and expanding networking to increase the detection of vulnerable situations and support for elderly people, and improve the strategies, tools and methods of professionals.
• Fostering support for every type of family with regard to parental skills.
• Providing support for single-parent families basically made up of women.
• Boosting support for people (basically men) who live alone and are especially vulnerable.
Sarrià-Sant Gervasi
• Launching and promoting initiatives aimed at people with disabilities and at entities working in this field.
• Prioritising initiatives around the following issues:
• Vulnerable people.
• Young children.
• Elderly people.

81
Social Rights
2017-2027 Strategy for Inclusion and Reducing Social Inequality in Barcelona
Gràcia
• Launching initiatives for the active promotion of old age, preventing isolation and assisting elderly people. Especially in La Salut and Camp d’en Grassot i Gràcia Nova.
• Responding to gentrification, based on diagnosis and co-responsibility, especially in Vila de Gràcia and Camp d’en Grassot i Gràcia Nova.
• Improving accessibility to services (better CSS locations, accessibility for people with functional diversity).
• Rollin out incomes based on the family situation and fostering spaces such as the healthy district.
• Fostering equal educational opportunities.
• Boosting quality employment and youth.
Horta-Guinardó
• Taking action to promote jobs.
• Opening a new centre for the elderly in Sant Genís dels Agudells, a project for vulnerable elderly people.
• Launching the Neighbourhood Plan in the Sant Genís dels Agudells and La Teixonera neighbourhoods.
• Launching the Health Programme in the Carmel, Sant Genís dels Agudells and La Teixonera neighbourhoods.
• Fighting against energy poverty, through the Energy Advice Point.
• Promoting feminism.
• Improving urban spaces, greenery and biodiversity.
Nou Barris
• Launching the initiatives provided for under the 2016-2019 Nou Barris Cohesion Action Plan, with regard to the four main priority areas identified: social assistance, housing, employment and work, and education and childhood.
• Intervening to resolve housing problems, especially in relation to squatting which creates insecurity in the neighbourhood, and the concentration of public housing.
• Promoting job placements, for the unemployed in general and young in particular, to ensure they have minimum financial resources.

82
Social Rights
2017-2027 Strategy for Inclusion and Reducing Social Inequality in Barcelona
• Giving social entities a central role in managing municipal facilities.
• Improving care for children as a very vulnerable group.
• Promoting positive community life in certain neighbourhoods.
• Implementing the initiatives provided for in the Neighbourhood Plan.
Sant Andreu
• Intervening to resolve housing problems, especially squatting which creates insecurity in the neighbourhood, and the concentration of public housing (for example, in the Baró de Viver neighbourhood).
• Improving job placements, for the unemployed in general and young people in particular, to ensure they have minimum financial resources.
• Giving social entities a central role in managing municipal facilities.
• Promoting care, especially for children, young people and the elderly.
• Launching projects to promote community harmony in Bon Pastor, Trinitat Vella and Baró de Viver.
• Increasing joint actions involving municipal services, local entities and people living in the district, by seeking a cross-cutting perspective to improve the well-being of the most vulnerable groups and individuals.
• Implementing the initiatives provided for under the Neighbourhood Plan.
Sant Martí
• Launching initiatives on the main issues: vulnerability, jobs and education.
• Prioritising the neighbourhoods with lower incomes and lower levels of education and employment, for integrated work.
• Boosting and creating employment plans (industrial estates with Sant Adrià).
• Working specifically with women to create social-economy cooperatives.
• Opening up educational spaces by making the alterations necessary for their use by the various neighbourhood groups and associations.
• Conducting a pilot test in the Besòs schools for days without a lunch break (dining room and leisure activities included for everyone).
• Implementing the initiatives provided for under the Neighbourhood Plan.

83
Social Rights
2017-2027 Strategy for Inclusion and Reducing Social Inequality in Barcelona
6. ROLLING OUT THE STRATEGY IN PROJECTS AND SERVICES
What form participation in the Strategy, in particular, all the projects and services incorporated in it, will take, is described below.
There are 167 social entities, organisations, networks and municipal departments involved in the Strategy.56 Of these 167, 38 are City Council departments, bodies or districts; 7 are Citizen Agreement action networks and 122 are social entities and organisations.
46%
3%
51%
Projects from social entities and organisations
Projects from the City Council or other local authority bodies
Projects from the Citizen Agreement action networks
56. This figure includes the all the entities that have taken part directly through their own projects and ser-vices. If we take into account overall participation in the Strategy drafting process, which all the members of the action networks were involved in, a total of 317 players (272 entities, 38 departments and local authority bodies, and 7 Citizen Agreement action networks) took part.
Figure 4. Participation in the Strategy
73%
4%
23% City Council departments, bodies and districts
Social entities and organisations
Citizen Agreement action networks
Figure 5. Projects and services incorporated into the Strategy
This participation translates into 892 projects and services helping to reduce social inequalities and achieve the goals established. Of these projects, 460 are being driven by social entities and organisations, 408 by City Council departments and districts and or other local authority bodies and 24 by the Citizen Agreement action networks.

84
Social Rights
2017-2027 Strategy for Inclusion and Reducing Social Inequality in Barcelona
All the initiatives included in the various strategic lines are outlined below:
LINE 1 Reducing inequality in income distribution and guaranteeing social rights, in particular, access to housing, quality jobs and basic needs.
232
LINE 2 Increasing educational fairness and training and cultural opportunities throughout life.
210
LINE 3 Strengthening and coordinating relational and community support services facilitating personal and collective empowerment.
279
LINE 4 Eliminating stigmatisation and social segregation. 97
LINE 5 Reducing territorial social inequalities. 74
LINE 1:Reducing inequality in income distribution and guaranteeing social rights, in particular, access to housing, quality jobs and basic needs.
232 projects and services have been incorporated within the framework of this line. Of these, 139 are driven by social entities and organisations, 84 by City Council departments and districts or other local authority bodies and 9 by Citizen Agreement action networks.
The breakdown per line goal is given below:
1.1 To move towards a guaranteed citizen income, by ensuring income transfers to the most vulnerable members of the population.
4 projects (2 projects incorporated by social entities and organisations and 32 by City Council departments and districts or by other local authority bodies).
1.2 To make municipal taxes and investments (expenditure) more redistributive.
3 projects (3 projects incorporated by City Council departments and districts or other local authority bodies).

85
Social Rights
2017-2027 Strategy for Inclusion and Reducing Social Inequality in Barcelona
1.3 To boost the social pricing of all the city’s services to guarantee universal access to them.
2 projects (2 from City Council departments and districts or other local authority bodies).
1.4 To move towards a city minimum or benchmark wage that establishes sufficient pay for a worker and their family to be able to live decently.
2 projects (2 projects incorporated by social entities and organisations).
1.5 To increase the opportunities for decent, inclusive and quality employment in the city, for people with every level of qualifications and with a gender perspective.
71 projects (41 projects incorporated by social entities and organisations, 30 by City Council departments and districts or other local authority bodies).
1.6 Promote socially responsible action by the territorial enterprises with comprehensive economic, social and environmental sustainability criteria (to promote decent working conditions, co-responsibility in care assistance, opportunities for professional development etc.).
17 projects (7 projects incorporated by social entities and organisations, 5 by City Council departments and districts or other local authority bodies and 5 by Citizen Agreement action networks).
1.7 To move towards a more egalitarian redistribution of domestic and care work and getting them recognised.
5 projects (5 from City Council departments and districts or other local authority bodies).
1.8 To achieve an ample supply of affordable housing, increase the public rented housing stock and foster new forms of cooperative housing.
21 projects (9 projects incorporated by social entities and organisations, 12 by City Council departments and districts or other local authority bodies).
1.9 To put an end to the current situation in the city of unsuitable and unsafe housing as defined under the European Typology on Homelessness and Housing Exclusion (ETHOS) and ensure physical accessibility to and within dwellings.
5 projects (2 projects incorporated by social entities and organisations, 3 by City Council departments and districts or other local authority bodies).
1.10 To tackle the residential and relational exclusion of the most vulnerable groups by supporting them on their inclusion itineraries.
66 projects (49 projects incorporated by social entities and organisations, 5 by City Council departments and districts or other local authority bodies and 5 by Citizen Agreement action networks).

86
Social Rights
2017-2027 Strategy for Inclusion and Reducing Social Inequality in Barcelona
1.11 To make suitable, healthy food more accessible and affordable by promoting a city food policy.
28 projects (22 projects incorporated by social entities and organisations, 6 by City Council departments and districts or other local authority bodies).
1.12 To combat energy poverty by promoting the city’s energy transition.
8 projects (5 projects incorporated by social entities and organisations, 3 by City Council departments and districts or other local authority bodies).

87
Social Rights
2017-2027 Strategy for Inclusion and Reducing Social Inequality in Barcelona
LINE 2:Increasing educational fairness and training and cultural opportunities throughout life.
210 projects and services have been incorporated within the framework of this line. Of these, 116 are driven by social entities and organisations, 92 by City Council departments, bodies or districts and 2 by Citizen Agreement action networks.
The breakdown per line goal is given below:
2.1. To increase success at school and reduce truancy and early school leaving by levelling rates between the various neighbourhoods, improving schooling conditions and reducing school segregation.
30 projects (15 projects incorporated by social entities and organisations and 15 by City Council departments and districts or by other local authority bodies).
2.2. To expand, diversify and provide fairer access to educational and fostering services for young children and their families, by boosting co-education at the city’s schools.
12 projects (6 projects incorporated by social entities and organisations, 6 by City Council departments and districts or other local authority bodies).
2.3. To reorganise and promote life-long learning and adult education with gender equality.
17 projects (9 projects incorporated by social entities and organisations and 8 by City Council departments and districts or by other local authority bodies).
2.4. To strengthen educational, social and health-care programmes and activities with positive action criteria in favour of the most vulnerable individuals and families, taking into account children’s opinions, and their participation and empowerment.
54 projects (36 projects incorporated by social entities and organisations, 16 by City Council departments and districts or other local authority bodies and 2 by Citizen Agreement action networks).
2.5. To improve the employment capacities of unemployed people and their rights to equal access, with special emphasis on the long-term unemployed.
23 projects (17 projects incorporated by social entities and organisations and 6 by City Council departments and districts or by other local authority bodies).

88
Social Rights
2017-2027 Strategy for Inclusion and Reducing Social Inequality in Barcelona
2.6. To promote and ensure equal, universal access to leisure, cultural, sports and game activities, especially among children and teenagers.
35 projects (17 projects incorporated by social entities and organisations and 18 by City Council departments and districts or by other local authority bodies).
2.7. To reduce the digital gap to ensure access to culture and education.
9 projects (3 projects incorporated by social entities and organisations and 6 by City Council departments and districts or by other local authority bodies).
2.8. To foster culture as a common, diverse and collective good, ensuring everyone has access to it as a veritable driving force for individual and collective progress.
14 projects (3 projects incorporated by social entities and organisations and 11 by City Council departments and districts or by other local authority bodies).
2.9. To foster equality and non-discrimination, and ensure all young children and teenagers enjoy opportunities for education, to prevent social inequalities from arising and reduce existing ones.
16 projects (10 projects incorporated by social entities and organisations and 6 by City Council departments and districts or by other local authority bodies).

89
Social Rights
2017-2027 Strategy for Inclusion and Reducing Social Inequality in Barcelona
LINE 3:Strengthening and coordinating relational and community support services facilitating personal and collective empowerment.
279 projects and services have been incorporated within the framework of this line. Of these, 139 are driven by social entities and organisations, 130 by City Council departments, bodies or districts and 10 by Citizen Agreement action networks.
The breakdown per line goal is given below:
3.1. To strengthen support and carer services and guarantee every citizen’s access to them, so that no one is excluded for legal-political reasons or due to functional diversity, dependency or economic vulnerability.
62 projects (49 projects incorporated by social entities and organisations, 13 by City Council departments and districts or other local authority bodies).
3.2. To empower citizens in defence of their rights by developing their capacity to organise and establish collective improvement goals and actions, strengthening their commitment to social action, especially in the most vulnerable neighbourhoods.
52 projects (23 projects incorporated by social entities and organisations, 5 by City Council departments and districts or other local authority bodies and 5 by Citizen Agreement action networks).
3.3. To promote a better, more equal organisation of time and the democrati-sation of carer work.
12 projects (3 projects incorporated by social entities and organisations, 4 by City Council departments and districts or other local authority bodies and 5 by Citizen Agreement action networks).
3.4. To add a community dimension to all people-care services in order to make progress in building a community system of social policies.
31 projects (14 projects incorporated by social entities and organisations, 16 by City Council departments and districts or other local authority bodies and 1 by Citizen Agreement action networks).
3.5. To provide the conditions so people who are frail or at social risk can stay in their homes with the necessary logistical, professional and social support, and promote independent living among people with functional disabilities/diversity.
33 projects (18 projects incorporated by social entities and organisations,

90
Social Rights
2017-2027 Strategy for Inclusion and Reducing Social Inequality in Barcelona
15 by City Council departments and districts or other local authority bodies).
3.6. To ensure the city is a living space by offering public spaces and facilities with diverse uses that encourage relations with others, as well as positive community life and intergenerational and intercultural relations.
49 projects (11 projects incorporated by social entities and organisations, 38 by City Council departments and districts or other local authority bodies).
3.7. To increase coordinated action by civil society and the local authority in order to improve people’s health and meet carer needs.
29 projects (17 projects incorporated by social entities and organisations, 12 by City Council departments and districts or other local authority bodies).
3.8. To increase support for people caring for ill and dependent family members.
11 projects (4 projects incorporated by social entities and organisations, 5 by City Council departments and districts or other local authority bodies and 2 by Citizen Agreement action networks).

91
Social Rights
2017-2027 Strategy for Inclusion and Reducing Social Inequality in Barcelona
LINE 4:Eliminating stigmatisation and social segregation.
97 projects and services have been incorporated within the framework of this line. Of these, 50 are driven by social entities and organisations, 44 by City Council departments, bodies or districts and 3 by Citizen Agreement action networks.
The breakdown per line goal is given below:
4.1. To put an end to violence in all its forms and fight against xenophobia, aporophobia, Islamophobia, LGBTI-phobia, ageism and other discriminatory attitudes.
17 projects (11 projects incorporated by social entities and organisations, 5 by City Council departments and districts or other local authority bodies and 1 by Citizen Agreement action networks).
4.2. To generate knowledge and communication strategies for transforming stigmatising social perceptions, debunking stereotypes and fighting against discrimination, based on positive action models.
29 projects (10 projects incorporated by social entities and organisations, 17 by City Council departments and districts or other local authority bodies and 2 by Citizen Agreement action networks).
4.3. To guarantee the rights of people with social-stigmatisation problems.
26 projects (17 projects incorporated by social entities and organisations and 10 by City Council departments and districts or by other local authority bodies).
4.4. To jointly and inclusively build community harmony and perceptions of safety in all areas and from a life-cycle perspective.
10 projects (3 projects incorporated by social entities and organisations and 7 by City Council departments and districts or by other local authority bodies).
4.5. To prevent and avoid people’s isolation in institutions and segregated spaces.
15 projects (10 projects incorporated by social entities and organisations and 5 by City Council departments and districts or by other local authority bodies).

92
Social Rights
2017-2027 Strategy for Inclusion and Reducing Social Inequality in Barcelona
LINE 5:Reducing territorial social inequalities.
74 projects and services have been incorporated into this line. Of these, 16 are driven by social entities and organisations and 58 by City Council departments, bodies or districts.
The breakdown per line goal is given below:
5.1. To keep residential uses and residents who want to stay in neighbourhoods undergoing urban improvement, and avoid people being expelled from neighbourhoods because they cannot afford to live there.
4 projects (4 projects incorporated by City Council departments and districts or other local authority bodies).
5.2. To block speculative practices in housing and urban spaces in general.
1 project (1 incorporated by City Council departments and districts or other local authority bodies).
5.3. To implement the Neighbourhood Plan in neighbourhoods with a higher index of social inequality and carry out comprehensive improvements there.
13 projects (1 project incorporated by social entities and organisations and 12 by City Council departments and districts or other local authority bodies).
5.4. To ensure fair and sustainable mobility for everyone and fight against climate change and its effects, by applying environmental justice criteria.
5 projects (1 project incorporated by social entities and organisations and 4 by City Council departments and districts or other local authority bodies).
5.5. To develop more socially resilient neighbourhoods, with a capacity for proactively tackling challenges, impacts and crisis situations.
10 projects (2 projects incorporated by social entities and organisations and 8 by City Council departments and districts or by other local authority bodies).
5.6. To promote economic development plans in the districts with a higher vulnerability index, by incorporating the social and solidarity economy there as well as productive, cooperative and community enterprises and a commercial network of small and medium-sized businesses.
13 projects (4 projects incorporated by social entities and organisations and 9 by City Council departments and districts or by other local authority bodies).

93
Social Rights
2017-2027 Strategy for Inclusion and Reducing Social Inequality in Barcelona
5.7. To bring services closer to the districts and people’s needs.
17 projects (5 projects incorporated by social entities and organisations and 12 by City Council departments and districts or by other local authority bodies).
5.8. To ensure the right to health by reducing social inequalities in the districts.
11 projects (3 projects incorporated by social entities and organisations and 8 by City Council departments and districts or by other local authority bodies).
For further information on all the projects and services incorporated into the Strategy, you can enter the following link: barcelona.cat/barcelonainclusiva
94
Social Rights
2017-2027 Strategy for Inclusion and Reducing Social Inequality in Barcelona

95
Social Rights
2017-2027 Strategy for Inclusion and Reducing Social Inequality in Barcelona
7. THE STRATEGY ACTION PLAN
Once the 2017-2027 Strategy for Inclusion and Reducing Social Inequalities has been approved, the Strategy Action Plan will be drafted.
The Strategy Action Plan will be implemented with the following approach:
• The social city model that has produced the Strategy is currently being rolled out by all the plans that have a bearing on the processes for reducing inequalities and promoting social inclusion, that is, in the 37 plans that appear in the TOP Document (critical issues, goals and proposals)57 specifically drafted during the Strategy analysis stage.
• The Strategy for Inclusion and Reducing Social Inequalities groups together, under 5 strategic lines and 42 goals, the projects and initiatives of the entities, social movements, action networks and the City Council departments and districts which have the most impact on reducing social inequalities, which are the main generators of poverty and social exclusion processes. Therefore, most of the Strategy’s goals will be developed by the projects and initiatives pledged by the City Council’s various areas as well as by social entities and movements.
• The Citizen Agreement for an Inclusive Barcelona, which organises collaboration between entities, will monitor and evaluate the actions and projects incorporated into the Strategy. The Agreement will also carry out a specific task with regard to promoting, driving and coproducing the projects regarded as being the most cross-cutting and having the most impact, bearing in mind its management capacity.
• Once the Barcelona Strategy for Inclusion and Reducing Social Inequalities has been approved, the Agreement Governance Council, on a proposal from the Action Committee and the City Council Mainstreaming Committee, will approve the launching of the structuring projects with more impact on reducing the social inequalities that affect exclusion processes and where specific impetus and monitoring actions are required.
Structuring projects will have the following in common:
• Their high-level, cross-cutting impact on the various strategic lines and goals.
• Their roll-out involves a number of players from both civil society and City Council areas.
The issues that the structuring projects will be based on are as follows:
• Rolling out a collaborative model for guaranteeing the right to healthy eating.
• Promoting active and committed citizens.
57. The TOP Document: critical issues, goals and proposals is available at the following link: barcelona.cat/barcelonainclusiva

96
Social Rights
2017-2027 Strategy for Inclusion and Reducing Social Inequality in Barcelona
• Prevention and community harmony in neighbourhoods.
• Reducing educational inequalities in more vulnerable neighbourhoods, especially among very young children.
• The Agreement against Racism and Xenophobia.
• Making progress on recognising and raising awareness of carers and expanding the services that give them support.
• The fight against the residential and energy exclusion of the most vulnerable collectives.
• Prevention and ensuring residents stay when faced with expulsion/gentrification processes: reducing speculative practices in housing.
• Income policies for ensuring an income for and the social empowerment of vulnerable individuals and families.
• Benchmark minimum wage.
These structuring projects, depending on the management that the Citizen Agreement can develop, will be as follows:
1. Projects managed by the Agreement networks: Strategic projects that are already under way and run by the Agreement, either through a network or which have been subject to an impetus and monitoring group and, owing to their strategic importance, require continuity and a new impetus.
2. “Tractor” projects: new “tractor” projects on issues never co-produced within the Citizen Agreement framework before, where the Agreement is regarded as the ideal space for its co-production work. These will be driven by an impetus and monitoring group set up specifically.
3. Promotion and monitoring projects: projects that are managed in different spaces of the Agreement but which, because of their importance in the Strategy, require promotion and monitoring by the Agreement governance bodies.
For the purposes of developing and driving these structuring projects, the municipal managers of the areas that the networks and projects are aimed at boosting will be interviewed beforehand.
A draft summary document will be produced on the basis of those interviews and include the following information:
1. Description of the project
The city’s current position in relation to the issue dealt with in the network and project, as well as the city’s mechanisms for responding to the central challenge that the network intends to work on.

97
Social Rights
2017-2027 Strategy for Inclusion and Reducing Social Inequality in Barcelona
2. The project’s goals and the actions proposed
The goals intended to meet the challenges posed in each of the networks and projects. Mention will also be made of the most notable actions that will be implemented to achieve the goals set.
3. Justification and impact on the strategic lines
The level of impact on the various strategic lines and goals will be specified, as well as the involvement of the various civil society and City Council area players that justify the impetus of the network or “tractor” project.
4. Result and impact indicators
All the indicators that will be used for evaluating the degree of goal achievement, finding out the level of action implementation, measuring the project’s impact and evaluating the joint work carried out by the various players that may make up the network or project.
5. Players involved
All the players involved in promoting the structuring project or network will be listed.

98
Social Rights
2017-2027 Strategy for Inclusion and Reducing Social Inequality in Barcelona

99
Social Rights
2017-2027 Strategy for Inclusion and Reducing Social Inequality in Barcelona
8. COMMUNICABLE MILESTONES FOR 2027
From all the Strategy goals, twelve big city milestones have been defined that are communicable and measurable and which we aim to reach within ten years.
The purpose of these milestones is to make the Strategy more communicable – following the example of the Millennium Development Goals or the European 2020 Strategy – and highlight the commitment of all the city’s players to social inclusion and reducing social inequalities. In defining the strategy, priority has been given to measurable, communicable milestones that are comparable with other territorial realities i the same context.
It should be pointed out that the milestones are not the mechanisms that will be used for evaluating the Strategy (described in the following section) but are based on the vision the Strategy is aiming for in 2027, with everyone’s commitment, and which is described in Chapter 4, Vision of Barcelona in 2027.
1. Reducing by one third the number of households that have to allocate more than 40% of their annual income to housing expenses.
• In 2016 there were 127,959 households in Barcelona that allocated more than 40% of their income to covering housing expenses (19.3% of the city’s total number of households).58
• The aim of this milestone is to reduce the number of households with this burden by 40,000.
2. Reversing the growth dynamics of income inequalities between neighbourhoods, reducing by 10% the gap between the 5 neighbourhoods with the highest and lowest disposable family income (DFI) / per capita.
• The gap in 2015 between the average for the 5 highest and 5 lowest DFI neighbourhoods / per capita was €34,391.59
• The gap in 2027 should be under €31,000.
3. Reducing the working poverty rate to below 7%.
• In 2016, the working poverty rate was 9.8.60
58. Source: Idescat and IERMB. Survey on Living Conditions and Habits of the Population, 2016.
59. Source: Municipal statistics and Barcelona Economia magazine issue numbers: 71, 74, 77 and 80. District and neighbourhood data for the years 2011, 2012 and 2013, calculated by the Department for Research and Knowledge, based on data published by Barcelona Economia.
60. Working poverty rate: number of people who are employed and have an income below the poverty thres-hold (calculated as 60% of the average household disposable income). Source: INE and Idescat: Survey on living conditions, 2016.

100
Social Rights
2017-2027 Strategy for Inclusion and Reducing Social Inequality in Barcelona
4. Halving the rate of severe material deprivation61 for the whole population especially, children.
• The rate in 2011 was 10.6%.
• If the entire population’s severe material deprivation rate was halved, it would drop to an approximate value of 5% by 2027.
• By contrast, the severe material deprivation rate for children below the age of 16 was 12.5% in 2011. By halving it, the severe material deprivation rate for children would drop to 6.25%.
5. Reducing by 60% the number of people unable to keep their home at an adequate temperature.
• The percentage in 2016 was 9.1%.62
• The percentage of people unable to keep their home at an adequate temperature in 2027 should be below 4%.
6. Reducing by 9 percentage points the difference in the school success rate between the district with the highest rate and the district with the lowest, ensuring that the highest rates are maintained or rise.
• The difference for the 2014-2015 school year was 18.37.63
• The difference between the school success rate in the 4th year of compulsory secondary school (ESO) in 2027 should be below 10%.
7. Ensuring that no woman or man has to look after an elderly person or person with a disability in need of care on their own.
• By 2027, no one should have to look after someone in need of care on their own. This is ambitious because in 2016, 7.9% of the city’s population (mostly women) were looking after a dependent person without any help.64
61. Severe material deprivation rate: proportion of the population living in households with an enforced in-ability to pay for at least four of the following items: 1) An annual holiday away from home for at least one week; 2) a meal consisting of meat, chicken or fish at least every second day; 3) keeping the dwelling at an adequate temperature; 4) unexpected expenses (of €650); 5) confrontation with arrears over main-dwelling-related expenses (mortgage or rent, gas and community bills, etc.) or hire-purchase instalments over the last 12 months; 6) a car; 7) a telephone; 8) a television set; 9) a washing machine. Source: Study: Social inequality and poverty in Barcelona in times of crisis. Idescat and IERMB. Survey on Living Conditions and Habits of the Population, 2006-2011 Despite that, the data that will be used for reaching the milestone will take the year 2016 as its point of reference. But this information is yet to be received from the Department for Research and Knowledge.
62 and 64. Source: Barcelona Health Survey, 2016.
63. Source: District data for the 2007-2008, 2009-2010, 2010-2011, 2011-2012, 2013-2014 school years, provided by the Barcelona Institute for Children and Adolescents, based on information from the report Oportunitats educatives a Barcelona, 2016 [Educational opportunities in Barcelona, 2016].

101
Social Rights
2017-2027 Strategy for Inclusion and Reducing Social Inequality in Barcelona
8. Reducing by 20% the percentage of people unable to talk to someone about their personal and family problems as much as they would like.
• In 2016, the percentage of people (aged 16 and over) unable to speak with someone about their personal and family problems as they would like was 8.8%.65
• In 2027, the percentage of people unable to speak to someone about their personal and family problems as much as they would like would be roughly 7.04%. In other words, 93% or more of people would be able to turn to someone to speak to about their personal and family problems.
9. Increasing Barcelona’s life expectancy at birth by halving the difference between neighbourhoods according to disposable family income.
• The gap for the 2013-2015 period was 3.6 years.66
• The gap for the three-year period, 2025-2027, should be 1.8 years.
10. Reducing psychological suffering by 25%, by halving the differences between men and women and between districts.
• In 2016, the percentage of people with psychological suffering was 18.5%.67 A 25% reduction by 2027 would cut the percentage of people with psychological suffering to 13.9%.
• The difference between men and women with psychological suffering was 3.8%.68 A 50% reduction by 2027 would cut that to 1.9%.
• In 2016, the difference between the districts with the highest and lowest percentages of people with psychological suffering was 22.1%.69 A 50% reduction by 2027 would cut that to 11%.
11. Increasing by 50% the number of people with a disability or functional diversity benefiting from personal autonomy and independent living programmes.
• In 2017, there were 602 people attended to (165 in flats handed over to social entities, 50 with the Municipal Personal Assistance Service and 387 on subsidised Independent Living projects in 2017).
• A 50% increase would raise the number to over 900 people.
65, 67 and 69. Source: Barcelona Health Survey, 2016.
66. Source: Report: Health in Barcelona 2016.
68. Source: Barcelona Health Survey, 2016 (more specifically, from information extracted from the GHQ-12 mental health scale).

102
Social Rights
2017-2027 Strategy for Inclusion and Reducing Social Inequality in Barcelona
12. Reducing to 10% the number of people have suffered some form of civil dispute or community-related problem in their neighbourhood in the last year.
• In 2015 the figure was 15.20%.70
70. Source: Victimisation Survey, 2012-2014..

103
Social Rights
2017-2027 Strategy for Inclusion and Reducing Social Inequality in Barcelona
9. EVALUATING AND RESCHEDULING THE STRATEGY
Six aspects of the Strategy for Inclusion and Reducing Social Inequalities will be evaluated:
1. Projects and initiatives: the level of the achievement of the projects and actions undertaken by the social entities and Barcelona City Council to roll out the Strategy.
2. Goals: the strategic lines and their goals.
3. Environment: the main changes in the external environment that determine the city’s social situation, as well as the challenges of the social policy for inclusion and reducing inequalities.
4. Impact: comparative evaluation of the change in the social situation in Barcelona, the Barcelona Metropolitan Area and Catalonia.
5. Measurable milestones: follow-up of the milestones proposed for 2027.
6. Capacity for organisation and action: evaluation of the improvement in in-teraction and cooperation between the city’s various players.
These evaluations are explained below:
1. Evaluation of the projects and actions
The level of implementation of each and every one of the actions pledged by the social entities and Barcelona City Council’s various municipal areas to roll out the Strategy will be evaluated to find out the stage implementation has reached and the level of progress made with regard to the stage when it was included in the Strategy (formulation, approval, budget, implementation, completion, etc.).
An index will be produced, based on each project, service or action, to find out the general level of progress in the Strategy’s projects and actions.
2. Evaluation of the goals
The goals will be evaluated through two complementary channels. On the one hand, the goals that can be measured comparatively in time by means of indicators and, on the other hand, by building a goal achievement index based on the evaluation made.
3. Evaluation of the setting
Based on the main international studies (United Nations, OECD, Eurostat, reports produced by the European Union, the World Bank, etc.) on the social situation in the setting and the main bibliography on the issue (which will be specified together with the international studies), social change trends in the setting will be identified and proposals made, where necessary, for the new challenges they may imply for social policy.
9.1. The Strategy evaluation levels

104
Social Rights
2017-2027 Strategy for Inclusion and Reducing Social Inequality in Barcelona
4. Evaluation of the impact
While we are fully aware of the many variables that have an impact on social change, we believe a comparative evaluation of change in the social situations of the Barcelona Metropolitan area, Catalonia and Barcelona will enable us to make hypotheses based on the factors that have had an influence, in particular, in relation to the possible influence of the Strategy.
This evaluation will be strengthened if accompanied by an evaluation of the level of goal, project and action implementation.
5. Measurable milestones
The milestones proposed for 2017 will be periodically monitored in line with the indicators they have been formulated from.
6. Evaluation of the capacity for organisation and action
An evaluation process similar to that of the Shared Strategy will be opened using a qualitative method, namely, interviews. The aim is to evaluate whether (or not) any progress has been made in improving interaction and cooperation between the social entities and Barcelona City Council in tackling social inequalities and improving social inclusion in the city.

105
Social Rights
2017-2027 Strategy for Inclusion and Reducing Social Inequality in Barcelona
The indicators that will be taken into account in evaluating the goals and the impact are drawn from several sources and surveys currently available through Barcelona City Council, such as The Health Survey, the Survey on the population’s living conditions and habits and the Victimisation Survey.
The specific indicators for each of the Strategy’s 5 lines are listed below.
LINE 1:Reducing inequality in income distribution and guaranteeing social rights, in particular, housing access, quality jobs and basic needs.
The following indicators have been established:
1. General poverty indicators:
1.1. At risk of poverty or social exclusion (AROPE) rate.
1.2. At risk of poverty or social exclusion (AROPE) rate for children below the age of 16.
1.3. At risk of poverty rate for people aged 16 and over.
1.4. At risk of poverty rate for households with children under the age of 16.
1.5. Rate of severe material deprivation for people aged 16 and over.
1.6. Rate of severe material deprivation for children under the age of 16.
1.7. Percentage of households that have suffered arrears in payments due to financial difficulties.
1.8. Percentage of households that find it hard or very hard to make ends meet at the end of the month.
2. General income distribution indicators:
2.1. Gap between highest and lowest DFI/per capita.
2.2. Income inequality index.
2.3. Gini Index.
2.4. 80/20 Index.
3. Income indicators referring to housing:
3.1. Economic effort allocated to housing.
• Rent (monthly bill/DFI).
• Purchase of new property (mortgage/DFI).
9.2. The Strategy monitoring and evaluation indicators

106
Social Rights
2017-2027 Strategy for Inclusion and Reducing Social Inequality in Barcelona
• Purchase of second-hand property (mortgage/DFI).
• Owning a new property (monthly instalment as a % of DFI).
• Owning a second-hand property (monthly instalment as % of DFI).
3.2. Housing expenditure overload rate.71
3.3. Average monthly rental price (price/m2, depending on the district).
3.4. Number of legal evictions.
3.5. Number of homeless people (according to the European Typology on Homelessness and Housing Exclusion – ETHOS).72
3.6. Number of social rented dwellings.
3.7. Percentage of social rented flats compared to the main residential stock.
3.8. Percentage of people unable to keep their home at an adequate temperature (during the winter or summer months) (indicator equivalent to the “energy poverty rate” concept).
3.9. Percentage of households living in dwellings in poor conditions.
4. Income indicators referring to jobs and wages:
4.1. Wage gap according to sex.
4.2. Working poverty index.
4.3. Unemployment rate (by sex and age).
4.4. Percentage of very long-term unemployed (over two years).
4.5. Change in unemployment coverage rate.
4.6. Wage earners on temporary contracts / Wage earners.
4.7. Percentage of the population living in households with very low work intensity.
71. This rate is calculated as a percentage of households that allocate over 40% of their annual income to such expenditure.
72. Homeless people, living on the streets, in inadequate housing, in settlements, other situations (shelters, hostels, etc.).
107
Social Rights
2017-2027 Strategy for Inclusion and Reducing Social Inequality in Barcelona
LINE 2:Increasing educational fairness and life-long training and cultural opportunities.
The following indicators have been established:
1. Schooling index for children aged 0-2.
2. Early school leaving rate.
3. Truancy index.
4. Success rate in 4th year of compulsory secondary education (ESO).
5. Rate of population with higher education.
6. Rate of population with primary education or less.
7. Percentage of secondary-school students failing basic skills tests in the 4th year of compulsory secondary education (ESO).

108
Social Rights
2017-2027 Strategy for Inclusion and Reducing Social Inequality in Barcelona
LINE 3:Strengthening and coordinating relational and community support services facilitating personal and collective empowerment.
The following indicators have been established:
1. Percentage of people aged 16 and over who do not turn to anyone when they lack financial resources.
2. Percentage of people aged 16 and over who do not turn to anyone when they are ill.
3. Percentage of people who belong to an entity or association.
4. Percentage of people who are members of a non-profit association, club or entity.
5. Percentage of people excluded from social relations.
6. People over the age of 80 living alone.
7. Percentage of people aged 16 and over who have no one to talk to about their personal and family problems as much as they would like.
8. Percentage of people aged 65 and over who have no one to talk to about their personal and family problems as much as they would like.
9. Percentage of households where a member does not have their care needs met at home because of age or chronic illness.
10. Percentage of people who have to look after a dependent person on their own.
11. Percentage of children unsatisfied with how adults listen to them..

109
Social Rights
2017-2027 Strategy for Inclusion and Reducing Social Inequality in Barcelona
LINE 4:Eliminating stigmatisation and social segregation.
The following indicators have been established:
1. Perceived safety level.
2. Perceived civility level.
3. Percentage of people who have suffered from a civil or community-related dispute in their neighbourhood in the last year.
4. Percentage of people who believe immigrants are taking away public-service resources.
5. Percentage of people who believe it is better for a country to have people with different customs and traditions living together.
6. Percentage of people who feel discriminated against on the grounds of sex, country of birth, country of origin, sexual orientation or disability.
7. Percentage of teenagers (13-19 years old) who claim they have suffered from discrimination (on grounds of gender, country of origin or ethnicity, sexual orientation or disability) over the last twelve months.
8. Percentage of teenagers (13-19 years old) who claim they have been victims of bullying (insulted, beaten, marginalised) four or more times in the last twelve months or have suffered any of the three actions at some time over the last twelve months.
9. Percentage of teenagers (13-19 years old) who claim they have been victims of cyberbullying (anything that harms them through the internet: sending photos, videos, comments, etc.) four or more times over the last twelve months or have suffered any of the three actions at some time over the last twelve months.

110
Social Rights
2017-2027 Strategy for Inclusion and Reducing Social Inequality in Barcelona
LINE 5:Reducing territorial social inequalities.
The following indicators have been established:
1. Summary social vulnerability index
2. Disposable family income per capita.
3. Disposable family income index in Barcelona.
4. Life expectancy at birth.
5. Insufficient education rate.
6. Rate of higher education qualifications according to sex.
7. Premature mortality rate.
8. Tuberculosis rate.
9. Teenage fertility rate.
10. Problem drug use index.
11. Prevalence of perceived poor health.
12. Prevalence of psychological suffering.
13. Residential vulnerability index.
This list of indicators will be updated depending on the comparative data available for each evaluation, with the possibility there will be variations and that new more appropriate indicators will be incorporated to measure the goals and the Strategy’s impact.

111
Social Rights
2017-2027 Strategy for Inclusion and Reducing Social Inequality in Barcelona
9.3. The temporary nature of the evaluation
The first evaluation of the Strategy will begin in the last quarter of 2019, when the new municipal government that emerges from the municipal elections takes over, and consist of:
• An evaluation of the setting.
• An evaluation of the impact.
• First look at level of progress made in reaching the milestones.
Based on the first evaluation, the Strategy will be rescheduled, if necessary.
A comprehensive evaluation will be carried out in the third quarter of 2023, at the start of a new term of office, and cover:
• Projects and initiatives.
• Goals.
• Environment.
• Impact.
• Measurable milestones.
• Capacity for organisation and action.
Once the evaluation has finished, the Strategy will be rescheduled. A final evaluation of the Strategy will be made in 2027.
There is a possibility of further evaluations or rescheduling throughout this period, depending on possible changes in the setting that might substantially modify the city’s social situation.
First evaluation
2017 2019 2023 2027
Comprehensive evaluation
Final evaluation
Start Rescheduling Rescheduling

112
Social Rights
2017-2027 Strategy for Inclusion and Reducing Social Inequality in Barcelona

113
Social Rights
2017-2027 Strategy for Inclusion and Reducing Social Inequality in Barcelona
10. THE STRATEGY DRAFTING PROCESS
The Strategy drafting process started in the summer of 2016 and will finish with the document’s formal approval at a Full Barcelona City Council Meeting and its public presentation to the city as a whole.
Months of work that has involved the signatory entities and organisations to the Citizen Agreement for an Inclusive Barcelona, the Agreement action networks, all Barcelona City Council areas and districts, the Municipal Social Welfare Council and social movements.
All the resulting documents have been worked on and debated by various bo-dies, including the Strategy Mainstreaming Committee, the Citizen Agreement Action Committee, its Governance Council and Network Coordination Board, the Municipal Social Welfare Council, the Agreement Assembly and the District Co-Responsibility Board. They have also been presented to the municipal party groups.
The Strategy drafting process has involved the following stages:
• Preparation stage: July 2016 - January 2017.
• Analysis stage: November 2016 - March 2017.
• Proposal stage: March 2017 - October 2017.
• Management stage: end of 2017 - 2027.
The most significant actions carried out during those stages and the various documents resulting from the whole process are outlined below:

114
Social Rights
2017-2027 Strategy for Inclusion and Reducing Social Inequality in Barcelona
PREPARATION STAGEJuly 2016 - January 2017
• Drawing up the draft of the Strategy approach.73
• Presentation of and debate on the Strategy approach at the Agreement Action Committee (24/10/16), the Agreement Governance Council (10/11/16), a specific session with the Governance Council (19/01/17) and at the Agreement Network Coordination Board (26/01/17).
ANALYSIS STAGENovember 2016 - July 2017
• Drawing up the Framework Document for devising the Strategy.74
• Preparation of the TOP: Critical issues, goals and proposals document,75 a series of plans relating to the social inclusion of the City Council and several social entities, and an Analysis of the results of social services monographic sessions (IMPULSEM).
• Debate on the various documents at the Agreement Action Committee (27/02/17) and the Municipal District Co-Responsibility Board (15/03/17).
• Conducting twenty interviews with various players, presenting the approach document, the framework document, and the TOP document (January-March 2017) to the municipal party groups, various municipal areas and departments, social entities and social movements; and two working sessions with the Platform for Mortgage Victims Platform (20/06/17 and 04/09/17).
73. This can be consulted in the documents section on the Citizen Agreement website at: barcelona.cat/barcelonainclusiva
74. This can be consulted in the documents section on the Citizen Agreement website at: barcelona.cat/barcelonainclusiva
75. This can be consulted in the documents section on the Citizen Agreement website at: barcelona.cat/barcelonainclusiva

115
Social Rights
2017-2027 Strategy for Inclusion and Reducing Social Inequality in Barcelona
PROPOSAL STAGEMarch 2017 - September 2017
• Drawing up the Towards the Strategic Summary document (critical issues and first goals draft).76
• Presentation of and debate on documents at the Barcelona City Council Mainstreaming Committee (10/03/17), at a joint session of the CMBS and Governance Council (21/03/17), at the Agreement’s annual assembly in 2017 (29/03/17), at the Municipal Group in charge of the Strategy for Inclusion (04/04/17) and at a joint meeting with the directors of People and Territory Services and the territorial directors of the Municipal Institute for Social Services (05/05/17).
• Starting to define the indicators for monitoring the Strategy and the measurable milestones, at several meetings of the indicator group (06/03/17, 24/03/17, 25/04/17, 25/05/17, 14/07/17).
• Drawing up the Strategy Vision, Mission and Goals document.77
• Presentation of and debate on the Strategy Vision, Mission and Goals document, at the Strategy Municipal Mainstreaming Committee (15/05/17), the Agreement Governance Council (18/05/17), the Group in charge of the Strategy for Inclusion (26/05/17), the Agreement Network Coordination Board (01/06/17), the Strategy Municipal Mainstreaming Committee (19/06/17) and the Agreement Action Committee (19/06/17).
• Drawing up the first draft of the Strategy for Inclusion and Reducing Inequalities document (July 2017). 78
• Presentation of and debate on the Strategy for Inclusion and Reducing Inequalities at the Agreement’ Governance Council (06/07/17) and online with the Group in charge of the Strategy for Inclusion, the Strategy Municipal Mainstreaming Committee and the Agreement Governance Council.
• Drafting of the summary document of the text of the Strategy for Inclusion and Reducing Inequalities (July 2017).79
76. This can be consulted in the documents section on the Citizen Agreement website at: barcelona.cat/barcelonainclusiva
77. The document is available on the Citizen Agreement website: barcelona.cat/barcelonainclusiva
78. The document is available on the Citizen Agreement website: barcelona.cat/barcelonainclusiva
79. The document is available on the Citizen Agreement website: barcelona.cat/barcelonainclusiva

116
Social Rights
2017-2027 Strategy for Inclusion and Reducing Social Inequality in Barcelona
• The summary document together with the process for collecting projects and services for incorporation into the Strategy were sent to all the Agreement entities and action networks, municipal departments, and social movements (27/07/17 - 20/10/17).
• Document presentation session with municipal party groups (19/09/17).
• Preparation of a first draft of milestones for 2027.
• The proposed milestones were worked out with the Agreement Governance Council (04/09/17), Barcelona City Council Mainstreaming Committee (27/09/17) and the Network Coordination Board (04/10/17).
• Presentation session of the results and action plan for approval by the Governance Council together with the Mainstreaming Committee and perma-nent CMBS (18/10/17).
• Approval of the Strategy at the Agreement’s Governance Council (16/11/17).
The Strategy is expected to be approved at a Full City Council Meeting.

117
Social Rights
2017-2027 Strategy for Inclusion and Reducing Social Inequality in Barcelona
11. LIST OF ENTITIES AND ORGANISATIONS TAKING PART
Bodies and departments of the City Council and other authorities
1. Barcelona Public Health Agency
2. Barcelona Social Services Consortium
3. Barcelona Education Consortium
4. Barcelona Health Consortium
5. Barcelona Linguistic Normalisation Consortium
6. Gender Mainstreaming Department. Barcelona City Council
7. Consumer Affairs Department. Barcelona City Council
8. Time and Carer Economy Department. Barcelona City Council
9. Urban Model Department. Barcelona City Council
10. Health Department. Barcelona City Council
11. Fire Prevention Service Department. Barcelona City Council
12. Strategic Services and Sustainability Culture Department. Barcelona City Council
13. Citizen Rights and Diversity Services Department. Barcelona City Council
14. Cooperative, Social and Solidarity Economy Services and Consumption Department. Barcelona City Council
15. Children, Youth and Elderly People Services Department. Barcelona City Council
16. Social Intervention Services Department. Barcelona City Council
17. Strategy and Innovation Department. Barcelona City Council
18. Barcelona Activa’s Executive Department of Strategies for Promoting Employment
19. Barcelona Activa’s Operational Department of Socio-Economic Innovation
20. Community Action Service Department Barcelona City Council
21. Ciutat Vella District. Barcelona City Council
22. Eixample District. Barcelona City Council
23. Gràcia District. Barcelona City Council
24. Horta-Guinardó District. Barcelona City Council
All the public departments and bodies, entities and networks taking part in the Strategy for Inclusion with their own projects and initiatives are listed below.

118
Social Rights
2017-2027 Strategy for Inclusion and Reducing Social Inequality in Barcelona
25. Les Corts District. Barcelona City Council
26. Nou Barris District. Barcelona City Council
27. Sant Andreu District. Barcelona City Council
28. Sant Martí District Barcelona City Council
29. Sants-Montjuïc District. Barcelona City Council
30. Sarrià - Sant Gervasi. Barcelona City Council
31. Technical Programming Office. Barcelona City Council
32. Manager’s Office for Presidency and Economy. Barcelona City Council
33. Barcelona Institute of Culture
34. Barcelona Institute for Children and Adolescents
35. Municipal Institute for People with Disabilities
36. Municipal Institute for Social Services
37. Barcelona Municipal Institute of Education
38. Barcelona Municipal Housing and Renovation Institute
Social entities, enterprises, employers’ organisations and professional associations
39. A12 Inter-University Studies and Research
40. ADAMA
41. Adoratrius-SICAR cat
42. ALENCOP SCCL
43. Catalan Alzheimer’s Disease Foundation
44. Amics de la Gent Gran
45. Amics del Moviment Quart Món Catalunya
46. Arrels Foundation
47. Association of Women Migrants in Catalonia
48. Yaya Luisa Social Association
49. Sud Integración Association
50. AREP Association
51. Atlàntida, Professionals for Interculturality Association
52. Pharmaceutical Bank Association
53. Welfare and Development Association

119
Social Rights
2017-2027 Strategy for Inclusion and Reducing Social Inequality in Barcelona
54. Catalan Haemophilia Association.
55. Catalan Association for Promoting Deaf People
56. Catalan Parkinson’s Disease Association
57. Catnova Association
58. La Nau Civic Association
59. El Raval Comprehensive Education Association
60. Gabella Association
61. In Via Association
62. Inclús Association
63. Nakeramos Intercultural Association
64. LaFinKa Barcelona Association
65. Narinan Social Family Project Association
66. Association for Social Integration and Job Placements
67. Prohabitage Association
68. Punt de Referència Association
69. Rauxa Association
70. Health and Family Association
71. Sant Martí Esport Association
72. Catalan Asperger’s Syndrome Association
73. ATRA
74. Barcelona Diocese Charity
75. Casal dels Infants ASB
76. ACIS Youth and Adult Centre - Foundation
77. City and values, Barcelona social services and initiatives foundation
78. Club Futbol Sala Centre Compartir
79. Cohousing Barcelona, SCCL
80. Catalan Psychologists’ Association
81. Catalan Social Educators’ Association
82. Catalan Pedagogues’ Association
83. Catalan Political Scientists and Sociologists’ Association
84. Catalan Social Workers’ Association
85. Commissions Obreres (CCOO)

120
Social Rights
2017-2027 Strategy for Inclusion and Reducing Social Inequality in Barcelona
86. Barcelona Youth Council
87. Let’s run together - the Milla de Sarrià Fun Run!
88. Red Cross in Barcelona
89. Faada. Foundation for Advice and Action in Defence of Animals
90. ACAPPS Federation
91. Catalan Federation of Social Volunteering
92. Barcelona Federation of Residents’ Associations
93. Catalan Federation of Special Work Centres
94. Catalan Mental Health Federation
95. Filles de la Caritat, a Social Foundation
96. Foment del Treball Nacional
97. Mental Health Forum
98. Acció solidària contra l’atur Foundation
99. Acollida i Esperança Foundation
100. Ajuda i Esperança Foundation
101. APIP-ACAM Foundation
102. Aroa Foundation
103. Banc de Recursos Foundation
104. Catalan Foundation for Cerebral Palsy
105. Champagnat Foundation
106. Comtal Foundation
107. Esperança Foundation
108. Els Tres Turons Foundation
109. Família i Benestar Social Foundation
110. Formació i Treball Foundation
111. IPSS Foundation
112. IReS Foundation
113. Itaca Foundation
114. Joia Foundation
115. Jubert Figueras Foundation
116. Mambré Foundation
117. Maria Raventós Foundation

121
Social Rights
2017-2027 Strategy for Inclusion and Reducing Social Inequality in Barcelona
118. Mercè Rodoreda Foundation
119. Pere Tarrés Foundation
120. PIMEC Foundation
121. Ared Private Foundation
122. Avismón-Catalunya Private Foundation
123. Bayt al-Thaqafa Private Foundation
124. Escó Private Foundation
125. Jovent Private Foundation
126. Llars Compartides Private Foundation
127. Pare Manel Private Foundation
128. Quatre Vents Private Foundation
129. Roger Torné Foundation
130. Roure Foundation
131. Salut i Comunitat Foundation
132. Social del Raval Foundation
133. Surt Foundation
134. Uszheimer Foundation
135. Babel Punto de Encuentro Foundation
136. Pasqual Maragall Foundation
137. Prevent Foundation
138. Soñar Despierto Foundation
139. Gra de Blat NGO
140. Impulsem, SCCL
141. Institut Diversitas, SCCL
142. ISOM, SCCL
143. Museu Marítim de Barcelona
144. Nutrició Sense Fronteres
145. ONCE
146. Neighbourhood Plan
147. Mortgage Victims Platform (PAH)
148. PROGESS, SL
149. Psicòlegs Sense Fronteres Catalunya

122
Social Rights
2017-2027 Strategy for Inclusion and Reducing Social Inequality in Barcelona
150. Salesians Sant Jordi - PES Cruïlla
151. Salut Mental Gràcia
152. Sant Pere Claver - Serveis Socials Foundation
153. International Civil Service of Catalonia
154. Suara Cooperativa
155. Catalan Board for Third-Sector Social Entities
156. Catalan Board for Children and Teenagers
157. Trastero de las Artes
158. Unió General de Treballadors (UGT)
159. Unión Romaní
160. Social Work Training and Research Unit. University of Barcelona
Citizen Agreement for an Inclusive Barcelona Action Networks
161. Homeless People’s Assistance Network (XAPSLL)
162. Barcelona Network for Inclusion in the Ordinary Work Market (XIB)
163. Children’s Rights Network (XDI)
164. Network of Open Centres for Assisting Children and Teenagers (XCO)
165. Barcelona Inclusive Housing Network (XHIB)
166. New Social Uses of Time Network (NUST)
167. Family Carers Support Network (XSFC)


BCN2017-2027 Strategy for Inclusion and Reducing Social Inequality in Barcelona
barcelona.cat/barcelonainclusiva