Embed Size (px)
Citation preview

Strategic Plan Briefing Book
+ + + + + + + + + + + + +
WORKSHOP AGENDA PACKAGE
Board of Directors Strategic Planning Workshop
February 15, 2017 9 a.m. to 5 p.m.
Florida Municipal Power Agency 8553 Commodity Circle Orlando, FL 32819-9002 407-355-7767
BOARD OF DIRECTORS
Page 1 of 105
FMPA’s Strategic Framework (2013 Strategic Plan)
Board of Directors Vision Being the preferred power and service provider for municipal electric utilities and the company of choice for employees.
ARP Executive Committee Vision To be the lowest cost, sustainable wholesale power provider in Florida.
Mission To provide competitively priced, reliable power and value-added services for municipal electric utilities through joint action.
Values • Trust built through honesty, integrity, openness and respect• Innovation and excellence• Teamwork among employees and members• Cultural diversity• Employee recognition, reward and empowerment• Environmentally responsible operations• Commitment to public power• Transparent and effective communication• The individual needs and desires of participants shall be given the strongest
consideration consistent with the best interests of all participants in the All-Requirements Project
Page 2 of 105

BOARD OF DIRECTORSSTRATEGIC PLANNING WORKSHOP
Agenda
Wednesday, February 15, 2017 8:00 am. Continental Breakfast
9:00 am Roll Call, Review Day and Current Mission/Vision/Values
Jacob Williams
9:15 am Presentation and Q&A on FMPA Member Drivers Resource and Succession Plans Material
Jacob Williams Frank Gaffney Sharon Adams
10:30 am Presentation and Q&A on U.S. Energy/Gas/Power Market View including Regulatory Impacts
Seth Schwartz, Energy Ventures Analysis, Inc.
11:30 am Break to get lunch and working session thereafter
11:45 am Presentation and Q&A on Comparative Work of Joint Action Agencies to FMPA
Michael Mace, PFM Asset Management, Inc.
12:45 pm Present List of Strategic Questions with Feedback and Additions
Kathy Viehe Jacob Williams
1:15 pm Prioritize List of Strategic Questions All
1:30 pm 15-Minute Break
1:45 pm Roundtable Discussion on Major Strategic Question – Direction Not Solution
Kathy Viehe
2:30 pm Roundtable Discussion on 2nd Major Strategic Question – Direction Not Solution
Kathy Viehe
3:15 pm Break
3:30 pm Breakout Session on 3 or 4 Strategic Questions All
4:15 pm Report Back from Breakouts on Strategic Questions Kathy Viehe (facilitates)
5:00 pm Test Adequacy for Mission/Vision/Values Kathy Viehe
5:30 pm Adjourn
Page 3 of 105

Michael Mace Managing Director
PFM Group, Charlotte, North Carolina
Michael Mace joined the PFM Group in 2001 with nearly twenty years of public finance and public power experience gained while working with major investment banking firms. He is located in the firm’s Charlotte, NC office and works with PFM partner Dan Hartman to manage PFM’s national utility practice. During his 16 years at PFM, Mr. Mace has focused exclusively on providing financial advisory services to many of the largest governmentally-owned utilities in the country. He and his Charlotte, NC Public Power colleagues are currently working with a large number of public power utilities, including: Bonneville Power Administration, ElectriCities of North Carolina, JEA, Long Island Power Authority, MEAG Power, New York Power Authority, Puerto Rico Electric Power Authority, Sacramento Municipal Utility District, Salt River Project and Santee Cooper. PFM’s work for these organizations includes traditional debt and derivative transactions; as well as asset sales, asset acquisitions and restructurings. In addition, Mr. Mace and PFM have been leaders in some of the most innovative transactions in the municipal utility industry, including renewable energy prepayments and utility charge securitizations. PFM also participates in the development of financial policies for our clients, and assists several utilities by providing public testimony to governing bodies and regulatory agencies in support of financial transaction approval and utility rate actions. Mr. Mace has worked with the American Public Power Association and the Large Public Power Council on several occasions by serving as a conference speaker and lending assistance toward the advancement of several utility industry priorities. Recently, Mr. Mace has been leading PFM’s team that serves as the Independent Registered Municipal Advisor to the Commonwealth of Puerto Rico and all of its public corporations.
Mr. Mace spent the early years of his career as a public power investment banker, working on a wide variety of transactions, including: conventional fixed- and variable-rate new money financings, major refunding and restructurings, securitizations, asset sales and acquisitions. While working in investment banking, Mr. Mace was responsible for managing new and derivative product efforts, public power, quantitative strategies and training at various firms. His focus has always been on bringing new and innovative approaches to help municipal issuers overcome challenging situations and take maximum advantage of market opportunities.
Mr. Mace graduated from Dartmouth College and received an MBA from the Fuqua School of Business at Duke University.
Page 4 of 105

Seth Schwartz President, Principal Energy Ventures Analysis
Mr. Schwartz is responsible for a wide variety of studies of energy supply and demand at Energy Ventures Analysis, Inc., including:
• Assisting utilities, industries, and independent power producers in developing fuel procurement strategies and in negotiating long-term fuel contracts.
• Auditing utility fuel procurement practices, system dispatch, and off-system sales. • Directing EVA’s analyses of coal supply and demand. • Testifying in fuel contract disputes. • Assisting companies in acquisitions and sales of coal reserves and producing properties.
Education
• Princeton University, B.S.E. in Geological Engineering.
Page 5 of 105
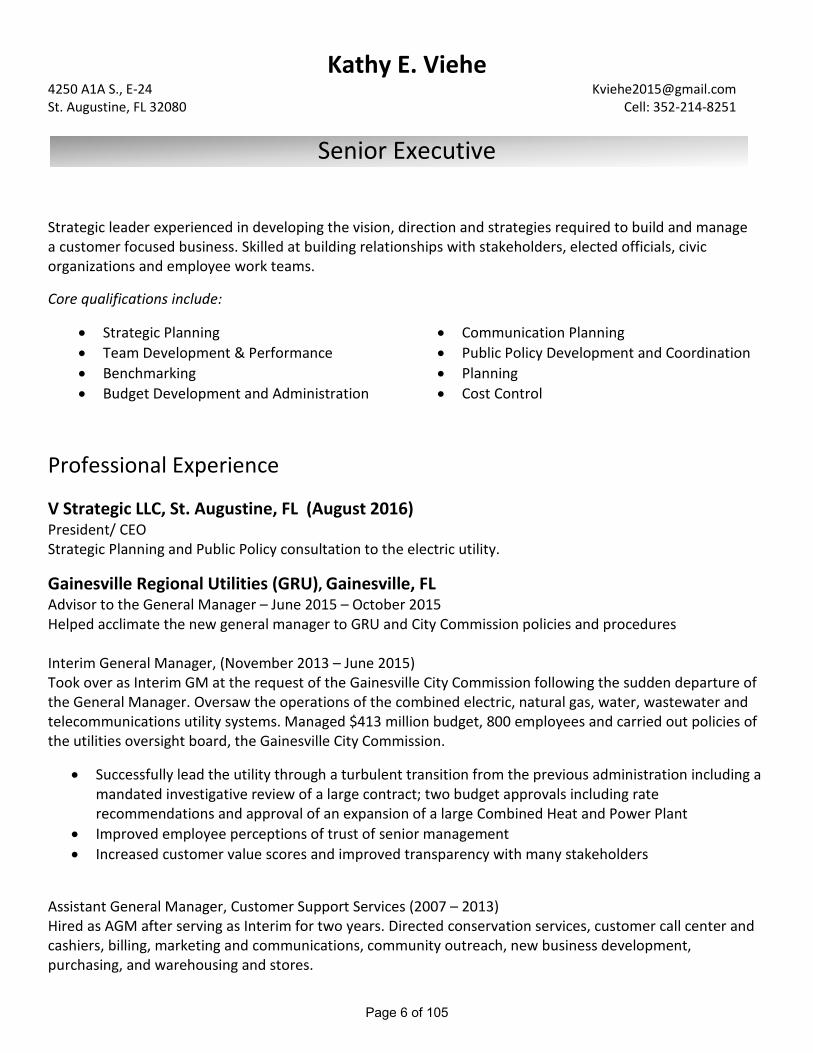
Kathy E. Viehe 4250 A1A S., E-24 [email protected] St. Augustine, FL 32080 Cell: 352-214-8251
Senior Executive
Strategic leader experienced in developing the vision, direction and strategies required to build and manage a customer focused business. Skilled at building relationships with stakeholders, elected officials, civic organizations and employee work teams.
Core qualifications include:
• Strategic Planning • Communication Planning • Team Development & Performance • Public Policy Development and Coordination • Benchmarking • Planning • Budget Development and Administration • Cost Control
Professional Experience
V Strategic LLC, St. Augustine, FL (August 2016) President/ CEO Strategic Planning and Public Policy consultation to the electric utility.
Gainesville Regional Utilities (GRU), Gainesville, FL Advisor to the General Manager – June 2015 – October 2015 Helped acclimate the new general manager to GRU and City Commission policies and procedures Interim General Manager, (November 2013 – June 2015) Took over as Interim GM at the request of the Gainesville City Commission following the sudden departure of the General Manager. Oversaw the operations of the combined electric, natural gas, water, wastewater and telecommunications utility systems. Managed $413 million budget, 800 employees and carried out policies of the utilities oversight board, the Gainesville City Commission.
• Successfully lead the utility through a turbulent transition from the previous administration including a mandated investigative review of a large contract; two budget approvals including rate recommendations and approval of an expansion of a large Combined Heat and Power Plant
• Improved employee perceptions of trust of senior management • Increased customer value scores and improved transparency with many stakeholders
Assistant General Manager, Customer Support Services (2007 – 2013) Hired as AGM after serving as Interim for two years. Directed conservation services, customer call center and cashiers, billing, marketing and communications, community outreach, new business development, purchasing, and warehousing and stores.
Page 6 of 105

Kathy E. Viehe 4250 A1A S., E-24 [email protected] St. Augustine, FL 32080 Cell: 352-214-8251
• Responsibility for over 100 employees and $5 million budget • Lead implementation of more than 22 residential and commercial energy efficiency programs • Developed nations first Solar Feed-in-Tariff to supply 18 MW of local renewable energy • Member, Florida Governor’s Action Team on Energy and Climate Change
Marketing and Communications Director (2000 – 2005) Assumed responsibility for marketing department following departure of the Marketing Director.
• Directed ten year, $2.5 million sports sponsorship with the Florida Gators to increase community visibility and utility program awareness
• Worked with 5 utilities to developed comprehensive business plan to serve national accounts • Implemented research to measure customer satisfaction and conservation programs and rebate awareness and
developed the “More than Energy” brand Communications Director – (1996-2000)
• Developed and implemented a strategic communications plan for all five utility systems • Conducted media training for all management personnel
Ft. Pierce Utilities Authority, Ft. Pierce, FL Communications Manager 1994 – 1996 Communications Officer 1991-1994 Managed a wide range of public relations tools, including promotional materials and direct-mail pieces for energy efficiency and other customer service programs. Defined and evaluated product marketing collateral, programs.
• Developed and directed the Manatee Education and Observation Center on behalf of the utility and the City of Ft. Pierce
Memphis Light, Gas and Water Division, Memphis, TN Senior Communications Specialist 1989 – 1991 Communications Specialist 1986 - 1989 Leadership/Professional Development
• President, Girls Place Board of Directors, 2016 • TEA Board of Directors, 2013-2015 • Appointed Member, Florida Governor’s Action Team on Energy and Climate Change, 2008 • Chair, American Public Power Association’s (APPA) Customer Connections Section, 2006-2007
Education
• Master of Arts, Corporate Communications, 1986, Memphis State University • Bachelor of Arts, Journalism, 1979, Memphis State University (University of Memphis)
Page 7 of 105

FMPA Strategic Planning SessionTen-Year Plan
February 2017
1Page 8 of 105

Outline1. Drivers of FMPA’s and our Members’ Businesses2. Ten-Year Resource Plan
A. Future Load GrowthB. ARP Supply and Demand BalanceC. Asset and Capital PlanD. FMPA has a Clean FleetE. Rate ImpactsF. Risks and OpportunitiesG. Conclusions
3. Succession Planning4. Energy Market Discussion5. Comparisons of Joint Action Agencies6. Strategic Planning 2Page 9 of 105

1. Drivers to FMPA’s and our Members’ Businesses
3Page 10 of 105

Customer Expectations
• Affordable• Reliable• Clean
• Generation resources• Energy efficiency
• Communication (outage and other information via technology, e.g., social media)
• Choice in Service options
4Page 11 of 105

Municipal Challenges
• Difficulty attracting and retaining qualified staff (e.g. linemen, substation and relay techs, engineers, IT support)
• Increasing workload - compliance, transmission tariff, engineering
• Political environment especially around Vero Beach
• Outside of city limit issue representation
5Page 12 of 105

Balancing Costs & Reliability
• Rate competition with neighboring utilities• Reliability of the grid• Distributed Resource integration (e.g.,
solar)• Aging Infrastructure• Contributions to the cities
6Page 13 of 105

2. Ten-Year Resource Plan
7Page 14 of 105
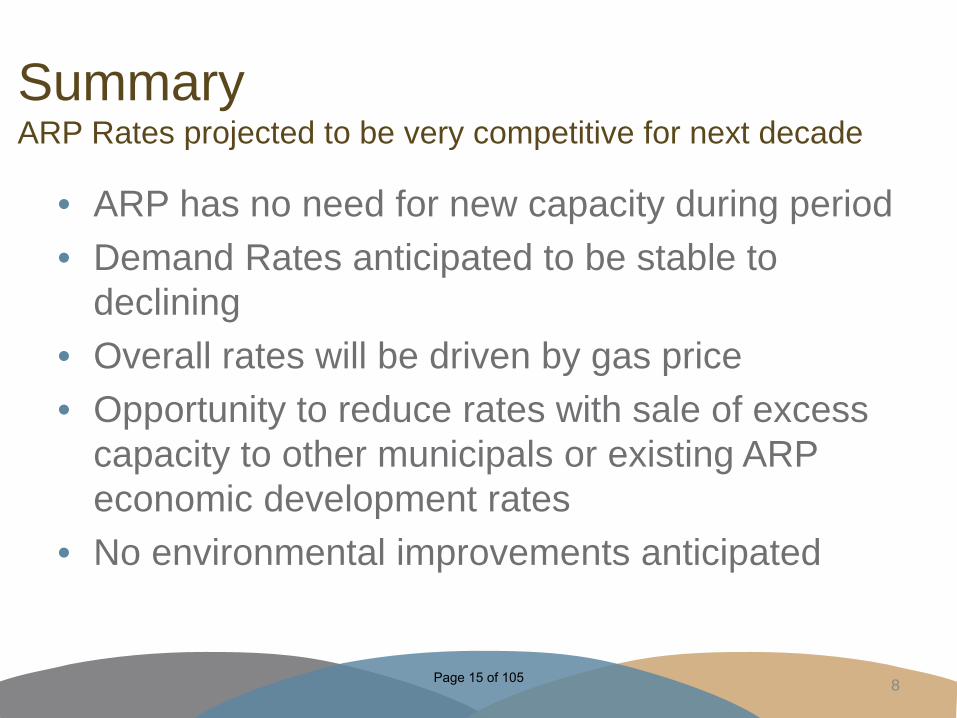
SummaryARP Rates projected to be very competitive for next decade
• ARP has no need for new capacity during period• Demand Rates anticipated to be stable to
declining• Overall rates will be driven by gas price• Opportunity to reduce rates with sale of excess
capacity to other municipals or existing ARP economic development rates
• No environmental improvements anticipated
8Page 15 of 105

2.A. Future Load Growth
9Page 16 of 105

10
ARP Energy Growth Projected at 1.2% per Year
5,000
5,500
6,000
6,500
7,000
7,500
1998 2000 2002 2004 2006 2008 2010 2012 2014 2016 2018 2020 2022 2024 2026 2028
Net
Ene
rgy
for L
oad
(GW
h)
Historical Weather-normalized 2016 Forecast
Compound Annual Growth Rate: 1998-2015: 0.8%2016-2028: 1.2%
• Pre-Recession (1998 –2006): 2.3%
• 2014-2015: 2.7%
Page 17 of 105

Key Trend #1 – Usage Per Meter is Declining
11
Over the past 5 years, load growth has depended on new customers because usage per customer has declined.
-1.0%-0.5%0.0%0.5%1.0%1.5%
Usage PerMeter
Customers Sales
Aggregated - Average Annual Growth Rates (Weather-Normalized) 2011-2015 (Fiscal Year)
Page 18 of 105
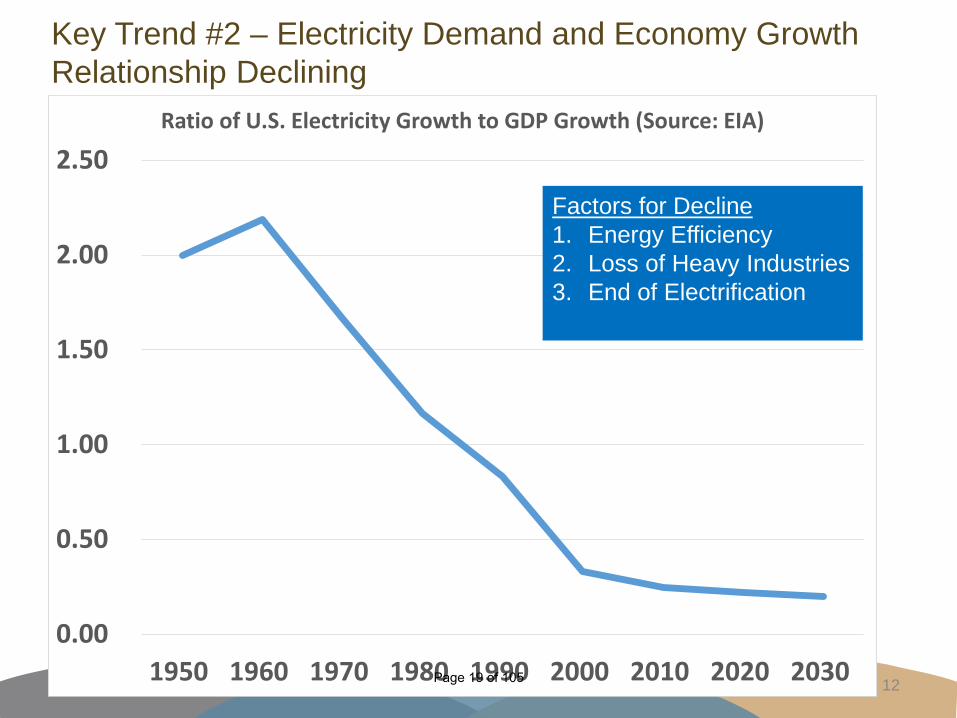
Key Trend #2 – Electricity Demand and Economy Growth Relationship Declining
12
0.00
0.50
1.00
1.50
2.00
2.50
1950 1960 1970 1980 1990 2000 2010 2020 2030
Ratio of U.S. Electricity Growth to GDP Growth (Source: EIA)
Factors for Decline1. Energy Efficiency2. Loss of Heavy Industries3. End of Electrification
Page 19 of 105
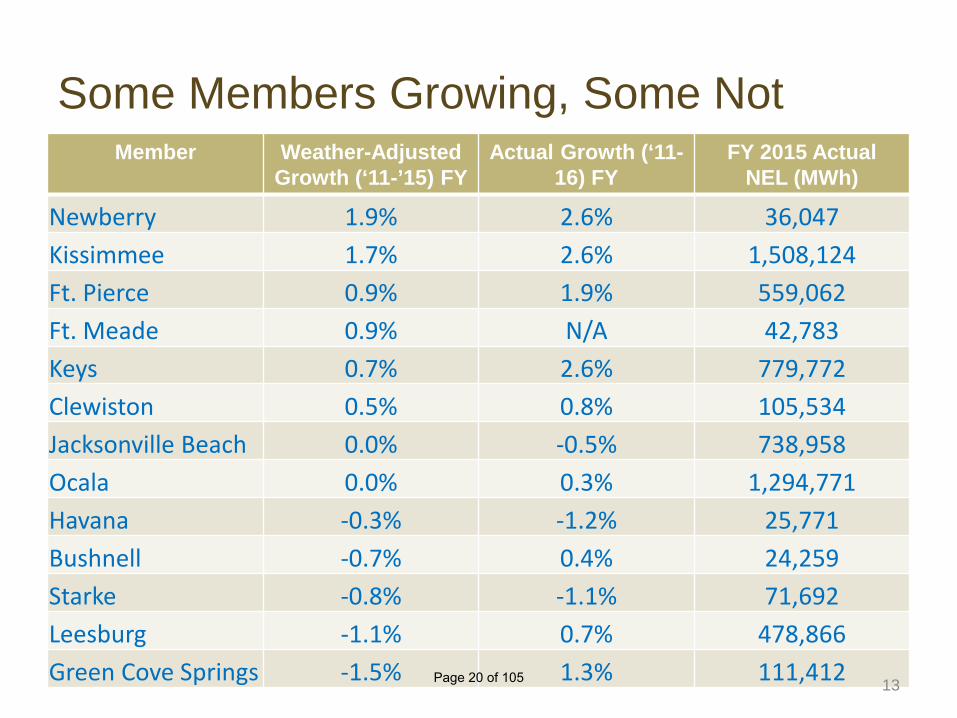
Some Members Growing, Some NotMember Weather-Adjusted
Growth (‘11-’15) FYActual Growth (‘11-
16) FYFY 2015 Actual
NEL (MWh)
Newberry 1.9% 2.6% 36,047Kissimmee 1.7% 2.6% 1,508,124Ft. Pierce 0.9% 1.9% 559,062Ft. Meade 0.9% N/A 42,783Keys 0.7% 2.6% 779,772Clewiston 0.5% 0.8% 105,534Jacksonville Beach 0.0% -0.5% 738,958Ocala 0.0% 0.3% 1,294,771Havana -0.3% -1.2% 25,771Bushnell -0.7% 0.4% 24,259Starke -0.8% -1.1% 71,692Leesburg -1.1% 0.7% 478,866Green Cove Springs -1.5% 1.3% 111,412 13Page 20 of 105
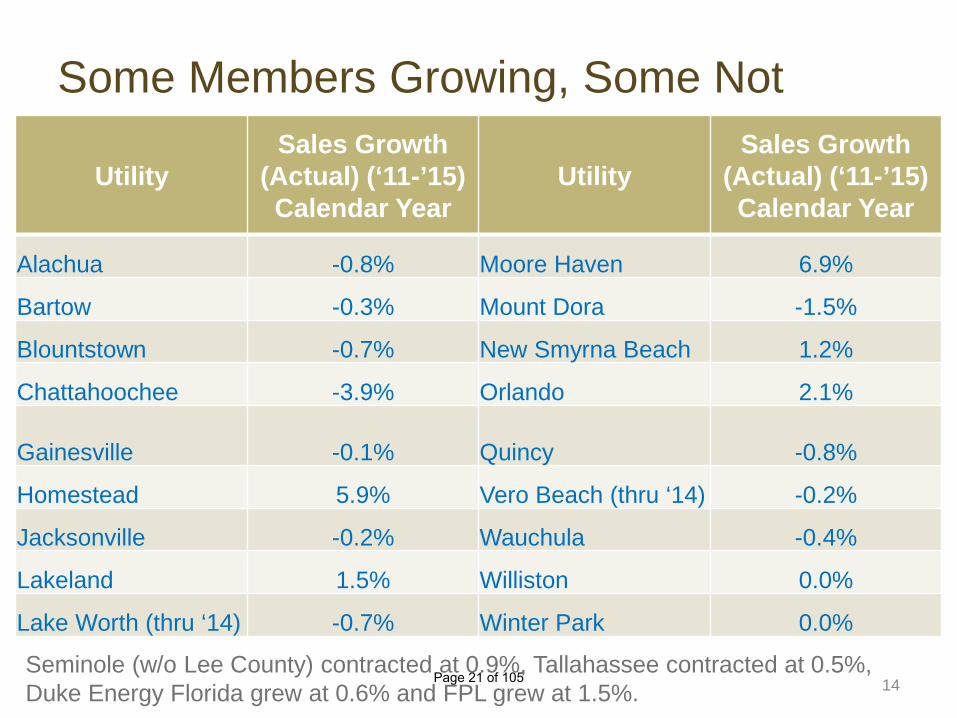
Some Members Growing, Some Not
UtilitySales Growth
(Actual) (‘11-’15) Calendar Year
UtilitySales Growth
(Actual) (‘11-’15) Calendar Year
Alachua -0.8% Moore Haven 6.9%
Bartow -0.3% Mount Dora -1.5%
Blountstown -0.7% New Smyrna Beach 1.2%
Chattahoochee -3.9% Orlando 2.1%
Gainesville -0.1% Quincy -0.8%
Homestead 5.9% Vero Beach (thru ‘14) -0.2%
Jacksonville -0.2% Wauchula -0.4%
Lakeland 1.5% Williston 0.0%
Lake Worth (thru ‘14) -0.7% Winter Park 0.0%
14Seminole (w/o Lee County) contracted at 0.9%, Tallahassee contracted at 0.5%, Duke Energy Florida grew at 0.6% and FPL grew at 1.5%.
Page 21 of 105

2.B. Supply and Demand Balance
15Page 22 of 105
16
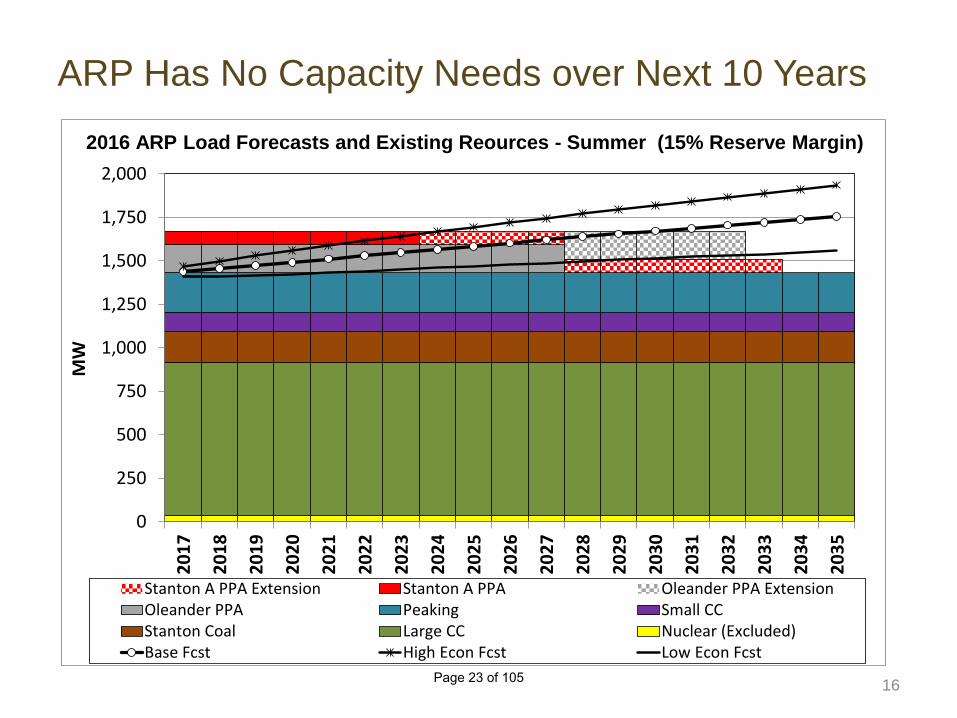
ARP Has No Capacity Needs over Next 10 Years
0
250
500
750
1,000
1,250
1,500
1,750
2,00020
17
2018
2019
2020
2021
2022
2023
2024
2025
2026
2027
2028
2029
2030
2031
2032
2033
2034
2035
MW
Stanton A PPA Extension Stanton A PPA Oleander PPA ExtensionOleander PPA Peaking Small CCStanton Coal Large CC Nuclear (Excluded)Base Fcst High Econ Fcst Low Econ Fcst
2016 ARP Load Forecasts and Existing Reources - Summer (15% Reserve Margin)
Page 23 of 105
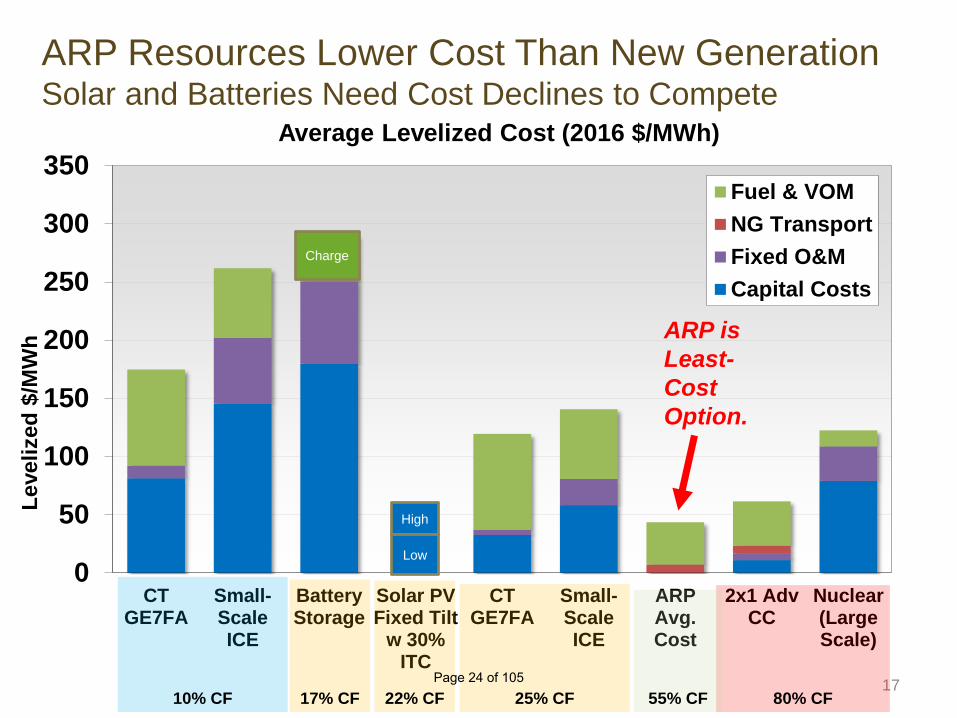
ARP Resources Lower Cost Than New GenerationSolar and Batteries Need Cost Declines to Compete
17
0
50
100
150
200
250
300
350
CTGE7FA
Small-ScaleICE
BatteryStorage
Solar PVFixed Tilt
w 30%ITC
CTGE7FA
Small-ScaleICE
ARPAvg.Cost
2x1 AdvCC
Nuclear(LargeScale)
Leve
lized
$/M
Wh
Average Levelized Cost (2016 $/MWh)
Fuel & VOMNG TransportFixed O&MCapital Costs
10% CF 25% CF 80% CF17% CF 55% CF22% CF
High
Low
ARP is Least-Cost Option.
Charge
Page 24 of 105

Fuel Mix is Exposed to Gas Price Volatility
18
13%
87%
2016 Actual
CoalGas
24%
76%
2026 (EVA Reference Case)
CoalGas
10%
90%
2026 (Gas Forward Strip Case)
CoalGas
$-
$1
$2
$3
$4
$5
$6
$7
2017 2018 2019 2020 2021 2022 2023 2024 2025 2026
$/M
MBt
u, N
omin
al
EVA Q4 2016 and Gas Forward Strip Forecasts ($/MMBtu, Nominal)
Gas Fwd Strip ($/MMBtu, Nominal)
EVA Delivered Gas Price Fcst ($/MMBtu, Nominal)
Page 25 of 105

2.C. Asset and Capital Plan
19Page 26 of 105
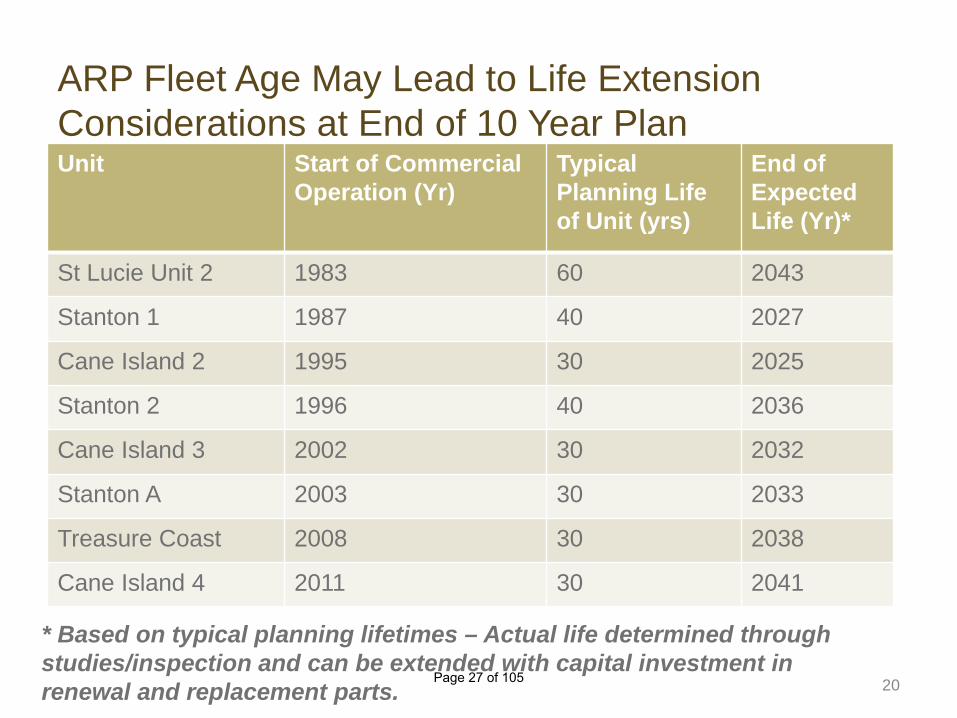
ARP Fleet Age May Lead to Life Extension Considerations at End of 10 Year Plan
20
Unit Start of Commercial Operation (Yr)
Typical Planning Life of Unit (yrs)
End of Expected Life (Yr)*
St Lucie Unit 2 1983 60 2043
Stanton 1 1987 40 2027
Cane Island 2 1995 30 2025
Stanton 2 1996 40 2036
Cane Island 3 2002 30 2032
Stanton A 2003 30 2033
Treasure Coast 2008 30 2038
Cane Island 4 2011 30 2041
* Based on typical planning lifetimes – Actual life determined through studies/inspection and can be extended with capital investment in renewal and replacement parts.
Page 27 of 105

R&R Funding Projected to Increase from $5 M to $9+ M per Year
21
0
5
10
15
20
25
2018 2019 2020 2021 2022 2023 2024 2025 2026 2027
$Mill
ion
Summary of Estimated 10-Year Capital Plan ($M)
Estimated Capital Expense ($M) Estimated R&R Fund Constribution ($M)
Stanton I Turbine Upgrade
Replacement Capital for Gas Path Parts (Treasure Coast & Cane 4)
Cane 3 Rotor Life Extension
Page 28 of 105
Resource Planning Focus – Next 5 Yrs
• Sell excess capacity to non-ARP members• Develop economic development rate for ARP• Solar Projects for Customer non-economic desire• New Project ideas for all members• Track renewable cost reduction trends• Test the market against Stanton A and Oleander PPAs• Evaluate DSM programs (e.g., peak shaving, energy
efficiency)• Periodic updates to forecasts (load, fuel) and plans (IRP,
10 year site plan)
22Page 29 of 105

2.D. FMPA has a Clean Fleet
23Page 30 of 105
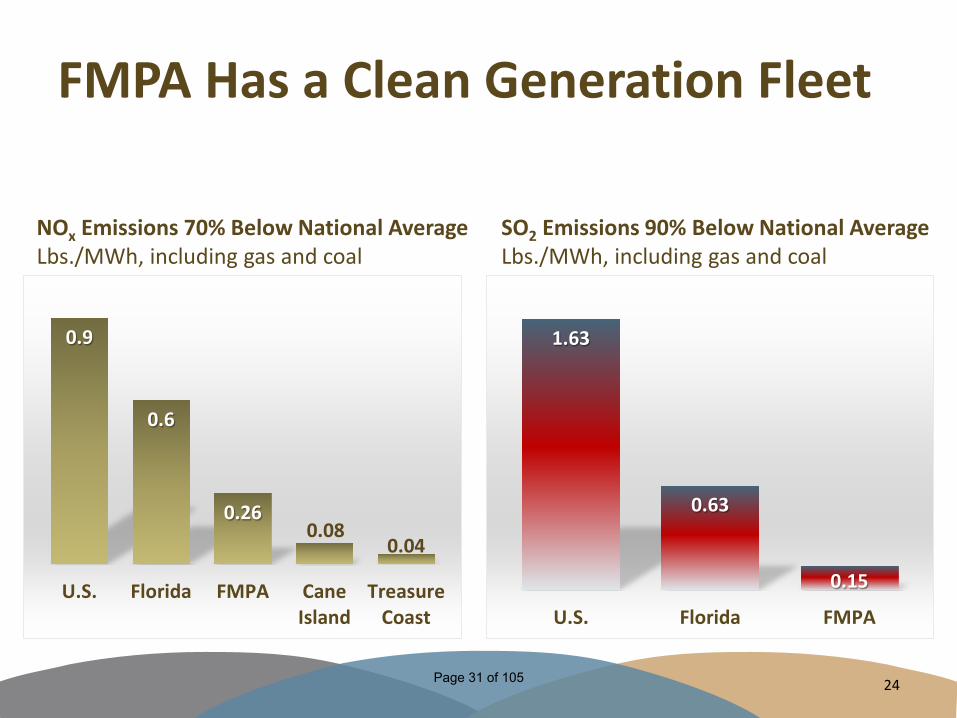
FMPA Has a Clean Generation Fleet
24
NOx Emissions 70% Below National AverageLbs./MWh, including gas and coal
0.9
0.6
0.260.08
0.04
U.S. Florida FMPA CaneIsland
TreasureCoast
SO2 Emissions 90% Below National AverageLbs./MWh, including gas and coal
1.63
0.63
0.15
U.S. Florida FMPA
Page 31 of 105

FMPA Is Well Positioned for Potential Carbon Regulation
25
CO2 Emissions 40% Below National AverageLbs./MWh for all generation
1,698
1,247
1,017
U.S. Florida FMPAPage 32 of 105

2.E. Rate Impacts
26Page 33 of 105

FMPA’s Power Costs Are Down 31% Since 2009
27
All-Requirements Project Power CostsAverage cost per 1,000 kWh billed by fiscal year
$104.80
$94.60
$83.20$79.40
$85.90$81.80
$72.79 $71.88
2009 2010 2011 2012 2013 2014 2015 2016
Power costs have
decreased 31% since 2009
Page 34 of 105

FMPA’s Costs are Competitive and Getting Better
28
$71 $73 $70
$86 $82$73
$87 $85$76
$-
$20
$40
$60
$80
$100
2013 2014 2015FPL ARP Duke
Source: Costs for investor-owned utilities from FERC Form 1 for long-term, full-requirements-type service.
FMPA’s Costs Are Lower Than Duke’s, FPL’s Rates Increased for 2017
Page 35 of 105

ARP Debt Projected to Decline through 2031Anticipate using R&R funding for 10 year capital plan with no new debt
29[1] These costs are not typically reflected in ARP debt service and capital lease cost schedules.[2] Debt service associated with Participant entitlements in the Stanton coal projects that is paid by the ARP.[3] Costs will only be incurred to the extent the ARP continues to use the associated resources beyond their respective fixedpayment terms.
$0
$20
$40
$60
$80
$100
$120
$140
2017 2019 2021 2023 2025 2027 2029 2031 2033 2035
Annu
al C
ost (
$Mill
ions
)
Accrual Year (FY)
Annual ARP Debt, Fixed & Optional TARP, and Assigned Project Debt Costs by Series
Assigned Project Debt Service (C&E) [1] [2] KEYS TARP PaymentsKUA TARP Payments (Optional) [1] [3] KUA TARP Payments (Fixed)PGP Debt Service Taylor Swaps Debt ServiceExisting ARP Debt Service
Page 36 of 105

Total ARP Fixed Costs Projected to Remain Stable
30
Debt & Capital Lease
Fixed O&M
Gas Transport
Purchased Cap.
A&G & Other
$0
$50
$100
$150
$200
$250
$300
2017 2022 2026
Annu
al C
ost (
$Mill
ions
)
Calendar Year
Projected Fixed Costs by Component (Excl. Transmission)
Page 37 of 105

ARP Costs Are Projected to Decline by 0.7% per Year if Gas Prices Follow Forward Strip
31
$0
$10
$20
$30
$40
$50
$60
$70
$80
$90
2017 2018 2019 2020 2021 2022 2023 2024 2025 2026
Aver
age
Cost
($/M
Wh)
Calendar Year
Projected ARP Demand and Energy Costs ($/MWh)
Avg. Demand Cost (Excluding Trans.) Average Energy CostPage 38 of 105
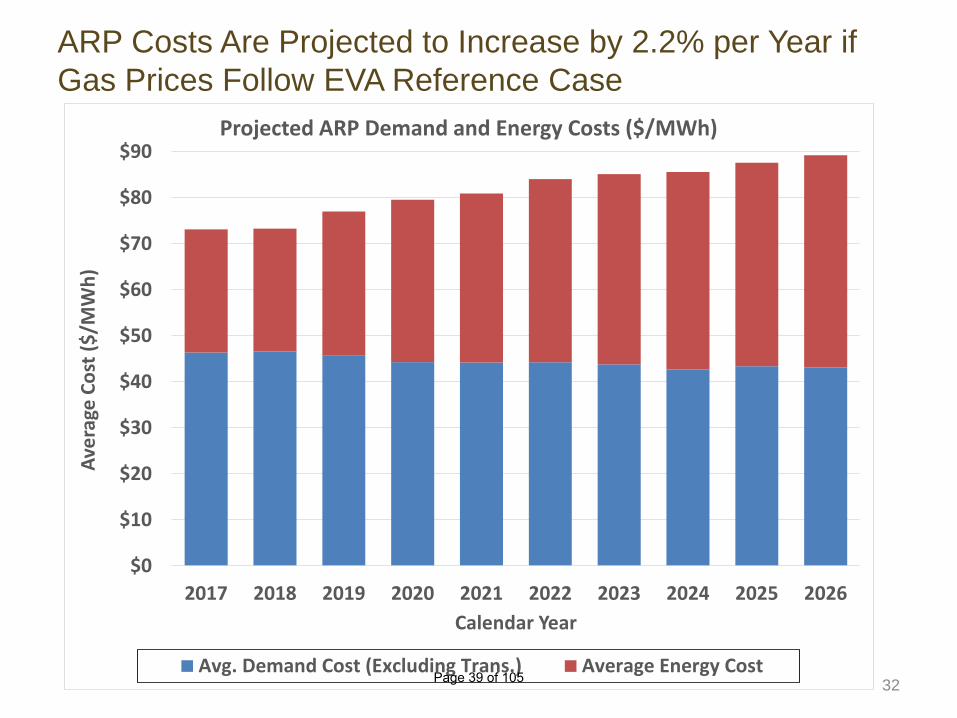
ARP Costs Are Projected to Increase by 2.2% per Year if Gas Prices Follow EVA Reference Case
32
$0
$10
$20
$30
$40
$50
$60
$70
$80
$90
2017 2018 2019 2020 2021 2022 2023 2024 2025 2026
Aver
age
Cost
($/M
Wh)
Calendar Year
Projected ARP Demand and Energy Costs ($/MWh)
Avg. Demand Cost (Excluding Trans.) Average Energy CostPage 39 of 105

Stanton and Tri-Cities Increase Overall Cost Despite Debt Payoff if Gas at Forward Strip
33
Other Costs
Debt Service
O&M Costs
Fuel Costs
$-
$20
$40
$60
$80
$100
$120
$140
$160
$180
$200
2017 Budget 2020 2026
$/M
Wh
Projected Stanton Project Costs
11% Capacity Factor 15% Capacity
Factor
36% Capacity Factor
Page 40 of 105
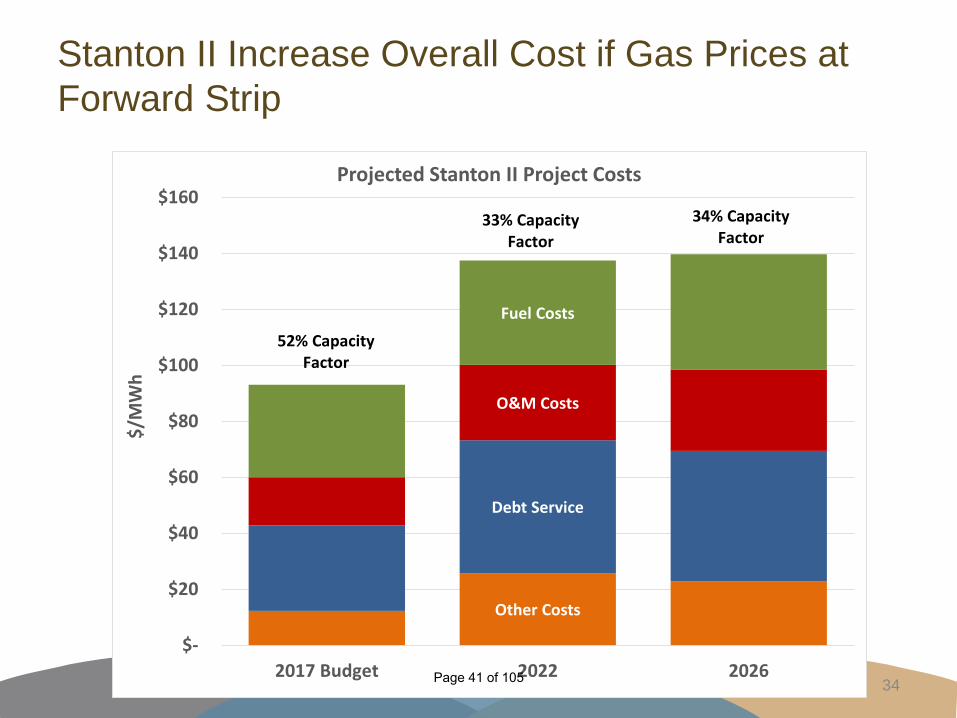
Stanton II Increase Overall Cost if Gas Prices at Forward Strip
34
Other Costs
Debt Service
O&M Costs
Fuel Costs
$-
$20
$40
$60
$80
$100
$120
$140
$160
2017 Budget 2022 2026
$/M
Wh
Projected Stanton II Project Costs
52% Capacity Factor
33% Capacity Factor
34% Capacity Factor
Page 41 of 105
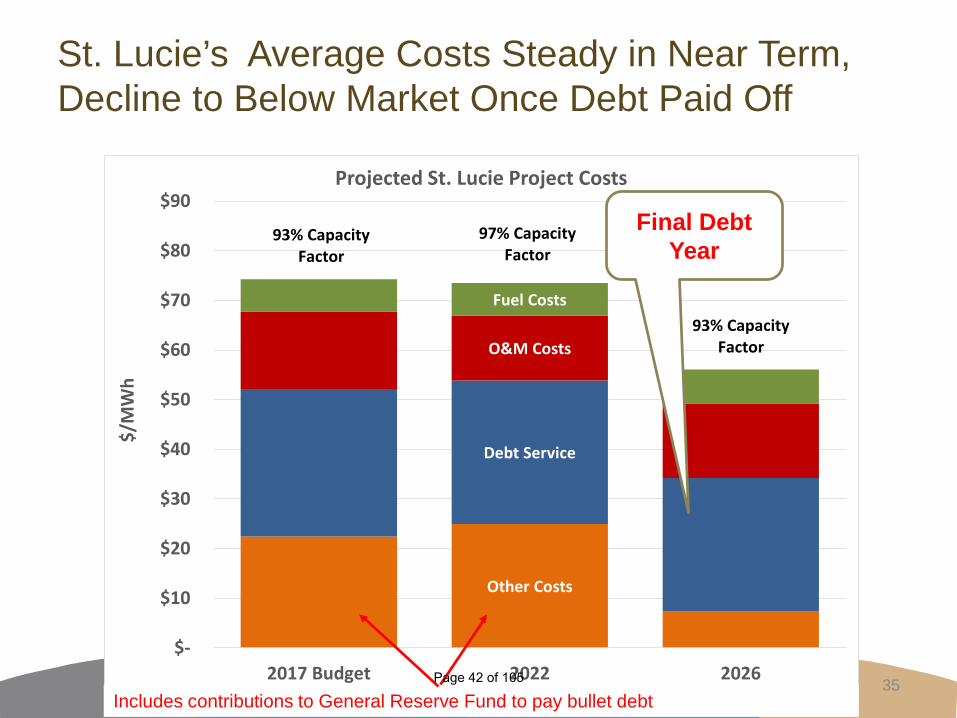
St. Lucie’s Average Costs Steady in Near Term, Decline to Below Market Once Debt Paid Off
35
Other Costs
Debt Service
O&M Costs
Fuel Costs
$-
$10
$20
$30
$40
$50
$60
$70
$80
$90
2017 Budget 2022 2026
$/M
Wh
Projected St. Lucie Project Costs
93% Capacity Factor
97% Capacity Factor
93% Capacity Factor
Final Debt Year
Includes contributions to General Reserve Fund to pay bullet debtPage 42 of 105

2.F. Risks and Opportunities
36Page 43 of 105
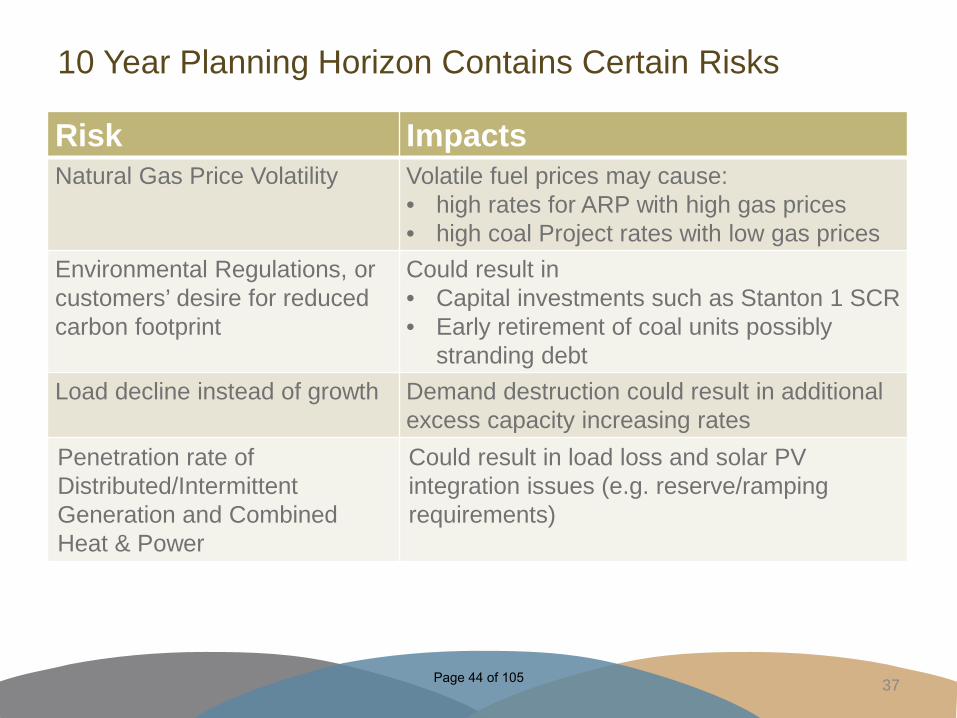
Risk ImpactsNatural Gas Price Volatility Volatile fuel prices may cause:
• high rates for ARP with high gas prices• high coal Project rates with low gas prices
Environmental Regulations, or customers’ desire for reduced carbon footprint
Could result in• Capital investments such as Stanton 1 SCR• Early retirement of coal units possibly
stranding debtLoad decline instead of growth Demand destruction could result in additional
excess capacity increasing ratesPenetration rate of Distributed/Intermittent Generation and Combined Heat & Power
Could result in load loss and solar PV integration issues (e.g. reserve/ramping requirements)
10 Year Planning Horizon Contains Certain Risks
37Page 44 of 105
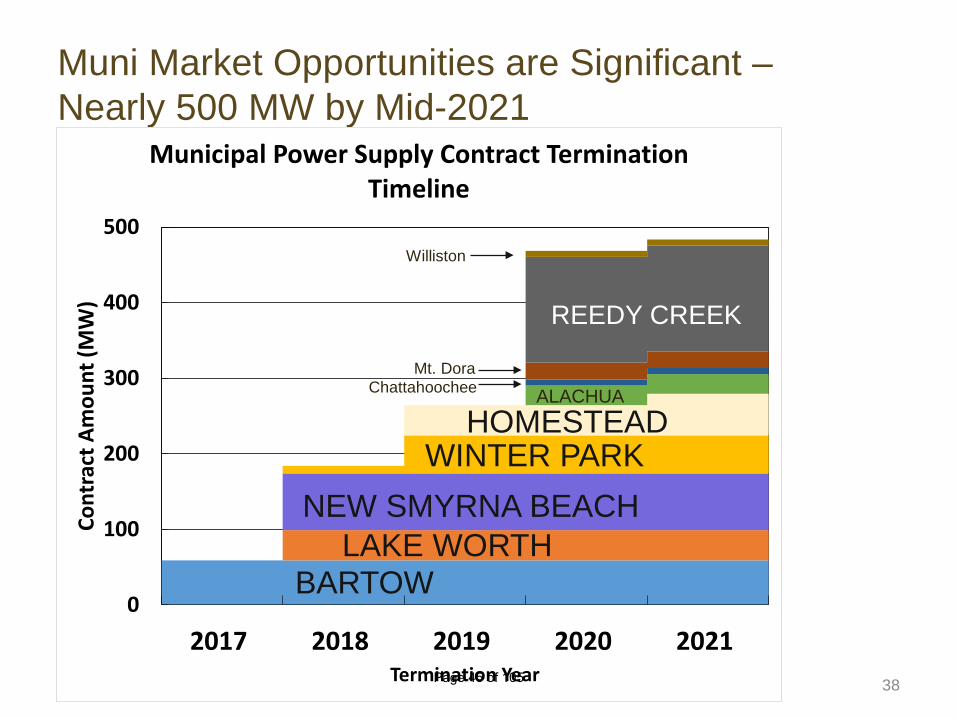
Muni Market Opportunities are Significant –Nearly 500 MW by Mid-2021
38
0
100
200
300
400
500
2017 2018 2019 2020 2021
Cont
ract
Am
ount
(MW
)
Termination Year
Municipal Power Supply Contract Termination Timeline
REEDY CREEK
HOMESTEADWINTER PARK
NEW SMYRNA BEACHLAKE WORTH
BARTOW
Mt. DoraChattahoochee
Williston
ALACHUA
Page 45 of 105

Other Markets Could Mean More Opportunities for Sales• Co-ops
• Seminole just finished an RFP• Larger munis (OUC, JEA, TAL, LAK)
• E.g., OUC is planning an RFP• IOUs
39Page 46 of 105

Increased Solar Penetration Could Further Depress Power Market Prices
40
0
500
1,000
1,500
2,000
2,500
3,000
3,500
4,000
2016 2017 2018 2019 2020 2021 2022 2023 2024 2025
MW
Summary of Estimated Solar Installations (Nominal MW) (Sources: FPSC 2016 TYSP Review and FPL Approved Case Settlement)
Total Planned CumulativePage 47 of 105
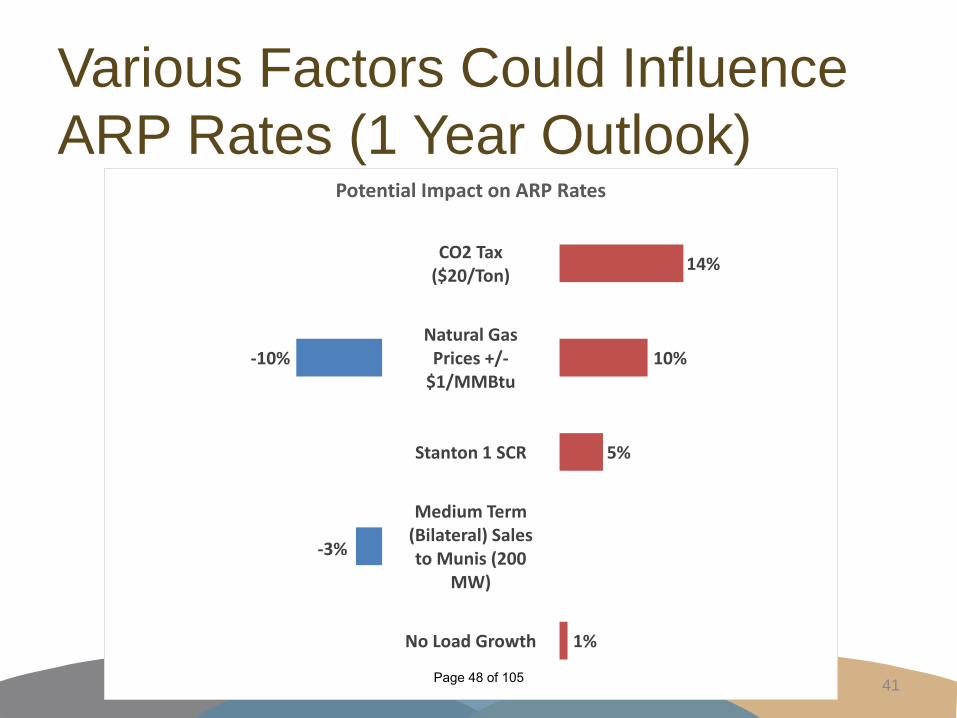
Various Factors Could Influence ARP Rates (1 Year Outlook)
41
No Load Growth
Medium Term (Bilateral) Sales to Munis (200
MW)
Stanton 1 SCR
Natural Gas Prices +/-
$1/MMBtu
CO2 Tax ($20/Ton)
1%
5%
10%
14%
-3%
-10%
Potential Impact on ARP Rates
Page 48 of 105

Risks and Opportunities: St. Lucie and Coal Projects• Opportunities
• Negotiate lower rail costs• Reliability Exchange Agreement
• Risks• SCR on Stanton 1 or other possible env. upgrades• Steam generator replacement on St. Lucie or other life extension
investment• When will the units be retired?• Low gas prices cause low capacity factor for coal, raising rates• Aging may result in lower availability
42Page 49 of 105

2.G. Conclusions
43Page 50 of 105
Conclusion - FMPA Moving into “Thrive Mode”• Overall Rates look to be very competitive but will be
driven by gas price• ARP has no need for new capacity nor major
environmental upgrades during period• FMPA should actively seek to sell excess capacity
• Other Municipals• Economic Development Rates to ARP
• Support non-economic renewable project developments as members desire
• Member services growing in importance to support further technical demands on members
• Resolving “negative” issues needed to get out of Legislative eye and promote the strong positives
44Page 51 of 105

3. Succession Planning
45Page 52 of 105

One-Quarter of FMPA’s Staff Are 55 or Older
Age Breakdown of FMPA’s WorkforceAmong 67 full-time employees
46Page 53 of 105
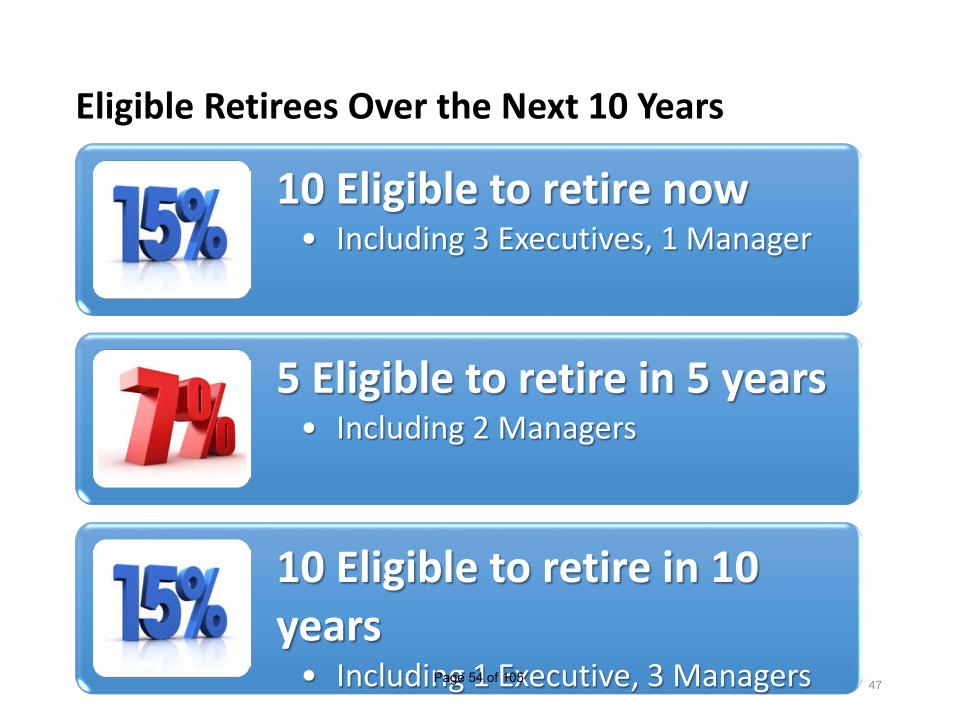
Eligible Retirees Over the Next 10 Years
10 Eligible to retire now• Including 3 Executives, 1 Manager
5 Eligible to retire in 5 years• Including 2 Managers
10 Eligible to retire in 10 years• Including 1 Executive, 3 Managers 47Page 54 of 105

Four Critical Positions Have Incumbents Who Are At or Near Retirement Eligibility Now
Area of Expertise Qualified by Age
Qualified by FMPA
Successor Identified
Succession Plan Needed
Legal Yes Yes Yes Within 1 year
Finance No Yes No Within 1 year
Communications No Yes No Within 2 years
Power Pool No Yes No Within 1 year
Page 55 of 105

Effective SuccessionPlanning
Analyze Needs/Gaps
Identify Talent Pool/Successor
Develop Strategies
Implement Strategies
Monitor and Evaluate
Link strategic goals and succession plans
49Page 56 of 105

4. Energy Market Discussion
50Page 57 of 105

Energy Ventures Analysis1901 N. Moore St. Arlington, VA 22209(703) 276 8900
U.S. ENERGY MARKET OUTLOOK –AN UNCERTAIN FUTURE
February 15, 2017
Prepared for:Florida Municipal Power Agency
Page 58 of 105
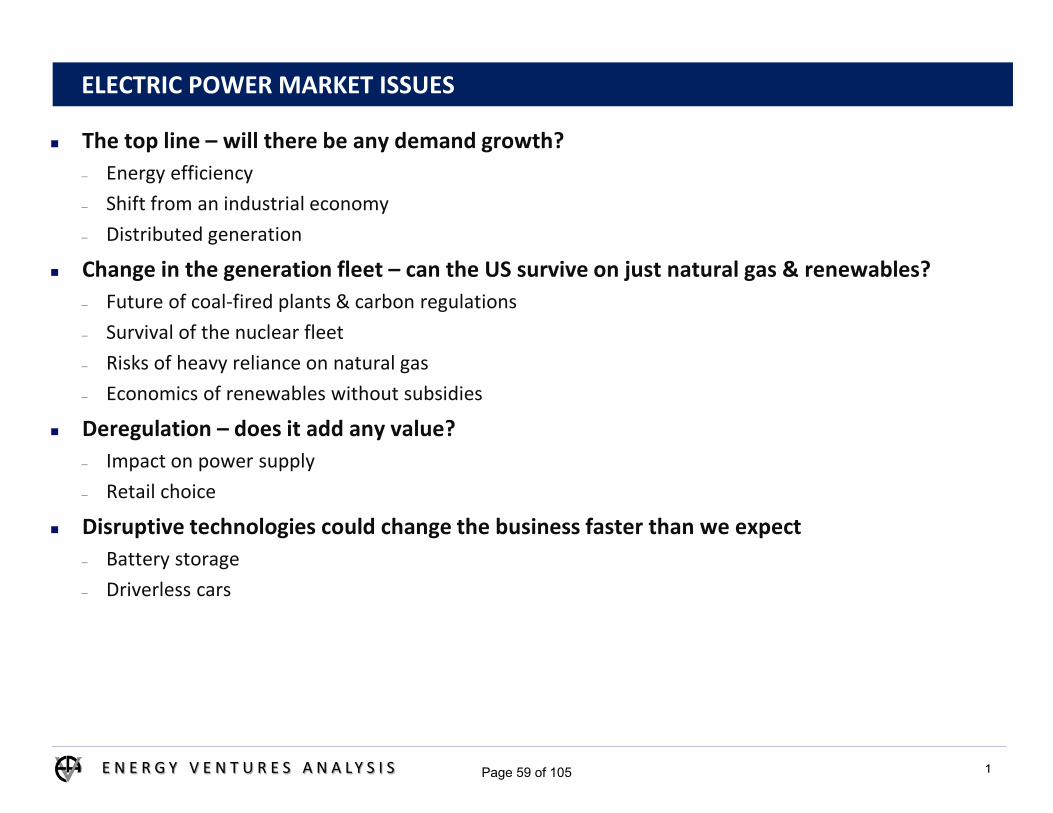
ELECTRIC POWER MARKET ISSUES
E N E R G Y V E N T U R E S A N A L Y S I S
The top line – will there be any demand growth?– Energy efficiency– Shift from an industrial economy– Distributed generation
Change in the generation fleet – can the US survive on just natural gas & renewables?– Future of coal-fired plants & carbon regulations– Survival of the nuclear fleet– Risks of heavy reliance on natural gas– Economics of renewables without subsidies
Deregulation – does it add any value?– Impact on power supply– Retail choice
Disruptive technologies could change the business faster than we expect– Battery storage– Driverless cars
1Page 59 of 105
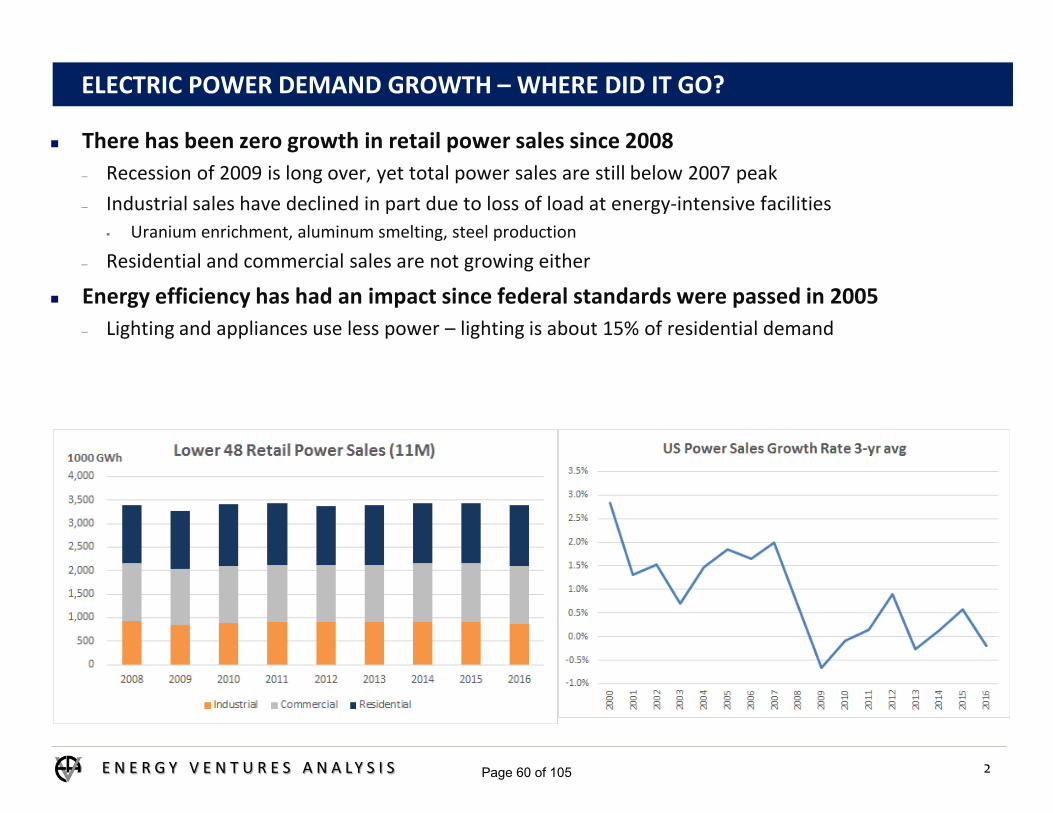
ELECTRIC POWER DEMAND GROWTH – WHERE DID IT GO?
E N E R G Y V E N T U R E S A N A L Y S I S
There has been zero growth in retail power sales since 2008– Recession of 2009 is long over, yet total power sales are still below 2007 peak– Industrial sales have declined in part due to loss of load at energy-intensive facilities
Uranium enrichment, aluminum smelting, steel production
– Residential and commercial sales are not growing either
Energy efficiency has had an impact since federal standards were passed in 2005– Lighting and appliances use less power – lighting is about 15% of residential demand
2Page 60 of 105

FLORIDA RETAIL POWER SALES HAVE NO GROWTH EITHER
E N E R G Y V E N T U R E S A N A L Y S I S
Retail sales compound annual growth rate 2007 – 2016(p) – 0.18%– Small shift from already minimal industrial demand to residential– Residential CAGR 2007 – 2016p only 0.48%
Average per capita power sales fell from 12,600 to 11,400 kWh per year– State population CAGR 1.3% annually since 2007
3Page 61 of 105

ELECTRIC POWER GENERATION IN FLORIDA – ALL GAS, ALL THE TIME?
E N E R G Y V E N T U R E S A N A L Y S I S
Since 2001, natural gas share of power generation has soared from 23% to 68%– FPL and FPC replaced oil with CCGT; Crystal River nuclear retired– Only major coal plant retirement was TECO – Gannon, coal capacity factors fell from 73% to 45%– Coal plant retirements have accelerated
Cedar Bay and Lansing Smith retired in 2016 Crystal River 1-2 and Indiantown announced for 2018
4Page 62 of 105

CAN THE COAL POWER FLEET SURVIVE ENVIRONMENTAL REGULATIONS?
E N E R G Y V E N T U R E S A N A L Y S I S
The list of new EPA rules affecting the coal fleet is overwhelming– Mercury and Air Toxics Standard (MATS) – technology-forcing standards for mercury and chlorine– Effluent Limitation Guidelines (ELG) – expensive wastewater treatment for scrubbed plants– Coal Combustion Residuals (CCR) – forced conversion from wet ponds to dry landfills– Regional haze (BART) – forcing reductions in aerosol emissions (SO2 and NOx)– Cross-State Air Pollution Rule (CSAPR) – state limits on fine particulate emissions (SO2 and NOx)– National Ambient Air Quality Standards (NAAQS) – new one-hour limits on ozone and SO2
– Cooling water intake (316b) – limits on cooling water impacts on aquatic life– New Source Review (NSR) – compliance with new source standards when making major modifications– Clean Power Plan (CPP) – state caps on total carbon dioxide emissions
Impact is similar – force new environmental capital in order to keep coal plants open– With lower gas prices and subsidized renewables, economic for new capital are less attractive
Can the new Trump Administration change this trajectory?– Not clear yet; if rules survive court challenges they must be revised by a new rulemaking– Legislative action is unlikely– Clean Power Plan is not likely to survive court case – may not matter if other new regulations are
unchanged
5Page 63 of 105
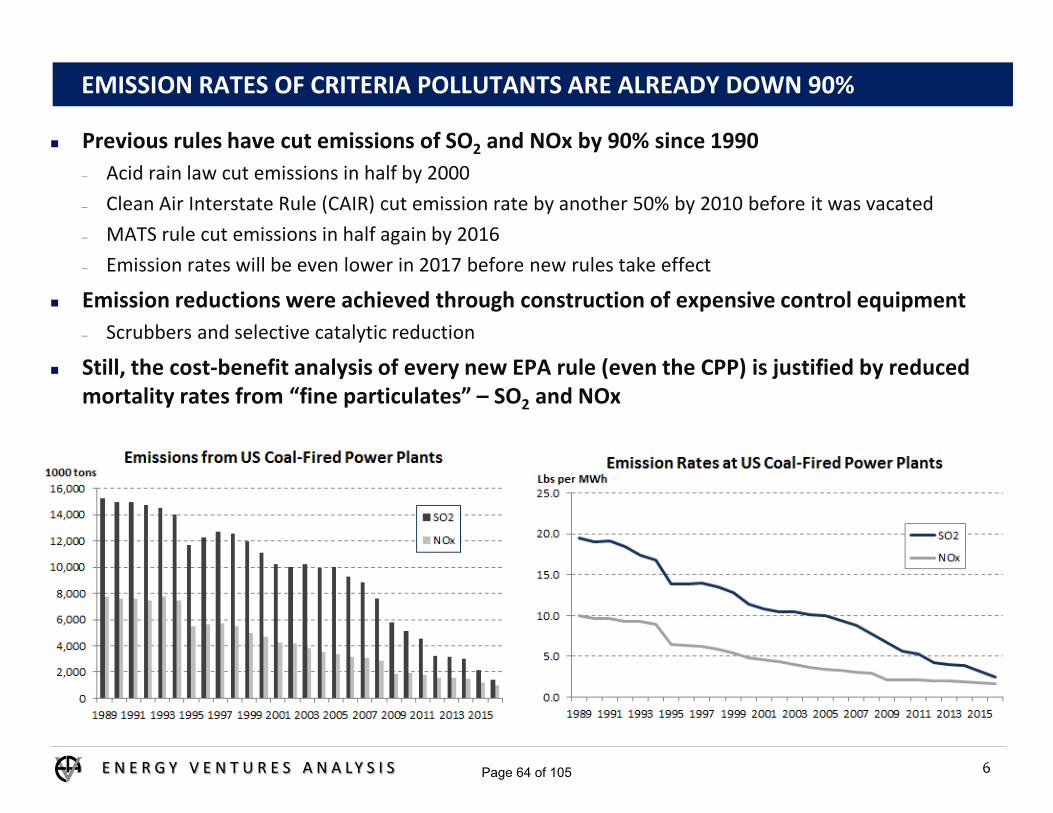
EMISSION RATES OF CRITERIA POLLUTANTS ARE ALREADY DOWN 90%
E N E R G Y V E N T U R E S A N A L Y S I S
Previous rules have cut emissions of SO2 and NOx by 90% since 1990– Acid rain law cut emissions in half by 2000– Clean Air Interstate Rule (CAIR) cut emission rate by another 50% by 2010 before it was vacated– MATS rule cut emissions in half again by 2016– Emission rates will be even lower in 2017 before new rules take effect
Emission reductions were achieved through construction of expensive control equipment– Scrubbers and selective catalytic reduction
Still, the cost-benefit analysis of every new EPA rule (even the CPP) is justified by reduced mortality rates from “fine particulates” – SO2 and NOx
6Page 64 of 105
ELECTRIC POWER MARKET COULD BE CHANGED BY DISRUPTIVE TECHNOLOGIES
E N E R G Y V E N T U R E S A N A L Y S I S
Batteries can change everything in the energy business– Previous battery technology was heavy, slow to charge and deteriorated as it discharged– However, batteries have major advantages if 2 of the 3 problems can be solved
For power generation, batteries can reduce the high cost of power storage– Current power storage is managed by building excess capacity of fossil generators– Local battery storage can enable wind and solar to become reliable power sources
Residential battery storage can allow customers to shift to distributed generation– Potentially destructive for the utility business model
Improved batteries would unlock the potential of electric cars– Current technology limited by range and charge time– Lack of charging infrastructure is a major hurdle– CAFÉ standards for 2025 cannot be met without electric vehicles
Driverless cars would change the energy landscape – Shift to taxi-type transportation would facilitate central charging and electric cars
7Page 65 of 105

NATURAL GAS – WILL IT STAY CHEAP AND ABUNDANT FOREVER?
E N E R G Y V E N T U R E S A N A L Y S I S
A brief history of natural gas prices– 1986 – 1999: Deregulation created excess capacity and prices about $2.00– 2000 – 2008: Growing demand from new CCGT consumed supply and $6.00 prices, with spikes– 2009 – 2017: The Shale Gas Era; growing supply from hydraulic fracturing kept prices at $4.00
Prices slumped below $3.00 in mild winters of 2012, 2015 and 2016; Polar Vortex briefly over $6.00
8Page 66 of 105
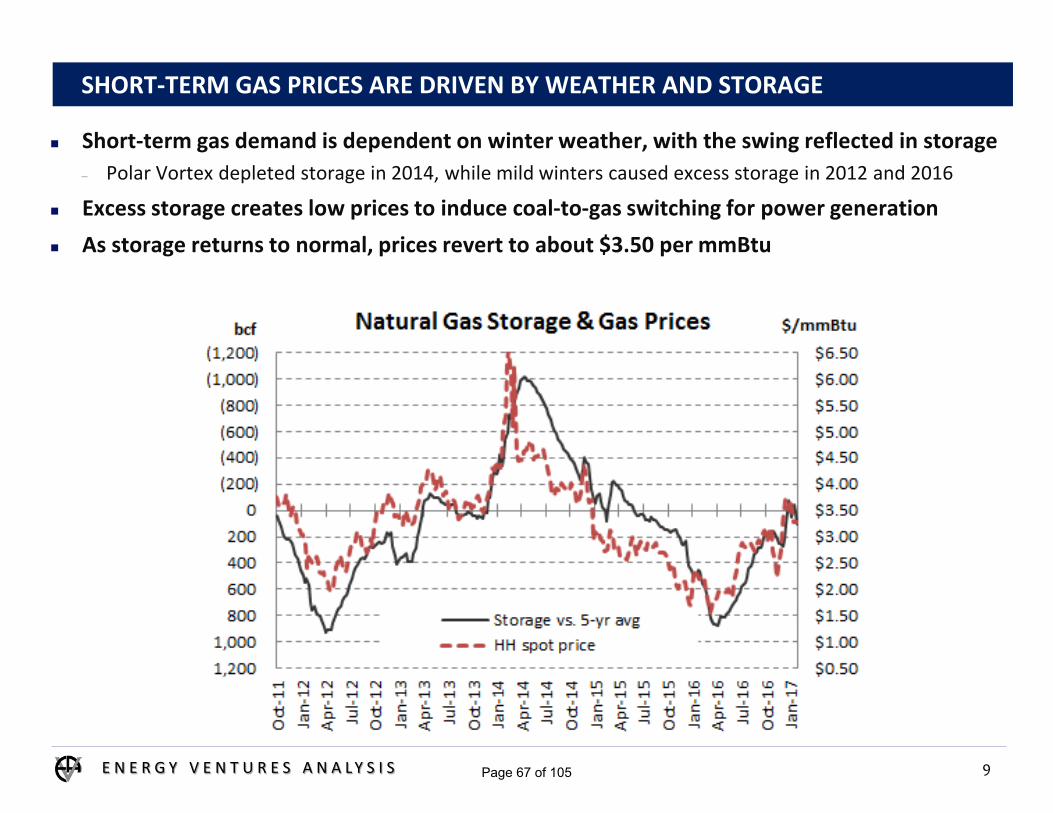
SHORT-TERM GAS PRICES ARE DRIVEN BY WEATHER AND STORAGE
E N E R G Y V E N T U R E S A N A L Y S I S
Short-term gas demand is dependent on winter weather, with the swing reflected in storage– Polar Vortex depleted storage in 2014, while mild winters caused excess storage in 2012 and 2016
Excess storage creates low prices to induce coal-to-gas switching for power generation As storage returns to normal, prices revert to about $3.50 per mmBtu
9Page 67 of 105

HAS NATURAL GAS SUPPLY GROWTH COME TO AN END?
E N E R G Y V E N T U R E S A N A L Y S I S
The shale gas surge increased supply from 55 bcfd in 2008 to 75 bcfd in 2015– Fracking and horizontal drilling unlocked supply of shale gas at low costs with low risks
Gas production has been falling since September 2015 in response to prices below $3.00
10Page 68 of 105

GAS DRILLING RIG COUNT IS BEGINNING TO RECOVER
E N E R G Y V E N T U R E S A N A L Y S I S
Total active gas rigs fell from 900 in 2011 to just 81 in August 2016– However, drilling has been concentrated in the prolific shale plays
Rig counts have recovered up 79% by February 2017, responding to higher gas prices
11Page 69 of 105
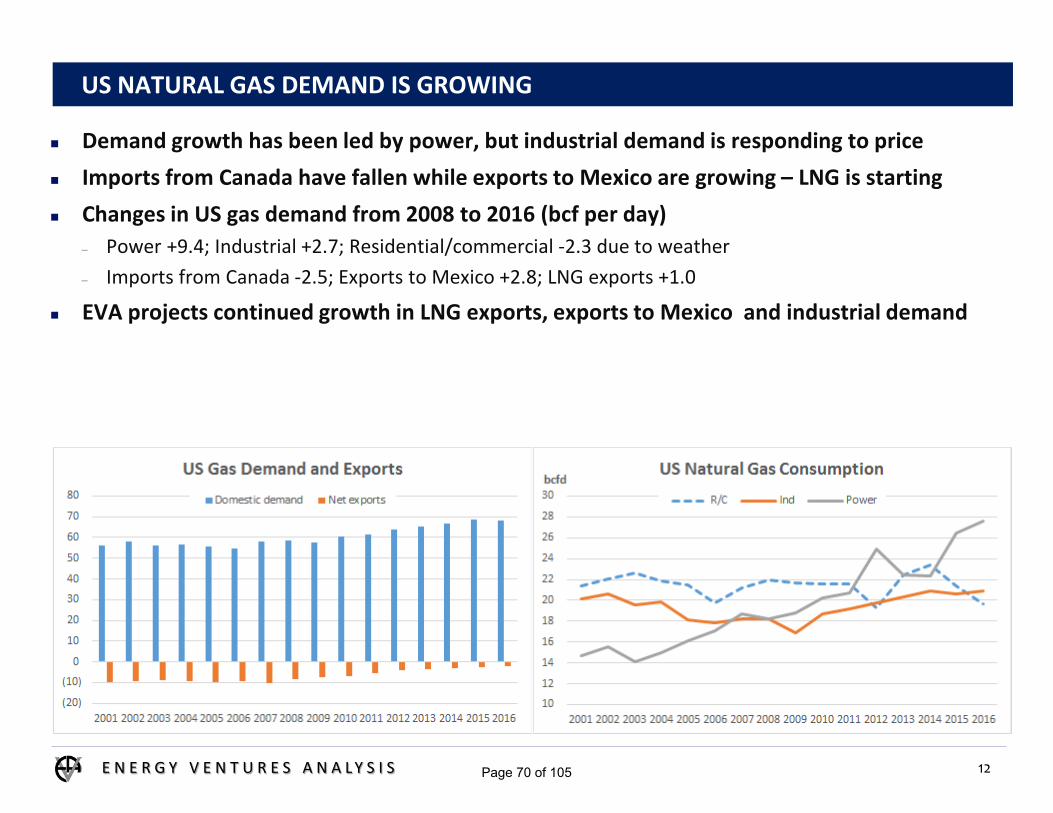
US NATURAL GAS DEMAND IS GROWING
E N E R G Y V E N T U R E S A N A L Y S I S
Demand growth has been led by power, but industrial demand is responding to price Imports from Canada have fallen while exports to Mexico are growing – LNG is starting Changes in US gas demand from 2008 to 2016 (bcf per day)
– Power +9.4; Industrial +2.7; Residential/commercial -2.3 due to weather– Imports from Canada -2.5; Exports to Mexico +2.8; LNG exports +1.0
EVA projects continued growth in LNG exports, exports to Mexico and industrial demand
12Page 70 of 105

US LIQUEFIED NATURAL GAS EXPORTS WILL BECOME A LARGE DEMAND
E N E R G Y V E N T U R E S A N A L Y S I S
New Sabine Pass terminal is shipping 1.0 bcfd and will expand to 2.0 bcfd Cove Point will start in early 2018, followed by Freeport in Texas LNG terminals have fixed contracts to pay for capacity Future volumes depend upon spread between world price and US price
– Spot price spread needs to be +$1.30 to Europe and Asia to cover variable costs
13Page 71 of 105

FUTURES MARKET CONTINUES TO EXPECT LOW GAS PRICES
E N E R G Y V E N T U R E S A N A L Y S I S
Futures market expects a sharp drop in gas price in Spring 2018– Return to structural excess capacity
EVA expects that the short era of gas prices below $3.00 is over, except for mild winters– Demand growth will be robust in non-power sectors, especially with new LNG terminals in 2019– Increased drilling is narrowly focused in prolific shale plays and associated gas– Price will need to support broader gains
14Page 72 of 105

LONG-TERM NATURAL GAS PRICES WILL RISE WITH HIGHER COSTS
E N E R G Y V E N T U R E S A N A L Y S I S
EVA forecast of long-term gas prices exceeds $4.00 by 2023– Growing demand will combine with depletion of best shales to cause a return to higher prices– Market price volatility is likely to grow with link to world LNG markets– Gas demand and price will be affected by a variety of world factors (weather, currency)
15Page 73 of 105

US COAL MARKETS HAVE BEEN HIT HARD BY LOWER DEMAND
E N E R G Y V E N T U R E S A N A L Y S I S
Domestic power demand is primary market – down 262 mm tons from 2011– Coal burn has fallen sharply due to combination of EPA rules and low gas prices
New EPA regulations could have been absorbed had gas prices stayed above $5.00 Low gas prices would not have forced coal plant retirements without EPA regulations mandating capital
World coal markets still have a major impact on US coal prices– US is a swing supplier for world coal markets – both metallurgical and thermal coal
Other domestic markets continue to decline
16
mm tons 2011 2012 2013 2014 2015 2016 2017 2018 2019 2020U. S. Coal Total
Electric Power Burn 932.0 822.5 857.1 850.4 736.6 670.6 729.5 711.3 695.3 697.2Consumer stock change (2.4) 8.6 (42.8) (4.1) 40.2 (30.9) (41.0) (8.0) 0.0 0.0
Electric Power Receipts 929.6 831.2 814.3 846.3 776.8 639.7 688.5 703.3 695.3 697.2Coke Ovens 22.1 20.9 21.1 21.7 19.5 16.0 17.9 17.3 17.0 16.7Industrial/Commercial 47.8 44.8 45.0 45.3 40.3 34.7 38.2 37.7 37.2 36.7Domestic Demand 999.4 896.8 880.4 913.3 836.6 690.4 744.6 758.3 749.5 750.7
Export metallurgical 69.0 68.2 61.2 57.6 44.6 39.4 43.0 42.0 41.0 40.0Export steam 42.6 61.7 64.2 44.4 35.4 23.1 42.8 38.8 38.4 38.1Total Exports 111.6 129.9 125.5 102.0 80.0 62.5 85.8 80.8 79.4 78.1
Total Demand 1,111.0 1,026.7 1,005.9 1,015.3 916.6 752.8 830.4 839.1 829.0 828.8
Page 74 of 105
17
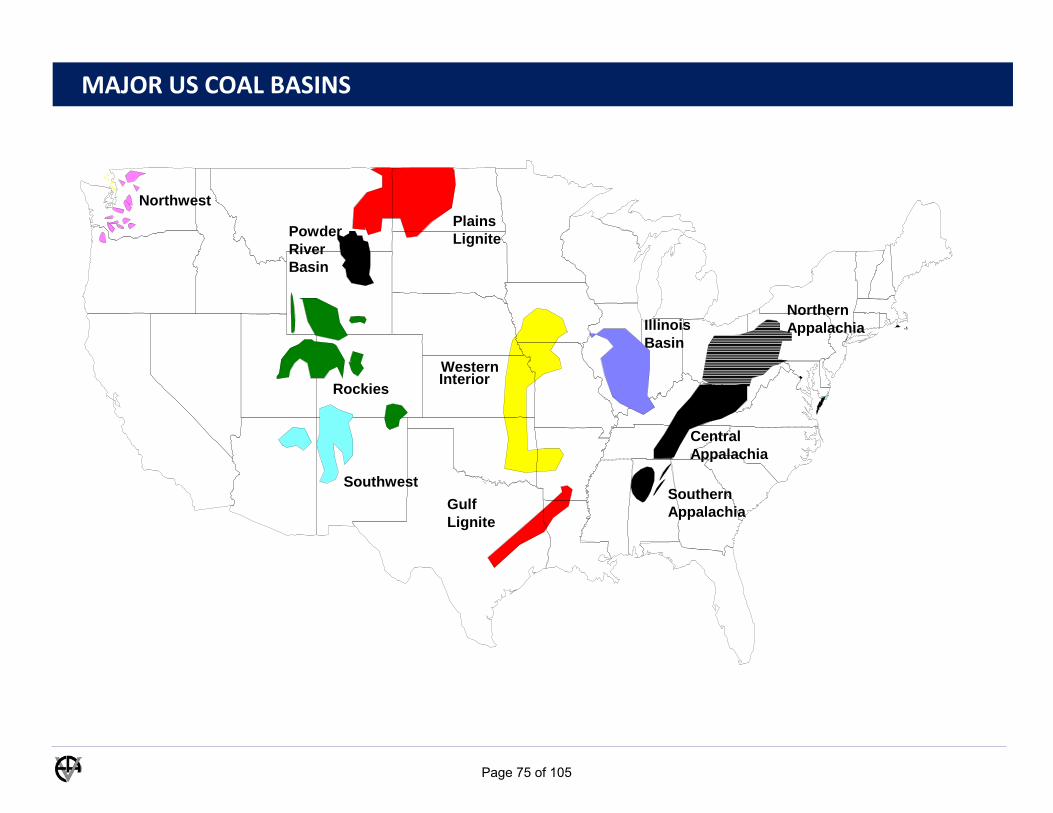
NorthwestPlainsLignite
GulfLignite
Rockies Interior
Northern Appalachia
Southern Appalachia
PowderRiverBasin
Southwest
Western
IllinoisBasin
Central Appalachia
MAJOR US COAL BASINS
Page 75 of 105
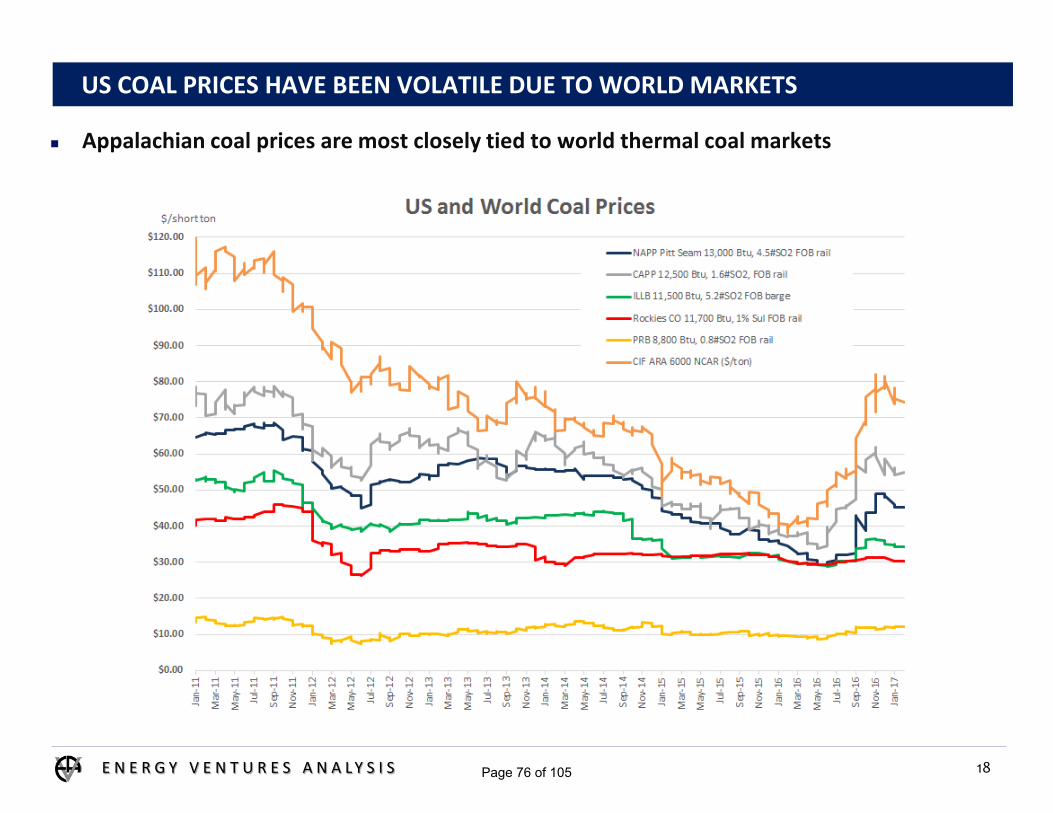
US COAL PRICES HAVE BEEN VOLATILE DUE TO WORLD MARKETS
E N E R G Y V E N T U R E S A N A L Y S I S
Appalachian coal prices are most closely tied to world thermal coal markets
18Page 76 of 105
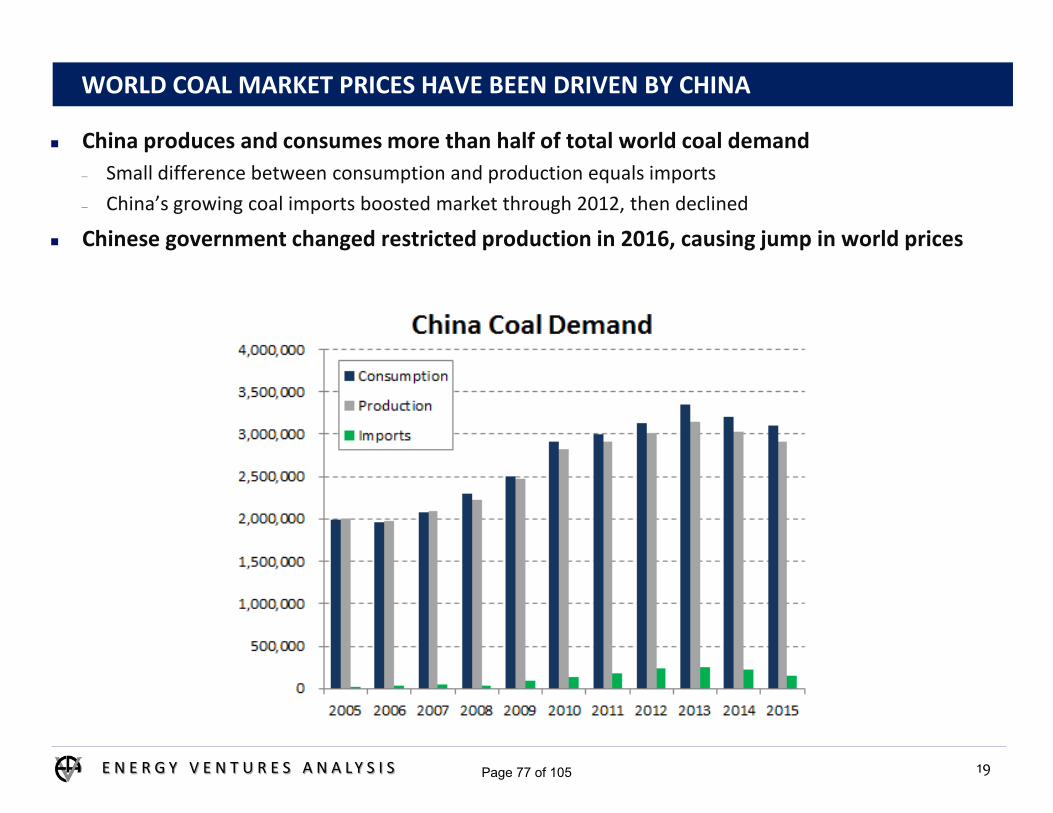
WORLD COAL MARKET PRICES HAVE BEEN DRIVEN BY CHINA
E N E R G Y V E N T U R E S A N A L Y S I S
China produces and consumes more than half of total world coal demand– Small difference between consumption and production equals imports– China’s growing coal imports boosted market through 2012, then declined
Chinese government changed restricted production in 2016, causing jump in world prices
19Page 77 of 105

PRIMARY SUPPLY BASIN FOR STANTON SHOULD HAVE STABLE PRICING
E N E R G Y V E N T U R E S A N A L Y S I S
Illinois Basin has fairly flat supply curve– Thick seams provide for low-cost mining– New mines developed to supply customers who retrofit scrubbers and switched from CAPP coal– Limited alternate markets (export, industrial) keeps pricing more stable than Appalachia
Rebound in demand expected in 2017, then flat to declining demand Mining costs tend to drive prices – ILB cash costs range from $22 to $35 per ton
– Prices unlikely to rise above mid-$40’s as supply can be added to compete away premiums
20
Illinois Basin 2011 2012 2013 2014 2015 2016 2017 2018 2019 2020Electric Power Burn 101.5 100.9 112.7 120.6 104.6 92.8 113.1 112.3 111.0 109.9
Consumer stock change (1.6) 1.3 (0.7) (2.7) 4.9 (4.7) (7.0) 0.0 0.0 0.0Electric Power Receipts 99.9 102.2 112.0 117.9 109.5 88.1 106.1 112.3 111.0 109.9Coke Ovens 0.1 0.1 0.0 0.0 0.0 0.0 0.0 0.0 0.0 0.0Industrial/Commercial 6.8 7.1 6.6 6.4 5.1 4.4 4.9 4.9 4.8 4.8Domestic Demand 106.8 109.3 118.5 124.3 114.5 92.5 111.0 117.2 115.8 114.7
Export metallurgical 0.0 0.0 0.0 0.0 0.0 0.0 0.0 0.0 0.0 0.0Export steam 10.4 17.4 17.9 9.6 9.8 5.8 10.0 9.7 9.3 9.0Total Exports 10.4 17.4 17.9 9.6 9.8 5.8 10.0 9.7 9.3 9.0
Total Demand 117.2 126.7 136.4 133.9 124.3 98.3 121.0 126.9 125.2 123.7
Page 78 of 105
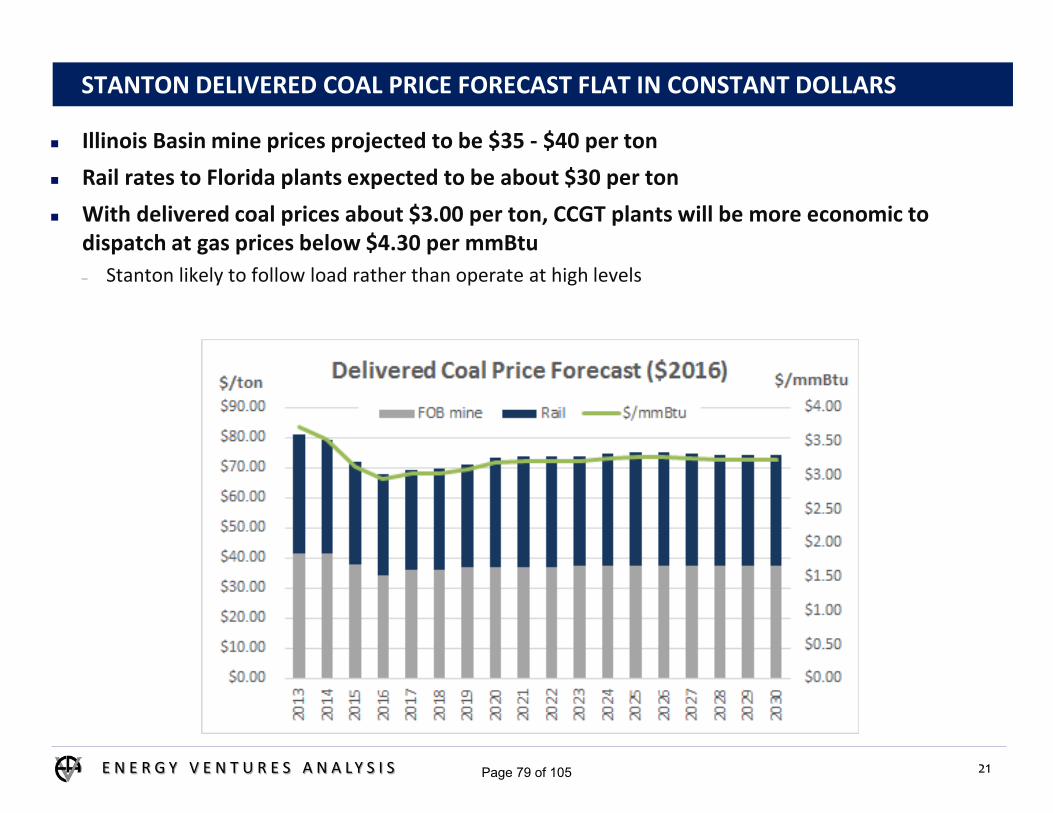
STANTON DELIVERED COAL PRICE FORECAST FLAT IN CONSTANT DOLLARS
E N E R G Y V E N T U R E S A N A L Y S I S
Illinois Basin mine prices projected to be $35 - $40 per ton Rail rates to Florida plants expected to be about $30 per ton With delivered coal prices about $3.00 per ton, CCGT plants will be more economic to
dispatch at gas prices below $4.30 per mmBtu– Stanton likely to follow load rather than operate at high levels
21Page 79 of 105

5. Comparisons of Joint Action Agencies
51Page 80 of 105
PFM
Financial and Credit Considerationsfor
Public Power Joint Action AgenciesPresented by
PFM Public Power Group
February, 2017
Page 81 of 105
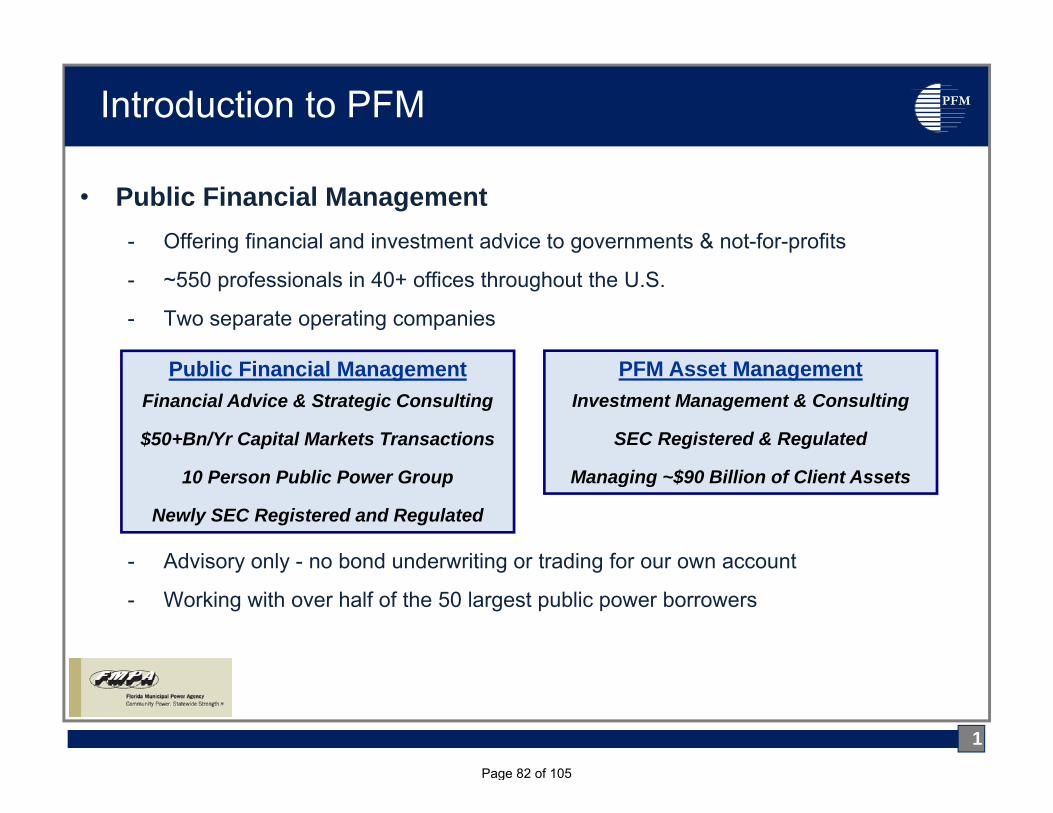
PFMIntroduction to PFM
1
• Public Financial Management- Offering financial and investment advice to governments & not-for-profits
- ~550 professionals in 40+ offices throughout the U.S.
- Two separate operating companies
- Advisory only - no bond underwriting or trading for our own account
- Working with over half of the 50 largest public power borrowers
Public Financial ManagementFinancial Advice & Strategic Consulting
$50+Bn/Yr Capital Markets Transactions
10 Person Public Power Group
Newly SEC Registered and Regulated
PFM Asset ManagementInvestment Management & Consulting
SEC Registered & Regulated
Managing ~$90 Billion of Client Assets
Page 82 of 105

PFM
I. Joint Action Agency History
II. Public Power Credit Perspectives
III. Joint Action Agency Examples
IV. Public Power Credit Pressure Points
V. Indicators of Success
VI. Questions
2Public Financial Management , Inc.
Discussion Topics
Page 83 of 105

PFM
► History is always interesting, but a lot has changed• Changes to the industry, the customers and technology make it more important to
look forward than backward
► Many Joint Action Agencies share a Similar History• Formed in the late 1970s or early 1980s• Moderate-sized to small to VERY small municipal systems• Responding to 5+% growth and limited resources• IOU wholesale price increases• Desire to realize economies of scale, and access resources
► Differences between JAAs result from Different Circumstances• Early successes/challenges often a function of resource selection and economy
basically - nuke vs. coal, and suburban vs. rural• Member diversity and dynamics
big/small suburban/rural growth rates
3Public Financial Management , Inc.
History of Joint Action Public Power
Page 84 of 105

PFM
► JAAs may be have been “Born” in the 70s and 80s, but they were more a product of 1950s Philosophy• One-for-All & All-for-One post-war, shared-sacrifice mentality• Industry dominated by engineers• Priority of meeting demand and building big• “The Pie” was growing and everyone could win• Some degree of trust in the government• Cyber security, carbon footprint, ISOs/RTOs were not even “things”
► It’s All Different Today• “The Pie” isn’t growing like it was in the past• Limited “win/win” opportunities, many decisions are about who wins/loses• More pronounced Member diversity along many criteria• Customers have vastly different priorities than in the past• Recognizing and managing the differences have become more important priorities
4Public Financial Management , Inc.
History of Joint Action Public Power
Page 85 of 105
PFM
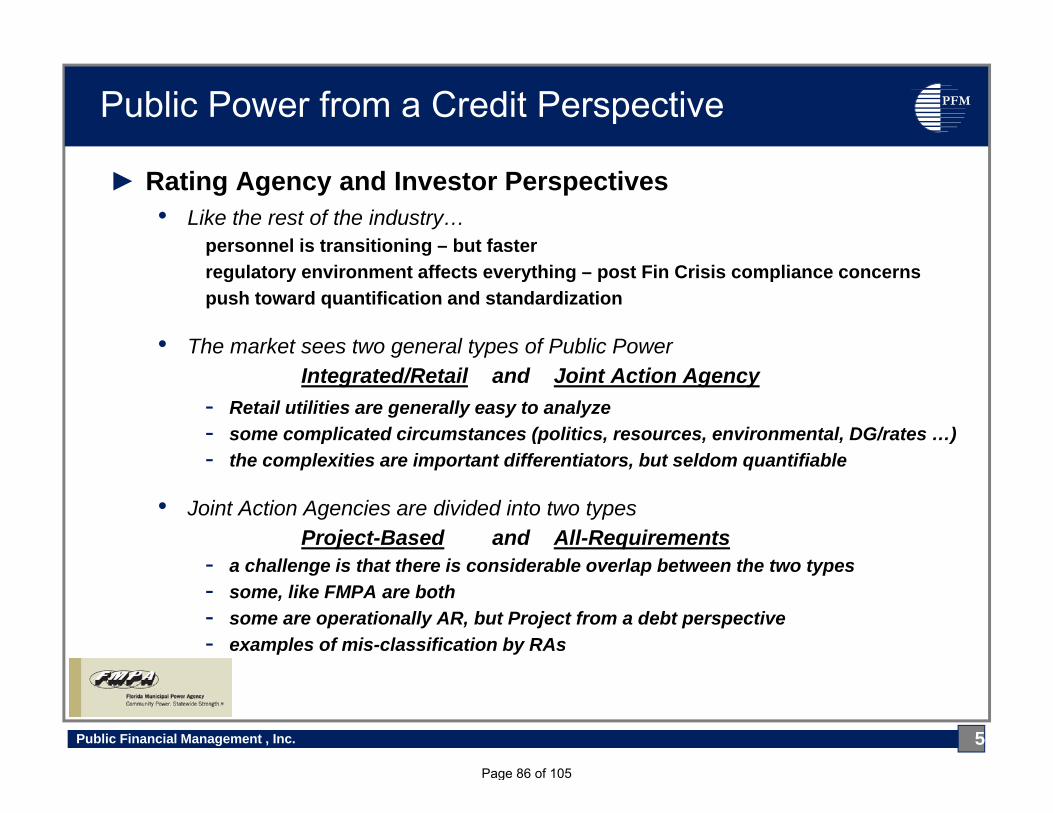
► Rating Agency and Investor Perspectives• Like the rest of the industry…
personnel is transitioning – but fasterregulatory environment affects everything – post Fin Crisis compliance concerns push toward quantification and standardization
• The market sees two general types of Public PowerIntegrated/Retail and Joint Action Agency
- Retail utilities are generally easy to analyze- some complicated circumstances (politics, resources, environmental, DG/rates …)- the complexities are important differentiators, but seldom quantifiable
• Joint Action Agencies are divided into two typesProject-Based and All-Requirements
- a challenge is that there is considerable overlap between the two types- some, like FMPA are both- some are operationally AR, but Project from a debt perspective- examples of mis-classification by RAs
5Public Financial Management , Inc.
Public Power from a Credit Perspective
Page 86 of 105
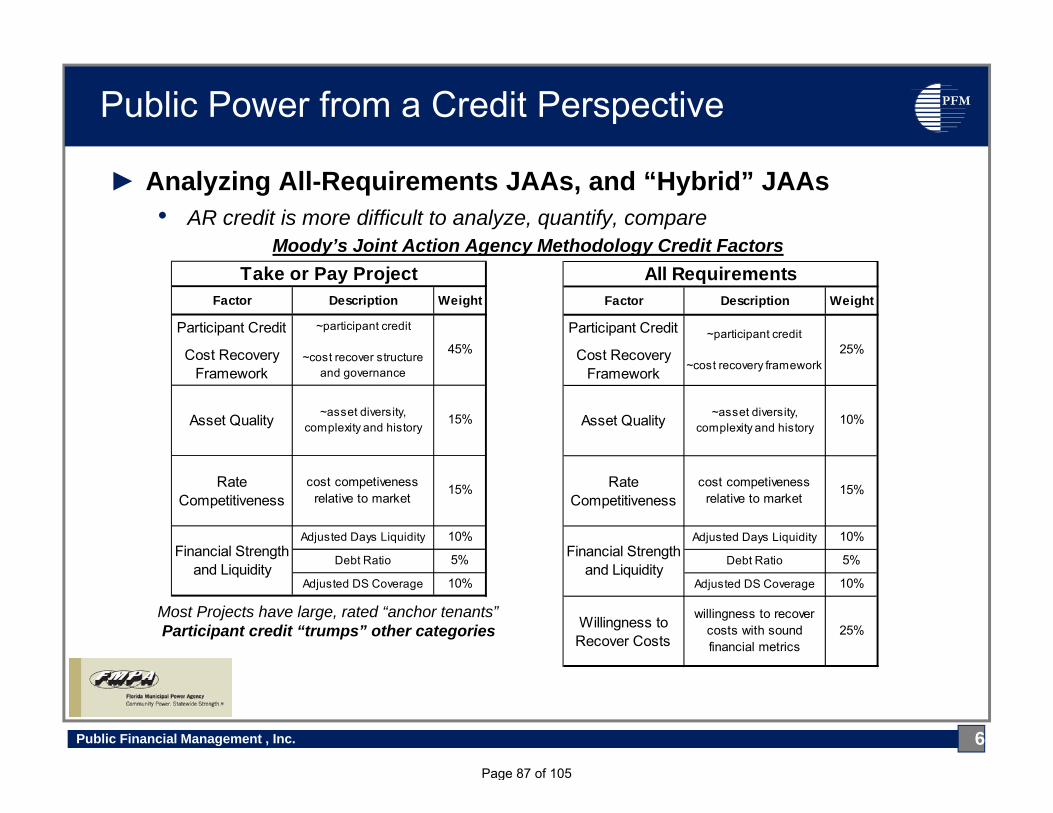
PFM
► Analyzing All-Requirements JAAs, and “Hybrid” JAAs• AR credit is more difficult to analyze, quantify, compare
Moody’s Joint Action Agency Methodology Credit Factors
Most Projects have large, rated “anchor tenants”Participant credit “trumps” other categories
6Public Financial Management , Inc.
Public Power from a Credit Perspective
Factor Description Weight
Participant Credit
Cost Recovery Framework
~participant credit
~cost recovery framework25%
Asset Quality ~asset diversity, complexity and history
10%
Rate Competitiveness
cost competiveness relative to market
15%
Adjusted Days Liquidity 10%
Debt Ratio 5%
Adjusted DS Coverage 10%
Willingness to Recover Costs
willingness to recover costs with sound financial metrics
25%
Financial Strength and Liquidity
All RequirementsFactor Description Weight
Participant Credit
Cost Recovery Framework
~participant credit
~cost recover structure and governance
45%
Asset Quality ~asset diversity, complexity and history
15%
Rate Competitiveness
cost competiveness relative to market
15%
Adjusted Days Liquidity 10%
Debt Ratio 5%
Adjusted DS Coverage 10%
Financial Strength and Liquidity
Take or Pay Project
Page 87 of 105
PFM
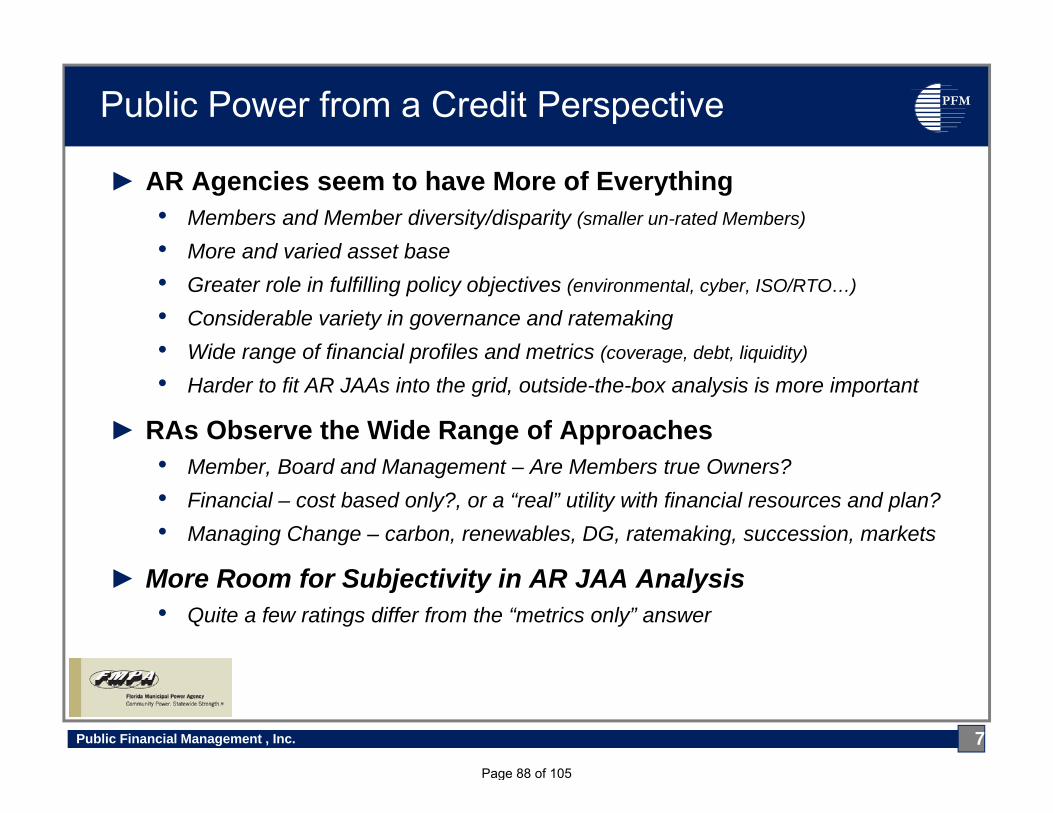
► AR Agencies seem to have More of Everything• Members and Member diversity/disparity (smaller un-rated Members)
• More and varied asset base• Greater role in fulfilling policy objectives (environmental, cyber, ISO/RTO…)
• Considerable variety in governance and ratemaking• Wide range of financial profiles and metrics (coverage, debt, liquidity)
• Harder to fit AR JAAs into the grid, outside-the-box analysis is more important
► RAs Observe the Wide Range of Approaches• Member, Board and Management – Are Members true Owners?• Financial – cost based only?, or a “real” utility with financial resources and plan?• Managing Change – carbon, renewables, DG, ratemaking, succession, markets
► More Room for Subjectivity in AR JAA Analysis• Quite a few ratings differ from the “metrics only” answer
7Public Financial Management , Inc.
Public Power from a Credit Perspective
Page 88 of 105
PFM
8Public Financial Management , Inc.
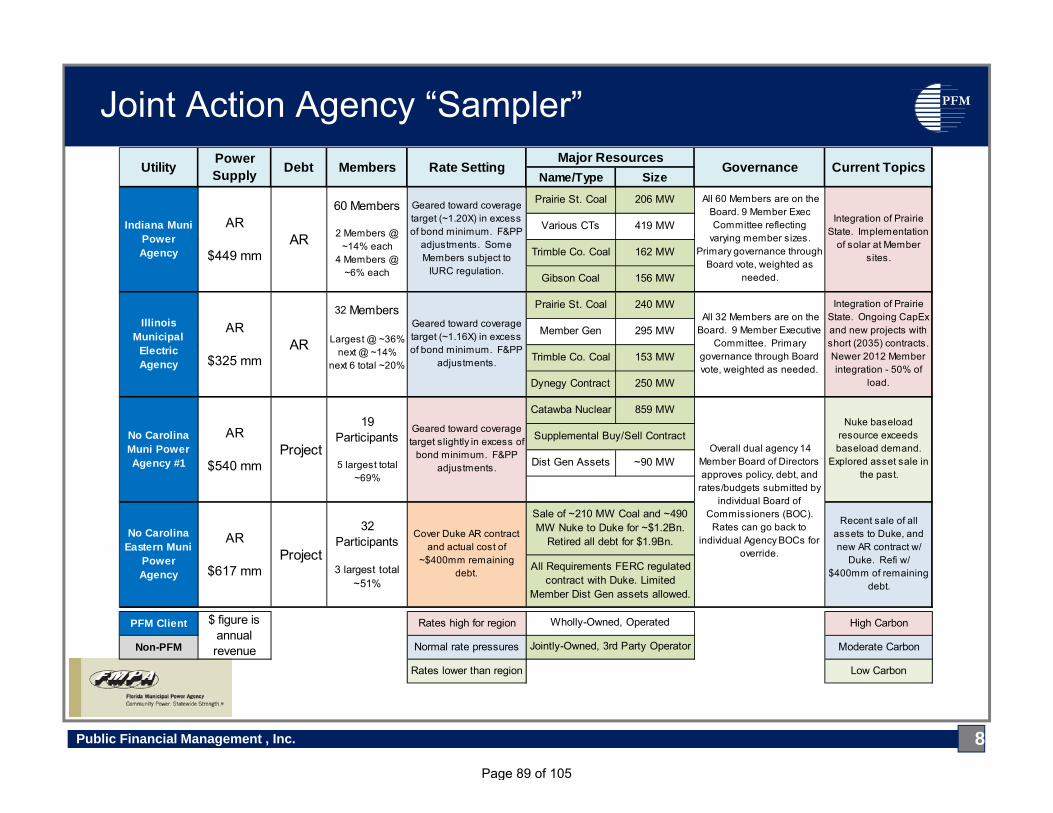
Joint Action Agency “Sampler”
Name/Type SizePrairie St. Coal 206 MW
Various CTs 419 MW
Trimble Co. Coal 162 MW
Gibson Coal 156 MW
Prairie St. Coal 240 MW
Member Gen 295 MW
Trimble Co. Coal 153 MW
Dynegy Contract 250 MW
Catawba Nuclear 859 MW
Dist Gen Assets ~90 MW
PFM Client Rates high for region High Carbon
Non-PFM Normal rate pressures Moderate Carbon
Rates lower than region Low Carbon
Utility Power Supply Debt Members Rate Setting
All 60 Members are on the Board. 9 Member Exec Committee reflecting
varying member sizes. Primary governance through
Board vote, weighted as needed.
Major Resources
Integration of Prairie State. Implementation
of solar at Member sites.
Governance Current Topics
Indiana Muni Power Agency
AR
$449 mmAR
60 Members
2 Members @ ~14% each
4 Members @ ~6% each
Geared toward coverage target (~1.20X) in excess of bond minimum. F&PP
adjustments. Some Members subject to
IURC regulation.
No Carolina Eastern Muni
Power Agency
Recent sale of all assets to Duke, and new AR contract w/
Duke. Refi w/ $400mm of remaining
debt.
Nuke baseload resource exceeds baseload demand.
Explored asset sale in the past.
32 Participants
3 largest total ~51%
AR
$617 mm Project
Overall dual agency 14 Member Board of Directors approves policy, debt, and
rates/budgets submitted by individual Board of
Commissioners (BOC). Rates can go back to
individual Agency BOCs for override.
Supplemental Buy/Sell Contract
Cover Duke AR contract and actual cost of
~$400mm remaining debt.
Sale of ~210 MW Coal and ~490 MW Nuke to Duke for ~$1.2Bn.
Retired all debt for $1.9Bn.
All Requirements FERC regulated contract with Duke. Limited
Member Dist Gen assets allowed.
Geared toward coverage target slightly in excess of
bond minimum. F&PP adjustments.
No Carolina Muni Power Agency #1
19 Participants
5 largest total ~69%
ProjectAR
$540 mm
Illinois Municipal
Electric Agency
AR
$325 mmAR
32 Members
Largest @ ~36%next @ ~14%
next 6 total ~20%
Geared toward coverage target (~1.16X) in excess of bond minimum. F&PP
adjustments.
All 32 Members are on the Board. 9 Member Executive
Committee. Primary governance through Board vote, weighted as needed.
Integration of Prairie State. Ongoing CapEx and new projects with short (2035) contracts. Newer 2012 Member integration - 50% of
load.
Jointly-Owned, 3rd Party Operator
Wholly-Owned, Operated$ figure is annual revenue
Page 89 of 105

PFM
9Public Financial Management , Inc.
Joint Action Agency “Sampler”
Name/Type SizeSherco #3 Coal 373 MW
Wind Contract 100 MW
Member Assets 85 MW
Dist Gen Assets 40 MW
Various Nuke 808 MW
Various Coal 750 MW
Vogtle 3&4 Nuke 500 MW
Gas Unit & PPA 603 MW
Fremont NG 612 MW
Combined Hydro 208 MW
Prairie St. Coal 368 MW
Meldahl Hydro 105 MW
ISO-NE Purchases
Various Nuke 200 MW
Various NG/Oil 500 MW
Wind Contracts 50 MW
PFM Client Rates high for region High Carbon
Non-PFM Normal rate pressures Moderate Carbon
Rates lower than region Low Carbon
7 Member Board. 3 largest have Board seats, others
elected. Most matters subject to all Member
weighted vote.
Shorter term of larger Member contracts
(>50%). Transmission investment. Coal CapEx. Dist Gen
assets.
Muni Electric Authority of
Georgia
AR
$642 mm(plus new
nuke)
Multiple Projects
47 Participants
14 "Major Participants"5 largest total
~50%
Project by project amounts to cover all
costs. Limited coverage.
9 Member Board elected by Member weighted vote. Staggered 3 year terms.
Board approves all major decisions.
New nulcear cost increases and delays.
Toshiba and Westinghouse credit.
DG accomodation. Nuke partners (JEA & Power South). DOE.
Southern Minnesota
Public Power Agency
AR
$234 mmAR
18 Members
Largest @ ~42%2 Members @
~12% each
Geared toward coverage target slightly in excess of
bond minimum, and liquidity targets.
20 Member overall Board from various states and at-
large. Project Particpant Committees make most
individual project decisions.
Integration of Prairie State and large new hydro projects, with
new and out-of-state Members.
American Municipal
Power
Projects & AR
$1,128 mm(plus new
hydro)
Multiple Projects
135 Membersacross 9 states
4 largest total ~40% across
projects
Project by project amounts to cover all
costs. Limited coverage.
12 Member Board: 2 Gov. appointees, 7 elected, 3
fixed from larger Members. Board votes govern major
decisions.
Evaluation of new units in an ISO capacity bid
market. Hedge Or Profit? Renewables emphasis in State.
Governance Current Topics
Mass. Muni Wholesale
Electric Coop & Berkshire
Wind
AR
$312 mm
$ figure is annual revenue
Wholly-Owned, Operated
Jointly-Owned, 3rd Party Operator
Utility Power Supply Debt Members Rate Setting
Major Resources
Multiple Projects
20 Members
largest @ ~14%next @~10%
Project by project amounts to cover all
costs. Limited coverage.
Page 90 of 105
PFM
► The Good News• Investor have clear preference for Essential Service Utilities – Public Power
- With good reason – Detroit, Puerto Rico, Chicago, USVI• Public Power (event AR JAAs) are easier to understand• Most Pension/OPEB liabilities are manageable• Potential environmental impacts/costs are generally shared across regions• The Puerto Rico and PREPA story is NOT a Public Power story• JAAs are generally an “A” rated industry, with a few exceptions• Retail Public Power is generally a “AA” rate industry, with exceptions• Majority of Public Power credit stories are stable to positive
► There Will Always be Challenges
10Public Financial Management , Inc.
Public Power Credit Pressure Points
Page 91 of 105

PFM
► #1 – Will Always be Rates• 10% Below Regional Averages
Flying Under the Radar, and Stay There• +/- 10% to Averages
Know the Numbers, Stay on Top of the Issues• 10% Above Regional Averages
Makes Everything HarderKeep Everyone on the Same Strategy Page, if Possible
► #2 – Managing Broader Industry Challenges• The Questions that Nobody really has the answers for• Answers and a Plan when possible (Risk Mgt, Financial, Resources, DG…)• Technical Awareness when its too early for a Plan (CPP, RTOs, Politics,..)
- Rating agencies still ask a lot of questions, even if there are no clear answers- It helps them get up the curve
11Public Financial Management , Inc.
Public Power Credit Pressure Points
Page 92 of 105

PFM
► #3 – Managing Member Diversity/Disparity• Recognize divergent position and impacts – there are many sources• Ensure early representation of differences
- Board and Committee composition• If it is a Rating Agency topic, have the numbers
- some challenging topics don’t have a big impact on the credit• Take the topic to the RAs when appropriate
- RAs interested in the deep dive on Member perspective• Debate, but don’t Litigate
- The Market has a very long memory for disputes - decades
► #4 – Impacts of 0% Load Growth (Economy, Conservation and DG)• RA Question regardless of economy, geography and rates• Small amounts of DG can grow and lead to the need for rate increases• Improper rate design at JAA and Members can compound the problem• Waiting makes fixing it harder• Rating analysts know how hard it can be to change/increase rates
12Public Financial Management , Inc.
Public Power Credit Pressure Points
Page 93 of 105
PFM
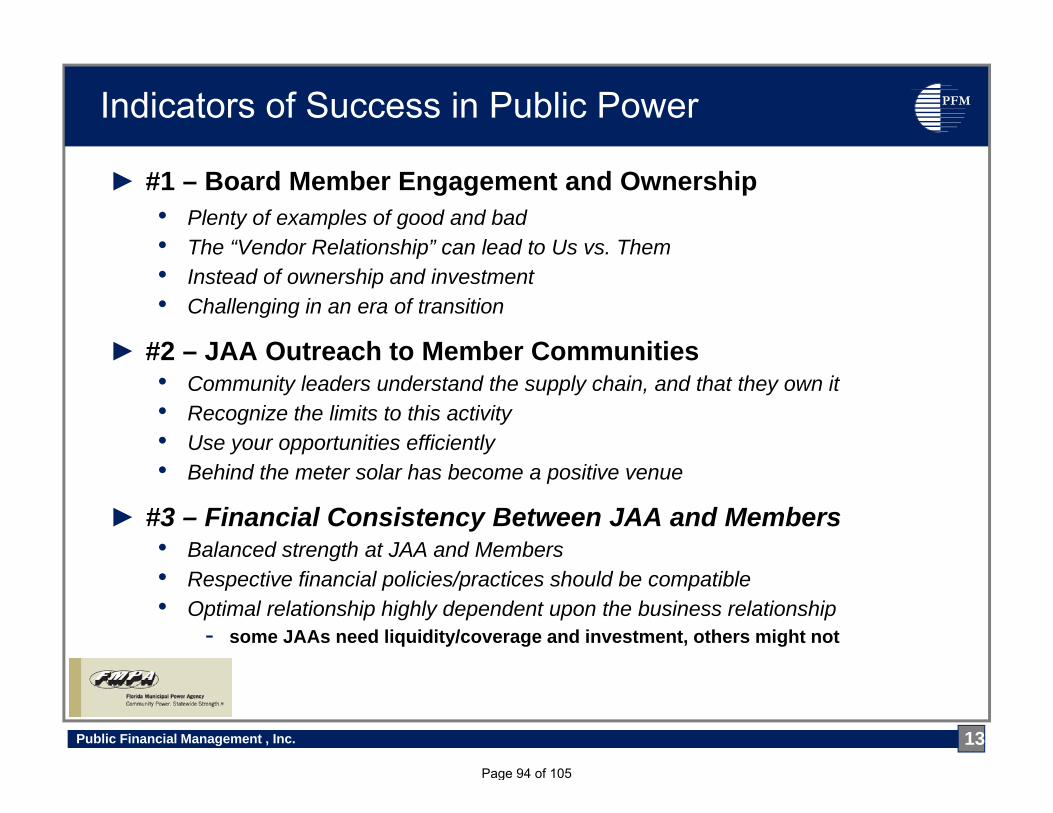
► #1 – Board Member Engagement and Ownership• Plenty of examples of good and bad• The “Vendor Relationship” can lead to Us vs. Them• Instead of ownership and investment• Challenging in an era of transition
► #2 – JAA Outreach to Member Communities• Community leaders understand the supply chain, and that they own it• Recognize the limits to this activity• Use your opportunities efficiently• Behind the meter solar has become a positive venue
► #3 – Financial Consistency Between JAA and Members• Balanced strength at JAA and Members• Respective financial policies/practices should be compatible• Optimal relationship highly dependent upon the business relationship
- some JAAs need liquidity/coverage and investment, others might not
13Public Financial Management , Inc.
Indicators of Success in Public Power
Page 94 of 105
PFM
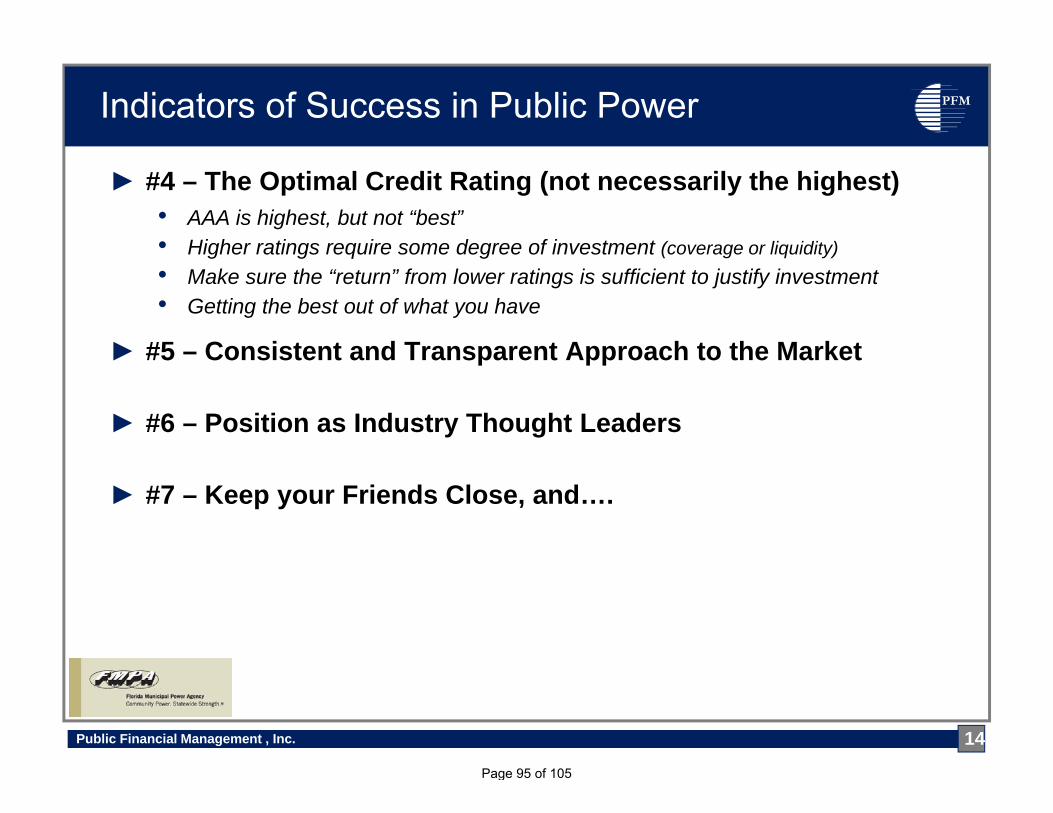
► #4 – The Optimal Credit Rating (not necessarily the highest)• AAA is highest, but not “best”• Higher ratings require some degree of investment (coverage or liquidity)• Make sure the “return” from lower ratings is sufficient to justify investment• Getting the best out of what you have
► #5 – Consistent and Transparent Approach to the Market
► #6 – Position as Industry Thought Leaders
► #7 – Keep your Friends Close, and….
14Public Financial Management , Inc.
Indicators of Success in Public Power
Page 95 of 105

PFM
Questions and Comments
15Public Financial Management , Inc.
Wrap Up
Page 96 of 105

6. Strategic Planning
52Page 97 of 105
Strategic Planning
• Helps determine priorities and bring focus to both human and financial resources to better strengthen an organization’s operational effectiveness.
53Page 98 of 105

What is the Board’s Role?
• Provide guidance to staff (policy)• Once specific strategies are developed by staff,
Board may review for consistency and timing• Monitor progress
54Page 99 of 105

Common Pitfalls
• A tendency to focus on squeezing more profit out of existing revenue rather than developing strategies that generate new revenue.
• Looking only at financial metrics (cost, revenue, profit, etc.).
• Getting into the weeds
55Page 100 of 105

What is the Staff’s role?
• Develop specific strategies• Communicate these strategies to the Board and
other stakeholders• Execute the plan • Monitor and communicate results • Adjust as necessary
56Page 101 of 105

Next Steps
• Board ranks the priorities• 15 minute break• Presentation of Board’s priority rankings• Large group discussion of highest priorities• Small group breakout discussions of lower
priority items
58Page 102 of 105
7. Strategic Items
57Page 103 of 105

Strategic Items Ranking1. Provide business model alternatives and best option(s) to enable:
• Some ARP and Non-ARP Members to participate in new resources (includinghigher cost renewables) while protecting the non-participating ARP membersfrom any cost increases from this addition
• Efforts in the future like peak shaving and other demand side efforts (e.g.combined heat and power) without negative impacts to ARP participants
2. Rate making efforts to:• Look at changes in cost recovery categories for fixed and variable costs and
propose and other methods that may lead to lower price differences betweenmembers
• Develop load attraction rates for ARP members.3. Evaluate multiple initiatives to lower costs to ARP members and
provide value to other municipals by:• Aggressively bidding on all FL municipal power supply contracts as a way of
reducing the cost of the excess capacity for ARP members and providing valueto other FL municipals or others
4. Work to tell the positive story of FMPA in the media, social mediaand appropriate industry forums and to minimize issues thatdominate the negative perceptions of FMPA
59Page 104 of 105
Strategic Items Ranking (Continued)5. Significant enhancement of Member Services
in the technical, operations, compliance and IT areas wheremembers are facing various challenges for staffing and servicedelivery to customers
6. Focus on maintaining and improving the bond ratings of FMPA’sbonds to reduce costs by restructuring debt, reducing debtand/or increasing liquidity
7. Employment development, retention and succession planningrequired to deliver on Strategic Initiatives and likely significantretirement potentials over the next 2 to 5 years.
8. Develop Strategic Relationships for potentialefforts in cost reduction, service expansionand risk mitigation with:• Major municipals in the state, other joint action agencies, cooperatives
and supportive IOUs
60Page 105 of 105