Embed Size (px)
Citation preview

SANDIA REPORT SAND2010-4526 Unlimited Release Printed July 2010
Strategic Petroleum Reserve Crude Oil Equation of State Model Development –Current Performance Against Measured Data David L. Lord and David K. Rudeen Prepared by Sandia National Laboratories Albuquerque, New Mexico 87185 and Livermore, California 94550
Sandia National Laboratories is a multi-program laboratory managed and operated by Sandia Corporation, a wholly owned subsidiary of Lockheed Martin Corporation, for the U.S. Department of Energy's National Nuclear Security Administration under contract DE-AC04-94AL85000. Approved for public release; further dissemination unlimited.
2
Issued by Sandia National Laboratories, operated for the United States Department of Energy by Sandia Corporation. NOTICE: This report was prepared as an account of work sponsored by an agency of the United States Government. Neither the United States Government, nor any agency thereof, nor any of their employees, nor any of their contractors, subcontractors, or their employees, make any warranty, express or implied, or assume any legal liability or responsibility for the accuracy, completeness, or usefulness of any information, apparatus, product, or process disclosed, or represent that its use would not infringe privately owned rights. Reference herein to any specific commercial product, process, or service by trade name, trademark, manufacturer, or otherwise, does not necessarily constitute or imply its endorsement, recommendation, or favoring by the United States Government, any agency thereof, or any of their contractors or subcontractors. The views and opinions expressed herein do not necessarily state or reflect those of the United States Government, any agency thereof, or any of their contractors. Printed in the United States of America. This report has been reproduced directly from the best available copy. Available to DOE and DOE contractors from U.S. Department of Energy Office of Scientific and Technical Information P.O. Box 62 Oak Ridge, TN 37831 Telephone: (865) 576-8401 Facsimile: (865) 576-5728 E-Mail: [email protected] Online ordering: http://www.osti.gov/bridge Available to the public from U.S. Department of Commerce National Technical Information Service 5285 Port Royal Rd. Springfield, VA 22161 Telephone: (800) 553-6847 Facsimile: (703) 605-6900 E-Mail: [email protected] Online order: http://www.ntis.gov/help/ordermethods.asp?loc=7-4-0#online
3
SAND 2010-4526 Unlimited Release Printed July 2010
Strategic Petroleum Reserve Equation of State Model Development –
Current Performance Against Measured Data
David Lord Geotechnology & Engineering Department
Sandia National Laboratories P.O. Box 5800
Albuquerque, NM, 87185-0706 [email protected]
David Rudeen GRAM, Inc.
Albuquerque, NM, 87112-2299 [email protected]
Abstract
This report documents the progression of crude oil phase behavior modeling within the U.S. Strategic Petroleum Reserve vapor pressure program during the period 2004-2009. Improvements in quality control on phase behavior measurements in 2006 coupled with a growing body of degasification plant operations data have created a solid measurement baseline that has served to inform and significantly improve project understanding on phase behavior of SPR oils. Systematic tuning of the model based on proven practices from the technical literature have shown to reduce model bias and match observed data very well, though this model tuning effort is currently in process at SPR and based on preliminary data. The current report addresses many of the steps that have helped to build a strong baseline of data coupled with sufficient understanding of model features so that calibration is possible.
4
ACKNOWLEDGMENTS
This work was supported by the Strategic Petroleum Reserve Project Office under the U.S. Department of Energy.
5
TABLE OF CONTENTS
Executive Summary .......................................................................................................................9 1 Introduction ..........................................................................................................................11
1.1 Development of Necessary Tools ......................................................................................11 1.2 Opportunity for EOS Improvements ..................................................................................11 1.3 Scope of Report..................................................................................................................11
2 Background ...........................................................................................................................13 2.1 Relevance of Vapor Pressure to the SPR ...........................................................................13 2.2 Importance of EOS Modeling at the SPR ..........................................................................13 2.3 Driver for Improvements in EOS Modeling ......................................................................13
2.3.1 Reducing Uncertainty .................................................................................................14 2.3.2 Increasing Margin .......................................................................................................15
2.4 Brief Review of QA/QC Improvements ............................................................................15 2.4.1 April 2006 Parallel with Degas Tests .........................................................................15 2.4.2 Data Review Requirements Implemented in 2007 .....................................................17
3 Methodology ..........................................................................................................................19 3.1 Definitions..........................................................................................................................19
3.1.1 Notation ......................................................................................................................19 3.1.2 Expansion Ratio and GOR Units ................................................................................19
3.2 PVT Measurements ............................................................................................................19 3.2.1 TVP-95 Instrument Description .................................................................................20 3.2.2 Example TVP-95 Dataset for Cavern WH008 ...........................................................20 3.2.3 Grabner TVP Analyzer Instrument Description .........................................................22
3.3 EOS Modeling ...................................................................................................................23 3.3.1 Creating a Whole Oil from TVP-95 Data ..................................................................23 3.3.2 Comparing Measured and Modeled BPP and GOR ...................................................24 3.3.3 Pressure-Expansion Relationships .............................................................................25 3.3.4 Adjusted GOR ............................................................................................................25
3.4 EOS Tuning .......................................................................................................................26 3.4.1 Selection of EOS Tuning Data ...................................................................................27
4 TVP Measurements Analysis ..............................................................................................28 4.1 TVP-95 and Grabner BPP Analysis ...................................................................................28
4.1.1 ASTM Standard ..........................................................................................................31 4.2 GOR History ......................................................................................................................32
4.2.1 Adjusted GOR ............................................................................................................32 4.2.2 Comparing with Grabner GOR from Degas Caverns ................................................33
4.3 Expansion Curve History ...................................................................................................35 4.3.1 BH114 Expansion Curves ..........................................................................................35 4.3.2 BH110 and BM115 Expansion Curves ......................................................................37 4.3.3 Concluding Remarks on Expansion Curve Analysis .................................................39
4.4 EOS Tuning Preliminary Results .......................................................................................39 4.4.1 Grabner Temperature Test Results .............................................................................39 4.4.2 Calibrating to Grabner Multi-Temperature Data ........................................................40 4.4.3 Verification of Calibrated EOS Model Against Degas Plant Data ............................41 4.4.4 Demonstration of Measurement Versus Model Tuning .............................................43
5 Summary ...............................................................................................................................44
6
5.1 Path Forward ......................................................................................................................44 5.2 Calibration Measurements .................................................................................................44
6 References .............................................................................................................................46 7 Glossary .................................................................................................................................47 Appendix A Grabner Equations .............................................................................................50
FIGURES
Figure 2-1. Seasonal Vapor Pressure Projection as Reported by the SPR Vapor Pressure Committee in May 2010. The streams represent crude oil type (sweet or sour) that is delivered from an SPR site. The sweet or sour designation refers to the concentration of sulfur in the oil. BM SW thus refers to Bryan Mound sweet stream oil. See the glossary for more detail on SPR terminology. ............................14
Figure 2-2. GC Measured BPP and GOR Flash Gas Compositions Before and After April 2006 QC Improvements. .............................................................................................17
Figure 3-1. Schematic of Major Conceptual Elements of the TVP-95 Measurement System. ....20 Figure 3-2. Conceptual Drawing of the Grabner TVP Analyzer 3-Point Expansion Sequence
(Top) with the Resulting Data Plotted and Fit with a Curve for Both BPP and GOR (Bottom). ...........................................................................................................22
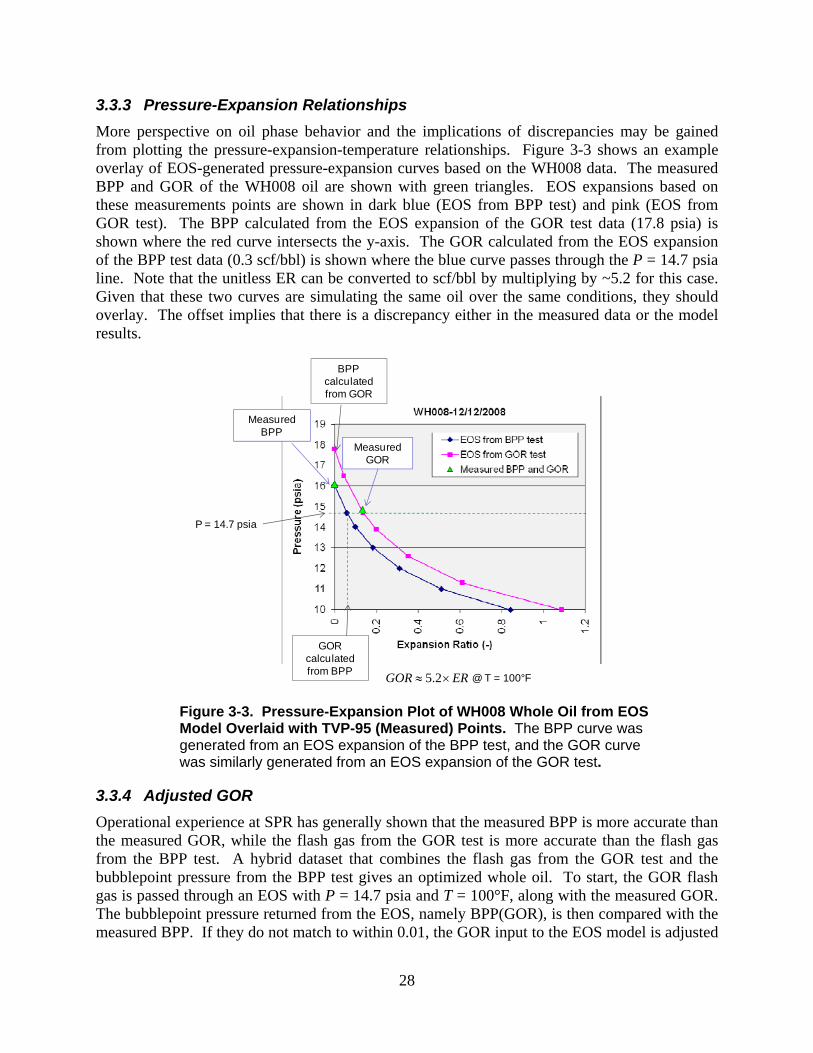
Figure 3-3. Pressure-Expansion Plot of WH008 Whole Oil from EOS Model Overlaid with TVP-95 (Measured) Points. The BPP curve was generated from an EOS expansion of the BPP test, and the GOR curve was similarly generated from an EOS expansion of the GOR test. ................................................................................25
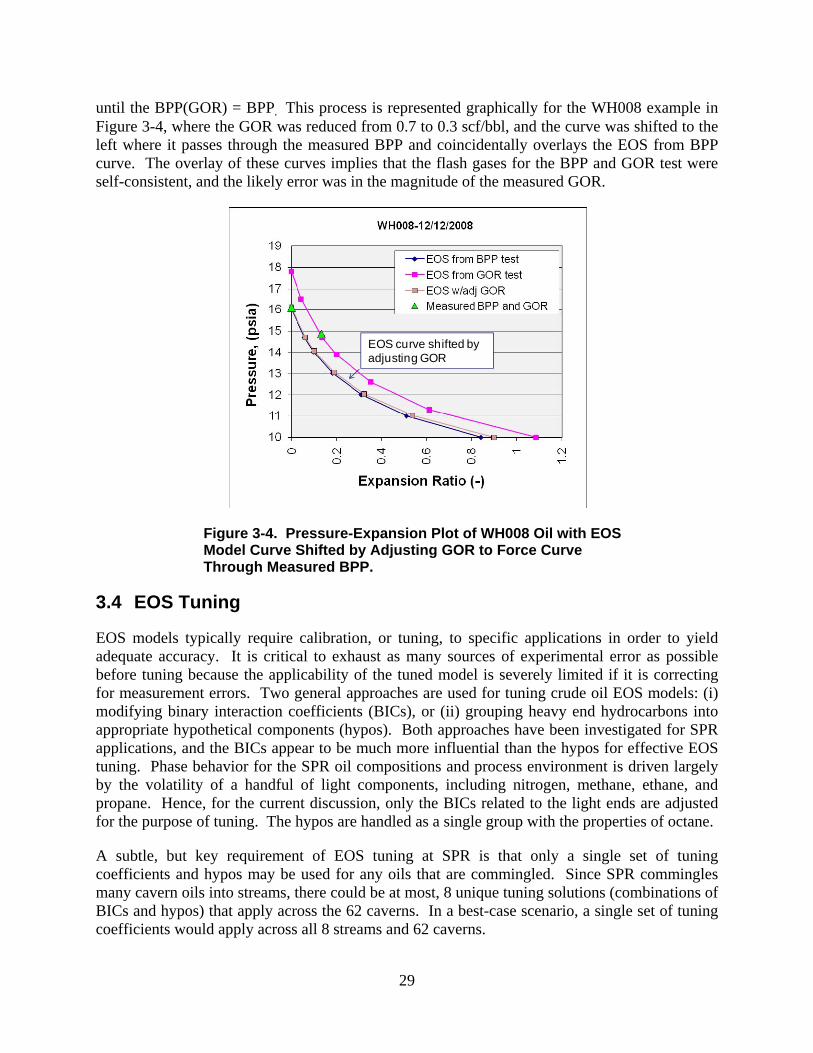
Figure 3-4. Pressure-Expansion Plot of WH008 Oil with EOS Model Curve Shifted by Adjusting GOR to Force Curve Through Measured BPP. ..........................................26
Figure 4-1. Scatter Plot of Difference Between TVP-95 and Grabner Measured BP Pressure. Linear regression is also shown. The two small arrows point to the two BH pre-degas BP pressures and indicate that they are not unduly biasing the result. ...........................................................................................................................30
Figure 4-2. EOS Calculated GOR Normalized to Measured GOR as a Function of Time. .........32 Figure 4-3. Adjusted GOR Normalized to EOS Calculated GOR as a Function of Time. ...........33 Figure 4-4. Measured and Adjusted GOR vs. Grabner GOR. Linear regressions are also
shown. .........................................................................................................................35 Figure 4-5. Grabner Measured and EOS Calculated Expansion Curves Before and After
April 2006 QC Implementation at BH114. .................................................................37 Figure 4-6. Grabner Measured and EOS Calculated Expansion Curves Before and After
April 2006 for BH110. ................................................................................................38 Figure 4-7. EOS Calculated GOR and BPP Expansion Curves Before and after April 2006
for BM115. ..................................................................................................................38 Figure 4-8. Comparison of Grabner Measured and EOS Model for BM105 Degas Plant
Inlet Oil Pressure-Expansion Relationship at Three Selected Temperatures with Default BICs = 0 (no Tuning). ....................................................................................40
Figure 4-9. Comparison of Grabner Measured and EOS Model for BM105 Degas Plant Inlet Oil Pressure-Expansion Relationship at Three Selected Temperatures with BICs Tuned for Optimal Fit. .......................................................................................41
Figure 4-10. Expansion Curves for Tuned and Un-Tuned EOS Models. .....................................43
7
TABLES
Table 3-1. Summary of Measured Values from the WH008 BPP and GOR Flash Experiments. ...............................................................................................................21
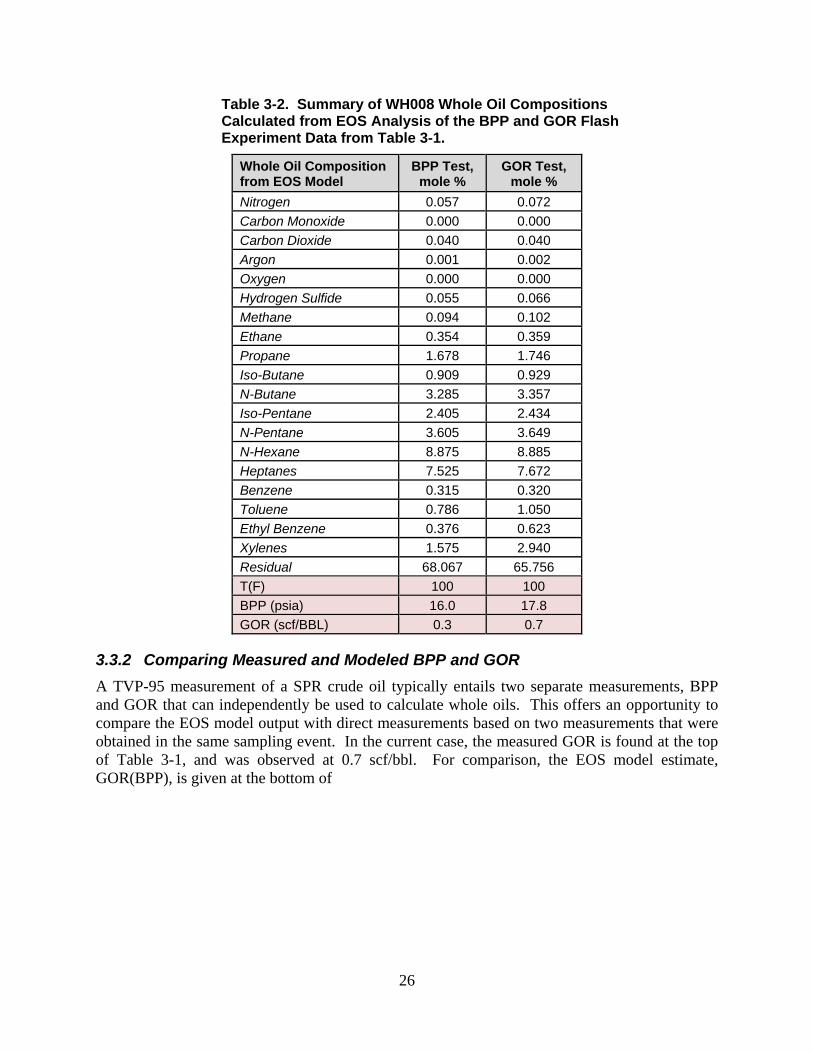
Table 3-2. Summary of WH008 Whole Oil Compositions Calculated from EOS Analysis of the BPP and GOR Flash Experiment Data from Table 3-1. .......................................24
Table 4-1. Comparison of TVP-95 and Grabner Degas Plant Inlet BP Pressures for BH Inlet Stream. ........................................................................................................................29
Table 4-2. Comparison of TVP-95 and Grabner Degas Plant Outlet BP Pressures for BH. ........29 Table 4-3. Comparison of Pre-Degas TVP-95 and Grabner Degas Plant Inlet BP Pressures
for BM. ........................................................................................................................30 Table 4-4. Measured, Adjusted, Grabner and Normalized GOR for Degassed Caverns. .............34 Table 4-5. BICs Resulting from Calibrating to BM105 Grabner Multi-Temperature Data. ........41 Table 4-6. Summary of Tuning Effects on Key Plant Parameters. ...............................................42
8
Page Intentionally Left Blank
9
Executive Summary
This report documents the progression of crude oil phase behavior modeling within the U.S. Strategic Petroleum Reserve vapor pressure program during the period 2004-2009. Improvements in quality control on phase behavior measurements in 2006 coupled with a growing body of degasification plant operations data have created a solid measurement baseline that has served to inform and significantly improve project understanding on phase behavior of SPR oils. With this baseline in place, the features and limitations of the current equation of state model were explored by utilizing the baseline data for model inputs and model output comparisons. Generally favorable performance was seen for model predictions of crude oil bubblepoint pressure, where uncertainty in measurements probably equals uncertainty in model predictions. Less accuracy was observed in the gas-oil ratio predictions from the equation of state models, where there appears to be a bias of overstating gas production. Some bias is actually expected when the equation of state model is first applied because the model must be calibrated or tuned for the specific application. Systematic tuning of the model based on proven practices from the technical literature have shown to reduce model bias and match observed data very well, though this model tuning effort is currently in process at SPR and based on preliminary data. The current report addresses many of the steps that have helped to build a strong baseline of data coupled with sufficient understanding of model features so that calibration is possible. In current SPR applications, the default un-tuned model is used for all production calculations. The end goal of this work is to develop a tuned equation of state model that will be used in production calculations that are, in turn, used to inform management decisions on safe operations and program direction.
10
NOMENCLATURE
BBL Barrel (42 US gallons)
BH Big Hill SPR site
BIC Binary interaction coefficient
BM Bryan Mound SPR site
BPP Bubblepoint pressure (at 100oF), also BP pressure
C1 Methane
C2 Ethane
C3 Propane
DM DynMcDermott Petroleum Operations Company
DOE U.S. Department of Energy
EOS Equation of state
GOR Gas-oil ratio (typically scf/bbl)
GOV Gross observed volume
GSV Gross standard volume
MB Thousand barrels (volume)
MMB Million barrels (volume)
MW Molecular weight
MS Microsoft
PVT Pressure-volume-temperature
QA Quality assurance (as applied to software development)
QC Quality Controls (as applied to measurements)
SG Specific gravity
SNL Sandia National Laboratories
So Sour crude oil by SPR criteria (total sulfur less than 1.99 mass%)
SPR Strategic Petroleum Reserve
Sw Sweet crude oil by SPR criteria (total sulfur less than 0.50 mass%)
TVP True vapor pressure (typically psia)
VB Visual Basic (macro language)
VP Vapor pressure
WH West Hackberry SPR site

11
1 Introduction
Understanding crude oil phase behavior at the Strategic Petroleum Reserve (SPR) is important to assuring safe and secure operations because phase separation may lead to emission of gases from the oil that pose explosion hazards (i.e., light hydrocarbons), health hazards (i.e., hydrogen sulfide, benzene), or handling problems (i.e., foaming) at atmospheric pressure. Conditions that lead to phase separation and emissions are anticipated and controlled through a combination of operational experience, direct monitoring, and numerical modeling. Most of the project’s current understanding of crude oil phase behavior was adapted from the petroleum industry, though some aspects of the SPR operating environment are unique and require specially-designed solutions. In response, the US Department of Energy (DOE) implemented a research and development project that sought to understand, simulate, and ultimately control crude oil emissions while simultaneously meeting the drawdown mission which, in very brief terms, is to provide up to 4.4 million barrels of crude oil per day to market within 13 days of a drawdown order from the U.S. president.
1.1 Development of Necessary Tools
In the mid-1990’s, a custom vapor pressure measurement tool called the TVP-95 was developed and built in order to provide baseline experimental data. In parallel with this, a numerical equation of state (EOS) model was developed in order to help interpret these data and make predictions for conditions not feasible or cost-effective to measure directly. The theoretical basis for the EOS model was derived from the petroleum literature, and the implementation was done by Sandia in a macro-enabled Excel workbook called the Sandia Solver. Together, these tools formed the basis of the vapor pressure monitoring and mitigation program at SPR, and have been used to inform program decisions since their implementation.
1.2 Opportunity for EOS Improvements
Several recent developments have presented an opportunity to improve the accuracy of SPR crude oil phase behavior modeling tools. First, the quality and accuracy of the baseline vapor pressure data have improved due to better quality control on both the data collection process and the data review process. Moreover, a large body of monitoring data from the cavern vapor pressure sampling program coupled with operational data obtained from the degasification plant has built a broad empirical base that may be used for comparison and model calibration. Finally, Sandia research and development efforts in FY08 and FY09 brought forward some approaches to EOS model calibration (called model “tuning” in the petroleum literature) that look promising based on preliminary analyses. Application of EOS model tuning at SPR is only in the pilot stages, and is probably several years from implementation at the time of this writing. This report documents part of the process of moving from the first-generation EOS models and data of the mid 1990’s to a new baseline that will likely appear in the early 2010’s.
1.3 Scope of Report
This report focuses on the performance of EOS modeling at SPR by comparing computational EOS model results with empirical measurements of crude oil phase behavior under selected

12
conditions where direct comparisons are possible. Model performance is first reviewed in a historical context to establish if and how the baseline has changed with historical changes in data collection and processing. The model is then compared against several measures of phase behavior obtained with the TVP-95, which is the baseline vapor pressure measuring tool, and the TVP-2000, which collects vapor pressure data from degas operations. Discrepancies between model and measured behavior may arise generally from two sources: error in measurements or inaccuracies in the numerical model. This report examines both sources for the data set considered.
13
2 Background
2.1 Relevance of Vapor Pressure to the SPR
The Strategic Petroleum Reserve (SPR), owned by the U.S. Department of Energy (DOE), currently stores about 700 million barrels of crude oil in 62 sub-surface, solution-mined salt-caverns along the U.S. Gulf Coast. While these salt caverns exhibit many attractive characteristics for large-volume, long-term storage of oil such as low cost for construction, low permeability for effective fluids containment, and secure location deep underground, they also present unique technical challenges for maintaining oil quality within delivery standards. One of these standards is maintaining an oil bubblepoint pressure (BPP) of 14.7 psia or less at delivery conditions. Failure to meet this criterion may lead to excessive atmospheric emissions of gases from the oil that pose hazards in floating roof storage tanks at atmospheric pressure. Both geothermal heating and intrusion of gases such as methane, carbon dioxide, and nitrogen from the host geology contribute to a problematic rise in bubblepoint pressure. Recognizing these potential occupational health and safety issues and environmental risks, the DOE implemented a crude oil vapor pressure monitoring program in 1993 that collects vapor pressure data for all the storage caverns. From these data, DOE evaluates the rate-of-change in vapor pressures (regain rates) of its oils in the SPR and forecasts future delivery properties using equation-of-state (EOS) modeling. Moreover, DOE implemented a vapor pressure mitigation program in which the oils are degassed, cooled and, if necessary, treated with hydrogen sulfide scavenger immediately prior to delivery in order to reduce emissions to safe handling levels.
2.2 Importance of EOS Modeling at the SPR
EOS models are used to determine the pressure-volume-temperature (PVT) relationships of crude oils in the SPR process environment and at delivery sites. They are also used to create whole oil compositional models from oil PVT analyses, and underlie the fundamental processes in the degas plant simulator model. The outputs from EOS models are compared against SPR Project Level II performance criteria (DOE, 1999; DOE, 2005) to determine whether oil movements will meet safety criteria for vapor pressure and crude oil emissions. Mitigation strategies are then designed and applied based on EOS model output. From an SPR operations perspective, information derived from the EOS modeling directly affects several million dollars of budgeted monitoring and mitigation work annually, as well as defines constraints on operations in order to meet safety criteria.
2.3 Driver for Improvements in EOS Modeling
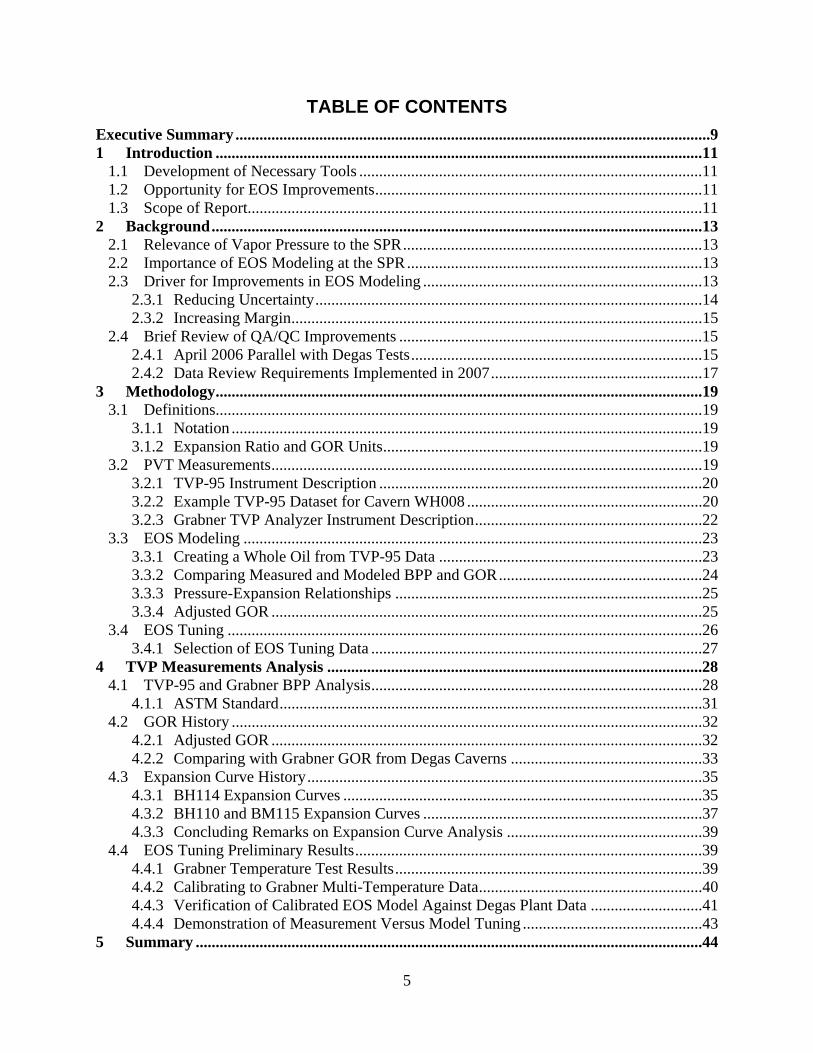
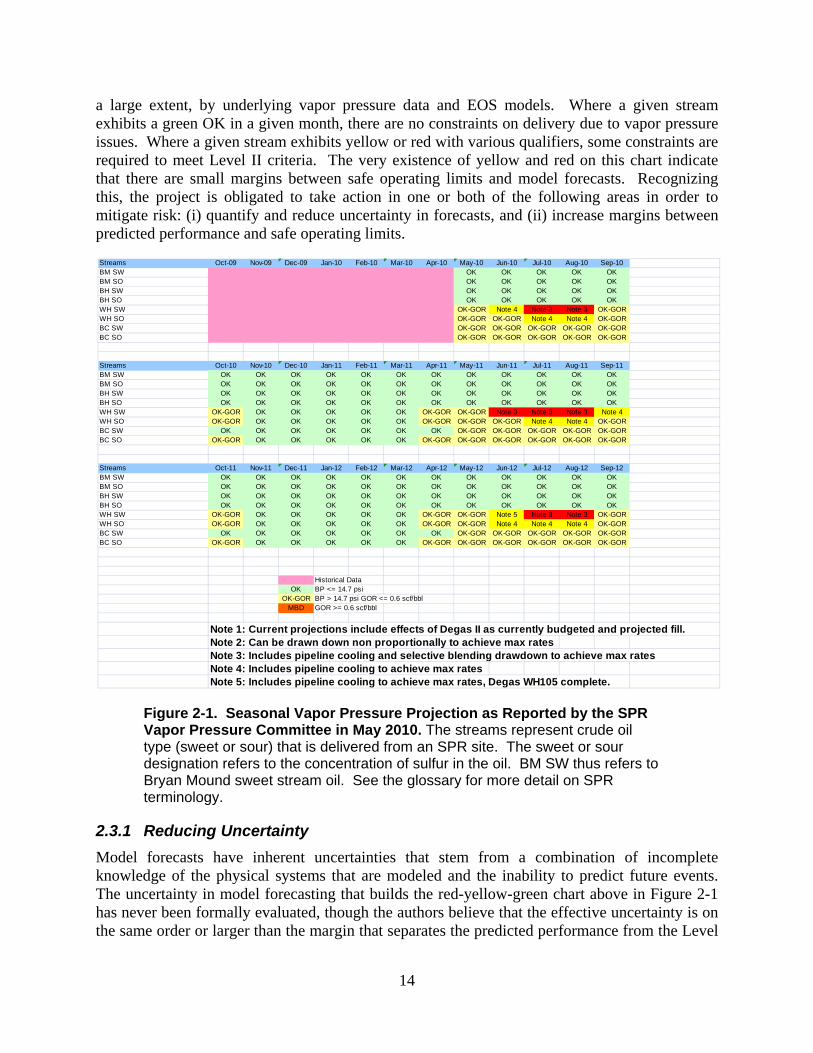
The focus on continued development of vapor pressure measurement and modeling methods at SPR is driven by tight margins between safe operating limits defined in the Level II criteria (DOE, 1999; DOE, 2005) and system performance predicted by numerical models. Operating with tight margins exposes the project, at a minimum, to reduced operational flexibility, and worse yet, to risk. An illustration of this is shown in Figure 2-1, which is a graphic produced by the SPR Vapor Pressure Committee on a quarterly basis that identifies the suitability of SPR crude oil streams for delivery to off-site customers. The figure, informally referred to as the red-yellow-green (RYG) chart, gives a three year forecast based on system models that are driven, to
14
a large extent, by underlying vapor pressure data and EOS models. Where a given stream exhibits a green OK in a given month, there are no constraints on delivery due to vapor pressure issues. Where a given stream exhibits yellow or red with various qualifiers, some constraints are required to meet Level II criteria. The very existence of yellow and red on this chart indicate that there are small margins between safe operating limits and model forecasts. Recognizing this, the project is obligated to take action in one or both of the following areas in order to mitigate risk: (i) quantify and reduce uncertainty in forecasts, and (ii) increase margins between predicted performance and safe operating limits.
Figure 2-1. Seasonal Vapor Pressure Projection as Reported by the SPR Vapor Pressure Committee in May 2010. The streams represent crude oil type (sweet or sour) that is delivered from an SPR site. The sweet or sour designation refers to the concentration of sulfur in the oil. BM SW thus refers to Bryan Mound sweet stream oil. See the glossary for more detail on SPR terminology.
2.3.1 Reducing Uncertainty
Model forecasts have inherent uncertainties that stem from a combination of incomplete knowledge of the physical systems that are modeled and the inability to predict future events. The uncertainty in model forecasting that builds the red-yellow-green chart above in Figure 2-1 has never been formally evaluated, though the authors believe that the effective uncertainty is on the same order or larger than the margin that separates the predicted performance from the Level
Streams Oct-09 Nov-09 Dec-09 Jan-10 Feb-10 Mar-10 Apr-10 May-10 Jun-10 Jul-10 Aug-10 Sep-10BM SW OK OK OK OK OKBM SO OK OK OK OK OKBH SW OK OK OK OK OKBH SO OK OK OK OK OKWH SW OK-GOR Note 4 Note 3 Note 3 OK-GORWH SO OK-GOR OK-GOR Note 4 Note 4 OK-GORBC SW OK-GOR OK-GOR OK-GOR OK-GOR OK-GORBC SO OK-GOR OK-GOR OK-GOR OK-GOR OK-GOR
Streams Oct-10 Nov-10 Dec-10 Jan-11 Feb-11 Mar-11 Apr-11 May-11 Jun-11 Jul-11 Aug-11 Sep-11BM SW OK OK OK OK OK OK OK OK OK OK OK OKBM SO OK OK OK OK OK OK OK OK OK OK OK OKBH SW OK OK OK OK OK OK OK OK OK OK OK OKBH SO OK OK OK OK OK OK OK OK OK OK OK OKWH SW OK-GOR OK OK OK OK OK OK-GOR OK-GOR Note 3 Note 3 Note 3 Note 4WH SO OK-GOR OK OK OK OK OK OK-GOR OK-GOR OK-GOR Note 4 Note 4 OK-GORBC SW OK OK OK OK OK OK OK OK-GOR OK-GOR OK-GOR OK-GOR OK-GORBC SO OK-GOR OK OK OK OK OK OK-GOR OK-GOR OK-GOR OK-GOR OK-GOR OK-GOR
Streams Oct-11 Nov-11 Dec-11 Jan-12 Feb-12 Mar-12 Apr-12 May-12 Jun-12 Jul-12 Aug-12 Sep-12BM SW OK OK OK OK OK OK OK OK OK OK OK OKBM SO OK OK OK OK OK OK OK OK OK OK OK OKBH SW OK OK OK OK OK OK OK OK OK OK OK OKBH SO OK OK OK OK OK OK OK OK OK OK OK OKWH SW OK-GOR OK OK OK OK OK OK-GOR OK-GOR Note 5 Note 3 Note 3 OK-GORWH SO OK-GOR OK OK OK OK OK OK-GOR OK-GOR Note 4 Note 4 Note 4 OK-GORBC SW OK OK OK OK OK OK OK OK-GOR OK-GOR OK-GOR OK-GOR OK-GORBC SO OK-GOR OK OK OK OK OK OK-GOR OK-GOR OK-GOR OK-GOR OK-GOR OK-GOR
Historical DataOK BP <= 14.7 psi
OK-GOR BP > 14.7 psi GOR <= 0.6 scf/bblMBD GOR >= 0.6 scf/bbl
Note 1: Current projections include effects of Degas II as currently budgeted and projected fill.Note 2: Can be drawn down non proportionally to achieve max rates Note 3: Includes pipeline cooling and selective blending drawdown to achieve max ratesNote 4: Includes pipeline cooling to achieve max ratesNote 5: Includes pipeline cooling to achieve max rates, Degas WH105 complete.
15
II criteria. If uncertainty can be reduced, then better clarity can be brought to how the project can best invest resources to mitigate the problem areas. The work outlined in this report is focused on reducing modeling uncertainty.
2.3.2 Increasing Margin
Increasing the margin between the predicted system performance (stream BPP and GOR) and the performance criteria (Level II limits on BPP and GOR) directly lowers risk. SPR has a three-part mitigation strategy to increase the margin between Level II criteria and predicted performance: (i) oil degasification, (ii) oil cooling, and (iii) hydrogen sulfide scavenging. The degasification program removes gas from oil in selected caverns, which reduces its bubble-point pressure and gas-oil ratio, which in turn significantly increases the predicted margin of system performance under the safety criteria. Also significant is the effect of geothermal heating on oil phase behavior, which is mitigated at SPR by the use of large heat exchangers which can be run at the time of delivery to cool the oil to a value between the cavern temperature and seasonal ambient surface water temperature. Finally, a hydrogen sulfide (H2S) scavenger program is in place that can be used as needed at the time of delivery in order to prevent poisonous H2S gas emissions.
2.4 Brief Review of QA/QC Improvements
2.4.1 April 2006 Parallel with Degas Tests
In April 2006 a set of “parallel” tests (TVP-95 and TVP-2000 run side-by-side on common samples) was run during degasification of SPR Big Hill cavern 114 (BH114) to investigate the historical discrepancies in whole oil compositions calculated from data derived from the TVP-95 and TVP-2000 instrument systems (see Lord, 2006a for more detail). The testing found that all of the gas chromatograph (GC) units exhibited high accuracy and reproducibility for the certified calibration gases. Testing of identical crude oil flash gases in all GC’s indicated that the light ends compared very closely (< 5% relative differences), though the hexanes and heptanes did not agree as well due to limitations in the calibration technique for the TVP-2000. Subsequent work by Sandia (Lord and Rudeen, 2006) found that the EOS model was not sufficiently sensitive to the uncertainty in measured hexanes and heptanes from the TVP-2000 to warrant action to tighten the calibration process.
While the GC performance appeared to test out well, the flash separator in the TVP-95 showed problems with producing valid equilibrium flash gas samples from the BPP test. Inadvertent traps and dead spaces in the sample handling line allowed vacuum flash gases to appear in the GC rather than true equilibrium flash gases for the BPP condition. Increased flushing of the sample lines coupled with a new valve configuration significantly improved the equilibrium measurements so that the whole oils calculated from the BPP and GOR conditions aligned quite well.
The effects of the TVP-95 BPP test problems affected data going back several years from April 2006. A review of the data indicated that while the BPP test gas compositions were erroneous, the GOR test compositions were actually sound because the flowing configuration in the GOR test flushed the sample lines and provided a gas sample that was near equilibrium. The Vapor Pressure Committee decided from summer 2006 forward to use GOR flash gas data as the basis
16
for whole oil calculations because they were more reliable than the historical BPP gas data. Once Pencor demonstrated that the BPP test process was improved, very little difference was observed between the integrity of the BPP or GOR flash gas results, and either may be used in the EOS model for building whole oils.
Several steps significantly improved agreement in the calculated wholes oils – consistent normalization schemes for GC data, a new valve configuration and increased flushing of the sample lines in the TVP-95. The issues were primarily with the BPP tests. However, a final issue that still needs to be addressed is gas flow metering. Accurate gas flow measurements are required for accurate EOS calculations.
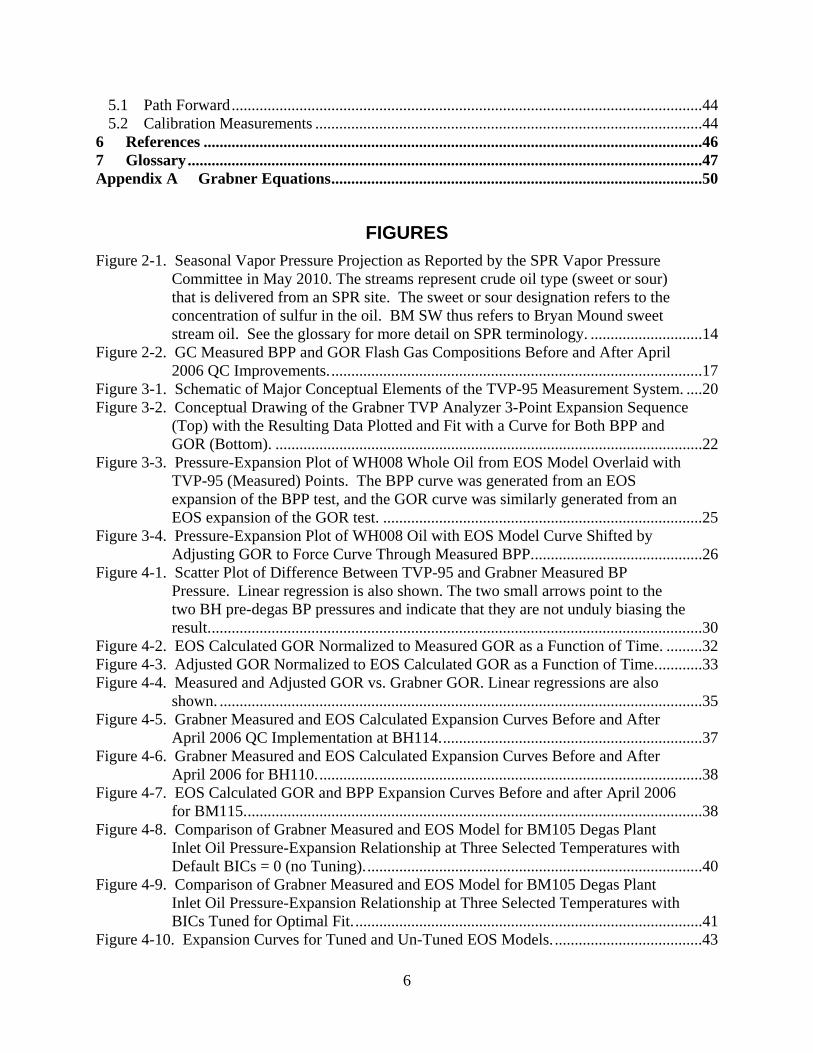
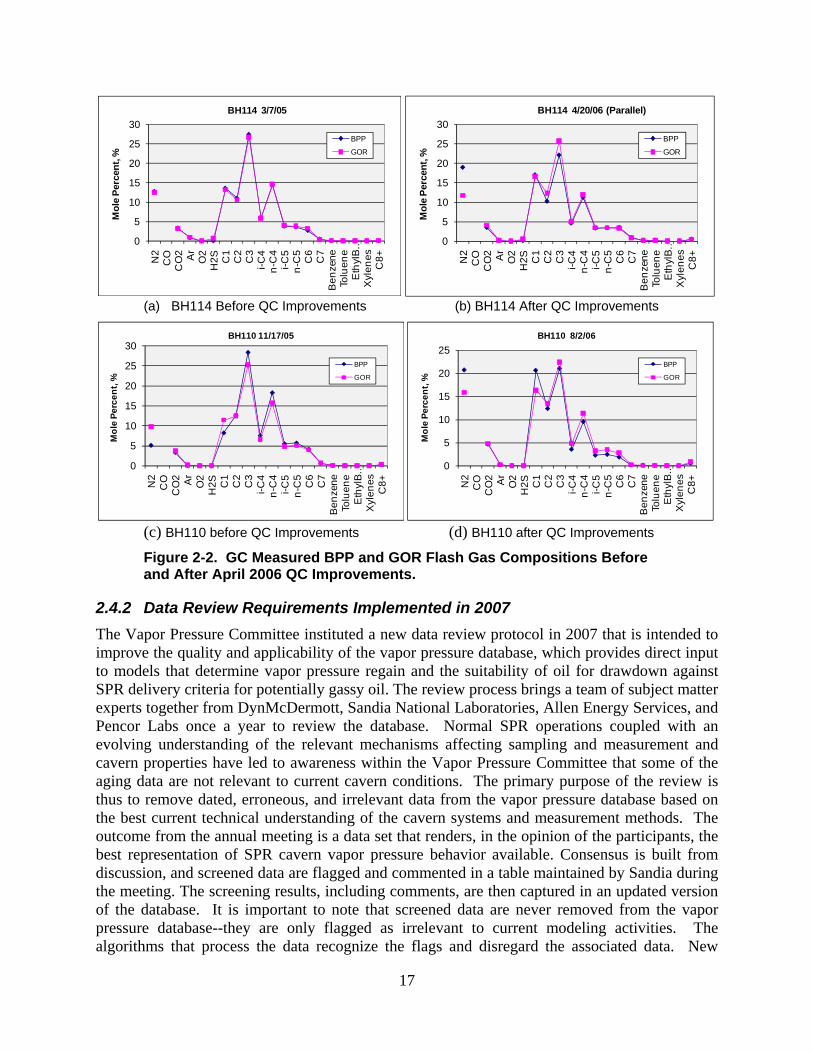
The effects of the QC improvements can be seen in Figure 2-2 which presents comparisons of the BPP (blue diamonds) and GOR (pink squares) flash gas compositions as measured by GC in the TVP-95 for BH114. Figure 2-2 (a) are comparisons before the QC implementation and Figure 2-2 (b) is during the parallel testing that led to the QC improvements, but after implementation of the increased flushing procedure. Prior to April 2006 the BPP and GOR flash gases are almost identical which is not physically reasonable. EOS sensitivity studies show that with a drop in flash pressure from BP to atmospheric, the mole % of the lightest components like N2 (nitrogen) and C1 (methane) should decrease as the intermediate components (C2, C3 and C4) more readily flash at the lower atmospheric pressure. Where the switch from decrease to increase occurs (that is, between which two components) varies with the component mix and temperature drop but is typically between C1 and C2. After the QC improvements, the expected relationship between the BPP and GOR gas compositions is visible in Figure 2-2 (b). Though subtle to the eye at the scale shown, the effects of small changes in the light ends composition in a crude oil composition have a significant effect on GOR. Figure 2-2 (c, d) shows a similar sequence for BH110 cavern oil that was sampled with the TVP-95 prior to (c) and after (d) the noted QC changes.
17
(a) BH114 Before QC Improvements (b) BH114 After QC Improvements
(c) BH110 before QC Improvements (d) BH110 after QC Improvements
Figure 2-2. GC Measured BPP and GOR Flash Gas Compositions Before and After April 2006 QC Improvements.
2.4.2 Data Review Requirements Implemented in 2007
The Vapor Pressure Committee instituted a new data review protocol in 2007 that is intended to improve the quality and applicability of the vapor pressure database, which provides direct input to models that determine vapor pressure regain and the suitability of oil for drawdown against SPR delivery criteria for potentially gassy oil. The review process brings a team of subject matter experts together from DynMcDermott, Sandia National Laboratories, Allen Energy Services, and Pencor Labs once a year to review the database. Normal SPR operations coupled with an evolving understanding of the relevant mechanisms affecting sampling and measurement and cavern properties have led to awareness within the Vapor Pressure Committee that some of the aging data are not relevant to current cavern conditions. The primary purpose of the review is thus to remove dated, erroneous, and irrelevant data from the vapor pressure database based on the best current technical understanding of the cavern systems and measurement methods. The outcome from the annual meeting is a data set that renders, in the opinion of the participants, the best representation of SPR cavern vapor pressure behavior available. Consensus is built from discussion, and screened data are flagged and commented in a table maintained by Sandia during the meeting. The screening results, including comments, are then captured in an updated version of the database. It is important to note that screened data are never removed from the vapor pressure database--they are only flagged as irrelevant to current modeling activities. The algorithms that process the data recognize the flags and disregard the associated data. New
0
5
10
15
20
25
30
N2
CO
CO
2 Ar
O2
H2
SC
1C
2C
3i-
C4
n-C
4i-
C5
n-C
5C
6C
7B
en
zen
eTo
lue
ne
Eth
ylB
…X
yle
ne
sC
8+
Mo
le P
erce
nt,
%BH114 3/7/05
BPP
GOR
0
5
10
15
20
25
30
N2
CO
CO
2 Ar
O2
H2
SC
1C
2C
3i-C
4n
-C4
i-C5
n-C
5C
6C
7B
en
zen
eTo
lue
ne
Eth
ylB
…X
yle
ne
sC
8+
Mo
le P
erce
nt,
%
BH114 4/20/06 (Parallel)
BPP
GOR
0
5
10
15
20
25
30
N2
CO
CO
2 Ar
O2
H2
SC
1C
2C
3i-
C4
n-C
4i-
C5
n-C
5C
6C
7B
en
zen
eTo
lue
ne
Eth
ylB
…X
yle
ne
sC
8+
Mo
le P
erc
en
t, %
BH110 11/17/05
BPP
GOR
0
5
10
15
20
25
N2
CO
CO
2 Ar
O2
H2
SC
1C
2C
3i-
C4
n-C
4i-
C5
n-C
5C
6C
7B
en
zen
eTo
lue
ne
Eth
ylB
…X
yle
ne
sC
8+
Mo
le P
erc
en
t, %
BH110 8/2/06
BPP
GOR

18
vapor pressure data are also reviewed each quarter by the committee before publication in the quarterly vapor pressure spreadsheets. In the event that data are screened out, they are again flagged and annotated as such in the database.
19
3 Methodology The workflow required to obtain, analyze and model crude oil phase behavior is very complex. The methodology presented here summarizes the processes with the intent to inform the reader enough to understand the basic results presented in section 4.
3.1 Definitions
3.1.1 Notation
The following notation will be used for the various measures of BP pressure and gas-oil ratio throughout the remainder of the report:
BPP – Bubblepoint pressure measured by the TVP-95
GOR – Gas-oil ratio measured by the TVP-95
adjGOR – GOR that has been adjusted so that when combined with flash gas compositions from a GOR test, the resulting whole oil exhibits a bubblepoint pressure equivalent to the measured BPP
BPP(GOR) – Bubblepoint pressure calculated by the EOS model from GOR test data.
GOR(BPP) – GOR calculate by the EOS model from BPP test data.
GOR(Grabner) – GOR calculated from curve fit to Grabner TVP data
BPP(Grabner) – BPP calculated from curve fit to Grabner TVP data
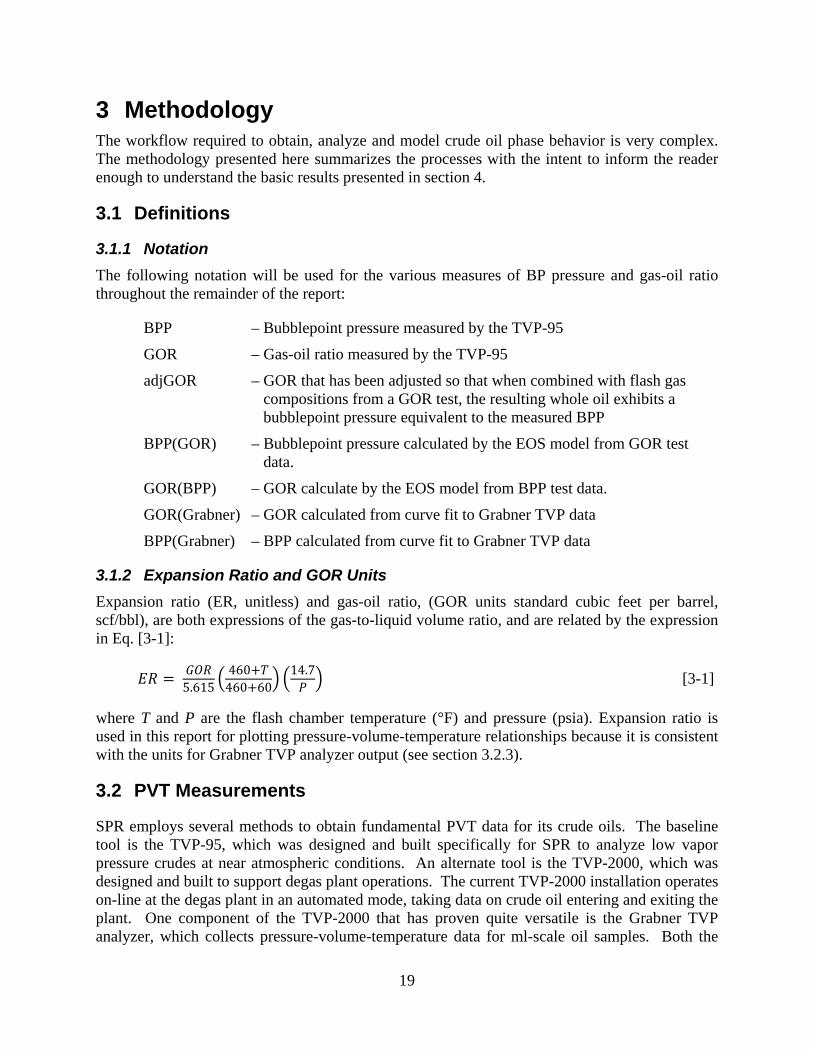
3.1.2 Expansion Ratio and GOR Units
Expansion ratio (ER, unitless) and gas-oil ratio, (GOR units standard cubic feet per barrel, scf/bbl), are both expressions of the gas-to-liquid volume ratio, and are related by the expression in Eq. [3-1]:
5.615
460460 60
14.7 [3-1]
where T and P are the flash chamber temperature (°F) and pressure (psia). Expansion ratio is used in this report for plotting pressure-volume-temperature relationships because it is consistent with the units for Grabner TVP analyzer output (see section 3.2.3).
3.2 PVT Measurements
SPR employs several methods to obtain fundamental PVT data for its crude oils. The baseline tool is the TVP-95, which was designed and built specifically for SPR to analyze low vapor pressure crudes at near atmospheric conditions. An alternate tool is the TVP-2000, which was designed and built to support degas plant operations. The current TVP-2000 installation operates on-line at the degas plant in an automated mode, taking data on crude oil entering and exiting the plant. One component of the TVP-2000 that has proven quite versatile is the Grabner TVP analyzer, which collects pressure-volume-temperature data for ml-scale oil samples. Both the

20
TV-95 and the Grabner TVP analyzer are described in more detail below.
3.2.1 TVP-95 Instrument Description
The TVP-95 is a portable set of vapor pressure test equipment (gas-liquid separator, gas chromatograph, measurement transducers and data loggers), housed in a trailer and operated by Pencor Laboratory for the SPR program. The TVP-95 is used to measure bubblepoint pressure, gas-oil ratio, and flash gas compositions for oil samples taken from SPR caverns on a periodic basis. Sampling frequency is about every 3 years for each cavern at SPR. The data are primarily used to establish a baseline BPP, corresponding GOR, flash gas composition, and vapor pressure regain rates from historical data for each cavern.
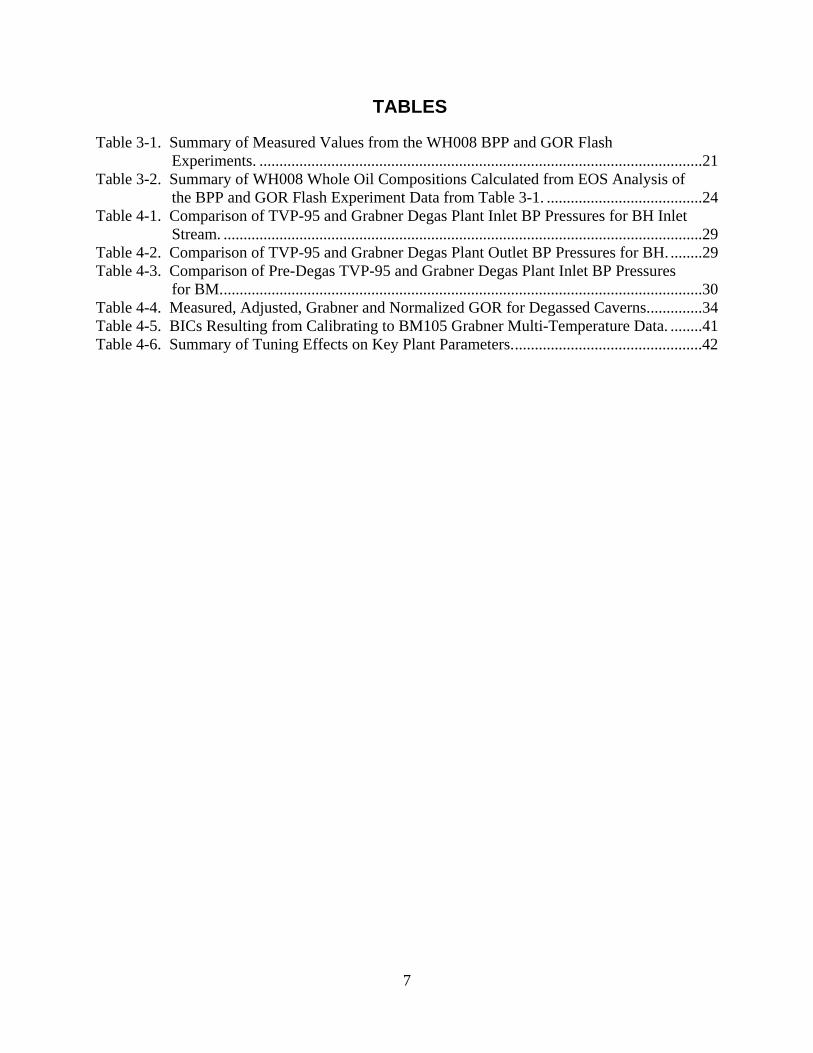
A schematic of the major conceptual elements of the TVP-95 flash experiment is given in Figure 3-1. The TVP-95 flash experiment induces phase separation of a liquid crude oil sample (oil in) stream into a gas phase and a liquid phase. Typically, two tests are run for a sampling event: (i) BPP pressure test where flash conditions are T=100°F, gas phase volume is small, and pressure is measured, and (ii) a GOR test where T=100°F, P = 14.7 psia and gas volume is measured for a known liquid volume. Cycle-time is typically 1-2 days including sample acquisition. Testing usually takes 2-8 hours. An example of a typical data set from the TVP-95 is given in the next section.
Figure 3-1. Schematic of Major Conceptual Elements of the TVP-95 Measurement System.
3.2.2 Example TVP-95 Dataset for Cavern WH008
SPR site West Hackberry cavern 8 (WH008) was sampled with the TVP-95 on 12/12/2008 by Pencor. A wireline tool was dropped to 2927 feet (892 m) deep in the cavern and crude oil was retrieved and held above its bubblepoint pressure until the test was started. The crude oil was passed through the TVP-95 and analyzed for bubblepoint pressure, gas-oil ratio, and associated equilibrium flash gas compositions at a flash chamber temperature of T = 100°F (311 K). Table 3-1 summarizes the results from these flash experiments. The table header information lists test
Gas flow meter
Gas/Liquid separator
Oil out
Oil in
Pressure meter
Gas Chromatograph
Valve•Closed for VP•Open for GOR and GC
TVP-95 Schematic
Used oil disposal
Crude oil sample
21
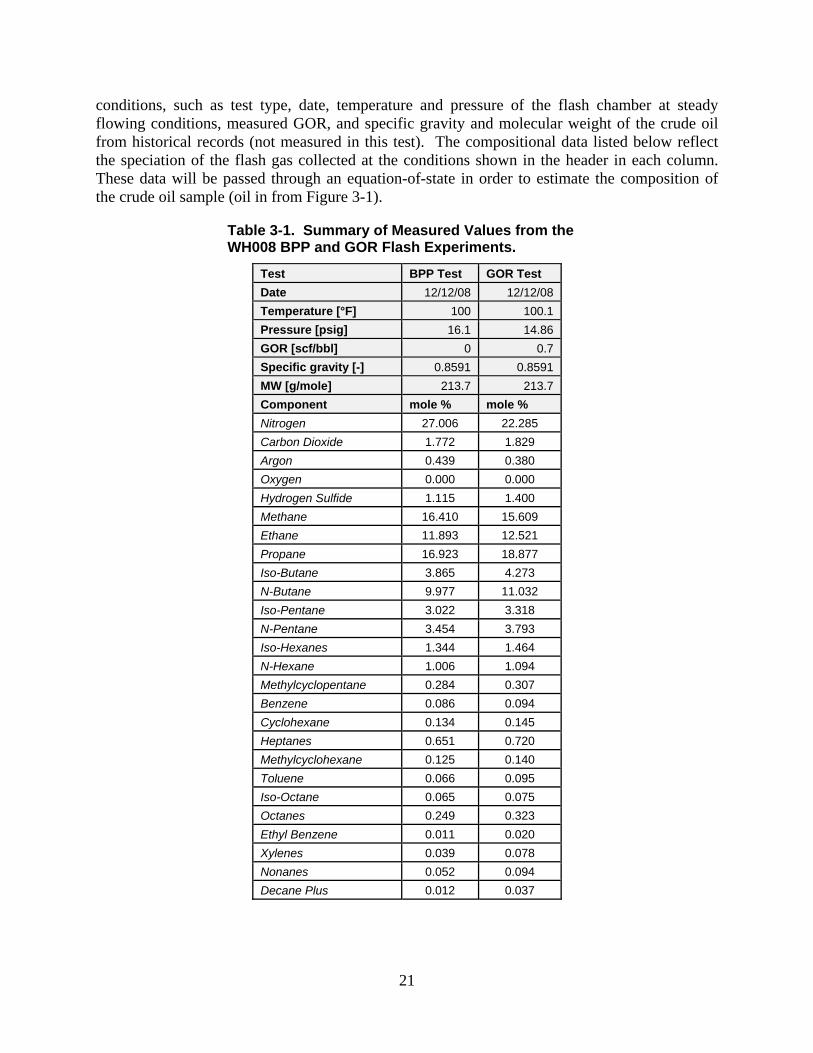
conditions, such as test type, date, temperature and pressure of the flash chamber at steady flowing conditions, measured GOR, and specific gravity and molecular weight of the crude oil from historical records (not measured in this test). The compositional data listed below reflect the speciation of the flash gas collected at the conditions shown in the header in each column. These data will be passed through an equation-of-state in order to estimate the composition of the crude oil sample (oil in from Figure 3-1).
Table 3-1. Summary of Measured Values from the WH008 BPP and GOR Flash Experiments.
Test BPP Test GOR Test
Date 12/12/08 12/12/08
Temperature [°F] 100 100.1
Pressure [psig] 16.1 14.86
GOR [scf/bbl] 0 0.7
Specific gravity [-] 0.8591 0.8591
MW [g/mole] 213.7 213.7
Component mole % mole %
Nitrogen 27.006 22.285
Carbon Dioxide 1.772 1.829
Argon 0.439 0.380
Oxygen 0.000 0.000
Hydrogen Sulfide 1.115 1.400
Methane 16.410 15.609
Ethane 11.893 12.521
Propane 16.923 18.877
Iso-Butane 3.865 4.273
N-Butane 9.977 11.032
Iso-Pentane 3.022 3.318
N-Pentane 3.454 3.793
Iso-Hexanes 1.344 1.464
N-Hexane 1.006 1.094
Methylcyclopentane 0.284 0.307
Benzene 0.086 0.094
Cyclohexane 0.134 0.145
Heptanes 0.651 0.720
Methylcyclohexane 0.125 0.140
Toluene 0.066 0.095
Iso-Octane 0.065 0.075
Octanes 0.249 0.323
Ethyl Benzene 0.011 0.020
Xylenes 0.039 0.078
Nonanes 0.052 0.094
Decane Plus 0.012 0.037
22
3.2.3 Grabner TVP Analyzer Instrument Description
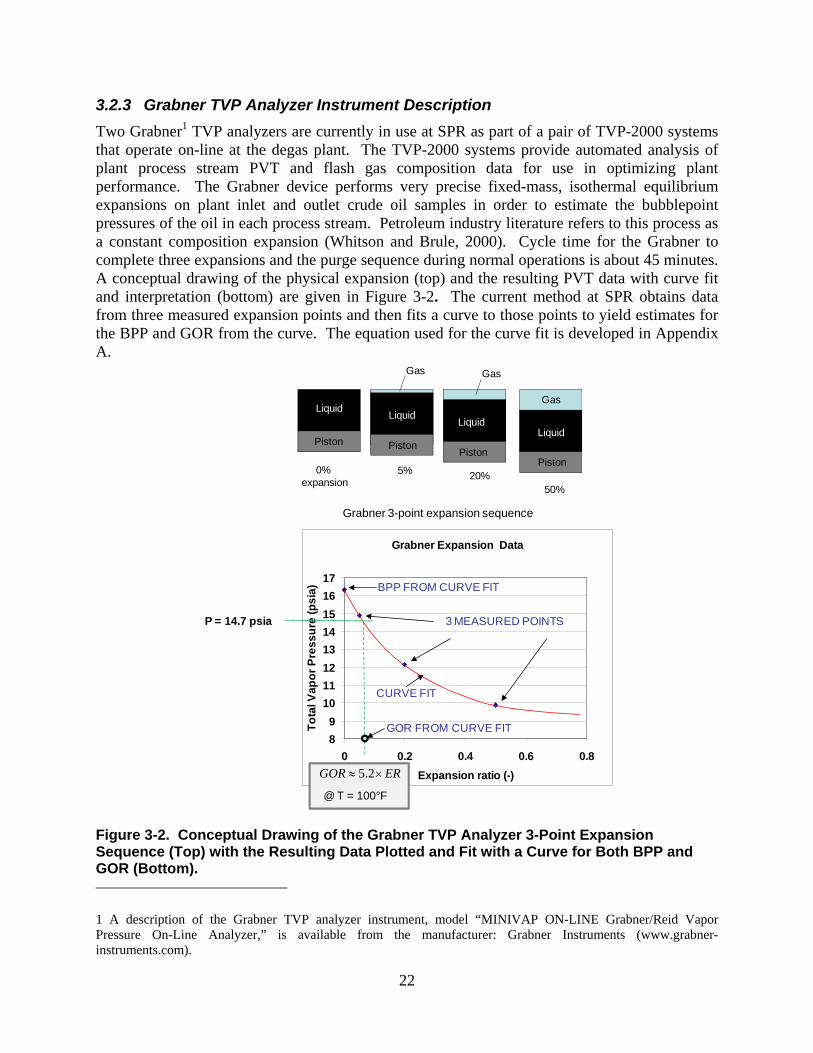
Two Grabner1 TVP analyzers are currently in use at SPR as part of a pair of TVP-2000 systems that operate on-line at the degas plant. The TVP-2000 systems provide automated analysis of plant process stream PVT and flash gas composition data for use in optimizing plant performance. The Grabner device performs very precise fixed-mass, isothermal equilibrium expansions on plant inlet and outlet crude oil samples in order to estimate the bubblepoint pressures of the oil in each process stream. Petroleum industry literature refers to this process as a constant composition expansion (Whitson and Brule, 2000). Cycle time for the Grabner to complete three expansions and the purge sequence during normal operations is about 45 minutes. A conceptual drawing of the physical expansion (top) and the resulting PVT data with curve fit and interpretation (bottom) are given in Figure 3-2. The current method at SPR obtains data from three measured expansion points and then fits a curve to those points to yield estimates for the BPP and GOR from the curve. The equation used for the curve fit is developed in Appendix A.
Figure 3-2. Conceptual Drawing of the Grabner TVP Analyzer 3-Point Expansion Sequence (Top) with the Resulting Data Plotted and Fit with a Curve for Both BPP and GOR (Bottom).
1 A description of the Grabner TVP analyzer instrument, model “MINIVAP ON-LINE Grabner/Reid Vapor Pressure On-Line Analyzer,” is available from the manufacturer: Grabner Instruments (www.grabner-instruments.com).
Piston
LiquidLiquid
LiquidLiquid
Gas
0% expansion
5% 20%50%
Gas
PistonPiston
Piston
Gas
Grabner 3-point expansion sequence
Grabner Expansion Data
8
9
10
11
12
13
14
15
16
17
0 0.2 0.4 0.6 0.8
Expansion ratio (-)
To
tal V
apo
r P
ress
ure
(p
sia
)
3 MEASURED POINTS
CURVE FIT
BPP FROM CURVE FIT
P = 14.7 psia
GOR FROM CURVE FIT
ERGOR 2.5
@ T = 100°F
23
In addition to providing TVP data to support degas plant operations, the Grabner instruments can provide valuable comparison and calibration data to assist experimental and numerical model development and calibration.
3.2.3.1 Grabner TVP Expansions at Nonstandard Temperature
One of the useful features of the Grabner TVP analyzer is that it can be easily and quickly configured to run PVT analyses at selected nonstandard temperatures (i.e., 90°F and 120°F) in order to provide EOS model calibration and tuning data for parameter space that is relevant to the SPR but not routinely measured. Grabner data collected at nonstandard temperatures are presented and discussed relevant to EOS tuning in section 4.4.
3.3 EOS Modeling
Equation-of-state (EOS) modeling at SPR is used to predict phase behavior of crude oil based on thermodynamic principles. EOS model output includes BPP and GOR of crude oils as a function of temperature and pressure. EOS models underlie all deliverability forecasting at SPR and are embedded in the HYSYS2 degas plant process simulator. EOS models are also used to build whole oil compositions for each cavern based on TVP-95 vapor pressure, GOR, and flash experiments. The Soave-Redlich-Kwong (SRK) version of the cubic EOS is used by the VP project to model two phase vapor/liquid equilibrium problems. The SRK EOS is implemented in several ways at SPR depending on application. For production calculations that feed into quarterly reports to senior management, the 2009 Vapor Pressure Database and Equation-of-State Solver (2009 VPEOS, Rudeen and Lord 2009) is run by DynMcDermott in New Orleans. The 2009 VPEOS and Solver runs in Microsoft Excel using spreadsheet functions and Visual Basic macros. For research and development (R&D) applications, such as the work presented in this report, a modified and more flexible version of the Excel-based Solver is used, as well as a standalone FORTRAN MS Windows program called D2EOS. The value in having the R&D versions is that they can be optimized to accept flexible input-output formats for coupling with nonstandard analyses, as well as be configured to carry many extra features that are not desired in a production tool. Note that all the above mentioned tools have been verified to give the same solutions to common test problems.
3.3.1 Creating a Whole Oil from TVP-95 Data
The data from Table 3-1 were passed through an EOS model in order to recombine the gas and liquid phases to form a “whole” oil, which should represent the composition and properties of the “oil in” from Figure 3-1. Results from the EOS model runs for the recombined whole oils are given in
2 HYSYS is a commercial off-the-shelf software package marketed by AspenTech that specializes in fluid-chemical-thermal process simulation.
24
Table 3-2. With two tests run, namely the BPP and GOR tests, there are two estimates of the whole oil. Note that the compositional profiles of the whole oils in

25
Table 3-2 are similar, but not identical.
26
Table 3-2. Summary of WH008 Whole Oil Compositions Calculated from EOS Analysis of the BPP and GOR Flash Experiment Data from Table 3-1.
Whole Oil Composition from EOS Model
BPP Test, mole %
GOR Test, mole %
Nitrogen 0.057 0.072
Carbon Monoxide 0.000 0.000
Carbon Dioxide 0.040 0.040
Argon 0.001 0.002
Oxygen 0.000 0.000
Hydrogen Sulfide 0.055 0.066
Methane 0.094 0.102
Ethane 0.354 0.359
Propane 1.678 1.746
Iso-Butane 0.909 0.929
N-Butane 3.285 3.357
Iso-Pentane 2.405 2.434
N-Pentane 3.605 3.649
N-Hexane 8.875 8.885
Heptanes 7.525 7.672
Benzene 0.315 0.320
Toluene 0.786 1.050
Ethyl Benzene 0.376 0.623
Xylenes 1.575 2.940
Residual 68.067 65.756
T(F) 100 100
BPP (psia) 16.0 17.8
GOR (scf/BBL) 0.3 0.7
3.3.2 Comparing Measured and Modeled BPP and GOR
A TVP-95 measurement of a SPR crude oil typically entails two separate measurements, BPP and GOR that can independently be used to calculate whole oils. This offers an opportunity to compare the EOS model output with direct measurements based on two measurements that were obtained in the same sampling event. In the current case, the measured GOR is found at the top of Table 3-1, and was observed at 0.7 scf/bbl. For comparison, the EOS model estimate, GOR(BPP), is given at the bottom of

27
Table 3-2, and is 0.3 scf/bbl, which is about half what was measured. With these data alone, it is not clear which method gives a more accurate representation of the true equilibrium GOR. A similar comparison of model versus measured results can be made by comparing the observed BPP = 16.1 psia with the EOS model estimate BPP(GOR) = 17.8 psia. Again, there is some discrepancy between the measured and modeled BPP values.
28
3.3.3 Pressure-Expansion Relationships
More perspective on oil phase behavior and the implications of discrepancies may be gained from plotting the pressure-expansion-temperature relationships. Figure 3-3 shows an example overlay of EOS-generated pressure-expansion curves based on the WH008 data. The measured BPP and GOR of the WH008 oil are shown with green triangles. EOS expansions based on these measurements points are shown in dark blue (EOS from BPP test) and pink (EOS from GOR test). The BPP calculated from the EOS expansion of the GOR test data (17.8 psia) is shown where the red curve intersects the y-axis. The GOR calculated from the EOS expansion of the BPP test data (0.3 scf/bbl) is shown where the blue curve passes through the P = 14.7 psia line. Note that the unitless ER can be converted to scf/bbl by multiplying by ~5.2 for this case. Given that these two curves are simulating the same oil over the same conditions, they should overlay. The offset implies that there is a discrepancy either in the measured data or the model results.
Figure 3-3. Pressure-Expansion Plot of WH008 Whole Oil from EOS Model Overlaid with TVP-95 (Measured) Points. The BPP curve was generated from an EOS expansion of the BPP test, and the GOR curve was similarly generated from an EOS expansion of the GOR test.
3.3.4 Adjusted GOR
Operational experience at SPR has generally shown that the measured BPP is more accurate than the measured GOR, while the flash gas from the GOR test is more accurate than the flash gas from the BPP test. A hybrid dataset that combines the flash gas from the GOR test and the bubblepoint pressure from the BPP test gives an optimized whole oil. To start, the GOR flash gas is passed through an EOS with P = 14.7 psia and T = 100°F, along with the measured GOR. The bubblepoint pressure returned from the EOS, namely BPP(GOR), is then compared with the measured BPP. If they do not match to within 0.01, the GOR input to the EOS model is adjusted
Measured BPP
Measured GOR
BPP calculated from GOR
GOR calculated from BPP
P = 14.7 psia
ERGOR 2.5 @ T = 100°F
29
until the BPP(GOR) = BPP. This process is represented graphically for the WH008 example in Figure 3-4, where the GOR was reduced from 0.7 to 0.3 scf/bbl, and the curve was shifted to the left where it passes through the measured BPP and coincidentally overlays the EOS from BPP curve. The overlay of these curves implies that the flash gases for the BPP and GOR test were self-consistent, and the likely error was in the magnitude of the measured GOR.
Figure 3-4. Pressure-Expansion Plot of WH008 Oil with EOS Model Curve Shifted by Adjusting GOR to Force Curve Through Measured BPP.
3.4 EOS Tuning
EOS models typically require calibration, or tuning, to specific applications in order to yield adequate accuracy. It is critical to exhaust as many sources of experimental error as possible before tuning because the applicability of the tuned model is severely limited if it is correcting for measurement errors. Two general approaches are used for tuning crude oil EOS models: (i) modifying binary interaction coefficients (BICs), or (ii) grouping heavy end hydrocarbons into appropriate hypothetical components (hypos). Both approaches have been investigated for SPR applications, and the BICs appear to be much more influential than the hypos for effective EOS tuning. Phase behavior for the SPR oil compositions and process environment is driven largely by the volatility of a handful of light components, including nitrogen, methane, ethane, and propane. Hence, for the current discussion, only the BICs related to the light ends are adjusted for the purpose of tuning. The hypos are handled as a single group with the properties of octane.
A subtle, but key requirement of EOS tuning at SPR is that only a single set of tuning coefficients and hypos may be used for any oils that are commingled. Since SPR commingles many cavern oils into streams, there could be at most, 8 unique tuning solutions (combinations of BICs and hypos) that apply across the 62 caverns. In a best-case scenario, a single set of tuning coefficients would apply across all 8 streams and 62 caverns.
EOS curve shifted by adjusting GOR
30
3.4.1 Selection of EOS Tuning Data
PVT and tuning data should be selected to cover the range of applications of the EOS modeling. For example, at SPR, the crude oil process environment exposes oil to temperatures ranging from about 80-130°F and pressure ranging from ~10-2000 psia. Since SPR oil rarely exhibits bubblepoints above 30 psia at 100°F, the effective pressure range for PVT testing can be constrained to between 10-30 psia. Liquid phase PVT behavior for the 30-2000 psia environments may be of interest for fluid dynamics modeling at SPR, but it is not required for the vapor pressure work. Volume corrections for pressure and temperature in the liquid phase only can be handled with industry standards, such as API MPMS Chapter 11 (API, 2004).
Test configurations should also relate closely to modeled conditions. For example, preliminary tuning is best accomplished against simple experimental configurations, such as a single-stage flash separator or Grabner-style PVT expansion. This limits the number of variables that may affect the system and model performance. Once this behavior is tuned in, then more complex processes may be simulated, such as specific unit operations, floating roof tanks, or ultimately, the entire degas plant. The challenge in many of these situations is that the system is not instrumented in such a way that all the required data are obtained. Among the options listed, the degas plant is actually very well-instrumented and does serve as a good source for calibration and verification data.
Commingling oil streams is another issue that must be considered. SPR commingles several caverns at a site to produce a stream for delivery. Phase behavior of the commingled stream should be verified against the EOS model.

31
4 TVP Measurements Analysis
This section of the report presents an analysis of the evolution of TVP measurements from early 2004, just prior to the beginning of degas II at Big Hill, to September, 2009. Analysis focuses on the paired BPP and GOR tested performed by the TVP-95, with validation provided by the Grabner TVP analyzer in the TVP-2000 at the degas plant, taking particular advantage of parallel testing performed for 7 of the 9 degassed caverns at BH. Analyses focus on (1) different measurements of BPP, (2) measurements and EOS estimates of GOR because of their continued, relatively high level of uncertainty and (3) Grabner measured and EOS calculated expansion curves because they cover a range of PVT space. More specifically, section 4.1 discusses the consistent differences seen in BPP measured by the TVP-95 and the Grabner TVP Analyzer. Section 4.2 presents an analysis of the consistent disparity between observed, measured and EOS calculated GOR using normalized GOR measures – that is, GOR divided by some “expected” value. In section 4.3, the single value comparisons and analyses are expanded to data covering a range of PVT space by comparing measured and EOS calculated expansion curves (a set of P, V points at a fixed temperature) and evaluating their evolution over time. In section 4.4 the EOS model is addressed by demonstrating the effects of model tuning using binary interaction coefficients. Historically, the SPR has used zero BICs. Non-zero BICs can be used to account for discrepancies between model results and observations after measurement error has been minimized.
4.1 TVP-95 and Grabner BPP Analysis
Two methods regularly used to measure crude oil BP pressure at SPR are the TVP-95 BPP test and the Grabner TVP analyzer located in the TVP-2000 at the degas plant. Parallel testing at BH during degassing in 2004-2006 allows for direct comparison of the two methods. Parallel testing refers to a test configuration in which the TVP-95 and TVP-2000 instrument systems are run side-by-side using a flowing source crude oil from the same stream at the degas plant. Measured BP pressures from the degas plant inlet-stream for the two measurement systems are compared in Table 4-1. No parallel tests were performed for BH101 and BH104 so pre-degas in-cavern TVP-95 values were used instead. From Table 4-1 it can be seen that the Grabner measured BPP is always higher than the TVP-95 measured value with an average difference of 0.82 psi (2=0.48 psi), indicating a statistically significant difference. A similar comparison for the degas plant outlet stream is shown in Table 4-2 indicating a similar trend – Grabner BPP are higher than TVP-95 BPP for 4 of the 6 caverns tested in parallel. BH112 and BH110 are the exceptions with differences of -0.01 and -0.3, respectively. The outlet stream from the degas plant has a much smaller BPP (~11 vs. ~18 psia) and an average difference of about 0.2 psia (2=0.35), indicating that the difference between Grabner and TVP-95 measured BP pressures are probably pressure dependent.
32
Table 4-1. Comparison of TVP-95 and Grabner Degas Plant Inlet BP Pressures for BH Inlet Stream.
BH Cavern Grabner, psia
TVP-95, psia
Difference, psia
Difference, %
BH108 18.7 18.0 0.70 0.039
BH113 18.8 18.6 0.20 0.011
BH103 19.0 17.8 1.16 0.065
BH101* 19.9 18.4 1.50 0.082
BH104* 18.7 17.7 1.00 0.056
BH112 16.4 15.1 1.27 0.084
BH102 15.3 14.8 0.49 0.033
BH114 19.0 18.0 1.00 0.056
BH110 16.7 16.6 0.10 0.006
Average 18.0 17.2 0.82 0.048
2 1.53 1.4 0.48 0.028
* No parallel TVP-95 data, pre-degas TVP-95 data used.
Table 4-2. Comparison of TVP-95 and Grabner Degas Plant Outlet BP Pressures for BH.
BH Cavern Grabner,
psia TVP-95,
psia Difference,
psia Difference,
%
BH108 10.5 9.8 0.70 0.071
BH103 11.6 11.2 0.39 0.035
BH112 10.4 10.4 -0.01 -0.001
BH102 11.1 11.1 0.00 0.000
BH114 11.3 11.0 0.30 0.027
BH110 10.3 10.6 -0.30 -0.028
Average 10.9 10.7 0.18 0.017
2 0.54 0.53 0.35 0.035
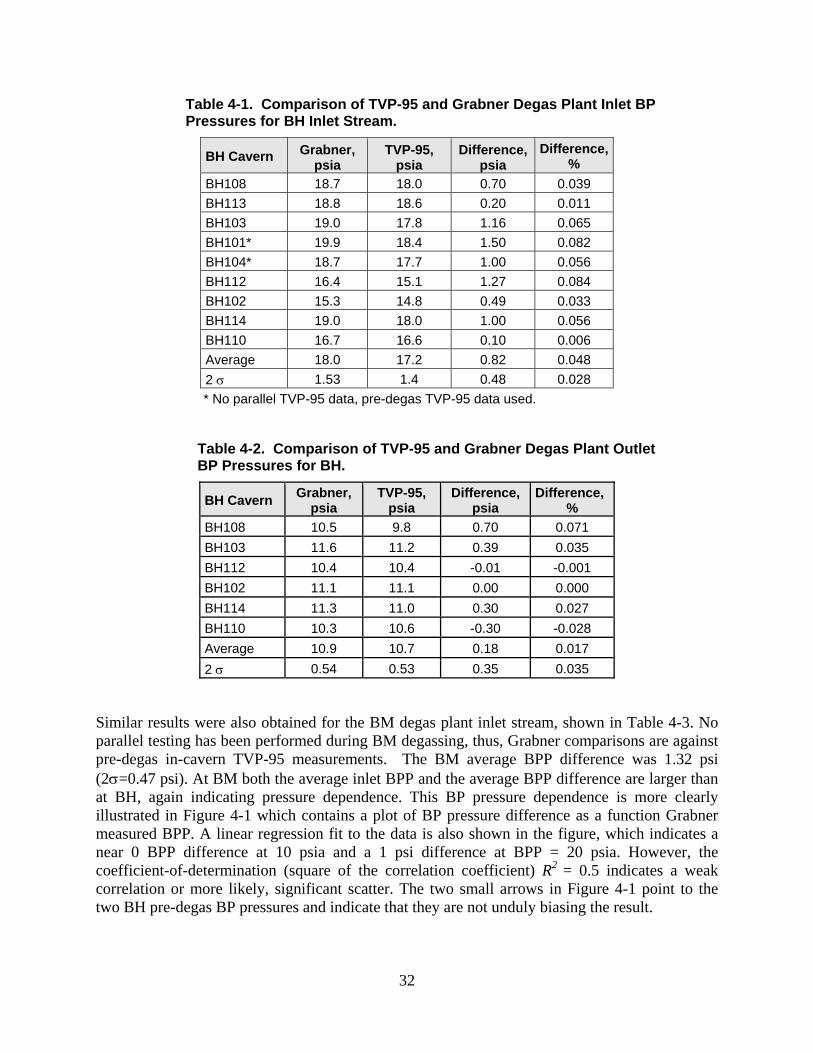
Similar results were also obtained for the BM degas plant inlet stream, shown in Table 4-3. No parallel testing has been performed during BM degassing, thus, Grabner comparisons are against pre-degas in-cavern TVP-95 measurements. The BM average BPP difference was 1.32 psi (2=0.47 psi). At BM both the average inlet BPP and the average BPP difference are larger than at BH, again indicating pressure dependence. This BP pressure dependence is more clearly illustrated in Figure 4-1 which contains a plot of BP pressure difference as a function Grabner measured BPP. A linear regression fit to the data is also shown in the figure, which indicates a near 0 BPP difference at 10 psia and a 1 psi difference at BPP = 20 psia. However, the coefficient-of-determination (square of the correlation coefficient) R2 = 0.5 indicates a weak correlation or more likely, significant scatter. The two small arrows in Figure 4-1 point to the two BH pre-degas BP pressures and indicate that they are not unduly biasing the result.
33
Table 4-3. Comparison of Pre-Degas TVP-95 and Grabner Degas Plant Inlet BP Pressures for BM.
BM Cavern Grabner,
psia TVP-95,
psia Difference,
psia Difference,
%
BM105 20.4 18.8 1.60 0.085
BM115 22.6 21.7 0.90 0.041
BM102 20.1 19.0 1.14 0.060
BM104 19.7 18.9 0.80 0.042
BM4 20.6 18.7 1.90 0.102
BM116 19.4 17.5 1.90 0.109
BM108 19.4 18.4 1.00 0.054
Average 20.3 19.0 1.32 0.070
2 1.11 1.29 0.47 0.028
Figure 4-1. Scatter Plot of Difference Between TVP-95 and Grabner Measured BP Pressure. Linear regression is also shown. The two small arrows point to the two BH pre-degas BP pressures and indicate that they are not unduly biasing the result.
There are several possibilities for why the Grabner and TVP-95 BPP measurements lead to apparent systematic differences in bubblepoint pressure. One is that there could be a systematic measurement error in one or both of the instruments. Another is that the systems are measuring vapor pressure accurately, but since neither can directly measure the exact point at which the first bubbles appear (the true incipient bubblepoint), the interpretations of the specific data collected by each instrument lead to a bias. Note that bubblepoint pressure is a special case of vapor pressure where gas volume is zero, but the slightest decrease in system pressure or increase in temperature from that position will create a positive, nonzero volume of gas.
y = 0.1097x - 1.038R² = 0.5091
-0.5
0.0
0.5
1.0
1.5
2.0
2.5
10 12 14 16 18 20 22 24
B
P, p
sia
Grabner BP, psia
BH Inlet
BM Inlet
BH Outlet
34
The test configuration information relevant to each systems approximation is as follows:
Grabner – a small (several mL) fixed-mass crude oil sample; flash cell is rocked during equilibration; BPP is not directly measured - it is estimated by extrapolation to zero expansion using a curve fit through 3 expansion points. Error sources are primarily the extrapolation function, the accuracy of the expansion volumes and the equilibrium assumption for the pressure measurements at each expansion.
TVP-95 – a flowing crude oil sample (10s of liters); a finite expansion volume (head space in the separator); the separator is not agitated during equilibration. Primary error sources are the finite gas volume and the assumption of steady-state equivalence to equilibrium between the flowing liquid and the fixed volume gas phases.
Assuming that the testing systems are working correctly, it is clear that the two systems are not actually measuring the same property. The Grabner estimates BPP by extrapolation to a zero expansion volume (closer to the definition of BP). The TVP-95 uses a small gas volume, relative to the total liquid flow volume, that is assumed to be close to zero volume. In other words, the TVP-95 is using the measured VP at some small “effective” expansion as an estimate of the BPP. Also, there is still a question of whether the flash process reaches true thermodynamic equilibrium between the liquid and gas phases in the TVP-95 separator. The TVP-95 BPP test conditions and the lack of agitation suggest that it is likely that the TVP-95 will under estimate the true BPP.
Sensitivity studies were used to establish equilibration times and expansion volumes inputs to the Grabner and a separate, preliminary sensitivity study ruled out the extrapolation as source of the discrepancy between the TVP-95 and Grabner BP pressures. These studies have provided a significant level of confidence in the Grabner estimated BPP pressures. Thus, the differences between Grabner and TVP-95 estimated BP pressures are likely due to the different methods employed to estimate the total vapor pressure at BPP flash conditions. Either BPP measure can be used long as they are used consistently. Future work will document these or equivalent sensitivity studies.
4.1.1 ASTM Standard
ASTM D6377-08, “Standard Test Method for Determination of Vapor Pressure of Crude Oil: VPCRx (Expansion Method)” covers the use of automated vapor pressure instruments to determine vapor pressure of a crude oil in a partial vacuum. The method is suitable for testing samples with vapor pressures between 25 kPa (3.6 psia) and 180 kPa (26 psia) at 37.8 C (100 °F) at expansion ratios from 0.02 to 4. Thus, ASTM standard is directly applicable to Grabner TVP Analyzer. The standard defines a minimal set of apparatus operating and measurement (pressure transducer, thermometer, vacuum pump, vacuum gage, etc.) requirements as well as sample handling and calibration requirements. Of importance to the VP project is a discussion of precision and bias in the measurement method that could help in further evaluations of the discrepancy between the TVP-95 and Grabner estimated BP pressures. However, the standard does not address the extrapolation of VP data to a zero expansion.
35
4.2 GOR History
GOR of SPR oils has been historically difficult to measure accurately because the volumes of gas evolved from the laboratory-scale TVP-95 samples are small, with gas flow rates commonly observed between 4 and 10 cc/min (Lord, 2006b). The situation is further complicated as the sample gas from the flash experiments is a saturated mixture, implying that any incremental increase in pressure or decrease in temperature will result in condensation, which will introduce error into the subsequent volume and compositional measurements of that gas stream. Gas lines must, therefore, be heat-traced and maintained at only incrementally higher pressure than the gas chromatograph so that the sample can be injected and analyzed properly.
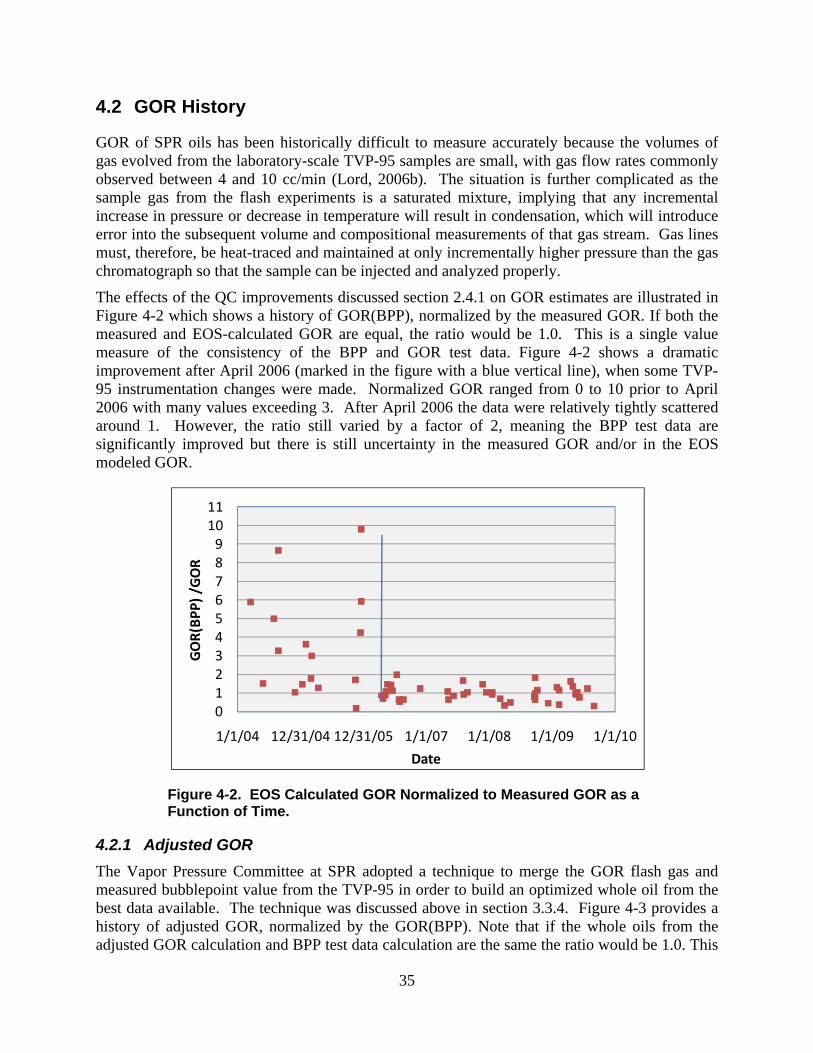
The effects of the QC improvements discussed section 2.4.1 on GOR estimates are illustrated in Figure 4-2 which shows a history of GOR(BPP), normalized by the measured GOR. If both the measured and EOS-calculated GOR are equal, the ratio would be 1.0. This is a single value measure of the consistency of the BPP and GOR test data. Figure 4-2 shows a dramatic improvement after April 2006 (marked in the figure with a blue vertical line), when some TVP-95 instrumentation changes were made. Normalized GOR ranged from 0 to 10 prior to April 2006 with many values exceeding 3. After April 2006 the data were relatively tightly scattered around 1. However, the ratio still varied by a factor of 2, meaning the BPP test data are significantly improved but there is still uncertainty in the measured GOR and/or in the EOS modeled GOR.
Figure 4-2. EOS Calculated GOR Normalized to Measured GOR as a Function of Time.
4.2.1 Adjusted GOR
The Vapor Pressure Committee at SPR adopted a technique to merge the GOR flash gas and measured bubblepoint value from the TVP-95 in order to build an optimized whole oil from the best data available. The technique was discussed above in section 3.3.4. Figure 4-3 provides a history of adjusted GOR, normalized by the GOR(BPP). Note that if the whole oils from the adjusted GOR calculation and BPP test data calculation are the same the ratio would be 1.0. This
01234567891011
1/1/04 12/31/04 12/31/05 1/1/07 1/1/08 1/1/09 1/1/10
GOR(BPP) /G
OR
Date
36
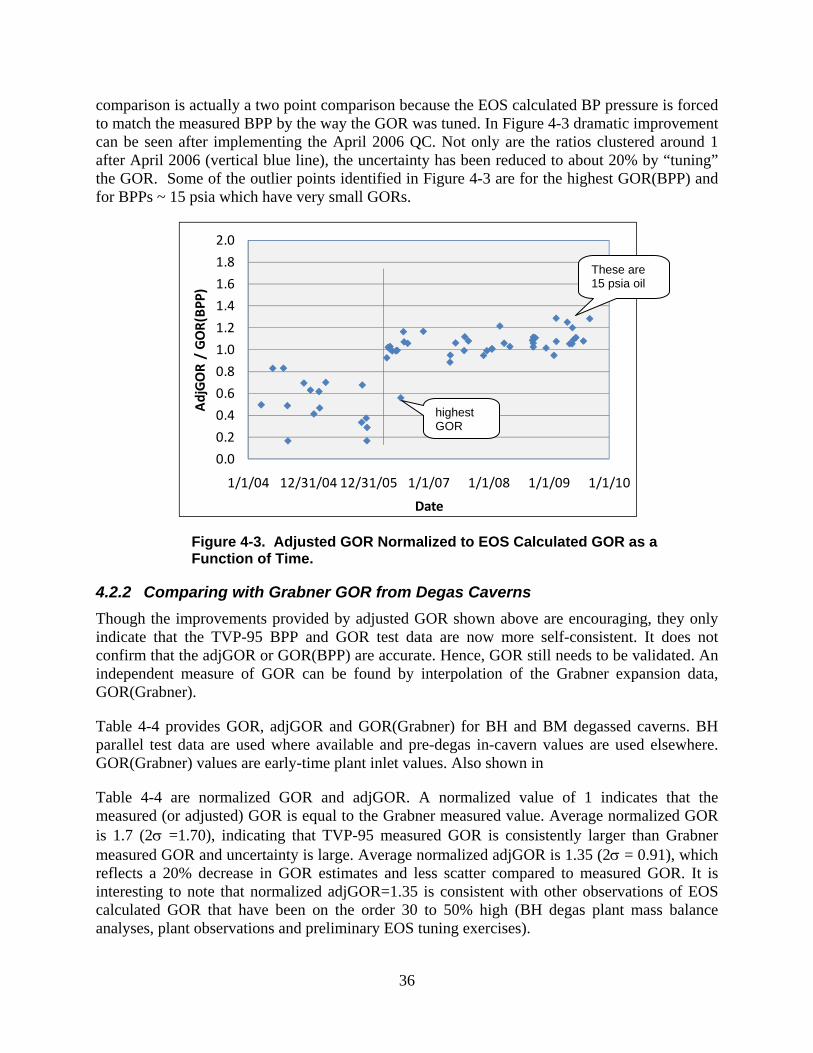
comparison is actually a two point comparison because the EOS calculated BP pressure is forced to match the measured BPP by the way the GOR was tuned. In Figure 4-3 dramatic improvement can be seen after implementing the April 2006 QC. Not only are the ratios clustered around 1 after April 2006 (vertical blue line), the uncertainty has been reduced to about 20% by “tuning” the GOR. Some of the outlier points identified in Figure 4-3 are for the highest GOR(BPP) and for BPPs ~ 15 psia which have very small GORs.
Figure 4-3. Adjusted GOR Normalized to EOS Calculated GOR as a Function of Time.
4.2.2 Comparing with Grabner GOR from Degas Caverns
Though the improvements provided by adjusted GOR shown above are encouraging, they only indicate that the TVP-95 BPP and GOR test data are now more self-consistent. It does not confirm that the adjGOR or GOR(BPP) are accurate. Hence, GOR still needs to be validated. An independent measure of GOR can be found by interpolation of the Grabner expansion data, GOR(Grabner).
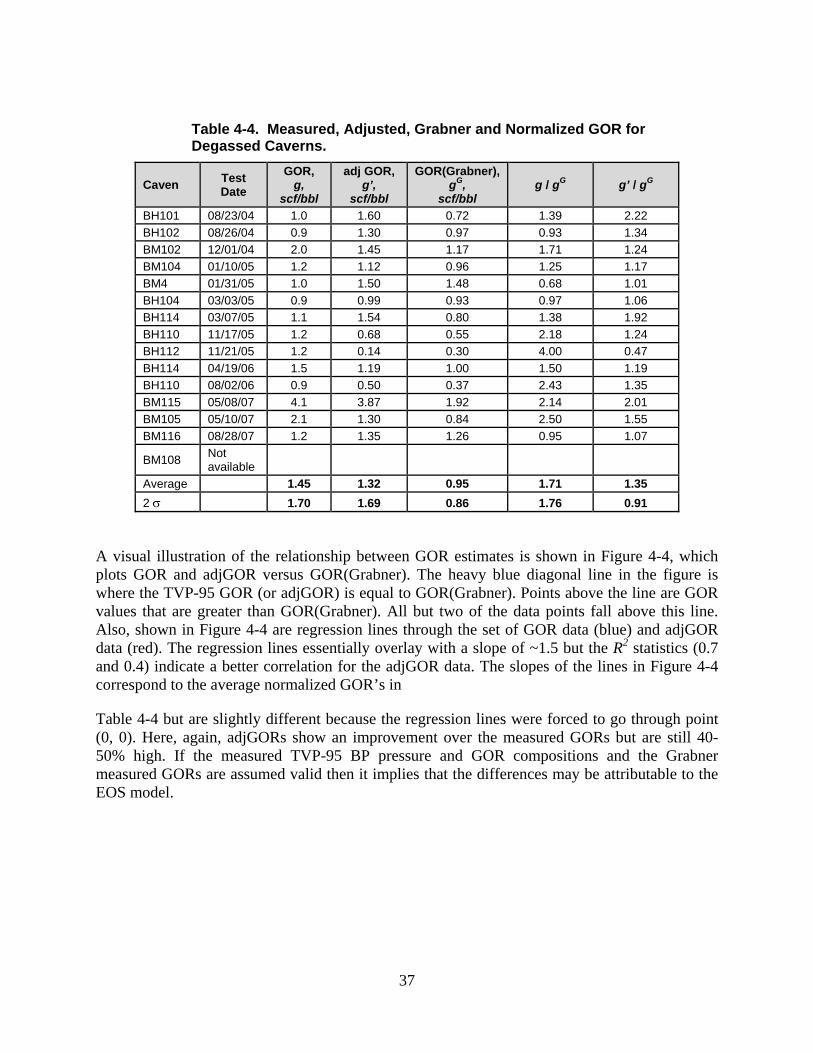
Table 4-4 provides GOR, adjGOR and GOR(Grabner) for BH and BM degassed caverns. BH parallel test data are used where available and pre-degas in-cavern values are used elsewhere. GOR(Grabner) values are early-time plant inlet values. Also shown in
Table 4-4 are normalized GOR and adjGOR. A normalized value of 1 indicates that the measured (or adjusted) GOR is equal to the Grabner measured value. Average normalized GOR is 1.7 (2 =1.70), indicating that TVP-95 measured GOR is consistently larger than Grabner measured GOR and uncertainty is large. Average normalized adjGOR is 1.35 (2 = 0.91), which reflects a 20% decrease in GOR estimates and less scatter compared to measured GOR. It is interesting to note that normalized adjGOR=1.35 is consistent with other observations of EOS calculated GOR that have been on the order 30 to 50% high (BH degas plant mass balance analyses, plant observations and preliminary EOS tuning exercises).
0.0
0.2
0.4
0.6
0.8
1.0
1.2
1.4
1.6
1.8
2.0
1/1/04 12/31/04 12/31/05 1/1/07 1/1/08 1/1/09 1/1/10
AdjGOR / GOR(BPP)
Date
These are 15 psia oil
highest GOR
37
Table 4-4. Measured, Adjusted, Grabner and Normalized GOR for Degassed Caverns.
Caven Test Date
GOR, g,
scf/bbl
adj GOR, g’,
scf/bbl
GOR(Grabner),gG,
scf/bbl g / gG g’ / gG
BH101 08/23/04 1.0 1.60 0.72 1.39 2.22
BH102 08/26/04 0.9 1.30 0.97 0.93 1.34
BM102 12/01/04 2.0 1.45 1.17 1.71 1.24
BM104 01/10/05 1.2 1.12 0.96 1.25 1.17
BM4 01/31/05 1.0 1.50 1.48 0.68 1.01
BH104 03/03/05 0.9 0.99 0.93 0.97 1.06
BH114 03/07/05 1.1 1.54 0.80 1.38 1.92
BH110 11/17/05 1.2 0.68 0.55 2.18 1.24
BH112 11/21/05 1.2 0.14 0.30 4.00 0.47
BH114 04/19/06 1.5 1.19 1.00 1.50 1.19
BH110 08/02/06 0.9 0.50 0.37 2.43 1.35
BM115 05/08/07 4.1 3.87 1.92 2.14 2.01
BM105 05/10/07 2.1 1.30 0.84 2.50 1.55
BM116 08/28/07 1.2 1.35 1.26 0.95 1.07
BM108 Not available
Average 1.45 1.32 0.95 1.71 1.35
2 1.70 1.69 0.86 1.76 0.91
A visual illustration of the relationship between GOR estimates is shown in Figure 4-4, which plots GOR and adjGOR versus GOR(Grabner). The heavy blue diagonal line in the figure is where the TVP-95 GOR (or adjGOR) is equal to GOR(Grabner). Points above the line are GOR values that are greater than GOR(Grabner). All but two of the data points fall above this line. Also, shown in Figure 4-4 are regression lines through the set of GOR data (blue) and adjGOR data (red). The regression lines essentially overlay with a slope of ~1.5 but the R2 statistics (0.7 and 0.4) indicate a better correlation for the adjGOR data. The slopes of the lines in Figure 4-4 correspond to the average normalized GOR’s in
Table 4-4 but are slightly different because the regression lines were forced to go through point (0, 0). Here, again, adjGORs show an improvement over the measured GORs but are still 40-50% high. If the measured TVP-95 BP pressure and GOR compositions and the Grabner measured GORs are assumed valid then it implies that the differences may be attributable to the EOS model.

38
Figure 4-4. Measured and Adjusted GOR vs. Grabner GOR. Linear regressions are also shown.
4.3 Expansion Curve History
The previous section discussed single valued measures of the consistency of the BPP and GOR tests performed by the TVP-95. This section will expand the discussion to measurements and EOS modeling over a range of PVT space by comparing Grabner measured and EOS calculated expansion curves. An expansion curve displays the pressure-volume relationships for a crude oil at a fixed temperature, usually 100 F. A set of expansion tests performed on a crude oil for a set of temperatures (say, 90, 100 and 120 F) provides a simplified picture of the PVT surface for a crude oil over a small range of PVT space. Historically, SPR has tested crude oils at 100 °F and over the narrow pressure range of bubblepoint to 1 atmosphere. EOS models are then used to estimate PVT behavior at non-standard conditions such as at delivery (80 °F) and at the degas plant (10-12 psi and 100-120 °F). The Grabner TVP analyzer in the TVP-2000 at the degas plant has provided an opportunity for collecting PVT validation data over the range temperature and pressures seen at SPR. As will be shown later, the data can also be used for tuning the EOS model.
4.3.1 BH114 Expansion Curves
The evolution of the PVT modeling at SPR can be illustrated by the pre and post April 2006 QC expansion-curve comparisons shown in Figure 4-5 for SPR cavern BH114, which is representative of the much broader available set of pre and post April 2006 EOS calculated expansion data.
In Figure 4-5, the two upper plots (a, b) represent EOS expansions based on TVP-95 data (a)
y = 1.4901xR² = 0.3994
y = 1.4433xR² = 0.7087
0
1
2
3
4
5
0 1 2 3 4 5
GOR, scf/bbl
Grabner GOR, scf/bbl
Measured GOR
Adjusted GOR
39
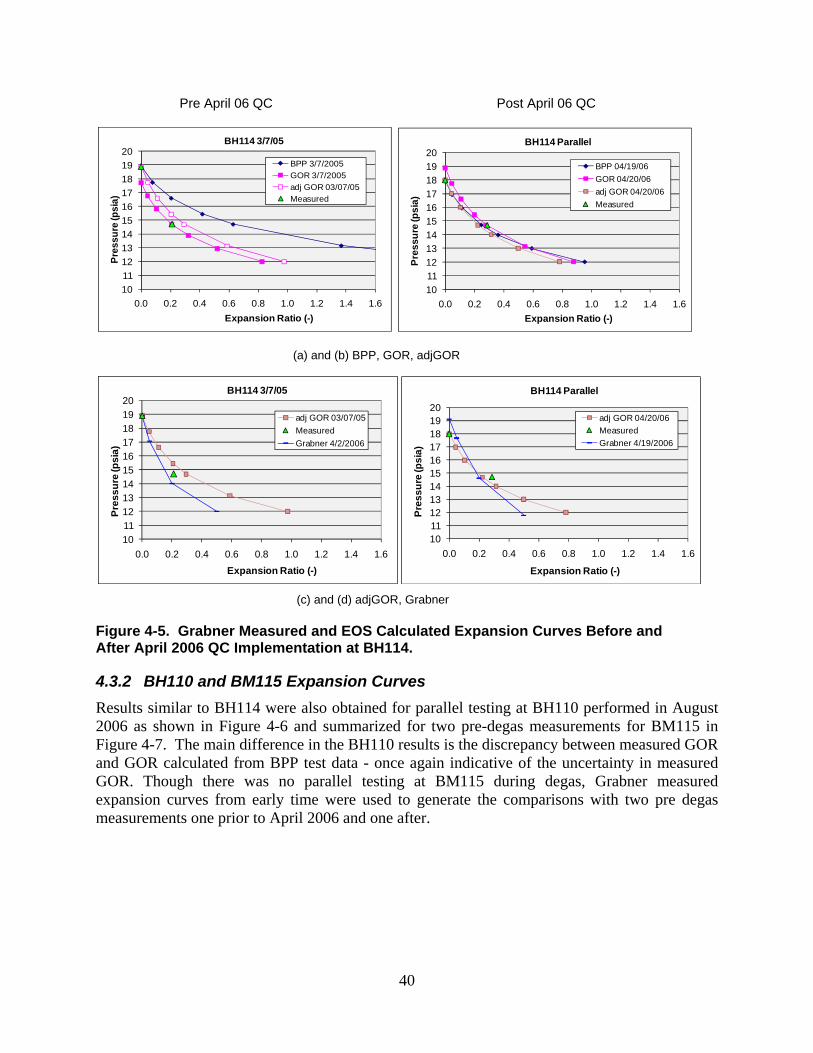
prior to degassing BH114 and (b) during parallel testing at BH114 in April. Recall that the April 2006 parallel tests led to the implementation of quality controls and new test configurations that dramatically improved TVP-95 test results (section 2.4.1). EOS calculated expansion curves using TVP-95 BPP test data are shown with blue triangles, GOR test data are shown with pink squares and adjGOR are shown with rose squares. The two green triangles mark the measured BP pressure at zero expansion and the measured GOR at 14.7 psia. The separation of the three curves in Figure 4-5(a) implies that the EOS calculated significantly different whole oil compositions for the three sets of test data in spite of simulating a single oil sample. Thus, the data from the two TVP-95 tests (BPP and GOR) are inconsistent. The disagreement was found during the QC analyses to be the poor conditioning of the BPP gas and the resulting GC compositions, which contributed to the very flat BPP expansion curve. Conversely, the close overlay of the three expansion curves in Figure 4-5(b) implies good consistency between BPP and GOR test data. For the data shown in Figure 4-5(b) minimal GOR adjustment was necessary and all three GOR estimates are very similar.
The convergence of curves in Figure 4-5(b) indicates considerable improvement in consistency among BPP and GOR measurements and the EOS model, though model accuracy is not confirmed by these data alone. Parallel testing with the Grabner allows for validation of the EOS model results. The second row of plots in Figure 4-5 provides a comparison of the EOS-calculated expansion-curve represented by the adjusted GOR curve (yellow diamonds) from Figure 4-5(a) and (b) with the Grabner measured expansion curve (blue minus sign). The comparison shows that the EOS calculated expansion curves predict significantly larger gas volumes at a given pressure than the Grabner measured expansion curve and the difference between measured and calculated increases with decreasing vapor pressure. For interpretation the EOS calculated expansion curve in Figure 4-5(d) should be shifted up so BPPs match, which is consistent with the TVP-95 versus Grabner BPP measurement discussion in section 4.1.
40
Pre April 06 QC Post April 06 QC
(a) and (b) BPP, GOR, adjGOR
(c) and (d) adjGOR, Grabner
Figure 4-5. Grabner Measured and EOS Calculated Expansion Curves Before and After April 2006 QC Implementation at BH114.
4.3.2 BH110 and BM115 Expansion Curves
Results similar to BH114 were also obtained for parallel testing at BH110 performed in August 2006 as shown in Figure 4-6 and summarized for two pre-degas measurements for BM115 in Figure 4-7. The main difference in the BH110 results is the discrepancy between measured GOR and GOR calculated from BPP test data - once again indicative of the uncertainty in measured GOR. Though there was no parallel testing at BM115 during degas, Grabner measured expansion curves from early time were used to generate the comparisons with two pre degas measurements one prior to April 2006 and one after.
10
11
12
13
14
15
16
17
18
19
20
0.0 0.2 0.4 0.6 0.8 1.0 1.2 1.4 1.6
Pre
ssu
re (p
sia)
Expansion Ratio (-)
BH114 3/7/05
BPP 3/7/2005
GOR 3/7/2005
adj GOR 03/07/05
Measured
10
11
12
13
14
15
16
17
18
19
20
0.0 0.2 0.4 0.6 0.8 1.0 1.2 1.4 1.6
Pre
ssu
re (p
sia
)
Expansion Ratio (-)
BH114 Parallel
BPP 04/19/06
GOR 04/20/06
adj GOR 04/20/06
Measured
10
11
12
13
14
15
16
17
18
19
20
0.0 0.2 0.4 0.6 0.8 1.0 1.2 1.4 1.6
Pre
ss
ure
(ps
ia)
Expansion Ratio (-)
BH114 3/7/05
adj GOR 03/07/05
Measured
Grabner 4/2/2006
1011121314151617181920
0.0 0.2 0.4 0.6 0.8 1.0 1.2 1.4 1.6
Pre
ss
ure
(ps
ia)
Expansion Ratio (-)
BH114 Parallel
adj GOR 04/20/06
Measured
Grabner 4/19/2006

41
Pre April 06 QC Post April 06 QC
(a) and (b) BPP, GOR, adjGOR
(c) and (d) adjGOR, Grabner
Figure 4-6. Grabner Measured and EOS Calculated Expansion Curves Before and After April 2006 for BH110.
(a) Pre April 06 QC (b) Post April 06 QC
Figure 4-7. EOS Calculated GOR and BPP Expansion Curves Before and after April 2006 for BM115.
10
11
12
13
14
15
16
17
18
19
0 0.2 0.4 0.6 0.8 1
Pre
ss
ure
(ps
ia)
Expansion Ratio (-)
BH110 11/17/05
BPP 11/17/05GOR 11/17/05adj GOR 11/17/05Measured
10
11
12
13
14
15
16
17
18
19
0 0.2 0.4 0.6 0.8 1
Pre
ssu
re (p
sia
)
Expansion Ratio (-)
BH110 Parallel
BPP 08/02/06
GOR 08/02/06
adj GOR 08/02/06
Measured
10
11
12
13
14
15
16
17
18
19
0 0.2 0.4 0.6 0.8 1
Pre
ss
ure
(ps
ia)
Expansion Ratio (-)
BH110 11/17/05
adj GOR 11/17/05
Measured
Grabner 6/29/2006
10
11
12
13
14
15
16
17
0.0 0.2 0.4 0.6 0.8 1.0
Pre
ss
ure
(ps
ia)
Expansion Ratio (-)
BH110 Parallel
adj GOR 08/02/06
Measured
Grabner 8/2/2006
10
12
14
16
18
20
22
24
0
0.5 1
1.5 2
2.5 3
Pre
ssu
re, (
psi
a)
Expansion Ratio (-)
BM115 4/11/05
BPP 04/11/05
GOR 04/11/05
adj GOR 04/11/05
Measured
Grabner 12/9/2007
10
12
14
16
18
20
22
24
0
0.5 1
1.5 2
2.5 3
Pre
ss
ure
, (p
sia
)
Expansion Ratio (-)
BM115 5/8/07
BPP 5/8/2007GOR 5/8/2007adj GOR 05/08/07Measured Grabner 12/9/2007
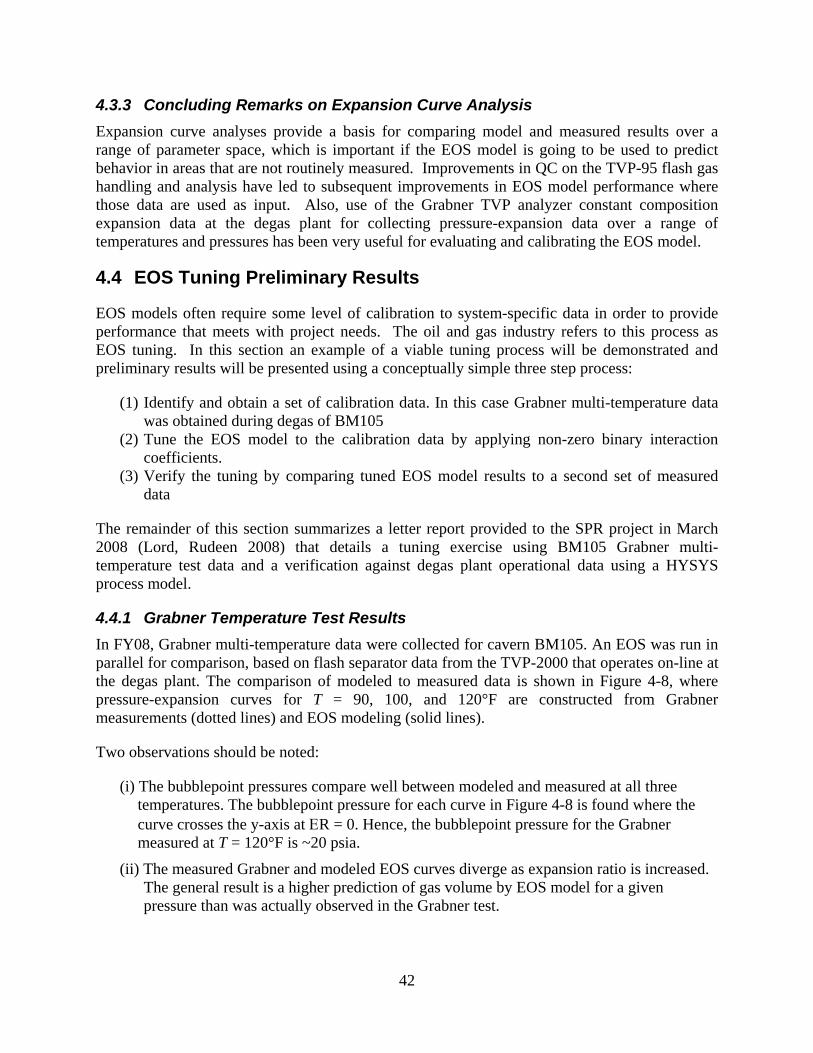
42
4.3.3 Concluding Remarks on Expansion Curve Analysis
Expansion curve analyses provide a basis for comparing model and measured results over a range of parameter space, which is important if the EOS model is going to be used to predict behavior in areas that are not routinely measured. Improvements in QC on the TVP-95 flash gas handling and analysis have led to subsequent improvements in EOS model performance where those data are used as input. Also, use of the Grabner TVP analyzer constant composition expansion data at the degas plant for collecting pressure-expansion data over a range of temperatures and pressures has been very useful for evaluating and calibrating the EOS model.
4.4 EOS Tuning Preliminary Results
EOS models often require some level of calibration to system-specific data in order to provide performance that meets with project needs. The oil and gas industry refers to this process as EOS tuning. In this section an example of a viable tuning process will be demonstrated and preliminary results will be presented using a conceptually simple three step process:
(1) Identify and obtain a set of calibration data. In this case Grabner multi-temperature data was obtained during degas of BM105
(2) Tune the EOS model to the calibration data by applying non-zero binary interaction coefficients.
(3) Verify the tuning by comparing tuned EOS model results to a second set of measured data
The remainder of this section summarizes a letter report provided to the SPR project in March 2008 (Lord, Rudeen 2008) that details a tuning exercise using BM105 Grabner multi-temperature test data and a verification against degas plant operational data using a HYSYS process model.
4.4.1 Grabner Temperature Test Results
In FY08, Grabner multi-temperature data were collected for cavern BM105. An EOS was run in parallel for comparison, based on flash separator data from the TVP-2000 that operates on-line at the degas plant. The comparison of modeled to measured data is shown in Figure 4-8, where pressure-expansion curves for T = 90, 100, and 120°F are constructed from Grabner measurements (dotted lines) and EOS modeling (solid lines).
Two observations should be noted:
(i) The bubblepoint pressures compare well between modeled and measured at all three temperatures. The bubblepoint pressure for each curve in Figure 4-8 is found where the curve crosses the y-axis at R = 0. Hence, the bubblepoint pressure for the Grabner measured at T = 120°F is ~20 psia.
(ii) The measured Grabner and modeled EOS curves diverge as expansion ratio is increased. The general result is a higher prediction of gas volume by EOS model for a given pressure than was actually observed in the Grabner test.
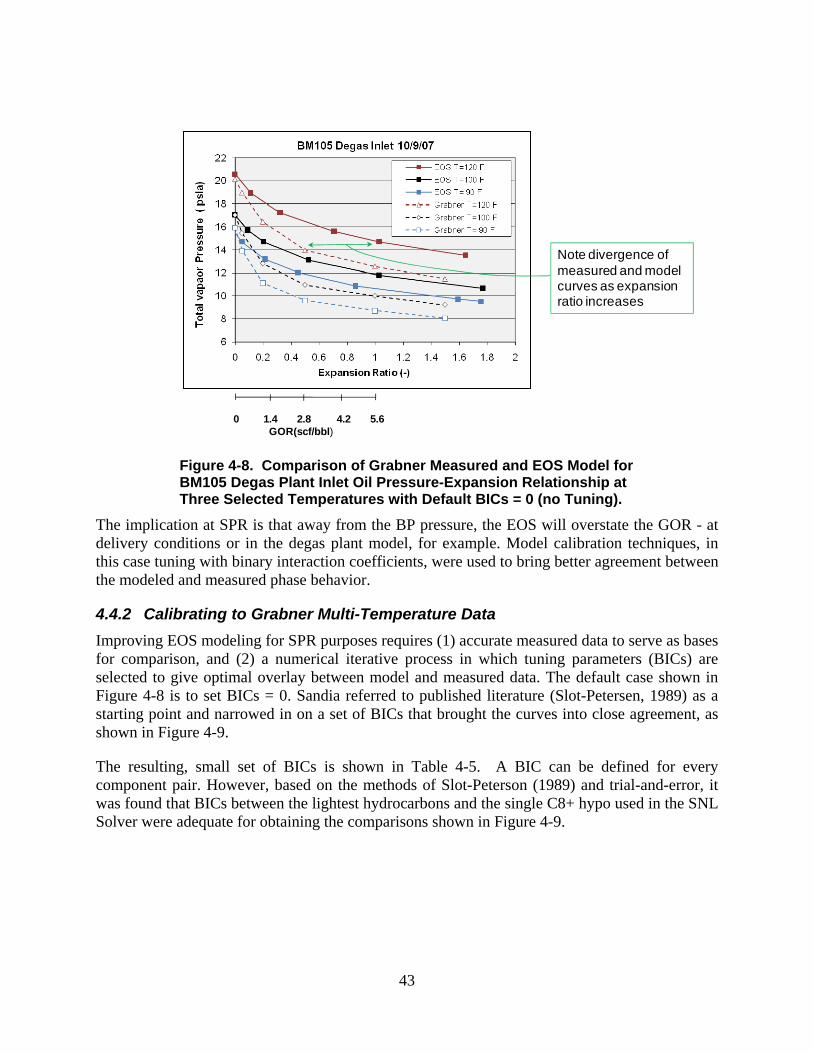
43
Figure 4-8. Comparison of Grabner Measured and EOS Model for BM105 Degas Plant Inlet Oil Pressure-Expansion Relationship at Three Selected Temperatures with Default BICs = 0 (no Tuning).
The implication at SPR is that away from the BP pressure, the EOS will overstate the GOR - at delivery conditions or in the degas plant model, for example. Model calibration techniques, in this case tuning with binary interaction coefficients, were used to bring better agreement between the modeled and measured phase behavior.
4.4.2 Calibrating to Grabner Multi-Temperature Data
Improving EOS modeling for SPR purposes requires (1) accurate measured data to serve as bases for comparison, and (2) a numerical iterative process in which tuning parameters (BICs) are selected to give optimal overlay between model and measured data. The default case shown in Figure 4-8 is to set BICs = 0. Sandia referred to published literature (Slot-Petersen, 1989) as a starting point and narrowed in on a set of BICs that brought the curves into close agreement, as shown in Figure 4-9.
The resulting, small set of BICs is shown in Table 4-5. A BIC can be defined for every component pair. However, based on the methods of Slot-Peterson (1989) and trial-and-error, it was found that BICs between the lightest hydrocarbons and the single C8+ hypo used in the SNL Solver were adequate for obtaining the comparisons shown in Figure 4-9.
0 1.4 2.8 4.2 5.6GOR(scf/bbl)
Note divergence of measured and model curves as expansion ratio increases

44
Figure 4-9. Comparison of Grabner Measured and EOS Model for BM105 Degas Plant Inlet Oil Pressure-Expansion Relationship at Three Selected Temperatures with BICs Tuned for Optimal Fit.
Table 4-5. BICs Resulting from Calibrating to BM105 Grabner Multi-Temperature Data.
Component Pair BIC
(C1, C8+) 0.5
(C2, C8+) 0.3
all others 0.0
4.4.3 Verification of Calibrated EOS Model Against Degas Plant Data
The final step in the calibration of the EOS model is verification against a second set of measured data. For this example, SPR degas plant operations data are used as a basis for comparison with model results. Both the un-calibrated and calibrated EOS models were implemented in a HYSYS process model of the degas plant. A comparison between the model and measured plant operations is provided in Table 4-6, which lists two key whole-oil parameters BPP and GOR and three key plant performance parameters: C3 (propane) recovery, (degassed) product VP, and plant fuel rate.
The plant performance parameters are defined as follows:
C3 recovery (%) – Ratio of mole % propane in plant outlet stream to mole % propane in plant inlet stream. The objective of degasification is to remove the low-value dissolved gases such as nitrogen, methane, and ethane to sufficiently lower the bubblepoint
6
8
10
12
14
16
18
20
22
0 0.2 0.4 0.6 0.8 1 1.2 1.4 1.6 1.8 2
To
tal
Vap
or
Pre
ssu
re,
psi
a
Expansion Ratio (-)
BM105 Degas Inlet 10/9/07
EOS, T = 120F
EOS, T = 100F
EOS, T = 90F
Grabner, T = 120F
Grabner, T = 100F
Grabner, T = 90F
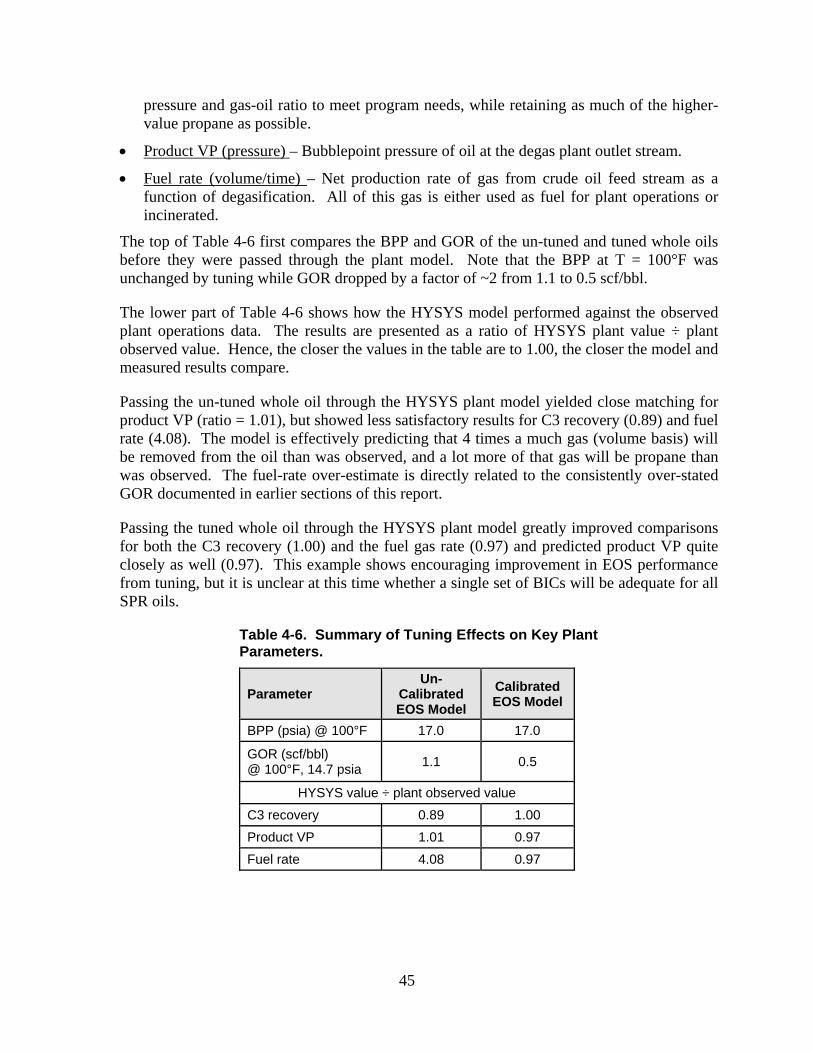
45
pressure and gas-oil ratio to meet program needs, while retaining as much of the higher-value propane as possible.
Product VP (pressure) – Bubblepoint pressure of oil at the degas plant outlet stream.
Fuel rate (volume/time) – Net production rate of gas from crude oil feed stream as a function of degasification. All of this gas is either used as fuel for plant operations or incinerated.
The top of Table 4-6 first compares the BPP and GOR of the un-tuned and tuned whole oils before they were passed through the plant model. Note that the BPP at T = 100°F was unchanged by tuning while GOR dropped by a factor of ~2 from 1.1 to 0.5 scf/bbl.
The lower part of Table 4-6 shows how the HYSYS model performed against the observed plant operations data. The results are presented as a ratio of HYSYS plant value ÷ plant observed value. Hence, the closer the values in the table are to 1.00, the closer the model and measured results compare.
Passing the un-tuned whole oil through the HYSYS plant model yielded close matching for product VP (ratio = 1.01), but showed less satisfactory results for C3 recovery (0.89) and fuel rate (4.08). The model is effectively predicting that 4 times a much gas (volume basis) will be removed from the oil than was observed, and a lot more of that gas will be propane than was observed. The fuel-rate over-estimate is directly related to the consistently over-stated GOR documented in earlier sections of this report.
Passing the tuned whole oil through the HYSYS plant model greatly improved comparisons for both the C3 recovery (1.00) and the fuel gas rate (0.97) and predicted product VP quite closely as well (0.97). This example shows encouraging improvement in EOS performance from tuning, but it is unclear at this time whether a single set of BICs will be adequate for all SPR oils.
Table 4-6. Summary of Tuning Effects on Key Plant Parameters.
Parameter Un-
Calibrated EOS Model
Calibrated EOS Model
BPP (psia) @ 100°F 17.0 17.0
GOR (scf/bbl) @ 100°F, 14.7 psia
1.1 0.5
HYSYS value ÷ plant observed value
C3 recovery 0.89 1.00
Product VP 1.01 0.97
Fuel rate 4.08 0.97
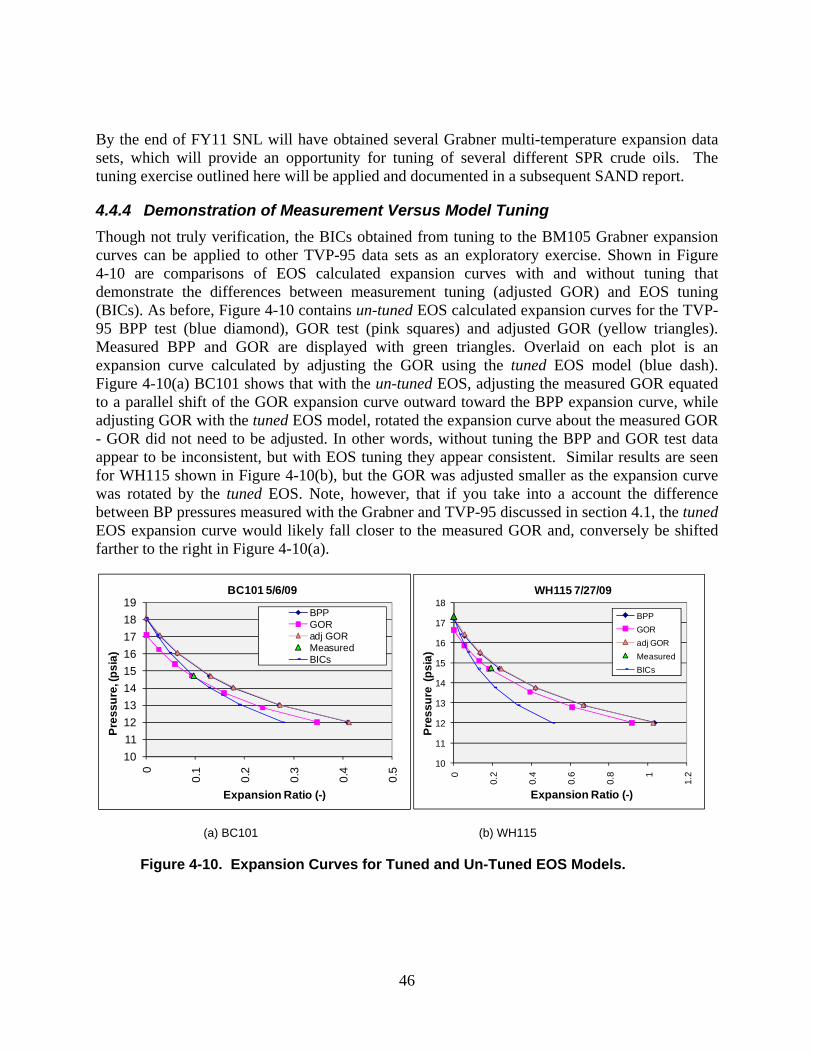
46
By the end of FY11 SNL will have obtained several Grabner multi-temperature expansion data sets, which will provide an opportunity for tuning of several different SPR crude oils. The tuning exercise outlined here will be applied and documented in a subsequent SAND report.
4.4.4 Demonstration of Measurement Versus Model Tuning
Though not truly verification, the BICs obtained from tuning to the BM105 Grabner expansion curves can be applied to other TVP-95 data sets as an exploratory exercise. Shown in Figure 4-10 are comparisons of EOS calculated expansion curves with and without tuning that demonstrate the differences between measurement tuning (adjusted GOR) and EOS tuning (BICs). As before, Figure 4-10 contains un-tuned EOS calculated expansion curves for the TVP-95 BPP test (blue diamond), GOR test (pink squares) and adjusted GOR (yellow triangles). Measured BPP and GOR are displayed with green triangles. Overlaid on each plot is an expansion curve calculated by adjusting the GOR using the tuned EOS model (blue dash). Figure 4-10(a) BC101 shows that with the un-tuned EOS, adjusting the measured GOR equated to a parallel shift of the GOR expansion curve outward toward the BPP expansion curve, while adjusting GOR with the tuned EOS model, rotated the expansion curve about the measured GOR - GOR did not need to be adjusted. In other words, without tuning the BPP and GOR test data appear to be inconsistent, but with EOS tuning they appear consistent. Similar results are seen for WH115 shown in Figure 4-10(b), but the GOR was adjusted smaller as the expansion curve was rotated by the tuned EOS. Note, however, that if you take into a account the difference between BP pressures measured with the Grabner and TVP-95 discussed in section 4.1, the tuned EOS expansion curve would likely fall closer to the measured GOR and, conversely be shifted farther to the right in Figure 4-10(a).
(a) BC101 (b) WH115
Figure 4-10. Expansion Curves for Tuned and Un-Tuned EOS Models.
10
11
12
13
14
15
16
17
18
19
0
0.1
0.2
0.3
0.4
0.5
Pre
ss
ure
, (p
sia
)
Expansion Ratio (-)
BC101 5/6/09
BPPGORadj GORMeasured BICs
10
11
12
13
14
15
16
17
18
0
0.2
0.4
0.6
0.8 1
1.2
Pre
ss
ure
(p
sia
)
Expansion Ratio (-)
WH115 7/27/09
BPP
GOR
adj GOR
Measured
BICs

47
5 Summary
This report summarizes the progress in SPR equation of state model development during the period 2004-2009. Significant improvements in model performance have been observed, and these are largely due to improved quality control on measurements that provide input data to the models. Many of the improvements are realized as reduced scatter in model output. These tighter distributions revealed that the model does a very good job of predicting bubblepoint pressure in SPR applications, but shows a bias for over-predicting flash gas volume at pressures lower than the bubblepoint. The crude oil equation of state typically requires some degree of tuning to calibrate the model to the specific application, and the SPR model has not yet been tuned for production calculations. The availability of degas operations data has allowed for some preliminary model tuning. The first results appear promising, but require further development with a broader body of data in order to test the applicability across the SPR complex.
5.1 Path Forward
The ultimate goal of this work is to provide a tuned equation of state model to SPR that offers improved performance over what is currently available so that project management may operate with increased confidence and less risk around crude oil vapor pressure issues. As demonstrated in the project history, accurate measurements on relevant samples provide a critical physical baseline. The EOS model can then be tuned to accurate, self-consistent data.
Sandia plans to run a model tuning exercise with a large body of Bryan Mound degasification plant operations data in the near future. The methodology will be similar to the example shown in section 4.4. One of the key open issues is how well a single set of tuning coefficients can calibrate the EOS model to a wide array of SPR oils and process environments. Note that EOS models require that any oils that are commingled have the same tuning coefficients. Since there are two streams (sweet, sour) at Bryan Mound, there can be, at most, 2 sets of tuning coefficients that apply to all Bryan Mound oils.
It is difficult to use the degas plant data alone to tune the EOS model because the plant is a complex system that enters many more variables into the process than are explicitly modeled. The risk in tuning the EOS model to the plant operations alone is that the tuning may be accounting for a host of uncertainties in process details, measurements, and model assumptions that may not apply beyond the degas plant simulations.
5.2 Calibration Measurements
There are some data that could be obtained specifically for the purpose of EOS tuning that would facilitate the tuning process. Sandia is developing test plans that will be passed through the Vapor Pressure Committee. Test plan concepts are listed briefly below.
Parallel at degas – Configure TVP-95 on degas plant inlet and outlet streams on selected caverns in order to collect parallel data with Grabner TVP analyzer to simultaneously provide EOS input (TVP-95 compositions) and pressure-expansion points (Grabner).

48
Welker bottle expansions – Collect pressurized oil samples from plant inlet stream in Welker bottle and run pressure-volume-expansion tests while collecting flash gas analyses. Welker bottles have variable volume that is controlled by a piston. These tests would provide complete, self-consistent equilibrium PVT and gas composition data required to run and tune the EOS model. These tests may help reveal whether TVP-95 is reaching thermodynamic equilibrium (GOR, flash gas compositions) in the flowing cell.

49
6 References
API, 2004. “Manual of Petroleum Measurement Standards, Chapter 11—Physical Properties Data. Section 1—Temperature and Pressure Volume Correction Factors for Generalized Crude Oils, Refined Products, and Lubricating Oils,” American Petroleum Institute, Washington, DC.
ASTM D6377-08, “Standard Test Method for Determination of Vapor Pressure of Crude Oil: VPCRx (Expansion Method)”, ASTM International, West Conshohocken, PA.
Lord, D.L. 2006a. “Summary Report on April 2006 Gas Chromatograph Comparison Tests at Degas Plant,” Geotechnology & Engineering Department, Sandia National Laboratories, Albuquerque, NM.
Lord, D.L. 2006b. Memo to Lisa Eldredge, DynMcDermott Petroleum Operations “Re: Suggestions for gas flow meter range in TVP-95,” from D. Lord, Geotechnology & Engineering Department, Sandia National Laboratories, Albuquerque, NM, dated December 12, 2006.
Lord, D.L., and D.K. Rudeen, 2006. “Letter Report on Preliminary Sensitivity Study of SNL Solver to Uncertainty in Flash Gas Input Data,” Geotechnology & Engineering Department, Sandia National Laboratories, Albuquerque, NM.
Lord D.L. and D.K. Rudeen 2008. “Report on BM105 and BM115 EOS Tuning Exercise,”, Geotechnology & Engineering Department, Sandia National Laboratories, Albuquerque, NM, dated March 6, 2008
Rudeen, D.K., and D.L. Lord, 2009. Software Development Document for the 2009 Vapor Pressure Database and Equation of State Solver, SAND Report in press. Sandia National Laboratories, Albuquerque, NM.
Slot-Petersen, C. 1989. “A Systematic and Consistent Approach to Determine Binary Interaction Coefficients for the Peng-Robinson Equation of State,” SPE Reservoir Engineering, 4(4), 488-494.
U.S. DOE, 1999. “U.S. Department of Energy Strategic Petroleum Reserve Project Performance Criteria Level II,”, U.S. Department of Energy, Office of Fossil Energy, Strategic Petroleum Reserve, Washington, DC 20585.
U.S. DOE, 2005. ECP Number VA-M/O-8353 R1. “Revise Level II Vapor Pressure Criteria,” U.S. Department of Energy, Strategic Petroleum Reserve, New Orleans, LA.
Whitson, C.H. and M.R. Brule, 2000. Phase Behavior, SPE Monograph Series Volume 20, Society of Petroleum Engineers, Richardson, TX.

50
7 Glossary Bubblepoint pressure (BPP): The pressure at which gas bubbles begin to evolve from a single-phase liquid crude oil. In SPR systems, this condition may be encountered when containment pressure on a crude oil is reduced from cavern storage pressure to near atmospheric pressure, resulting in the evolution of a mixture of gases (N2, CH4, C2H6, etc., benzene, H2S). BPP will increase with geothermal heating of caverns and gas intrusion into cavern oil. Units: psia
Degas plant: A crude oil processing plant used to mitigate gassy oil, resulting in an outlet liquid crude oil stream that exhibits a bubblepoint pressure several psi lower than the inlet stream. The primary process removes light gases (nitrogen, methane, ethane, propane, butane, pentane) by passing the crude oil through a pressure-controlled gas-liquid separator and incinerating the off-gas. The plant is portable and is moved to each SPR site according to needs defined by the Vapor Pressure Committee.
DynMcDermott Petroleum Operations: Maintenance and operations contractor to the U.S. Strategic Petroleum Reserve.
Equation-of-state model (EOS): Model used to predict phase behavior of crude oil based on thermodynamic principles. EOS model output includes BPP and GOR of crude oils as a function of temperature and pressure. EOS models underlie all deliverability forecasting at SPR and are embedded in the HYSYS degas plant process simulator. EOS models are also used to build whole oil compositions for each cavern based on TVP-95 vapor pressure, GOR, and flash experiments. The Soave-Redlich-Kwong (SRK) version of the cubic EOS is used by the VP project to model two phase vapor/liquid equilibrium problems. The SRK EOS is implemented in Microsoft Excel using spreadsheet functions and Visual Basic macros as part of the VP database and as a standalone FORTRAN MS Windows program called D2EOS.
Gas-oil ratio (GOR): The volume (standard cubic feet) of gas evolved (N2, CH4, C2H6, etc., benzene, H2S) per barrel of liquid oil at selected conditions, usually evaluated at atmospheric pressure. GOR is zero for oils contained at pressure greater than their bubble-point pressure. GOR is positive and nonzero for oils contained at pressure below their bubble-point pressure. GOR value will increase with geothermal heating of caverns and gas intrusion into cavern oil. A standardized GOR is measured at 100 F and reported at 60 F. Units: scf/bbl
Grabner: The Grabner TVP Analyzer, abbreviated sometimes as the Grabner, refers to a test cell that measures the pressure of a fixed-mass, two-phase crude oil sample as a function of controlled volume and temperature. The test sequence creates points in pressure-volume-temperature (PVT) space that can be used for curve-fitting to determine bubblepoint pressure and gas-oil ratio.
H2S scavenging: One mitigation strategy used to minimize risk of worker exposure to hydrogen sulfide (H2S) in crude oil emissions is to add an H2S scavenger to the crude stream when it is sent to various delivery points, including external customers. The H2S scavenger is a liquid that is injected into an oil delivery stream on SPR property that chemically binds with the H2S in the oil and reduces downstream H2S emissions to below federal occupational safety and health administration (OSHA) exposure limits.
51
HYSYS: Commercial software contracted from AspenTech that simulates oil and gas physical behavior in the SPR process environment. SPR has HYSYS models of each SPR site and the degasification plant. The models are used to predict the properties of oil and gas streams (i.e., phase behavior) as well as optimize plant performance.
Parallel testing: A test configuration in which the TVP-95 and TVP-2000 instrument systems are run side-by-side using flowing source oil from the same stream, typically at the degas plant.
Pencor: Oilfield services contractor that collects and analyzes crude oil samples for the vapor pressure program at SPR. Pencor owns and operates the TVP-95 instrument that is used to analyze all cavern oil samples for vapor pressure, GOR, and flash analysis.
Pencor reports: Pencor sampling results are reported in Excel workbooks containing a cover letter summary, BPP test data and plot, BPP gas chromatography results, GOR test data and plot and GOR gas chromatography results. Reports are delivered to Collins Lanier of DM, who maintains a library of test reports and distributes them to the project. A set of Pencor reports is also stored in the SNL SPR digital library maintained by Sam Wallace. The report naming convention is: SSNNN-yy-mm-dd-comment-nnnn-nnnnnnnnnn.xls, where SS is site abbreviation (BC, BH, BM, WH), NNN is cavern number, yy-mm-dd is the date of sampling event, comment is an abbreviated test comment (DH=downhole sample; F=flowing sample; UP = unpressurized test; C30+= C30+ compositional analysis; the remainder is Pencor coding).
Red-yellow-green (RYG) charts: Quarterly SPR program planning tool that presents status of crude oil deliverability on site/stream basis against program published emissions criteria. The chart looks forward 3 years from date of publication. Results are color coded in green (OK for delivery), yellow (OK with H2S scavenging), or red (not OK for delivery).
Regain (also called vapor pressure regain): Term used within SPR program for the rate-of-change in cavern representative BP pressure in units of psi/yr. It is determined from linear regression analysis of measured BPP as a function of time. Historically, this change in BP pressure was thought to be caused by in the influx of volatile gases from the surrounding host salt, primarily methane with small amounts of nitrogen, ethane, propane and butane. This interpretation was influenced by the large quantities of gas produced during cavern development by leaching. As both the quantity and quality of VP data increased with time, apparent regain rates have been reduce to essentially zero except for a few isolated caverns. Because of the method used, calculated regain rates also include the effects of compositional changes due to oil movements in and out of the caverns. New incoming 18 psi oil when mixed in a cavern with a 15 psi degassed oil will result in a oil with an intermediate BP pressure. Much of the current apparent regain is significantly influenced by these oil movements. The regression calculated regain rates also contain sampling errors because the data is obtained from very small samples located at single locations within very large caverns.
Stream: At SPR, the term “stream” implies commingled crude oil, originating from one or more caverns at a given SPR site that is intended for delivery to market. For vapor pressure program planning purposes, streams are built nominally from volume-weighted averages of all sweet or all sour caverns at a given site. Each site has a sweet stream and a sour stream that has a set of published properties and assay data that are used in negotiating sales.
52
Sweet and sour crude oils: Sweet and sour crude oil designations specific to SPR refer to allowable total sulfur limits in the crude stream. Sweet oil must have less than 0.5 mass % total sulfur, and sour oil must have less than 2.0 mass % total sulfur. Sweet and sour oils are not commingled at SPR, hence they are stored, marketed and transported separately.
TVP-2000: A crude oil measurement system (gas-liquid separator, constant mass expansion tool (Grabner), gas chromatograph, and data loggers) that obtains phase behavior and compositional data, co-located with the degas plant. The TVP-2000 is used to monitor the BP pressures and flash gas compositions of the inlet and outlet streams of the degas plant for monitoring and tuning degas plant operations. The flash chamber is typically run at ~120° F and 15 psia in order to produce sufficient gas for volume flow rate determination and proper GC operations.
TVP-95: A portable set of vapor pressure VP test equipment (flash chamber, gas-liquid separator, gas chromatograph, measurement transducers and data loggers), housed in a trailer and operated by Pencor Laboratory for the SPR program. The TVP-95 is used by the SPR to measure vapor pressure and flash gas compositions of oil samples taken from SPR caverns on a semi-regular scheduled basis. The data are primarily used to establish a baseline BP pressure, corresponding GOR, flash gas composition, and vapor pressure regain rates from historical data. Typically, two tests are run for a sampling event: (1) a BPP pressure test where flash conditions are T=100° F, gas phase volume is small, and pressure is measured and (2) a GOR test where T=100° F, P = 14.7 psia and gas volume is measured. Flash is actually performed using flowing samples so volumes are actually fluxes (volume-rates).
Vapor pressure database: Also called quarterly vapor pressure spreadsheets. The VP database is a set of four Microsoft Excel workbooks, one for each SPR site, and a set of utilities programmed with Visual Basic macros. Each site workbook contains a worksheet for each cavern at the site and each cavern worksheet contains a column of data for each sampling/test event for the cavern. A column of data represents a tabulation of the data from a Pencor Report: vapor pressure test conditions (temperature, pressure and GOR), gas chromatography results (mole fractions), and a whole oil description calculated by the EOS, and VP regain rate calculated using linear regression of screened data. The VP database is updated each time a Pencor Report is received and snapshots of the database are released to the project quarterly.
The production versions of the quarterly VP database files currently reside on the SPR project server in New Orleans, which requires a SPR network account to access. On the SPR network, the files can be accessed by running the KONFIG application. Data are organized in folders on KONFIG, with the pathname for quarterly VP data as follows:
“SPR Project Library > Engineering > Process Analysis > Process Models > Quarterly Data”
The four current Excel vapor pressure database files can also be obtained from the DynMcDermott Operational Systems Engineering Department, as they are responsible for quarterly reporting to project management.
.
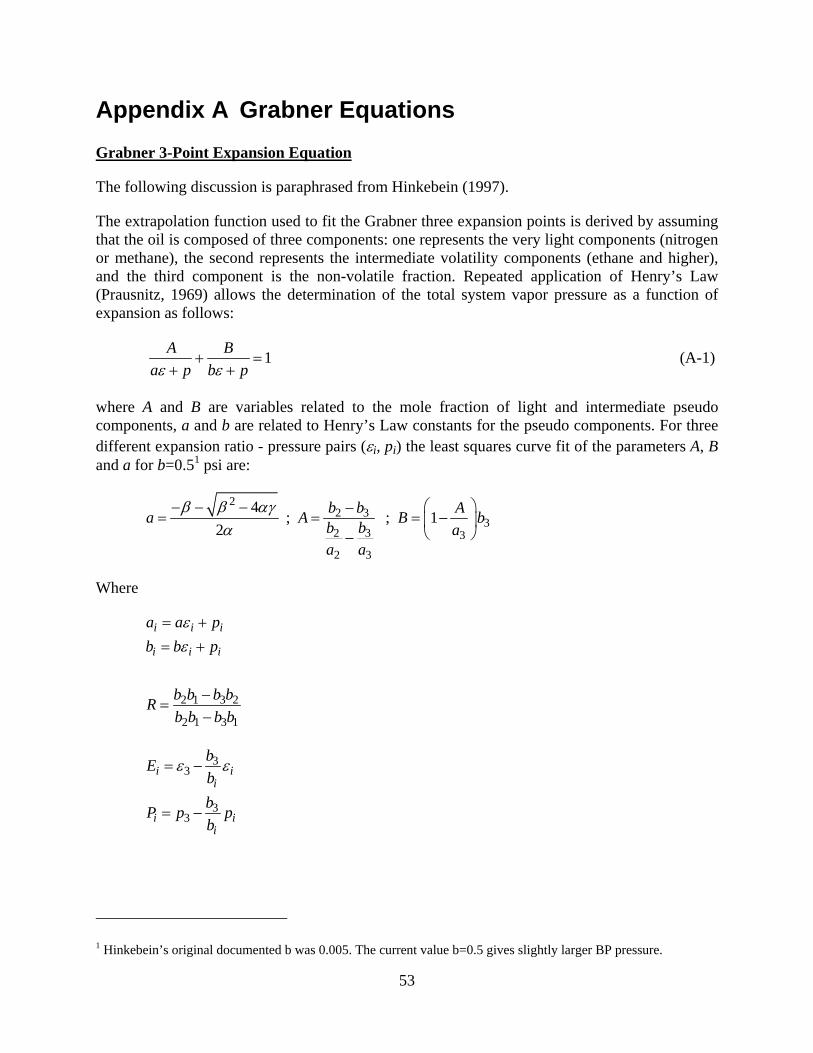
53
Appendix A Grabner Equations
Grabner 3-Point Expansion Equation
The following discussion is paraphrased from Hinkebein (1997).
The extrapolation function used to fit the Grabner three expansion points is derived by assuming that the oil is composed of three components: one represents the very light components (nitrogen or methane), the second represents the intermediate volatility components (ethane and higher), and the third component is the non-volatile fraction. Repeated application of Henry’s Law (Prausnitz, 1969) allows the determination of the total system vapor pressure as a function of expansion as follows:
1A B
a p b p
(A-1)
where A and B are variables related to the mole fraction of light and intermediate pseudo components, a and b are related to Henry’s Law constants for the pseudo components. For three different expansion ratio - pressure pairs (i, pi) the least squares curve fit of the parameters A, B and a for b=0.51 psi are:
22 3
332 3
2 3
4 ; ; 1
2
b b Aa A B b
bb aa a
Where
2 1 3 2
2 1 3 1
i i i
i i i
a a p
b b p
b b b bR
b b b b
33
33
i ii
i ii
bE
b
bP p p
b
1 Hinkebein’s original documented b was 0.005. The current value b=0.5 gives slightly larger BP pressure.
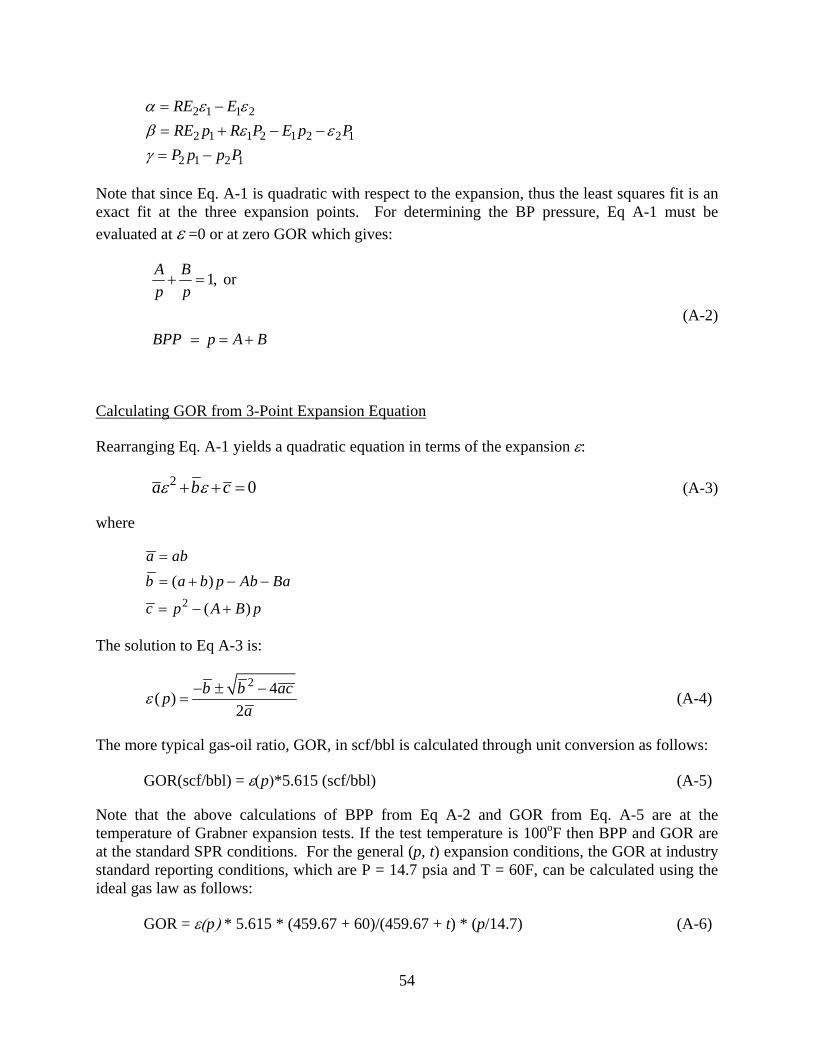
54
2 1 1 2
2 1 1 2 1 2 2 1
2 1 2 1
RE E
RE p R P E p P
P p p P
Note that since Eq. A-1 is quadratic with respect to the expansion, thus the least squares fit is an exact fit at the three expansion points. For determining the BP pressure, Eq A-1 must be
evaluated at =0 or at zero GOR which gives:
1, or
A B
p p
BPP p A B
(A-2)
Calculating GOR from 3-Point Expansion Equation
Rearranging Eq. A-1 yields a quadratic equation in terms of the expansion :
2 0a b c (A-3)
where
2
( )
( )
a ab
b a b p Ab Ba
c p A B p
The solution to Eq A-3 is:
2 4( )
2
b b acp
a
(A-4)
The more typical gas-oil ratio, GOR, in scf/bbl is calculated through unit conversion as follows:
GOR(scf/bbl) = p*5.615 (scf/bbl) (A-5)
Note that the above calculations of BPP from Eq A-2 and GOR from Eq. A-5 are at the temperature of Grabner expansion tests. If the test temperature is 100oF then BPP and GOR are at the standard SPR conditions. For the general (p, t) expansion conditions, the GOR at industry standard reporting conditions, which are P = 14.7 psia and T = 60F, can be calculated using the ideal gas law as follows:
GOR = p* 5.615 * (459.67 + 60)/(459.67 + t) * (p/14.7) (A-6)

55
DISTRIBUTION U.S. Department of Energy (electronic copy) Strategic Petroleum Reserve Project Management Office 900 Commerce Road East New Orleans, LA 70123 e-mail: [email protected] U.S. Department of Energy (3) Forrestal Building 1000 Independence Avenue, SW Washington, DC 20585 Attn: D. Johnson (FE-40) Sandia Internal (all electronic copies) Copies MS Name Org. 1 0735 J. Merson 06730 1 0706 D. Borns 06732 1 0706 S. Wallace 06732 1 0706 D. Lord 06732 1 0706 B. Ehgartner 06732 1 0706 S. Webb 06732 1 0899 Technical Library 09536

56