Embed Size (px)
Citation preview

STRATEGIC HOUSING MARKET
ASSESSMENT UPDATE
MOLE VALLEY DISTRICT COUNCIL
Cobweb Consulting
Final report
December 2020

CONTENTS
Executive summary 1
Chapter 1 Introduction 6
Chapter 2 Policy context 8
Chapter 3 Housing needs assessment 19
Chapter 4 Affordable housing needs 38
Chapter 5 Housing requirements of specific groups 62
Appendix 1 Mole Valley and the Gatwick Diamond 107

1
EXECUTIVE SUMMARY
Housing needs assessment
• Applying the current standard housing need assessment methodology leads to a housing need
of 453 dwellings per annum in Mole Valley.
• We also ran two alternative scenarios. Alternative Scenario 1 uses the approach set out in NPPG
standard methodology, apart from using the latest ONS 2018-based household projections. This
produces an estimate of housing need of 194 dwellings per annum.
• Alternative Scenario 2 applies the government’s standard national methodology as set out in its
August 2020 consultation. This produces an estimate of 563 dwellings per annum.
• Many local authorities in the South East region experience large increases in assessed need
under this proposed new algorithm. There has been considerable concern about this, and it is
likely that a decisions to ‘rebalance’ the regional approach will emerge. The Council should
monitor this to ensure it uses the most up to date methodology.
• NPPF and NPPG require that local authorities should use the standardised need assessment
methodology, drawing on MHCLG’s 2014-based household projections, to calculate the level of
housing need in their areas unless there are exceptional circumstances. No exceptional
circumstances have been identified in Mole Valley.
• The recommended breakdown of new private sector market dwellings by size is 25% one-
bedroomed units, 45% two-bedroomed units, 20% three-bedroomed units, and 10% four-
bedroomed units. It is also recommended that 25% of new completions should be in the form
of flats and apartments.
• The assessment of need figure is an important consideration in local planning, but a range of
other matters, including the requirement for affordable housing and the availability of sites for
housing will need to be considered by the Council in arriving at a decision about the target level
of new housing provision to be included in its local plan.
Affordable housing needs requirement
• The need for affordable housing differs from overall new housing need. The latter is an
assessment of the amount of additional housing stock required to cater for future household
growth, using the Government’s formula. The affordable housing requirement estimates the
total amount of affordable housing required, which could be met in a variety of ways in addition
to building more homes (for example, by the reletting of existing affordable homes when
tenants leave).
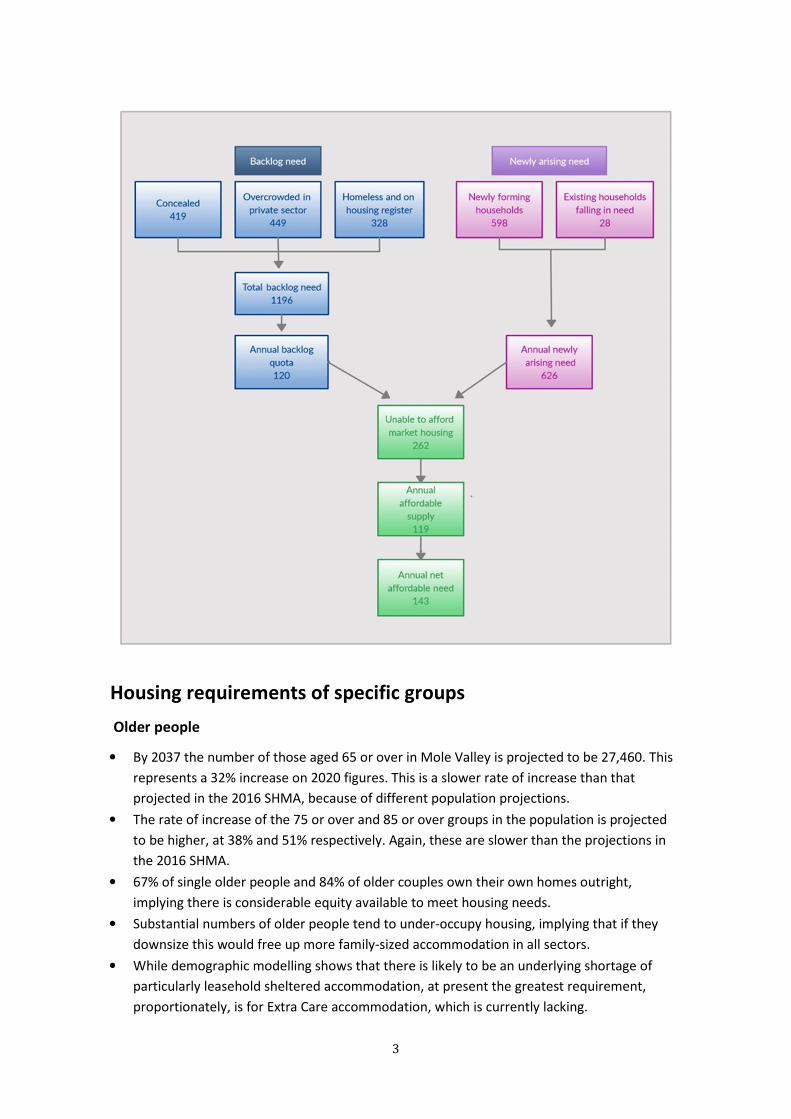
• Backlog housing need is need which exists at the start of the period for which a plan is being
prepared. It was assessed to be 1,196 households. It was assumed that backlog housing need
would be met over a ten-year period, leading to an annual quota of backlog need of 120
households.

2
• There are two additional sources of affordable housing need. The largest source is newly
forming households (598 per annum). The other is existing households not currently in need but
falling into need in the future (28 per annum).
• These three sources of need add up to an overall total of annual need of 746 households,
before taking account of the ability of these households to afford market housing.
• An estimated 262 households per annum could not afford to pay the market entry threshold
cost and therefore needed affordable housing.
• Other affordable housing thresholds were also examined. The lowest cost threshold was based
on current actual average rent levels in the social rented sector. 68 households per annum
could not afford these rents (the estimates of incomes include housing benefits) suggesting that
the housing benefit system is not helping all households to fully meet their housing costs, and
that some low income households will need to spend a higher proportion of their income on
housing than assumed.
• 52 households could afford a social rent, and a rent up to 59% of the lower quartile private rent.
They would therefore require social rented housing at or slightly above current social rent
levels.
• The next threshold was set at 60% of the lower quartile market rent, which approximates to
Affordable Rents. 87 households could afford a rent at 60-79% of the lower quartile market
rent.
• This leaves another 55 households who could afford 80-99% of the market threshold rent,
which is comparable to the costs of Shared Ownership.
• As a further indicator, housing thresholds were identified for new building dwellings by number
of bedrooms and the ability of households to purchase at these levels under the proposed First
Home mechanism was examined. 202 households could buy a first home each year, most of
whom required one or two bedroomed units. Those able to afford a larger unit would probably
have an income above the eligibility level for the scheme.
• These numbers should not be treated as exact, because a household near any one of the
thresholds might shift its demand by devoting more of its income towards housing.
• The annual supply of affordable housing units is estimated at 119 units, and deducting this
from gross need of 262 provides a net annual requirement for affordable housing of 143 units
per annum.
• There is an apparent small surplus of one-bedroomed units. Setting this aside, 50% of
affordable units should be two-bedroomed, 35% three bedroomed and 15% four-bedroomed.
• The Council’s Affordable Housing Strategy 2020-2025 indicates that there is an over-supply of
unpopular older persons’ accommodation (which is not let as supported housing) in the housing
association stock which would account for the surplus.
• The chart below summarises the process of calculating affordable need and the numbers in
need.
3
Housing requirements of specific groups
Older people
• By 2037 the number of those aged 65 or over in Mole Valley is projected to be 27,460. This
represents a 32% increase on 2020 figures. This is a slower rate of increase than that
projected in the 2016 SHMA, because of different population projections.
• The rate of increase of the 75 or over and 85 or over groups in the population is projected
to be higher, at 38% and 51% respectively. Again, these are slower than the projections in
the 2016 SHMA.
• 67% of single older people and 84% of older couples own their own homes outright,
implying there is considerable equity available to meet housing needs.
• Substantial numbers of older people tend to under-occupy housing, implying that if they
downsize this would free up more family-sized accommodation in all sectors.
• While demographic modelling shows that there is likely to be an underlying shortage of
particularly leasehold sheltered accommodation, at present the greatest requirement,
proportionately, is for Extra Care accommodation, which is currently lacking.
4
• There is a case for the authority considering facilitating more Park Homes, as a relatively
affordable option for older people.
• Looking ahead to 2040 there will need to be an additional 436 units of rented sheltered
accommodation and 1,369 leased or market rent sheltered units
• There will be a need for 384 units of Extra Care accommodation between 2020 and 2040,
73% of which should be leasehold and 27% rented.
Households with disabled members including wheelchair users
• A steady increase in the number of older people with mobility disabilities is forecast
between now and 2040 (a 42% increase), but a minor decrease is projected for working-age
people.
• Demographic modelling suggests that 174 households have an unmet need for wheelchair
accessible accommodation. Others will have accessible housing needs that may not require
full-wheelchair accessible standards.
• There is some mismatch between the numbers needing social/affordable wheelchair
accessible stock, and the allocations to that stock when it becomes available.
• We suggest further work is undertaken to look more deeply into the economic
circumstances of those potential 174 requiring such accommodation, to determine how
many or what proportion could access market products.
• But in the interim it is clear that more effective use of the social housing wheelchair
assets that come into availability be made, by ensuring they are let to those that require
wheelchair accessible accommodation.
Students
• There are over 3,700 students resident in the district during term time, including older
school students.
• 81% live with their parents. Around 14 % live in the private rented sector.
• There are currently no Higher Education establishments based in Mole Valley, though there
are a number in surrounding authorities, and London colleges and universities are easily
accessible by rail
• There are currently no plans to build any purpose-built student accommodation in the
district.
• The district is a ‘net exporter’ of students – that is, the number of residents that leave the
authority for elsewhere during term time is greater than the numbers that come in.
• In view of the above there does not seem to be a strong case for purpose-built student
accommodation to be prioritised against other demands.
Private rented sector (PRS)
• The PRS has expanded in Mole Valley by 80% between the last two Censuses and is now
likely to be providing homes for 26% of households
• Private renters, including those with children, tended to live in smaller properties than
owners, and to be more overcrowded.
• Although private renters are more economically active than average, they are slightly
more likely to be in lower-paid and less responsible jobs than average.

5
• Rents have increased by between 15% and 25% since 2011 (depending on bedsize); there
are signs that the increase rate is slowing.
• Assuming up to a third of household incomes could go on housing costs, 40% of renters
cannot afford a median rent two bedroom home.
• The number of PRS tenancies let to those claiming Housing Benefit has reduced sharply,
by 41%, since 2013; if it is becoming less of an option for those on lower incomes, this
must be of concern to the authority, particularly given the high proportion of households
with dependent children that rely upon it.
• In spite of the reduction in claims, new claimants represent 50% of net annual affordable
housing need.
• Loss of a PRS tenancy accounted for 26% of initial assessments under the Homelessness
Reduction Act 2017 in 2018-19
• To date the authority has not had to use the PRS as a source of temporary
accommodation to a great extent.
• Looking to the future, it seems likely that landlords will continue to exit the Housing
Benefit / Universal Credit sub-sector and ‘upmarket’ their offers, to the detriment of
those on lower incomes. There must be concern about access for those on the lower
end of the income spectrum, and the knock on effects on homelessness services if this
scenario arises. The authority may wish to take measure to engage with landlords
offering homes at the lower end of the price spectrum, to assist them remain in this
market
Those wishing to build their own homes
• As of September 2020, 125 individuals had registered as interested in self or custom
build under the monitoring arrangements set up under the Self-Build and Custom
Housing Building Act. However, currently only 85 of these is eligible.
• The Act expects an authority to make provision in certain circumstances for suitable
serviced plots to meet demand as evidenced by the register. Regulations in force from
2016 give authorities the option to divide the register, based on eligibility tests, including
local connection and financial viability. Only those that can pass the eligibility tests would
be entitled to district support.
• Of the 85, 34 are eligible under Part 1 of the register – that is, they have established
some form of local connection with Mole Valley and demonstrated ability to finance their
schemes.
• Of the 34, 80% currently live in the area, 50% work there, and nearly 40% have family
connections. The majority have substantial assets or access to mortgages
• There is no data available yet to indicate whether demand for self-build in Mole Valley is
relatively high or low; but in the context of other priorities for scarce land resources,
including the 564 households on the housing register, and the annual deficit of 143
affordable homes, we suggest that there is little evidence that self-build should be
prioritised above other demands.

6
Chapter 1
Introduction
Background
1.1 In August 2020 Cobweb Consulting were commissioned by Mole Valley District Council to
undertake an update of the Mole Valley section of the 2016 Strategic Housing Market Assessment
that had been produced for the Housing Market Area covering Kingston on Thames and North East
Surrey.
1.2 The commission is in the context of the authority preparing a new Local Plan and updating its
evidence base to support this.
1.3 As a supplement to this commission we were also asked to produce an update report of the
housing market linkages between Mole Valley and the Gatwick Diamond. This appears as
Appendix 1 to the main report.
1.4 Since the last SHMA, there have been significant changes to the National Planning Policy
Framework (NPPF) and National Planning Practice Guidance. The key element is a new standard
method for assessing future housing requirements. The standard method itself has undergone
several iterations.
1.5 Most of the material in the 2016 study is still relevant; this commission is an update rather
than a full SHMA. This update focusses on the assessment of housing needs, affordable housing
requirements, and housing requirements for specific groups.
1.6 All the data we use is the most up to date available at the date of writing. However, readers
should be aware that some data sets, especially the 2011 Census, will be less than contemporary.
Where possible we have tried to use more up to date data, for example using the English Housing
Survey to update information on concealed households and the proportion of Private Rented
Sector homes
Methodology
1.7 The methodology adopted was primarily a desk-based analysis of secondary data from
standard sources, as well as analysis of administrative data held by Mole Valley. To give this data
context, a series of interviews with representatives and stakeholders in different parts of the
housing market were held to validate and inform the conclusions of this report .

7
Report structure
1.8 The rest of this report is structured as follows:
• Chapter 2 The policy context
• Chapter 3 Housing needs assessment
• Chapter 4 Affordable housing needs
• Chapter 5 The housing requirements of specific groups.
• Appendix 1 Mole Valley and the Gatwick Diamond
Acknowledgements and authorship
1.9 We would like to thank our project client, Natalie Blaken of Nupremis Cambridge Ltd. Among
the many staff at Mole Valley who have helped, we would particularly thank Andy Barber, Planning
Policy Officer and Jane Smith and Duncan Clarke, Planning Policy Managers. From the housing
and environmental health teams we would like to thank Alison Wilks, Del Smith, Dina
Bouwmeester, Kirsty Jones, and Lisa Shepherd. Additionally, we would thank the stakeholders from
different sectors of Mole Valley’s housing market for their input.
1.10 This report was researched and written by Danny Friedman, Ros Grimes and Philip Leather, of
Cobweb Consulting.
8
Chapter 2
The policy context
Key messages
• National Planning Policy Framework (NPPF) requires local authorities to base their planning
policies on a local housing needs assessment, calculated using a standardised national
methodology, together with an assessment of affordable housing need.
• The methodology was changed in February 2019 to include a requirement to use the 2014-
based ONS household projections as the starting point for the standardised national
methodology.
• The government is now consulting on a further set of changes which will change the housing
methodology calculation formula and permit the use of up to date household projections.
• National Planning Practice Guidance (NPPG) no longer refers to an objective assessment of
need (OAN) or to the preparation of a strategic housing market assessment.
• The standardised national methodology for identifying housing need is not mandatory but
must be followed unless there are exceptional circumstances which suggest an alternative
approach.
• Constraints on provision such as land availability or infrastructure should not be considered
when estimating need, although they are of course relevant in developing policies.
• Total housing need should be broken down by age group, type of household, size of
household, tenure, and any special requirements (such as needs for people with disabilities
or wheelchair users).
• A separate and detailed approach to assessing the need for affordable housing is also set out
in NPPG. This has not changed substantially from previous guidance. NPPG requires the
provision of appropriate housing for older people and people with disabilities including
specialist and supported housing.
• The government is in the process of introducing a new affordable housing product known as
First Homes which will provide a discount on a dwelling purchased in the private market by
certain priority groups. The details of this scheme are still being finalised but in August 2020
the government proposed a pilot scheme of 1,500 dwellings nationally.
• At time of writing, two unprecedented areas of uncertainty surround the UK housing
market, the economy and society more widely. The first is the impact of leaving the
European Union and the second is the COVID-19 pandemic. The scope of report does not
take account of either of these uncertainties and it would be premature to do so. However,
it will be important to monitor evidence on their impact as it emerges in coming years and to
take this into account in planning policies for housing.

9
Introduction
2.1 This chapter highlights the key aspects of planning policy and guidance which this Strategic
Housing Market Assessment (SHMA) Update for Mole Valley has considered.
2.2 The National Planning Policy Framework (NPPF), originally published in 2012, sets out the
government’s principles and policies relating to planning. After remaining unchanged since its initial
publication, the NPPF was revised after consultation in July 2018, and revised again in February
2019. In August 2020 the Government published a White Paper, Planning for the future1, which sets
out further proposals for wide-ranging changes to the planning system including the process of local
plan preparation. During August and September 2020 the government held a consultation on
changes to planning policy and regulations in four areas:
• changes to the standard method for assessing local housing need.
• Transitional arrangements for First Homes sold at a discount to market price for first time
buyers including key workers.
• temporarily lifting the small sites threshold below which developers do not need to
contribute to affordable housing.
• extending the current Permission in Principle to major development.
National Planning Policy Framework (2012)
2.3 The first NPPF published in 2012, introduced a presumption in favour of sustainable
development as the underlying feature of planning policy, and set out an intention on the part of the
government to secure a significant increase in the supply of housing through the planning system.
2.4 The NPPF and planning practice guidance formally required in each area, local planning
authorities to prepare a Strategic Housing Market Assessment (SHMA). The purpose of an SHMA was
to develop a clear understanding of housing needs in an area, with neighbouring planning
authorities working together where Housing Market Areas (HMAs) crossed their boundaries. The
SHMA was required to provide a full assessment of the need for both market housing and affordable
housing, which would provide the basis for local plan policies relating to future housing supply and
to the proportion of affordable housing in new developments.
2.5 The 2016 SHMA was required to include an objective assessment of housing need (OAN)
based on robust evidence. SHMAs were required to be thorough but proportionate, and to build
where possible on secondary information sources rather than primary surveys.
2.6 NPPG was updated at intervals, but few changes were made to the guidance on housing need.
However, there was considerable volume of additional practice on Examination in Public of Local
Plans; Appeals against the refusal of individual planning applications; and the development of
Neighbourhood Plans. In addition, a body of case law emerged where applicants, local authorities or
the Secretary of State sought clarification through the Courts of the definition of OAN, and the
process of its calculation. As a result, by 2017, the assessment of the OAN within a SHMA had
become a complex and time-consuming process.
1 See MHCLG (2020) Planning for the future, White Paper August 2020, at www.gov.uk/mhclg.

10
NPPF 2018, 2019 and 2020 Changes to the Planning System consultation
2.7 The increasing concern at the cost of preparation and the extended timetable for public
examination of planning policies setting out future housing requirements led the government to
make revisions to the NPPF with the aim of reducing the complexity of the process of calculating
OAN. The new NPPF, published in July 2018, included the requirement for local authorities to use a
standard methodology for the assessment of housing need. The detail of the standard methodology
was set out in an amended version of NPPG in September 2018.
2.8 In the same month, the Office of National Statistics (ONS) published a new set of official
household projections, based on population projections using 2016 rather than 2014 as the base
year. The updated projections showed a significant reduction in the projected annual average level
of household growth in many areas across the country. The government’s objective at this time is to
achieve 300,000 new homes per year. To ensure that the planning system provided the framework
for that delivery, the government made further changes to NPPF and NPPG in 2019 to require local
authorities to continue to use the 2014-based household projections (rather than the updated 2016
projections) in assessing housing need unless there were strong reasons for not doing so.
2.9 In June 2020, ONS published a set of 2018-based household projections, using its most up to
date population forecasts. These confirmed the reduction in household numbers identified in the
previous 2016-based projections, and at national level showed a further reduction, making the 2014-
based projections which NPPG specifies are to be used in local planning even more divergent from
current trends. As a result, the government is proposing to revise its standard methodology for
assessing housing need. The new proposals published in August 2020, in ‘Changes to the Current
Planning System’, and subject to a consultation which ended on 1 October 2020, indicate the
baseline demographic need assessment which forms Step 1 of the standard methodology should use
the latest official projections, unless a percentage increase above existing local housing stock levels
results in a higher figure. At present Step 2 of the standard methodology adjusts the baseline
demographic need by a factor based on the extent to which the ratio of the median housing sale
price to median earnings for people in employment exceeds a value of 4.0. The proposed new
method retains this but adds to it a further factor which takes account of the change in this
affordability ratio over the last ten years. Currently, the housing need assessment produced by the
standard methodology is also capped to impose a limit on the extent of change in assessed need
from the level enshrined in previous local plans, but the new proposals eliminate this capping stage.
National Planning Practice Guidance
2.10 The current NPPF sets the requirement for planning authorities to prepare assessments of
housing need. NPPG provides the detail on how to carry these out:
• Firstly, an assessment of housing need, based on the standard methodology set out in the
PPG, unless there are clear reasons for adopting an alternative (NPPF para 60 and NPPG
Housing and economic needs assessment2 para 001 Reference ID: 2a-001-20190220); and
2 All subsequent references to paragraphs from PPG relate to the Housing and economic needs assessment
section of the guidance so the title of the section is omitted in these references. The guidance is published
online and is subject to continuous amendment. Paragraph references are correct at 14-07-2019.

11
• Secondly, an assessment of the current number of households and projected number of
households who lack their own housing and who cannot afford to meet their housing needs in
the market (NPPF paras 61-64 and NPPG guidance paras 018 Reference ID: 2a-018-20190220
to 024 Reference ID: 2a-024-20190220).
2.11 The current steps to derive the minimum annual local housing need are set out in Paragraph:
004 Reference ID: 2a-004-20190220 of NPPG. Step 1 is to derive the annual average number of net
additional households expected to form over a ten-year period starting at the current year from the
relevant official projections. In Step 2, this figure is adjusted using a formula based on the level of
affordability of housing in each area. In Step 3, the resulting figure is assessed to see whether it may
be subject to capping.
2.12 The guidance indicates that the standard assessment should be made at the start of the plan-
making process and that it should be revised when appropriate. The Office for National Statistics
(ONS) usually publishes revised affordability data annually and updates of household projections
every two years.
2.13 The guidance stresses that the standard assessment is an estimate of the minimum level of
need in an area, and it refers to circumstances when there may be a higher level of need (Paragraph:
010 Reference ID: 2a-010-20190220), for example:
• when economic growth strategies are in place requiring additional housing to support them
• where strategic infrastructure improvements, especially to transport infrastructure, are
planned which provide the opportunity for higher growth or require higher growth to make
them viable
• or where one authority has agreed to take on unmet need from other areas.
Housing Needs of Different Groups and Housing for Older People and People with
Disabilities
2.14 The guidance on the needs of certain groups of households has been expanded beyond that in
the previous version. The guidance now notes that the need for housing for particular groups of
people may exceed, or be proportionally high in relation to, the overall housing need figure
calculated using the standard method. This is because the needs of particular groups are calculated
for the whole population of an area , rather than from the smaller number of new households
calculated by the standard housing needs method. Hence, when producing policies to address the
need of specific groups, authorities will need to consider how the needs of individual groups can be
addressed within the constraint of the overall new housing need established. The need for particular
sizes, types and tenures of homes as well as the housing needs of particular groups should also be
considered separately from overall need (Paragraph: 017 Reference ID: 2a-017-20190220).
Affordable housing
2.15 The guidance on the need for affordable housing (PPG guidance paras 018 Reference ID: 2a-
018-20190220 to 024 Reference ID: 2a-024-20190220) has remained largely unchanged. This need
should be calculated firstly by estimating the backlog of need from people who currently occupy

12
unsuitable housing (or who cannot form separate households) together with need arising from
newly forming households in the future. Secondly, the proportion of these households who are
unable to afford market housing and who require affordable housing is calculated. The current and
future supply of affordable housing is then deducted from this requirement to produce an estimate
of net affordable need. Affordable housing need may be disaggregated into categories based on the
different types of affordable housing available, such as social or affordable rented housing,
intermediate housing or First Homes. At present, housing provided by the private rented sector is
not included.
2.16 Mole Valley Council has published an Affordable Housing Strategy 2020-25 which includes a
detailed analysis of the need for affordable housing, the supply, and policies to address affordable
need which is referred to extensively in Chapter 4. The Strategy’s overall ambition is to continue to
deliver new affordable homes and increase delivery by the council. Firstly, to increase the delivery of
affordable homes that are of sustainable construction, energy efficient and where possible have
social rents; and secondly in the longer term, with the right conditions, become a developer and
potentially a landlord of affordable/council housing.
2.17 The Strategy provides a range of actions to achieve these aims that includes maintaining the
critical partnership with housing association partners and developers and looking at alternative
methods of delivery, including the Council building new affordable homes. It also seeks to prioritise
the mitigation of climate change in the construction process and development of affordable homes
for social rent and for those with support needs, especially older people whose needs in later life
could be met by extra care housing. Opportunities through the Council’s regeneration activities,
working with parish councils and rural communities and community led groups to deliver affordable
homes are also highlighted. The Strategy will be annually reviewed, and progress reported to the
Council’s Scrutiny Committee.
Implications
2.18 The objective of this study is to produce estimates of future housing need. The current NPPF
clearly requires that these should be based on the standard methodology, unless exceptional
circumstances apply. This study complies with this requirement, providing a full explanation of the
components of the estimate and the sources used. However, we have also undertaken two
additional scenarios. Firstly, a detailed assessment of housing need using the most recent 2018-
based ONS household projections, and secondly an analysis using the new standard assessment
methodology proposed by the government in Changes to the Current Planning System, August 2020.
Consultation on these proposals is now complete but at the time of writing the government has not
announced how it intends to proceed.
National housing policy context
2.19 Government housing policy in the period since 2013 has been set in the wider context of
continuing restrictions on public expenditure driven by ‘austerity’. Interventions have focused on
methods of influencing demand and supply in the private market, rather than on direct social sector
provision. Wider reforms, seeking to reduce or contain public expenditure on the welfare benefits
system have also had, or in future will have, major impacts on housing.

13
2.20 The recovery in house prices and market transactions in the housing market after the global
financial crisis in 2008 was encouraged by a gradual easing of mortgage lending terms such as
deposit requirements and loan to income ratios. Government interventions also sought to support
the market, notably through the Help to Buy scheme, which has to date received over £10 billion of
government equity loan funding. Many commentators argue that the Help to Buy scheme has simply
stimulated price increases in the new build sector rather than increased supply. An independent
evaluation of Help to Buy for MCHLG reported limited levels of additionality in both demand and
supply. Comments in the press and from some professional bodies have been far more critical3 .
2.21 On the supply side, the emphasis of government policy has been on changes to the planning
system which the government believes will boost supply. These include measures to secure the
allocation of more land for housing and the granting of more planning permissions in areas of higher
demand. These measures include the requirement to have a 5 year land supply; the Housing Delivery
Test, the national housing need assessment methodology; and changes to the Town and Country
Planning (General Permitted Development) Order to allow certain offices to be converted into
residential units without planning consent.
2.22 The White Paper, Fixing Our Broken Housing Market published in February 2017 made the
issue of increasing the overall supply of new housing a key objective of government policy, and its
proposals to secure higher allocations of land, higher levels of planning permissions for housing, and
higher levels of build out from these permissions represented a significant step up in the scale and
range of interventions. The White Paper also included proposals for expanding the private rented
sector by attracting more institutional providers or investors. However, changes to the taxation
arrangements for private landlords are argued by some to be likely to reduce future growth in the
private rented sector, and to change the structure of the sector. The White Paper also included
proposals to make renting fairer for tenants.
The social rented sector
2.23 The social rented sector has experienced increasing challenges over the period since 2013.
Welfare reforms have sought to reduce or contain the costs to government of housing benefit
payments to social rented tenants, and to reduce levels of under-occupation in the sector. Support
for Right to Buy has also continued to reduce the social rented stock. At the same time grant or loan
finance for new development has remained generally restricted, and increasingly targeted on areas
where affordability ratios suggest that need is highest.
2.24 The Rent Standard4 governs the rents which Private Regulated Providers of Social Housing
(PRPSH) can charge their tenants. Social housing rents are based on a rent formula based on the
3 Ministry of Housing, Communities and Local Government (2018) Evaluation of the Help to Buy Equity Loan
Scheme 2017, Christine Whitehead, Peter Williams, Ipsos MORI and the London School of Economics. A report
by Morgan Stanley, The help to buy premium – and its unintended consequences, is also widely cited in press
and other commentary.
and Wilcox S and Williams P (2018) Dreams and Reality: Government finance, taxation and the private housing
market, London, Chartered Institute of Housing. 4 See Policy Statement on rents for social housing, MHCLG, Feb 2019

14
relative value of each property, relative local income levels, and the size of the property. A
requirement to reduce rents over a four-year period was introduced in 2016. From 2020 onwards,
further limitations apply to social rents. These changes have provided a way to contain housing
benefit costs, but they have posed potential future challenges to the viability of some organisations
in the sector, or to their ability to develop new housing, leading to mergers and restructuring. The
net result has been a more or less static number of social rented dwellings nationally, which in the
context of overall housing growth has led to a declining overall share. Proposals for changes to the
funding of supported housing also led to uncertainties which adversely affected development, and
some of these remain a concern for the longer term.
2.25 In 2011, the government also enabled PRPSHs to charge affordable rents which may be set at
up to 80% of local market rents inclusive of service charges). Landlords can only let new properties
at an affordable rent when they meet certain conditions. Existing vacant properties can also be
converted from social rent to affordable rent in certain circumstances. Regulations specify how an
affordable rent is to be determined and place a limit on annual increases. Since 2015 social landlords
may also charge a full market rent where a tenant household has an income of £60,000 per annum
or more and separate regulations apply to such tenants.
2.26 Following the tragedy at Grenfell Tower in 2017, the government issued A New Deal for Social
Housing, in August 2018. The Green Paper set out a series of objectives and proposals and sought
comments on reforms to social rented housing to achieve these objectives, including:
• ensuring homes are safe and decent,
• effective measures to deal with complaints and disputes
• measures to empower residents and to strengthening the Regulator,
• the tackling of stigma associated with the sector, and celebrating thriving communities
• expanding affordable housing supply with social rented homes as a springboard to home
ownership.
2.27 Shortly before leaving office the then-Prime Minister Theresa May announced that an action
plan to implement the Green Paper recommendations would be published in September 2019. No
plan has been published by the time of writing, and none of the recommendations have been
implemented. Instead, a Housing White Paper has been promised. The Secretary of State for
Housing Communities and Local Government announced in August 2020 that that work on the
White Paper has been ‘paused’ because of the pandemic5..
2.28 However, a certain amount of background work and consultation has been undertaken in the
intervening period, which will be built on when the White Paper emerges. This includes:
• Safety: implementing the Hackitt Review recommendations, which would improve building
safety standards, and testing various types of cladding, adding sprinklers and alarm systems
to existing buildings. A review of the 2006 Decent Homes Standard is also recommended.
• Complaints: Consulting on improving and streamlining the process of making complaints by
tenants, with standardised stages, and possible strengthening of the Housing Ombudsman
5 https://www.insidehousing.co.uk/news/news/social-housing-white-paper-work-paused-during-pandemic-
says-jenrick-67845

15
role.
• Empowering residents: measures suggested include landlord performance league tables,
rewarding (via the Affordable Housing Programme) good landlord performance, linking Key
Performance Indicators to regulatory judgements for housing associations, giving greater
choice to tenants through enhanced stock transfer and tenant management initiatives, and
additional tenant training and involvement in contractor selection. And strengthening the
powers of the Social Housing Regulator.
• Addressing stigma: apart from tenant consultation on this issue, there is little concrete
discussion at the moment. The final report of the Building Better, Building Beautiful
Commission, published in January 2020 highlighted the impact of high-quality design in
addressing stigma6.
• Boosting the supply of social housing and supporting home ownership: the most concrete
step taken here was to relax the barriers to local authorities building homes, through
withdrawal of the borrowing cap and more strategic investment by Homes England.
However, there are concerns that the commitment to social housing is undermined by the
proposals in the White Paper ‘Planning for the Future, published in August 20207 to scrap
Section 106 agreements, which have been the biggest sole contributor to affordable housing
development in recent years. There are also proposals to make shared ownership staircasing
possible in smaller steps.
2.27 It should be emphasised that with the exception of the few measures noted above, none of
the aspirations of the Green Paper have been realised to date. The legacy of Grenfell Tower
continues to dominate housing policy and practice, as landlords, tenants and freeholders face up to
the implications of and costs associated with non-compliance with fire safety standards, security,
and panel replacement.
Homelessness and rough sleeping
2.28 Concerns over homelessness have continued to feature in the media and in government
policy , with a recent increased emphasis arising from the rapid growth of rough sleeping in many
areas, argued by some commentators to be a result of longer-term welfare reforms. In August 2018
the government published a Rough Sleeping Strategy seeking to halve the incidence of rough
sleeping by 2022 and end it by 2027. In December 2018 this was followed by a delivery plan. Mole
Valley has benefitted from to a share of the £131,440 allocated to four East Surrey authorities under
the initiative.8 Further funding (£144,000) has been made available to the Council by MHCLG from
the Next Steps Programme in 2020/21 to continue to support, in the long term, rough sleepers
assisted by the ‘Everyone Initiative’ that commenced in March 2020 in response to the pandemic .
2.29 In 2018 the Homelessness Reduction Act 2017 placed new duties on local authorities (and
referral agencies) to help prevent homelessness and ‘relieve’ homelessness if it does occur. These
duties apply to all those in need, regardless of status, whether intentional or if they have a local
connection. They cover, for example, rough sleepers and younger single people. The measures do
6 https://www.gov.uk/government/publications/living-with-beauty-report-of-the-building-better-building-
beautiful-commission 7 https://www.gov.uk/government/consultations/planning-for-the-future 8 https://www.gov.uk/government/publications/rough-sleeping-initiative-2020-to-2021-funding-allocations

16
not go as far as placing a full rehousing duty for these applicants on the authority – that remains
within the criteria set by the 1996 Housing Act. However, it does require authorities to thoroughly
assess all applicants and provide a personalised response. Mole Valley will be publishing a new
Homelessness Strategy and Rough Sleeping Strategy 2020-2025 that at the time of writing is in draft
form. It will replace the previous Homelessness Strategy 2015-2020, which describes the problems
of homelessness and rough sleeping in the district in detail and sets out policies and initiatives to
address them.
Leaving the European Union
2.30 Any discussion of policy context needs to have regard to leaving the European Union and its
impact on housing markets. The House of Commons Library original briefing paper9 suggested
caution when looking at market changes since the vote to leave the European Union, citing global
political uncertainty and the broader UK economy as other significant factors. Nonetheless, it noted
that though initial fears of a major drop in consumer confidence and house prices were not realised,
there were concerns about the longer term, after exit from the European Union, and beyond.
2.31 Looking ahead, the longer-term housing market impact of leaving the European Union will
be intrinsically tied into the economic as well as the political impact. The variables here are
substantial: the relationship between the pound and the Euro and the cost of building materials;
changes to interest rates affecting mortgages; the ability of London to retain its international
financial role which will undoubtedly impact on areas outside but close to Greater London; the
results of single or bilateral market trade negotiations; and the wider impact of migration policy
including access to construction workers.
COVID-19 and housing markets
2.32 It is impossible, of course, to ignore the shock of the COVID-19 virus pandemic on housing
markets, policy and practice. Savills have summarised the broad-brush impact on housing markets as
follows:
In general, we can expect the pandemic to affect the housing market in a number of ways:
• General uncertainty will weigh on consumer sentiment;
• Restrictions on people’s ability to go about their day-to-day business will impede normal
estate agency, mortgage and conveyancing processes10
• Stock market falls will make people feel less secure about their personal financial situation;
and
• A negative impact on earnings, employment and wealth generation11.
2.33 There are several steps that the government and housing providers are taking or have taken
to ameliorate the situation as far as possible. These include:
9 Brexit: implications for the housing market and construction, Briefing Paper 07666, House of Commons
Library October 2016 10 At the time of writing, some restrictions on these processes have been lifted and a degree of normality has
returned to the housing market transaction process, subject to local lockdown measures. 11 https://www.savills.co.uk/research_articles/229130/298265-0/coronavirus-and-the-uk-housing-market

17
• A buffer period before private and social landlords can begin to take possession action.
• A mortgage payment ‘holiday’ for homeowners and Buy to Let landlords
• Guidance on delaying or slowing house-moves.
• The removal of Stamp Duty on the purchase of dwellings of under £500,000 until the end of
March 2021.
• The Government has written to local authorities in England asking them to house all people
sleeping rough, and those in hostels and night shelters and invested in the Next Steps
Programme.
• Furlough payment arrangements and the introduction of Self-Employed income support to
protect earnings to some extent.
• Additional personal support at a regional level, depending on the tier of lockdown
implemented
2.34 A range of estimates of the economic and housing impact of COVID-19 have now been
published and others will follow as evidence of these changes emerges12. A substantial increase in
unemployment is widely accepted as likely. Within some parts of the housing market, prices are
reported to be rising as households seek to relocate into larger dwellings or dwellings with a garden,
and to move from urban areas to suburban and more rural locations with lower housing densities,
but rising unemployment may impact on these aspirations. Mole Valley Council officers report that
there is evidence of increased levels of downsizing by older people as a result of the temporary
removal of Stamp Duty, which may increase the supply of larger units for families who are able to
afford them. A local housing association reported a dramatic increase in interest in Shared
Ownership when the first lockdown was lifted, as those trapped in ‘cooped up’ arrangements
sought alternatives. But a conclusive analysis of the impact of COVID-19 on housing markets is
impossible at this stage. This is a matter which the Council will need to monitor carefully.
First Homes
2.35 In February 2020 the government published a consultation paper on First Homes: getting
you on the ladder13. This reiterated the impact of existing measures such as Help to Buy, Right to
Buy, stamp duty relief, and the provision of support to the construction of affordable rented homes
and shared ownership homes. However, it set out a new scheme to secure First Homes on new
housing developments, which would be sold at a discount of 30% of market value, to priority groups
including key workers and serving members of the armed forces. Resales of First Homes would be
restricted to a price set at 70% of the market value at the time of sale so as to pass the discount on
to others in housing need.
2.36 In August 2020 the government published further details of the First Homes scheme taking
account of responses to the comments received. The scheme will commence with a pilot of 1,500
12 For example, https://www.pwc.co.uk/premium/covid-19/uk-economic-update-covid-19.pdf,
https://www.research.ox.ac.uk/Article/2020-04-07-the-economic-impact-of-covid-19 13 See MHCLG (2020) First Homes: getting you on the ladder, consultation in the design and delivery of First Homes.

18
First Homes. 30% will be the minimum discount, but local planning authorities will be able to require
that developers increase this to 40% or 50% if there is evidence that 30% is not enough to make
homes affordable to those in priority groups, and provided that this level of discount is viable. There
will be a price cap on First Homes of £250,000 across England outside London, making the maximum
First Home price £357,000. An assessment of the current new build sector across Mole Valley carried
out by the Council suggests that this rules out three and four bedroomed homes completely, but as
the scheme is targeted on first-time buyers this may not exclude many households. Studio and one-
and two-bedroom units should be eligible in areas such as Leatherhead and Dorking where prices
are lower and where there is an established market for them. An assessment of the affordability of
First Homes is included in Chapter 4 but this needs to be monitored carefully in the future as
experience with the new product develops.
19
Chapter 3
Housing Need Assessment
Key messages
• This chapter provides an assessment of the level of housing need in Mole Valley using the
standard national methodology, together with an assessment of how need will change as a
result of proposed changes to this methodology. It also considers other matters relevant to the
assessment of housing need.
• Applying the current standard housing need assessment methodology leads to a housing need
of 453 dwellings per annum in Mole Valley.
• Alternative Scenario 1 uses the approach set out in NPPG standard methodology, apart from
using the latest ONS 2018-based household projections. This produces an estimate of housing
need of 194 dwellings per annum.
• Alternative Scenario 2 applies the government’s proposed new standard national methodology
as set out in its August 2020 consultation. This produces an estimate of 563 dwellings per
annum.
• Many local authorities in the South East region experience large increases in assessed need
under this proposed new algorithm. It is likely that a decision on this proposal will emerge
during the period of preparation of the local plan so the Council should monitor this to ensure
it uses the most up to date methodology.
• NPPF and NPPG require that local authorities should use the standardised need assessment
methodology, drawing on MHCLG’s 2014-based household projections, to calculate the level of
housing need in their areas unless there are exceptional circumstances. No exceptional
circumstances have been identified in Mole Valley.
• The recommended breakdown of new private sector market dwellings by size is 25% one-
bedroomed units, 45% two-bedroomed units, 20% three-bedroomed units, and 10% four-
bedroomed units. It is also recommended that 25% of new completions should be in the form
of flats and apartments.
• The assessment of need figure is an important consideration in local planning, but a range of
other matters, including the requirement for affordable housing and the availability of sites for
housing will need to be considered by the Council in arriving at a decision about the target
level of new housing provision to be included in its local plan.
Introduction
3.1 As Chapter 2 described, the approach which governments have required local authorities to
take in assessing housing need have been subject to many recent amendments. The frequency of
these changes after a long period of stability introduces an element of uncertainty into estimates of
housing need. In this section we firstly set out the estimated housing need in Mole Valley using the
standard national methodology set out in the NPPF issued in 2019 and in subsequent NPPG. At the
time of writing this remains the official approach. The chapter also addresses the impact of new
2018-based household projections issued in 2020 by the Office of National Statistics (ONS) and
presents a scenario which applies these projections to the existing standard methodology. However,

20
the government has also issued (in July 2020) proposals for a new standard methodology for
calculating housing need. These may be amended after consultation (although previous
consultations have not tended to result in significant amendments) but their implications for housing
need in Mole Valley are also set out in this section. We consider that having this range of estimates
available will provide the Council with the best advice on how to proceed in setting future targets for
housing provision in the area.
The 2019 Standard Assessment of Need
3.2 The approach to be followed is set out in NPPG published in February 2019. Step 1 is to ‘set
the baseline using national household growth projections, for the area of the local authority’. The
calculation is required to start at the current year (2020) and to estimate annual average household
growth over the next ten years. At the time of writing, NPPG specifies that local authorities should
use the 2014-based household projections published by the MHCLG, unless exceptional
circumstances apply. Table 3.1 below shows the calculation, with the baseline of annual growth set
out in the final column. Table 3.1 also shows the same calculation using the 2016- and 2018-based
household projections subsequently published by the Office of National Statistics.
Table 3.1 Step 1 Household projections and annual average growth
2020 households 2030 households Annual Average Growth
MHCLG 2014-based 38,183 41,417 323.4
ONS 2016-based 37,571 39,862 229.1
ONS 2018-based 37,207 38,584 137.7
Sources: ONS, 2016-based household projections; ONS, 2016-based household projections; MHCLG 2014-based household projections.
3.3 Projected annual average household growth in Mole Valley has fallen from over 300 in the
2014-based projections to only 138 in the most up-to-date set of projections. This is accounted for
by both differences in the underlying population projections on which they are based; and by
differences in the assumptions made about the propensity of the population to form separate
households, which is determined through a series of estimated household formation rates. The
2014-based household projections produced by MHCLG take as their starting point ONS mid-year
estimates up to 2013 and the ONS 2014-based population projections. The most recent 2018-based
ONS projections take mid-year estimates up to 2019 and the ONS 2018-based population
projections.3.4 Step 2 of the current standard assessment of need requires the calculation of a
median workplace earnings-based affordability ratio, which is then used to calculate an adjustment
factor. This is applied to the average annual projected household growth figure calculated in Step 1
to produce a minimum annual housing need estimate.
3.5 NPPG specifies that the most recent median workplace-based affordability ratio, published
by the Office for National Statistics at local authority level, should be used. Data for 2019, published
in March 2020, is the most recent available14. The 2018 ratio is 13.55, a reduction from the 2018
peak of 14.57 and the lowest ratio since 2015. This compares to a ratio of 12.43 for Surrey as a
whole, 10.12 for the South East region, and 7.70 for England and Wales.
14 The data may be found at
https://www.ons.gov.uk/peoplepopulationandcommunity/housing/datasets/ratioofhousepricetoworkplaceba
sedearningslowerquartileandmedian, Table 5c.
21
The formula for calculating the adjustment factor is:
Adjustment factor = ( Local affordability ratio - 4
) x 0.25 + 1 4
3.6 The first stage in calculating the adjustment factor is to subtract 4.0 from the workplace-
based affordability ratio, leading to a figure of 9.55. In stage 2 this is divided by 4, giving a result of
2.3875. The third stage is to multiply this by 0.25, giving a result of 0.596875. The fourth and final
stage is to add 1.0 to this result to give a final adjustment factor of 1.596875.
3.7 If applied to baseline household growth, the adjustment factor gives a minimum annual
household need of 516 dwellings per annum (rounded to the nearest whole dwelling), based on the
MHCLG 2014-based household projections.
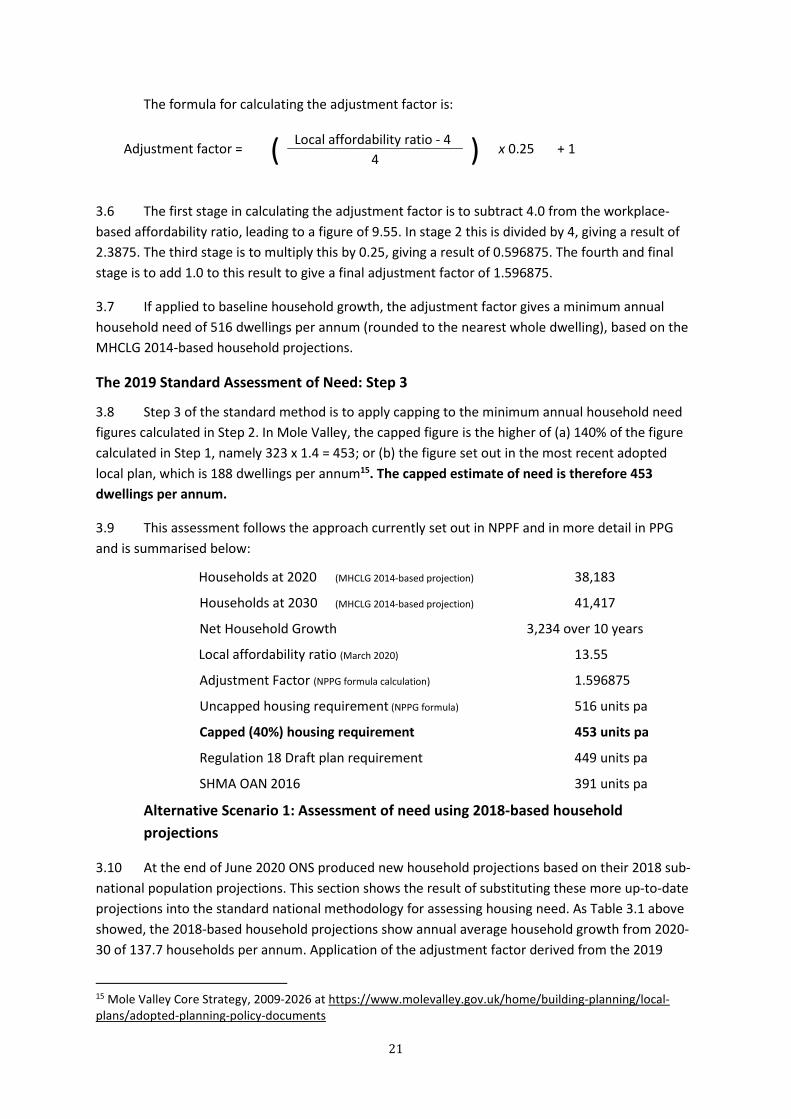
The 2019 Standard Assessment of Need: Step 3
3.8 Step 3 of the standard method is to apply capping to the minimum annual household need
figures calculated in Step 2. In Mole Valley, the capped figure is the higher of (a) 140% of the figure
calculated in Step 1, namely 323 x 1.4 = 453; or (b) the figure set out in the most recent adopted
local plan, which is 188 dwellings per annum15. The capped estimate of need is therefore 453
dwellings per annum.
3.9 This assessment follows the approach currently set out in NPPF and in more detail in PPG
and is summarised below:
Households at 2020 (MHCLG 2014-based projection) 38,183
Households at 2030 (MHCLG 2014-based projection) 41,417
Net Household Growth 3,234 over 10 years
Local affordability ratio (March 2020) 13.55
Adjustment Factor (NPPG formula calculation) 1.596875
Uncapped housing requirement (NPPG formula) 516 units pa
Capped (40%) housing requirement 453 units pa
Regulation 18 Draft plan requirement 449 units pa
SHMA OAN 2016 391 units pa
Alternative Scenario 1: Assessment of need using 2018-based household
projections
3.10 At the end of June 2020 ONS produced new household projections based on their 2018 sub-
national population projections. This section shows the result of substituting these more up-to-date
projections into the standard national methodology for assessing housing need. As Table 3.1 above
showed, the 2018-based household projections show annual average household growth from 2020-
30 of 137.7 households per annum. Application of the adjustment factor derived from the 2019
15 Mole Valley Core Strategy, 2009-2026 at https://www.molevalley.gov.uk/home/building-planning/local-
plans/adopted-planning-policy-documents
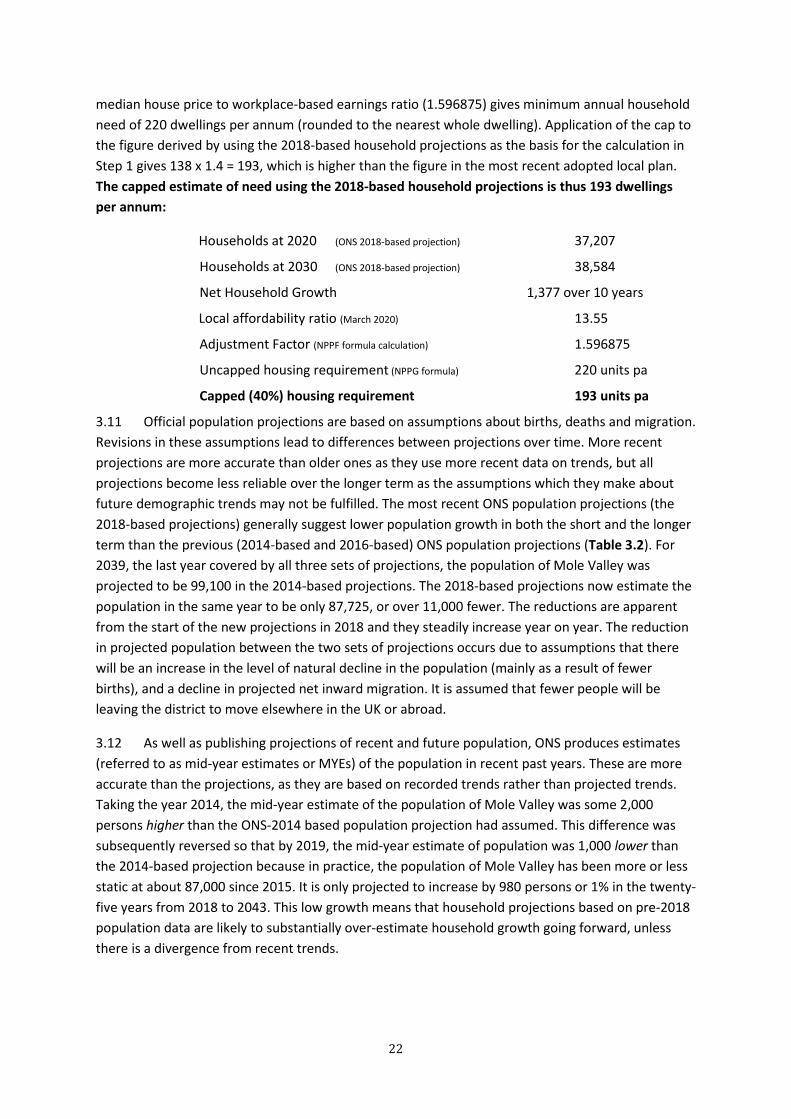
22
median house price to workplace-based earnings ratio (1.596875) gives minimum annual household
need of 220 dwellings per annum (rounded to the nearest whole dwelling). Application of the cap to
the figure derived by using the 2018-based household projections as the basis for the calculation in
Step 1 gives 138 x 1.4 = 193, which is higher than the figure in the most recent adopted local plan.
The capped estimate of need using the 2018-based household projections is thus 193 dwellings
per annum:
Households at 2020 (ONS 2018-based projection) 37,207
Households at 2030 (ONS 2018-based projection) 38,584
Net Household Growth 1,377 over 10 years
Local affordability ratio (March 2020) 13.55
Adjustment Factor (NPPF formula calculation) 1.596875
Uncapped housing requirement (NPPG formula) 220 units pa
Capped (40%) housing requirement 193 units pa
3.11 Official population projections are based on assumptions about births, deaths and migration.
Revisions in these assumptions lead to differences between projections over time. More recent
projections are more accurate than older ones as they use more recent data on trends, but all
projections become less reliable over the longer term as the assumptions which they make about
future demographic trends may not be fulfilled. The most recent ONS population projections (the
2018-based projections) generally suggest lower population growth in both the short and the longer
term than the previous (2014-based and 2016-based) ONS population projections (Table 3.2). For
2039, the last year covered by all three sets of projections, the population of Mole Valley was
projected to be 99,100 in the 2014-based projections. The 2018-based projections now estimate the
population in the same year to be only 87,725, or over 11,000 fewer. The reductions are apparent
from the start of the new projections in 2018 and they steadily increase year on year. The reduction
in projected population between the two sets of projections occurs due to assumptions that there
will be an increase in the level of natural decline in the population (mainly as a result of fewer
births), and a decline in projected net inward migration. It is assumed that fewer people will be
leaving the district to move elsewhere in the UK or abroad.
3.12 As well as publishing projections of recent and future population, ONS produces estimates
(referred to as mid-year estimates or MYEs) of the population in recent past years. These are more
accurate than the projections, as they are based on recorded trends rather than projected trends.
Taking the year 2014, the mid-year estimate of the population of Mole Valley was some 2,000
persons higher than the ONS-2014 based population projection had assumed. This difference was
subsequently reversed so that by 2019, the mid-year estimate of population was 1,000 lower than
the 2014-based projection because in practice, the population of Mole Valley has been more or less
static at about 87,000 since 2015. It is only projected to increase by 980 persons or 1% in the twenty-
five years from 2018 to 2043. This low growth means that household projections based on pre-2018
population data are likely to substantially over-estimate household growth going forward, unless
there is a divergence from recent trends.
23
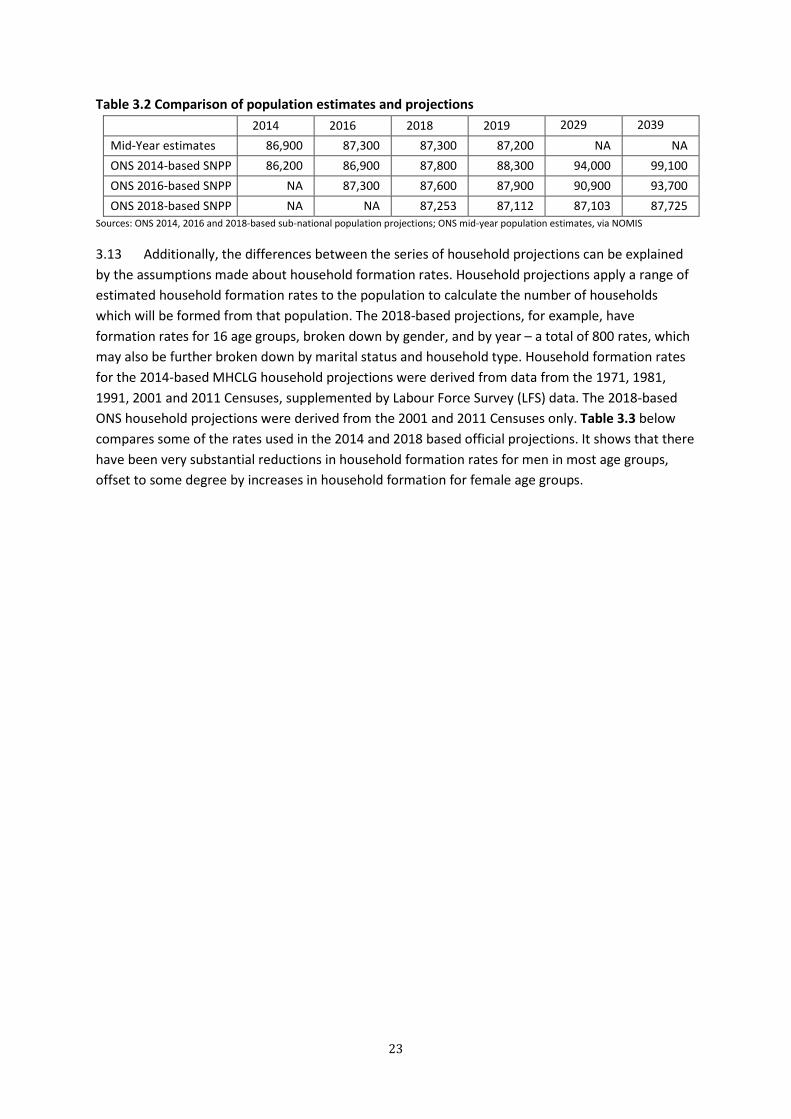
Table 3.2 Comparison of population estimates and projections
2014 2016 2018 2019 2029 2039
Mid-Year estimates 86,900 87,300 87,300 87,200 NA NA
ONS 2014-based SNPP 86,200 86,900 87,800 88,300 94,000 99,100
ONS 2016-based SNPP NA 87,300 87,600 87,900 90,900 93,700
ONS 2018-based SNPP NA NA 87,253 87,112 87,103 87,725
Sources: ONS 2014, 2016 and 2018-based sub-national population projections; ONS mid-year population estimates, via NOMIS
3.13 Additionally, the differences between the series of household projections can be explained
by the assumptions made about household formation rates. Household projections apply a range of
estimated household formation rates to the population to calculate the number of households
which will be formed from that population. The 2018-based projections, for example, have
formation rates for 16 age groups, broken down by gender, and by year – a total of 800 rates, which
may also be further broken down by marital status and household type. Household formation rates
for the 2014-based MHCLG household projections were derived from data from the 1971, 1981,
1991, 2001 and 2011 Censuses, supplemented by Labour Force Survey (LFS) data. The 2018-based
ONS household projections were derived from the 2001 and 2011 Censuses only. Table 3.3 below
compares some of the rates used in the 2014 and 2018 based official projections. It shows that there
have been very substantial reductions in household formation rates for men in most age groups,
offset to some degree by increases in household formation for female age groups.

24
Table 3.3 Comparison of household formation rates in Mole Valley
2018-based 2014-based
Percentage Point
Difference
2019 2039 2019 2039 2019 2039
Male 20-24 15% 10% 14% 12% 1 -2
25-29 34% 26% 45% 41% -11 -15
30-34 56% 45% 75% 68% -19 -23
35-39 69% 59% 88% 87% -19 -28
40-44 76% 67% 94% 95% -19 -28
45-49 79% 73% 95% 95% -16 -22
50-54 80% 76% 95% 94% -14 -18
55-59 80% 76% 97% 97% -18 -21
60-64 77% 73% 97% 96% -20 -23
65-69 74% 67% 98% 98% -24 -31
70-74 84% 92% 99% 99% -16 -8
75-79 88% 96% 99% 99% -11 -3
80-84 92% 98% 99% 100% -8 -1
Female 20-24 12% 12% 8% 9% 4 3
25-29 22% 25% 16% 18% 7 6
30-34 29% 34% 18% 21% 11 13
35-39 30% 35% 16% 17% 14 18
40-44 33% 39% 18% 20% 15 19
45-49 37% 45% 19% 18% 18 27
50-54 43% 52% 22% 23% 21 30
55-59 44% 52% 25% 27% 19 26
60-64 41% 41% 24% 24% 17 17
65-69 36% 22% 28% 28% 8 -5
70-74 40% 25% 33% 39% 7 -13
75-79 51% 36% 42% 44% 9 -7
80-84 68% 64% 56% 53% 12 11
Source: MHCLG, 2014-based household projections and ONS, 2016-based household projections
3.14 A key issue in assessing housing need relates to the cause of the decline in household
formation rates, or putting it another way, the higher projected average household size. Is this a
result of changing household preferences, such as sharing by groups of unrelated individuals, or the
result of increasing affordability problems? Or is it simply a lack of supply, making it harder for
individuals wishing to live on their own or to afford to do so? The latter explanation might be termed
suppressed household formation.
3.15 Defining, measuring and tackling suppressed household formation raises many difficulties.
Affordability is inevitably a constraint on household formation in any housing market – the question
is at what stage do affordability problems become problematic, and lead to overcrowding, or levels
of dwelling occupancy which cause other problems?

25
3.16 These are complex issues. In its 2017 White Paper Fixing our broken housing market, the
government decided that it wished to increase supply with the aim of improving affordability, and
through this to permit more households to form. It did so by introducing a national supply target
above that which would be derived from household projections alone.
3.17 This is a pragmatic policy response which recognised the difficulty of precise calculations of
suppressed household formation, but which determined and set a definitive target.
3.18 In that sense the government’s current requirement that local planning authorities should
set aside the most up to date projections and use outdated projections is unnecessary, as it relies on
both inaccurate population projections and household formation trends which are out of date. The
latest consultation abandons this approach and returns to the use of the most up-to-date
projections, but at the same time increases the factor to be applied to the demographic base
projections.
Alternative Scenario 2 Proposed new standard methodology
3.19 In August 2020 the government published a paper16 setting out proposed changes to the
standard national methodology for the assessment of housing need. Consultation on these
proposals remains open at the time of writing and closes on 1st October 2020.
3.20 Step 1 in the proposed new approach is entitled Setting the baseline –providing stability and
certainty by incorporating a blend of household projections and stock. It proposes that the baseline
for the revised standard method should be whichever is the higher of (a) 0.5% of the existing
housing stock in each local authority, or (b) the latest projected average annual household growth
over a 10-year period. The Government considers that the target of 0.5% of the existing stock in an
area provides a reasonable baseline target for annual additions. It also takes the view that
household projections have a role in topping up this baseline where the latest projected average
annual growth is higher than 0.5% of the existing stock.
3.21 The consultation specifies the data source to be used for an estimate of the size of the
dwelling stock as MHCLG Live Table 12517. The most recently published data relates to 2019 and
shows that the total stock in Mole Valley is 38,772, of which 0.5% is 193.86 dwellings. The household
projections element of the baseline must use the latest ONS national household growth projections
for the local authority area18. The latest 2018-based ONS household projections set out in Table 3.1
above showed annual average household growth of 137.7, a lower figure than 0.5% of the dwelling
stock. Accordingly, the proposed new method would produce a baseline for Mole Valley of 194
dwellings per annum (rounded to the nearest whole dwelling).
3.22 Step 2 of the new proposed approach is entitled Adjusting for market signals – maintaining
price signals using the current affordability ratio and the change in affordability over the last 10
years. The government proposes that the standard method will include two adjustments to the
baseline, using the median house price to workplace-based median earnings ratio to produce a
16 See MHCLG (2020) Changes to the current planning system: Consultation on changes to planning policy and
regulations, August 2020, pp 11-18. 17See https://www.gov.uk/government/collections/dwelling-stock-including-vacants (Table 125) 18 The calculation is required to use the principal projection set out in Table 406 of the projections.

26
factor to apply to the baseline in Step 1. Stage 1 in Step 2 follows the present approach, using this
ratio for the most recent year for which data is available. The formula to adjust the ratio using 2019
data would give an adjustment factor of 0.596875.
3.23 In Stage 2 of Step 2 the government proposes to make a further adjustment to take account
of the extent of change in the affordability ratio over time. The affordability ratio for each local
authority ten years before the most recent available ratio will be subtracted from that ratio. The
difference will be multiplied by 0.25 and added to the figure from Step 2 Stage 1 to give a final
factor. For Mole Valley, the 2019 ratio was 13.55. The ratio in 2009 was 8.33 and the difference
between these ratios is 5.22. Multiplying this by 0.25 gives an addition of 1.305. Adding this to the
factor from Step 2 Stage 1 gives an adjustment factor of 1.901875. Finally, the new approach
proposes a further addition of 1.0 to this factor, making a final adjustment factor of 2.901875.
Authorities where affordability has worsened over the last ten years will have their estimated need
increased as a result of this additional factor, whilst those where affordability has improved will
experience a reduction in need.
3.24 The final part of the calculation (equivalent to Step 3 in the existing standard methodology)
is to apply this factor to the baseline figure from Step 1. For Mole Valley this indicates an overall
assessment of 193.8644 * 2.901875 = 563 dwellings (rounded to the nearest whole dwelling). The
government proposes that this figure should not be subject to capping as under the present method.
The result of this new proposal is to increase the standard assessment for Mole Valley by 110
dwellings per annum or 24.3%. When aggregated across all local authorities in England, the
proposed new methodology produces an estimate of 337,250 dwellings. The stages in this
calculation are summarised below:
Households at 2020 (ONS 2018-based projection) 37,207
Households at 2030 (ONS 2018-based projection) 38,584
Net Household Growth 1,377 over 10 years
Local affordability ratio (March 2020) 13.55
Adjustment factor 1 – affordability ratio 1.596875
Adjustment factor 2 – change in affordability 1.305000
Combined adjustment factor 2.901875
Housing requirement 563 units pa
Regulation 18 Draft plan requirement 449 units pa
SHMA OAN 2016 391 units pa
3.25 The proposed new standard methodology on its own would lead to an annual addition to
the dwelling stock in Mole Valley of almost 1.5%. Compounded over a twenty-year period this would
result in a 30% increase in the dwelling stock in the district, and over thirty years a more than 50%
increase. The scale of growth implied by the standard methodology is therefore transformational. It
exceeds the level of household growth projected on current trends over the 2020-2040 period, 7%,
by a very wide margin.

27
Housing and economic growth
3.26 In 2018, Mole Valley Council published an Economic Prosperity Strategy19. It set out a
considerable number of economic strengths in the district, including the high productivity level of its
economy, the high proportions of knowledge based workers with creative and entrepreneurial
talent, the low level of unemployment at that time, the attractive environment, good links to
London, and proximity to both Gatwick and Heathrow airports. It noted that Mole Valley plays an
important role in the Gatwick Diamond area which in turn plays a significant role in the economy of
the South East region. The relationship between Mole Valley and the Gatwick Diamond is discussed
in detail in Appendix 1. There were also some threats to be addressed in the strategy including a
highly constrained built environment, a shortage of commercial and industrial premises, an ageing
population, and significantly a shortage of affordable housing/accommodation. The strategy
highlighted the need to strike a balance between protecting the natural environment (which was an
important factor making the area attractive to businesses and workers), and the need to support the
economy and meet affordable housing requirements.
3.27 The economic strategy does not set employment growth targets, so it is impractical to assess
the specific housing requirement arising from its proposals. However, the scale of additional housing
provision identified by the current standard national housing need assessment methodology and the
currently-proposed revised methodology are both significantly greater than the underlying trend in
demographic household growth. Demographic growth averages 137 dwellings per annum over the
2020-2030 period, the current standard assessment identifies a need of 453 dwellings per annum,
and the proposed new approach set out in the Government’s consultation identifies a need of 563
dwellings. These levels of need clearly provide a very wide margin of housing provision above the
basic demographic need and should be adequate to support economic growth.
Market signals
3.28 In the past, NPPG relating to housing need estimation required local authorities to consider
the need for an uplift to housing need to take account of market signals. These were indicators such
as house prices or affordability ratios which could show that the demand for housing was higher
than that indicated by demographic trends. Guidance did not suggest any specific uplift or relate the
degree of uplift to any specific indicators. Over time, as a result of the accumulation of evidence at
Local Plan enquiries and from other sources, Planning Inspectors tended to identify an uplift of 20%
as justified when severe affordability problems were identified in an area. Such rates were applied in
some (but not all) areas of the South East and East of England and in London where affordability
problems were worst. Subsequently, through its standardised need assessment methodology, the
government defined a ‘factor’ which it required local authorities to apply to basic demographic
need. This was based on the level of housing affordability in an area. Under the present standard
methodology the multiplier applied to Mole Valley before capping is 1.6 (rounded to one decimal
place), or 60%, some three times the uplift previously identified to take account of market signals. In
new proposals under consultation, the ‘factor’ will be increased to 2.9 (or 190%, some 9.5 times the
20% uplift), as the proposed new method takes account not only of current affordability problems
but the rate of change in affordability over time.
19 Mole Valley Council (2018) Mole Valley Economic Prosperity Strategy 2018-2028, July 2018

28
3.29 The 2016 SHMA showed steadily rising residential land and rural land prices across the South
East and this trend has continued. There is no reliable data on local land prices. House prices have
increased significantly over the period since 2005 (Figure 3.1) but they have stabilised since 2017.
House price indicators such as those published by ONS do not yet reflect COVID-19 (2020 data in
Figures 3.1 and 3.2 are as of March 2020, before the first lockdown would have impacted). Some
commentators considered that the COVID-19 crisis would cause reductions in house prices, but the
evidence at the time of writing is that in areas such as Mole Valley and for larger dwelling types with
gardens, demand and prices are increasing. The Stamp Duty freeze may have played a part in this
and it remains to be seen whether recent increases will be sustained if this freeze ends and
unemployment rises.
Figure 3.1 Mean and lower quartile house prices in Mole Valley 2005-2020
Source: ONS, House Price Statistics for Small Areas (HPSSAs) datasets 12 and 15.
3.30 Sales volumes were also described as an indicator of market signals in previous NPPG. They
have remained in the 1,000-1,500 dwellings per annum range since 2009. They fell slightly after
2016, and probably much more sharply during the lockdown of early 2020, but at present volumes
are rising again as the market ‘catches up’.
0
100,000
200,000
300,000
400,000
500,000
600,000
2005 2006 2007 2008 2009 2010 2011 2012 2013 2014 2015 2016 2017 2018 2019 2020
Sa
le p
rice
£
Mean Lower quartile
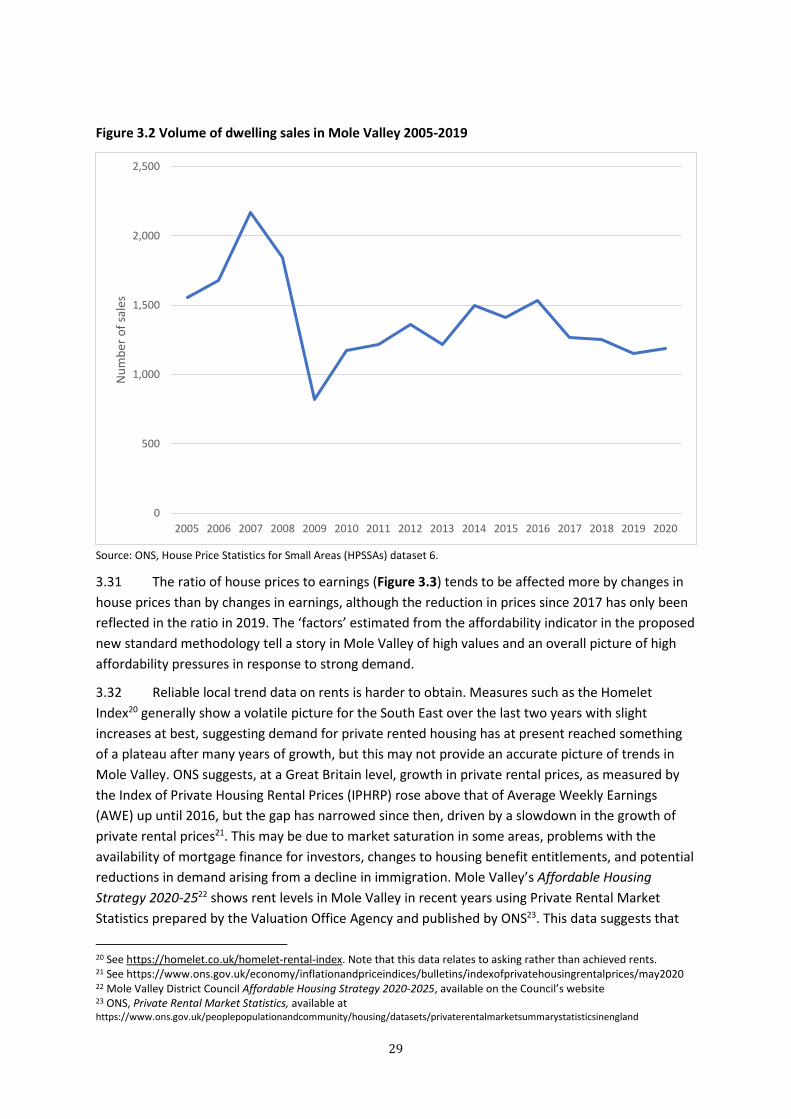
29
Figure 3.2 Volume of dwelling sales in Mole Valley 2005-2019
Source: ONS, House Price Statistics for Small Areas (HPSSAs) dataset 6.
3.31 The ratio of house prices to earnings (Figure 3.3) tends to be affected more by changes in
house prices than by changes in earnings, although the reduction in prices since 2017 has only been
reflected in the ratio in 2019. The ‘factors’ estimated from the affordability indicator in the proposed
new standard methodology tell a story in Mole Valley of high values and an overall picture of high
affordability pressures in response to strong demand.
3.32 Reliable local trend data on rents is harder to obtain. Measures such as the Homelet
Index20 generally show a volatile picture for the South East over the last two years with slight
increases at best, suggesting demand for private rented housing has at present reached something
of a plateau after many years of growth, but this may not provide an accurate picture of trends in
Mole Valley. ONS suggests, at a Great Britain level, growth in private rental prices, as measured by
the Index of Private Housing Rental Prices (IPHRP) rose above that of Average Weekly Earnings
(AWE) up until 2016, but the gap has narrowed since then, driven by a slowdown in the growth of
private rental prices21. This may be due to market saturation in some areas, problems with the
availability of mortgage finance for investors, changes to housing benefit entitlements, and potential
reductions in demand arising from a decline in immigration. Mole Valley’s Affordable Housing
Strategy 2020-2522 shows rent levels in Mole Valley in recent years using Private Rental Market
Statistics prepared by the Valuation Office Agency and published by ONS23. This data suggests that
20 See https://homelet.co.uk/homelet-rental-index. Note that this data relates to asking rather than achieved rents. 21 See https://www.ons.gov.uk/economy/inflationandpriceindices/bulletins/indexofprivatehousingrentalprices/may2020 22 Mole Valley District Council Affordable Housing Strategy 2020-2025, available on the Council’s website 23 ONS, Private Rental Market Statistics, available at https://www.ons.gov.uk/peoplepopulationandcommunity/housing/datasets/privaterentalmarketsummarystatisticsinengland
0
500
1,000
1,500
2,000
2,500
2005 2006 2007 2008 2009 2010 2011 2012 2013 2014 2015 2016 2017 2018 2019 2020
Nu
mb
er
of
sale
s

30
rents have recently been static, or for larger units, fallen slightly, but it should be noted that ONS
caution against using this data to infer trends over time.
Figure 3.3 Ratio of median house price to median workplace-based earnings, Mole Valley 2005-
2019
Source: ONS, Ratio of house price to workplace-based earnings (lower quartile and median), 1997 to 2019.
3.33 In terms of other indicators of market signals, overcrowding nationally has shown a steady
increase in both the social rented and private rented sectors in the last decade, whilst in the owner-
occupied sector it has declined24. Data at local level is not available after 2011. The lack of up to date
data also affects estimates of concealed households (households involuntarily sharing housing with
another household because they cannot afford or obtain separate accommodation).
3.34 Homelessness was highlighted in former NPPG as a market signal. The Mole Valley
Affordable Housing Strategy 2020-2025 includes data on trends in homelessness and the
Homelessness Review 2019 and the draft Homelessness Review 2020 show that levels of
homelessness have increased in recent years, particularly applications from single people and
couples under 55 who have complex needs (a mix for example of mental health substance misuse
and offending). Homelessness is an indicator of the demand for affordable rather than market
housing, as most of those presenting as homeless would be unlikely to be able to afford open
market housing. The Strategy also indicates that numbers on the Council’s Housing Register have
fluctuated between 450 and 560.
3.35 The conclusion which emerges from these indicators is that in terms of the measure of
house prices relative to incomes, Mole Valley remains an area with serious affordability problems, in
24 See House of Common Library Paper on Overcrowding at
https://researchbriefings.files.parliament.uk/documents/SN01013/SN01013.pdf
0.00
2.00
4.00
6.00
8.00
10.00
12.00
14.00
16.00
2005 2006 2007 2008 2009 2010 2011 2012 2013 2014 2015 2016 2017 2018 2019
Ra
tio
of
me
dia
n h
ou
se p
rice
to
me
dia
n w
ork
pla
ce-
ba
sed
ea
rnin
gs

31
common with most parts of the South East region and London. Although the affordability ratio has
levelled off recently, it is too soon to determine whether this is an established trend. Other
indicators such as rent levels or overcrowding are more inconclusive, partly as a result of data
problems. However, given the size of the uplift relating to affordability issues generated by the
standard methodology for assessing housing need, and the even greater uplift under proposals to
change this methodology, there seems no case for adding any further uplift to take account of
market signals in Mole Valley.
Other considerations when determining the future level of housing provision
3.36 Mole Valley is mostly rural in character and includes the North Downs and Surrey Hills Area
of Outstanding Natural Beauty (AONB). 76% of the district is included within Green Belt. The
majority of sites for new housing are located within the main urban areas and on brownfield land.
Housing developments comprising more than 50 units are in short supply. Finding sites for new
housing is thus a considerable challenge, as the August 2020 Housing Delivery Test Action Plan
indicates25. There are currently few site allocations contributing towards housing delivery, with the
majority of new housing emanating from previously unidentified sites. In particular, changes of use
from offices to residential purposes are making a large contribution towards housing delivery,
although these do not contribute towards affordable supply.
3.37 Although there was a rising trend in net dwelling completions over the 2015-2018 period,
the new target established by the standard assessment of need set out in NPPF is well above current
levels. The proposed new standard assessment, if implemented, will be three times the level in the
Core Strategy. It is unsurprising that such a sharp increase in need will prove challenging.
3.38 The Council has recognised this as an issue in the Housing Delivery Test Action Plan 2020 .
The key action to increase housing delivery is to progress with preparing a new Local Plan, and in
addition to:
• Allocate sites for housing development;
• Release some employment land to housing development where it is not suitably located, is
inaccessible to services or not appear to meet the needs of businesses;
• Pursue policies to encourage intensification of use and higher densities in built-up areas;
• Examine the phasing of large site allocations to release land as quickly as possible.
Table 3.5 Housing supply and housing targets
Total Market Affordable Target
2009-10 115 60 55 188
2010-11 113 91 22 188
2011-12 235 147 88 188
2012-13 173 150 23 188
2013-14 127 106 21 188
2014-15 190 124 66 188
2015-16 158 118 40 353
2016-17 209 194 15 358
25 Mole Valley District Council (2020) Housing Delivery Test Action Plan 2020, available from the Council’s website

32
Total Market Affordable Target
2017-18 374 334 40 318
2018-19 157 116 41 449
Total 2009-2019 1851 1440 411 2604
Average 2009-
2019 185 144 41
Sources: Mole Valley District Council: AMRs for various years; Housing Delivery Test Action Plan August 2020; Affordable
Housing Strategy 2020-2025
3.39 Chapter 4 below considers the need for affordable housing. Not surprisingly, given the high
prices and rents in the authority, there is a significant need for affordable housing. The Council has a
track record of securing affordable housing, with an average of 41 affordable completions per
annum over the 2009/10-2018/19 period26, despite a temporary fall in provision in 2016/17. In
addition to setting targets for the proportion of new homes which take the form of affordable
housing, the Council may wish to consider boosting overall housing supply targets specifically in
order to increase the supply of affordable housing, though in practice this may be unfeasible given
the constraints on land in the authority and the financial viability of affordable housing provision
given that Mole Valley is a high value area
Exceptional circumstances
3.40 NPPG requires local authorities to follow the calculation set out in the standard national
methodology for housing need assessment unless they can demonstrate that exceptional
circumstances apply27. The guidance identifies circumstances under which it might be appropriate to
increase the estimate of housing need over that produced by the standard national methodology.
These include cases where a deliverable growth strategy is in place (one where funding is in place to
facilitate growth); where strategic infrastructure improvements have or will shortly take place;
where an authority agrees to take on unmet need from a neighbouring authority; or where the
national methodology produces a result which is below past levels of delivery or another need
assessment. An approach which results in a higher level of need than that produced using the
standard methodology will be considered sound28.
3.41 In contrast, where an alternative approach results in a lower housing need figure than that
identified using the standard method, it will be necessary to demonstrate, using robust evidence,
that the figure is based on realistic assumptions of demographic growth and that there are
exceptional local circumstances that justify deviating from the standard method. This will be tested
at examination. Guidance does not indicate what might constitute special circumstances.
Constraints posed by land supply or by policies to protect land such as Green Belt are not matters
of need, but instead are considered at a later stage when formulating policies to meet assessed
need rather than as factors which reduce need. A possible example might be a situation where
trend demographic projections are misleading because they include a recently completed
settlement expansion. No special circumstances of this kind can be identified in Mole Valley.
26 See the 2017/18 AMR on the Council’s website 27 NPPG, Housing and economic need assessment, para 010 28 NPPG, Housing and economic need assessment, para 015.

33
Required size of market housing
3.42 The NPPF, supported by NPPG, requires a breakdown of the size requirement for new
market housing. If actual occupancy levels within the existing market sector stock are compared to a
measure such as the bedroom standard29, it is clear that the existing private stock is significantly
under-occupied, most especially in the owner occupied sector where 74% of households have more
bedrooms than indicated by the standard (Table 3.6)30. Even in the private rented sector, where
housing costs are more closely related to accommodation size, 51% of households occupy more than
the standard. Conversely, within both social and privately rented housing, a significant minority of
households are overcrowded. This would suggest that a concentration on smaller dwellings in future
market provision would lead, in the long run, to a better overall match with the bedroom standard.
However, the scale of under occupation is difficult to address, even in the medium term, because
annual additions to the stock are small relative to the dwellings already in existence.
Table 3.6 Occupancy rating by tenure 2011
2+ bedrooms
more than BS
1 bedroom
more than BS Matching BS
1+ bedrooms
less than BS
Social tenants 9% 18% 66% 7%
Private tenants 16% 35% 42% 7%
Owner occupiers 53% 33% 13% 1%
All households 43% 31% 24% 3%
Source: ONS, 2011 Census, Table DC4105EWla - Tenure by occupancy rating (bedrooms) by household composition
3.43 In practice, the bedroom standard plays no part in determining actual occupancy patterns in
the private sector. These are determined by the operation of the market, with households
consuming the amount of space which they can obtain and afford. It may therefore be argued that
future dwelling completions should accept the reality of current levels of under occupation.
3.44 However, it should not be assumed that this picture will remain unchanged. Affordability
pressures have already exerted an influence on household space consumption decisions in London
and the South East, for example through the conversion of housing built for single family occupation
into smaller flats in some areas. Worsening affordability might, in future, increase the demand for
smaller units. An increase in the proportion of private renting might increase the demand for smaller
units, as occupancy levels in the sector tend to match household size more closely than in the
owner-occupied sector. In the owner-occupied sector, households generally might wish to occupy
dwellings with more bedrooms, more bathrooms and other facilities, and spaces for home working
or other leisure activities, if they can afford to. In the short term at least, COVID-19 seems to be
increasing the demand for larger dwellings to facilitate home working, though it is inadvisable to
regard this as an established long-term trend at this stage. Conversely, more old people might seek
to downsize to smaller units if purpose built private housing for older people were to become more
popular than at present, or as a result of incentives such as the temporary removal of Stamp Duty on
properties costing under £500,000.
29 The minimum standards set under Part 10, Housing Act 1985 to determine the numbers of bedrooms required by
different types of households, below which they are categorised as overcrowded. 30 2011 Census data is used here as it is the most up to date available on overcrowding and under occupation at local level

34
3.45 Projected changes in household composition can also be used as a guide to housing size
requirements. In their current form, official household projections do not directly indicate the
breakdown of households by size, but they include projections of household type. Applying
assumptions about dwelling size requirements by household type31 to the projections (Table 3.7)
indicates only slight overall changes in bedroom requirements during the 2018-2043 period.
However, most of the net increase over the 2018-2043 period is in households requiring a one or
two-bedroomed unit (78% of the increase). The impact of assuming one additional spare bedroom
for each household type is shown in the final column of the table.
Table 3.7 Change in bedroom requirements arising from projected household growth
2018 2043 Net increase Spare
bedroom
No. of bedrooms
reqd Number Percent Number Percent Number
% of
increase
% of
increase
1 5605 15% 6677 17% 1072 33% 0%
2 15181 41% 16663 41% 1482 45% 33%
3 9582 26% 9794 24% 212 6% 45%
4 6610 18% 7141 18% 531 16% 22%
All sizes 36979 100% 40276 100% 3297 100% 100%
Source: ONS 2018-based household projections Stage 2
3.46 In the case of Mole Valley, only a proportion of the total housing requirement generated by
the standard national methodology arises from projected new households from Mole Valley. These
are the households forming the Step 1 demographic baseline. Most households occupying new
housing (or housing released by other households moving into new housing) will come from outside
the district, and their demands in terms of dwelling size are unknown. It may be that a high
proportion are seeking larger dwellings but conversely many may be retirees looking to downsize. So
it may not be appropriate to place undue significance on the changes in the demand for dwellings of
different sizes arising from the household projections. The need to make the most effective use of
land to meet housing need also suggests the provision of a high proportion of small units in the
future. A concentration on smaller dwelling units would be the most likely to contribute to reducing
under-occupation, increasing affordable supply, and thereby improving the affordability of housing
in the private sector.
3.47 These differing considerations suggest two alternative approaches to determining the future
size breakdown of market housing in Mole Valley. On the one hand, a focus on smaller units would
have the benefit of securing the greatest yield from the limited land supply; it would make a greater
impact on affordability because smaller dwellings tend to be lower-priced; it aligns with the picture
of demand shown by household projections if a relatively tight match between household and
dwelling size is assumed; and it would allow for changes to the current pattern of occupancy of the
private stock by enabling a greater degree of downsizing by existing under-occupying households, if
we assume that the demand for downsizing exists on a substantial scale. On the other hand, a
greater focus on larger dwellings would provide a much closer match to the actual pattern of
31 It is assumed that one-person households require either one or two bed dwellings (50% of each); that the demand from
multi-adult households is split equally between two, three and four-bedroomed dwellings; and that households with
children require one bedroom per child.

35
occupancy in the private sector at present. There is no evidence that this pattern of occupancy will
change in the future, unless compelled to do so by higher prices.
3.48 A position between these two approaches would deliver some gains in terms of more
efficient land use and the reduction of under occupancy, whilst reflecting the reality of private sector
demand to a considerable extent. Table 3.8 shows the size breakdown of the private sector housing
stock in 2011, the latest year for which this breakdown is available. We propose modifying the
requirement for one-bedroom units from the 33% suggested by projected future demand to 25% to
align with the 2011 demand in the private rented sector. Two bedroomed units currently make up
23% of the existing private stock, and 45% of projected future demand. An increase in the
proportion of new units with two bedrooms would contribute to both the reduction of under-
occupation and the improvement of affordability, in addition to increased densities and the more
efficient use of scarce land resources. It is therefore recommended that 45% of new build stock
should be of two bedrooms. Three-bedroomed dwellings currently form the largest proportion of
the dwelling stock (34%). There is clearly a strong current demand for these dwellings but a much
lower level of projected demand. A reduction in the proportion in the new build stock to 20% would
provide more scope for smaller homes. The proportion of the private sector stock in the authority
with four and five or more bedrooms in 2011 was high (23%). This element of the stock probably
contains a high proportion of under-occupying households, some of whom may be older people
looking to downsize if more attractive smaller units were available. This process would not only
ensure better use of the stock, but also ensure that there was adequate provision for those seeking
larger units without much additional new build. On the other hand, increased home working and a
general demand for more living space would suggest that a reasonable proportion of new dwellings
should be of this size. This suggests that the target for dwellings with four bedrooms or more should
be 10% of the total new build.
Table 3.8 Number of bedrooms in existing stock
1 2 3 4 5 or more
Owner occupier 5% 21% 36% 26% 12%
Private tenant 26% 39% 24% 7% 3%
All private 8% 23% 34% 23% 11%
Proposed target
for market housing 25% 45% 20% 10%
Source: ONS, 2011 Census Table DC4405EW - Tenure by household size by number of bedrooms
Required dwelling type
3.49 The current mix of dwellings by size provides some guidance on the required dwelling size
mix in the future, because there is a potential link between household size and dwelling size, albeit
one which is overlain and blurred by incomes, aspirations and allocation policies. There is no similar
determinant of the demand for dwellings of different types which is more strongly preference-
based. Table 3.9 shows the breakdown of dwellings by type in Mole Valley in 2011, the latest date
for which this information is available. The owner occupied stock was overwhelmingly in the form of
houses and even in the two rented sectors only a third of dwellings were flats. In the intervening
period since 2011, a considerable number of flats have been constructed or created by conversion,
including the conversion of office space, but as the total increase in the stock over this period has

36
been in the order of 1,600 units32, this is unlikely to have changed the overall dwelling type profile
dramatically.
Table 3.9 Dwelling type by tenure 2011
Percentage of each dwelling type by tenure
Houses Flats
Det-
ached
Semi det-
ached
Terr-
aced Other
All
houses
Purpose
-built
Con-
verted Other All flats
Owner
occupied 43% 26% 11% 10% 90% 6% 2% 2% 10%
Private rented 12% 15% 9% 32% 68% 21% 6% 6% 32%
Social rented 2% 21% 10% 34% 66% 31% 2% 0% 34%
All hhds 32% 23% 10% 17% 83% 12% 2% 3% 17%
Source: ONS, 2011 Census, Table DC4407EW - Tenure by number of persons per bedroom in household by accommodation
type
3.50 If the pattern of 2011 demand in the private sector is a guide to the future, only a small
proportion of the private sector dwellings to be constructed over the period 2018-2043 should be in
the form of flats or apartments. However this picture may now be out of date, and in addition, the
need to increase the supply of affordable housing, the need to make the best use of limited land
supplies, and the significant requirement for smaller housing units demonstrated in the previous
section all suggest an increased role for flat provision in the future and a corresponding reduction in
the proportion of dwellings which are in the form of houses. In predominantly urban locations,
especially in large cities, preferences for apartment accommodation may have increased amongst
some groups since 2011 – predominantly amongst young people but also amongst some older
people. But in contrast, looking at future household growth, there are projected declines in the
number of households with dependent children, and increases in the numbers of one person
households. This would suggest an increase in the demand for smaller accommodation. But there is
no simple direct correspondence between household type and dwelling type (for example people
living alone by no means prefer to live in flats). In addition to these changes, the largest increase in
any household type over the period 2018-2043 in Mole Valley is in multi-adult households. This is a
wide category and includes, for example, both childless couples or couples whose children have left
home, and groups of younger unrelated adults sharing housing as a lifestyle choice or to reduce their
housing costs. The latter might perhaps constitute an increased market for flatted accommodation.
However, there is no clear supporting case and this would suggest a cautious approach. Increasing
the target of provision for flats to 25% of private sector new development would make a positive
contribution to increasing likely densities whilst at the same time recognising the reality of demand
in the private sector. In the future, Build to Rent may make a greater contribution to apartment
supply than in the past. One large scheme is already proposed which includes some affordable units.
3.51 The significance in current housing supply of conversions from office use, and the
encouragement being given to this process by government policy, suggests that a significant
proportion of future development will be converted flats. Concerns have been expressed that the
space standard in some units have been inadequate. However, this is a matter of supply rather than
32 The proportion of these which were flats is unknown.

37
of need. There are other ways of achieving higher densities than through the construction of flats
and apartments, or by using airspace.
Conclusion
3.52 NPPF and NPPG specify that local authorities should use the Government’s standardised
need assessment methodology to calculate the level of housing need in their areas in order to
inform the setting of a level of provision for new housing in their local plans, unless there are
exceptional circumstances. At present this leads to an annual housing need level of 453 dwellings in
Mole Valley. Under new proposals, subject to consultation, this will increase to 563 dwellings per
annum.
3.53 The standardised assessment leads to a much higher estimate of housing need than that in
the Council’s current Core Strategy and that produced in the 2016 SHMA. It is also much higher than
the level of trend-based household growth in the most up-to-date official projections, indicating that
the district will become a substantial importer of households from outside its boundaries in the
future. However, NPPF is clear that the estimate of need produced by the standard national
assessment should be used unless exception circumstances suggest otherwise, and no such
circumstances have been identified or suggested to us.
3.54 The recommended breakdown of dwellings by size in the new build stock, other than that
being provided to meet the need for affordable housing, is 25% one-bedroomed units, 45% two-
bedroomed units, 20% three-bedroomed units, and 10% four-bedroomed units. Although this does
not match the current pattern of stock, it will contribute to a reduction in under occupation in the
authority, to the improvement of affordability by creating more lower cost dwellings, and to the
achievement of higher densities. More caution is needed in relation to the supply of dwellings by
type, but a target for new private development of 25% flats and apartments is recommended. This
represents a substantial departure from the overall pattern of dwellings in the district, but may be
more closely aligned to current new provision.

38
Chapter 4
Affordable housing need
Key messages
• This chapter estimates the requirement for affordable dwellings in Mole Valley using a
spreadsheet model based on National Planning Practice Guidance – Housing and Economic
Needs Assessment, paragraphs 18-24.
• The need for affordable housing differs from overall new housing need. The latter is an
assessment of the amount of additional housing stock required to cater for future household
growth, using the Government’s formula. The affordable housing requirement estimates the
total amount of affordable housing required, which could be met in a variety of ways in
addition to building more homes (for example, by the reletting of existing affordable homes
when tenants leave).
• Backlog housing need is need which exists at the start of the period for which a plan is being
prepared. It was assessed to be 1,196 households. It was assumed that backlog housing need
would be met over a ten-year period, leading to an annual quota of backlog need of 120
households.
• There are two additional sources of affordable housing need. The largest source is newly
forming households (598 per annum). The other is existing households not currently in need
but falling into need in the future (28 per annum).
• These three sources of need add up to an overall total of annual need of 746 households,
before taking account of the ability of these households to afford market housing.
• To assess the number of households in need which were unable to afford market housing,
estimates were obtained of the distribution of household incomes in the authority, and of the
incomes of the specific groups defined in NPPG as potentially in need. Household incomes were
compared with the threshold entry cost for market housing (the lower quartile private rent), to
give an estimate of the number of households in need of affordable housing.
• An estimated 262 households per annum could not afford to pay the market entry threshold
cost and therefore needed affordable housing.
• Other affordable housing thresholds were also examined. The lowest cost threshold was based
on current actual average rent levels in the social rented sector. 68 households per annum
could not afford these rents (the estimates of incomes include housing benefits) suggesting that
the housing benefit system is not helping all households to fully meet their housing costs, and
that some low income households will need to spend a higher proportion of their income on
housing than assumed.
• 52 households could afford a social rent, and a rent up to 59% of the lower quartile private
rent. They would therefore require social rented housing at or slightly above current social rent
levels.
• The next threshold was set at 60% of the lower quartile market rent, which approximates to
Affordable Rents. 87 households could afford a rent at 60-79% of the lower quartile market
rent.

39
• This leaves another 55 households who could afford 80-99% of the market threshold rent,
which is comparable to the costs of Shared Ownership.
• As a further indicator, housing thresholds were identified for new building dwellings by number
of bedrooms and the ability of households to purchase at these levels under the proposed First
Home mechanism was examined. 202 households could buy a first home each year, most of
whom required one or two bedroomed units. Those able to afford a larger unit would probably
have an income above the eligibility level for the scheme.
• These numbers should not be treated as exact, because a household near any one of the
thresholds might shift its demand by devoting more of its income towards housing.
• The annual supply of affordable housing units is estimated at 119 units, and deducting this
from gross need of 262 provides a net annual requirement for affordable housing of 143 units
per annum.
• There is an apparent small surplus of one-bedroomed units. Setting this aside, 50% of
affordable units should be two-bedroomed, 35% three bedroomed and 15% four-bedroomed.
• The Council’s Affordable Housing Strategy 2020-2025 indicates that there is an over-supply of
unpopular older persons’ accommodation (which is not let as supported housing) in the
housing association stock which would account for the surplus.
• The chart below summarises the process of calculating affordable need and the numbers in
need.

40

41
Introduction
4.1 This chapter concerns the requirement for affordable dwellings as distinct from the overall
need for housing set out in Chapter 3. National Planning Practice Guidance (NPPG) sets out a well-
established framework for calculating the need for affordable housing. This has not changed
significantly in recent revisions to NPPG . The process of calculating affordable housing need involves
adding together the current backlog of unmet need for affordable housing and the projected future
need for affordable housing; and subtracting the current supply of affordable housing stock. Cobweb
Consulting has developed a spreadsheet-based model which follows the steps set out in official
guidance to produce an assessment of affordable housing need. The spreadsheet is transparent and
set up to facilitate changes in a range of basic input assumptions and the updating of input sources.
Unless otherwise stated, this model is the source for all the figures and tables in this chapter.
4.2 The need for affordable housing differs from the overall need for housing. Overall housing
need is an assessment of the amount of additional housing stock required to cater for future
household growth. It is a net addition to the dwelling stock of all tenures. The affordable housing
requirement estimates the total amount of affordable housing required to meet the needs of
households which cannot afford to access market housing. It assesses the ability to afford housing
across all newly-forming households, not simply the net addition to household numbers, adds in any
current backlog, and offsets this against the supply of affordable housing in the current stock to
produce an estimate of how much additional affordable housing is needed. The two estimates are
not directly related, and the need for affordable housing could in theory be met by the transfer of
existing dwellings from the market (for example, through purchase by the local authority or a
Registered Provider) to the affordable sector. However, new building is an important source of
affordable housing supply.
4.3 The model assumes that all households who cannot afford market housing require some
form of affordable housing. The types of affordable housing provision available and the costs
associated with these have evolved rapidly in recent years, so the model is set up to be independent
of the exact type of provision. It requires as an input the monthly or annual cost of each type of
affordable provision in order to estimate the number of households in need who cannot afford
higher costs. In this report the model has been modified to include an assessment of the number
of households in need which can afford a First Homes product – a new government product
promoted in Changes to the Current Planning System which will provide a discount on the
purchase price for first time buyers and some other groups.
4.4 The supply of private rented dwellings is not included within the model as there is no
guarantee that this supply will be allocated to those in affordable need or indeed that it will continue
within the supply, as this is subject to the decisions of individual private landlords. However, the
potential contribution of this sector is important as a source of provision for those in affordable
housing need, especially with the assistance of Local Housing Allowance and support through the
benefit system, although this assistance is of course subject to reform at the present time. This is
discussed further at a later stage in this chapter and also in Chapter 5.
Household incomes and the ability to afford housing
4.5 The main requirement for estimates of affordable housing need is data on household

42
incomes. Local data on household incomes is not readily available in the form required to produce
estimates of the ability of different household groups to afford different types of housing. Several
commercial companies produce local estimates of the distribution of household incomes as a whole.
Incomes produced by CACI Paycheck, have been used in this SHMA as the basis for estimates of the
distribution of incomes for various groups in 2020. The methodology for the CACI estimates is not
published in detail by the company, but they are modelled using a variety of information sources and
indirect indicators, rather than being fully based on a survey of incomes. Table 4.1 (second column)
shows the median, lower and upper quartile and decile incomes for all households in Mole Valley in
2020.
4.6 The CACI estimates cover all households. This is of limited value in estimating affordable
housing need as it includes many households who can readily afford market housing. Instead, the
methodology requires income data for different groups in need: concealed households,
overcrowded households, homeless households and households on the housing register, newly
forming households and existing households falling into need. To obtain this, the ratio of the
incomes of each group to the incomes of all households was estimated using data from the English
Housing Survey (EHS). This exercise was carried out for each decile point on the income spectrum
and for each of the four dwelling sizes. These ratios were then applied to the CACI Paycheck data for
all households to produce estimates of the incomes of each need group33.
4.7 Table 4.1 below shows each decile point in the income distribution of households in Mole
Valley in 2020, together with the quartiles and the median using CACI Paycheck data. 50% of
households in the authority have an estimated income in excess of £48,116 per annum, so Mole
Valley is undoubtedly a high income area. However, some households have very low incomes and
10% have an income of less than £16,019 per annum. As would be expected, households in need
have very different income profiles to the population as a whole. Homeless households, to take an
extreme example, tend to have much lower incomes. Tables 4.1a to 4.1e show the estimated
incomes of the five groups in need of housing whose numbers are estimated in this chapter. These
are broken down by the number of bedrooms which they require when their needs are measured
against the bedroom standard.
4.8 Household incomes are translated in the model into an estimate of the housing costs which
they could pay for – a gross income of £X per annum will enable a household to afford a mortgage of
£Y, or monthly rental of £Z. Several assumptions, all changeable within the model to test
alternatives, are required to produce these estimates, as follows:
• The maximum percentage of income to be spent on housing costs, whether mortgage
payments, monthly rent, or a combination of these: In practice the model assumes this to be
the actual percentage spent, in order to minimise the demand for affordable housing. The
maximum percentages assumed were 25% for households with a gross income of up to
33 As a hypothetical example, if EHS were to show that the lower quartile income point for newly forming
households in the survey was three quarters of the lower quartile income point for all households, the CACI
estimate of the lower quartile income of all households in Mole Valley would be multiplied by 0.75 to give an
estimate of the lower quartile income of newly forming households. Separate factors are calculated for each
need group, for each of four dwelling size requirements, for the eleven income points shown in Table 4.1.
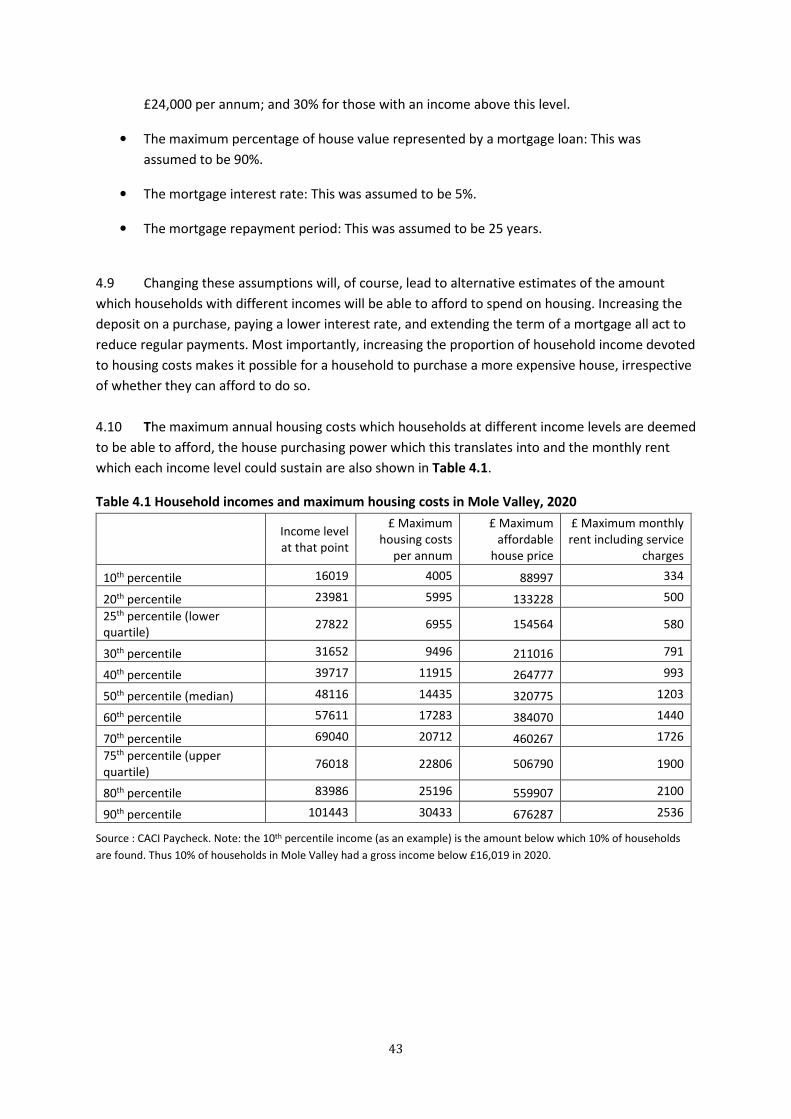
43
£24,000 per annum; and 30% for those with an income above this level.
• The maximum percentage of house value represented by a mortgage loan: This was
assumed to be 90%.
• The mortgage interest rate: This was assumed to be 5%.
• The mortgage repayment period: This was assumed to be 25 years.
4.9 Changing these assumptions will, of course, lead to alternative estimates of the amount
which households with different incomes will be able to afford to spend on housing. Increasing the
deposit on a purchase, paying a lower interest rate, and extending the term of a mortgage all act to
reduce regular payments. Most importantly, increasing the proportion of household income devoted
to housing costs makes it possible for a household to purchase a more expensive house, irrespective
of whether they can afford to do so.
4.10 The maximum annual housing costs which households at different income levels are deemed
to be able to afford, the house purchasing power which this translates into and the monthly rent
which each income level could sustain are also shown in Table 4.1.
Table 4.1 Household incomes and maximum housing costs in Mole Valley, 2020
Income level
at that point
£ Maximum
housing costs
per annum
£ Maximum
affordable
house price
£ Maximum monthly
rent including service
charges
10th percentile 16019 4005 88997 334
20th percentile 23981 5995 133228 500
25th percentile (lower
quartile) 27822 6955 154564 580
30th percentile 31652 9496 211016 791
40th percentile 39717 11915 264777 993
50th percentile (median) 48116 14435 320775 1203
60th percentile 57611 17283 384070 1440
70th percentile 69040 20712 460267 1726
75th percentile (upper
quartile) 76018 22806 506790 1900
80th percentile 83986 25196 559907 2100
90th percentile 101443 30433 676287 2536
Source : CACI Paycheck. Note: the 10th percentile income (as an example) is the amount below which 10% of households
are found. Thus 10% of households in Mole Valley had a gross income below £16,019 in 2020.

44
Table 4.1a Estimated incomes of overcrowded households
All
households Overcrowded households
Decile
£ per
annum 1 bed 2 bed 3 bed 4 bed
10 16019 NA 12008 22959 32126
20 23981 NA 15948 26212 38072
LQ 27822 NA 16937 28558 39098
30 31652 NA 16448 30386 40768
40 39717 NA 20649 33948 47394
Median 48116 NA 25897 37563 52447
60 57611 NA 31756 40269 59356
70 69040 NA 38675 43670 62245
UQ 76018 NA 47741 46610 64998
80 83986 NA 56933 53493 69306
90 101443 NA 71918 65077 83765
Table 4.1b Estimated incomes of concealed households
All
households Concealed households
Decile
£ per
annum 1 bed 2 bed 3 bed 4 bed
10 16019 5527 10064 15488 16943
20 23981 9423 13283 21005 25111
LQ 27822 11601 14062 22873 29091
30 31652 14100 13487 23996 31839
40 39717 17799 16518 26570 36733
Median 48116 22780 19714 28079 38855
60 57611 28014 23646 29534 43352
70 69040 30768 28270 31782 45479
UQ 76018 33799 34627 37000 46658
80 83986 39971 40706 43925 48068
90 101443 46976 51165 54202 58041
Table 4.1c Estimated incomes of homeless households and households on housing register
All
households
Homeless households and households on housing
register
Decile
£ per
annum 1 bed 2 bed 3 bed 4 bed
10 16019 5557 6827 12024 12656
20 23981 5409 9066 16396 18946
LQ 27822 5636 9628 17863 21980
30 31652 6624 9351 19006 24399
40 39717 7932 11739 21234 28366
Median 48116 9236 14722 23496 31390
60 57611 11164 18053 25188 35525
70 69040 14208 21987 27316 37253
UQ 76018 15768 27141 29154 38901
80 83986 16223 32367 33460 41480
90 101443 20934 40885 45632 50134

45
Table 4.1d estimated incomes of newly forming households
All
households Newly forming households
Decile
£ per
annum 1 bed 2 bed 3 bed 4 bed
10 16019 12929 12496 23154 33160
20 23981 14653 12846 22491 32127
LQ 27822 24782 22344 38449 65505
30 31652 30951 25983 39492 79164
40 39717 39971 34139 42450 81135
Median 48116 48141 42487 64818 88911
60 57611 55176 48107 73956 99694
70 69040 61918 55767 77821 142947
UQ 76018 63509 61369 90313 136425
80 83986 66927 65149 88427 130943
90 101443 76451 77176 104282 144499
Table 4.1e Estimated incomes of existing households coming into need
All
households Newly forming households
Decile
£ per
annum 1 bed 2 bed 3 bed 4 bed
10 16019 12165 11565 19759 25077
20 23981 16066 15276 24282 32277
LQ 27822 16949 16180 26442 34868
30 31652 16326 15543 27794 36935
40 39717 20074 19099 30813 42657
Median 48116 24658 22952 32774 45411
60 57611 29732 27615 34567 50772
70 69040 35311 33105 37241 53260
UQ 76018 43485 40594 40987 54782
80 83986 51685 47823 47233 56731
90 101443 64828 60155 57751 68512
Tables 4.1a to 4.1e are estimated from the CACI Paycheck data shown in col 2 of each table
Backlog need
4.11 The next stage in the calculation of affordable housing need calculates the currently unmet
need for affordable housing, or backlog need, as distinct from need which will arise in the future.
NPPG does not prescribe in detail which types of need should be included, but the following
categories have been used in this update:
• Concealed households (419 households). This is the same figure as that used in the
2016 SHMA. It cannot be updated because changes to the questions included in the
English Housing Survey no longer enable a calculation of the number of concealed
households to be made.
• Overcrowded households (449 households). This figure has been updated from the
2016 SHMA. The 2011 estimate of the number of overcrowded households in the
private sector in Mole Valley (625 households) was reduced by a factor of 0.8907, which

46
was based on the level of reduction in overcrowding for the South East region over the
period 2011-2019 derived from the English Housing Survey. A further reduction factor
of 0.8064 was applied to allow for overlap between overcrowded households and
households in other need categories. This factor is higher than that of 0.7500 used in
the 2016 SHMA (resulting in a smaller reduction). There is no data available on the
extent of such overlaps and the factor was estimated by examining 2018-19 EHS data on
overcrowded households (the most recent available) and assessing the proportion who
appeared to consist of a single family unit.
• Homeless households and households on the housing register (328 households). This
figure has been updated from the 2016 SHMA, to draw on the most up to date housing
register and homelessness data available. The total number of households on the
register in April 2020 who were not indicated as transferring from another social rented
housing unit was 407. An additional 11 households also indicated as living in social
rented housing were also deducted. A further 19 households were deducted as being
overcrowded and therefore duplicating the separate estimate of overcrowded
households. Some 98 households were deducted as being concealed – that is living with
parents, family or friends. Finally, 49 households were added to the list because they
were homeless and in temporary accommodation.
In order to provide an assessment of the size breakdown of affordable housing need, the assessment
of backlog need must be broken down by bedroom requirements. The bedroom requirement for
each sub-category of backlog need is derived directly from the original data source where available,
or if not, estimated using data from the English Housing Survey on the most comparable group for
which information was available.
Total backlog need
4.12 Adding the backlog of concealed, overcrowded, homeless and housing register households
together produces a gross backlog need for affordable housing of 1,196, after the deduction of all
those in need currently living in social rented housing, and reductions to eliminate duplication
between the sources of need.
4.13 Ideally, backlog need would be met as quickly as possible. Current NPPG does not specify a
period for meeting backlog need but previous NPPG recognises that it must be dealt with over a
period of several years and all assessments of affordable need include an assumption on the length
of this period. In a context of high demand such as Mole Valley, an extended period is likely to be
necessary. A period of ten years has been assumed in the model. This aligns with the 2016 SHMA.
The backlog of affordable need is therefore 120 dwellings per annum. Table 4.2 shows the
breakdown of annual backlog need by bedroom requirement, assuming that the need in each size
category is met at the same rate.

47
Table 4.2 Minimum estimate of backlog need in households per annum by bedroom requirement
No. of beds Number Percent
1 bed 26 22%
2 bed 43 36%
3 bed 25 21%
4+ bed 26 21%
Total 120 100%
Note: numbers may not exactly sum to total because of rounding
Newly arising need
4.14 The second component of affordable housing need identified in NPPG is newly arising need.
This will be generated in the future by newly forming households unable to afford access to market
housing, and by some existing households whose needs change. The first element of need arising
from newly forming households is estimated from the household projections examined in Chapter 3.
However, unlike the estimate of overall need, which is based on net new household formation, the
estimate of affordable housing need must be derived from gross new household formation (that is
all new household formation, without the deduction of households which dissolve). Affordable
housing released by households which dissolve is considered later in the calculation as part of
affordable supply. Household projections do not provide the required data directly. The model
follows the normal approach to estimating gross new household formation specified in previous
NPPG. The gross annual average number of newly forming households in Mole Valley is 598 per
annum34.
4.15 This estimate also provides a breakdown of the dwelling sizes required by these newly
forming households (Table 4.3). 57% of need from newly arising households (which are generally
single people or couples) is for one or two bedroomed units, but 31% require three bedroomed
units, and 12% require four bedroomed units.
4.16 The income distribution of newly forming households was estimated from English Housing
Survey data for the South East averaged over the period 2015-19. Newly-forming households include
some households with higher incomes as well as those on low incomes. Overall, the incomes of this
group are generally close to or slightly above the average for households as a whole, with those
requiring three bedrooms having the highest incomes.
Table 4.3 Newly arising need per annum in households by bedroom requirement
No. of beds Number Percent
1 bed 107 18%
2 bed 231 39%
3 bed 188 31%
4+ bed 72 12%
Total 598 100%
Note: numbers do not exactly sum to total because of rounding
34 This figure is calculated by averaging the increase in size of each five year cohort of projected households under the age
of 45 drawing on the latest official household projections.

48
Existing households falling into need
4.17 In the future, as well as newly forming households, some households currently in existence
may fall into need as a result of a change in circumstances. This is the most difficult category of need
to estimate and guidance does not specify an approach to use. The approach adopted in the model
is based on CORE35 data on lettings in the social rented sector averaged for the years 2014-2018. It
identifies new lettings to existing households falling into need as a result of a change in
circumstances such as eviction, inability to afford mortgage payments or rent. To smooth out annual
fluctuations in need, the number of households affected has been derived from an average of four
years CORE data. To allow for the possibility that local authorities and their partners cannot house all
those experiencing such problems in any one year, numbers in need have been increased by 25%.
The model estimates that 28 existing households will fall into need annually. Table 4.4 provides a
breakdown of their requirements by number of bedrooms, which is assumed to be the same as for
all households in backlog need.
Table 4.4 Existing households falling into need per annum by bedroom requirement
No. of beds Number Percent
1 bed 3 12%
2 bed 10 36%
3 bed 8 30%
4+ bed 6 22%
Total 28 100%
Note: numbers do not exactly sum to total because of rounding
4.18 The total annual level of need arising from backlog need, newly arising need and existing
households falling into need, is 745. This is subdivided by bedroom requirement as follows:
• One bedroom required: 137 (18%)
• Two bedrooms required: 284 (38%)
• Three bedrooms required: 221 (30%)
• Four or more bedrooms required: 104 (14%)
Estimating the proportion of households unable to afford market housing
4.19 The next step in the calculation of affordable need is to estimate the proportion of these
households who will be unable to afford to buy or rent a market dwelling. Following NPPG market
entry price/rent levels were determined from an analysis of sale prices and rents for housing of
different sizes36. The thresholds used for access to the market were the lower quartile cost of buying
on the open market, or of renting, whichever was the cheaper. Mortgage costs were converted to
monthly costs using the assumptions relating to deposit and interest rates described above. The
lower quartile thresholds utilised in the model for market prices and rents in Mole Valley are shown
35 CORE (Continuous Recording of Social Lettings) is a national database which records details of new social
tenants and the properties which are let to them. 36 For house sales, the lower quartile thresholds were obtained from the latest ONS House Price Statistics for
Small Areas, which in turn are derived from HM Land Registry sales data. For rents, the thresholds were
obtained from the most recently-published data on ONS Private Rental Market Rents. The thresholds were
checked against the perceptions of Mole Valley Council planning and housing officers.

49
in Table 4.5, broken down by bedroom requirement. At each bedroom size the lower quartile rent
threshold is lower than the cost of buying at the lower quartile price and it is this threshold which
determines affordability. As a result, households at the margin of those deemed able to afford
market housing will only be able to rent rather than to buy. The table also shows four other cost
levels for affordable housing, which we have modelled after discussion with Mole Valley officers.
Figure 4.1 shows how these thresholds relate to one another:
• A threshold based on average rents in the Social Rented sector, derived from published
national data on local authority lettings (detailed in Table 4.5);
• A threshold based on 60% of lower quartile market rents, which local knowledge indicates is
approximately the same as Affordable Rents;
• A threshold based on 80% of lower quartile market rents, which aims to be representative of
the annual cost of a Shared Ownership purchase;
• A threshold indicating the cost of a First Home, based on a discount of 30% on the lower
quartile price for each dwelling size.
Table 4.5 Market and affordable threshold prices/rents
Market solutions Affordable housing solutions
Beds
Buying: lower
quartile
threshold price
(£)
Renting in the
market: lower
quartile
threshold rent
(£ per month)
Renting at
current
average Social
Rents (£ per
month)
Affordable
Renting at 60%
lower quartile
market rent
level (£ per
month)
Shared
Ownership
equivalent:
Renting at 80% of
lower quartile
market rent (£
per month)
Buying at First
Homes discount
rate of 30% on
lower quartile
prices (£ per
month)
1 200,700 810 412 486 648 1,052
2 223,000 1050 498 630 840 1,578
3 400,000 1300 624 780 1040 2,651
4+ 664,000 1600 694 960 1280 3,137
Sources: HM Land Registry, ONS, and model estimates of price/rent differentials by dwelling size. Adjustments were made
to the lower quartile market rent for four-bedroomed units based on local knowledge.

50
Figure 4.1 Market and affordable prices/rents (£ per month)
4.20 Table 4.6 shows the number and percentage of households in need who are able/unable to
afford market housing at the thresholds shown in Table 4.5, lines 1 and 2. Thirty-five percent of
households in need cannot afford to access market housing at the thresholds shown in the table.
This means that 262 units of affordable housing are required annually to meet need, before taking
account of the annual supply through relets. The proportion of households requiring affordable
housing is highest for those requiring two-bedroomed accommodation (40%), followed by those
requiring three bedroomed accommodation (38%).
Table 4.6 Ability to afford market threshold housing cost
1 bed 2 bed 3 bed 4+ bed Total
Cost pcm (£) 810 1,050 1,300 1,600
Threshold (£) 9,720 12,600 15,600 19,200
Number Total need 137 284 221 104 745
Can afford 98 171 137 77 483
Can’t afford 39 112 84 27 262
Percent Can afford 72% 60% 62% 74% 65%
Can’t afford 28% 40% 38% 26% 35%
4.21 Tables 4.7-4.9 show the results of applying the first three affordable housing thresholds set
out in Table 4.5. Table 4.7 shows the annual cost of Social Housing Rents, and the number and
percentage of households unable to afford a rent at or above these threshold costs for each
bedroom category. As the CACI household income estimates include housing benefit income, almost
all households should be able to afford this cost threshold, but 68 (9%) households can only afford
housing costs below the social housing rent thresholds. In these cases, their benefit entitlement
cannot compensate then fully for rental costs and they will be obliged to devote a higher proportion
of their incomes to rent payments.
£0
£500
£1,000
£1,500
£2,000
£2,500
£3,000
£3,500
1 bed 2 bed 3 bed 4+ bed
Co
st (
£ p
er
mo
nth
)
Social Rent Affordable Rent First Home Lower quartile PRS rent 80% market rent
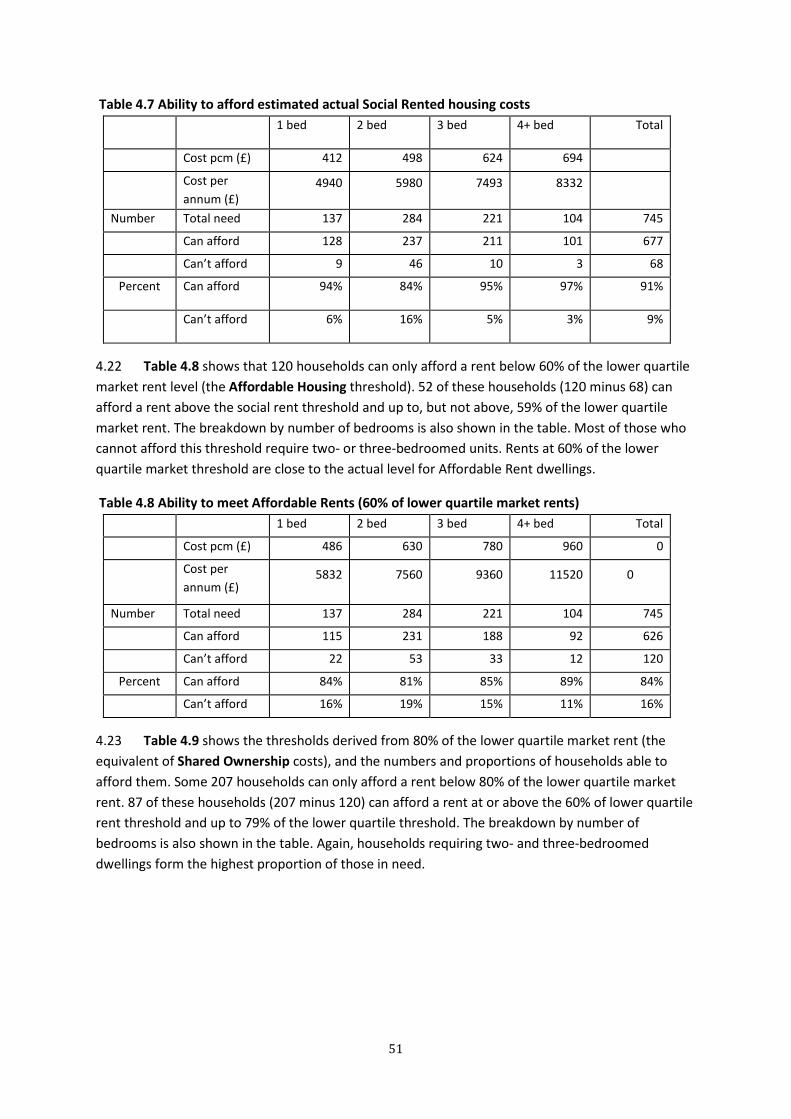
51
Table 4.7 Ability to afford estimated actual Social Rented housing costs
1 bed 2 bed 3 bed 4+ bed Total
Cost pcm (£) 412 498 624 694
Cost per
annum (£)
4940 5980 7493 8332
Number Total need 137 284 221 104 745
Can afford 128 237 211 101 677
Can’t afford 9 46 10 3 68
Percent Can afford 94% 84% 95% 97% 91%
Can’t afford 6% 16% 5% 3% 9%
4.22 Table 4.8 shows that 120 households can only afford a rent below 60% of the lower quartile
market rent level (the Affordable Housing threshold). 52 of these households (120 minus 68) can
afford a rent above the social rent threshold and up to, but not above, 59% of the lower quartile
market rent. The breakdown by number of bedrooms is also shown in the table. Most of those who
cannot afford this threshold require two- or three-bedroomed units. Rents at 60% of the lower
quartile market threshold are close to the actual level for Affordable Rent dwellings.
Table 4.8 Ability to meet Affordable Rents (60% of lower quartile market rents)
1 bed 2 bed 3 bed 4+ bed Total
Cost pcm (£) 486 630 780 960 0
Cost per
annum (£) 5832 7560 9360 11520 0
Number Total need 137 284 221 104 745
Can afford 115 231 188 92 626
Can’t afford 22 53 33 12 120
Percent Can afford 84% 81% 85% 89% 84%
Can’t afford 16% 19% 15% 11% 16%
4.23 Table 4.9 shows the thresholds derived from 80% of the lower quartile market rent (the
equivalent of Shared Ownership costs), and the numbers and proportions of households able to
afford them. Some 207 households can only afford a rent below 80% of the lower quartile market
rent. 87 of these households (207 minus 120) can afford a rent at or above the 60% of lower quartile
rent threshold and up to 79% of the lower quartile threshold. The breakdown by number of
bedrooms is also shown in the table. Again, households requiring two- and three-bedroomed
dwellings form the highest proportion of those in need.
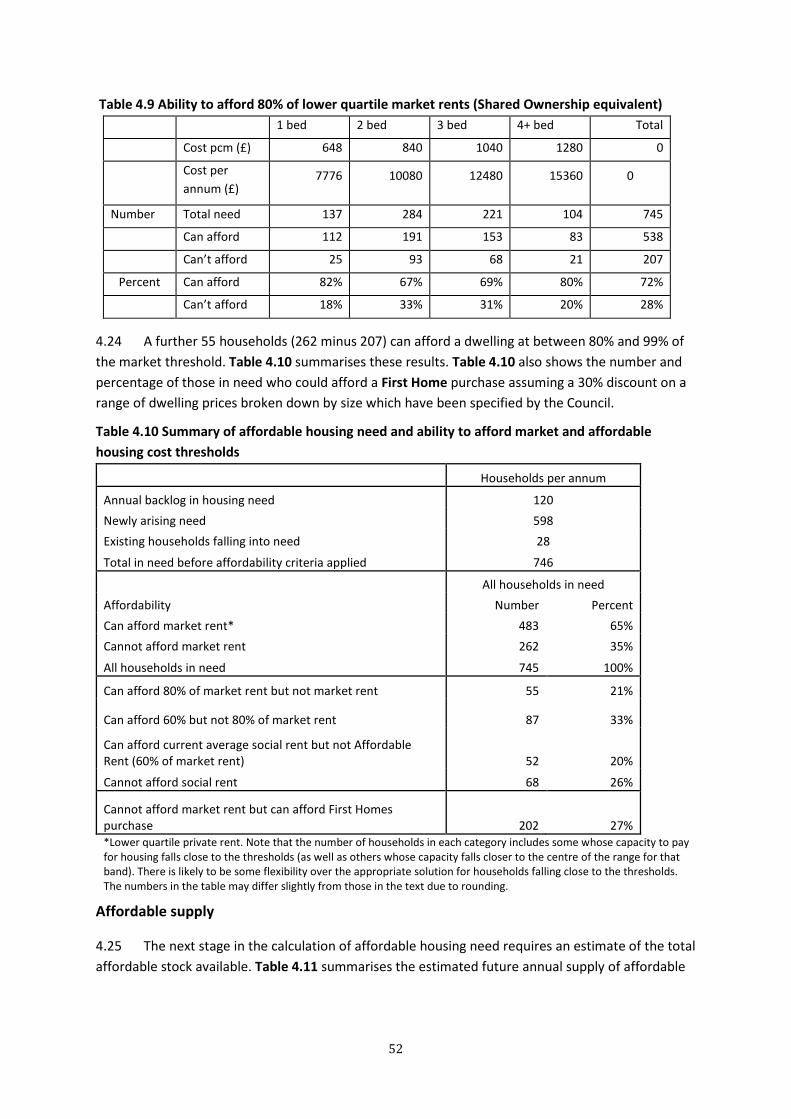
52
Table 4.9 Ability to afford 80% of lower quartile market rents (Shared Ownership equivalent)
1 bed 2 bed 3 bed 4+ bed Total
Cost pcm (£) 648 840 1040 1280 0
Cost per
annum (£) 7776 10080 12480 15360 0
Number Total need 137 284 221 104 745
Can afford 112 191 153 83 538
Can’t afford 25 93 68 21 207
Percent Can afford 82% 67% 69% 80% 72%
Can’t afford 18% 33% 31% 20% 28%
4.24 A further 55 households (262 minus 207) can afford a dwelling at between 80% and 99% of
the market threshold. Table 4.10 summarises these results. Table 4.10 also shows the number and
percentage of those in need who could afford a First Home purchase assuming a 30% discount on a
range of dwelling prices broken down by size which have been specified by the Council.
Table 4.10 Summary of affordable housing need and ability to afford market and affordable
housing cost thresholds
Households per annum
Annual backlog in housing need 120
Newly arising need 598
Existing households falling into need 28
Total in need before affordability criteria applied 746
All households in need
Affordability Number Percent
Can afford market rent* 483 65%
Cannot afford market rent 262 35%
All households in need 745 100%
Can afford 80% of market rent but not market rent 55 21%
Can afford 60% but not 80% of market rent 87 33%
Can afford current average social rent but not Affordable
Rent (60% of market rent) 52 20%
Cannot afford social rent 68 26%
Cannot afford market rent but can afford First Homes
purchase 202 27%
*Lower quartile private rent. Note that the number of households in each category includes some whose capacity to pay
for housing falls close to the thresholds (as well as others whose capacity falls closer to the centre of the range for that
band). There is likely to be some flexibility over the appropriate solution for households falling close to the thresholds.
The numbers in the table may differ slightly from those in the text due to rounding.
Affordable supply
4.25 The next stage in the calculation of affordable housing need requires an estimate of the total
affordable stock available. Table 4.11 summarises the estimated future annual supply of affordable
53
homes by type37. The main component of supply is annual relets from the existing affordable
housing stock. This has been calculated in line with NPPG on the basis of past trends - an average of
the past three years supply. The Affordable Housing Strategy 2020-2025 suggests that the level of
turnover (and thus the number of annual relets) is declining, so this level of supply should be
monitored in the future. In order to ensure that the estimate reflects the longer-term supply of
stock, first time lettings of new dwellings are excluded. The estimate is also limited to re-lets to new
tenants and excludes transfer lettings. The largest element of affordable housing supply is general
needs lettings (86 units per annum). New housing in the pipeline is excluded from this element of
supply, as it is a one-off feature rather than part of the continuing flow provided by relets. If a major
quantum of new supply were to be anticipated, the impact of this on future relets would need to be
factored into annual supply in the year of completion. The second component of future supply is
Affordable Rented housing (29 units). The third component of supply is supported housing (93 units).
These are one-bedroomed units, let to households requiring specialised dwellings and/or care and
support. They are not part of the general needs housing stock, and few older households are found
in the estimates of backlog and newly forming need above, so supported dwellings have not been
included in the calculation of affordable housing supply.
4.26 Finally the model includes an estimate of the number of intermediate tenure homes that
come up for re-let/re-sale (4 units per annum). Any of these elements of affordable housing could
experience an increase or reduction as a result of new additions to the stock or though demolition,
disposal or sale of social rented homes, or the disposal of intermediate tenure homes currently
occupied by households in need of affordable housing. If they were of significant scale, such changes
would impact on long term relet rates and should be considered in future updates of the model. For
example, a substantial increase in the sale of social rented housing through right to buy would have
a longer term (though complex) downwards impact on relet supply. In addition, such changes need
to be taken into account in looking at the future supply of affordable accommodation to meet
backlog and newly arising need, by assessing their profile over time of any changes and adding them
to, or subtracting them from, outstanding need at the appropriate point when they impact on
supply.
37 Data on all social housing lettings (by local authorities and Registered Providers) is recorded in a national collection
system called CORE. This data was interrogated to identify the number of lettings by all social providers in Mole Valley,
broken down by type of letting (social rent, affordable rent, intermediate tenure) and by the number of bedrooms per
dwelling. Lettings to existing social tenants were excluded as they do not result in additional supply for households
currently living outside the affordable sector. Data was obtained for the three latest years available at the time of writing,
and averaged across the three years to smooth out short tern variations.

54
Table 4.11 Future annual supply of affordable homes
Annual supply
Social sector re-lets 1 Bed 45
2 Beds 20
3 Beds 20
4+ Beds 1
Total 86
Affordable rent relets 1 Bed 19
2 Beds 6
3 Beds 4
4+ Beds 0
Total 29
Shared ownership/intermediate 1 Bed 1
2 Beds 2
3 Beds 1
4+ Beds 0
Total 4
Total 1 Bed 64
2 Beds 28
3 Beds 25
4+ Beds 1
Total 119
Source: Mole Valley DC, CORE. Data on lettings and other resupply has been averaged over the period 2016-19. Figures
may not sum to totals because of rounding.
Net affordable need
4.27 The final stage is to subtract affordable housing supply from affordable need. This results is
an estimate of net annual need for affordable housing in Mole Valley of 143 units. Table 4.12 shows
this total and provides a breakdown of net need by type and size of affordable housing. The supply
of housing at social rent levels almost balances the demand, but there is an apparent over-supply of
one-bedroom units. There is a more substantial shortfall of lettings at Affordable Rent levels (59
units). This occurs across all bedroom categories, but is most substantial for two- and three-
bedroomed units. There is also a shortfall of dwellings (51 units) at higher annual cost levels, which
equate to Shared Ownership housing or other intermediate tenure products. Overall, the largest
level of net need for is for units with rents of between 60% and 79% of the lower quartile private
rent level, and within this category, the greatest level of need is for two-bedroomed units. There is
currently very limited supply in this category. Finally, there is significant net need from households
which can afford between 80% and 99% of the lower quartile private rent (54 households). The main
category of need within this group is for four-bedroomed units. Overall, the largest proportion of net
need is for units with two bedrooms, with an apparent slight surplus of one-bedroomed units.
4.28 The ability of households in need to afford First Homes was also examined. As Table 4.10
showed, 229 households out of 748 in need would be able to afford a First Home with a 30%
discount. The majority of these are households (179 or 78%) require one or two bedroomed
dwellings.
4.29 Some larger households in need might be able to afford a three- or four-bedroomed dwelling
at the assumed First Home cost level (newly forming households, for example, include some larger

55
households with relatively high incomes) but most would be ineligible because their income would
be above the threshold of £80,000 per annum.
4.30 The split of need between categories of supply should be treated with caution, as household
incomes form a continuous distribution rather than being clustered around the threshold income
levels required to afford particular types of housing. Some households will be close to the various
thresholds and could change category if they were to spend slightly more on housing than the model
assumes. Likewise, the breakdown of need by bedroom requirement is based on the bedroom
standard and some households might desire more or fewer bedrooms than the standard allows.
Table 4.12 Future annual need for affordable homes
Annual
need
Annual
supply
Surplus (+)
or shortfall
(-)
Percentage
Can afford a social rent but not an
affordable rent*
1 Bed 22 45 23
2 Beds 53 20 -33
3 Beds 33 20 -13
4+ Beds 12 1 -11
Total 120 86 -33
Can meet Affordable Rent (60%) but
not 80% market rent
1 Bed 3 19 16
2 Beds 40 6 -34
3 Beds 35 4 -31
4+ Beds 9 0 -9
Total 87 29 -59
Can afford 80% but not full market
rent
1 Bed 14 1 -13
2 Beds 19 2 -17
3 Beds 16 1 -15
4+ Beds 6 0 -6
Total 55 4 -51
All who cannot afford full market
rent
1 Bed 39 65 26 -18%
2 Beds 112 28 -84 59%
3 Beds 84 25 -59 42%
4+ Beds 27 1 -26 18%
Total 262 119 -143 100%
Note: The percentages are calculated using the overall shortage of affordable homes as a base. They may not sum to
100% due to rounding. As there is an oversupply of one bedroomed units, the percentage for this dwelling size is
negative. *Includes those who cannot afford a social rent, who will be required to spend more of their income on
housing than the assumed maximum. Due to rounding, components of need may not sum exactly to the total shown in
the table.
Supporting small and medium-sized developers
4.31 In a bid to encourage small and medium-sized developers to contribute further to overall
housing supply, the Government is proposing to extend the small sites policy and raise the threshold
at which a local planning authority can require Affordable Housing contributions from 10 units to 40
or 50 units, thus reducing overall costs to developers. This is proposed for an initial period of 18

56
months. A threshold of 40 units would see a reduction of between 7% and 14% of Affordable
Housing delivery nationally, whereas a threshold of 50 units would see a reduction of between 10%
and 20%. In designated rural areas, the current threshold at which local planning authorities can
require Affordable Housing is 5 units. The Government is not proposing to change this threshold.
Large areas in the centre and south of the District will therefore be unaffected.
4.32 National policy currently sets out that affordable housing contributions should not be sought
for developments that have a site area of less than 0.5 hectares. The Government proposes to scale
up the site size threshold at the same proportion as the increase in number of homes threshold but
has not stated a new site size threshold.
Implications for Mole Valley
4.33 A review of development in Mole Valley reveals that over the last five and a half years there
have been thirteen housing developments delivering between 10 and 40 (or 50) units that have been
granted planning permission and have or will deliver either affordable homes on-site or make a
financial contribution towards affordable housing. This review does not include developments where
all of the homes are affordable (such as The Poland Trust land at the junction of Middle Street and
Wellhouse Lane, Brockham), or developments taking or taken place under the permitted
development regime which are exempt from affordable housing contributions.
4.34 If the proposed 40- or 50-unit threshold had been implemented five years ago, none of
these developments would be providing either affordable homes on-site or be making a financial
contribution towards affordable housing. This would have resulted in a loss of 62 on-site affordable
homes and £684,700 towards affordable housing. This equates to roughly 11 affordable homes per
annum and around £125,000 per annum. If these per annum figures are applied to the temporary
18-month period to which the 40- or 50- unit threshold will be applied, there would be a loss of
16/17 affordable homes and roughly £187,500 lost in financial contributions towards affordable
housing.
4.35 Over the same five-and-a-half-year period, there were only three developments granted
planning permission that would / will deliver affordable homes on-site or provide a financial
contribution towards affordable housing (because they’re above the 50-unit threshold).These three
developments have or will deliver a total of 64 affordable homes and £2,398,812 towards affordable
housing. In effect the 40- to 50-unit threshold would ‘wipe out’ 80% of sites currently delivering
affordable housing, half of the total provision of affordable homes, and 22% of financial
contributions towards affordable housing.
4.36 It is therefore expected that should these changes be implemented, the delivery of
affordable housing in Mole Valley would be significantly negatively impacted.
Required type, and size of affordable housing
4.37 The largest category of net need is for two-bedroomed units (59%). There is also a high level
demand for affordable three-bedroomed units. There is less demand for four-bedroomed units, but
it is significant because of the high lower quartile private sector rent for this size of unit in the area.
Setting aside the surplus of one-bedroomed units, 50% of new affordable homes should be two-
bedroomed, 30% three-bedroomed and 15% four-bedroomed. These proportions provide guidance

57
for decisions on the target mix of new affordable housing supply going forward, but they vary by
type of affordable provision. They should not be applied rigidly, as some households may wish to
spend more or less of their income on housing costs than we have assumed, and some may need to
occupy more, or fewer, bedrooms than assumed.
Assumptions
4.38 The outputs of the model are sensitive to several assumptions over inputs and parameters.
For these factors, it is not a case of a right or wrong approach but rather of a choice following the
weighing up of the pros and cons of alternatives. These include the following factors:
• Percentage of gross household income devoted to housing costs: the proportions used are
as set out earlier in this chapter, but a different factor or factors may be appropriate. The
higher the percentage which is assumed, the more that any particular household will pay.
This results in a reduction in the overall level of affordable need, although the reduction is
not pro rata.
• Whether or not an adjustment should be made to annual supply, in anticipation of a
change in the overall number and composition of lettings due to impending national policy
changes.
• The period over which backlog need should be eliminated (currently set at ten years).
Reducing the period (for example from ten to five years) has the effect of increasing annual
backlog need and thus the overall level of affordable need, but at the same time it reduces
the period for which backlog need applies, assuming that all affordable need is met over
this period. Increasing the period over which backlog need is met has the opposite effects.
• Whether or not to include any supported housing as well as general needs housing in the
annual supply, and if so, what proportion to include.
• The price thresholds utilised, both the market entry price threshold, which determines the
overall level of affordable need, and the thresholds for different types of affordable
housing.
Comparison with 2016 SHMA
4.39 Table 4.13 compares headline results from this update with those published in the 2016
SHMA. There was a significant increase in the level of backlog need in 2020 which can probably be
explained by the level of affordable completions achieved in the last four years which have not been
able to keep pace with the annual increment of newly forming need. In contrast, the use of more up
to date household projections has led to a reduction in the estimate of newly forming household
numbers. In this Mole Valley is following the national trend of reducing rates of new household
formation. There has been a slight but significant reduction in the proportion of households in need
who are estimated to require affordable housing, suggesting that increases in incomes have more
than kept up with rising house prices, even at this lower end of the overall market. Affordable supply
is estimated to have fallen significantly, a reflection of reducing turnover in the existing affordable
stock and the continuing constraints on new affordable supply for rent. As a result, the annual level
of affordable need has increased by 12 dwellings per annum from 131 to 143.
4.40 The estimates of incomes produced by CACI do not take account of any reductions which

58
have occurred and will occur in future as a result of the impacts of the COVID-19 pandemic and
other developments such as Brexit. To provide a basic indication of the scale of impact, we have
assumed that reductions in incomes will reduce the level of the lower quartile income in the
authority by one third from £27,800 to £18,400. Leaving all other assumptions unchanged leads to
an increase in the net level of affordable need from 143 dwelling per annum to 191 per annum, a
rise of 34%. This is intended purely as an illustration – modelling the economic impacts of COVID-19
and Brexit are beyond the scope of this SHMA update.
Table 4.13 Comparison of findings with 2016 SHMA
Comparison with 2016 SHMA 2016 SHMA 2020 update
Backlog need 927 1196
Backlog need per annum 93* 120
Newly forming households per annum 637 598
Existing households falling into need per annum 8 28
Backlog and new need per annum 738 746
In need but cannot afford market rent 282 262
Percentage unable to afford market rent 38% 35%
Affordable supply 151 119
Net affordable need per annum 131 143
The role of the private rented sector in meeting affordable need
4.41 NPPG stresses that the assessment of net affordable housing need should be derived by
comparing affordable need with affordable housing supply. The private rented sector is not currently
formally counted a part of the affordable housing supply for housing market assessment purposes.
However, it may play a part in meeting affordable housing need in some circumstances, supported
by the availability of benefits based on Local Housing Allowance assistance with rents. Table 4.14
assesses the potential impact of the private rented sector on housing need in Mole Valley. In March
2020 there were 681 Housing Benefit claimants in the private rented sector in the authority38. This
represented 12.6% of private rented tenants, assuming growth of 27% over the period between
2011, the latest date for which data on the number of households living in the sector is available,
and 2019. This suggests the benefit-dependent private rented sector is significant in the authority,
but far from dominant.
4.42 To assess the possible scale of the contribution which the PRS might be making to meeting
affordable need, an estimate is required of the annual inflow of new Housing Benefit (HB) claimants.
EHS regional data indicates that 11% of private rented sector tenants (averaged over the three-year
period from 2016-19) were new entrants to the sector in the previous twelve months. Applied to the
estimated numbers within the sector in Mole Valley in 2020, this suggests that 597 households per
annum enter the private rented sector from other tenures or as newly-forming households.
Assuming that these have the same profile as tenants in the sector as a whole suggests that 75 new
HB claimants per year enter the private rented sector. This represents 52% of net annual affordable
housing need.
38 Extracted from the online STATEXPLORE database provided by the Department of Work and Pensions.

59
Table 4.14 Estimated impact of the private rented sector on housing need
PRS HB
claimants
March 2020
Renting
from private
landlord or
living rent
free 2011
Private
renting
2020
(assuming
growth of
27%)
Claimant
rate (claim-
ants/unit
2020)
Turnover
(estimated
% of PRS
tenants
entering
sector in last
year)
Number of
new
entrants
Estimated
number of
new HB
claimants
per annum
681 4,270 5,423 12.6% 11% 597 75
Sources: DWP StatExplore, Census 2011, English Housing Survey 2016-19
4.43 It is important to note that the private rented sector provides less security of tenure than
the affordable sector (and indeed bears responsibility for a measure of homelessness applications,
when assured shorthold tenancies are not renewed).
Impact of affordable need on overall housing need
4.44 Mole Valley will need to formulate a policy for affordable housing in response to this
assessment of the level of affordable housing need in the borough, and other sources of evidence.
NPPG contains the following instruction, which was changed only slightly in the two recent updates
of NPPG (our emphasis):
‘The total affordable housing need can then be considered in the context of its likely delivery as a
proportion of mixed market and affordable housing developments, taking into account the probable
percentage of affordable housing to be delivered by eligible market housing led developments. An
increase in the total housing figures included in the plan may need to be considered where it could
help deliver the required number of affordable homes.‘ 39
4.45 Table 3.5 above showed the delivery of affordable homes in Mole Valley over the period
2009-2018. The level of provision varied from year to year as would be expected, but has averaged
45 dwellings per annum, or 25% of all provision. This represents 29% of the net annual need for
affordable housing shown above. The overall level of new housing need estimated in Chapter 3 is
453 dwellings per annum, rising to 563 under the proposed new method. If affordable housing
provision is created at the rate of 25% of housing output at the level which is required to meet need,
the level of affordable housing secured will be higher (113 units per annum, or 141 under the
proposed new method) but still below net affordable need.
4.46 This suggests that there is a need to increase the proportion of affordable housing obtained
from completions. To meet the affordable requirement fully, it might be necessary to aim to secure
a higher percentage of affordable housing from eligible completions. An alternative would be to
increase the target level of overall provision but given the very large step up which will be required
to meet the affordable housing requirement, this could be very difficult to achieve in practice.
39 Housing and economic needs assessment, CLG February 2019, Paragraph 024 Reference ID 024-20190220

60
Conclusion
4.47 This chapter has presented the results of a model which assesses the requirement for
affordable housing, independently calculated using a methodology based on updated NPPG. The
overall net need is estimated to be 143 units per annum. The estimate reflects the distribution of
incomes and price/rents at the base year 2020, which is assumed to remain broadly unchanged in
the future. The estimates could be affected by changes in the relationship between incomes and
prices/rents in the future. Similarly, if house prices rise or fall relative to incomes generally this
would also affect affordability. It will be important to monitor the impact of such factors carefully. In
terms of size, the largest categories of net need are for two-bedroomed units (50% of net need, if
the surplus of one-bedroom units is set aside), and three-bedroomed units (35% of net need).
4.48 Combining the estimate of overall need from Chapter 3 and the estimate of affordable need
set out in this chapter gives a guide to the overall dwelling size breakdown of new housing which is
required. Table 4.15 shows the estimated percentage breakdowns of need by dwelling size for
affordable housing and for market housing. The apparent surplus of 1 bed affordable housing has
been rebased to zero. Beneath this, the table shows the required breakdown of units by bedroom
size under three different scenarios. The first assumes that all net affordable need is met by new
housing construction, accounting for 143 out of the 453 units of new housing required per annum.
The second assumes that the level of affordable provision met by new building is 100 out of 153
units per annum, and the third scenario assumes that only 50 out of 153 units are met by new
construction. In each case the residual requirement for new construction to meet need is assumed
to be met in full by market development. In every case the main requirement is for two-bedroom
units. These examples are illustrative and assume that the target for new housing construction is set
at, rather than above or below, the level indicated by the Standardised Need Assessment.

61
Table 4.15 Illustrative examples of the breakdown of new housing provision by unit size
1 bed 2 bed 3 bed 4+ bed
Target size breakdown Affordable housing 0% 50% 35% 15%
Market housing 25% 45% 20% 10%
Dwellings per annum
(dpa) Total 1 bed 2 bed 3 bed 4+ bed
Affordable need met in
full by new
construction
Standardised
housing need
453 75 229 71 78
Affordable housing 143 0 72 50 21
Market housing 310 75 157 21 57
100 out of 153 dpa
met by new
construction
Standardised
housing need
453 88 220 78 67
Affordable housing 100 0 50 35 15
Market housing 353 88 170 43 52
50 out of 153 dpa met
by new construction
Standardised
housing need 453 101 212 84 56
Affordable housing 50 0 25 18 7
Market housing 403 101 187 66 49
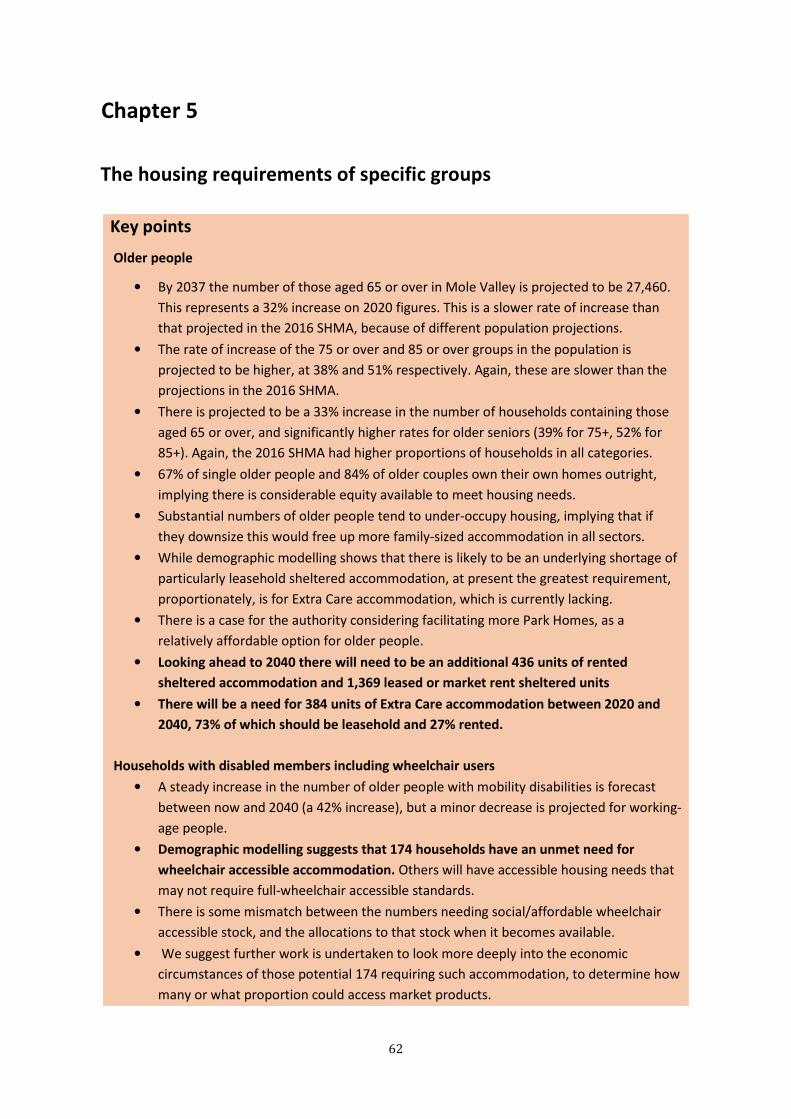
62
Chapter 5
The housing requirements of specific groups
Key points
Older people
• By 2037 the number of those aged 65 or over in Mole Valley is projected to be 27,460.
This represents a 32% increase on 2020 figures. This is a slower rate of increase than
that projected in the 2016 SHMA, because of different population projections.
• The rate of increase of the 75 or over and 85 or over groups in the population is
projected to be higher, at 38% and 51% respectively. Again, these are slower than the
projections in the 2016 SHMA.
• There is projected to be a 33% increase in the number of households containing those
aged 65 or over, and significantly higher rates for older seniors (39% for 75+, 52% for
85+). Again, the 2016 SHMA had higher proportions of households in all categories.
• 67% of single older people and 84% of older couples own their own homes outright,
implying there is considerable equity available to meet housing needs.
• Substantial numbers of older people tend to under-occupy housing, implying that if
they downsize this would free up more family-sized accommodation in all sectors.
• While demographic modelling shows that there is likely to be an underlying shortage of
particularly leasehold sheltered accommodation, at present the greatest requirement,
proportionately, is for Extra Care accommodation, which is currently lacking.
• There is a case for the authority considering facilitating more Park Homes, as a
relatively affordable option for older people.
• Looking ahead to 2040 there will need to be an additional 436 units of rented
sheltered accommodation and 1,369 leased or market rent sheltered units
• There will be a need for 384 units of Extra Care accommodation between 2020 and
2040, 73% of which should be leasehold and 27% rented.
Households with disabled members including wheelchair users
• A steady increase in the number of older people with mobility disabilities is forecast
between now and 2040 (a 42% increase), but a minor decrease is projected for working-
age people.
• Demographic modelling suggests that 174 households have an unmet need for
wheelchair accessible accommodation. Others will have accessible housing needs that
may not require full-wheelchair accessible standards.
• There is some mismatch between the numbers needing social/affordable wheelchair
accessible stock, and the allocations to that stock when it becomes available.
• We suggest further work is undertaken to look more deeply into the economic
circumstances of those potential 174 requiring such accommodation, to determine how
many or what proportion could access market products.

63
• But in the interim it is clear that more effective use of the social housing wheelchair
assets that come into availability be made, by ensuring they are let to those that
require wheelchair accessible accommodation.
Students
• There are over 3,700 students resident in the district during term time, including older
school students.
• 81% live with their parents. Around 14 % live in the private rented sector.
• There are currently no Higher Education establishments based in Mole Valley, though
there are a number in surrounding authorities, and London colleges and universities are
easily accessible by rail
• There are currently no plans to build any purpose-built student accommodation in the
district.
• The district is a ‘net exporter’ of students – that is, the number of residents that leave
the authority for elsewhere during term time is greater than the numbers that come in.
• In view of the above there does not seem to be a strong case for purpose-built
student accommodation to be prioritised against other demands.
Private rented sector (PRS)
• The PRS has expanded in Mole Valley by 80% between the last two Censuses and is
now likely to be providing homes for 26% of households
• Mature adults (age 25-49) comprise the largest group (50%), and a high proportion of
households have dependent children (31%).
• Groups categorised as other than White are more reliant on the sector than White
groups.
• Private renters, including those with children, tended to live in smaller properties than
owners, and to be more overcrowded.
• Although private renters are more economically active than average, they are slightly
more likely to be in lower-paid and less responsible jobs than average.
• Rents have increased by between 15% and 25% since 2011 (depending on bedsize);
there are signs that the increase rate is slowing.
• Assuming up to a third of household incomes could go on housing costs, 40% of
renters cannot afford a median rent two bedroom home.
• The number of PRS tenancies let to those claiming Housing Benefit has reduced
sharply, by 41%, since 2013; if it is becoming less of an option for those on lower
incomes, this must be of concern to the authority, particularly given the high
proportion of households with dependent children that rely upon it.
• In spite of the reduction in claims, new claimants represent 50% of net annual
affordable housing need.
• Loss of a PRS tenancy accounted for 26% of initial assessments under the
Homelessness Reduction Act 2017 in 2018-19
• To date the authority has not had to use the PRS as a source of temporary
accommodation to a great extent.

64
• Looking to the future, it seems likely that landlords will continue to exit the Housing
Benefit / Universal Credit sub-sector and ‘upmarket’ their offers, to the detriment of
those on lower incomes. There must be concern about access for those on the lower
end of the income spectrum, and the knock on effects on homelessness services if
this scenario arises. The authority may wish to take measure to engage with
landlords offering homes at the lower end of the price spectrum, to assist them
remain in this market
Those wishing to build their own homes
• As of September 2020, 125 individuals had registered as interested in self or custom
build under the monitoring arrangements set up under the Self-Build and Custom
Housing Building Act. However, currently only 85 of these is eligible.
• The Act expects an authority to make provision in certain circumstances for suitable
serviced plots to meet demand as evidenced by the register. Regulations in force
from 2016 give authorities the option to divide the register, based on eligibility tests,
including local connection and financial viability. Only those that can pass the
eligibility tests would be entitled to district support.
• Of the 85, 34 are eligible under Part 1 of the register – that is, they have established
some form of local connection with Mole Valley and demonstrated ability to finance
their schemes.
• Of the 34, 80% currently live in the area, 50% work there, and nearly 40% have family
connections. The majority have substantial assets or access to mortgages
• There is no data available yet to indicate whether demand for self-build in Mole
Valley is relatively high or low; but in the context of other priorities for scarce land
resources, including the 564 households on the housing register, and the annual
deficit of 153 affordable homes, we suggest that there is little evidence that self-
build should be prioritised above other demands.
Introduction
5.1 As required in the brief, this chapter discusses the housing requirements of some specific
groups: older households, households with disabled members (including wheelchair users),
students, private renters, and those wishing to build their own homes.
Older households
Demographic context
5.2 In common with the rest of the country, Mole Valley is projected to see substantial increases
in the number and proportion of people aged 65 and older between 2020 and 2037, the monitoring
period of the Plan. In the tables below we also show changes until 2040, so a multi-decade
perspective can also be gained.
5.3 Based on the ONS 2018 base population projections, the number of 65s and over is
projected to increase by 6,641 over the period, a 32% increase on the 2020 figures. This is a lower

65
projected increase than that in the 2016 SHMA (which was 10,600 people and a 38% increase rate).
This earlier figure was based on ONS 2012 base population projections and covered the period 2014
to 2030. More recent ONS projections have shown a slower rate of overall population growth and
slower growth in the numbers of older people.
5.4 Within this, the growth rate for the more senior groups that are more likely to place serious
demand on care and health services are higher; a 38% increase is projected for those 75 or over
(3,963 increase) and a 51% increase for those 85 or over (1,680 increase). Again, these are all lower
increases than those projected in the 2016 SHMA. While people are living longer, the amount of
time they are healthy has not kept pace, and their needs, including housing needs, increase in the
later stages of their lives.
Table 5.1 Population increase rates, older people
2020 2030 2037 2040
% increase
2020-2037
No. increase
2020-2037
People aged 65+ 20,820 24,731 27,460 28,117 32% 6,641
People aged 75+ 10,396 12,687 14,359 15,361 38% 3,963
People aged 85+ 3,304 4,068 4,984 5,147 51% 1,680
Source: ONS Sub-national Population projections 2018 base
5.5 In terms of the overall proportions in the population this will represent, currently those aged
65 or over make up 24% of Mole Valley’s population: this is projected to increase to 31% by 2037. In
parallel, while the proportion aged under 25 is expected to reduce from 26% to 23%, the proportion
of the main working age group, aged 25 to 64, is projected to reduce more sharply, from 50% to
46%. This may have implications for the ability of the local community to provide the services an
increasing proportion of older people will require.
Table 5.1a Changing proportions and numbers of population groups over time
Proportion 2020 2030 2037 2040
Under 25 26% 24% 23% 23%
25-64 50% 48% 46% 45%
65+ 24% 28% 31% 32%
Number 2020 2030 2037 2040
Under 25 22,457 20,862 19,949 19,808
25-64 43,818 41,508 40,096 39,914
65+ 20,820 24,269 27,460 28,117
Total 87,095 87,101 87,505 87,840
Source: ONS Sub-national Population projections 2018 base
Households containing older persons
5.6 In terms of the increase in the number of households that make up this population40, the
figures are as follows:
40 ‘Household’ in this sense is one categorised where the household reference person is aged 65 or more, or 85 or more, as
appropriate
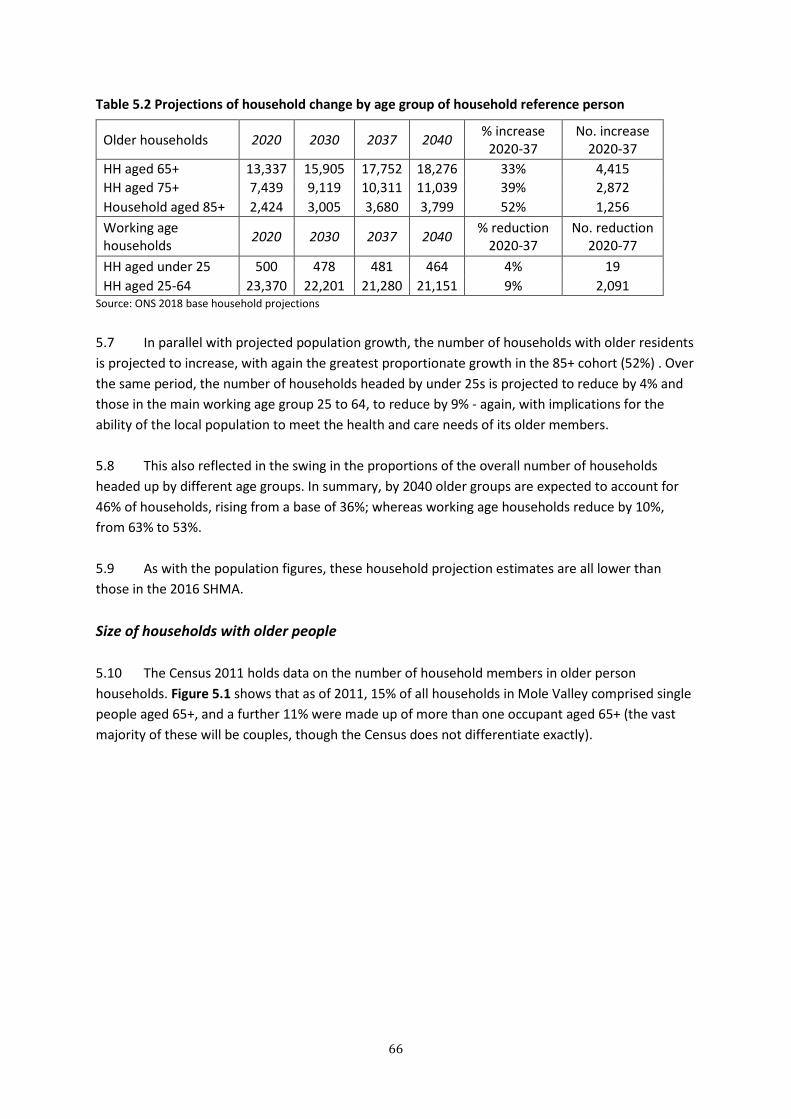
66
Table 5.2 Projections of household change by age group of household reference person
Source: ONS 2018 base household projections
5.7 In parallel with projected population growth, the number of households with older residents
is projected to increase, with again the greatest proportionate growth in the 85+ cohort (52%) . Over
the same period, the number of households headed by under 25s is projected to reduce by 4% and
those in the main working age group 25 to 64, to reduce by 9% - again, with implications for the
ability of the local population to meet the health and care needs of its older members.
5.8 This also reflected in the swing in the proportions of the overall number of households
headed up by different age groups. In summary, by 2040 older groups are expected to account for
46% of households, rising from a base of 36%; whereas working age households reduce by 10%,
from 63% to 53%.
5.9 As with the population figures, these household projection estimates are all lower than
those in the 2016 SHMA.
Size of households with older people
5.10 The Census 2011 holds data on the number of household members in older person
households. Figure 5.1 shows that as of 2011, 15% of all households in Mole Valley comprised single
people aged 65+, and a further 11% were made up of more than one occupant aged 65+ (the vast
majority of these will be couples, though the Census does not differentiate exactly).
Older households 2020 2030 2037 2040 % increase
2020-37
No. increase
2020-37
HH aged 65+ 13,337 15,905 17,752 18,276 33% 4,415
HH aged 75+ 7,439 9,119 10,311 11,039 39% 2,872
Household aged 85+ 2,424 3,005 3,680 3,799 52% 1,256
Working age
households 2020 2030 2037 2040
% reduction
2020-37
No. reduction
2020-77
HH aged under 25 500 478 481 464 4% 19
HH aged 25-64 23,370 22,201 21,280 21,151 9% 2,091

67
Figure 5.1 Household type and size, 2011
Source: Census 2011 Table DC 4101EW
Tenure of older households
5.11 We can look further at the current tenure of older households, as this will be an important
indicator of likely ability to meet future housing needs. Figure 5.2 shows that 73% of all single people
over the age of 65 own their homes, with over two-thirds owning them outright. For older couples,
the number owning outright increases to 84%, with another 7% holding mortgages. This compares to
the very different tenure profile of younger households, shown for comparison in the third column.
Clearly, for some of the owner occupiers there will be substantial equity available to help meet
future needs. However there are still 27% single older households and 10% larger older households
in the social or private rented sectors, less likely to be able to command additional resources, and
therefore there will still be some call for appropriate housing for lower income groups.
15%11%
74%
0%
10%
20%
30%
40%
50%
60%
70%
80%
One person household
aged 65 plus
Two or more people, aged
65 plus
All other households
Ho
use
ho
ld s
ize

68
Figure 5.2 Tenure of older households, Mole Valley
Source: Census 2011 Table DC 4105EWLa
Overcrowding and under-occupation
5.12 Another aspect of older people’s ability to resolve their housing requirements is the degree
of overcrowding or under-occupation that exists. Across all tenures (Figure 5.3), older households
are proportionately much more likely than younger households to have at least one extra bedroom
beyond their basic requirements, with 75% of single older households under-occupying, and 94% of
two or more person households with surplus bedrooms, including 73% with two or more extra
bedrooms. The pattern for younger people is fairly similar to that of single over 65’s, with 74%
under-occupying though there is a small element (3%) of overcrowding.
5.13 While there are many reasons why households may want or need spare bedrooms,
nonetheless, these figures have to be considered in the context of owner-occupiers being able to
meet their needs by downsizing; and for social renters, to understand if there is scope for making
better use of stock. This is discussed further in 3.38, where the high proportion of four beds or larger
currently in the stock are a factor in recommendations for a greater emphasis on one and two
bedroom properties in future development strategies. Table 3.8 details the breakdown. It could be
noted that a significant proportion of social rented stock – 33% - is let to tenants aged 65 plus.
67%
84%
27%
6%
7%
46%
21%
7%
11%
6% 3%
16%
0%
10%
20%
30%
40%
50%
60%
70%
80%
90%
100%
One person household aged
65 plus
Two or more people, aged
65 plus
All other households
Owned outright Owned with mortgage or loan (inc SO)
Social rented Private rented inc. rent free

69
Figure 5.3 Older household occupancy levels, Mole Valley
Source: Census 2011 Table LC4105EWla
5.14 When we break this down by tenure, Figure 5.4 indicates that over 65s living in the owner-
occupied sector have considerable scope for downsizing, as 91% under-occupy their homes,
including 63% with two extra bedrooms or more. There is minimal indication of overcrowding. The
scope is reduced in the social rented and private rented sectors, but nonetheless, in the social
rented sector, where the local authority will have some degree of control and influence, 26% of
older households do under-occupy, 11% by two beds or more. Older people also under-occupy to a
significant extent in the private rented sector (47%), though this is somewhat counterbalanced by
the 13% overcrowding rate in the sector. However, this latter figure should be treated with some
caution as Census data merges in its ‘other household types’ category over 65s in non-standard
households with other households including full time student households. This may particularly
impact on the private renting overcrowding figure.
0% 0% 4%
26%
6%
26%
31%
21%
33%
44%
73%
38%
0%
10%
20%
30%
40%
50%
60%
70%
80%
90%
100%
1 person 65+ 2 or more 65+ Other households
Missing 1 or more bedrooms At bedroom standard
1 bedroom surplus 2 or more bedroom surplus

70
Figure 5.4 Occupation levels, older people and tenure, Mole Valley
Source: Census 2011 Table LC4105EWla.
Profile of older persons
5.15 Older persons are not homogenous and will require a range of solutions to enable people to
retain as much independence in as late in life as possible. The broad-brush conclusions we draw
together above around household size, household tenure (and the options for meeting future needs
that it may create), overcrowding and under occupation (and therefore downsizing) have to be
nuanced by the nature of the communities in which older people live. For example, there will be
older people with close ties to a local area, where their children and relatives live, who will be
unlikely to downsize unless there are suitable smaller properties within the local area, accessible to
their families. As Surrey County Council’s commissioning statement for Mole Valley on
accommodation with care, residential and nursing care for older people notes 41 ‘an ambitious
programme for a more diverse range of accommodation with care options for people with a range of
disabilities and needs, with the aim to maximise independence, choice and control’ is required.
5.16 Anecdotally, interviews with neighbouring authorities confirmed that under occupation by
older households is a common occurrence, especially in the more affluent areas. However, it was
also noted that this is their choice. Even if there were an increase in the provision of high quality
apartment, sheltered or extra care schemes to allow such residents to downsize, most still might
choose preference to remain in their existing properties.
41 Commissioning statement for Mole Valley on accommodation with care, residential and nursing care for
older people 2019 onwards; Surrey CC 2019
1% 3%
13%8%
71%
40%
28%
15%
31%63%
11%16%
0%
10%
20%
30%
40%
50%
60%
70%
80%
90%
100%
Owned or shared ownership
(part owned and part
rented)
Social rented Private rented or living rent
free
Missing 1 or more bedrooms At bedroom standard
1 bedroom surplus 2 or more bedroom surplus

71
Older persons and health issues
5.17 There are a range of health issues that impact on the housing needs of older people. Those
related to mobility issues and requirements for physically-accessible housing is discussed in the
section on Households with disabled members and wheelchair requirements (beginning at para 5.36)
in this chapter. Here we note some other health issues that may impact on housing requirements.
5.18 Looking first at general health and long-term limiting conditions, Figures 5.5 and 5.6 strongly
illustrate the linkages between ageing and poor health or disability. While practically all children and
nearly 90% of working age adults in Mole Valley are in good health, this falls to 61% among over 65s,
with another 10% stating they were in ‘bad’ health.
Figure 5.5 Ageing and health
Source: Census 2011 Table DC3403EW
5.19 As regards conditions or disabilities that limit activities, again only a minority of children and
working age adults had limiting conditions, whereas 23% of over 65s found their activities were
limited a little, with a further 19% feeling their activities were limited a lot.
Figure 5.6 Ageing and disability
Source: Census 2011 Table DC3403EW
98%
1% 0%
89%
8%2%
61%
29%
10%
0%
20%
40%
60%
80%
100%
120%
Good / very good Fair Bad / Very bad
Child Working age 65+
97%
2% 1%
91%
6% 3%
58%
23%19%
0%
20%
40%
60%
80%
100%
120%
Not limited Limited a little Limited a lot
Child Working age 65+
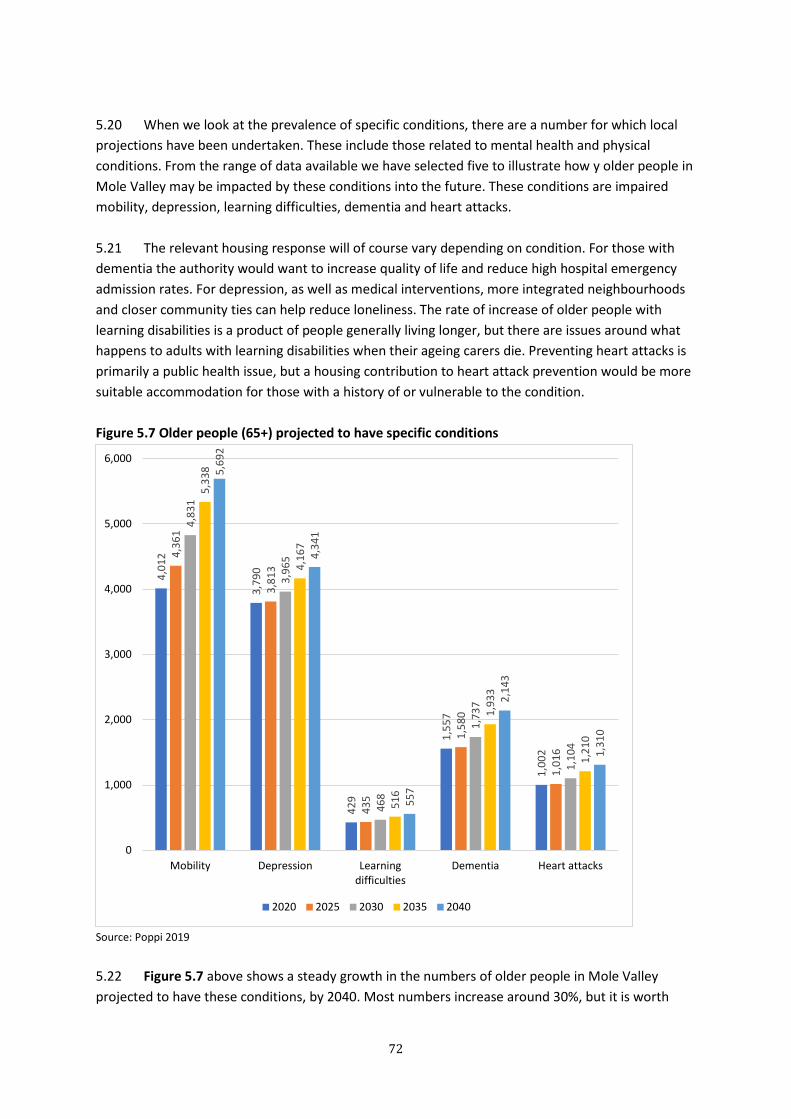
72
5.20 When we look at the prevalence of specific conditions, there are a number for which local
projections have been undertaken. These include those related to mental health and physical
conditions. From the range of data available we have selected five to illustrate how y older people in
Mole Valley may be impacted by these conditions into the future. These conditions are impaired
mobility, depression, learning difficulties, dementia and heart attacks.
5.21 The relevant housing response will of course vary depending on condition. For those with
dementia the authority would want to increase quality of life and reduce high hospital emergency
admission rates. For depression, as well as medical interventions, more integrated neighbourhoods
and closer community ties can help reduce loneliness. The rate of increase of older people with
learning disabilities is a product of people generally living longer, but there are issues around what
happens to adults with learning disabilities when their ageing carers die. Preventing heart attacks is
primarily a public health issue, but a housing contribution to heart attack prevention would be more
suitable accommodation for those with a history of or vulnerable to the condition.
Figure 5.7 Older people (65+) projected to have specific conditions
Source: Poppi 2019
5.22 Figure 5.7 above shows a steady growth in the numbers of older people in Mole Valley
projected to have these conditions, by 2040. Most numbers increase around 30%, but it is worth
4,0
12
3,7
90
42
9
1,5
57
1,0
02
4,3
61
3,8
13
43
5
1,5
80
1,0
16
4,8
31
3,9
65
46
8
1,7
37
1,1
04
5,3
38
4,1
67
51
6
1,9
33
1,2
10
5,6
92
4,3
41
55
7
2,1
43
1,3
10
0
1,000
2,000
3,000
4,000
5,000
6,000
Mobility Depression Learning
difficulties
Dementia Heart attacks
2020 2025 2030 2035 2040
73
noting that the projected increase in older people with mobility difficulties is 42% and with dementia
is 38%.
Supply of and demand for older persons’ housing
5.23 From a strategic perspective, the approach of Surrey County Council’s commissioning body42
and the evidence informing the Local Plan43 has been to provide a diverse range of accommodation
with care options. These include Extra Care, assisted living, supported living and supported housing.
Section 4 of the evidence paper provides a fuller description of different types of specialist
accommodation. Allowing people regardless of their financial circumstances to access settings
where current and future needs can be met reduces the risk of having to access more intensive
types of care as a result of crisis. The development of Extra Care facilities – which are at present
absent in Mole Valley – is seen as particularly important. Their development is also emphasised in
the Joint Strategic Needs Assessment44
5.24 Surrey County Council are principally housing with care commissioners, and therefore they
have not analysed to any great extent the requirement for lower-care sheltered accommodation45,
though they do discuss close care settings and retirement villages and issues related to classing
developments as C2 or C3.
5.25 Surrey County Council note declining demand for residential care and the growing popularity
of Extra Care, and an increase in the numbers being supported to live independently in the
Commissioning Statement However, one of the knock-on effects will be an increase in the need for
nursing care, as people live longer in their own homes, and therefore need more intensive care in
later life. A historic over-reliance in placing older people in residential settings is acknowledged46.
5.26 There is also a strong emphasis on the quality of future provision covered in some detail in
the evidence base, which we would endorse. This includes consideration of:
• Sustainable locations: access to transport, shops, facilities, and in safe neighbourhoods
• Adequate space: fewer bedrooms but more space, including space for families, mobility
scooters and storage
• Accessible accommodation: including building to wheelchair standards where possible,
bungalows and lift-accessible apartments
42 Commissioning Statement: Accommodation with care, residential and nursing care for older people – Mole
Valley District Council 2019 and onwards. Surrey County Council 2019 43 Future Mole Valley – Evidence paper: specialist housing to support people with disabilities and an aging
population, January 2020
https://www.surreyi.gov.uk/jsna/planning-housing-and-housing-related-support/#header-needs-of-specific-
groups 44 Surrey Joint Strategic Needs Assessment https://www.surreyi.gov.uk/jsna/ 45 That is, self-contained sheltered accommodation with communal facilities and an element of support, such
as an alarm system or warden 46 Future Mole Valley – Evidence paper: specialist housing to support people with disabilities and an aging
population, January 2020

74
• Sociably designed, with frontages facing on to public space, shared social space and
communal outdoor spaces
• Appropriate parking facilities: although requirements are likely to be lower, visitor, staff and
delivery requirements need to be taken in to account
• Use of age-appropriate ‘HAPPI’ design principles: covering layouts, windows, circulation
space, flexibility, energy efficiency and other principles47
5.27 We are taking the opportunity presented by this update to reassess future need against
supply based on demographic prevalence models, that is, looking at the number of different types of
units required per thousand population. England prevalence rates are used as a baseline, as the
assumption is that underlying need will not vary much across the country, though the type of tenure
appropriate (because of variations in the ability to afford different tenures) may vary.
5.28 Estimating supply is not a very precise science, because of the move away from standard
‘sheltered’ schemes to more flexible and integrated housing and support options, including Extra
Care schemes that blur the boundaries between housing and care-based accommodation. There is
no official data that summarises either social or private sector supply. The best source of data is the
Elderly Accommodation Counsel48 (EAC) statistical base. The associated SHOP (Strategic Housing for
Older People Analysis Tool) modelling tool also summarises supply. This has been used in studies49 to
estimate housing demand and supply for older persons at a local authority level.
5.29 Surrey County Council has made a more precise estimate of the demand for Extra Care for
2025 and 2035 which it published in the commissioning statement.
Table 5.4 Future demand for Extra Care (EC) in Mole Valley
2025 2035
75+
population
Total
demand
for EC
Rental
units
demanded
Leasehold
units
demanded
75+
population
Total
demand
for EC
Rental
units
demanded
Leasehold
units
demanded
12,400 310 84 226 14600 365 99 266
Source: 2019 Commissioning Statement, Surrey CC
5.30 It will be noted that these figures are slightly higher than those emerging from our new
analysis, discussed further below.
5.31 Supply figures (based on analysis of the EAC database) are as shown in Table 5.5 for Mole
Valley. Some units (the precise number is not specified in the EAC database) in a 53 units leasehold
scheme are available on a freehold ownership basis. Currently there is no supply of Extra Care in the
47 See ‘Building for the Baby Boomers :making a housing market for an ageing population, Policy Exchange
2018 48 http://www.eac.org.uk/ 49 Assessing potential demand for older persons housing in London, Three Dragons and Celandine Research,
March 2014 and update (including assessment of need for care homes and dementia housing), November
2017

75
authority area, but we have included care homes and care with nursing accommodation in the table
to show the imbalance against the LIN / SHOP analysis commissioning document’s aims.
Table 5.5 Supply of specialist older persons housing
Type Number
Sheltered – social rented 793
Sheltered – leasehold 474
Sub-total 1,267
Care
Care with nursing
289
592
TOTAL 2,148
Source: EAC database, interrogated September 2020
5.32 The SHOP toolkit also suggests a demographic model for estimating the need for different
types of older persons’ accommodation, based on academic research into the number of over 75s in
the population50. When applied to the latest (2018) Mole Valley population projections, the results
are as follows:
Table 5.5a Demand for specialist older persons housing – demographic model
Demand
per 1,000
75+
population
2020 2025 2030 2035 2040
Sheltered and enhanced to rent 80 832 954 1,015 1,104 1,229
Leasehold sheltered 120 1,248 1,430 1,522 1,656 1,843
Extra care total 25 260 298 317 345 384
Extra care -rent (27%) 70 80 86 93 104
Extra care - sale (73%) 190 218 232 252 280
Overall total 2,339 2,682 2,855 3,105 3,456
Source: ONS 2018 base population projections and SHOP prevalence estimator
5.33 As regards Table 5.5a, the SHOP toolkit distinguishes ‘sheltered’ and ‘enhanced sheltered
demand’, giving them rates of, respectively, 60 and 20 per 1,000. ‘Enhanced sheltered’ is described
as ’reflecting additional care and support needs of older residents in sheltered housing (but not high
enough levels to require extra care housing)’51. As the EAC database no longer sources the supply of
enhanced care, we have merged its rate with that for standard sheltered, to arrive at a combined
rate of 80 per 1,000 over 75s.
5.34 As noted earlier, the estimated future need for Extra Care is slightly lower than that in the
Commissioning statement (by 12 for 2025 and by 20 for 2035). This is because we have used more
up to date population projections than those available when the Commissioning statement was
drawn up. The overall lower numbers projected throughout the 2018 projections are reflected here
50 Strategic Housing for Older People Resource Pack – section A, paper A2, Housing LIN 51 Housing LIN Extra Care Fact Sheet 1 – Extra Care – What is it?, 2015

76
as elsewhere.
5.35 As regards the split between Extra Care leasehold and rented, we have used the same
assumptions in the SCC commissioning statement, and apportioned demand at 27% rented and 73%
leasehold.
5.36 We can compare the proportion of demand that is being met, both currently and likely
projections into the future (Figure 5.8), for at least rented sheltered and leased sheltered. Although
numerically the greatest current and future demand is for sheltered accommodation, in terms of the
proportion of need currently being met, the greatest requirements is for private leasehold sheltered
accommodation. This is in contrast to the conclusion in the SHMA which prioritises rented sheltered.
And additionally, the ‘Future Mole Valley’ paper52 notes that evidence from social landlords in the
area suggests that there is an oversupply of affordable sheltered, and some variation in quality
between schemes, including an over-presence of cramped studio flats53 both for rent (only 16% of
need currently being met) and for sale (just over half need currently being met). One housing
association commented that there is an oversupply of bedsit-style independent living units which
ultimately needed to be converted into larger units, or demolished and rebuilt as general needs
homes.
5.37 Clearly, as there is no Extra Care currently available, the proportion of need being met is
zero percent.. However, as the ‘Future Mole Valley’ paper argues, the greatest priority is for Extra
Care, based on a policy of actively reducing reliance on traditional nursing and care homes. In
interviews with housing associations considerable enthusiasm was shown for engaging with the
County and the local authority in developing Extra Care schemes. These figures confirm the 2016
SHMA finding of a shortage of Extra Care places. Figure 5.8 also shows the reducing proportion of
need in all categories that would be met into the future if the overall amount of different forms of
accommodation do not increase.
52 Future Mole Valley – Evidence paper: specialist housing to support people with disabilities and an aging
population, January 2020 53 Ibid

77
Figure 5.8: Proportion of need currently being met, and projections assuming static supply
Source: Cobweb modelling based on tables 5.5 and 5.5a
.
5.38 The figures also need to be extrapolated to suggest future development programmes and
enablement to meet the volume of future need for older people’s accommodation. If we base future
demand on the percentages in the supply and demand figures in tables 5.5 and 5.5a, we can see
what the requirements are:
• an additional 436 sheltered rented units by 2040 (22 units pa)
• an additional 1,369 sheltered leased / market rent units (68 units pa)
• 104 rented Extra Care units (5 units pa)
• 280 leased / market rent Extra Care units (14 units pa)
Specialist housing requirement and overall housing requirement
5.39 Within the neighbouring authorities in Mole Valley’s Housing Market Area (Kingston upon
Thames, Elmbridge and Epsom & Ewell), the projections for ageing populations have prompted
careful consideration. The degree of emphasis varies though, depending on the extent of perceived
‘gaps’ in provision. One authority was aware that past provision had been low, leaving them with a
significant shortage; another might have the issue noted but not sufficient to set quotas. Most areas
have a variety of suitable accommodation at some stage of development or application.
5.40 Two of the neighbours are taking a more cautious approach. They are very keen to ensure
that any new provision is appropriate to local need, particularly as all these areas face severe
pressure on available land. Applications are being examined carefully and, as one expressed it, it was
not right to assume that an ageing population with complex health needs implied an ‘open book’ to
everything that came forward.
5.41 The updated PPG for older persons housing contains this new requirement:
How should plan-making authorities count specialist housing for older
people against their housing requirement? Plan makers will need to count
95%
83%78%
72%
65%
38%33% 31%
29%26%
0%
10%
20%
30%
40%
50%
60%
70%
80%
90%
100%
2020 2025 2030 2035 2040
Social rented sheltered Leasehold sheltered

78
housing provided for older people against their housing requirement. For
residential institutions, to establish the amount of accommodation released
into the housing market, authorities should base calculations on the average
number of adults living in households using Census data (para 16a Housing
for Older and Disabled People PPG).
5.42 We interpret this exercise as involving two stages:
First: Examine the Census data to see how the households containing over 75s are composed,
focussing on single people (as these are the only ones that will release a home if they move)
• In 2011 there were 3,433 households in Mole Valley comprising a single person aged 75
or more, and another 4,767 with two people aged 75 plus, making up 8,200 (12%)
households all together (Census 2011 table QS110EW).
Second: Apply the likelihood of moving to more suitable accommodation figures to the number of
single person households aged 75 plus and compare with potential provision
• Using a methodology derived by the GLA for the assessment of the likelihood of moving
if suitable accommodation were available54, we will use the lower figure used in the
Three Dragons report (15%) as the GLA includes all over 65s, not just 75 plus. Fifteen
percent of 4,254 single households amounts to some 515 properties that would be freed
up if these households were able to move into more suitable accommodation.
5.43 This figure of 515 is undoubtedly very crude, as, firstly it is based on 2011 data, and the
number of single persons over 75 households will have increased. And it may be the case that some
two person households may also move out of their existing homes. And finally, it implies that there
will be available specialist stock for these households to move into.
5.44 The GLA report refers to the period 2019 to 2029. This implies that around 52 homes per
annum will be freed up by older people leaving their current homes and moving into specialist
accommodation. This would need to be added to other reasons for these homes becoming free, the
prime one of course being the death of the resident.
The role of Park Homes
5.45 Park Homes, static caravans permanently pitched on landscaped sites, often with small
surrounding gardens and parking facilities, are a feature of UK rural areas. There are approximately
85,000 households (160,000 individuals) living year-round in Park Homes on 2,000 sites. Some 68%
of residents are aged over 60. The majority of the homes are owned, though some are also rented55.
54 Assessing potential demand for older persons housing in London, Three Dragons and Celandine Research,
March 2014 and update (including assessment of need for care homes and dementia housing), November
2017
55 Mobile (Park) Homes, House of Commons Briefing Paper, 2019
79
5.46 There are currently at least 862 Park Homes pitches on 13 sites in Mole Valley, most of
which are concentrated north and north-east of Dorking, around Boxhill. These are ‘protected’
pitches, in that they are occupied year-round, and are covered by the Mobile Homes Act 2013. They
do not include other holiday pitches.
5.47 A review of sales sites noted that there were around 40 available for purchase, a significant
proportion. It also seemed clear from the literature that there is strong growth in the numbers
available, with the numbers less constrained by planning considerations, and substantially cheaper
to acquire / build than conventional homes.
5.48 Those available were exclusively one or two bedroom, with prices ranging from £89,000 to
£185,000 (one beds) and £157,000 to £290,000 (two beds). Compared to the price of owner-
occupation in Mole Valley for normal housing stock, this is extraordinarily cheap. Square footage
ranged from 400 sq. ft. to 900 sq. ft.
5.49 They are undoubtedly popular with older people (55 plus), combining the advantages of a
bungalow layout with a low cost. They can be neighbourly and friendly, some with social facilities,
and feel safe and secure generally56. The authors of the Housing LIN study consider that they are
potentially a good option to meet older people’s housing needs, and their use should form part of a
local authority’s strategic considerations.
5.50 However, there are a number of issues and negative factors that need to be taken into
account, both from the perspective of a household seeking to obtain and live in a Park Home, and
from that of the local planning authority concerned. Both the Housing LIN study and the House of
Commons paper referenced above go into these in some detail, but to summarise:
• There are issues about insecurity of tenure, based around the fact that the accommodation
is classed as ‘caravan’ outside the normal legislative framework for brick and mortar
accommodation.
• Sites are not always maintained to reasonable standards, and the scope for local authority
intervention is limited
• There are concerns that pitch fees can be increased unreasonably (though the Mobile
Homes Act 2013 did improve this)
• There are difficulties disposing of / selling on homes and pitches
• Warmth and heating can be issues
• Accessing Disabled Facilities Grants and Aids and Adaptations can be complex
• Residents may have difficulty accessing care and support services
• Authorities need to be conscious that the sites hold a concentration of older people, whose
demographics need to be considered in planning activities (for example in the JSNA).
5.51 We suggest the authority develop approaches through its housing strategy to capitalise on
Park Homes as a relatively affordable resource for elderly owners who may want to down-size to
more appropriate accommodation, and to tackle those negative issues that it has the power to
56 Park Home living – a good housing option for later life?, Housing LIN, 2014
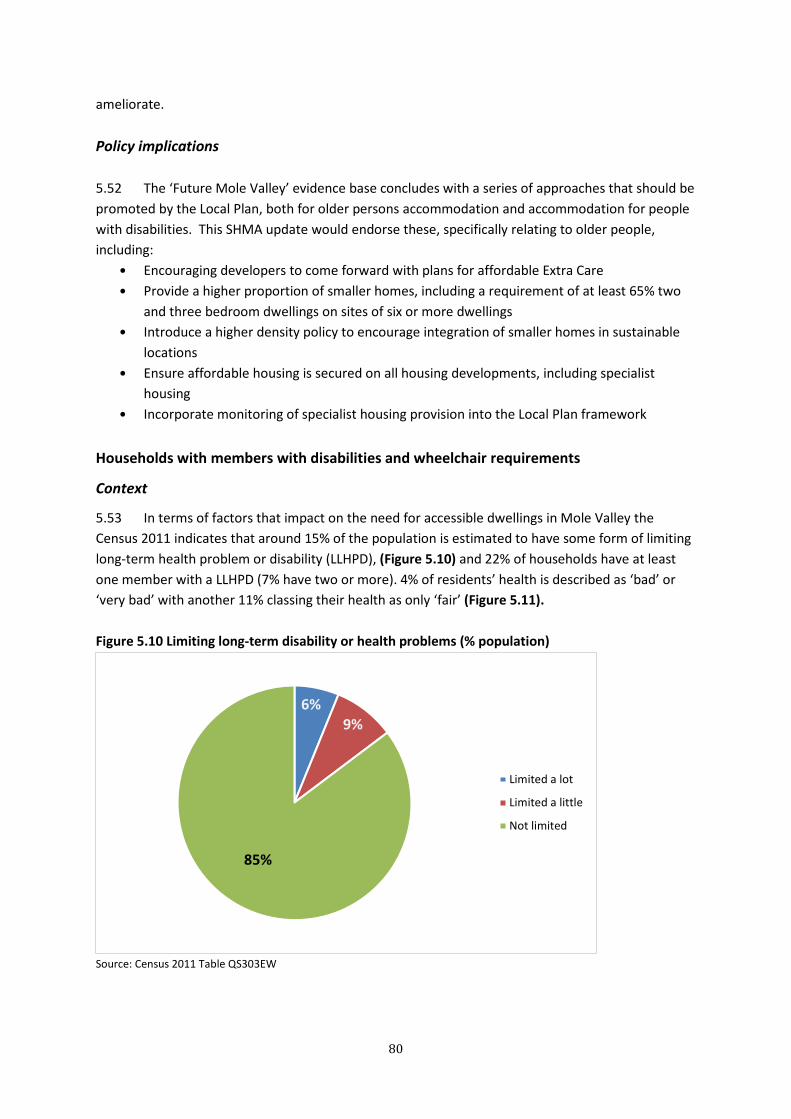
80
ameliorate.
Policy implications
5.52 The ‘Future Mole Valley’ evidence base concludes with a series of approaches that should be
promoted by the Local Plan, both for older persons accommodation and accommodation for people
with disabilities. This SHMA update would endorse these, specifically relating to older people,
including:
• Encouraging developers to come forward with plans for affordable Extra Care
• Provide a higher proportion of smaller homes, including a requirement of at least 65% two
and three bedroom dwellings on sites of six or more dwellings
• Introduce a higher density policy to encourage integration of smaller homes in sustainable
locations
• Ensure affordable housing is secured on all housing developments, including specialist
housing
• Incorporate monitoring of specialist housing provision into the Local Plan framework
Households with members with disabilities and wheelchair requirements
Context
5.53 In terms of factors that impact on the need for accessible dwellings in Mole Valley the
Census 2011 indicates that around 15% of the population is estimated to have some form of limiting
long-term health problem or disability (LLHPD), (Figure 5.10) and 22% of households have at least
one member with a LLHPD (7% have two or more). 4% of residents’ health is described as ‘bad’ or
‘very bad’ with another 11% classing their health as only ‘fair’ (Figure 5.11).
Figure 5.10 Limiting long-term disability or health problems (% population)
Source: Census 2011 Table QS303EW
6%
9%
85%
Limited a lot
Limited a little
Not limited

81
Figure 5.11 General health (% population)
Source: Census 2011 Table QS303EW
5.54 The context for understanding the housing requirements of those with disabled members
and in particular those with wheelchair users is intrinsically linked to the age of the population. 75%
of current wheelchair users are aged 60 or over in England, including 20% who are 85 or over57. As
noted above, as with the rest of the country, numbers and proportions of older people are forecast
to rise over the coming years. As Figure 5.7 (in the section on older people) indicates, a 42% increase
in the number of older people with mobility-related impairments is projected. As regards working
age people with severe physical disabilities (Figure 5.12), a minor increase in number (2%) is
projected by 2025, but then a reduction is forecast. Figure 5.12 also shows the rates of change for
other conditions associated with disability and need for support among working age people, which
show similar patterns to those for mobility support.
57 English Housing Survey 2011 Table A6.11
51%34%
11%
3% 1%
Very good health
Good health
Fair health
Bad health
Very bad health

82
Figure 5.12 Working age people and specific conditions
Source: Pansi data, 2019
Aids and Adaptations and Disabled Facilities Grants
5.55 Clearly, not all households with members with mobility-impairments will require wheelchair
accessible accommodation. Aids and adaptations can be provided using Disabled Facilities Grant
(where resources permit), and they are an important tool in preventing people having to take up
residential care places. DFGs can be applied for and used across tenures and can be particularly
significant for less well-off owner occupiers.
5.56 Mole Valley’s central government annual grant allocation (which excludes additional local
authority contribution) was relatively stable until 2014-15, and then rose to £525,000 in 2015-16.
This was a result of the government announcing significant extra resources for DFGs over the
following five years and establishing the Better Care Fund (now the Improved Better Care Fund),
which also incorporated Social Care Capital Grant. The aim of the fund was to further the integration
of social care and health services, and DFGs have been incorporated within it. Mole Valley’s
allocation steadily rose to £770,111 by 2020-2021 under the new scheme. However, as can be seen
reflected in Figure 5.13 below, the 2020-21 national allocation has been frozen, with Mole Valley
seeing a slightly reduced allocation.
3,0
92
1,1
77
3,5
07
4,5
22
2,6
84
3,1
44
1,1
49
3,4
31
4,4
25
2,7
053
,04
7
1,1
23
3,3
49
4,3
19
2,6
192
,92
8
1,0
96
3,2
67
4,2
13
2,5
182
,84
9
1,0
77
3,2
08
4,1
38
2,4
56
0
500
1,000
1,500
2,000
2,500
3,000
3,500
4,000
4,500
5,000
Mobility Learning disability Mental health (2+
common disorders)
Drug / alcohol Need for personal
care
2020 2025 2030 2035 2040
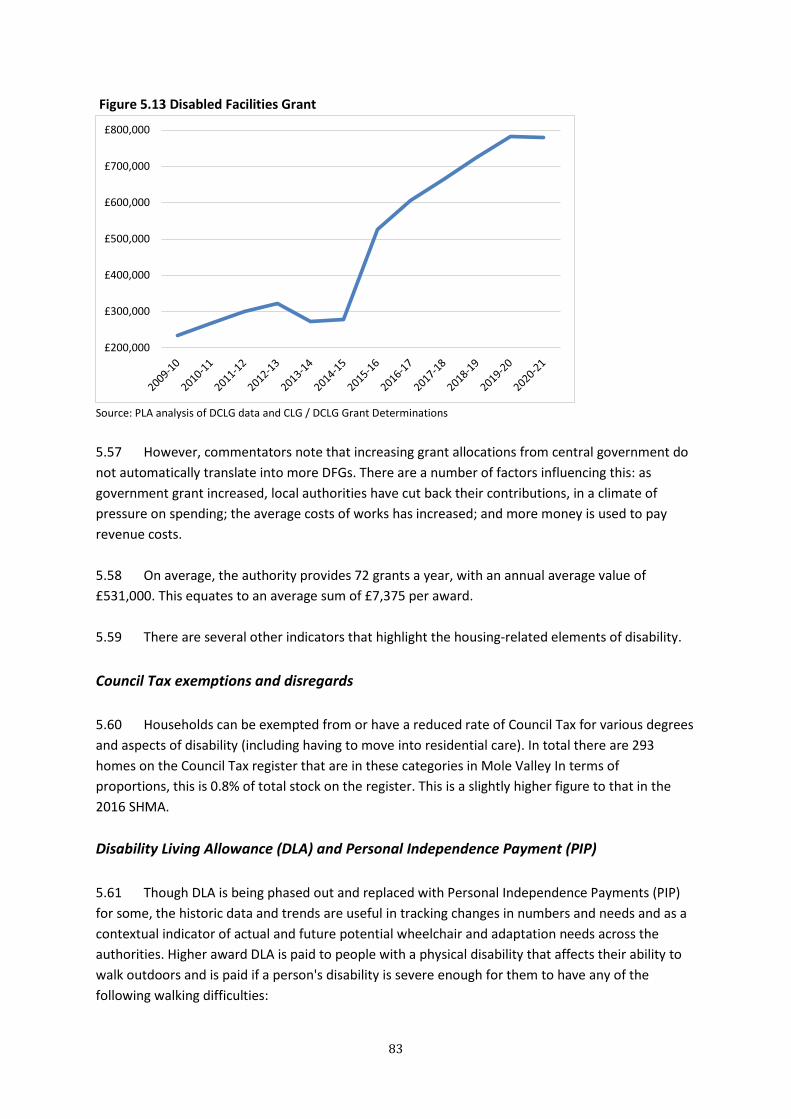
83
Figure 5.13 Disabled Facilities Grant
Source: PLA analysis of DCLG data and CLG / DCLG Grant Determinations
5.57 However, commentators note that increasing grant allocations from central government do
not automatically translate into more DFGs. There are a number of factors influencing this: as
government grant increased, local authorities have cut back their contributions, in a climate of
pressure on spending; the average costs of works has increased; and more money is used to pay
revenue costs.
5.58 On average, the authority provides 72 grants a year, with an annual average value of
£531,000. This equates to an average sum of £7,375 per award.
5.59 There are several other indicators that highlight the housing-related elements of disability.
Council Tax exemptions and disregards
5.60 Households can be exempted from or have a reduced rate of Council Tax for various degrees
and aspects of disability (including having to move into residential care). In total there are 293
homes on the Council Tax register that are in these categories in Mole Valley In terms of
proportions, this is 0.8% of total stock on the register. This is a slightly higher figure to that in the
2016 SHMA.
Disability Living Allowance (DLA) and Personal Independence Payment (PIP)
5.61 Though DLA is being phased out and replaced with Personal Independence Payments (PIP)
for some, the historic data and trends are useful in tracking changes in numbers and needs and as a
contextual indicator of actual and future potential wheelchair and adaptation needs across the
authorities. Higher award DLA is paid to people with a physical disability that affects their ability to
walk outdoors and is paid if a person's disability is severe enough for them to have any of the
following walking difficulties:
£200,000
£300,000
£400,000
£500,000
£600,000
£700,000
£800,000

84
• they are unable or virtually unable to walk
• they have no feet or legs
• the effort of walking could threaten their life or be likely to lead to a serious deterioration in
their health.
5.62 Higher mobility DLA may also be paid to those with a severe learning impairment that has a
physical basis, and those with severe sight impediments, so the figures cannot automatically be
assumed to relate to potential wheelchair or adaptation use. PIP paid at the Enhanced rate has
similar criteria.
5.63 Figure 5.14 tracks the caseload for Mole Valley over the last nine years, for those of working
age and those of pensionable age. We have data for PIP for 2013 onwards, and this has been
incorporated. It seems clear that figures for both groups had been fairly constant and consistent
until 2015, after which the number of younger claimants started dropping, showing a 23% reduction
by 2018, while older claimants remained stable. There is no obvious explanation for this, other that
it seems on par with the generally downwards future trajectory modelled for different conditions
noted in Figure 5.12
Figure 5.14 Higher rate / enhanced mobility DLA and PIP recipients, Mole Valley
Source: DWP Stat-Explore and Nomis
Calculating unmet wheelchair-accessible housing need
5.64 The English Housing Survey (EHS) 2018 estimated that only 22% of wheelchair users lived in
1,4
70
1,4
70
1,4
90
1,4
16
1,3
90
1,3
83
1,3
07
1,1
22
1,0
60
43
0 48
0
50
0
51
0 55
0
57
1
56
2
56
3
51
2
0
200
400
600
800
1,000
1,200
1,400
1,600
2010 2011 2012 2013 2014 2015 2016 2017 2018
Working age Pension age
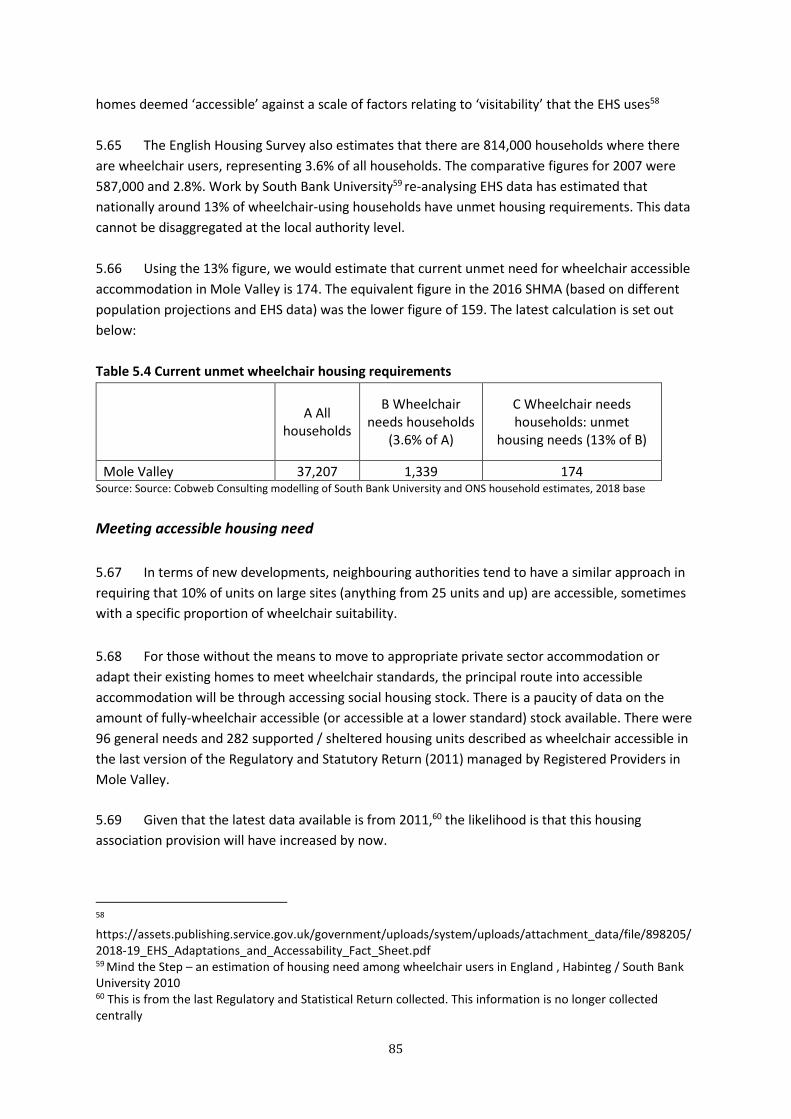
85
homes deemed ‘accessible’ against a scale of factors relating to ‘visitability’ that the EHS uses58
5.65 The English Housing Survey also estimates that there are 814,000 households where there
are wheelchair users, representing 3.6% of all households. The comparative figures for 2007 were
587,000 and 2.8%. Work by South Bank University59 re-analysing EHS data has estimated that
nationally around 13% of wheelchair-using households have unmet housing requirements. This data
cannot be disaggregated at the local authority level.
5.66 Using the 13% figure, we would estimate that current unmet need for wheelchair accessible
accommodation in Mole Valley is 174. The equivalent figure in the 2016 SHMA (based on different
population projections and EHS data) was the lower figure of 159. The latest calculation is set out
below:
Table 5.4 Current unmet wheelchair housing requirements
A All
households
B Wheelchair
needs households
(3.6% of A)
C Wheelchair needs
households: unmet
housing needs (13% of B)
Mole Valley 37,207 1,339 174 Source: Source: Cobweb Consulting modelling of South Bank University and ONS household estimates, 2018 base
Meeting accessible housing need
5.67 In terms of new developments, neighbouring authorities tend to have a similar approach in
requiring that 10% of units on large sites (anything from 25 units and up) are accessible, sometimes
with a specific proportion of wheelchair suitability.
5.68 For those without the means to move to appropriate private sector accommodation or
adapt their existing homes to meet wheelchair standards, the principal route into accessible
accommodation will be through accessing social housing stock. There is a paucity of data on the
amount of fully-wheelchair accessible (or accessible at a lower standard) stock available. There were
96 general needs and 282 supported / sheltered housing units described as wheelchair accessible in
the last version of the Regulatory and Statutory Return (2011) managed by Registered Providers in
Mole Valley.
5.69 Given that the latest data available is from 2011,60 the likelihood is that this housing
association provision will have increased by now.
58
https://assets.publishing.service.gov.uk/government/uploads/system/uploads/attachment_data/file/898205/
2018-19_EHS_Adaptations_and_Accessability_Fact_Sheet.pdf 59 Mind the Step – an estimation of housing need among wheelchair users in England , Habinteg / South Bank
University 2010 60 This is from the last Regulatory and Statistical Return collected. This information is no longer collected
centrally

86
5.70 Mole Valley’s housing register does not directly record whether applicants need wheelchair
accessible accommodation, but 94 applicants state that they want ground floor accommodation, of
which 17 also require aids and adaptations.
5.71 The fullest indicator of the number of disabled-accessible dwellings coming into use in the
social rented sector is the CORE log, which records both the housing needs of new tenants, and the
type of property that was let. This covers both general needs housing and supported housing. As can
be seen from CORE log data, an average of seven general needs wheelchair accessible units have
been let per annum over the last three years. There is no reference in the CORE log to any
wheelchair accessible supported housing units being let, though undoubtedly most lettings into
sheltered accommodation will be wheelchair accessible
5.72 We have looked at general needs and supported housing allocation over the last three years
available (2016-18) and there are some anomalies that suggest that best use of stock is not always
made. We discuss this further below.
5.73 Across 2015-2017, 22 general needs and no supported housing wheelchair accessible
dwellings were let. We found that:
• Of the 22 lettings to wheelchair adapted general needs accommodation, 12 went to those
who had did not require wheelchair accessible stock (Table 5.5).
• In the same period, 9 applicants requiring general needs wheelchair access were let
properties that were not wheelchair adapted.
• Also, over that period, seven supported housing applicants required wheelchair accessible
units. As noted, no units came available for letting in that period. Five of these applicants
were let properties that had been fitted with aids and adaptations.

87
Table 5.5 Match between those requiring wheelchair accessible accommodation and letting of
wheelchair standard homes
General needs lettings,
2016-2018
Allocatee required
wheelchair accessible
property
Yes No
Property let
was of
wheelchair
standard
Yes 10 12
No 9
Source: CORE log. 2016-2018
5.74 There can be several reasons for this apparent mismatch and the fact that some wheelchair
accessible units went to those that did not need them :
• The need to minimise void periods conflicting with the sometimes long periods that households
with wheelchair needs (who may be elderly or with learning difficulties as well) need to prepare
for a move.
• The general inflexibility of the nominations / allocations procedures between local authorities
and housing associations, with the need to fill the void quickly trumping the need to fill it
appropriately.
• Issues around choice and preference – it may be that wheelchair units are not located where
individuals with wheelchair housing needs have their networks of support.
• Unrealistic expectations – it may be that applicants still envisage a ‘bungalow’ type unit as what
they would be offered, whereas it will be more likely that it would be a flat or maisonette,
sometimes lifted and on higher floors.
• ‘Pre-emptive’ allocations – allocating a wheelchair accessible home to a household that does not
immediately need it but is likely to in the foreseeable future. Here we would have regard to the
95 requiring mobility access showers, and the four with mobility scooters.
• Concerns about inaccuracies in the CORE log.
Policy implications
5.75 In summary there is a ‘flow’ of around 7 general needs social rented wheelchair units into
availability per annum. A significant proportion appears to be allocated to those without immediate
need of them. Against this, there is the backlog unmet need for up to 174 units (from modelling).
Regards should also be had to those 94 households wanting ground floor accommodation, and the
17 requiring aids and adaptations. Further work would be required to look more deeply into the
economic circumstances of those requiring such accommodation, to determine how many or what
proportion could access market products, but it is clear that more effective use of the social housing

88
wheelchair assets that come into availability should be a priority with the objective of meeting the
identified needs of the 30 households on the register requiring wheelchair units.
5.76 More generally, we would endorse the recommendations in the specialist housing evidence
paper previously referenced that disabled accessible accommodation be integrated in wider,
mainstream housing provision, that it is developed along sustainable principles, and that it is built in
well-connected areas of the authority to ensure residents are able to fully-participate in community
life. To this end we suggest a threshold-based policy requiring a proportion of accessible and
adapted dwellings in all new developments.
5.77 Such a threshold-based approach is suggested in the Draft Local Plan, following the
requirements of changes in Building Regulations: viz:
On sites of 10 or more new dwellings, a minimum of 10% of new dwellings will be required to meet
Building Regulations standard M4 (2) ‘accessible and adaptable dwellings’. Additionally, on sites of
20 or more new dwellings, a minimum of 5% of new dwellings will be required to meet Building
Regulations standard M4 (3) ‘wheelchair user dwellings’ to help meet the specific needs of older
people and those with mobility, accessibility and support needs. The number of dwellings provided to
meet the specified standards should be rounded down to the nearest whole dwelling.61
5.78 This would help to bring forward an increased supply of accessible housing whilst
simultaneously encouraging more independent living, and we would endorse such an approach.
Other disabilities
5.79 As noted in figure 5.12 there are substantial numbers of working age residents with learning
disabilities, mental health problems, drug or alcohol dependency and other conditions requiring care
and support. Although the numbers with these conditions are projected to gradually reduce
between now and 2035, provision will need to continue to be made. We would endorse Surrey
Council Council’s approach of commissioning affordable accommodation with care and support for
adults with a learning disability and/or autism and older people, that is focused on enabling
independence and maximising individual choice and control.
5.80 Currently the County funds a much higher percentage of people with a learning disability
and/or autism in residential care than most and ensuring improved options for them is key. They
also note a growing number of young people with learning disabilities and/or autism who will need
appropriate accommodation arranged as they transition from Children’s Services to Adult Social Care
(ASC).
5.81 Health colleagues recognise the whole system benefits of the accommodation with
care approach and see the strategy as a key part of health and social care integration.
61 Future Mole Valley – consultation on Local Plan 2018-33; Policy H5, para 1

89
Students
Students studying in Mole Valley
5.82 PPG (Paragraph: 004 Reference ID: 67-004-20190722) addresses student housing
requirements as follows:
Strategic policy-making authorities need to plan for sufficient student accommodation whether it
consists of communal halls of residence or self-contained dwellings, and whether or not it is on
campus. Encouraging more dedicated student accommodation may provide low cost housing that
takes pressure off the private rented sector and increases the overall housing stock. Strategic policy-
making authorities are encouraged to consider options which would support both the needs of the
student population as well as local residents before imposing caps or restrictions on students living
outside university-provided accommodation. Local Planning Authorities will also need to engage with
universities and other higher educational establishments to ensure they understand their student
accommodation requirements in their area.
5.83 There are no Higher Education (HE) Institutions in Mole Valley, nor is there any purpose-
build student accommodation (PBSA), either existing or in the pipeline There are a number of HE
institutions in surrounding authorities and areas, including the University of Surrey and Guildford
College in Guildford, the University of Kingston, a campus of the University of the Creative Arts in
Epsom and Ewell, Brooklands College, which has a campus in Weybridge, Elmbridge and North East
Surrey College of Technology (Nescot) also in Epsom and Ewell. Further afield, there is Crawley
College and East Surrey College, based in Reigate.
5.84 But equally significant is the fact that central London is accessible by train in under an hour
from Leatherhead and Dorking (London Victoria and Waterloo Stations).
Student numbers living in Mole Valley
5.85 We cannot assume that those who study in Mole Valley live in the district; nor can we
assume that all those students who live in in the district study there. Good transport links into
central London where universities are concentrated may make the district attractive to student
commuters.
5.86 There has been a certain amount of work done on the relationship between London’s HE
institutions and in-commuting students. The London Academic Forum set up by the Mayor
concluded that a greater proportion of students domiciled outside London would be coming to
London universities, and that therefore priority groups for new development should include UK non-
Londoners62. However, at present, this finding may be compromised by the impact of Covid-19.
5.87 Table 5.6 shows the number of resident students in Mole Valley. at the time of the Census –
62 https://www.london.gov.uk/what-we-do/planning/who-we-work/planning-working-
groups/mayor%E2%80%99s-academic-forum
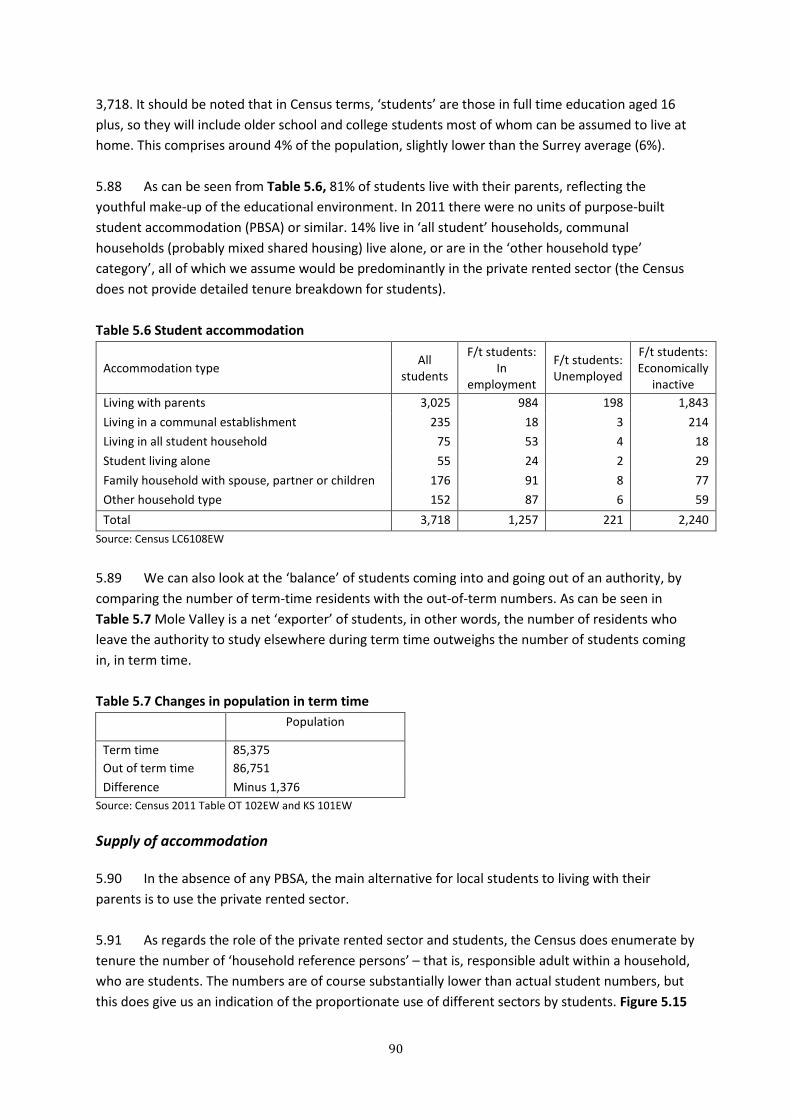
90
3,718. It should be noted that in Census terms, ‘students’ are those in full time education aged 16
plus, so they will include older school and college students most of whom can be assumed to live at
home. This comprises around 4% of the population, slightly lower than the Surrey average (6%).
5.88 As can be seen from Table 5.6, 81% of students live with their parents, reflecting the
youthful make-up of the educational environment. In 2011 there were no units of purpose-built
student accommodation (PBSA) or similar. 14% live in ‘all student’ households, communal
households (probably mixed shared housing) live alone, or are in the ‘other household type’
category’, all of which we assume would be predominantly in the private rented sector (the Census
does not provide detailed tenure breakdown for students).
Table 5.6 Student accommodation
Accommodation type All
students
F/t students:
In
employment
F/t students:
Unemployed
F/t students:
Economically
inactive
Living with parents 3,025 984 198 1,843
Living in a communal establishment 235 18 3 214
Living in all student household 75 53 4 18
Student living alone 55 24 2 29
Family household with spouse, partner or children 176 91 8 77
Other household type 152 87 6 59
Total 3,718 1,257 221 2,240
Source: Census LC6108EW
5.89 We can also look at the ‘balance’ of students coming into and going out of an authority, by
comparing the number of term-time residents with the out-of-term numbers. As can be seen in
Table 5.7 Mole Valley is a net ‘exporter’ of students, in other words, the number of residents who
leave the authority to study elsewhere during term time outweighs the number of students coming
in, in term time.
Table 5.7 Changes in population in term time
Population
Term time 85,375
Out of term time 86,751
Difference Minus 1,376
Source: Census 2011 Table OT 102EW and KS 101EW
Supply of accommodation
5.90 In the absence of any PBSA, the main alternative for local students to living with their
parents is to use the private rented sector.
5.91 As regards the role of the private rented sector and students, the Census does enumerate by
tenure the number of ‘household reference persons’ – that is, responsible adult within a household,
who are students. The numbers are of course substantially lower than actual student numbers, but
this does give us an indication of the proportionate use of different sectors by students. Figure 5.15

91
below notes the numbers of student-headed households (students aged 16-34 and older). It is
immediately apparent that private renting is dominant for younger students, while older students
tend to be owner-occupiers.
Figure 5.15 Tenure of student household reference people
Source: Census 2011 Table DC4601EW
Policy implications
5.92 Given that there are no HE establishments in the authority area (nor apparently any plans to
develop them) and given that more residents leave Mole Valley to study during term time than come
in, there does not seem to be a great demand for PBSA at the moment.
5.93 Easy access to London and surrounding areas, alongside the projections that London
universities will increasingly attract students from surrounding authorities, also indicates that there
is unlikely to be local pressure for PBSA in the foreseeable future, and if anything is an indicator that
more of this stock should be developed in London, rather than Mole Valley.
Private rented sector (PRS)
Introduction
5.94 Unlike the other groups considered in this chapter, the PRS cannot be considered to be a
‘specific group’ in terms of catering to a distinct household or socio-economic bloc. However, NPPG
(para 002 Reference ID: 67-002-20190722) indicates data sources that can be used to reflect
demand for private renting. It is not suggested the PRS is a component of affordable housing supply,
nor that specific targets or plans for the numbers of private rented units should be introduced.
However, the PRS should be considered as part of the overall picture when identifying the overall
need for different types of housing within the scope of a housing needs assessment.
5.95 The PRS serves a number of functions, one of which is to provide a tenure option for those
2017
36
53
23
19
0
10
20
30
40
50
60
Owned or shared
ownership
Social rented Private rented
Nu
mb
er
of
stu
de
nts
Age 16 to 34 Age 35 or over

92
who cannot afford owner-occupation but are not eligible for the social rented or intermediate
housing sectors. The influential though now rather dated Rugg and Rhodes report63 identified a
series of ‘niche’ markets within the PRS, including a luxury end, young professionals, students, a
‘Housing Benefit market’ and temporary accommodation for homeless households. More recent
studies have identified a new, burgeoning sub-market termed the ‘working poor’, characterised by
high employment levels, prevalence of households with children, low incomes, and low benefit claim
levels.64 The most recent study, also by Rugg and Rhodes65 concluded that
• The PRS is complex and evolving; the size of the sector is less important than its
configuration and the changing nature of the needs that are being met.
• There are too many households in the sector that would prefer to be in other tenures.
• Many privately renting households may be heading for a long retirement in the sector, with
inadequate pensions to cover housing rented at market rates.
• It is uncertain whether housing a large proportion of low income tenants in the PRS is the
most cost effective approach to meeting housing need.
• Property conditions in the market remain poor relative to other sectors.
• A disproportionately high percentage of households with babies and infants are living in the
PRS.
• The regulatory framework for private renting is out of date, and in need of radical
revision.
• The local housing allowance system is based on Broad Rental Market Area boundaries that
are wholly out of date.
• Private renting is by no means a marginal activity. It is an established feature of the market
and there is a need for policy interventions that are more neutral: overtly ‘pro’ or ‘anti’ PRS
measures always distort the market.
5.96 This section outlines some of the features around the composition of the residents in the
Mole Valley PRS. Some of it is based on Census 2011 data, and so may be out of date. Where
possible data has been updated, but there are few other authoritative sources
5.97 After a long period of expansion as a tenure, both in the number of households and their
proportion, linked to the 2008 recession and the pressures the owner-occupied sector was under,
there are now signs that the PRS ‘bubble’ is deflating. In the south east, the English Housing Survey
reveals the PRS has fallen in size from 19.8% to 17.6% of all households between 2016 and 2019.
Private renting in Mole Valley
5.98 Between the 2001 and 2011 Censuses the size of the sector increased by 80%, from 2,340 to
4,270 and increased the proportion of households it housed from 7% to 12% (figure 5.15). This was
63 Rugg J. and Rhodes D., The private rented sector: its contribution and potential, University of York 2008 64 The private rented sector in South East London and Lambeth, Cobweb Consulting / SE London Housing
Partnership 2014 65 Rugg J. and Rhodes D., The evolving private rented sector; its contribution and potential, University of York,
2018

93
at the expense of both the owner-occupier sector and the social rented sector (figure 5.15a). There
were 9,636 residents in the private rented sector, an average of 2.3 people per household. Following
the assumptions in chapter 4 (para 4.33) we estimate the sector has probably increased by 27%
since 2011, implying that there are now 5,423 homes in the sector, representing 14.6% of the stock
(based on the 2018 base ONS figures). This is slightly lower than the 17.6% average across the South
East noted in the English Housing Survey 2018-19.
Figure 5.15a Change in proportions of tenures, 2001-2011
Source: Census 2001 Table KS 1o8 and Census 2011 Table KS402EW
Age bands
5.99 In terms of who the sector caters for, (at the date of the Census 2011) what is immediately
apparent is the relatively high proportion of children – 20% of residents. The other significant factor
is that the largest single group, 50%, are adults approaching middle age, a larger proportion than
young adults. This pattern indicates that the sector is catering for families who have not been able to
access the other sectors, notably owner-occupation, or for older singles and couples who also
cannot access owner-occupation. More recent studies undertaken elsewhere have confirmed that
the PRS continues to house substantial numbers of children66.
66 For example, the 2018-2019 English Housing Survey shows that 43% of households in the PRS have
dependent children
7%
13%
77%
3%
12% 12%
75%
1%
0%
10%
20%
30%
40%
50%
60%
70%
80%
90%
PRS Social rented Owner occupier Other
2001 2011
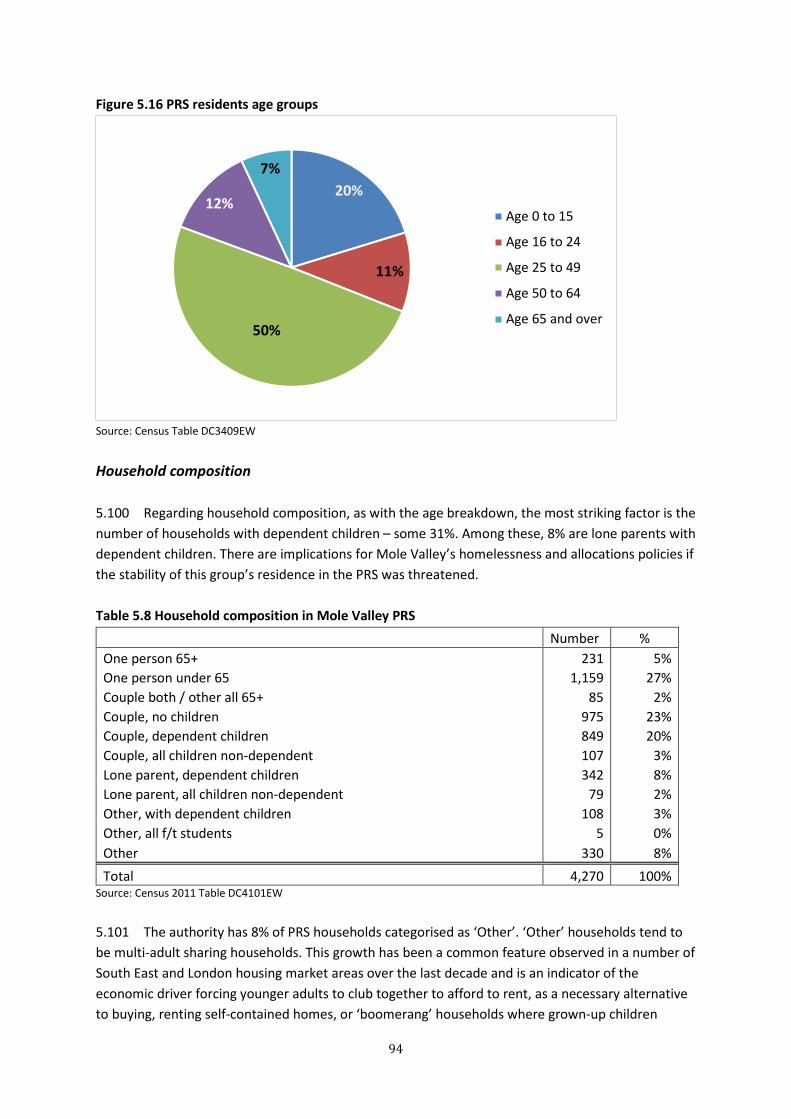
94
Figure 5.16 PRS residents age groups
Source: Census Table DC3409EW
Household composition
5.100 Regarding household composition, as with the age breakdown, the most striking factor is the
number of households with dependent children – some 31%. Among these, 8% are lone parents with
dependent children. There are implications for Mole Valley’s homelessness and allocations policies if
the stability of this group’s residence in the PRS was threatened.
Table 5.8 Household composition in Mole Valley PRS
Number %
One person 65+ 231 5%
One person under 65 1,159 27%
Couple both / other all 65+ 85 2%
Couple, no children 975 23%
Couple, dependent children 849 20%
Couple, all children non-dependent 107 3%
Lone parent, dependent children 342 8%
Lone parent, all children non-dependent 79 2%
Other, with dependent children 108 3%
Other, all f/t students 5 0%
Other 330 8%
Total 4,270 100% Source: Census 2011 Table DC4101EW
5.101 The authority has 8% of PRS households categorised as ‘Other’. ‘Other’ households tend to
be multi-adult sharing households. This growth has been a common feature observed in a number of
South East and London housing market areas over the last decade and is an indicator of the
economic driver forcing younger adults to club together to afford to rent, as a necessary alternative
to buying, renting self-contained homes, or ‘boomerang’ households where grown-up children
20%
11%
50%
12%
7%
Age 0 to 15
Age 16 to 24
Age 25 to 49
Age 50 to 64
Age 65 and over

95
return to or never leave the parental home, because accessing private renting or owner-occupation
is beyond their means.
PRS property size
5.102 The PRS predominantly comprises smaller properties. Some 60% are one beds or two beds
(20% one beds, 40% two beds) compared to 24% in the owner-occupied sector (4% one beds, 20%
two beds). Conversely, only 40% of PRS properties are three-bed or larger, compared to 76% in the
owner-occupier sector. This is reflected to some extent in the overcrowding ratios in the different
sectors, where both the PRS and the social rented sector (both 7% overcrowded) are significantly
more so that the owner-occupier sector. Figure 5.16 shows the proportions of different tenures that
have extra bedrooms, are ‘balanced’ in terms of the bedroom standard and are overcrowded – i.e.
have a deficit of bedrooms.
Figure 5.16 Overcrowding by tenure
Source: Census 2011 Table LC 4108EW
5.103 Given the proportions of dependent children in the PRS we also looked at how the space
they enjoyed compared to other sectors. Again, private and social rented tenants with children were
substantially more likely than their owner-occupying counterparts to live in smaller one or two
bedroom homes (7% for owners, 38% for social renters, 35% for private renters).
53%
9%16%
33%
18%
35%
13%
66%
42%
1%7% 7%
0%
10%
20%
30%
40%
50%
60%
70%
80%
90%
100%
Owned or SO Social rented Private rented
2 or more extra 1 extra Balanced Deficit of 1 or more
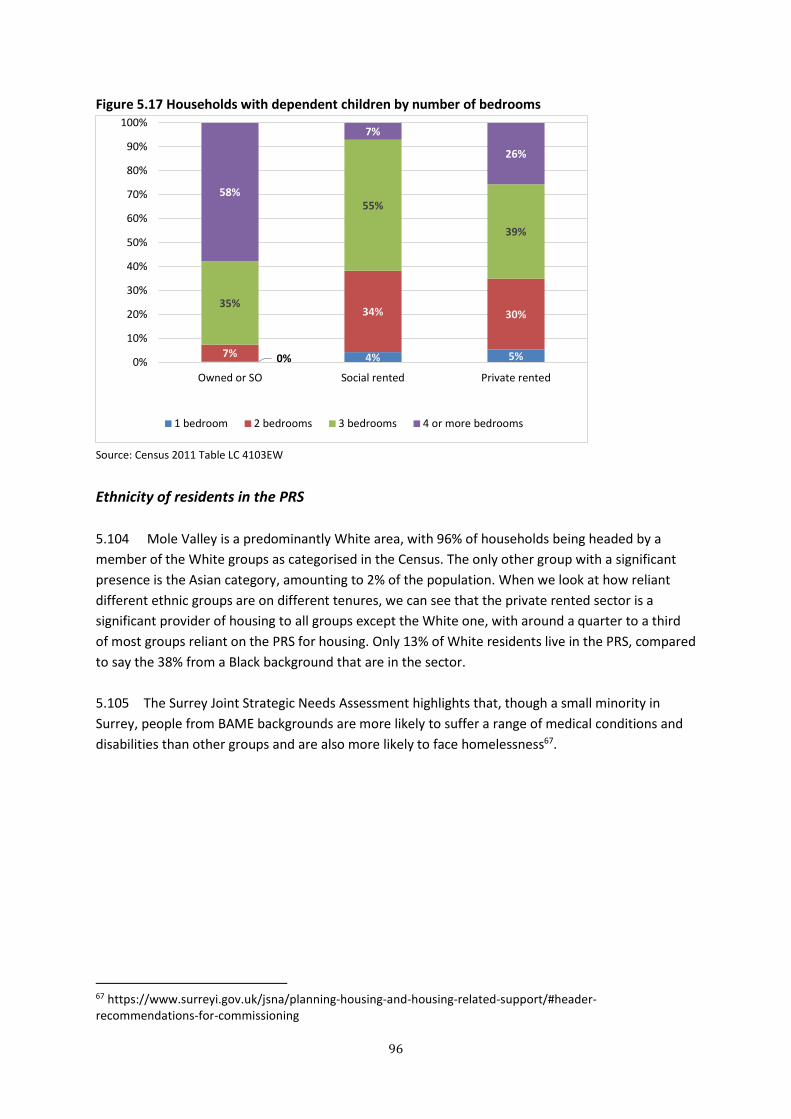
96
Figure 5.17 Households with dependent children by number of bedrooms
Source: Census 2011 Table LC 4103EW
Ethnicity of residents in the PRS
5.104 Mole Valley is a predominantly White area, with 96% of households being headed by a
member of the White groups as categorised in the Census. The only other group with a significant
presence is the Asian category, amounting to 2% of the population. When we look at how reliant
different ethnic groups are on different tenures, we can see that the private rented sector is a
significant provider of housing to all groups except the White one, with around a quarter to a third
of most groups reliant on the PRS for housing. Only 13% of White residents live in the PRS, compared
to say the 38% from a Black background that are in the sector.
5.105 The Surrey Joint Strategic Needs Assessment highlights that, though a small minority in
Surrey, people from BAME backgrounds are more likely to suffer a range of medical conditions and
disabilities than other groups and are also more likely to face homelessness67.
67 https://www.surreyi.gov.uk/jsna/planning-housing-and-housing-related-support/#header-
recommendations-for-commissioning
0% 4% 5%7%
34% 30%35%
55%
39%
58%
7%
26%
0%
10%
20%
30%
40%
50%
60%
70%
80%
90%
100%
Owned or SO Social rented Private rented
1 bedroom 2 bedrooms 3 bedrooms 4 or more bedrooms

97
Figure 5.18 PRS and ethnicity
Source: Census 2011 Tables LC 4201EW
Economic activity, occupation and industry
5.106 Mole Valley PRS residents show higher economic activity rates than the overall average for
the authority (shown for comparison), mainly because there is a significantly lower retirement rate
in the PRS, compared to other sectors.
Table 5.9 PRS and economic activity
Economic activity category PRS All tenures
Economically active 86% 68%
Employed or self-employed, f/t 84% 81%
Employed or self-employed, p/t 12% 17%
Employed f/t students 1% 0%
Unemployed (exc. f/t students) 2% 2%
Unemployed f/t students 0% 0%
Inactive 14% 32%
Retired 9% 29%
Inactive other (sick, disabled, at home) 3% 2%
Inactive f/t students 0% 0%
Inactive other plus unemployed exc. Students 3% 2%
Source: Census 2011 Table DC 4601EW
5.107 We can also examine the type of occupation that those in work belong to (Table 5.10). Here,
the PRS is catering for slightly fewer residents at the wealthier end of the occupational spectrum:
groups 1, 2 and 3 (58%), compared to the general population (64%).
5.108 Further down the spectrum, there is a marginally higher proportion in the lower supervisory
75%
58% 58%
45%
59%
12%
16%7%
17%
15%
13%
26%35% 38%
25%
0%
10%
20%
30%
40%
50%
60%
70%
80%
90%
100%
White Mixed/multiple Asian Black Other
Owned Social rented Private rented
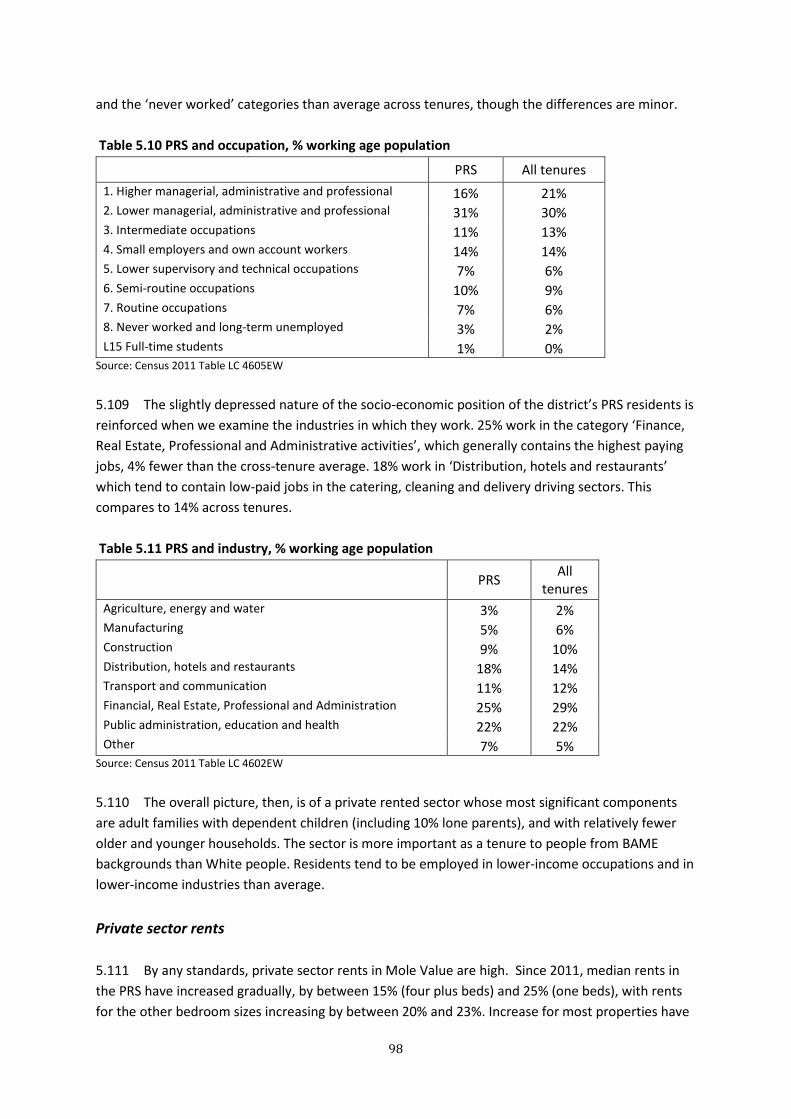
98
and the ‘never worked’ categories than average across tenures, though the differences are minor.
Table 5.10 PRS and occupation, % working age population
PRS All tenures
1. Higher managerial, administrative and professional 16% 21%
2. Lower managerial, administrative and professional 31% 30%
3. Intermediate occupations 11% 13%
4. Small employers and own account workers 14% 14%
5. Lower supervisory and technical occupations 7% 6%
6. Semi-routine occupations 10% 9%
7. Routine occupations 7% 6%
8. Never worked and long-term unemployed 3% 2%
L15 Full-time students 1% 0% Source: Census 2011 Table LC 4605EW
5.109 The slightly depressed nature of the socio-economic position of the district’s PRS residents is
reinforced when we examine the industries in which they work. 25% work in the category ‘Finance,
Real Estate, Professional and Administrative activities’, which generally contains the highest paying
jobs, 4% fewer than the cross-tenure average. 18% work in ‘Distribution, hotels and restaurants’
which tend to contain low-paid jobs in the catering, cleaning and delivery driving sectors. This
compares to 14% across tenures.
Table 5.11 PRS and industry, % working age population
PRS
All
tenures
Agriculture, energy and water 3% 2%
Manufacturing 5% 6%
Construction 9% 10%
Distribution, hotels and restaurants 18% 14%
Transport and communication 11% 12%
Financial, Real Estate, Professional and Administration 25% 29%
Public administration, education and health 22% 22%
Other 7% 5% Source: Census 2011 Table LC 4602EW
5.110 The overall picture, then, is of a private rented sector whose most significant components
are adult families with dependent children (including 10% lone parents), and with relatively fewer
older and younger households. The sector is more important as a tenure to people from BAME
backgrounds than White people. Residents tend to be employed in lower-income occupations and in
lower-income industries than average.
Private sector rents
5.111 By any standards, private sector rents in Mole Value are high. Since 2011, median rents in
the PRS have increased gradually, by between 15% (four plus beds) and 25% (one beds), with rents
for the other bedroom sizes increasing by between 20% and 23%. Increase for most properties have

99
been steady, though four plus beds have been more volatile over the years (though the samples are
smaller). There are some signs that the rate of increase is slowing slightly (see Figure 5.19). If we
assume (as we have done in chapter 4) that no household should be expected to pay more than a
third of their income in housing costs, this means that the relevant incomes for affordable PRS
accommodation by bedsize are as follows:
Table 5.12 Median private rents and affordability
Size
Monthly
median rent
(£)
Annual
median rent
(£)
Household income required to
ensure no more than 33.3%
spent on housing costs (£)
Studio 700 8,400 25,000
1 bed 860 10,320 30,960
2 bed 1,125 13,500 40,500
3 bed 1,495 17,940 53,830
4+ bed 2,300 27,600 82,800 Source: Valuation Office Agency March 2020
5.112 If we apply these figure to the income distribution table, table 4.1, we see that:
• The lowest earning 30% could not afford a studio or one bed at median rent
• The lowest earning 40% could not afford a two bed at median rent
• The top earning 30% could afford a three bed at median rent
• Only the top 10% of earners could afford a four bed at median rent
5.113 However, it should be remembered that the figures relate to household income so, for
example, if three individual sharers on median earnings jointly rented a four-bed, this would become
affordable. The key affordability issue is around access to the smallest properties for those on the
lowest earnings.
Figure 5.19 Changes in rent levels over time
Source: Valuation Office Agency and ONS
-250
250
750
1,250
1,750
2,250
2,750
2011 2012 2013 2014 2015 2016 2017 2018 2019 2020
£ p
er
mo
nth
Studio 1 bedroom 2 bedrooms 3 bedrooms 4 + bedrooms All

100
5.114 The inability of households on lower incomes to afford access to the PRS, despite the Local
Housing Allowance having increased slightly over the last five years, was highlighted as an issue in
the 2019 Homelessness Review by the Council68. While the authority has been successful through
their rent bond deposit scheme, payments of rent in advance and use of the homelessness
prevention fund in preventing homelessness from or relieving homelessness within the PRS, this
approach is only viable if there continues to be a supply of affordable properties in the sector.
However, according to officers, given the overall affluence of the area, there is no need for
landlords to cater to the lower end of the market and in effect that has atrophied.
The Housing Benefit market and Houses in Multiple Occupation (HMOs)
5.115 The number of PRS households that landlords are willing to let to if they need to access
Housing Benefit (HB) has been falling since the impact of the welfare reforms that were begun in
2011, under which caps to Local Housing Allowances were introduced. Since 2011 a range of other
measures, including caps on overall HB payable, reductions to the support that younger people can
receive, and the introduction of Universal Credit have been rolled out. The cumulative impact has
been a reduction by 20% of the number of HB claimants across the South East (and therefore a loss
of these tenancies to those with lower incomes who would in the past have accessed the sector).
5.116 The problem is exacerbated in Mole Valley by the very low proportion of HMOs in the
district (less than 1% of dwellings according to the Homelessness Review; there are only ten licenced
HMOs on the HMO register). This means that there are very few housing options for those on
benefits, especially for those aged under 35 and therefore restricted in the amount of Local Housing
Allowance to which they are entitled. This is perhaps reflected by the changing balance of
homelessness acceptances, between families and single people: in 2015-16 the ratio was 33:8
families to single people; in 2018-19 it was 33:24 families to single people.
5.117 In spite of the low numbers of licensed HMOs, the numbers have increased over the last
several years. But the type and standard of HMOs reflect the affluence of the area. According to
officers, they tend to be of a high standard, attracting wealthier tenants. One example given was of
an HMO where a pilot was a resident.
5.118 More generally, in Mole Valley, as with elsewhere, changes to the benefit regime have
impacted on the number of HB claims from PRS tenants. Numbers have fallen substantially since the
changes began to take effect in 2013. The fall in claims from 1153 to 681 (March 2020) represents a
41% reduction. The rollout of Universal Credit may account for a significant proportion of the
decline, though it is noticeable that the downward trend began several years before the introduction
of Universal Credit. Problems accessing UC, especially just after it was rolled out, and the time lags
in receiving payments made it more difficult for low income tenants to obtain and retain
accommodation.
68 Homelessness Review 2019, Mole Valley District Council

101
Figure 5.20 Number of PRS Housing Benefit claims
Source: DWP StatExplore
5.119 It will be remembered from Chapter 4 that we estimated that 59 new claimants (now, of
course, mostly claiming Universal Credit) enter the PRS every year. This represents 39% of affordable
housing need, and thus shows the considerable role the PRS plays in effectively preventing statutory
homelessness, as (given the demographic profile noted above) it is likely that a substantial
proportion would be households with dependent children. There must therefore be concern at the
rate of attrition of the housing benefit PRS.
Stock condition in the PRS
5.120 There is very little information available on the condition of the private rented stock. As far
as can be seen, there has not been a private sector stock condition survey carried out in recent
times. The Surrey JSNA69 indicates that at a national level poor housing is more common in the
private rented sector, where it is estimated that 29% of homes fail decent homes standards.
5.121 Mole Valley environmental health services have issued one Prohibition Order (used where
there are serious threats to the health and safety of occupants over the last five years and have
carried out a successful prosecution of a landlord for breach of the Prohibition Order.
Homelessness and temporary accommodation (TA)
5.122 There is a body of evidence showing the loss of tenancies in the PRS are impacting on
homelessness. Across the country the proportion of priority acceptances of those losing their PRS
69 https://www.surreyi.gov.uk/jsna/planning-housing-and-housing-related-support/
1043 1071
11531082 1052
1002963 950
830
681
6
113
139
567
1454
0
200
400
600
800
1000
1200
1400
1600
2011 2012 2013 2014 2015 2016 2017 2018 2019 2020
Housing Benefit Universal Credit

102
tenancies because of the ending of Assured Shorthold Tenancies (ASTs) has quadrupled since 201170.
In Mole Valley the ending of an AST has been the most common reason for approaches to the
Housing Options and Homelessness Services Team in four of the last six years71. Under the new data
collection arrangements associated with the Homelessness Reduction Act 2017, the first three
quarters of 2018-19 saw that 26% of those initially assessed under the Act (49 of 191) had lost their
accommodation because of the ending of an AST. The authority will want to monitor future
developments further, as the new data collection arrangements brought in under the Homelessness
Reduction Act 2017 are not yet fully bedded in.
5.123 The Surrey Joint Strategic Needs Assessment highlights homelessness prevention and
support for homeless households as one of its key recommendations for improving health
outcomes.72
5.124 As of July 2020, there were 196 PRS households on the Mole Valley housing register, around
35% of the total and the largest single group by tenure. Of these 23 households (12%) were also
categorised as homeless.
5.125 The other factor of relevance is the role the PRS has had in helping provide temporary (and
more recently permanent) accommodation for statutorily homeless households. London authorities
in particular have relied on a variety of leasing schemes. Traditionally, Mole Valley has avoided this
path, through use of its own self-contained emergency accommodation, in association with local
housing associations, Bed and Breakfast (for limited periods) and private sector nightly stay
accommodation within the authority.
70 The Homelessness Monitor 2018, JRF / Crisis, 2018 71 Homelessness Review 2019, Mole Valley DC 72 https://www.surreyi.gov.uk/jsna/planning-housing-and-housing-related-support/#header-whos-at-risk-and-
why
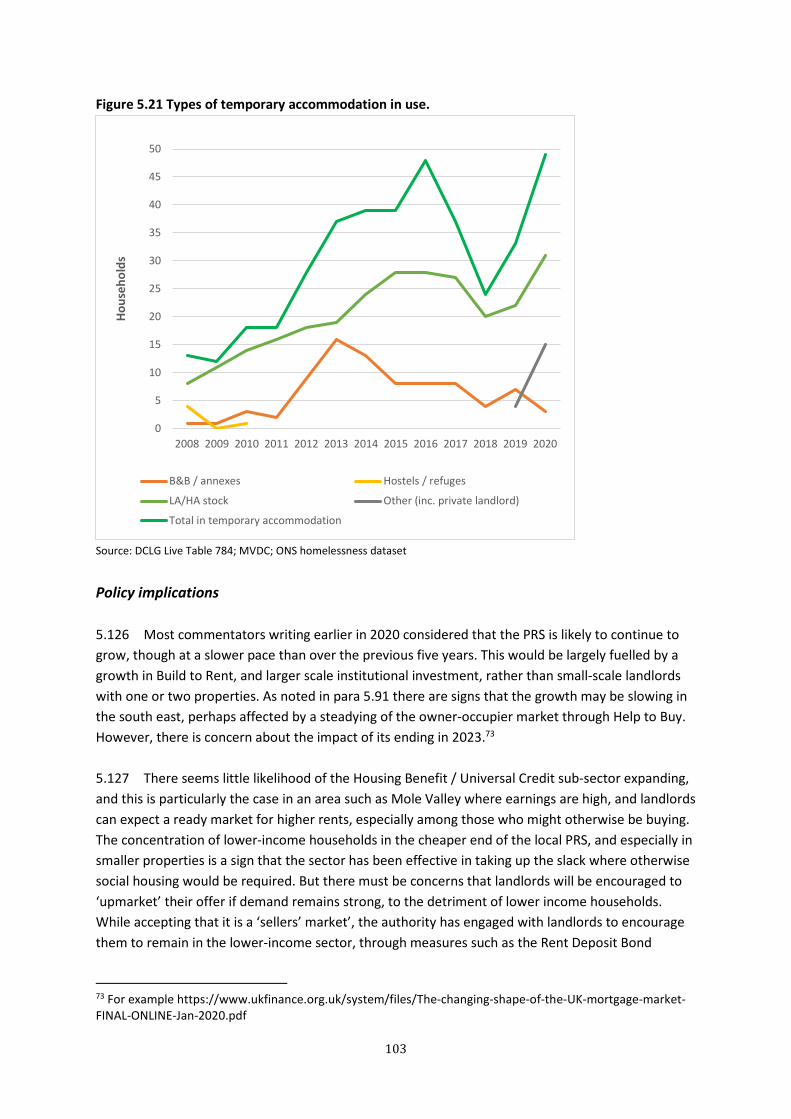
103
Figure 5.21 Types of temporary accommodation in use.
Source: DCLG Live Table 784; MVDC; ONS homelessness dataset
Policy implications
5.126 Most commentators writing earlier in 2020 considered that the PRS is likely to continue to
grow, though at a slower pace than over the previous five years. This would be largely fuelled by a
growth in Build to Rent, and larger scale institutional investment, rather than small-scale landlords
with one or two properties. As noted in para 5.91 there are signs that the growth may be slowing in
the south east, perhaps affected by a steadying of the owner-occupier market through Help to Buy.
However, there is concern about the impact of its ending in 2023.73
5.127 There seems little likelihood of the Housing Benefit / Universal Credit sub-sector expanding,
and this is particularly the case in an area such as Mole Valley where earnings are high, and landlords
can expect a ready market for higher rents, especially among those who might otherwise be buying.
The concentration of lower-income households in the cheaper end of the local PRS, and especially in
smaller properties is a sign that the sector has been effective in taking up the slack where otherwise
social housing would be required. But there must be concerns that landlords will be encouraged to
‘upmarket’ their offer if demand remains strong, to the detriment of lower income households.
While accepting that it is a ‘sellers’ market’, the authority has engaged with landlords to encourage
them to remain in the lower-income sector, through measures such as the Rent Deposit Bond
73 For example https://www.ukfinance.org.uk/system/files/The-changing-shape-of-the-UK-mortgage-market-
FINAL-ONLINE-Jan-2020.pdf
0
5
10
15
20
25
30
35
40
45
50
2008 2009 2010 2011 2012 2013 2014 2015 2016 2017 2018 2019 2020
Ho
use
ho
lds
B&B / annexes Hostels / refuges
LA/HA stock Other (inc. private landlord)
Total in temporary accommodation
104
Scheme. We would support this type of initiative and suggest that additional support measures (e.g.
tenant training and advice, improvement grants) be considered if possible.
5.128 The general impression gained from neighbouring authorities is that the PRS is still a growing
sector. It is described in one as ‘strong and healthy’ and there is an emphasis on town centre
development. The more rural areas and those furthest from the city are not traditionally ones where
there was much rented property but even they are seeing or expecting growth.
5.129 The stimuli to growth include the obvious affordability factors, causing people to come to
purchase later, if at all. But it is thought that there are also lifestyle factors such as greater job
mobility amongst the young (making the PRS a sensible short term option) and economic uncertainty
(which causes people to hold off purchase until more certain times). In addition, areas where there
is severe pressure on space are finding that one solution is higher density flatted dwellings, and
these lend themselves to rental more than purchase.
5.130 Institutional investment was noted in several neighbouring areas, usually providing higher
value accommodation. One authority expressed the view that the increase in institutional
investment was raising standards beyond those offered by traditional private owners. Properties
were being built to a higher specification with additional facilities and features.
5.131 However, the big factor with an as yet unknown long-term impact is of course Covid-19. The
implications are multiple, ranging from an increase in the number of evictions and growing
homelessness as the legislative buffers are removed, to longer-term life-style changes, as people
prioritise the quality of their homes as both work / living space, to changing patterns of institutional
investment as lenders and financial markets continue to experience uncertainty.
People wishing to build their own homes
5.132 National Planning Policy Guidance notes the government’s desire to enable more people to
build their own homes and to make this form of housing a mainstream housing option.
5.133 The Self-Build and Custom Housing Building Act 2015 came into force in April 2016. Among
other measures, it placed a duty on local authorities to keep a register of individuals and community
groups who have expressed an interest in acquiring land to bring forward self-build and custom-
build projects and to have regard to and make provision for the interests of those on such registers
in developing their housing initiatives and their local plans (including such data in SHMAs). It is
expected that the authority will grant permission for serviced plots to meet demand. It also allows
volume house builders to include self-build and custom-build projects as contributing towards their
affordable housing obligations, when in partnership with a Registered Provider.
5.134 Revised regulations came into force in October 201674. In effect, these give authorities the
option to set up a two-part register that is more sophisticated than the initial model. Authorities can
74
http://www.legislation.gov.uk/uksi/2016/1027/pdfs/uksi_20161027_en.pdf
http://www.legislation.gov.uk/uksi/2016/1027/pdfs/uksiem_20161027_en.pdf

105
set up local eligibility tests against two criteria: having a local connection and being able to
demonstrate they have the resources to purchase land for their own self-build project. Only those
who meet these criteria and enter Part 1 of the register would be entitled to access to development
permissions. Mole Valley has set up such a two-part register. The regulations also make provision for
authorities to appeal to the secretary of state for exemptions from the duty to provide serviced plots
where demand on housing land supply is constrained.
5.135 As of September 2020 there were 125 applicants who had expressed interest in self-build or
custom build in Mole Valley. There were 32 applicants in 2016, 37 applicants in 2017, 16 in 2018, 21
in 2019 and 19 so far in 2020. However, of the original 125, only 85 (66%) are still eligible, mainly
because the remnant ceased paying registration fees.
• Of the remaining 85, 34 are eligible under Part 1 of the Register (that is, they have a local
connection and can demonstrate access to financial resources).
• Of these, 80% currently lived in Mole Valley, while 50% worked there and nearly 40% had
family connections
• Eight of the 34 are also looking at Self-Build options outside Mole Valley.
• In terms of resources available, 16 would use their savings, alongside taking out a mortgage;
11 would use their savings without taking out a mortgage; four had no savings, but would
take out a mortgage; three were totally reliant on the sale of their current home to fund the
self-build project, with another six using existing property equity to supplement savings and
/ or mortgage.
• Only one housing association had expressed interest in Self-Build.
• There was very little interest expressed in forms of occupation other than full ownership:
only two were interested in affordable renting and two in shared equity schemes.
• Among the 34, demand for larger properties was dominant: 24 wanted four-beds or larger,
and 18 wanted three-beds
• In parallel, 29 wanted detached houses, with another 11 wanting bungalows (multiple
selections were possible).
• Estimated budgets ranged from £160,000 to £1.5M
Policy implications
5.136 It will be up to the authority to decide what priority should be given to self-builders,
alongside competing demands for access to development land. But if the authority were to make
such provision, it would be sensible to prioritise those with the closest connections to the authority
(that is, on Part 1 of the register), those with the greatest needs (e.g. to provide local family
accommodation) and those that have restricted their application to Mole Valley. There are currently
26 applicants that meet these criteria.
5.137 All the neighbouring authorities have self-build registers with varying numbers of applicants
(including one with none). Most have, or are planning to, introduced stricter criteria such as Mole
Valley have done, so that those on the register are displaying serious interest. The general approach
seems to be to make a small percentage (5%) of plots available on large sites, for a limited time. But

106
it is a very low priority and where space is at a particular premium even this provision may be
difficult to justify.
5.138 There is no centrally-held data yet available that would enable us to compare demand for
self-build in Mole Valley with demand elsewhere. Generally, it is the case that the UK has a lower-
proportion of self-builders than other parts of Europe – some 7% to 10% of completions compared
to say, Austria, where 80% are self or custom-built75, and the government has indicated that it wants
to double the numbers. However, it should be noted that there are currently 564 households on
Mole Valley’s housing register who will in the main be requiring some form of affordable home, and
a calculated annual deficit of 143 affordable homes (Table 4.13). It would be understandable if the
authority were to prioritise those needs above those of self-builders when it comes to the allocation
of scarce serviced land.
75 Self-Build and Custom Built Housing (England) – House of Commons briefing paper, 2017

107
Appendix 1
Mole Valley and the Gatwick Diamond: an update report on housing market
linkages
Introduction
1. Chapter 2 of the 2016 SHMA considered evidence on the boundaries of Housing Market
Areas covering the four local authorities who commissioned that study (Mole Valley, Epsom and
Ewell, Elmbridge and the London Borough of Kingston upon Thames) and the areas adjacent to
them. It concluded (para 2.44) that the SHMA should treat the four commissioning authorities as a
single HMA, but with recognition of the existence of linkages to adjoining areas outside the HMA. It
was recommended that Mole Valley should take account of the linkages between its southern parts
and HMAs to the south and east, arising from the economic pull of development in the core of the
Gatwick Diamond area, shown schematically below (Figure 1). These HMAs were the Northern West
Sussex HMA covering Crawley, Horsham and Mid Sussex, and the Croydon-Reigate-Tandridge HMA.
The brief for this study included a requirement to provide an updated analysis of Mole Valley’s
housing market relationships with the areas of Reigate, Crawley and Horsham in a separate paper.
Figure 1 Location of the Gatwick Diamond
Source: http://www.gatwickdiamond.co.uk/
108
2. It is not surprising that Gatwick Airport and economic activity there and in Crawley should
exert an influence on the housing market of Mole Valley. The Gatwick Diamond has been identified
as one of the fastest growing areas of the UK economy. The area covered by the Diamond has no
formal boundary, but is a partnership covering Crawley, Epsom and Ewell, Horsham, Mid Sussex,
Mole Valley, Reigate & Banstead and Tandridge. A report by the Centre for Cities published in 201776
concluded that the area was making a strong contribution to the UK economy and performing well
above average on a range of economic indicators. In terms of jobs, Crawley makes the largest
contribution, led by the large concentrations of jobs in the Manor Royal business district and
Gatwick Airport. Other areas, such as Horsham, Leatherhead, Reigate, Burgess Hill and Epsom also
make strong contributions. The report concluded that to maintain its strong performance in the
future, the area would need to address three pressures:
• Improving the supply of adequate employment land.
• Addressing the rising cost of housing, which might make the area less attractive to workers
in the future.
• Increasing the supply of workers with the skills required to support and sustain growth.
Housing market linkages
3. Following the NPPF and Planning Practice Guidance extant at the time of its preparation, the
2016 SHMA examined evidence on commuting patterns, house prices, migration and other
contextual indicators to assist in the identification of HMA boundaries. Current PPG no longer refers
to HMAs or their definition, so this analysis uses the approach previously set out.
Commuting patterns
4. The Office of National Statistics publishes a set of travel-to-work areas covering the whole
country. The 2016 SHMA described commuting patterns in the area covering and around Mole
Valley, drawing on the latest classification of travel-to-work areas drawn up by the Office of National
Statistics in 2015, based on 2011 Census data. For the 2011 Census-based TTWAs, the defining
criteria were that at least 75% of an area's resident workforce should work in the area, and at least
75% of the people who work in the area should also live there. The area should also have a working
population of at least 3,500. For areas with a working population in excess of 25,000, lower self-
containment rates of 66.7% were necessary.
5. The 2011-based TTWA boundaries allocated Mole Valley to three separate wider TTWAs
(Figure 2). A small part of the north-east of the district was placed within the very large London
TTWA. This small area mainly covers Ashstead, located between Leatherhead and Epsom and within
the M25. The south west of Mole Valley, west of the A24 and excluding Dorking, fell within the
Guildford and Aldershot TTWA. The majority of the district, including both Dorking and Leatherhead
fell within the large Crawley TTWA which, in addition to Crawley, covers most of Horsham, Mid
Sussex, Tandridge and Reigate and Banstead. In the previous 2001-based TTWAs Mole Valley was
split between London and Crawley, with the boundary running south of Leatherhead and north of
Dorking, so there was a significant change in the predominant set of economic linkages in the
Leatherhead area over the 2001-2011 period, with a re-orientation of much of the north of Mole
Valley towards Gatwick and Crawley, reflecting the strong economic growth of the area.
76 Hugo Bessis and Adeline Bailly (2017) The Economic Geography of the Gatwick Diamond
October, 2017, Centre for Cities

109
6 As the 2016 SHMA noted, the volatility of these TTWA boundaries, and the very large size of
the TTWAs in and around London, including the one centred on Crawley/Gatwick, limits their value
as a key source of evidence in determining HMA boundaries. Areas such as Haywards Heath which
are within the Crawley TTWA could in no sense be said to be part of the same housing market as,
say, Dorking. However, the allocation of the largest part of Mole Valley district to the Crawley TTWA
confirms the strength of its linkages with Gatwick Airport, Crawley and the other centres of
employment such as business parks in the immediate area. It supports the view that there are now
strong commuting links between much of the district and the core of the Gatwick Diamond. Much of
this will relate to better paid employees willing and able to commute substantial distances rather
than to low paid workers.
Figure 2 Travel to work area boundaries
Contains National Statistics data © Crown copyright and database right 2020. Contains OS data © Crown copyright and database right
2020.

110
House prices
7. PPG indicated that patterns of house prices and of changes in prices also provided evidence
of the relationship between housing demand and supply in different locations and the identification
of areas which have different price levels, market ‘hotspots’, low demand areas and areas of price
volatility. Analysis in the 2016 SHMA revealed that Mole Valley was a largely high-priced area having
a sectoral relationship with London, and forming part of a high-priced rural area outside the Greater
London Boundary serving commuters working in London, and a retired population. The settlements
of Leatherhead and Dorking provided an exception to this pattern with some lower value housing.
The predominantly rural southern part of Mole Valley was also adjacent to the lower-priced areas of
Reigate, Horley, Crawley and Horsham, with Crawley especially having no higher priced rural
hinterland within its own boundaries. More recent data is available on the pattern of prices at the
end of 2019 for lower level super output areas (Figure 3). Although prices have increased, the
pattern shows very little change from that shown in the 2016 SHMA. There is a notable absence of
any very low priced areas within Mole Valley, Horsham, Mid Sussex or Reigate and Banstead.
Figure 3 Median dwelling sale price by LSOA
Source: ONS Median house prices by lower layer super output area: HPSSA dataset 46, release July 2020. Contains National
Statistics data © Crown copyright and database right 2020. Contains OS data © Crown copyright and database right 2020.
111
Migration patterns
8. Migration patterns have been the most widely-used indicator of the extent of housing
market boundaries, as in the various national studies carried out in the early 2000s which are
described and referenced in the 2016 SHMA. Migration patterns can be used to highlight areas
within which a relatively high proportion of household moves (typically 70 per cent nationally) are
contained, in the same way that TTWAs can be created from commuting patterns, but there is no
equivalent official national set of HMA boundaries to that produced for TTWAs because it has
proved impossible to construct an authoritative and unique set of housing market areas. In some
areas consisting of a large town surrounded by a rural hinterland, it is (relatively) straightforward to
define an HMA which is reasonably self-contained, but in many areas the complexity of the
settlement pattern makes this difficult. In the London context especially, there is a tendency for the
analysis of migration patterns either to arrive at one very large HMA covering the whole of the
Greater London area and some adjacent districts outside (which is of little practical use for
development planning purposes), or to come up with a network of smaller areas which are not
unique, but dependant on the chosen starting point. It is also accepted that with the strong draw of
employment in central London and the generally better transport links, it is often necessary to
accept lower self-containment thresholds in and for some distance around the capital.
9. The ten-yearly Censuses of Population provide a very detailed picture of patterns of
migration between areas, notably through a matrix of origin-to-destination migration flows. This is
now of course increasingly out of date, but ONS also publish an annual estimate of internal
migration - moves between English and Welsh local authorities, Scotland and Northern Ireland -
which provides a broad update of the migration picture for Mole Valley. The latest data available,
released in June 2020, covers the year ending June 2019. Table 1 shows the main areas of origin for
migrants into Mole Valley in that period and the main destinations for out migrants (international
migration is not included in this data).
10. Migration is always made up of relatively large gross flows between districts, and much
smaller net flows, and most is relatively short-distance. The main net flows into Mole Valley are from
the other three local authorities which fell within the HMA identified in 2016, confirming the
continuing validity of this HMA area. Other significant net inflows come from Sutton, Merton and
Richmond. In contrast, there are net outflows from Mole Valley to Horsham and to Brighton.
11. This pattern is a classic one known as cascading, under which population migration occurs
outwards from large urban centres such as London to suburban areas, and from these areas into
more rural areas such as Mole Valley and to those further away, such as Horsham. There are some
other flows which do not fit into this pattern but arise simply from proximity such as moves between
Mole Valley and Crawley, Guildford and Reigate and Banstead. Interestingly there are very large
flows to and from Guildford but little net change. This picture suggests that the Gatwick Diamond is
not a major direct driver of migration movement into or out of Mole Valley, and that it is still less
important than the process of cascading movement out from Great London and its outer suburban
areas. Some of this migration will be of people seeking to move out of London whilst still working
there, but a significant component will be retirement related.

112
Table 1 Main internal migration flows (within Great Britain and Northern Ireland) involving Mole
Valley
Inward migration Outward migration Net inward
Epsom and Ewell 455 216 239
Kingston upon Thames 264 100 164
Elmbridge 298 152 146
Sutton 203 95 108
Reigate and Banstead 518 416 102
Merton 143 43 100
Richmond upon Thames 86 25 61
Wandsworth 157 123 34
Croydon 91 59 32
Tandridge 87 68 19
Crawley 71 73 -2
Guildford 260 266 -6
Brighton and Hove 67 102 -35
Waverley 80 133 -53
Horsham 120 336 -216
Source: ONS 2020 Internal migration - Matrices of moves between English and Welsh local authorities, English regions,
Scotland and Northern Ireland, year ending June 2019
12. Overall, this analysis confirms that the Kingston and North East Surrey HMA continues to be
valid, but that there are significant links between Mole Valley and the Gatwick/Crawley area, links
which have perhaps strengthened in recent years. These derive from the importance of the
Gatwick/Crawley as a centre for employment for Mole Valley residents. But the attraction of central
London, and of Kingston/Sutton and other employment locations in outer London is also important,
as are the smaller but significant concentrations of employment in Dorking and Leatherhead. The
converse of this is that Mole Valley already contributes to the provision of housing for those
employed in the central Gatwick Diamond area and that it is therefore playing a role in supporting
economic growth. Those living in Mole Valley are more likely to be higher paid workers able to
support longer distance travel. It is also likely that Mole Valley plays its part in the development of
the wider Gatwick Diamond area economy through the accommodation of some businesses
attracted to the area by its growth and the make up of its economy.
The planning context
13. The important of Gatwick/Crawley as a developing and dynamic focus for employment is
already recognised in the development planning process. As well as Mole Valley, both Crawley and
Horsham districts are in the process of developing new Local Plans in which the matter of
accommodating and sustaining this economic growth plays an important part.
14. Crawley’s Draft Plan is strongly focussed on the management of its central role within the
Diamond and the wider economic sub-region with Gatwick Airport as its economic core. It
recognises that Crawley lies within a wider area which it defines as the Northern West Sussex HMA,
mainly covering Crawley, Horsham and Mid Sussex, but also extending northwards into Reigate and
Banstead (but not including Mole Valley). The towns within the Northern West Sussex HMA are
complementary and inter-dependent with regard to housing and economic growth, and a table
adjacent to para 2.28 of the Crawley Draft Plan shows housing needs not just for the authority itself

113
but across the whole HMA. The Draft Plan indicates that under the current standard assessment the
town will need to provide for 752 new homes per annum to meet its needs, and accommodating
even some of this will involve difficult decisions77. The requirement to meet assessed need will need
to be reconciled with the protection of the built and natural environment. The confined boundaries
of Crawley and the scarcity of land free of constraints makes the need to plan for growth
challenging. In para 2.8 the draft Plan notes that the town’s housing needs may not be capable of
being met entirely within its own administrative boundaries, and Figure 2 adjacent to para 2.30 of
the Draft Plan shows four sites outside the Crawley boundary in Reigate and Banstead, Horsham and
Mid Sussex which will contribute to meeting Crawley’s needs.
Horsham
15. Horsham’s Draft Plan also indicates that the district forms an important part of the Gatwick
Diamond with close links to Crawley and Mid Sussex, along with linkages to the south coast in the
south eastern corner of the District. As in Crawley, the pressures arising from the proximity to
Gatwick place a unique challenge because of the characteristics of the town of Horsham and the
high quality rural environment. The Draft Plan aims to ensure that these strong identities are
retained. It indicates that to deliver the step change in housing required by Government78 to meet
housing needs together with a contribution to the needs of the wider sub region as part of the Duty
to Co-operate will require development at several large-scale strategic locations and potential for
strategic development has been identified in a number of other locations across the District.
Mid Sussex
16. The Mid Sussex District plan was adopted in 2018. Although Mid Sussex does not adjoin
Mole Valley, it forms part of the Northern West Sussex HMA and is within the Gatwick Diamond. The
plan fully recognises the wider context within which the district sits and the need for it to play a part
in sustaining economic growth. Chapter 3 of the plan describes the consultation carried out under
the Duty to Co-operate and the provision in the plan for Mid Sussex to provide 1,500 dwellings over
its plan period to met the needs of adjoining districts, especially those in the Northern West Sussex
HMA.
17. Taken together the three districts of Crawley, Horsham and Mid Sussex will experience an
increase in the level of assessed housing need from 2,819 dpa to 3618 dpa if the government’s
current proposals are adopted.
Reigate and Banstead
18. Mole Valley has relatively strong gross migration flow linkages with Reigate and Banstead
and makes a net gain of around 100 persons per annum from it. The two authorities share a long
common boundary and Dorking and Reigate are relatively close to one another so this is
unsurprising. Reigate and Redhill are well located in relation to the motorway network and have
strong sectoral transport links to Croydon and London, as well as southwards to the core of the
Gatwick Diamond. It is difficult to discern any other strong drivers of linkage between Mole Valley
and Reigate and Banstead.
77 This target may reduce to 598 dpa as a result of proposed changes to the standard assessment methodology for housing
need. 78 Under the proposals out for consultation at present, the assessed housing need for Horsham will increase from 965 dpa
to 1715 dpa, more than offsetting the reduction in Crawley.

114
19. The Reigate and Banstead Core Strategy was adopted in 2014, but according to a report on
affordable housing prepared in 2019 by Iceni Projects Limited, an update carried out by the Council
in 2019 did not identify any need to make changes to the policies which it contained. The Core
Strategy refers to the Duty to Cooperate but makes no specific mention of Mole Valley in that
context.
20. The 2019 update on affordable housing need reported that the Council considered that the
factors which had led it to adopt a constrained target for affordable housing (ie a target lower than
assessed need) were still pertinent in 2019, presumably despite the changes to NPPF and the
assessment of need since 2014. The assessment of need prepared by Iceni also makes no mention of
the needs of other areas or the Duty to Cooperate. In 2019 a Statement of Common Ground was
prepared by Reigate and Banstead jointly with Tandridge District Council in which the Councils
agreed that at present they were unable to assist one another in meeting housing need. At the same
time Tandridge agree with Mole Valley that it would not in general be appropriate to seek to tackle
Tandridge’s unmet housing need in Mole Valley because the two authorities are within different
HMAs. This suggests that Reigate and Banstead is more closely focussed in housing terms on the
Croydon-Reigate-Tandridge HMA area than it is with Mole Valley.
Mole Valley
21. The Draft Plan for Mole Valley seeks to meet the projected housing development needs of
the area through a ‘brownfield first’ approach using previously developed land, and land within the
built up areas of Ashtead, Bookham, Dorking, Fetcham and Leatherhead, including sites gained
through town centre redevelopment, redevelopment of sites previously in employment use, and
increases in the density of development. Development is also proposed on land to be released by
revision of the boundaries of the Green Belt and Countryside Beyond the Green Belt to enable
expansion of the villages of Beare Green and Hookwood in the south of the district, closer to Gatwick
and Crawley. The Draft Plan reports that discussions with neighbouring authorities have explored
the potential for meeting housing demand outside of Mole Valley, but no significant opportunities
are likely to arise over the course of the plan period.
Conclusions
22. Parts of Mole Valley district sit closely adjacent to the core area of the Gatwick Diamond,
including the airport itself and the settlement of Horley. Three separate HMA areas have been
identified covering or close to this core area – the Kingston and North East Surrey HMA, the
Croydon, Reigate and Banstead, Tandridge (and Mid Sussex) HMA79, and the Northern West Sussex
HMA. The last of these, in particular, is central to the Gatwick Diamond and strongly enshrined in
approved and draft local plans with evidence of clear cooperation on housing need between the
three authorities which it covers. The southern part of Reigate and Banstead, especially Horley, is
also closely linked to this core area. Although the boundaries of the Northern West Sussex HMA do
not include Horley, Crawley’s Draft Local Plan includes reference to a strategic site within Horley as
part of its provision for meeting need.
23. Mole Valley has been identified as forming part of a different Housing Market Area also
covering Kingston-on-Thames, Elmbridge, Epsom and Ewell. This is still supported by the evidence on
79 Mid Sussex appears to feature in more than one HMA as referred to in the 2019 Reigate-Tandridge Statement of
Common Ground.

115
patterns of migration, and reflects the sectoral structure of the area with moves out from London to
suburban areas and onwards into Mole Valley, and the radial transport links from the area into
Greater London. The Green Belt designation of land in Mole Valley adjacent to Gatwick and Horley,
has also probably prevented employment or housing growth on the north west side of Gatwick
airport which otherwise might have naturally taken place. Reflecting this, public and other transport
links from Gatwick/Crawley to the southern parts of Mole Valley are relatively weak, or indirect.
24. Despite this, much of Mole Valley forms part of the Crawley TTWA as a result of its strong
commuting links with the core Gatwick area. The settlement pattern and transport infrastructure in
the south of Mole Valley makes it likely that at present most commuting is by relatively high-earning
employees living in attractive rural areas within the Green Belt and other protected locations. The
Gatwick Diamond core and its periphery already make an important contribution to the economy of
Mole Valley and this may increase in the future. This may well not outweigh the importance of the
Green Belt and its protection, but Mole Valley has recognised options for taking forward
development in parts of this area adjacent to good employment opportunities as part of the process
of meeting its own very considerable housing needs.
25. It is a feature of the standard assessment of housing need that the needs which are
identified to be met by a local authority under that approach (and even more under the proposed
revised approach) are implicitly treated as needs arising in that area. In practice, only the
demographic base element of housing need can be construed as need arising in an area. The origin
of the additional need arising from the application of the various factors under the methodology
cannot be determined. It arises from the apportionment of the shortfall of need after the national
aggregate of demographic need is deducted from the government’s target for overall new housing
provision. In that sense, provision by Mole Valley to meet the housing needs which it is responsible
for (as determined by the standard methodology) is very likely to contribute to housing need arising
from economic growth at Gatwick/Crawley or other locations in the wider Gatwick Diamond area,
irrespective of whether this is formally identified as being the case.
The impact of COVID-19
26. This paper would not be complete without a reference to the impact of COVID-19. In August
2020 for example, Gatwick Airport alone announced 600 redundancies, and these and other impacts
will inevitably set back growth in the area for a period. At that point, it was reported that in Crawley,
25,800 people (41% of the labour force) were on furlough80 and there is no reason to assume that
surrounding areas would not also be affected, if less seriously. The same article described individual
cases of hardship and potential business failure, with some local people making comparisons
between the area and former coalmining areas in the north. Other commentators have dismissed
such comparisons, pointing out the continued existence of business parks such as Manor Royal and
the area’s proximity to London.
27 Uncertainty clearly hangs over the future demand for air travel. It may be that after a period
of retrenchment and slower growth the Gatwick Diamond area will return to or towards its previous
trajectory on the grounds that the basic factors driving the demand for low cost air travel remain
unchanged (though the airline industry recently predicted that this would not be until 2024).
Alternatively, though less probably, there may be more fundamental changes to the ways in which
80 See https://www.bbc.co.uk/news/uk-england-sussex-54480892

116
the companies previously attracted to the area do business. At present it is too soon to form a clear
view but the situation and its impact on housing demand in the area needs to be carefully
monitored.