Embed Size (px)
Citation preview

Strategic choices in social policy
Frank Vandenbroucke
Brussels, BIOF
7 May 2010

Strategic choices
“strategy” = “long-term plan or policy”
• Explicit strategic choices
– Budgetary strategy to prepare for ageing– Reconciling work and family life– (A certain type of) activation– Sector-based second pillar pensions– …
• Implicit strategic choices
– Emphasis on minimum protection– …

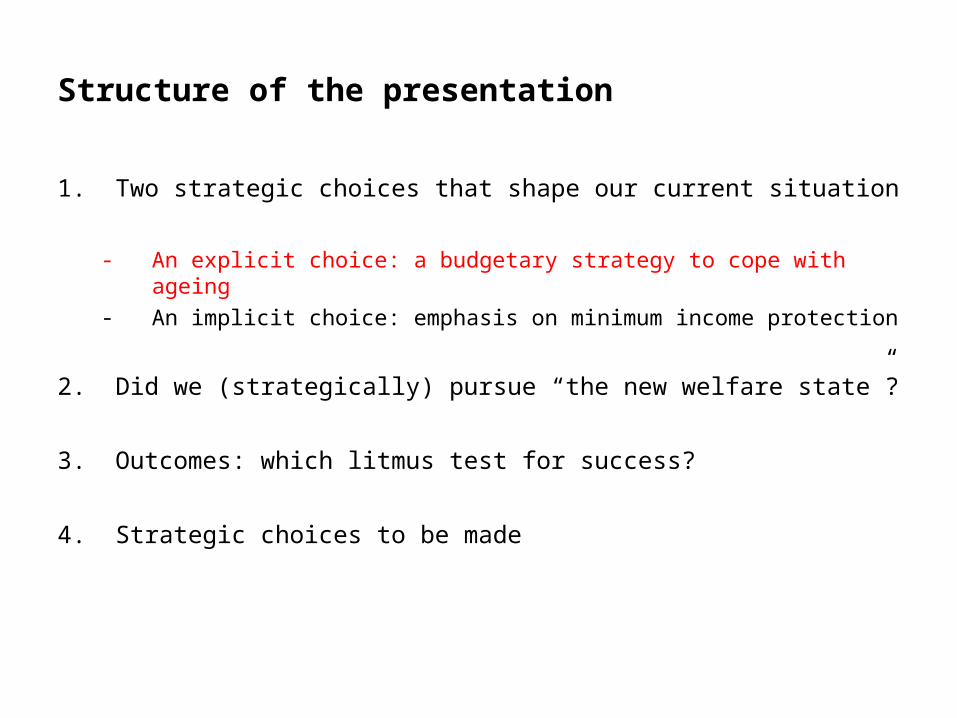
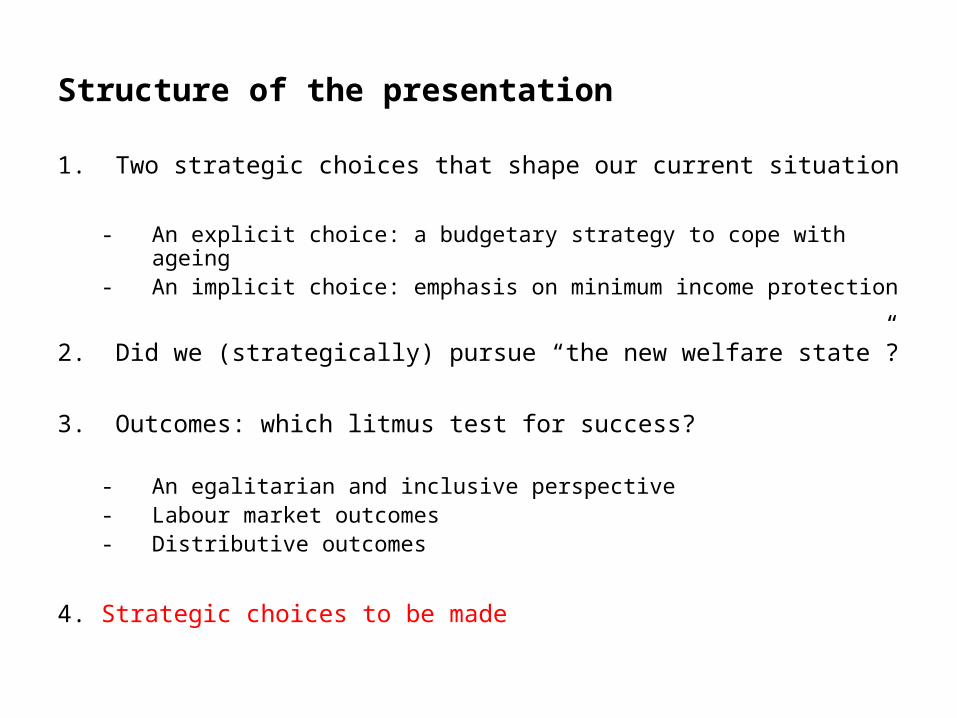
Structure of the presentation
1. Two strategic choices that shape our current situation
- An explicit choice: a budgetary strategy to cope with ageing
- An implicit choice: emphasis on minimum income protection
2. Did we (strategically) pursue “the new welfare state”?
3. Outcomes: which litmus test for success?
4. Strategic choices to be made

The budgetary strategy: turning vice into virtue
Current budgetary objectives, as formulated by the HRF
Entity I = Federal Government and (federal) Social Security
Entity II = Regional and Community Govt. (G&G) and Local Govt. (LO)
Budgetary objectives (“NFS”), distribution per Entity
2010 2011 2012 2013 2014 2015
Total -5,1% -4,1% -3,0% -2,0% -1,0% 0,0%
Entity I -4,1% -3,3% -2,6% -2,1% -1,6% -1,0%
Entity II -1,0% -0,8% -0,4% 0,1% 0,6% 1,0%
+ G&G -0,6% -0,5% -0,2% 0,2% 0,6% 0,9%
+ LO -0,4% -0,3% -0,3% -0,1% 0,0% 0,1%
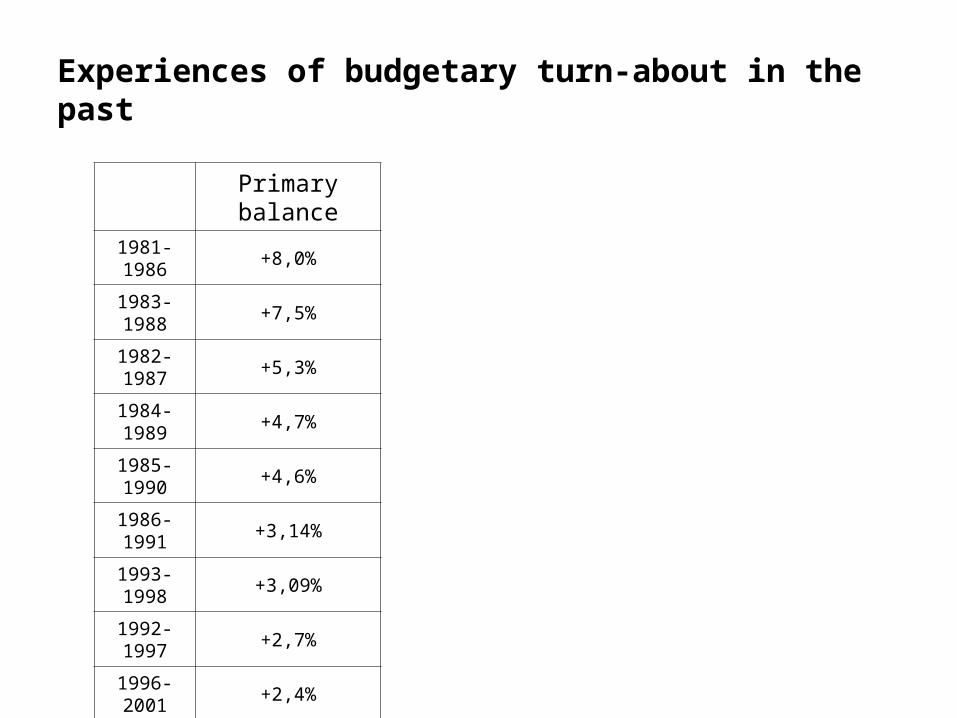
Primary balance
1981-1986 +8,0%
1983-1988 +7,5%
1982-1987 +5,3%
1984-1989 +4,7%
1985-1990 +4,6%
1986-1991 +3,14%
1993-1998 +3,09%
1992-1997 +2,7%
1996-2001 +2,4%
1995-2000 +2,2%
Experiences of budgetary turn-about in the past

Primary balance
1981-1986 +8,0% +3,7% ( - Inv)
1983-1988 +7,5%
1982-1987 +5,3%
1984-1989 +4,7%
1985-1990 +4,6%
1986-1991 +3,14%
1993-1998 +3,09% +2,6% ( - Inv) 1,7% (Ent. I) 1,4% (Ent. II)
1992-1997 +2,7%
1996-2001 +2,4%
1995-2000 +2,2%
Experiences of budgetary turn-about in the past

Limits of the budgetary strategy
• An unprecedented budgetary turn-about
• A fundamental institutional recalibration
• All net budgetary margins for the next 50 years = pensions & health-care (“cost of ageing)
80% of the “cost of ageing” is absorbable
… “heroic” in terms of budgetary effort, institutional deal,
… “bleak” in terms of societal dynamism?

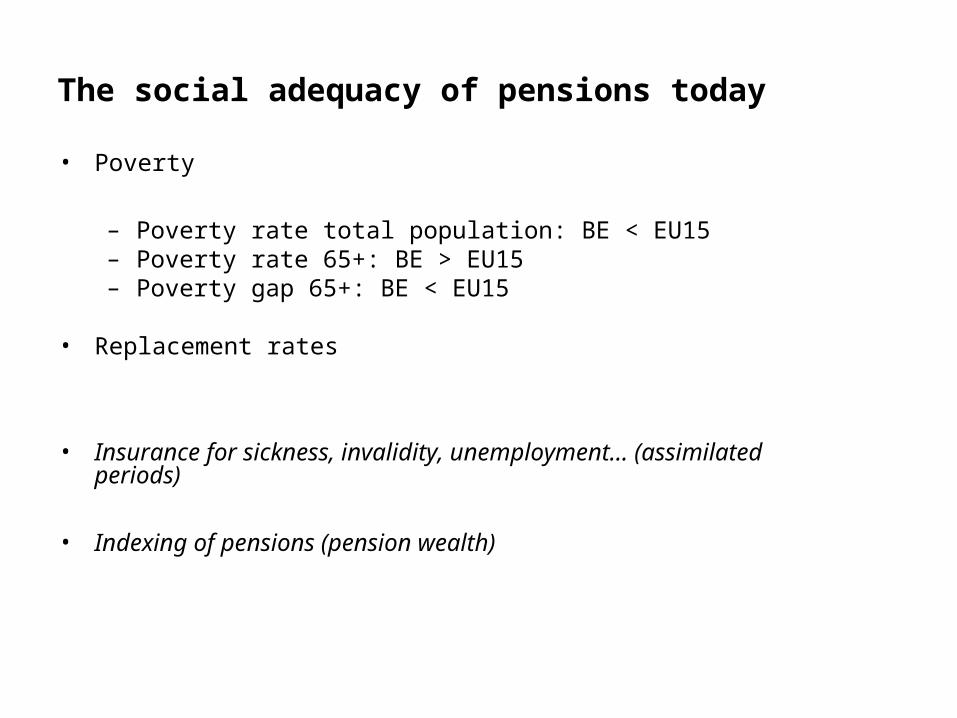
The social adequacy of pensions today
• Poverty
– Poverty rate total population: BE < EU15– Poverty rate 65+: BE > EU15– Poverty gap 65+: BE < EU15
• Replacement rates
The social adequacy of pensions today
• Poverty
– Poverty rate total population: BE < EU15– Poverty rate 65+: BE > EU15– Poverty gap 65+: BE < EU15
• Replacement rates
• Insurance for sickness, invalidity, unemployment… (assimilated periods)
• Indexing of pensions (pension wealth)

The OECD on (prospective) replacement rates
Gross (net) pension replacement rates by earnings
(individual earnings, multiple of average)
0,5 1 1,5 2
OECD72,2
(82,4)59,0
(70,3)54,3
(65,5)50
(60,8)
Belgium58,1
(78,7)42,0
(63,7)32,5
(51,7)24,3
(41,2)

-60
-50
-40
-30
-20
-10
0
10
20
30
40
0,5 1 1,5 2
Individual earnings, multiple of average
Pe
ns
ion
ga
p (
% o
f in
div
idu
al e
arn
ing
s)
Por Spa Fin Fra Ger
Gre Swe Ita Lux Net
-60
-50
-40
-30
-20
-10
0
10
20
30
40
0,5 1 1,5 2
Individual earnings, multiple of average
Aus Bel Den UK Ire
The pension gap and individual earnings (difference between mandatory, national and OECD average gross replacement rate)
Countries with less progressive benefit formulae Countries with more progressive benefit formulae

Current Belgian replacement rates (generation 2008)
RVP samplesalaried workers with career > 25 yearsgrossindividual pension
• Viz-à-viz average earnings over career: 64%
– career 25-29 years: 47%– career 45 years: 67%
• Viz-à-viz earnings last 5 years: 51%
– career 25-29 years: 41%– career 45 years: 52%
? Single-income => dual income pension households
! Second pillar: Matthew…

The projected social adequacy of pensions
Forecast by the Belgian Planning Office:
• Significant decrease of poverty among the elderly (2030)
• Further erosion of pension replacement rates for men, improvement then erosion for women
Should/can we improve upon this (simulated) scenario?
Is the legitimacy of our pension system in danger?

Pension reform is on the agenda
• Lowering the “quality” of pensions
– “quality” for which people? what conception of social adequacy?
• Extra contributions
– Second pillar?
• Working longer

Structure of the presentation
1. Two strategic choices that shape our current situation
- An explicit choice: a budgetary strategy to cope with ageing
- An implicit choice: emphasis on minimum income protection
2. Did we (strategically) pursue “the new welfare state”?
3. Outcomes: which litmus test for success?
4. Strategic choices to be made

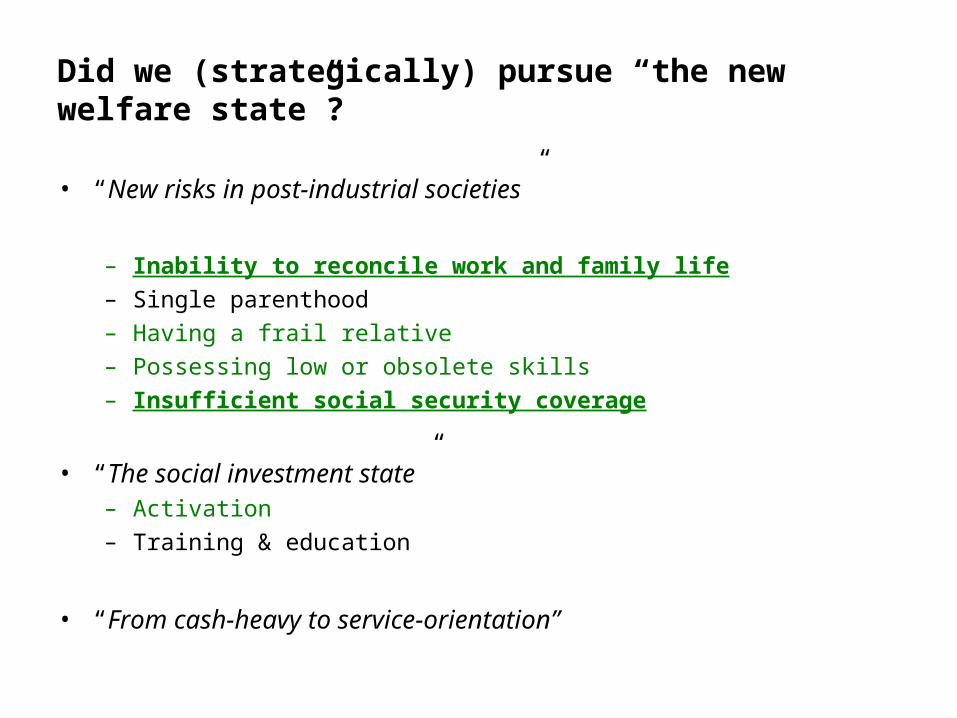
“The new welfare state”
• “New risks in post-industrial societies”
– Inability to reconcile work and family life– Single parenthood– Having a frail relative– Possessing low or obsolete skills– Insufficient social security coverage
• “The social investment state”
– Activation– Training & education
• “From cash-heavy to service-orientation”
= a coherent set of interrelated strategic choices?

Did we (strategically) pursue “the new welfare state”?
• “New risks in post-industrial societies”
– Inability to reconcile work and family life
– Single parenthood
– Having a frail relative
– Possessing low or obsolete skills
– Insufficient social security coverage
• “The social investment state”– Activation
– Training & education
• “From cash-heavy to service-orientation”

Did we (strategically) pursue “the new welfare state”?
• “New risks in post-industrial societies”
– Inability to reconcile work and family life– Single parenthood– Having a frail relative– Possessing low or obsolete skills– Insufficient social security coverage
• “The social investment state”– Activation– Training & education
• “From cash-heavy to service-orientation”– Mixed picture– Service-vouchers

Not a “frozen landscape”, yet…
… problems of
• coherence• determination• cost-efficiency
… linked, in Belgium, (amongst other factors) to
• north-south divide• “competitive nation building”

Structure of the presentation
1. Two strategic choices that shape our current situation
- An explicit choice: a budgetary strategy to cope with ageing- An implicit choice: emphasis on minimum income protection
2. Did we (strategically) pursue “the new welfare state”?
3. Outcomes: which litmus test for success?
- An egalitarian and inclusive perspective- Labour market outcomes- Distributive outcomes
4. Strategic choices to be made

België 25-29 jaar 30-34 jaar 35-39 jaar 40-44 jaar 45-49 jaar 50-54 jaar 55-64 jaar
M V M V M V M V M V M V M V
Laaggeschoold -8,9 -2,8 -6,2 -3 -5,6 3,6 -1,6 9,7 3,1 16,3 3,1 13,6 6,4 7,9
Middengeschoold 3,5 1,6 -0,1 4,5 1,3 7,4 -1,5 9,8 1,9 12,7 3,3 19,1 4,8 14,1
Hooggeschoold -1 1,2 -2,2 3,3 -1,7 3,4 0,4 3,1 -1 4,5 1 9,8 8,8 13,5
Vlaanderen 25-29 jaar 30-34 jaar 35-39 jaar 40-44 jaar 45-49 jaar 50-54 jaar 55-64 jaar
M V M V M V M V M V M V M V
Laaggeschoold -9 -7 -2,9 0,5 -3,9 8,4 -0,9 17,4 5,9 23,2 5 18,5 7,9 9,3
Middengeschoold 2,3 3 0,5 9,6 2,5 12,2 0,5 14,5 4,3 17,5 4,5 23,9 3,7 14,3
Hooggeschoold -1,6 1,9 -1,6 3,2 -1 5 0,5 6,3 0,2 4,2 -0,1 14,5 8,5 12,7
Wallonië 25-29 jaar 30-34 jaar 35-39 jaar 40-44 jaar 45-49 jaar 50-54 jaar 55-64 jaar
M V M V M V M V M V M V M V
Laaggeschoold -9,9 3,9 -10 -1,9 -5,5 6,9 -0,3 5,4 0,4 9,7 1,3 11,2 3,6 6,3
Middengeschoold 7,2 5,9 -2,2 2,6 -0,3 3,4 -3,6 4,8 -1,4 5,5 3,7 14,8 5,5 14,4
Hooggeschoold -1 2 -0,7 4,1 -2,9 4,3 3,4 1,7 -1,3 7,7 2,3 1,5 11,6 13,9
Change in employment rate 1998 - 2008 (ppt)
Bron: Eurostat en Steunpunt WSE
Legende:
x ≥ 10% 3% ≤ x < 5% -3% ≤ x < 0% -10% ≤ x < -5%
5% ≤ x < 10% 0% ≤ x < 3% -5% ≤ x < -3% x < -10%
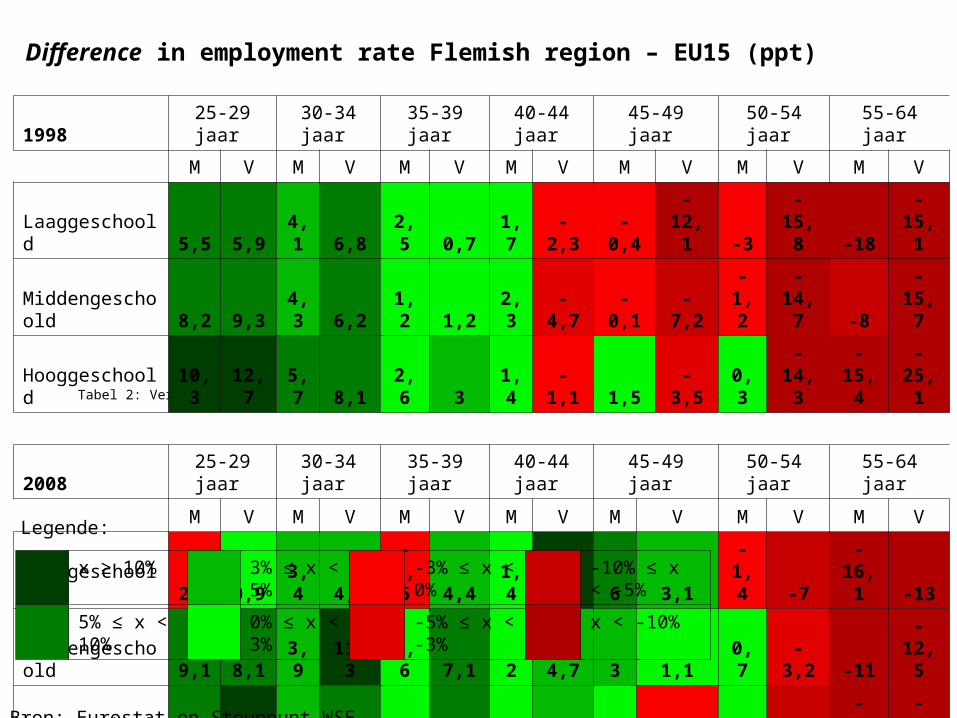
Tabel 2: Verschil tussen werkzaamheidsgraad in Vlaanderen en EU 15 (%) (bron: Eurostat en Steunpunt WSE)
1998 25-29 jaar 30-34 jaar 35-39 jaar 40-44 jaar 45-49 jaar 50-54 jaar 55-64 jaar
M V M V M V M V M V M V M V
Laaggeschoold 5,5 5,9 4,1 6,8 2,5 0,7 1,7 -2,3 -0,4 -12,1 -3 -15,8 -18 -15,1
Middengeschoold 8,2 9,3 4,3 6,2 1,2 1,2 2,3 -4,7 -0,1 -7,2 -1,2 -14,7 -8 -15,7
Hooggeschoold 10,3 12,7 5,7 8,1 2,6 3 1,4 -1,1 1,5 -3,5 0,3 -14,3 -15,4 -25,1
2008 25-29 jaar 30-34 jaar 35-39 jaar 40-44 jaar 45-49 jaar 50-54 jaar 55-64 jaar
M V M V M V M V M V M V M V
Laaggeschoold -2,1 0,9 3,4 4,4 -0,6 4,4 1,4 10,9 6 3,1 -1,4 -7 -16,1 -13
Middengeschoold 9,1 8,1 3,9 11,3 2,6 7,1 2 4,7 3 1,1 0,7 -3,2 -11 -12,5
Hooggeschoold 5,4 11,2 3 7,5 1,3 5,3 2,1 4,3 1,6 -1,3 0,1 -5,8 -10,7 -20,8
Difference in employment rate Flemish region – EU15 (ppt)
Bron: Eurostat en Steunpunt WSE
Legende:
x ≥ 10% 3% ≤ x < 5% -3% ≤ x < 0% -10% ≤ x < -5%
5% ≤ x < 10% 0% ≤ x < 3% -5% ≤ x < -3% x < -10%

1998 25-29 jaar 30-34 jaar 35-39 jaar 40-44 jaar 45-49 jaar 50-54 jaar 55-64 jaar
M V M V M V M V M V M V M V
Laaggeschoold -8 -22,5 -4,1 -10,6 -6,1 -15,4 -11,3 -15,3 -10,8 -14,9 -9,8 -18,9 -18,8 -12,5
Middengeschoold -3,9 -8,5 -0,9 -5,2 -2,7 -4,7 -1,1 -3,9 -0,7 -5 -6,5 -14,6 -12,1 -14,2
Hooggeschoold 8,1 2,1 0 2 1,9 0,5 -2,3 -0,6 -0,7 -6,7 -2 -0,6 -15,7 -23,7
2008 25-29 jaar 30-34 jaar 35-39 jaar 40-44 jaar 45-49 jaar 50-54 jaar 55-64 jaar
M V M V M V M V M V M V M V
Laaggeschoold -16,5 -16,6 -11,9 -15,4 -10,8 -13,2 -11 -14,1 -9,9 -13,2 -11,9 -17,4 -21,2 -13,4
Middengeschoold 1,9 -6,8 -4,0 -7,1 -4,1 -7,6 -5,5 -4,2 -3,3 -8,7 -5,4 -12,2 -13,3 -10,9
Hooggeschoold 3,8 0,7 -1,8 2,3 -1,3 2,1 1,3 0,2 -2,1 -1 0,2 -5,1 -7,9 -18,2
Difference in employment rate Walloon region - EU15 (ppt)
Bron: Eurostat en Steunpunt WSE
Legende:
x ≥ 10% 3% ≤ x < 5% -3% ≤ x < 0% -10% ≤ x < -5%
5% ≤ x < 10% 0% ≤ x < 3% -5% ≤ x < -3% x < -10%

Structure of the presentation
1. Two strategic choices that shape our current situation
- An explicit choice: a budgetary strategy to cope with ageing- An implicit choice: emphasis on minimum income protection
2. Did we (strategically) pursue “the new welfare state”?
3. Outcomes: which litmus test for success?
- An egalitarian and inclusive perspective- Labour market outcomes- Distributive outcomes
4. Strategic choices to be made

How to account for rising inequality?
Stylized on the basis of Cantillon, Brandolini & Smeeding (US, UK, Can, Swe, Fin)
Structure of the presentation
1. Two strategic choices that shape our current situation
- An explicit choice: a budgetary strategy to cope with ageing- An implicit choice: emphasis on minimum income protection
2. Did we (strategically) pursue “the new welfare state”?
3. Outcomes: which litmus test for success?
- An egalitarian and inclusive perspective- Labour market outcomes- Distributive outcomes
4. Strategic choices to be made

Strategic choices to be made
1. Maintain (responsibility-sensitive) egalitarian objectives
- Do not sacrifice minimum income protection for replacement rate objectives- “Matthew-test”- Legitimating based on Homo reciprocans and a “fairness code”
2. Balance income protection, investment in human capital & care3. Cash => service-orientation4. Public & private5. Keep focus on (inclusive) employment-objective6. Activation7. (Budgetary & personal) saving vs. working longer
8. Institutional change
- Burden sharing- Responsibility- Focus on core tasks