Embed Size (px)
Citation preview

Presented at the first ESRB Annual Conference, 22-23 September 2016
Disclaimer: views herein are those of the authors, and do not implicate their affiliated institutions
Acknowledgement: thanks to Martin Neychev for excellent research assistance
Sam Langfield European Systemic Risk
Board
Stop or go? The reform agenda in OTC derivatives markets
Peter Hoffmann European Central Bank
DG-Research
Harald Hau
University of Geneva Swiss Finance Institute

How critics understood derivatives in 2009
2 © Harald Hau
“OTC derivatives contributed significantly to the crisis” US Financial Crisis Inquiry Commission

G20 commitment
3 © Harald Hau
Trade reporting to authorities Central clearing for standard trades Trading on exchanges or platforms

Where do we stand in Europe in 2016?
© Harald Hau
Interest Rates Credit FX
Notional €250tn €8tn €40tn
Reporting
Central clearing
Exchange trading
Focus of Analysis

Issues with the implementation shortfall
Direct costs of inefficient OTC market structure Who pays and how much? Do high transaction costs inhibit efficient risk management?
Inefficient risk allocation?
Is counterparty risk borne by highly leveraged institutions which are least apt to assume this risk (Glass-Steagall Act logic)?
Is “Too Big to Fail” re-enforced?
5 © Harald Hau
Good news: new reporting allows us to evaluate the costs of partial reform…

Transactions-level data
6 © Harald Hau
EMIR requires all EU-resident entities to report derivatives transactions to trade repositories
“Big data”: approximately 20 billion observations per year on 100 variables
Work started at the ESRB in 2015: Extract clean data on transactions from raw data Summarized in new ESRB Occasional Paper no.11
Subsample of FX derivatives:
EUR/USD forwards executed between 15 Jan and 15 Feb 2016 Focus on FXD trades between 170 banks and 3,000 firms (“clients”)

FX derivative trading in OTC markets
7 © Harald Hau
Core-periphery network structure in which firms transact with few banks
Search costs imply that “shopping” is costly and unsophisticated firms may face high transaction costs
Banks earn
information rents from the OTC structure
Main findings
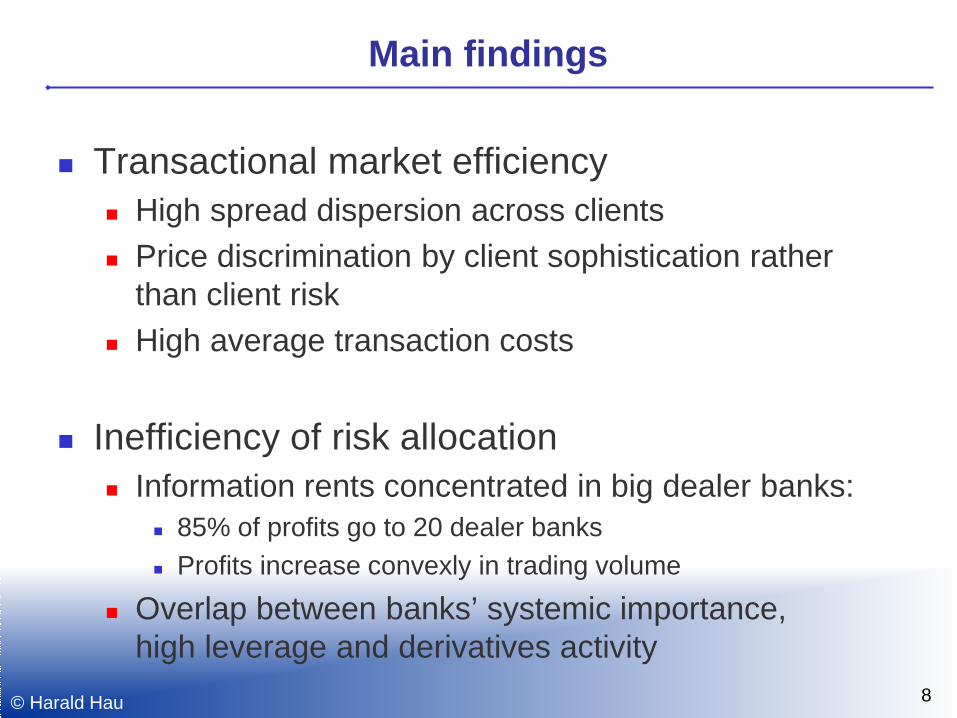
Transactional market efficiency High spread dispersion across clients Price discrimination by client sophistication rather
than client risk High average transaction costs
Inefficiency of risk allocation Information rents concentrated in big dealer banks:
85% of profits go to 20 dealer banks Profits increase convexly in trading volume
Overlap between banks’ systemic importance, high leverage and derivatives activity
© Harald Hau 8
Spread and cost calculation
9 © Harald Hau
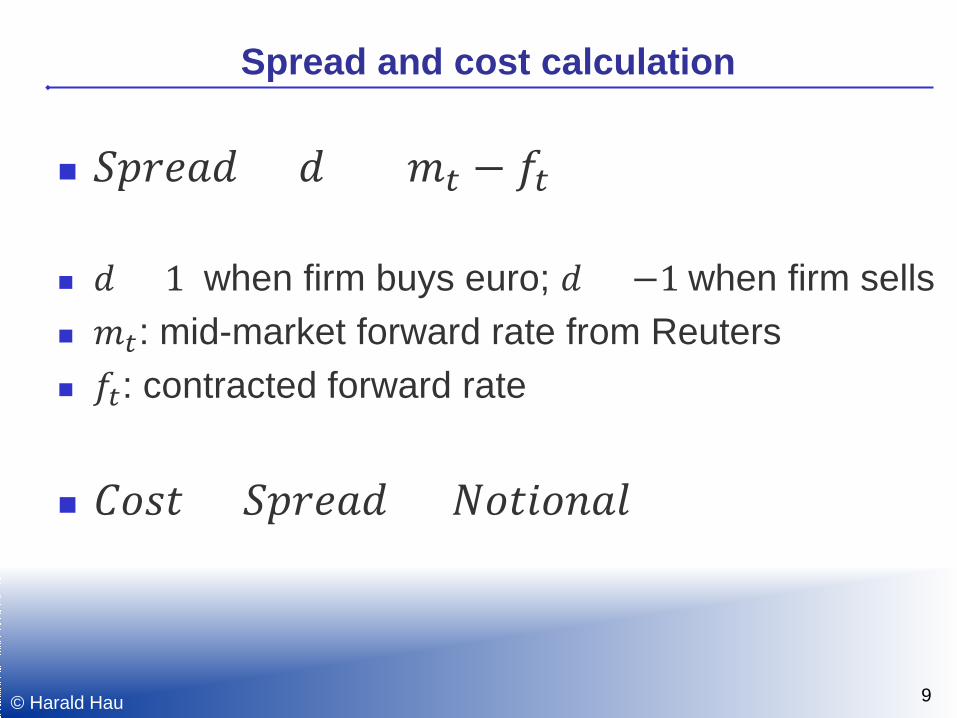
𝑆𝑆𝑆𝑆𝑆𝑆 = 𝑆 × (𝑚𝑡 − 𝑓𝑡)
𝑆 = 1 when firm buys euro; 𝑆 = −1 when firm sells 𝑚𝑡: mid-market forward rate from Reuters 𝑓𝑡: contracted forward rate
𝐶𝐶𝐶𝐶 = 𝑆𝑆𝑆𝑆𝑆𝑆 × 𝑁𝐶𝐶𝑁𝐶𝑁𝑆𝑁
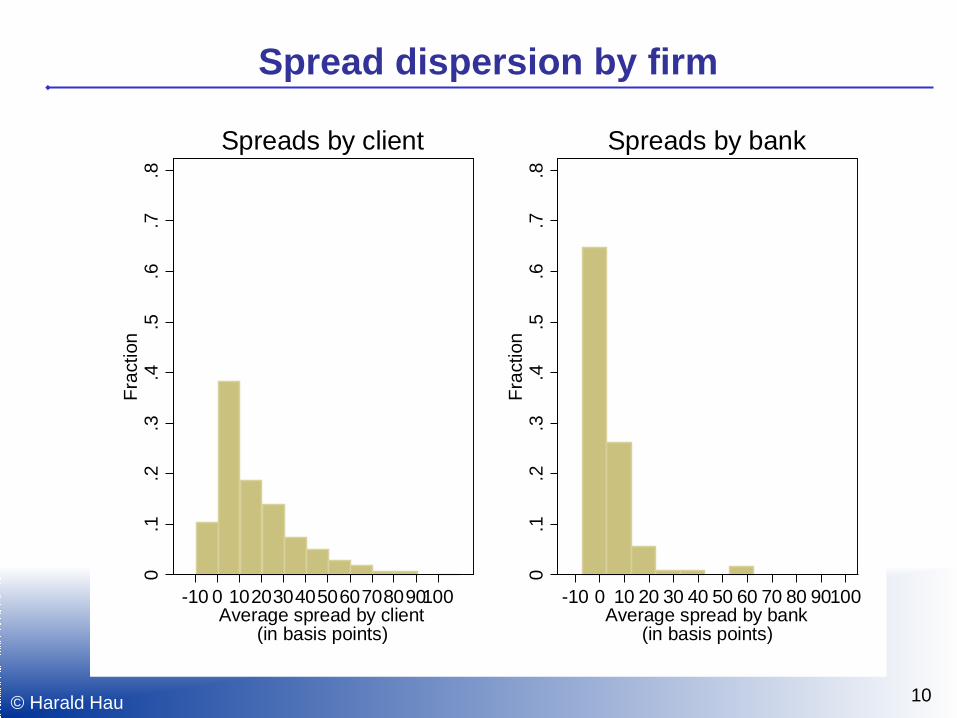
Spread dispersion by firm
10 © Harald Hau
0.1
.2.3
.4.5
.6.7
.8Fr
actio
n
-10 0 102030405060708090100Average spread by client
(in basis points)
Spreads by client
0.1
.2.3
.4.5
.6.7
.8Fr
actio
n
-10 0 10 20 30 40 50 60 70 80 90100Average spread by bank
(in basis points)
Spreads by bank

Price discrimination by client sophistication
11 © Harald Hau
Inexperienced clients pay higher spreads, but not risky clients
050
100
Ave
rage
spr
ead
of c
lient
(in b
asis
poi
nts)
0 Experienced
10 20 30 Inexperienced
40
Predicted effect of sophistication(in basis points)
Client Inexperience
050
100
-4 Low risk
-2 0 High risk
2
Expected default frequency(in logs)
Client Risk
Estimated values Fitted polynomial

-2.0
0-1
.50
-1.0
0-0
.50
0.00
Est
imat
ed c
oeffi
cien
t of c
lient
siz
e
.1 .2 .3 .4 .5 .6 .7 .8 .9Quantile
Size
0.00
5.00
10.0
015
.00
20.0
0E
stim
ated
coe
ffici
ent o
f HH
inde
x
.1 .2 .3 .4 .5 .6 .7 .8 .9Quantile
Concentration
Quantile regressions
12 © Harald Hau
Spread rises with client inexperience (measured by size or concentration in dealers)

OTC market structure and price discrimination
13 © Harald Hau Source: Deutsche Börse (2008)
Exchange-based structures reduce spreads Enhanced pre-trade
price transparency removes banks’ information rents
Also see Li and Schürhoff (2015)
Premium paid by inexperienced clients is inherent in OTC market structure Banks extract
information rents

0.1
.2.3
.4Fr
actio
n
0 5 10 15Total costs by client (in logs)
Costs by client
0.1
.2.3
.4Fr
actio
n
0 5 10 15Total revenues by bank (in logs)
Revenues by bank
Cost dispersion by client
14 © Harald Hau
Total costs paid by clients: approximately €3.2bn per year in FXD Costs inhibit firms’ risk
management Inefficient risk transfer may
have real effects, particularly for export-oriented firms

0.1
.2.3
.4Fr
actio
n
0 5 10 15Total revenues by bank (in logs)
Revenues by bank
Revenue dispersion by bank
15 © Harald Hau
OTC market structure concentrates information rents in a few banks
This entrenches TBTF

05
1015
20B
ank
reve
nues
from
dis
crim
inat
ory
pric
ing
(in lo
gs)
10 15 20 25Notional outstanding (in logs)
Linear fit Nonlinear fit
Revenue concentration in few dealer banks
16 © Harald Hau
Revenues increase convexly in market share of notional

SIFI status, leverage, and derivatives activity
17 © Harald Hau
SIFI Book leverage ratio
Barclays 4.5% BNP Paribas 4.0%
BPCE 4.5% Crédit Agricole 5.3% Deutsche Bank 3.5%
HSBC 5.0% ING Bank 3.9% Nordea 4.5%
RBS 5.6% Santander 4.7%
Société Générale 3.8% Standard Chartered 5.5%
Unicredit Group 4.4%
The 13 G-SIFI banks in EU account for 75% of total €3.2bn yearly revenues from discriminatory pricing in FXD Key questions: • How much risk
compression? • How much risk flows to
low leverage institutions?
• How can we get other intermediaries into the market?

Conclusions
18 © Harald Hau
OTC market structure in FXD is costly for the export sector and particularly for
unsophisticated firms entrenches TBTF by preventing non-banks from
entering as intermediaries concentrates derivative risk in the least desirable
place within the economy (G-SIFI) Regulatory credibility is at stake in staying at Stop

…as this cartoon suggests…
19 © Harald Hau

APPENDIX
20 © Harald Hau
Description of EU Derivatives Market Reform The traffic-light matrix shown on slide 4 is intended to be an indicative summary of the state of play in OTC derivatives market reform in the EU. The European Markets Infrastructure Regulation (EMIR) provides for a comprehensive reporting requirement for any EU-located legal person engaging in a derivative transaction to report the specified details of that transaction to an ESMA-authorized trade repository. The state of play with respect to the EU’s legal implementation of the G20 commitment with respect to trade reporting is therefore unambiguously “green”. With respect to central clearing, the situation is more nuanced. The EU Commission has adopted regulations that provide for a phasing-in of central clearing obligations for plain-vanilla interest rate derivatives (see http://ec.europa.eu/finance/financial-markets/derivatives/index_en.htm). The first phase of this central clearing obligation began in 21 June 2016, and applied to institutions that were already CCP members at the end of 2015 (mostly large banks); the second phase begins in 21 December 2016, when the obligation will be rolled out to other financial institutions meeting certain criteria related to trading volume. Eventually, the central clearing obligation will apply to all firms trading plain-vanilla interest rate derivatives. The Commission has also adopted a regulation that provides for a central clearing obligation with respect to index CDS products referenced on iTraxx; this obligation will be phased in from February 2017. No central clearing obligation is currently envisaged for single-name CDS products or any foreign exchange derivatives. This justifies the “green”, “amber” and “red” labels for interest rate, credit and foreign exchange derivatives respectively.

21 © Harald Hau
Description of EU Derivatives Market Reform (continued) With respect to the G20 commitment to require “all standardized OTC derivative contracts” to be “traded on exchanges or electronic trading platforms”, the EU has made relatively little progress to date, in large part owing to delays until 2018 in the application of legislation pertaining to markets in financial instruments (MiFID II and MiFIR). A final report on technical standards drafted by ESMA (https://www.esma.europa.eu/sites/default/files/library/2015/11/2015-esma-1464_-_final_report_-_draft_rts_and_its_on_mifid_ii_and_mifir.pdf), and endorsed by the Commission in April 2016 subject to certain amendments, sets out asset class specific thresholds for determining whether certain types of interest rate and credit derivatives may be exempt from pre-trade disclosure requirements. In the report, ESMA also “proposes to deem the whole class of foreign exchange derivatives as illiquid”, thereby exempting FXDs from various pre-trade disclosure requirements under MiFID/MIFIR. For brevity, the traffic-light matrix does not contain information on other aspects of the G20 commitments (including margin and capital requirements for OTC derivatives that are not centrally cleared). The notional values of EUR250tn, EUR8tn and EUR40tn for interest rate, credit and FX derivatives (respectively) are calculated based on the outstanding trades reported to DTCC as of 02/11/15. They therefore proxy the size of the EU-resident derivatives market, and contrast with global data for BIS, which point to market sizes of approximately EUR350tn, EUR11tn and EUR65tn for interest rate, credit and FX derivatives (respectively), as reported in Abad et al (2016).

22 © Harald Hau
Description of Transactions-Level EMIR Dataset The transactions-level EMIR dataset is described in Abad et al (2016). According to EMIR, all EU-located legal persons (counterparties) entering into a derivative contract must report the details of that contract to a trade repository (TR) authorised by ESMA. There are six authorized TRs: CME, DTCC, ICE, KDPW, Regis-TR and UnaVista. DTCC has the largest market share in FX derivatives, at 66%. Owing to EMIR’s double-sided reporting obligation, DTCC’s coverage of unique trades is even larger than this 66% suggests; as such, we deem it adequate to draw data only from DTCC for the purposes of this analysis.
23 © Harald Hau
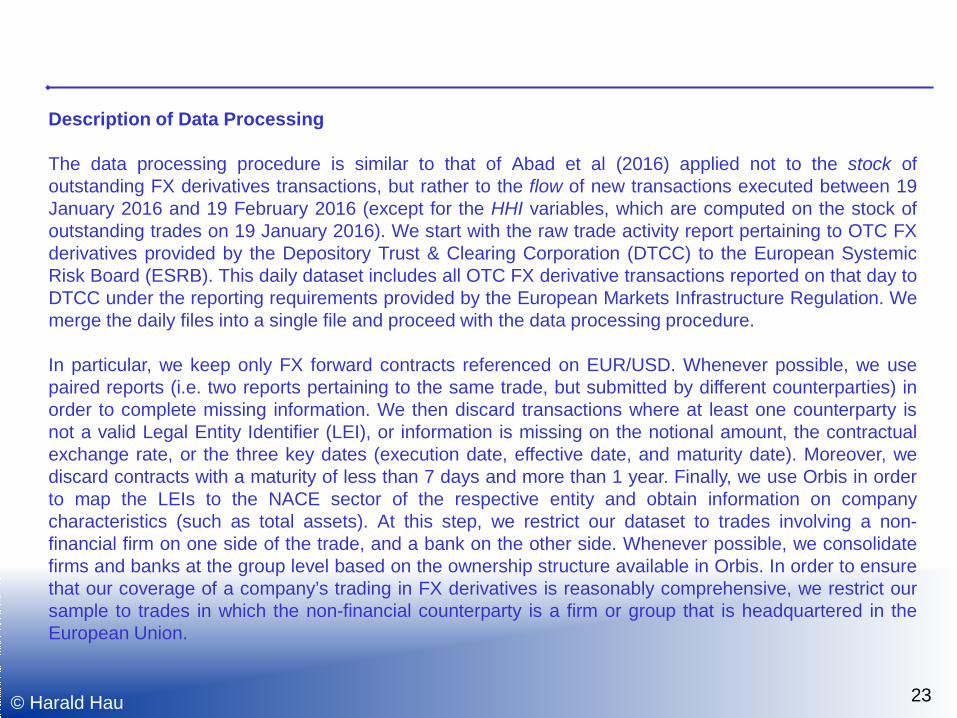
Description of Data Processing The data processing procedure is similar to that of Abad et al (2016) applied not to the stock of outstanding FX derivatives transactions, but rather to the flow of new transactions executed between 19 January 2016 and 19 February 2016 (except for the HHI variables, which are computed on the stock of outstanding trades on 19 January 2016). We start with the raw trade activity report pertaining to OTC FX derivatives provided by the Depository Trust & Clearing Corporation (DTCC) to the European Systemic Risk Board (ESRB). This daily dataset includes all OTC FX derivative transactions reported on that day to DTCC under the reporting requirements provided by the European Markets Infrastructure Regulation. We merge the daily files into a single file and proceed with the data processing procedure. In particular, we keep only FX forward contracts referenced on EUR/USD. Whenever possible, we use paired reports (i.e. two reports pertaining to the same trade, but submitted by different counterparties) in order to complete missing information. We then discard transactions where at least one counterparty is not a valid Legal Entity Identifier (LEI), or information is missing on the notional amount, the contractual exchange rate, or the three key dates (execution date, effective date, and maturity date). Moreover, we discard contracts with a maturity of less than 7 days and more than 1 year. Finally, we use Orbis in order to map the LEIs to the NACE sector of the respective entity and obtain information on company characteristics (such as total assets). At this step, we restrict our dataset to trades involving a non-financial firm on one side of the trade, and a bank on the other side. Whenever possible, we consolidate firms and banks at the group level based on the ownership structure available in Orbis. In order to ensure that our coverage of a company’s trading in FX derivatives is reasonably comprehensive, we restrict our sample to trades in which the non-financial counterparty is a firm or group that is headquartered in the European Union.

24 © Harald Hau
Summary of EUR/USD FX Derivatives Market The total daily trading volume in the bank-to-customer segment of the EUR/USD FX forward market averages EUR8.1bn, with 1,353 individual transactions on average. More than half of all transactions (762 on average) pertain to contracts with an original maturity of between 30 and 180 days. Most contracts have an underlying notional of less than EUR1m, consistent with a significant number of relatively small non-financial firms. Only about 15% of all contracts (115) have a notional in excess of EUR10m. Naturally, the number of firms active on the average trading day (553) vastly exceeds the number of active banks (64).
Information on the cross-section of banks: Average trading frequency is around 8 times per day, with an average notional of EUR47m, and an average of 4 counterparties. As one would expect, concentration among dealers is very high; the largest dealers account for the bulk of dealer-client activity. While the median dealer is active on only around 21% of all trading days, the 95th percentile corresponds to a dealer that is active on every trading day. There is also a high correlation between market activity and balance sheet size. While the median dealer has a balance sheet of around EUR9bn, the mean size stands at EUR263bn.

25 © Harald Hau
Summary of EUR/USD FX Derivatives Market (continued) Information on the cross-section of client (i.e. non-financial firms): On average, non-financial corporations (NFCs) trade a daily notional of EUR2m. This is split across 0.35 trades involving 0.18 counterparties, meaning that, on average, most non-financial corporations trade only infrequently: just 14% of trading days involve market activity for the average NFC. As with the dealers, these cross-sectional distributions are heavily skewed to the right, with relatively few firms accounting for a large fraction of the overall trading activity and interacting with more than one dealer on a given day. The same counts for the frequency with which firms are active in the market. While the median firm is only active on 8% of all trading days, the 95th percentile firm is active on roughly every second trading day. The median firm size is around EUR200m, and the average corresponds to EUR2.17m. The three largest countries account for close to two thirds of all firms in our sample, with German firms alone representing 35% of all firms. We also find that the firms active in the FX forward market are predominantly engaged in wholesale and retail trade (50.4%) or manufacturing (27.9%), which is in line with the bulk of the trading activity being related to the need for managing the risk of future costs and revenues denominated in foreign currency. This can also explains the preponderance of German and Dutch firms, since these two economies have large export sectors.

Table 1: Description of Variables
26
Variable Description
Spread 𝑆 × (𝑚𝑡 − 𝑓𝑡), where 𝑆 = 1 when firm buys euro; 𝑆 = −1 when firm sells; 𝑚𝑡 is the mid-market forward rate from Reuters; and 𝑓𝑡 is the contracted forward rate. The spread is then multiplied by 10,000 such that it is expressed in basis points.
Client size Total assets (in logs) of the global ultimate owner of the client (i.e. non-financial firm).
Client HHI The generalized Herfindahl-Hirschman Index (HHI) of clients (i.e. non-financial firms) with respect to the concentration of their trades with dealers. The variable is calculated on the stock of all outstanding OTC FX derivatives transactions (including non-EUR/USD) on 15/01/16. We set Client HHI=1 for clients that have no outstanding FX derivative transactions on 15/01/16.
Bank size Total assets (in logs) of the global ultimate owner of the bank.
Bank HHI The generalized Herfindahl-Hirschman Index (HHI) of banks with respect to the concentration of their trades with clients. The variable is calculated on the stock of all outstanding OTC FX derivatives transactions (including non-EUR/USD) on 15/01/16.
Client EDF The 1-year expected default frequency (in %) of the global ultimate owner of the client (i.e. non-financial firm), sourced from Moody’s Analytics (CreditEdge). When the observation is missing, we set Client EDF=0, and define an EDF missing dummy to capture the fixed effect of these cases.
EDF missing dummy
A dummy that is equal to 1 when the Client EDF variable is missing (before it is set to 0), and 0 otherwise.
Notional log Total notional (in logs) of each transaction.
Tenor log Tenor (in logs) of each transaction (measured in days).
Realized volatility
The realized volatility of the spot exchange rate, measured as the sum of the 1-minute log changes in the preceding 30 minutes, annualized.

Table 2: Summary Statistics
27 © Harald Hau
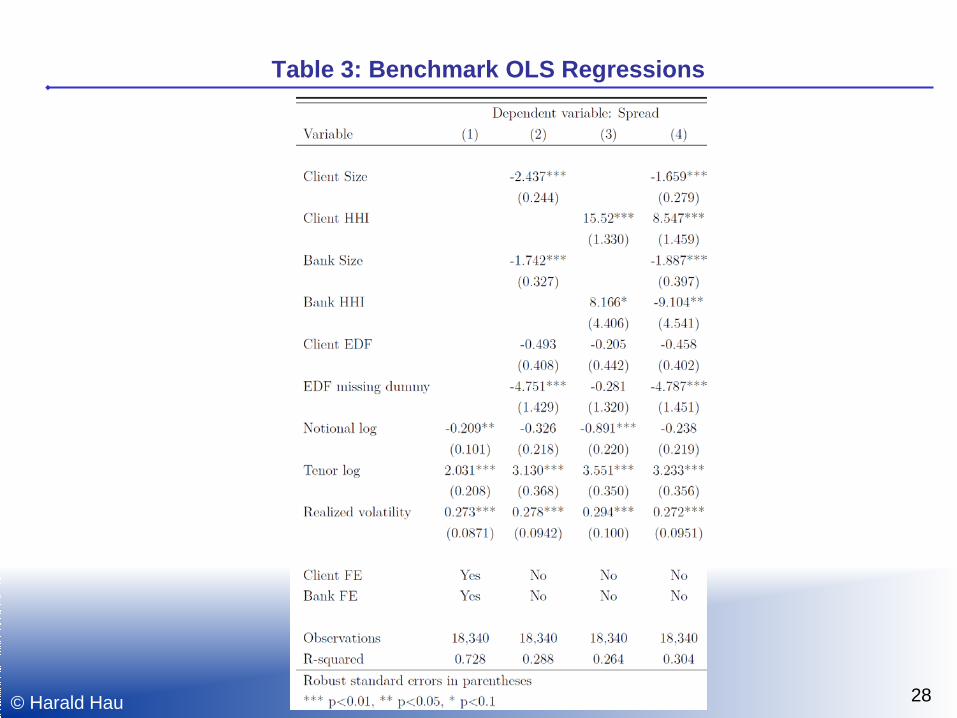
Table 3: Benchmark OLS Regressions
28 © Harald Hau

Table 4: Quantile Regressions
29

References
30 © Harald Hau
Abad, Jorge, Inaki Aldasoro, Christoph Aymanns, Marco D’Errico, Linda Fache Rousova, Peter Hoffmann, Sam Langfield, Martin Neychev and Tarik Roukny (2016). “Shedding light on dark markets: First insights from the new EU-wide OTC derivatives dataset.” ESRB Occasional Paper no.11.
Deutsche Börse (2008). “The global derivatives market: An introduction.” FSB (2016). “OTC derivatives market reforms: Eleventh progress report on implementation.” Li, Dan and Normal Schürhoff (2015). “Dealer networks.” Mimeo.