Embed Size (px)
Citation preview
StimulatingSchool Improvement!!
Or…
Harvey PerkinsJohn Hodge
The Urban Learning and Leadership CenterMarch, 2009

Don’t Confuse Your School Improvement Plan
withSchool Improvement!!

School improvement corollary:
“If we develop a beautiful school improvement plan that meets the state guidelines, but does not produce meaningful school change, did we have
school improvement?”

Truth or Dare?
OR
Is it an annual chore that allows you to put another
check in the box of the bureaucracy and move on
with business as usual?
Is your school improvement plan a vehicle for faculty dialogue around best practices and the means of cultural and instructional
renewal in your school?

• Macro• Mission, Vision,
Values Driven• Primary• Stable• Internal Locus of
Control
• Micro• Goals & Data Driven/
School Improvement Plan• Secondary• Dynamic• External Locus of Control
(in a high stakes testing environment)
Two Faces of School Leadership in a Professional Learning Community
Cultural Development Program Management

Well, what are schools supposed to be?
• Places for teaching and learning?
• Places for transmission of culture, societal values, individual values?
• Places for development of responsible citizens?
Most of these concepts are found in the mission statements of the majority of
American schools.
ALL of the Above!!
™ ™ ULLCULLC

Many school improvement efforts
today are fragmented, addressing only part of
their stated mission.This problem
has become more acute
in this era of high stakes testing!

How members of the school community
behave
What members of the school community
believe
How members
of the school
community engage in
teaching and learning
The S.A.M.E. Pathway

™ULLC
The S.A.M.E. Pathway

Activity:Consider all three environments
from the SAME model. List 1 or 2 ideas which, if implemented in
your schools, would significantly impact teaching and learning.(Share out when prompted)
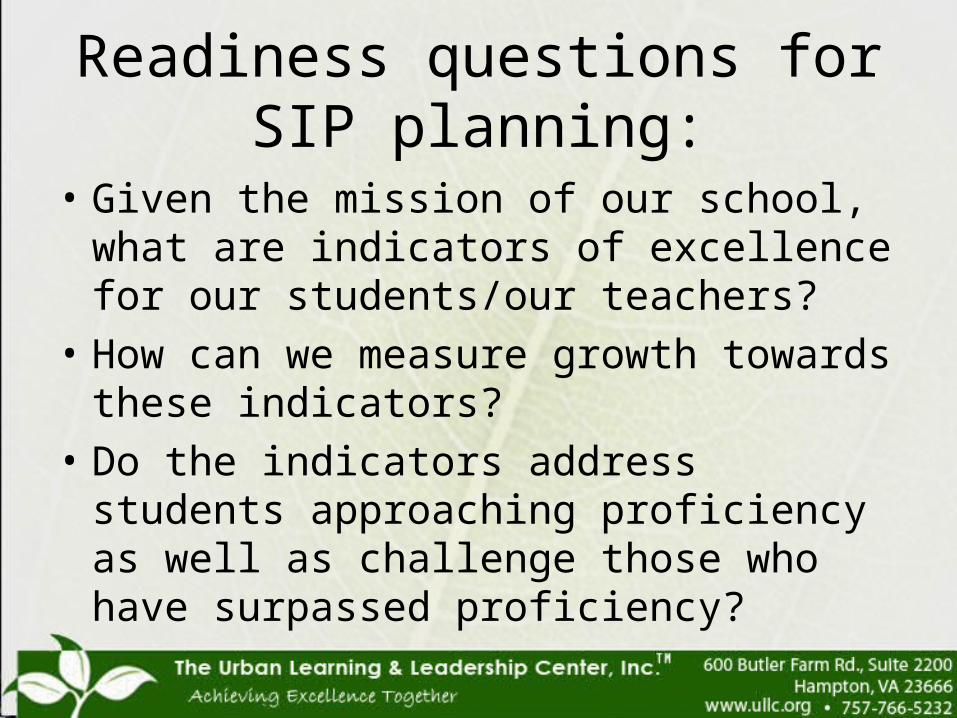
Readiness questions for SIP planning:
• Given the mission of our school, what are indicators of excellence for our students/our teachers?
• How can we measure growth towards these indicators?
• Do the indicators address students approaching proficiency as well as challenge those who have surpassed proficiency?

Team time
• With members of your SIT, discuss what indicators of excellence reflect the outcomes you desire for your students and staff, e.g. what indicators measure lifelong learners, responsible citizens, high academic achievement for all, continued professional growth, collaborative lesson design, etc.

So…Let’s get started!
How do you feel about this process definition for your SIP?
Our SIP clearly articulates the goals, objectives, and strategies to make
this school a more productive place for teaching and learning next year,
and it presents a clear implementation and monitoring
strategy.

Let’s reflect on our current School Improvement Process!(See “Taking our SIP Pulse!”)

Activity:Score the process and
product of your current SIP. Share with your table group any items below “3” on your
score. Look for common areas of concern at your table.

Let’s now explore a vehicle to transform an over-burdened bureaucratic document into a viable action plan for school
growth:
ULLC Six Steps to SIP Planning

Non-Negotiables for a Quality SIP
• Student achievement focus-beyond process measures to product measures
• Meticulous data analysis
• Input from all stakeholders
• Targeted focus—less is more!!
• Tenacious monitoring for consistent delivery
• Communication and celebration!

ULLC Design for SIP Development:Six Critical Steps
• Data Capture and Reporting
• Data Analysis
• Goal/Objective Setting
• Strategy/Action Plan Development
• Monitoring and Adjusting
• Communicating the Plan

Step I. Data Capture and Reporting
• Historical data yields new direction!
• Some folks LOVE data-use them!
• Data Capture is a technical skill; Data Reporting is leadership skill!
• Display of data should tell YOUR story and challenge your staff!– The state template is for organizing your data;
it may not be the best way to tell your story.

1. The state has provided many valuable test results reports for i-LEAP, LEAP, OR GEE, such as:1. School roster report2. School performance report3. School Achievement level report4. School economic status subgroup report5. School subgroup/Education classification report6. School special education exceptionality report
Data Capture:Much Has Been Done!
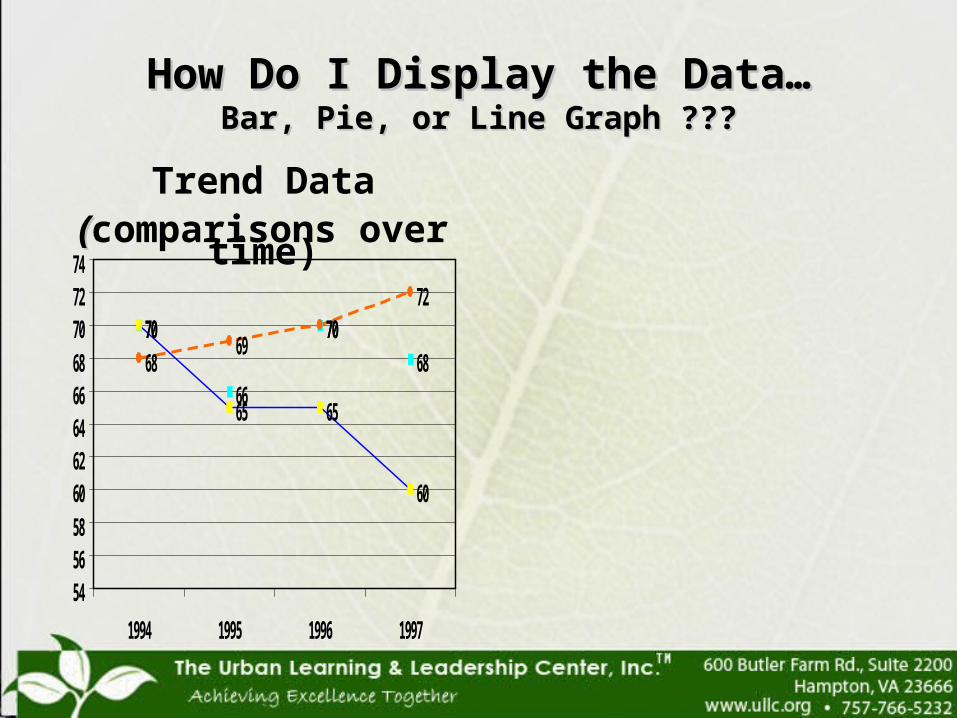
How Do I Display the Data…How Do I Display the Data…Bar, Pie, or Line Graph ???Bar, Pie, or Line Graph ???
70
66
7068
70
65 65
60
6869
7072
5456586062646668707274
1994 1995 1996 1997
Trend Data((comparisons over time)
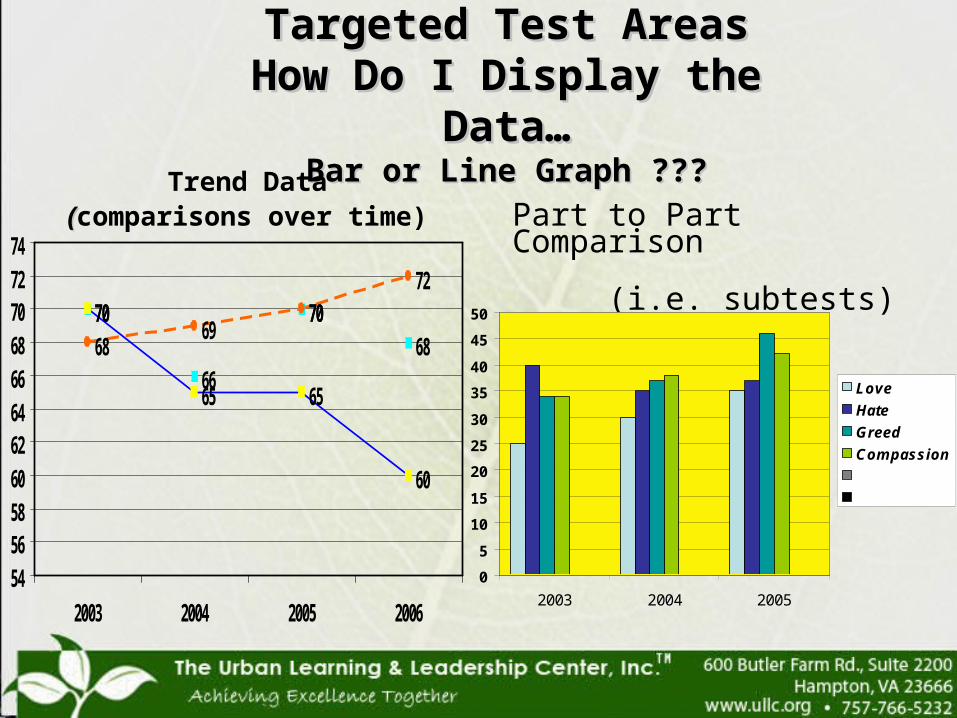
Targeted Test Areas Targeted Test Areas How Do I Display the Data…How Do I Display the Data…
Bar or Line Graph ???Bar or Line Graph ???
70
66
7068
70
65 65
60
6869
7072
5456586062646668707274
2003 2004 2005 2006
Part to Part Comparison
(i.e. subtests)
0
5
10
15
20
25
30
35
40
45
50
2003 2004 2005
Love
Hate
Greed
Compassion
Trend Data((comparisons over time)

View All Details View All Trends
2005 AYP Reading: Grades 6, 7 and 8
Percent Proficient
Number Proficient
Total Students
All Students Details Trends
64.8 628 969
American I ndian/ Alaskan Native Details Trends
66.7 4 6
Asian/ Pacific I slander Details Trends
84.4 27 32
African American Details Trends
51.3 118 230
White (not of Hispanic origin) Details Trends
69.3 466 672
Hispanic Details Trends
44.8 13 29
Free/ Reduced Meals Details Trends
47.3 129 73
Special Education Details Trends
32.4 57 176
Limited English Proficient Details Trends
22.7 5 22


Team Time
1.Discuss how you can use your data displays to tell your story.
2. Where are your “data gurus” with graphics capabilities?
3. When and where do you need to “tell your story”?
II. Data Analysis
• Purpose is two-fold– celebration
• How can you use your data analysis results for celebration?• When should this occur?• How can celebration be motivational for next year’s SIP?
– purpose/performance dissonance• Should your SIT consider the deliverables in your mission
statement as it develops your SIP goals?• Is your mission statement “alive”?• How does data analysis and mission, when taken together,
provide a vehicle for change?

Data Analysis• Total team involvement
– At some point in the process, all staff members need to “get their hands” into the data!
– How does getting a report from the SIT differ from sifting through the data yourself?
• Types of analysis (different lens!)– Trend analysis– Program/strategy analysis– Content analysis– Instructional asset analysis– Student performance analysis

Don’t forget to use qualitative data as well as quantitative
data to triangulate your analysis!

III. Goal and Objective Setting
• Must reflect the state goals• Goal statement needs assessment
objective strategy activity – direct line of sight!!
• Create no more objectives than you can and will tenaciously monitor!

Direct Line of Sight!• Goal: By 2013-2014, all students will reach high standards, attaining
proficiency or better, in mathematics.• Needs Assessment: • By the end of the 2008-2009 school year, 48% of ____________Middle
School eighth grade students had attained proficiency or better in mathematics on LEAP.
• 54% of white students attained this goal while 38% were African-American.• Objectives: By the end of the 2009-2010 school year, LEAP mathematics
proficiency in grade 8 will increase from 48% to 70%. • By the end of the 2009-2010 school year, LEAP mathematics proficiency
for African-American students in grade 8 will increase from 38% to 60%.

Team time
• With members of your SIT..– Review each goal area to ensure a direct line
of sight from data analysis to objective to action strategy
– Ensure that goals and objectives are consistent with local, state, and national benchmarks.

IV. Strategy/Action Plan Development
• Where would you be if your physician diagnosed your illness accurately, but gave you an ineffective or inappropriate prescription?
• Your team must expand its knowledge base before prescribing the solution set!

Strategy/Action Plan Development
• “Benchmark” successful teachers
• Find model schools or programs
• Contact your curriculum coordinator (if applicable)
• Research your target area (regional offices are a good source)
• Contact university personnel
• Web Research (www.esrlink.com)

Strategy/Action Plan Development• How many strategies are enough?
– Select 1-3 action steps per objective– Select no more than you can TENACIOUSLY
MONITOR!
• “Institutionalized” practices vs. new SIP– Take the I-S-E challenge!– The “preamble” solution!

V. Monitoring and Adjusting
• “What gets measured gets done!”
• Monitor the process (are we consistently implementing our strategies?) as well as the product (what interim data do we need to collect to determine the effectiveness of the strategy?)
• If the horse you are riding dies, get off!

Monitoring and Adjusting• Timeline
– Not Sept-June!!– This should reflect the report dates for the action step!
• Indicator of Implementation– What is the OBSERVABLE change you desire?
• Evaluation Procedures– What evidence will you accept that the action step is
really being done?– Think creatively; use existing sources; don’t create a
reporting nightmare!

VI. Communicating the Plan
• Internal and external communication• Use regular communication tools
(daily/weekly bulletins, newsletters, etc.) to keep the plan alive!
• Structure existing meetings (grade level, team and department) around the plan strategies
• Promote your “improvement” culture with parents and business partners!

Can Your Action Planpass the
“Elevator Speech” test?

Student Student AchievemeAchievementnt
TeacherTeacherss AdministratoAdministrato
rsrs
ParentsParents StudentStudentss
SIP as a bureaucratic chore!

Student Student AchievemeAchievementnt
AdministratoAdministratorsrs
StudentStudentss
TeacherTeacherss
ParentsParents
SIP as a tool for cultural change!

“After the Final Rose”…Site Visits
• School improvement in schools engaged in re-structuring is a collaborative effort between district and school based leadership. The purpose of site visits is to allow district personnel to engage in dialogue with the SIT and the school administration to achieve a deeper understanding of building issues and the team’s rationale for the action plans in use. use.

District Advantages– To gain a firsthand knowledge of the school
improvement efforts of the school based leadership teams
– To facilitate networking between schools– To share best practices for increasing student
achievement between schools throughout the district– To provide support services to assist schools in
achieving their stated goals and objectives. – To assist in long range budget development and
professional development planning consistent with school needs

School Advantages
– To celebrate successes in student achievement
– To engage in professional dialogue around school improvement planning
– To receive support as appropriate from district personnel for school based reform efforts
– To receive assistance in school improvement planning in such areas as data analysis, action step planning, and program monitoring.

Leading and Sustaining School Change Efforts
• Distributed leadership training
• Site based coaching
• Networking for excellence

Harvey W. Perkins,CEO
John W. Hodge, Vice-President
757-766-5234www.ullc.org