Embed Size (px)
Citation preview

98
ness of asphalt binder at a given temperature and loading time. How-ever, air voids reduce the stiffness of the mixture and must be takeninto account. The precise reinforcement or stiffening mechanismspresent in asphalt–aggregate composites have been obscured by manyfactors, such as the average particle size, gradation, and presence ofagglomerates (1).
A number of researchers have studied several possible mechanismsand reported salient findings in a large volume of asphalt literature(1–10). Up to the present time, however, most of the previous studiesfocused and reported on asphalt mastic stiffening, where the mineralaggregate particle volume concentration (cv) is far less than 60% ofthe total volume of mastics. Thus it was desired to obtain the stiff-ening behavior of HMA mixtures experimentally over a completerange of particle volume concentrations (cv) starting from the asphaltbinder level all the way up to the mixture level where the volumeconcentration typically reaches nearly 90% of the total volume.
The two main objectives of this paper are (a) to present experi-mentally observed binder-to-mixture stiffness data at varying levelsof aggregate volume concentration and (b) to demonstrate how asequential differential scheme micromechanics model (11) can beused to predict these data and to provide new insight toward the roleof the mineral aggregate particles in the evolution of mixture modulusas a function of aggregate volume concentration.
ASPHALT–AGGREGATE REINFORCEMENTMECHANISMS
Among the different reinforcement mechanisms described so far,the following three categories are the most widely accepted andfrequently cited.
Volume Replacement (Volume Filling)
For particulate composites with stiff particles imbedded in a softmatrix, the most dominant mechanism of reinforcement is achievedsimply due to the replacement of soft matrix volume with muchstiffer particles (12–14). The net effect of this reinforcement is oftenmanifested by an increase in bulk and shear moduli, fracture toughnessof the composite, or the viscosity in the case of a fluid suspension. Theconcept is simple and straightforward, as Heukelom and Wijga explain(2): “An increasing volume concentration of ‘solid’ particles reducesthe volume concentration of the liquid medium in which the flowtakes place, so that the resistance to flow—or viscosity—increases.”This type of reinforcement mechanism has been shown to be welldescribed by a number of analytical models, such as the sequentialdifferential scheme micromechanics model (11).
Stiffening Mechanisms ofAsphalt–Aggregate MixturesFrom Binder to Mixture
Minkyum Kim and William G. Buttlar
Hot-mix asphalt (HMA) is a particulate composite of mineral aggregatesand asphalt binder in which the aggregate particles reinforce the softasphalt binder phase, as evidenced by the several orders of magnitudeof difference in the stiffness of HMA compared with the binder. Todevelop a mechanistic way of predicting the stiffness of HMAs, an exper-imentally constructed database of the stiffness evolution, as the volumeconcentration of the aggregate particles progressively increases (fromasphalt binder to coarse HMA mixture), is essential. In this study, aunique database of the complex modulus (E*) was collected with a hollowcylinder tensile test device; asphalt–aggregate mixtures with varyingvolume concentrations of aggregate particles were tested over a rangeof temperatures and loading frequencies. The complex modulus mastercurve data for these mixtures were then compared with micromechan-ical model predictions, on the basis of a differential scheme effectivemedium theory that is known to capture accurately the reinforcingeffect of stiff particles placed in a soft matrix. Stiffening mechanisms,such as volume replacement and aggregate interlock, were explored inlight of this new data set and the model predictions. The volume replace-ment stiffening mechanism was quite pronounced; a considerable amountof aggregate interlock effect was also observed at certain aggregate volumeconcentrations and testing frequencies and temperatures. A detailedanalysis of the data that sheds light on stiffening mechanisms in asphaltconcrete mixtures is provided.
In its simplest form, a hot-mix asphalt (HMA) concrete is a mixtureof mineral aggregate particles and asphalt cement binder. The actualcomposition of the HMA, however, is quite complex due mainly tothe nonuniformity of crushed mineral aggregate particle shapes andthe diversity of particle size, ranging from a few microns to a fewcentimeters in diameter. In addition, air voids are also present in theinternal microstructure of the HMA concrete. The mineral aggregateparticle phase plays an important role in reinforcing the otherwisesoft asphalt binder phase in the HMA to provide satisfactory load-bearing capacity when paved in roads, airfields, parking lots, and soforth. The reinforcement effect is clearly evidenced by the fact thatthe stiffness of HMA is orders of magnitude higher than the stiff-
M. Kim, Louisiana Transportation Research Center, Louisiana State University,4101 Gourrier Avenue, Baton Rouge, LA 70808. W. G. Buttlar, Department ofCivil and Environmental Engineering, University of Illinois at Urbana–Champaign,205 North Mathews Avenue, Urbana, IL 61801. Corresponding author: M. Kim,[email protected].
Transportation Research Record: Journal of the Transportation Research Board,No. 2181, Transportation Research Board of the National Academies, Washington,D.C., 2010, pp. 98–108.DOI: 10.3141/2181-11

Kim and Buttlar 99
Aggregate Particle Interlocking (Particle Contact)
Particle-to-particle contacts in HMA concrete are apparent not onlybetween coarse aggregates, but also between fine aggregates andbetween coarse and fine aggregates, depending on the mixture com-position. When present, particle contact will significantly limit thedeformability of HMA concrete in compression or shear, leading toan increase of material stiffness in general (15). This reinforcementmechanism is particularly important when a significantly large portionof aggregate particles are “flocculated” as hypothesized by Heukelomand Wijga (2) (i.e., when particles are significantly agglomerated).The interlocked aggregates form continuous “pathways,” by whichforce can be transmitted through the rigid aggregate skeleton, result-ing in high mixture stiffness. While not fully packed to a maximumvolume, agglomerates may also trap some asphalt within them andoccupy a larger effective volume than the actual particle volume andimpart an additional increase of the stiffness. On the other side ofthe spectrum, a “fully peptized” state exists, in which all particlesare floating in a dilute state, thereby rendering the reinforcementeffect as minimal. The actual state of the particle dispersion in typi-cal HMA mixtures would be expected to reside somewhere betweenthese two states.
Physicochemical Interaction
Another reinforcement mechanism is the so-called physicochemicalinteraction that may exist at the interface between mineral particlesand asphalt matrix. This stiffening phenomenon is thought to resultfrom the presence of chemically active particles and by absorption,adsorption, or selective sorption of some portions of the asphaltmatrix by the particles. Craus et al. (4) thoroughly studied the associ-ated properties of mineral aggregate fillers, which led to an increasein the stiffness of asphalt–filler systems. The specific surface area offillers, which is tied to the geometric irregularity, surface activity,and adsorption intensity, was found to be the most influential factoraffecting stiffening. In general, high surface area and high surfaceactivity are thought to be associated with high interface bond strength,
which will consequently influence the behavior of asphalt masticsand bituminous mixtures. Inspired by the evidence on the physico-chemical interaction presented by Craus et al. (4), Buttlar et al. (8)modified the generalized self-consistent scheme micromechanicsmodel by introducing the concept of “immobilized asphalt,” whicheventually increases the effective volume concentration of filler par-ticles and gives a means of estimating additional stiffening effectbeyond a pure volume replacement reinforcement. Although thephysicochemical interaction reinforcement is of great interest toasphalt material researchers, no further attempts are made in thispaper to address this aspect. This reinforcement effect is known tobe minimal when chemically inert particles represent the vast major-ity of the mineral aggregate phase, as is typically the case in mostHMA mixtures.
EXPERIMENTAL METHODS
A series of laboratory tests was performed to measure the complexmodulus (E*) at varying loading frequencies from 0.01 to 10 Hz fordifferent asphalt–aggregate mixtures composed of identical binder,but different ranges of aggregate particle sizes as shown in Table 1.Although it is often desirable to characterize the E* of HMA mixturesacross a broad temperature range, say −10°C to 54°C as recommendedby the AASHTO TP62-03, the E* of the materials studied here wasmeasured at three low temperatures between −25°C and 5°C. Therationale for this limited testing temperature regime is discussed in thefollowing sections.
Material
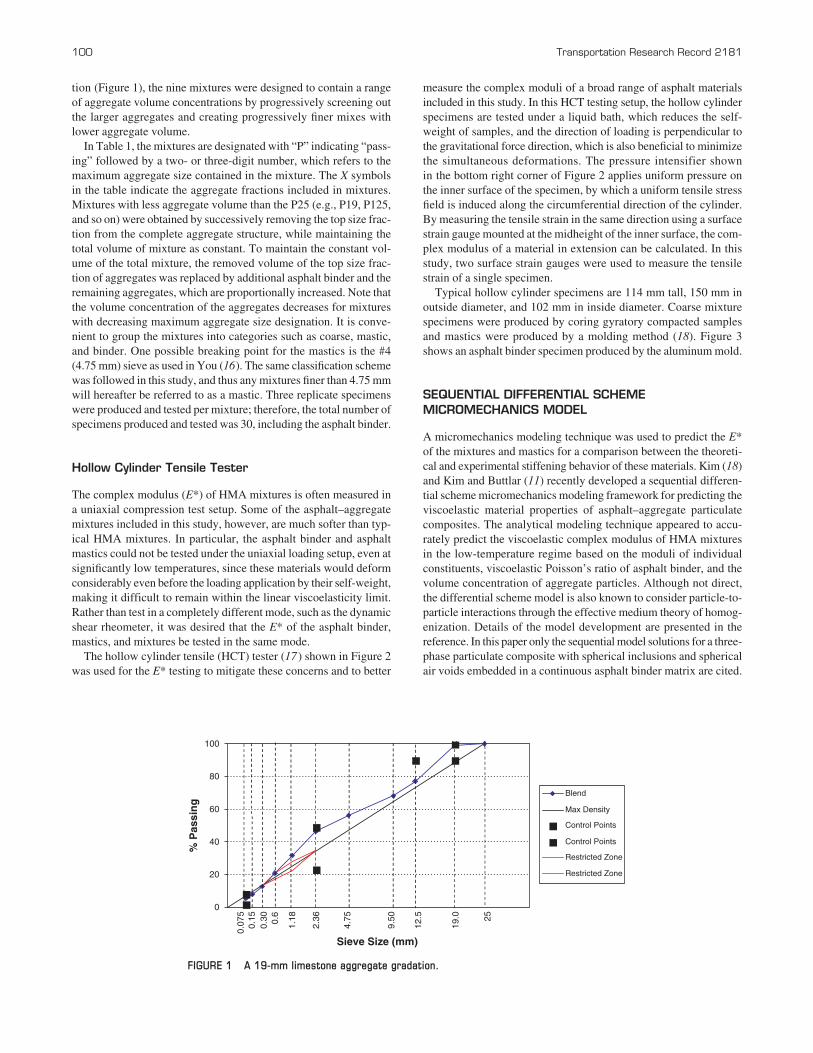
Typical Illinois limestone aggregates from a single source weremixed with a PG 64-22 asphalt binder obtained from Emulsicoat,Inc., in Urbana, Illinois, to produce the nine asphalt–aggregate mix-tures. A major goal of the material design was to produce variouslevels of asphalt–aggregate mixtures, which would clearly demon-strate the stiffening trend arising from the gradual addition ofaggregate particles. Starting from a primary dense mixture grada-
TABLE 1 Material Design Scheme and Composition of Produced Mixtures
Mixture Designation
Coarse mix Mastic Binder
P25 P19 P125 P475 P236 P118 P06 P03 P200 PG 64-22
Sieve Size (mm)25 X19 X X12.5 X X X9.5 X X X4.75 X X X X2.36 X X X X X1.18 X X X X X X0.6 X X X X X X X0.3 X X X X X X X X0.15 X X X X X X X X0.075 X X X X X X X X X
Aggregate volume 0.88 0.88 0.85 0.77 0.71 0.64 0.56 0.46 0.29 0.00concentration, cv
100 Transportation Research Record 2181
tion (Figure 1), the nine mixtures were designed to contain a rangeof aggregate volume concentrations by progressively screening outthe larger aggregates and creating progressively finer mixes withlower aggregate volume.
In Table 1, the mixtures are designated with “P” indicating “pass-ing” followed by a two- or three-digit number, which refers to themaximum aggregate size contained in the mixture. The X symbolsin the table indicate the aggregate fractions included in mixtures.Mixtures with less aggregate volume than the P25 (e.g., P19, P125,and so on) were obtained by successively removing the top size frac-tion from the complete aggregate structure, while maintaining thetotal volume of mixture as constant. To maintain the constant vol-ume of the total mixture, the removed volume of the top size frac-tion of aggregates was replaced by additional asphalt binder and theremaining aggregates, which are proportionally increased. Note thatthe volume concentration of the aggregates decreases for mixtureswith decreasing maximum aggregate size designation. It is conve-nient to group the mixtures into categories such as coarse, mastic,and binder. One possible breaking point for the mastics is the #4(4.75 mm) sieve as used in You (16). The same classification schemewas followed in this study, and thus any mixtures finer than 4.75 mmwill hereafter be referred to as a mastic. Three replicate specimenswere produced and tested per mixture; therefore, the total number ofspecimens produced and tested was 30, including the asphalt binder.
Hollow Cylinder Tensile Tester
The complex modulus (E*) of HMA mixtures is often measured ina uniaxial compression test setup. Some of the asphalt–aggregatemixtures included in this study, however, are much softer than typ-ical HMA mixtures. In particular, the asphalt binder and asphaltmastics could not be tested under the uniaxial loading setup, even atsignificantly low temperatures, since these materials would deformconsiderably even before the loading application by their self-weight,making it difficult to remain within the linear viscoelasticity limit.Rather than test in a completely different mode, such as the dynamicshear rheometer, it was desired that the E* of the asphalt binder,mastics, and mixtures be tested in the same mode.
The hollow cylinder tensile (HCT) tester (17 ) shown in Figure 2was used for the E* testing to mitigate these concerns and to better
measure the complex moduli of a broad range of asphalt materialsincluded in this study. In this HCT testing setup, the hollow cylinderspecimens are tested under a liquid bath, which reduces the self-weight of samples, and the direction of loading is perpendicular tothe gravitational force direction, which is also beneficial to minimizethe simultaneous deformations. The pressure intensifier shown in the bottom right corner of Figure 2 applies uniform pressure onthe inner surface of the specimen, by which a uniform tensile stressfield is induced along the circumferential direction of the cylinder.By measuring the tensile strain in the same direction using a surfacestrain gauge mounted at the midheight of the inner surface, the com-plex modulus of a material in extension can be calculated. In thisstudy, two surface strain gauges were used to measure the tensilestrain of a single specimen.
Typical hollow cylinder specimens are 114 mm tall, 150 mm inoutside diameter, and 102 mm in inside diameter. Coarse mixturespecimens were produced by coring gyratory compacted samplesand mastics were produced by a molding method (18). Figure 3shows an asphalt binder specimen produced by the aluminum mold.
SEQUENTIAL DIFFERENTIAL SCHEMEMICROMECHANICS MODEL
A micromechanics modeling technique was used to predict the E*of the mixtures and mastics for a comparison between the theoreti-cal and experimental stiffening behavior of these materials. Kim (18)and Kim and Buttlar (11) recently developed a sequential differen-tial scheme micromechanics modeling framework for predicting theviscoelastic material properties of asphalt–aggregate particulatecomposites. The analytical modeling technique appeared to accu-rately predict the viscoelastic complex modulus of HMA mixturesin the low-temperature regime based on the moduli of individualconstituents, viscoelastic Poisson’s ratio of asphalt binder, and thevolume concentration of aggregate particles. Although not direct,the differential scheme model is also known to consider particle-to-particle interactions through the effective medium theory of homog-enization. Details of the model development are presented in thereference. In this paper only the sequential model solutions for a three-phase particulate composite with spherical inclusions and sphericalair voids embedded in a continuous asphalt binder matrix are cited.
0
20
40
60
80
100
Sieve Size (mm)
% P
assi
ng
Blend
Max Density
Control Points
Control Points
Restricted Zone
Restricted Zone
25
19.0
12.5
4.75
9.50
2.36
1.180.6
0.15
0.07
5
0.30
FIGURE 1 A 19-mm limestone aggregate gradation.

PressureIntensifier
Specimen
Cooling Medium
Servo-hydraulic Actuator
Silicone Seal
Latex Membrane
PistonLatexMembrane
Specimen Fluid Column
SiliconeSeal
FIGURE 2 Schematic of HCT tester.
(a) (b)
FIGURE 3 (a) Asphalt binder HCT test specimen and (b) aluminum mold.
Kim and Buttlar 101

102 Transportation Research Record 2181
At first, bulk and shear moduli of the composite are obtained usingtwo-phase spherical particle model solutions without considering theair voids:
where
K* and G* = bulk and shear complex moduli, respectively;C, p, and m = composite, particle, and matrix, respectively; and
c = volume concentration of aggregate particles.
K*C and G*
C, which appear on both sides of the equations, need to besolved by a numerical iteration method starting from a seed valueprovided to the right-hand side of the equations.
At the next step, the moduli calculated using Equations 1 and 2are fed into the spherical pore models as the matrix property:
In Equations 3 and 4, the volume concentration, c, is the volumeconcentration of air voids in the mixture. The tensile complexmodulus, E*, of the final three-phase composite then can be calculated as
For the model predictions, an elastic modulus of limestone (Ep) wasassumed as 55.2 GPa based on You’s measurements (16) of the two
EK G
K GC
C C
C C
** *
* *( )=
+
9
35
G G cK G
K GC m
C C
m m
* ** *
* *(= −( ) +
+
⎡
⎣⎢⎢
⎤
⎦⎥⎥
13 4
3 4
5 3
1 3
44)
K K cK G
K GC m
C C
m m
* ** *
* *( )= −( ) +
+
⎡
⎣⎢⎢
⎤
⎦⎥⎥
13 4
3 43
G G c G GG
G
K GC p p m
C
m
C* **
*
*= − −( ) −( )⎡
⎣⎢⎢
⎤
⎦⎥⎥
+1
3 42 5
CC
m mK G
*
* *( )
3 42
1 5
+
⎡
⎣⎢⎢
⎤
⎦⎥⎥
K K c K KK G
K GC p p m
C C
m m
* ** *
* *= − −( ) −( ) +
+
⎡
⎣⎢⎢
⎤1
3 4
3 4 ⎦⎦⎥⎥
( )1
distinctive Illinois limestones used in this study. According to You,the modulus of the limestones ranged approximately from 30 GPato 80 GPa depending on their geological classification (two distinctledges were sampled at the Vulcan quarry in Kankakee, Illinois).The assumed elastic modulus of 55.2 GPa represents a mean valueof You’s measurements. To convert Ep into Kp and Gp for inputs inEquations 1 and 2, the Poisson’s ratio of limestone aggregates wasassumed as 0.25.
The E* master curve of the PG 64-22 asphalt binder was con-structed at a reference temperature of 5°C by fitting to a sigmoidalfunction. The viscoelastic Poisson’s ratio is known to vary dependingon the temperature and the loading time (19–22). Accurate measure-ments of the viscoelastic Poisson’s ratio, however, require verysophisticated instrumentation. Due to limitations of the testing deviceused, the time- and temperature-dependent Poisson’s ratio of asphaltbinder was not experimentally obtained. Fortunately, a set of exper-imental viscoelastic Poisson’s ratio data of a similar asphalt binderto the one used in this study was reported by Di-Benedetto et al.(23). Their Poisson’s ratio data were used to estimate the Poisson’sratio of the PG 64-22 asphalt binder over a wide range of reducedloading frequency to convert E* into K* and G*. The estimated vis-coelastic Poisson’s ratios of the asphalt binder ranged approximatelyfrom 0.5 to 0.4.
The air void content in the gyratory compacted 19-mm primarydense mixture was measured to be 3.7%. A slightly higher airvoid content (or spherical pore volume concentration) of 4.8%was assumed to exist in hollow cylinder specimens as comparedto the gyratory specimens due to the density gradient (24) typi-cally caused by gyratory compactors. An air void level of 4.8%was estimated based on the assumption of a gradual linear increaseof air voids starting from 0% at the aggregate volume concentrationof 0.4 up to 6% when the volume concentration finally reaches 1.
RESULTS AND DISCUSSIONS
Complex Modulus (E*)
Figure 4 summarizes the time–temperature shifted E* master curvesof all nine asphalt–aggregate mixtures and the PG 64-22 binder at a
1.0E+01
1.0E+02
1.0E+03
1.0E+04
1.0E+05
1.0E-02 1.0E+021.0E+00 1.0E+061.0E+04 1.0E+08
Reduced Frequency (Hz)
E*
(MP
a)
P25 P19 P125 P475 P236
P118 P06 P03 P200 PG64-22
Tref = 5 °°C
FIGURE 4 Measured E* master curves of all materials tested by the HCT test.

reference temperature of 5°C. The appropriate shift factors werefound by fitting the measured data to a sigmoid master curve functionas recommended in the Mechanistic–Empirical Pavement DesignGuide (25). In the log-log plot of Figure 4, master curves of asphaltbinder and mastics are well spaced and show stiffness increase as theaggregate volume in the mastics increase. Conversely, the data curvesin the coarse mixture regime are tightly grouped, making clear iden-tification of each of the individual data trends difficult. For example,P25, P19, and P125 are not clearly distinguishable from one anotheron the plot. In other words, some small-volume increment of aggre-gate particles at high-volume concentration level did not display sig-nificant effects on the stiffening of mixtures. The trend is somehowinconsistent with the particulate composite theories, which typicallypredict that exponential stiffness will increase as the volume con-centration reaches its maximum value (i.e., c = 1). It is believed thatthe trend is indicative of the significant effect of air voids on thestiffening of asphalt–aggregate mixtures, which “develops” as thehighest volume concentration levels are reached, thereby counter-acting the increase in stiffening due to the additional aggregate volumeconcentration.
Stiffening Ratio (E*r )
The stiffening ratio (E*r), as defined as the ratio of the mixture E* tothe binder matrix E* (E*r = E*
C/E*m), is a measure of the stiffeningeffect of mineral aggregate particles at a given volume concentra-tion. Only a few experimental studies (26) have reported the stiff-ening behavior of asphalt materials from this broad perspective.In this study, a more comprehensive range of materials with agradual increase of aggregate volume concentration starting fromthe asphalt binders continuing to the dense HMA mixtures wasinvestigated.
Figure 5 shows an example plot of this stiffening behavior calcu-lated based on the E* measurements of all 10 materials tested. In thisplot, stiffening behavior of the asphalt binder at five different load-ing frequencies is shown along the aggregate volume concentrationincrement. Increasing trend of the stiffening ratio is clearly visiblefrom left to the right as the aggregate volume concentration becomes
higher. This trend confirms the self-explanatory volume replacementreinforcement mechanism of asphalt–aggregate mixtures.
One notable observation from Figure 5 besides the volume con-centration dependency of the stiffening potential is the loadingfrequency-dependent stiffening potential. The lower stiffening ratiocurve (black triangles) shows the stiffening ratios calculated at areduced loading frequency of 106 Hz. Thereafter, stiffening ratiocurves calculated at slower loading frequencies show a gradualincrease as the loading frequency slows down to 0.1 Hz, as indi-cated by the upward arrow. In fact, the stiffening ratio of viscoelasticmaterials is dependent on the loading rate and the temperature (6).Under an isothermal condition with master curves constructed basedon the time–temperature superposition principle such as shown in Fig-ure 4, it is only dependent on the reduced loading frequency ( fr, Hz).Therefore, as Anderson et al. (6) presented, greater stiffening ratiosare observed under a slower loading frequency or higher tempera-ture or both. Also, the difference between the highest and loweststiffening ratios appears to become greater as the aggregate volumeincreases in mixtures.
An underlying parameter behind the fr-dependent stiffening ratiomay be the moduli contrast (or modulus ratio) between the bindermatrix phase and the particulate phase. Chow (27 ), Phan-Thien andPham (28), Yin et al. (29), and Yin and Sun (30) showed increasingstiffening ratio trend as the moduli contrasts becomes larger basedon various model prediction results and numerical simulation results.With the assumed elastic modulus of limestone aggregate particles(Ep), the moduli contrast of the asphalt binder can be calculated assummarized in Table 2.
Note that the asphalt binder master curve data shown in Table 2have been extrapolated by one decade toward the lower frequencyend and by less than a decade at the highest frequency to facili-tate comparisons with other experimental data. The assumed elas-tic modulus (Ep) of limestone aggregate is 55.2 GPa as discussedearlier. With this constant elastic modulus, the calculated modulicontrast is naturally inversely proportional to the asphalt bindermodulus.
To investigate the relationship between the stiffening ratio ofasphalt mixtures and the moduli contrast, stiffening ratios of all the
1.0E+00
1.0E+01
1.0E+02
1.0E+03
0.0 0.1 0.2 0.3 0.4 0.5 0.6 0.7 0.8 0.9 1.0
Volume Concentration (c)
E* r
= E
* C/E
* m
fr = 0.1 Hz
fr = 106 Hz
FIGURE 5 Measured stiffening ratios of all mixtures.
Kim and Buttlar 103

104 Transportation Research Record 2181
mixtures are plotted over the moduli contrast tabulated in Table 2.Figure 6 shows stiffening ratio versus moduli contrast plots for thenine mixtures. In the figure, very good linear relationships betweenthe stiffening ratio and the moduli contrast are observed on thelog-log plots for the coarse mixtures and mastics with relativelyhigher volume concentration of aggregates (P25 to P118). The slopeof linear trend lines tends to gradually decrease as the volume con-centration of aggregates decreases. The R2 values also tend todecrease, which implies that the linearity of the relationship wouldgradually diminish as the volume concentration of aggregatesdecreases.
As expected, stiffening ratio versus moduli contrast relation-ships of three fine mastics (i.e., P06, P03, and P200) with muchlower aggregate volume concentrations are not linear, as can beseen from the mismatch between the measured stiffening ratiosand trend lines with decreasing R2 values. Instead, the stiffeningratio of these mastics shows a peak-and-decreasing trend as themoduli contrast increases.
The stiffening ratio versus moduli contrast curves of all themixtures and mastics are plotted together in Figure 7 for a clearercomparison among different mixtures and mastics. The top threecurves represent coarse mixtures (P25, P19, and P125) with good linear relationships. The middle three curves are the mastics(P475, P236, and P118) with medium-high aggregate volumeconcentrations from 0.77 to 0.64. Reduced linearity begins toappear with these mastics. The bottom three curves are the finermastics (P06, P03, and P200) with a much lower level of aggre-gate volume concentrations, where little or no linear relationshipsare found between the stiffening ratio and the moduli contrast.However, it should be noted that the categories themselves (i.e.,coarse, mastic, or fine mastic) should not necessarily dictate thelinearity of the relationship.
The correlations between stiffening behavior and moduli contrastis believed to show the role of the aggregate particle interlocking inthe reinforcement mechanism of asphalt–aggregate mixtures in addi-tion to the volume replacement mechanism. Consider the two extremematerials (P25 and P200) for example. Since the moduli contrastwas calculated as inversely proportional to the reduced loading fre-quencies, it can be concluded that the coarse mixture P25 maintainsthe level of stiffening at longer loading frequencies and at highertemperatures. Conversely, the fine mastic P200 cannot hold the level
of stiffening as the temperature increases and the loading frequencydecreases.
The observation can be explained by the deformability of materi-als, which is dependent on the aggregate interlock. With a closelypacked aggregate volume concentration of 0.88, the deformation inthe mixture P25 at very slow loading frequencies could have beenlimited by the network of aggregate particles or, in other words, theaggregate interlocking in the densely compacted mixture. This sit-uation will clearly result in a high stiffening ratio. On the otherextreme, with much less aggregate volume concentration of 0.29,there appears to be little influence from interconnecting aggregatesin the microstructure of the P200 mastic. Using the term introducedearlier, this state can be regarded as approaching the “fully peptized”state, at which the deformation under very slow loading cannot belimited by the aggregate interactions, and thus continuous flow canoccur. Clearly, the stiffening due to the dilute aggregate concentra-tion will not be as effective as the dense mixture with an interlockedaggregate network.
In comparison with the experimental stiffening behavior, a similartype of plot is simulated by the micromechanics modeling approachdescribed earlier. Figure 8 presents the sequential differential schememodel predicted stiffening ratio versus moduli contrast plots at vary-ing levels of particle volume concentrations. The legend next to thestiffening ratio curves approximately shows the volume concentrationof closely matching curves from either the top or bottom in order.
As discussed earlier, the differential scheme model considers bothvolume replacement and particle interaction to some extent throughthe homogenization. Thus the stiffening ratio curves presented inFigure 8 can be regarded as the result of both stiffening mechanisms.When compared to the experimentally observed stiffening behaviorin Figure 7, monotonically increasing trends of the stiffening ratiocurves are observed at all level of volume concentrations, which areobviously not in a good agreement with the experimental results.Also the linearity of the model-simulated stiffening ratio curvesunderstates that of the experiments especially in the higher volumeconcentration range where stronger particle interactions may exist.This comparison indicates that a higher degree of particle interlockingreinforcement plays a significant role in reinforcing the asphalt–aggregate mixtures, under certain conditions such as high volumeconcentration of aggregates and slow loading frequencies, evenunder tension.
Figure 9 illustrates a global prediction plot of stiffening ratio versusvolume concentration by the sequential differential scheme model-ing compared with the HCT-measured data at a reduced loading fre-quency of 10 Hz. The model prediction follows the experimentalstiffening potential reasonably well, while consistently departing fromthe measurements through the entire range of volume concentrationsof the tested nine mixtures and mastics. The discrepancy, again,reflects the inability of the current analytical models to detect highlysophisticated particulate stiffening mechanisms, such as particleinterlocking (or particle-to-particle contact).
SUMMARY AND RECOMMENDATIONS
In summary, viscoelastic complex moduli in tension (E*) of 10asphalt–aggregate mixtures (including a binder) with varying aggre-gate volume concentrations were conducted using the hollow cylin-der tensile tester within the low in-service temperature range.Reinforcement (or stiffening) potential of these mixtures and
TABLE 2 Moduli Contrast Between LimestoneAggregate and Asphalt Binder
fr (Hz) E* (MPa) Moduli Contrast (Mc)
1.00E+08 2,050 27
1.00E+07 1,906 29
1.00E+06 1,702 32
1.00E+05 1,434 39
1.00E+04 1,111 50
1.00E+03 770 72
1.00E+02 468 118
1.00E+01 249 222
1.00E+00 119 465
1.00E-01 54 1,013
1.00E-02 26 2,125
1.00E-03 14 4,014

y = 1.2882x 0.7445
R 2 = 0.9996
1.E+01
1.E+02
1.E+03
1.E+01 1.E+02 1.E+03 1.E+04
Moduli Contrast
Sti
ffen
ing
Rat
ioy = 1.5768x0.7061
R 2 = 0.986
1.E+01
1.E+02
1.E+03
1.E+01 1.E+02 1.E+03 1.E+04
Moduli Contrast
Sti
ffen
ing
Rat
io
y = 2.3616x0.5971
R 2 = 0.9962
1.E+01
1.E+02
1.E+03
1.E+01 1.E+02 1.E+03 1.E+04
Moduli Contrast
Sti
ffen
ing
Rat
io
y = 1.9206x 0.5553
R 2 = 0.9908
1.E+01
1.E+02
1.E+03
1.E+01 1.E+02 1.E+03 1.E+04
Moduli Contrast
Sti
ffen
ing
Rat
io
y = 2.4456x 0.392
R 2 = 0.9732
1.E+00
1.E+01
1.E+02
1.E+01 1.E+02 1.E+03 1.E+04
Moduli Contrast
Sti
ffen
ing
Rat
io
y = 3.1942x 0.2872
R 2 = 0.9023
1.E+00
1.E+01
1.E+02
1.E+01 1.E+02 1.E+03 1.E+04
Moduli Contrast
(a) (b)
(c) (d)
(e) (f)
Sti
ffen
ing
Rat
io
c = 0.88 c = 0.88
c = 0.85c = 0.77
c = 0.71 c = 0.64
FIGURE 6 Stiffening ratio versus moduli contrast for produced mixtures: (a) Mixture P25, (b) Mixture P19, (c) MixtureP125, (d) Mixture P475, (e) Mixture P236, and (f) Mixture P118.
(continued on next page)
mastics was investigated as related to the aggregate volume concen-tration (c) and the moduli contrast between the aggregate particlesand asphalt binder. The stiffening ratio versus volume concentrationcurves confirmed that the volume replacement (or volume filling)reinforcement is a predominant mechanism in asphalt–aggregatemixtures. The stiffening ratio versus moduli contrast plots showedthat the effect of aggregate interlocking also plays a crucial rolein the reinforcement mechanism. However, the importance of the aggregate interlocking seems to be condition dependent. Forexample, for a dense mixture at very low temperatures where theasphalt binder modulus is very high, this stiffening mechanismmay be less important than the volume replacement reinforcement.As temperature becomes warmer and the asphalt binder modulus is
low, the aggregate particle interlocking reinforcement mechanismwould become more important, because, without the aggregate net-work contribution, asphalt mixtures may experience continuousflow of deformation, which will result in very low stiffness.
Though not evaluated in this study, it can be expected that the degreeof aggregate interlocking will have a more direct effect on the shearmodulus (G*) of asphalt mixtures, which will eventually affect therutting performance of paved roads, since mixtures with higher shearmodulus are known to better resist rutting. Thus designing HMA mix-tures with a better aggregate skeleton, angularity, surface texture, andso on to obtain better rutting performance seems to be a reasonableapproach. However, these aggregate properties would become lessimportant in designing HMA mixtures for better cracking resistance.
Kim and Buttlar 105

106 Transportation Research Record 2181
y = 5.4437x 0.0703
R 2 = 0.1845
1.E+00
1.E+01
1.E+02
1.E+01 1.E+02 1.E+03 1.E+04
Moduli Contrast
Sti
ffen
ing
Rat
io
c = 0.56
y = 4.5594x 0.0171
R 2 = 0.0136
1.E+00
1.E+01
1.E+01 1.E+02 1.E+03 1.E+04
Moduli Contrast
Sti
ffen
ing
Rat
io
c = 0.46
y = 3.1746x -0.0291
R 2 = 0.0706
1.E+00
1.E+01
1.E+01 1.E+02 1.E+03 1.E+04
Moduli Contrast
(g) (h)
(i)
Sti
ffen
ing
Rat
io
c = 0.29
FIGURE 6 (continued) Stiffening ratio versus moduli contrast for produced mixtures: (g) Mixture P06, (h) Mixture P03,and (i) Mixture P200.
1.0E+00
1.0E+01
1.0E+02
1.0E+03
1.0E+01 1.0E+02 1.0E+03 1.0E+04
Moduli Contrast (Ep/E*m)
Sti
ffen
ing
Rat
io (
E* C
/E* m
) c=0.88
c=0.29
CoarseMixture
SandMastic
FineMastic
FIGURE 7 Measured stiffening ratio versus moduli contrast.

1.E+00
1.E+01
1.E+02
1.E+03
1.E+01 1.E+02 1.E+03 1.E+04
Moduli Contrast
Sti
ffen
ing
Rat
io (
E* r
)
0.9
0.8
0.7
0.6
0.5
0.4
0.3
0.2
0.1
FIGURE 8 Micromechanics model-simulated stiffening ratio versus moduli contrast curves.
1.E+00
1.E+01
1.E+02
1.E+03
0.0 0.1 0.2 0.3 0.4 0.5 0.6 0.7 0.8 0.9 1.0
Volume Concentration (c)
Sti
ffen
ing
Rat
io (
E* r
)
fr = 10 Hz
Sequential Differential Scheme Prediction
HCT Measured Data
FIGURE 9 Stiffening ratio versus volume concentration at fr � 10 Hz.
The findings and recommendations presented here are based on alimited number of observations and analyses. Therefore, more workis needed to confirm the findings presented in this paper.
REFERENCES
1. Shashidhar, N., and P. Romero. Factors Affecting the Stiffening Poten-tial of Mineral Fillers. In Transportation Research Record 1638, TRB,National Research Council, Washington, D.C., 1998, pp. 94–100.
2. Heukelom, W., and P. W. O. Wijga. Viscosity of Dispersions as Gov-erned by Concentration and Rate of Shear. Journal of the Association ofAsphalt Paving Technologists, Vol. 40, 1971, pp. 418–437.
3. Anderson, D. A., and W. H. Goetz. Mechanical Behavior and Rein-forcement of Mineral Filler-Asphalt Mixtures. Journal of the Associationof Asphalt Paving Technologists, Vol. 42, 1973, pp. 37–66.
4. Craus, J., I. Ishai, and A. Sides. Some Physico-Chemical Aspects of theEffect and the Role of the Filler in Bituminous Paving Mixtures. Journalof the Association of Asphalt Paving Technologists, Vol. 47, 1978,pp. 558–588.
5. Anderson, D. A., H. U. Bahia, and R. Dongre. Rheological Propertiesof Mineral Filler-Asphalt Mastics and Their Relationship to PavementPerformance. In ASTM STP 1147: Effects of Aggregates and MineralFillers on Asphalt Mixture Performance. American Society for Testingand Materials, Philadelphia, Pa., 1992, pp. 132–153.
6. Anderson, D. A., R. Dongre, D. W. Christensen, and E. L. Dukatz.Effects of Minus No. 200-Sized Aggregate on Fracture Behavior ofDense-Graded Hot-Mix Asphalt. In ASTM STP 1147: Effects of Aggre-gates and Mineral Fillers on Asphalt Mixture Performance. AmericanSociety for Testing and Materials, Philadelphia, Pa., 1992, pp. 154–176.
7. Mogawer, W. S., and K. D. Stuart. Effect of Mineral Fillers on Proper-ties of Stone Matrix Asphalt Mixtures. In Transportation ResearchRecord 1530, TRB, National Research Council, Washington, D.C.,1996, pp. 86–94.
Kim and Buttlar 107

108 Transportation Research Record 2181
8. Buttlar, W. G., D. Bozkurt, G. G. Al-Khateeb, and A. S. Waldhoff.Understanding Asphalt Mastic Behavior Through Micromechanics. InTransportation Research Record: Journal of the Transportation ResearchBoard, No. 1681, TRB, National Research Council, Washington, D.C.,1999, pp. 157–166.
9. Lackner, R., M. Spiegl, R. Blab, and J. Eberhardsteiner. Is Low-Temperature Creep of Asphalt Mastic Independent of Filler Shape andMineralogy? Arguments from Multiscale Analysis. Journal of Materialsin Civil Engineering, Vol. 17, No. 5, 2005, pp. 485–491.
10. Delaporte, B., H. D. Benedetto, P. Chaverot, and G. Gauthier. LinearViscoelastic Properties of Bituminous Materials: From Binders to Mastics.Journal of the Association of Asphalt Paving Technologists, Vol. 76,2007, pp. 1–34.
11. Kim, M., and W. G. Buttlar. Differential Scheme Effective MediumTheory for Hot-Mix Asphalt⎟ E*⎟ Prediction. Journal of Materials in CivilEngineering, Special Issue, 2010, in press (http://ascelibrary.aip.org/dbt/dbt.jsp?KEY=JMCEXX&Volume=1&Issue=1).
12. Daniel, I. M., and O. Ishai. Engineering Mechanics of CompositeMaterials. Oxford University Press, New York, 1994.
13. Callister, Jr., W. D. Materials Science and Engineering: An Introduction.John Wiley and Sons, Inc., New York, 2003.
14. Christensen, R. M. Mechanics of Composite Materials. Dover, Mineola,N.Y., 2005.
15. You, Z., and W. G. Buttlar. Discrete Element Modeling to Predict theModulus of Asphalt Concrete Mixtures. Journal of Materials in CivilEngineering, Vol. 16, No. 2, 2004, pp. 140–146.
16. You, Z. Development of a Micromechanical Modeling Approach toPredict Asphalt Mixture Stiffness Using the Discrete Element Method.Doctoral dissertation. University of Illinois at Urbana-Champaign,Urbana, 2003.
17. Buttlar, W. G., G. G. Al-Khateeb, D. Bozkurt. Development of a HollowCylinder Tensile Tester to Obtain Mechanical Properties of Bitumi-nous Paving Mixtures. Journal of the Association of Asphalt PavingTechnologists, Vol. 68, 1999, pp. 369–403.
18. Kim, M. Development of Differential Scheme Micromechanics Model-ing Framework for Predictions of Hot-Mix Asphalt (HMA) ComplexModulus and Experimental Validations. Doctoral dissertation. Universityof Illinois at Urbana-Champaign, Urbana, 2009.
19. Ferry, J. D. Viscoelastic Properties of Polymers. John Wiley and Sons,Inc., New York, 1961.
20. Aklonis, J. J. Introduction to Polymer Viscoelasticity, 2nd ed. JohnWiley and Sons, Inc., New York, 1983.
21. Hilton, H. H., and S. Yi. The Significance of (An)Isotropic ViscoelasticPoisson Ratio Stress and Time Dependencies. International Journal ofSolids and Structures, Vol. 35, No. 23, 1998, pp. 3081–3095.
22. Christensen, R. M. Theory of Viscoelasticity. Dover, Mineola, N.Y.,2003.
23. Di-Benedetto, H., B. Delaporte, and C. Sauzeat. Three-DimensionalLinear Behavior of Bituminous Materials: Experiments and Modeling.International Journal of Geomechanics, Vol. 7, No. 2, 2007, pp. 149–157.
24. Al-Khateeb, G. Z. Development of a Hollow-Cylinder Tensile Tester toObtain Fundamental Mechanical Properties of Asphalt Paving Mixtures.Doctoral dissertation. University of Illinois at Urbana-Champaign,Urbana, 2001.
25. ARA, Inc., ERES Consultants Division. Guide for Mechanistic–Empir-ical Design of New and Rehabilitated Pavement Structures. Final report,NCHRP Project 1-37A. Transportation Research Board of the NationalAcademies, Washington, D.C., 2004. www.trb.org/mepdg/guide.htm.
26. Delaporte, B. Etude de la Rhéologie des Mastics Bitumineux à l’Aided’un Rhéomètre à Cisaillement Annulaire. PhD dissertation. L’InstitutNational des Sciences Appliquées de Lyon, Lyon, France, 2007.
27. Chow, T. S. Review of the Effect of Particle Shape on the MechanicalProperties of Filled Polymers. Journal of Material Science, Vol. 15,1980, pp. 1873–1888.
28. Phan-Thien, N., and D. C. Pham. Differential Multiphase Models forPolydispered Suspensions and Particulate Solids. Journal of Non-Newtonian Fluid Mechanics, Vol. 72, 1997, pp. 305–318.
29. Yin, H. M., L. Z. Sun, and G. H. Paulino. Micromechanics-Based ElasticModel for Functionally Graded Materials with Particle Interactions.Acta Mater, Vol. 52, 2005, pp. 3535–3543.
30. Yin, H. M., and L. Z. Sun. Magnetic Properties of Randomly DispersedMagnetic Particulate Composites: A Theoretical Study. Physical ReviewB, Vol. 72, No. 5, 2005.
The Characteristics of Bituminous Paving Mixtures to Meet Structural RequirementsCommittee peer-reviewed this paper.