Embed Size (px)
Citation preview

1
STEWARDSHIP BEHAVIOUR AS GOVERNANCE IN FAMILY BUSINESSES
JUSTIN B. CRAIG ASSOCIATE PROFESSOR OF ENTREPRENEURSHIP AND FAMILY BUSINESS
CO-DIRECTOR AUSTRALIAN CENTRE FOR FAMILY BUSINESS SCHOOL OF BUSINESS
BOND UNIVERSITY TEL: +61 7 55951161 FAX: +61 7 55951160
CLAY DIBRELL ASSOCIATE PROFESSOR OF ENTREPRENEURSHIP AND STRATEGY
COLLEGE OF BUSINESS OREGON STATE UNIVERSITY
TEL: +541 737-4110 FAX: +541 737-5388
DONALD O. NEUBAUM ASSISTANT PROFESSOR OF ENTREPRENEURSHIP AND STRATEGY
COLLEGE OF BUSINESS OREGON STATE UNIVERSITY
TEL: +541 737-6036 FAX: +541 737-5388
Abstract
To demonstrate the potential of stewardship behavior in the governance of family businesses, we introduce a statistically valid and reliable measure that captures the degree to which family leaders act to engender stewardship governance in their family’s firm. Demonstrating nomological validity of our measure through significantly positive relationships with innovativeness and firm performance further links our scale to entrepreneurial behaviors. We discuss the contribution of our research for practitioners and scholars.
2
STEWARDSHIP BEHAVIOUR AS GOVERNANCE IN FAMILY BUSINESSES
Introduction
Family businesses dominate all economies. Interest in the challenges facing
family business leaders and their advisors has increased in recent times. That many
family business leaders are intrinsically motivated by higher level needs to act for the
collective good of their firms motivates this research. We suggest these decision makers
will design their organizations in order to elicit stewardship behaviors. The collective
behavior that is a signature of stewardship, we argue, gives rise to stewardship being an
effective governance form. More specifically, family business leaders will benefit when
they demonstrate commitment to making a significant contribution to an organization’s
mission, longevity, and stakeholders, more so than their economic self-interest (Davis et
al., 1997; Davis et al., 2000).
How family businesses are governed influences how they perform. Though
agency theory is the dominant governance paradigm (Arthurs & Busenitz, 2003;
Wasserman, 2006), some scholars (e.g., Ghoshal, 2005) believe the narrow emphasis on
the economic rationality of agents, which underpins agency theoretical arguments,
ignores equally important non-economic motivations. According to agency theory, the
interests of shareholder/ principals and agents diverge as each wishes to maximize their
own personal utility and wealth. Theorists from psychology and sociology, however,
challenge the purely economic motivations of agents and argue individuals possess a
wide variety of motivations and desires, and their personal utility can be maximized
through non-economic means (Hirsh, Michaels, & Friedman, 1987). Contemporary
thinking positions stewardship theory as a complementary view of organizational

3
governance where the interests of principals and agents can be aligned. While interest in
stewardship theory has increased considerably in recent years, no researchers have
attempted to create and validate a reliable stewardship measure.
To address this gap, in this paper, we introduce a psychometric scale developed
from the seminal work on stewardship theory (e.g., Davis, Schoorman, & Donaldson,
1997; Donaldson & Davis, 1989, 1991). Stewardship theory was designed “for
researchers to examine situations in which executives as stewards are motivated to act in
the best interests of their principals” (Davis et al., 1997, p. 24). According to these
scholars, stewards gain higher utility from pro-organizational and collectivistic behaviors
than economic, individualistic and self-serving behaviors. When faced with a self-
serving decision versus a more cooperative, pro-organizational behavior, stewards will
pursue the latter because of the higher utility they assign to such behaviors. Thus, not
only are the interests of principals protected, but also the stewards own utility is
maximized, which makes such decisions wholly rational. Unfortunately, the personal,
intrinsic motivations of stewardship are not easily quantified.
The paper proceeds as follows. The next section presents an overview of previous
literature. Then, we discuss how family business leaders can benefit by designing their
firms to elicit stewardship behaviors. The methods used to develop our scale, as well as
the results of the tests of our measure, are then presented. The final section discusses the
implications and limitations of our research.
Previous Literature

4
Agency theory suggests agents for owners will exploit their access to superior
information for personal gain. The information asymmetry and contradictory incentives
between the parties facilitates the need to introduce governance initiatives to ensure
clarity, accountability and transparency for stakeholders (Ang, Cole, & Lin, 2000; Berle
& Means, 1932; Demsetz, 1988; Eisenhardt, 1989; Fama & Jensen, 1983; Jensen &
Meckling, 1976). Put another way, agency theory tries to account for the inability of
owners to control their agents effectively (Fox & Hamilton, 1994). Agency theory,
therefore, has driven the development of systems of external control with two
complementary over-arching purposes: to control agents and reduce agency costs (Dicke
& Ott, 2002; Wasserman, 2006).
Controlling agents, however, is not a concern when the interests of the principal
and the agent are aligned (Tosi et al., 2003). When there is goal congruence between the
principal and the agent, the principal’s wealth will be maximised (Berle & Means, 1932).
In agency theory, there is an assumption that both owners and their agents are
individualistic, opportunistic, self-maximizing wealth seekers, with divergent goals and
interests (Davis et al., 1997). Specifically, though principals and agents both seek to
maximize their own welfare, principals achieve this through the wealth created by their
capital investment while agents maximize their personal value vis-à-vis their position and
involvement in the principal’s firm, and the economic benefits gained from this
involvement (Tosi et al., 2003).
The limitations of the application of agency theoretical arguments have lead to the
development of alternate explanations, one of which is stewardship theory. Stewardship
theory defines relationships based upon behavioral premises not addressed by the agent-

5
principal interest divergence canvassed in agency theory (Donaldson & Davis, 1989,
1991). According to stewardship theory, the steward’s objectives are aligned with those
of the organization (e.g., sales growth, innovation or profitability) and the utility gained
through pro-organizational behavior is higher than those gained through individualistic,
self-serving behavior. As such, a steward is able to maximize multiple, often conflicting,
stakeholders’ interests through firm performance because, by so doing, the steward’s
utility functions are maximized (Davis et. al., 1997).
The most comprehensive description and explanation of stewardship theory is
offered by Davis et al. (1997), a paper strongly influencing the development of our scale.
Davis et al. (1997) believe corporate governance results from both psychological (“the
model of man”) and situational (“the model of the organization”) contexts. Thus, the
resulting governance structure of an organization has roots not only the psychological
factors and motivations of the agent, but also from the organizational and cultural
conditions which exist within the organization. These two contexts are inextricably
intertwined, as the organizational and cultural context which exists within the firm is
patterned after the executive’s psychological model of man. Thus, stewardship
governance stems from the personal motivations of the agent, as well as the cultural
conditions his/her leadership engenders within the organization.
Designing Family Businesses to Elicit Stewardship Behaviors
Davis, Schoorman, Mayer, and Tan (2000) confirm that leaders who identify with
the organization and embrace its objectives are committed to make it succeed, even at
personal sacrifice. By developing a strong, values-driven corporate culture through

6
stewardship-rooted governance initiatives, leaders are able to assemble a loyal set of
talented supporters, family and non-family, who will preserve the firm’s tacit knowledge
and reputation and contribute to difficult to match capabilities (Miller & Le Breton-
Miller, 2006; Teece, Pisano, & Schuen, 1997; Zahra et al., 2008). Stewardship
governance, and the associated accountable behavior, therefore, is likely to occur when
core values converge and an internal sense of responsibility is created (Dicke & Ott,
2002). As a consequence, control-based methods can be reduced because of the
likelihood that the majority will perform to expectations voluntarily.
Drawing conclusions from previous research that has attempted to position
stewardship in governance terms is difficult for two reasons. First, the proxy measures
created from demographic and financial data are intended to reflect individual manager
behavior. Second, stewardship theory, as introduced by Davis et al. (1997), is a complex
hybrid of firm and individual-level (situational and psychological) contexts. To address
this, we suggest an opportunity exists to develop a stewardship governance measure of
organizations by soliciting firm leaders’ individual responses to concepts introduced in
seminal works. The nexus of our argument is that family business leaders who express
feelings and satisfaction with the firm and its policies, which are consistent with
stewardship theoretical constructs, will promote internal organizational processes that
lead to empowering environments in the firms they lead. As a consequence, principals
and agents will be mutually accountable, their goals and motivations will be aligned, and
these stewardship-rooted behaviors will act as an effective and beneficial form of
governance. Next, we present a discussion of the methods use to develop and test our
measure of stewardship governance.

7
METHOD AND MEASURES
Stewardship
Item Generation and Expert Panel
Drawing upon accepted scale development practices (e.g., Churchill, 1979;
DeVellis, 1991), we first generated 38 items based on the psychological and situational
contexts of stewardship (i.e., intrinsic motivation, identification with the organisation, use
of power, involvement orientation, collectivist versus individualistic culture, and power
distance) from Davis et al. (1997). Specifically, from the Motivation discussion in Davis
et al. (1997), we created items from statements such as: ‘In contrast, in stewardship
theory, the focus is on intrinsic rewards that are not easily quantified. These rewards
include opportunity for growth, achievement, affiliation, and self-actualization.’ (p. 28);
from the Identification discussion, questions were developed from statements like:
‘…belief in and acceptance of the goals of the organisation…is more closely related to
the notion of identification, and is an important component of the psychological profile of
a steward.’ (p. 30); from the Use of Power discussion, ‘Personal power is the basis of
influence in a principal-steward relationship’ (p. 31); from the Management Philosophy
discussion, an example of a statement from which questions were developed is: ‘A
control-orientated management philosophy is more likely to produce choices of agency
theory relationships, whereas an involvement-orientated management philosophy is more
likely to produce stewardship theory relationships’ (p. 34); the Culture discussion lead to
items being developed from statements such as: ‘…collectivist cultures are more
conducive to the emergence of stewardship relationships…individualistic cultures would

8
appear to facilitate agency relationships’ (p. 35); and under the Power Distance sub-
section, the items were distilled from statements such as: ‘High power distance cultures
are conducive to the development of agency relationships, because they support and
legitimize the inherent inequality between principal and agent. This idea is especially true
in the context of work, because the development of hierarchies, of layers of supervision
(as control mechanisms), and of inequalities in rewards and status may lead the agents to
‘ideologically reject the boss’s authority completely, while in practice they will comply’
(Hofstede, 1991: 36)’, and ‘Low power distance cultures are more conducive to the
development of stewardship relationships, because their members place greater value on
the essential equality of the principal and the manager’ (p. 36). Whenever possible, we
referred back to the original source material to construct our items (e.g., Hofstede, 1991,
Porter et al., 1974)
We then recruited a panel of three entrepreneurship/family business scholars. The
expert panel was provided a definition of stewardship theory and an outline of the six
dimensions differentiating stewardship assumptions. For each of the 38 items, we
originally generated, a 5-point Likert scale anchored from 1 (not at all) to 5 (to an
extreme extent) was developed. Each item was preceded by statements asking, ‘To what
extent do you see yourself as…’ or ‘To what extent does your business…’ Five of the
questions were reverse coded. The panel was asked to interpret each of the 38 items and
assign them to one of the six dimensions. In cases were the panel did not reach an
agreement, or felt the items were redundant, we removed those items from further
consideration. This process resulted in 27 items across the six dimensions of the
psychological and situational contexts. Making up the three dimensions of the

9
psychological context were: intrinsic motivation (7 questions), identification with the
organisation (4 questions), use of power (3 questions); while the three dimensions of the
situational context consisted of: involvement orientation (6 questions), collectivist culture
(6 questions) and power distance (1 question) (see Table 1).
Insert Table 1 about here
Exploratory Factor Analysis
A questionnaire was sent electronically via an email to respondents in top
management positions in U.S. family businesses (n = 400). After two follow up emails,
68 responses were received representing a response rate of 17%, which is considered
slightly greater than normal response rate for top management team research (Hambrick
et al., 1993). Respondents were senior representatives of family firms of various sizes
from a wide range of industries. We asked our respondents to classify themselves as
either a family business or a non-family business in our questionnaire. We drew upon the
literature which suggests that CEOs, Managing Director or Chairman’s perception of the
business being a family business is crucial to the business being considered a family
business (Binder Hamlyn, 1994; Carsrud 1994; Cooper, Upton, & Seaman 2005; Dibrell
& Craig, 2006; Ram & Holliday, 1993; Westhead & Cowling, 1998). Using principal
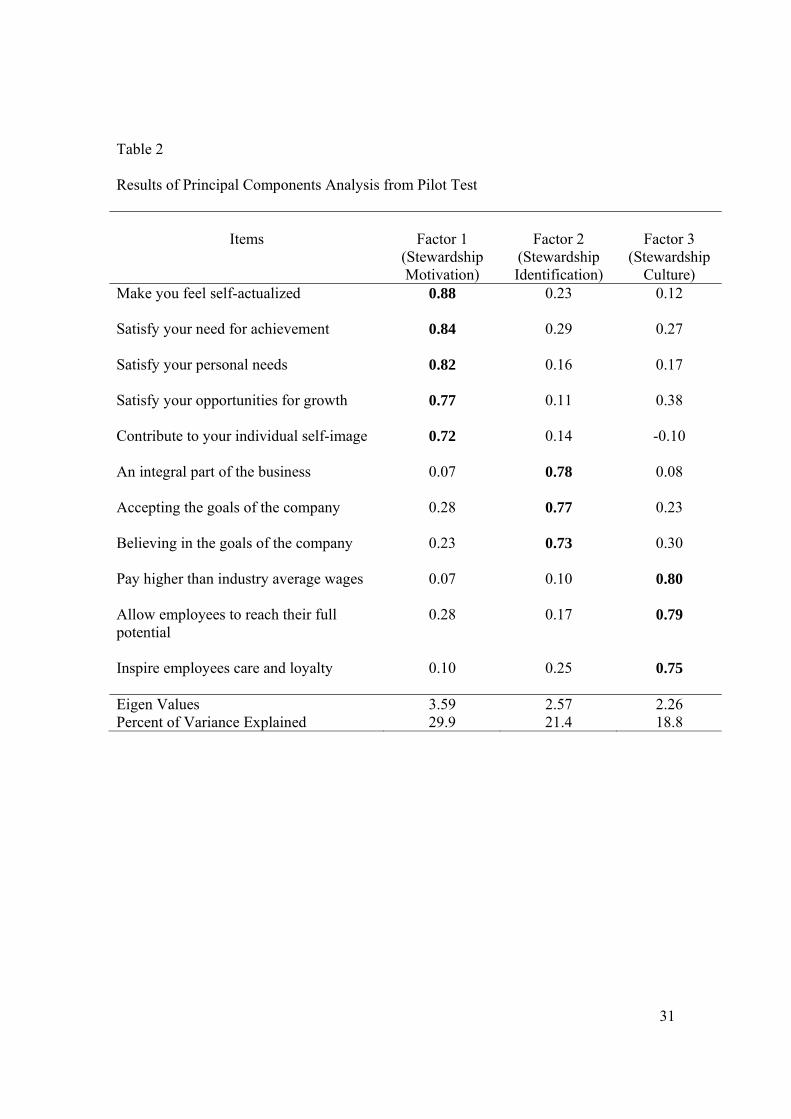
component analysis with a varimax rotation, three factors emerged. As reported in Table
2, all items for the three factors, which we named motivation, identification, and culture,
had factor loadings greater than .70, which were greater than the .50 loadings
recommended by Hair et al. (1995). All factors had eigen values greater than 1 with the
variance accounted for being relatively equally distributed among the dimensions.
Likewise, the coefficient alphas for motivation (5 items; α = .87), identification (3 items;

10
α = .80), and culture (3 items; α = .71) were all above the .70 threshold suggested by
Nunnally (1978). The remaining items were dropped due to high cross-loadings or un-
interpretable factor structures.
Insert Table 2 about here
Validation Sample
Consistent with the purpose of the study and to further validate the stewardship
scale, we proceeded to gather additional data from executives through a mail
questionnaire, following Salant and Dillman’s (1994) recommended approach. Other
scholars (e.g., Powell, 1996) have suggested that many of the extant studies have stronger
industry effects than imagined. We wished to control for these effects in our exploratory
analysis for our validation study and chose to focus on only one industry, the food
processing industry. A list of 4,341 firms participating in the U.S. food processing
industry was acquired from Dun and Bradstreet. The food processing industry was
chosen for the sample context because of the large number of firms and the wide variance
in the size, scale and types of firms participating within the industry. Firms involved in
food processing are often suggested to have a long-term approach as their product is for
human consumption. Out of the 4,341 potential respondent firms, 461 were removed for
reasons such as incorrect addresses or firm policies against responding to mail surveys.
After conducting two waves of mailing surveys, a total of 360 responses were collected
for a response rate of 9.3%. To test for non-response bias, we tested for differences
between early and late respondents (Kanuk & Berenson, 1975) and did not find any
statistical differences in the number of employees or firm age.

11
Since our goal was to develop a firm level measure of stewardship in family
firms, an additional 115 firms were eliminated from the sample as these firms indicated
that they were non-family firms, resulting in a sample of 245 family businesses.
Likewise, we only included responses from CEOs (n = 154) or owners (n = 38). The
remaining respondents were removed from the analysis. We sampled CEOs and owners
because these individuals are likely to be most aware of stewardship-related issues.
While the issues facing principals (our owner respondents) and agents (our CEO
respondents) may vary, we believe the inclusion from both sets of respondents is
appropriate. Since our primary purpose was to rely on the respondents to create a
psychometrically valid and reliable stewardship scale (i.e., convergent, discriminant and
nomological validations), as opposed to testing hypothesized relationships, the inclusion
of both types of responses does not negatively impact our results. This belief was
supported as responses provided by the owners and CEOs did not significantly differ. The
size of the responding firms ranged from under five employees (n = 31) to greater than
500 employees (n = 7) with the average firm in the sample having between 10 and 49
employees (n = 95). The firms’ ages ranged from 3 years (n = 5), to the higher ages
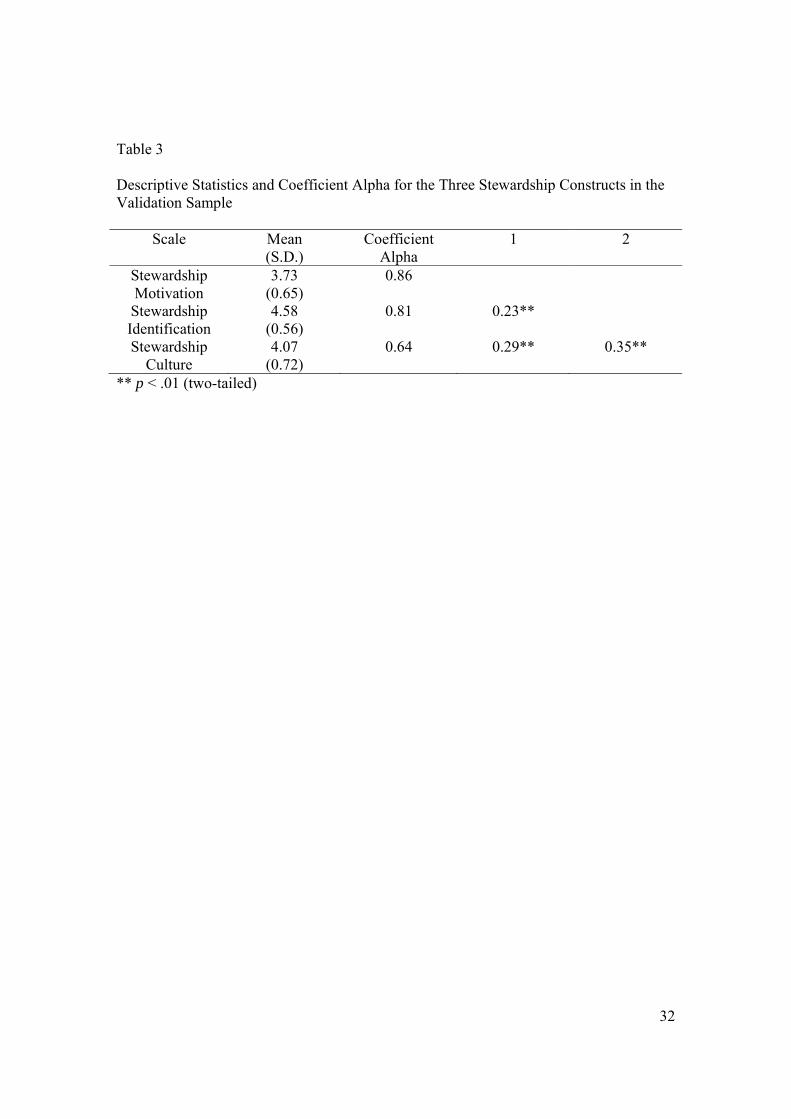
groups of 15 to 29 years (n = 55) and greater than 30 years (n = 107). Descriptive
statistics and corresponding coefficient alphas are presented in Table 3.
As common method variance is a concern in the use of mail surveys, the method
suggested by Harman (1967) was used. A factor analysis of all the items employed in the
study was conducted. If only one factor emerged, then this would suggest the potential
for common method bias. The factor analysis produced three factors, with the first factor
accounting for 37% of the 67% explained variance (Podsakoff & Organ, 1986). This

12
finding suggests common method bias is not a significant problem and should not
influence the results.
There is potential for confounding biases to emerge in the data when using single
respondents. In order to test for the prevalence of these biases, we attempted to check the
responses of our participants against an archival data source. To alleviate these concerns,
we drew upon recommendations by Feltham, Feltham, and Barnett (2005) by testing
single respondent answers to items to a broader population. If the results infer that the
single respondents from our sample are significantly different than the answers to the
same questions in the national survey, then there were would be a higher probability of
single respondent biases in our sample. We tested three items that were collected during
data collection but unrelated to this study and compared these responses to the same
responses from a national archival data source. Specifically, we asked respondents to
classify “to what extent your family has influence on your business”; “your family
members share similar values”; and “we agree with the family business goals, plans and
policies”. We then tested these three items against the same three items which were
collected in the publicly available 2002 Massachusetts Mutual Data (n = 1,104) survey of
US family businesses. Using independent sample t-tests, there were no significant
differences between the responses from our sample and the 2002 Massachusetts Mutual
survey responses. This finding suggests that the single respondents in our sample are
answering within the norms of the broader U.S. family business population and that the
biases associated with single respondents are mitigated.
Insert Table 3 about here
Confirmatory Factor Analysis

13
The reported coefficient alphas range for the three factors of motivation,
identification, and culture were α = 0.86, 0.81, and 0.64, respectively, which are above
the 0.60 range for exploratory research (Nunnally, 1978). Furthermore, the composite
reliability scores for the three different factors were 0.86, 0.82, and 0.65, respectively, as
reported in Table 4 (Baumgartner & Homburg, 1996, Fornell & Larcker, 1981).
A confirmatory factor analysis was conducted on results from the exploratory
analysis pilot test factor structure to test for the invariance of the factor structures across
samples. One item, ‘someone who is involved-oriented,’ was removed as it was deemed
to capture an individual respondent’s propensity for stewardship rather than the desired
stewardship governance constructs of stewardship motivation, stewardship identification,
and stewardship culture. Employing a two-phase confirmatory factor analysis approach
(Anderson & Gerbing, 1988), the reflective measures of the latent factors were first
tested. The results from the analysis, as found in Table 4, showed each indicator had a
standardized and significant factor loading ranging from 0.43 to 0.90 on their respective
latent constructs.
Insert Table 4 about here
Next, a series of sequential chi-square models were tested including a constrained
three factor model and the unconstrained three factor model. For the constrained three
factor model, the respective covariance relationships among the three latent factors were
set to 1. For the unconstrained three factor model, the latent factors were allowed to
covary. The unconstrained three factor model (χ2 =97.22; d.f. = 44; p = 0.0)
demonstrated the best overall model fit and was significantly better than the constrained

14
factor model (χ2 =379.41; d.f. = 41; p = 0.0) based on the examination of chi-square
differences (Δχ2 =282.19; d.f. = 3; p < 0.05).
To test for convergent and discriminant validities, we drew from the approach
recommended by Bagozzi et al. (1991). A review of the items loading on the three
factors is suggestive of convergent validity, as all items loaded at .43 or greater and had
statistically significant t-values (p < .05). To test for discriminant validity, the average
variance extracted (AVE) was calculated for each construct. The AVE indicates the
amount of variance which can be explained through the different factors and should be
0.50 or greater (Fornell & Larcker, 1981). The AVE results for the three different factors
are reported in table 4. Likewise, if the AVE is greater than the square of
intercorrelations among the different constructs, then the constructs illustrate discriminant
validity. None of the squared intercorrelations were greater than the reported AVEs,
indicating the three different factors demonstrated discriminant validity. Thus, based on
these results, the three constructs demonstrated convergent and discriminant validities.
Establishing Nomological Validity
To establish nomological validity, we drew inspiration from Corbetta and Salvato
(2004) who confirm that organisational outcomes such as innovativeness and financial
performance increase as stewardship behaviours flourish.
Innovativeness
Innovativeness is a staple dimension used in distinguishing a firm’s
entrepreneurial orientation (e.g., Covin & Slevin, 1989; Lumpkin & Dess, 1996; Miller &
Friesen, 1982). Innovativeness is typically defined as product innovation or process
innovation. Product innovation refers to the changes made to the existing products of the

15
organization or the new and breakthrough products that the organization produces while
process innovation refers to the changes made in the processes or technologies used by
the organization to deliver its products or services (Garcia & Calantone, 2002).
Innovativeness has further been defined as “the willingness to place strong emphasis on
research and development, new products, new services, improved product lines, and
general technological improvement in the industry” (Slevin & Covin, 1990: 43).
Innovations vary in complexity and can range from minor changes to existing products,
processes or services to breakthrough products, processes or services that introduce first-
time features or exceptional performance. Put simply, innovativeness can be described as
the process by which new products or new methods of production are introduced
(Baumol & Blinder, 2000). Product and process innovations allow firms to compete
aggressively, renew operations, create new revenue streams and improve shareholders'
value (Hitt et al., 1994).
Linking Stewardship to Innovativeness and Firm Performance
To link the developed stewardship constructs to innovativeness and firm
performance in our family firm context, we first correlated the three stewardship factors
with firm innovation (i.e., a four-item scale measuring the emphasis a firm places on
product and process innovations) (Dibrell & Craig, 2006) and firm financial performance
(i.e., a two-item scale capturing total sales growth and return on total assets relative to
other industry competitors) (Matsuno et al., 2002; Zahra et al., 2000). For firm
innovation, stewardship motivation (r = 0.15; p < 0.05; two-tailed test), stewardship
identification (r = 0.11; p < 0.10; two-tailed test), and stewardship culture (r = 0.36; p <

16
0.01; two-tailed test) demonstrated positive associations. Comparably, the three factors,
namely stewardship motivation (r = 0.28; p < 0.01; two-tailed test), stewardship
identification (r = 0.14; p < 0.05; two-tailed test), and stewardship culture (r = 0.37; p <
0.01; two-tailed test), were positively correlated with firm financial performance.
Given these results, we proceeded to conduct a series of linear regression
equations where the respective stewardship factors were regressed on firm innovation and
firm financial performance. For innovation, stewardship culture demonstrated the
greatest strength (b = 0.36; p < 0.001; two-tailed test; R2 = 0.129), followed by
stewardship identification (b = 0.18; p < 0.05; two-tailed test; R2 = 0.032) and
stewardship motivation (b = 0.17; p < 0 .05; two-tailed test; R2 = 0.027). The results
were stronger for firm financial performance with stewardship motivation (b = 0.28; p <
0 .001; two-tailed test; R2 = 0.079), stewardship identification (b = 0.16; p < 0.05; two-
tailed test; R2 = 0.026) and stewardship culture being the highest (b = 0.38; p < 0.001;
two-tailed test; R2 = 0.140) variance. The three factors of stewardship therefore
demonstrated nomological validity. Given these results, the final set of items to capture
stewardship is presented above in Table 4.
DISCUSSION AND IMPLICATIONS
Though contemporary family business scholars have increasingly identified the
appeal of stewardship theory, empirical researchers have been constrained by a lack of
direct measures of stewardship and have been forced to rely on proxies for stewardship.
Using these measures has limited the generalizability and acceptance of stewardship
theory as a way of explaining individual and firm behaviour. In this paper, we drew from

17
established theory to introduce a multi-factor measure of stewardship in family firms and
provided confirmation of the validity of the scale by establishing statistically significant
links to innovativeness and firm performance.
In developing a valid measure, we believe we have addressed a gap in the extant
literature, enabling future researchers to more confidently and directly test the effects of
stewardship on organisational outcomes. We have demonstrated that, since
entrepreneurial firms are characterized by their commitment to innovation, which further
stimulates firm growth (Covin & Slevin, 1991; Miller 1983; Zammuto & O’Connor,
1992), family leaders who design their organisational environments with stewardship-
rooted dimensions of motivation, identification and culture are likely to see benefit
through innovation and improved financial performance. Below we discuss how our
results contribute to our understanding of family business.
First, from a methodological viewpoint, we see several applications for the use of
the stewardship scale validated in this paper. Specifically, as called for by Ghoshal
(2005) and Ghoshal and Moran (1996), the scale can be used to address the controversies
related to stewardship theory’s bona-fides. Future scholars can use our measure in a wide
variety of settings to empirically verify the efficacy of models which have invoked
stewardship-based relationships. As well, the inclusive nature of the scale draws on
psychological and situational aspects of firm functioning and can be used to understand
the paradoxes of governance and control-collaboration tensions existing in firms
(Sundaramurthy & Lewis, 2003). For example, would the proposed benefits of a
stewardship setting be uniform across all environmental (e.g., high vs. low dynamism or
high versus low strategic uncertainty) or organisational (e.g. high vs. low risk-taking, or

18
high vs. low competitive aggressiveness) contexts? Does stewardship moderate the
relationship between firm strategy and performance? Finally, though the stewardship
scale may be particularly relevant for the study of entrepreneurial and family firms, the
scale can potentially help understand relationships in the context of different ownership
forms. For example, the scale can be used to understand different relationships within
different types of family firms (e.g., founder-led, multi-generational, active vs. passive
family involvement, private vs. publicly-held family firms).
Other avenues within the family business literature also exist. For example,
researchers have discussed the value creating benefits of stewardship approaches within
family businesses. Specifically, it has been suggested that stewarded firms should
promote and facilitate open channels of communication, decentralization and informal
decision making, loosely coupled decision linkages, flexible job descriptions, and
processes and procedures associated with various internal organisation activities
(Corbetta & Salvato, 2004, Eddleston & Kellermanns, 2007). Using this stewardship
scale in concert with other accepted measures that measure these phenomena will add to
our continued understanding of family firms.
Further, we suggest that the stewardship scale could be used to quantify
differences between family and non-family firms. Though there is increasing discussion
about apparent differences between family and non-family firms, the extent and nature of
the differences between the two types of firms is inconclusive (Bird et al., 2002; Sharma
2004; Zahra & Sharma, 2004). Salvato and Melin’s (2003) equifinality discussion
suggests that many firms, regardless of ownership structures and related factors, are good
at performing the same dynamic process (e.g., knowledge creation, serial

19
entrepreneurship, product innovation). A comparative research project using the
stewardship scale would demonstrate whether leaders of family firms are better equipped
than their non-family contemporaries to promote a stewardship environment.
LIMITATIONS
Operationalizing theoretical discussions is not without challenges, and we would
be remiss if we did not acknowledge the limitations of this research. First, though this
study drew from cross-sectional industrial data for the pilot test and then from a more
focused industry specific sample (validation study), the generalizability of the construct
could be a limitation of the stewardship scale. First, the scale is not generalisable to non-
family firms as non-family firms were not included in the testing procedures which refine
the scale. Second, many of the respondents employed less than 50 employees. Hence, the
generalizability of the scale may be constrained to small- to medium-sized firms. Further,
there may have been owners who self-classified themselves as CEOs, resulting in
potentially low-agency issues (Anderson & Reeb, 2003). It was our intent to capture a
wide variety of respondents from varied governance settings (i.e., CEO vs. Owner) within
family firms. The breadth of our respondents could in fact be considered a strength of
our measure.
Second, we acknowledge the criticisms associated with a single country sample
bias in our sample. A third associated limitation relates to the difficulty of developing a
scale to tap individual and firm level behaviours. In effect, we maintain family business
leaders with strong stewardship-centered beliefs will strive to foster strong, values-driven
cultures through stewardship-rooted initiatives. This conjecture enables us to overcome

20
the potential confusion stemming from the individual- and firm-level approach
introduced in Davis et al.’s original discussion.
Fourth, the use of self reported data and the well documented effects of single
respondent biases (e.g., Donaldson & Grant-Vallone, 2002) may have affected the
construction of our scale and the nomological findings. We did take efforts to mitigate
the concerns regarding self reported data by comparing our sample with a much larger
and cross-industry sample. Our results indicated that the responses to our items by single
respondents were comparable to those in the national larger population. Another
limitation is the use of a single industry and the generalisability of our findings to a
broader industry audience. Though the Massachusetts Mutual Data was collected cross-
industries, we caution against the application of our findings from a single industry (i.e.,
the food processing industry) to other industries which do not share similar attributes to
our studied industry.
Finally, our empirical findings of a three dimensional construct did not match
completely with Davis et al.’s (1997) six dimensions conceptualization. Some factors
disappeared while others collapsed into a single dimension (i.e., collectivistic culture and
use of power). Though the developed measure did demonstrate nomological validity via
links to innovation and firm performance, we acknowledge a different set of items may
map more directly on the conceptual dimensions, a factor which may encourage future
scholars to consider testing an alternative set of items.
CONCLUSION

21
By empirically linking stewardship behaviours to innovativeness and firm
performance, we have demonstrated that stewardship behaviours act as an effective
governance mechanism for family businesses. Further, we provide an important first step
in linking theory building with theory testing and conclude the stewardship scale is
positioned to play an important role in establishing alignment between stakeholder
groups within the family business and the vision and values of the leadership. The scale,
we hope, will also increase rigor and relevancy to future discussions. Future scholars are
encouraged to use this more direct measure of stewardship which, based on the results
presented above, is both reliable and valid.

22
REFERENCES
Anderson, J.C., & Gerbing, D.W. (1988). Structural equation modeling in practice: A
review and recommended two-step approach. Psychological Bulletin, 103, 411-
423
Anderson, R. C., & Reeb, D. M. (2004). Board composition: Balancing family influence
in S&P 500 firms. Administrative Science Quarterly, 49, 209-237.
Anderson, R. C. & Reeb, D. M. (2003). Founding-family ownership and firm
performance: evidence from the S&P 500. Journal of Finance, 58, 1301-1327.
Ang, J. S., Cole, R. A., & Lin, J. W. (2000). Agency costs and ownership structure.
Journal of Finance, 55, 81-106.
Arthurs J., & Busenitz, L. (2003). The boundaries and limitations of agency theory and
stewardship theory in the venture capitalist/entrepreneur relationship.
Entrepreneurship: Theory & Practice, 28(2), 145-162.
Bagozzi, R.P., Yi, Y., & Phillips, L.W. (1991). Assessing Construct Validity in
Organizational Research. Administrative Science Quarterly, 36, 421-458.
Baumgartner, H., & Homburg, C. (1996). Applications of structural equation modeling in
marketing and consumer research: A review. International Journal of Research in
Marketing, 13, 139-161.
Baumol, W. J., &. Blinder, A. S. (2000). Macroeconomics: Principles and Policy,
8th Edition, Fort Worth: The Dryden Press.
Berle, A., & Means, G. (1932). The modern corporation and private property. New
York: Macmillan.

23
Binder Hamlyn. (1994). The quest for growth: A survey of UK private companies,
London: Binder Hamlyn.
Bird, B., Welsch, H., Astrachan, J., & Pistrui, J. (2002). Family business research: The
evolution of an academic field. Family Business Review, 15(4): 337-350.
Carsrud, A. L. (1994). Meanderings of a resurrected psychologist, or lessons learned in
creating a family business program. Entrepreneurship Theory and Practice, 19,
39-48.
Churchill, G. A. (1979). A paradigm for developing better measures of marketing
constructs, Journal of Marketing, 16, 64-73.
Cooper, M. J., Upton, N. & Seaman, S. (2005). Customer relationship management: A
comparative analysis of family and nonfamily business practices. Journal of
Small Business Management, 43, 242-256.
Corbetta, G., & Salvato, C. (2004). Self-serving or self-actualizing? Models of man and
agency costs in different types of family firms: A commentary on “Comparing the
agency costs of family and non-family firms: Conceptual issues and exploratory
evidence. Entrepreneurship Theory and Practice, Summer, 355-362.
Covin, J. G., & Slevin, D. P. (1989). Strategic management in small firms in hostile and
benign environments. Strategic Management Journal, 10, 75-87.
Covin, J. G., & Slevin, D. P. (1991). A conceptual model of entrepreneurship as firm
behavior. Entrepreneurship: Theory & Practice, 16(1), 7-26.
Davis, G. F. (2005). New directions in corporate governence. Annual Review of
Sociology, 31, 143-162.

24
Davis, J. H., Schoorman, F. D., & Donaldson, L. (1997). Toward a stewardship theory of
management. Academy of Management Review, 22, 20–47.
Davis, J. H., Schoorman, F. D., Mayer, R., & Tan, H. (2000). The trusted general
manager and business unit performance. Strategic Management Journal, 21, 563-
576.
Demsetz, H. (1988). Ownership, control, and the firm. Vol 1. in The Organization of
Economic Activity Series. New York: Blackwell Publishing.
DeVellis, R. F. (1991). Scale development: theory and applications. Applied Social
Research Methods Series. Newbury Park: Sage.
Dibrell, C., & Craig, J. B. (2006). The natural environment, innovation, and firm
performance: A comparative study. Family Business Review, 21(4), 275-287.
Dicke, L. A., & Ott, J. S. (2002). A test: Can stewardship theory serve as a second
conceptual foundation for accountability methods in contracted human services?
International Journal of Public Administration, 25(4), 463–487.
Donaldson, L. (2002). Damned by our own theories: Contradictions between theories and
management education. Academy of Management Learning & Education, 1(1),
96-106.
Donaldson, L., & Davis, J. H. (1989). CEO governance and shareholder returns: Agency
theory or stewardship theory. Paper presented at the annual meeting of the
Academy of Management, Washington, DC.
Donaldson, L., & Davis, J. H. (1991). Stewardship theory or agency theory: CEO
governance and shareholder returns. Australian Journal of Management, 16(1),
49–64.

25
Donaldson, S. I. & Grant-Vallone, E. J. (2002). Understanding self-report bias in
organizational behavior research. Journal of Business & Psychology, 17: 245-260.
Eddleston, K. A. & Kellermanns, F. W. (2007). Destructive and productive family
relationships: A stewardship theory perspective. Journal of Business Venturing,
22, 545-565.
Eisenhardt, K. (1989). Agency theory: An assessment and review. Academy of
Management Review, 14(1), 57-74.
Fama, E., & Jensen, M. C. (1983). Separation of ownership and control. Journal of Law
Economics, 26, 301-325.
Feltham, T. S., Feltham, G. & Barnett, J. J. (2005). The dependence of family businesses
on a single decision-maker. Journal of Small Business Management, 43, 1–15.
Fornell, C. D., & Larcker, F. (1981). Evaluating structural equation models with
unobservable variables and measurement errors. Journal of Marketing Research,
18, 39-50.
Fox, M. A., & Hamilton, R. T. (1994). Ownership and diversification: Agency theory or
stewardship theory. Journal of Management Studies, 31, 69–81.
Garcia, R., & Calantone, R. (2002). A critical look at technological innovation typology
and innovativeness terminology: A literature review. The Journal of Product
Innovation Management 19, 110-132.
Ghoshal, S. (2005). Bad management theories are destroying good management
practices. Academy of Learning & Education, March, 73-91.
Ghoshal, S., & Moran, P. (1996). Bad for practice: A critique of transaction cost theory.
Academy of Management Review, 21, 31-47.

26
Hair, J. F., Jr., Anderson, R. E., Tatham, R. L., & Black, W. C. (1995). Multivariate data
analysis with readings (4th Ed.). Upper Saddle River, NJ: Prentice Hall.
Hambrick, D. C., Geletkanycz, M. A., & Fredrickson, J. W. (1993). Top executive
commitment to the status quo: Some tests of its determinants. Strategic
Management Journal, 14, 401-418
Hitt, M., Hoskinson, R., & Ireland. R. (1994). A mid-range theory of the interactive
effects of international and product diversification on innovation and
performance. Journal of Management, 20(2), 297-326.
Hirsh, P., Michaels, S., & Friedman, R. (1987). “Dirty hands” versus “clean models.”
Theory and Society, 16, 317-336.
Hofstede, G. (1991). Cultures and organizations: Software of the mind. London:
McGraw-Hill.
Jensen, M. C., & Meckling, W. H. (1976). Theory of the firm: Managerial behavior,
agency costs, and ownership structure. Journal of Financial Economics, 3, 305-
360.
Kanuk, L., & Berenson, C. (1975). Mail surveys and response rates: A literature review.
Journal of Marketing Research, 12, 440-453.
Lumpkin, G. T., & Dess, G. G. (1996). Clarifying the entrepreneurial orientation
construct and linking it to performance. Academy of Management Review, 21(1),
135-172.
Matsuno, K., Mentzer, J. T., & Özsomer, A. (2002). The Effects of Entrepreneurial
Proclivity and Market Orientation on Business Performance. Journal of
Marketing, 66(3), 18-32.

27
Miller, D. (1983). Entrepreneurship correlates in three types of firms. Management
Science, 29, 770-791.
Miller, D., & Friesen, P. H. (1982). Innovation in conservative and entrepreneurial firms:
Two models of strategic momentum. Strategic Management Journal, 3, 1-25.
Miller, D., & Le Breton-Miller, I. (2006). Family governance and firm performance:
Agency, stewardship, and capabilities, Family Business Review, XIX(1), 73-87.
Nunnally, J. C. (1978). Psychometric theory. New York: McGraw Hill.
Podsakoff, P. M., & Organ, D.W. (1986). Self-reports in Organization research: Problems
and prospects, Journal of Management, 12, 531-544.
Porter, L. W., Steers, R. M., Mowday, R. T., & Boulian, P. V. (1974). Organizational
commitment, job satisfaction, and turnover among psychiatric technicians.
Journal of Applied Psychology, 5, 803-609.
Powell, T. C. 1996 How much does industry matter? An alternative empirical test.
Strategic Management Journal, 17, 323-334.
Ram, M., & Holliday, R. 1993 Relative merits: Family culture and kinship in small firms.
Sociology, 27, 629 648.
Salant, P., & Dillman, D. A. (1994). How to conduct your own survey. New York: John
Wiley & Sons.
Salvato, C., & Melin, L. (2003). Competitive advantages of family businesses: A
dynamic capabilities perspective. New Perspectives in Family Firm Research,
IFERA Conference, Laussane.

28
Schulze, William S., Lubatkin, M. H., Dino, R. N., & Buchholtz, A. K. (2001). Agency
relationships in family firms: Theory and evidence, Organization Science, 12(2),
99-116.
Sharma, P. (2004). An overview of the field of family business studies: Current status
and directions for the future’ Family Business Review, 17(1):1-36.
Slevin, D. P., & Covin, J. G. (1990). Juggling entrepreneurial style and organizational
structure - How to get your act together. Sloan Management Review, 31(2), 43-54.
Sundaramurthy, C., & Lewis, M. (2003). Control and collaboration: Paradoxes of
governance. Academy of Management Review, 28, 397–415.
Teece, D., Pisano, G., & Schuen, A. (1997). Dynamic capabilities and strategic
management. Strategic Management Journal, 18, 509-533.
Tosi, H. L., Brownlee, A. L., Silva, P., & Katz, J. P. (2003). An empirical exploration of
decision-making under agency controls and stewardship structure. Journal of
Management Studies, 40, 2053–2071.
Wasserman, N. (2006). Stewards, agents, and the founder discount: Executive
compensation in new ventures. Academy of Management Journal, 49(5), 960-976.
Westhead, P., & Cowling, M. (1998). Family firm research: The need for a
methodological rethink,” Entrepreneurship Theory and Practice, 23, 31-56.
Zammuto, R., & E. O’Connor. (1992). Gaining advanced manufacturing technologies
benefits: The role of organizational design and culture. Academy of Management
Review, 17, 701-728.
Zahra, S. A., & Sharma, P. (2004). Family business research: A strategic reflection,
Family Business Review, 17(4): 331-346.

29
Zahra, S.A., Neubaum, D. O., & Huse, M. (2000). Entrepreneurship in medium-size
companies: Exploring the effects of ownership and governance systems, Journal
of Management, 26, 947-976.
Zahra, S. A., Hayton, J. C., Neubaum, D. O., & Craig, J. B. (2008). Culture of family
commitment and strategic flexibility: The moderating effect of stewardship.
Entrepreneurship Theory and Practice. November, 1035-1054.

30
Table 1 Expert panel items across the 6 dimensions of Stewardship
Dimension Question Individual/Psychological To what extent….. Intrinsic Motivation …do you see yourself as someone who is motivated by
individual goals Intrinsic Motivation …do you see yourself as someone whose role it is to manage
the family’s investments Intrinsic Motivation …do you see yourself as someone whose personal motives
are aligned with the business Intrinsic Motivation …does your business satisfy your personal needs Intrinsic Motivation …does your business satisfy your opportunities for growth Intrinsic Motivation …does your business satisfy your need for achievement Intrinsic Motivation …does your business make you feel self-actualized Organisational Identification …do you see yourself as an integral part of the business Organisational Identification …do you see yourself as believing in the goals of the
company Organisational Identification …do you see yourself as accepting the goals of the company Organisational Identification … does your business contribute to your self image Personal Power …do you see yourself as someone who uses personal power
to influence others Personal Power …do you see yourself as someone who uses institutional
power to influence others Organisational/Situational To what extent….. Involvement Orientation …do you see yourself as one who maximizes potential Involvement Orientation …do you see yourself as one who should minimize potential
costs Involvement Orientation …do you see yourself as someone who is involvement-
orientated Involvement Orientation …do you see yourself as someone who is control-orientated Involvement Orientation …does your business monitor your performance Power Distance …does your business delegate your authority on its behalf Power Distance …does your business promote a hierarchical structure with
many layers of supervision Collectivism …does your business pay higher than industry average
wages Collectivism …does your business allow employees to reach their full
potential Collectivism …does your business promote flexible work practices Collectivism …does your business encourage a collectivist rather than an
individualistic culture
31
Table 2 Results of Principal Components Analysis from Pilot Test
Items
Factor 1
(Stewardship Motivation)
Factor 2
(Stewardship Identification)
Factor 3
(Stewardship Culture)
Make you feel self-actualized
0.88 0.23 0.12
Satisfy your need for achievement
0.84 0.29 0.27
Satisfy your personal needs
0.82 0.16 0.17
Satisfy your opportunities for growth
0.77 0.11 0.38
Contribute to your individual self-image
0.72 0.14 -0.10
An integral part of the business
0.07 0.78 0.08
Accepting the goals of the company
0.28 0.77 0.23
Believing in the goals of the company
0.23 0.73 0.30
Pay higher than industry average wages
0.07 0.10 0.80
Allow employees to reach their full potential
0.28 0.17 0.79
Inspire employees care and loyalty
0.10 0.25 0.75
Eigen Values 3.59 2.57 2.26 Percent of Variance Explained 29.9 21.4 18.8
32
Table 3 Descriptive Statistics and Coefficient Alpha for the Three Stewardship Constructs in the Validation Sample
Scale Mean (S.D.)
Coefficient Alpha
1 2
Stewardship Motivation
3.73 (0.65)
0.86
Stewardship Identification
4.58 (0.56)
0.81 0.23**
Stewardship Culture
4.07 (0.72)
0.64 0.29** 0.35**
** p < .01 (two-tailed)

33
Table 4 Results of Confirmatory Factor Analysis using Validation Study
Indicators
Completely Standardized Loadings for Stewardship Motivation (t-value)
Completely Standardized Loadings for Stewardship Identification
(t-value)
Completely Standardized Loadings for Stewardship
Culture (t-value)
Composite Reliability
(AVE)
Satisfy your need for achievement
0.86 (13.69)
0.86 (.56)
Satisfy your personal needs
0.80 (12.30)
Satisfy your opportunities for growth
0.76 (11.42)
Contribute to your self image
0.73 (10.81)
Make you feel self-actualized
0.57 (10.81)
Believing in the goals of the business
0.90 (13.46)
0.82 (.61)
An integral part of the business
0.73 (10.42)
Accepting the goals of the business
0.70 (9.87)
Allow employees to reach their full potential
0.76 (8.43)
0.65 (.39)
Inspire employees care and loyalty
0.64 (7.36)
Pay higher than industry average wages
0.43 (5.05)
Model Fit Statistics: χ2 = 97.22 (d.f. = 41, p < 0.001); CFI = 0.95; Delta2 = 0.95; RNI = 0.95; RMSEA = 0.087; NNFI = 0.94; GFI = 0.91.
![Japan’s Stewardship Code and Japan’s Corporate Governance Code · 2017-03-13 · Japan’s Stewardship Code and Japan’s Corporate Governance Code December 22, 2015 [Ikeo, Chairman]](https://img.dokumen.tips/doc/110x75/5f90a50a670cf42f0354242f/japanas-stewardship-code-and-japanas-corporate-governance-code-2017-03-13.jpg)