Embed Size (px)
DESCRIPTION
Consumer-Driven Health Plans: Early Cost & Use Evidence with a Focus on Pharmaceuticals & Hospital Admissions. Stephen T Parente Roger Feldman Jon B Christianson August , 2004. Questions to be Addressed. Are CDHP pharmacy and hospital expenditures different from other health plan types? - PowerPoint PPT Presentation
Citation preview
Consumer-Driven Health Plans: Early Cost & Use Evidence with a Focus on Pharmaceuticals & Hospital Admissions
Stephen T Parente
Roger FeldmanJon B Christianson
August, 2004

Questions to be Addressed Are CDHP pharmacy and hospital
expenditures different from other health plan types?
Is there a CDHP pharmacy utilization effect? Brand vs. generic Chronic patients
Is there a CDHP hospital use effect? Elective admissions Emergency admissions

Why Focus on Pharmacy?
Fastest rising cost sector of health economy
Recent innovations in both CDHP and non-CDHP marketplace Non-CDHP: 3-tier consumer payment CDHP: Consumer prices vary by
employee/patient total expenditure level CDHP ‘shopping’ tools are most
advanced for pharmacy market
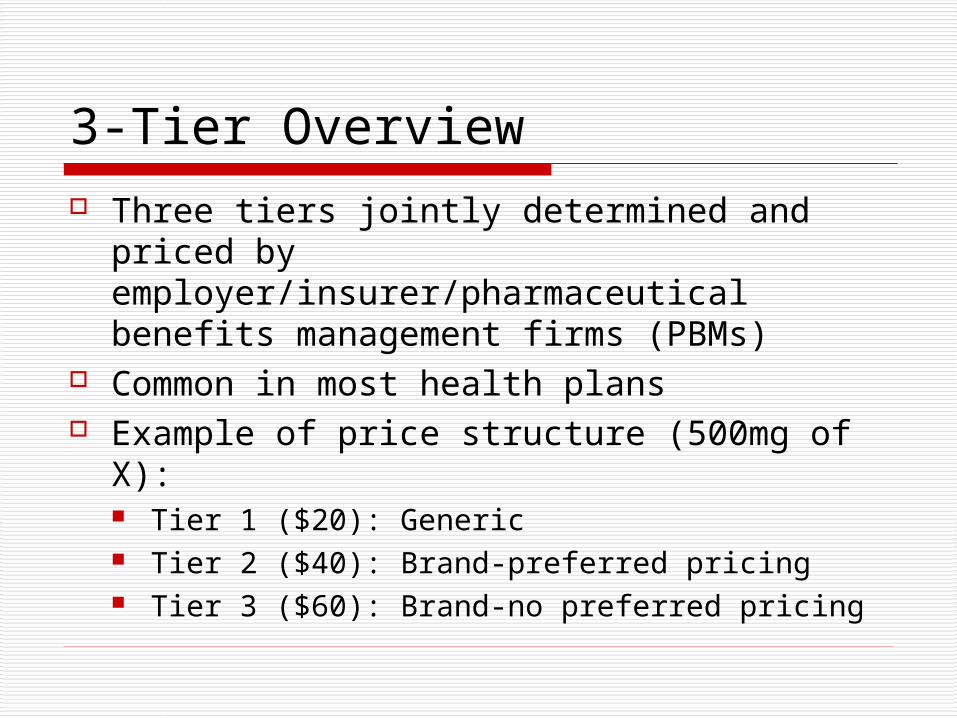
3-Tier Overview Three tiers jointly determined and
priced by employer/insurer/pharmaceutical benefits management firms (PBMs)
Common in most health plans Example of price structure (500mg of X):
Tier 1 ($20): Generic Tier 2 ($40): Brand-preferred pricing Tier 3 ($60): Brand-no preferred pricing

Definity Health as CDHP Model
Definity Definity HealthHealthCareCare
AdvantageAdvantage
Web- and Web- and Phone-Phone-Based Based ToolsTools
Health ToolsHealth Toolsand Resourcesand Resources
Health Tools and Resources• Care management
program• Internet enables
Health Coverage• Preventive care covered
100%• Annual deductible• Expenses beyond the
PCA
Personal Care Account (PCA)• Employer allocates PCA1
• Member directs PCA• Roll over at year-end • Apply toward deductible2
Annual Annual DeductibleDeductible
Annual Annual DeductibleDeductible
Pre
ven
tive
Care
10
0%
Pre
ven
tive
Care
10
0%
Health Health CoverageCoverage
An
nu
al
Ded
uct
ible
1 Employer selects which expense apply toward the Health Coverage annual deductible.2 Paid out of employer’s general assets.
PCAPCAPCAPCA
$$

Study Setting Large employer that offered HMO and PPO
in 2000-2002 and introduced CDHP in 2001
Variation in cost sharing by health plan CDHP take-up rate of approximately 15% General caveat: Employer’s experience can
be quite different due to: Alternatives offered Plan design Communications with employees Sponsor’s objectives for the plan

Presentation of Results Results are limited to employees who worked for the
firm continuously for three years (2000-2002) and:1. Employee chose the CDHP in 2001 and 2002, or2. Employee chose another health plan in 2001
and 2002. This limitation removed 40% to 50% of all employees
from the analysis We want to see both adoption and maturing impact of
CDHP while controlling for prior spending 2000: Pre-CDHP experience controls for prior
spending 2001: CDHP adoption year 2002: CDHP ‘maturation’ year

Impact of CDHP on pharmacy cost
Health Plan Cohorts MeanDeviationMean Mean
CDHP Cohort N=531Hospital Expenditure 1,369.97$ 1,999.25$ 3,468.53$ Physician Expenditure 2,093.70$ 2,935.84$ 3,510.83$ Pharmacy Expenditure 935.29$ 1,103.72$ 1,341.78$
HMO Cohort N=1,551Hospital Expenditure 1,842.80$ 1,796.37$ 1,956.83$ Physician Expenditure 2,381.08$ 2,959.90$ 3,088.22$ Pharmacy Expenditure 1,107.64$ 1,498.54$ 1,640.25$
PPO Cohort N=1,554Hospital Expenditure 1,779.06$ 2,049.76$ 2,367.17$ Physician Expenditure 2,245.22$ 2,834.32$ 3,294.47$ Pharmacy Expenditure 1,007.95$ 1,484.91$ 1,789.26$
Year 2000 Year 2001 Year 2002
NOTE: THESE RESULTS ARE NOT CASE-MIX ADJUSTED, are from a restricted continuously enrolled sample of ~60% of the employee population, and do not reflect the plans’ full prescription drug experience.

Impact of CDHP on general pharmacy use
2000 2001 2002Health Plan Cohorts Mean Mean Mean
CDHP Cohort N=531Physician Visits 5.74 7.49 7.15Hospital Admission Rate 0.05 0.10 0.16Prescriptions Filled 16.01 19.46 20.21
HMO Cohort N=1,551Physician Visits 6.75 7.56 7.29Hospital Admission Rate 0.07 0.06 0.09Prescriptions Filled 17.27 18.77 20.03
PPO Cohort N=1,554Physician Visits 5.78 6.54 6.95Hospital Admission Rate 0.07 0.07 0.11Prescriptions Filled 20.92 23.15 21.28
NOTE: THE PHARMACY RESULTS ARE NOT CASE-MIX ADJUSTED, are from a restricted continuously enrolled sample of ~60% of the employee population, and do not reflect the plans’ full prescription drug experience.

Are CDHP cost and general pharmacy use different?
CDHP cohort has lowest pharmaceutical expenditure over time.
CDHP cohort has lower pharmacy use over time than PPO, but higher than HMO.
Consumer-driven component could work for pharmacy.

Is brand name pharmacy use different for CDHP enrollees?
2000Health Plan Cohorts Mean Mean % Mean %
change change
CDHP Cohort N=531Brand Prescriptions Filled 7.90 10.23 29% 10.74 5%Generic Prescriptions Filled 8.11 9.24 14% 9.46 2%All Prescriptions Filled 16.01 19.46 22% 20.21 4%
HMO Cohort N=1,551Brand Prescriptions Filled 7.63 9.09 19% 9.84 8%Generic Prescriptions Filled 9.64 9.68 0% 10.19 5%All Prescriptions Filled 17.27 18.77 9% 20.03 7%
PPO Cohort N=1,554Brand Prescriptions Filled 11.11 13.06 18% 12.29 -6%Generic Prescriptions Filled 9.81 10.09 3% 8.98 -11%All Prescriptions Filled 20.92 23.15 11% 21.28 -8%
2001 2002
NOTE: THESE RESULTS ARE NOT CASE-MIX ADJUSTED, are from a restricted continuously enrolled sample of ~60% of the employee population, and do not reflect the plans’ full prescription drug experience.

Is there a difference in pharmacy use for CDHP patients with chronic conditions?
Percent 2000Health Plan Cohorts Sample Mean Mean % Mean %
change change
CDHP Cohort N=531Chronic Patient Scripts 41% 31.28 33.69 8% 30.45 -10%Non-Chronic Patient Scripts 59% 9.60 12.41 29% 13.02 5%All Patient Scripts 16.01 19.46 22% 20.21 4%
HMO Cohort N=1,551Chronic Patient Scripts 36% 33.81 32.92 -3% 32.89 0%Non-Chronic Patient Scripts 64% 10.08 11.05 10% 12.65 14%All Patient Scripts 17.27 18.77 9% 20.03 7%
PPO Cohort N=1,554Chronic Patient Scripts 46% 37.34 36.87 -1% 31.39 -15%Non-Chronic Patient Scripts 53% 11.58 13.22 14% 12.60 -5%All Patient Scripts 20.92 23.15 11% 21.28 -8%
2001 2002
NOTE: THESE RESULTS ARE NOT CASE-MIX ADJUSTED, are from a restricted continuously enrolled sample of ~60% of the employee population, and do not reflect the plans’ full prescription drug experience.

Are there more specific differences in CDHP pharmacy use?
The CDHP & HMO had consistent increases in use of both generic and brand name drugs, whereas the PPO had across-the-board decrease in 2002.
The CDHP chronic condition cohort had higher drug use in 2001, but a decrease in 2002.
The biggest decrease in chronically ill patient drug use occurred in the PPO.

CDHP Specific Drug Case Studies:Lipitor & ViagraHealth Plan Cohorts Mean Mean % Mean %
change change
CDHP Cohort N=531Lipitor Prescriptions 0.24 0.46 93% 0.70 53%Lipitor Out of Pocket $$ 3.77$ 3.73$ -1% 6.51$ 74%Viagra Prescriptions 0.02 0.04 75% 0.05 19%Viagra Out of Pocket $$ 0.56$ -$ -100% -$ 0%
HMO Cohort N=1,551Lipitor Prescriptions 0.30 0.38 28% 0.57 50%Lipitor Out of Pocket $$ 3.77$ 6.82$ 81% 13.75$ 101%Viagra Prescriptions 0.05 0.07 44% 0.11 65%Viagra Out of Pocket $$ 1.17$ 1.69$ 43% 3.19$ 89%
PPO Cohort N=1,554Lipitor Prescriptions 0.52 0.81 56% 89% 10%Lipitor Out of Pocket $$ 7.83$ 13.24$ 69% 18.40$ 39%Viagra Prescriptions 0.06 0.08 41% 0.10 24%Viagra Out of Pocket $$ 1.49$ 1.85$ 24% 2.35$ 27%
NOTE: THESE RESULTS ARE NOT CASE-MIX ADJUSTED, are from a restricted continuously enrolled sample of ~60% of the employee population, and do not reflect the plans’ full prescription drug experience.

Does the CDHP affect use and patient expenditure for popular Rx?
Lipitor HMO and PPO: Use goes up as price goes up CDHP: Decrease in patient price accompanied
by a small increase in Lipitor use Viagra
HMO and PPO: Use also increases with price CDHP: Viagra use increases, but the out of
pocket expense is nil, suggesting that it may be purchased explicitly from the PCA or after the deductible is met.
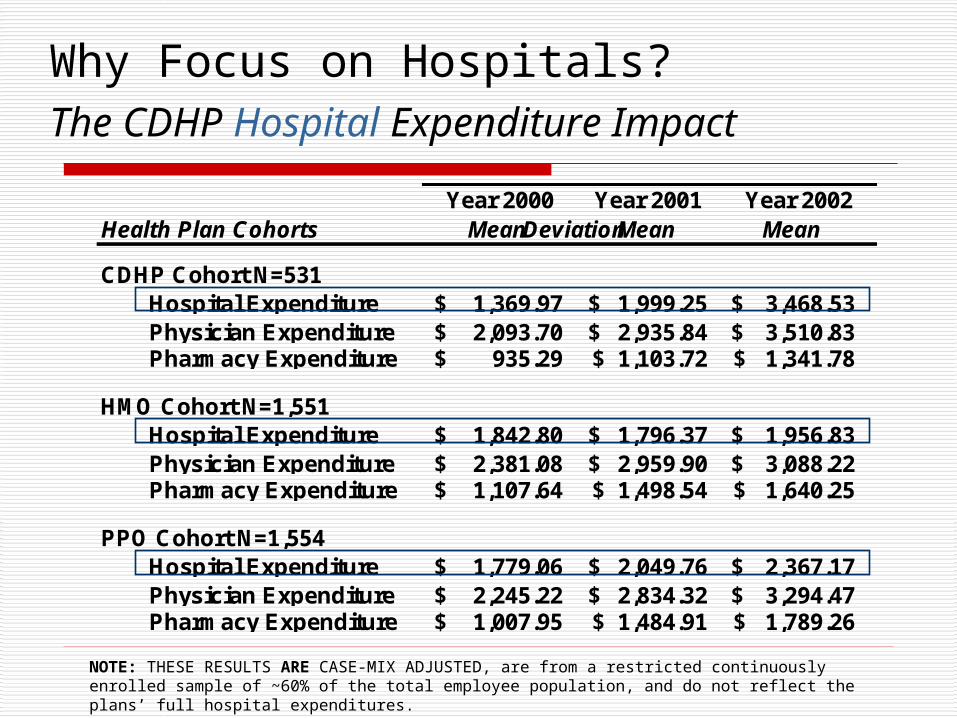
Why Focus on Hospitals?The CDHP Hospital Expenditure Impact
NOTE: THESE RESULTS ARE CASE-MIX ADJUSTED, are from a restricted continuously enrolled sample of ~60% of the total employee population, and do not reflect the plans’ full hospital expenditures.
Health Plan Cohorts MeanDeviationMean Mean
CDHP Cohort N=531Hospital Expenditure 1,369.97$ 1,999.25$ 3,468.53$ Physician Expenditure 2,093.70$ 2,935.84$ 3,510.83$ Pharmacy Expenditure 935.29$ 1,103.72$ 1,341.78$
HMO Cohort N=1,551Hospital Expenditure 1,842.80$ 1,796.37$ 1,956.83$ Physician Expenditure 2,381.08$ 2,959.90$ 3,088.22$ Pharmacy Expenditure 1,107.64$ 1,498.54$ 1,640.25$
PPO Cohort N=1,554Hospital Expenditure 1,779.06$ 2,049.76$ 2,367.17$ Physician Expenditure 2,245.22$ 2,834.32$ 3,294.47$ Pharmacy Expenditure 1,007.95$ 1,484.91$ 1,789.26$
Year 2000 Year 2001 Year 2002

Elective vs. Emergency Admission RatesCase-mix adjusted
NOTE: THESE RESULTS ARE CASE-MIX ADJUSTED and are from a restricted continuously enrolled sample of ~60% of the employee population, and do not reflect the plans’ full prescription drug experience.
2000Health Plan Cohorts Mean Mean % Mean %
change change
CDHP Cohort N=531High probability elective 0.01 0.03 130% 0.03 -18%High probability emergency 0.02 0.03 43% 0.05 58%Elective/emergency ratio 0.64 1.04 61% 0.54 -48%
HMO Cohort N=1,551High probability elective 0.01 0.01 -16% 0.02 136%High probability emergency 0.02 0.02 -20% 0.03 49%Elective/emergency ratio 0.39 0.41 5% 0.65 59%
PPO Cohort N=1,554High probability elective 0.01 0.01 -20% 0.02 103%High probability emergency 0.02 0.02 -17% 0.04 133%Elective/emergency ratio 0.41 0.39 -3% 0.34 -13%
2001 2002

Is there a CDHP hospital use effect? Elective admissions
At baseline, CDHP elective admissions are the same as HMO and PPO.
In all periods of operation (2001 & 2002), CDHP had the highest use of elective admissions.
CDHP was only cohort to ever have more elective than emergency admissions (in 2001).
HMO had largest percentage increase in elective admissions (136%) by end of period.
Emergency admissions CDHP had the highest emergency admission rate by
the end of the study period. PPO and HMO had same admission rate at first, but
emergency admission rate jumped 133% in 2002 for the PPO.

Summary
CDHP pharmacy expenditures are less than HMO and PPO.
CDHP chronic condition cohort drug use is a mixed story – initial increase followed by decrease in 2nd year.
Brand name drug use higher in CDHP, but overall cost is lower. Suggests 3-tier model may not be very effective in comparison if pharmaceutical expenditures are less and brand consumption is higher.
Pent-up demand may be present in the CDHP population with largest percent changes in uses of elective admissions.
CDHP population emergency admission rate highest by end of study period. Suggests high CDHP hospital expenditure may be for more serious illnesses. Could also suggest a care coordination/quality concern too.

Implications for HSAs Priors & Assumptions:
Definity Health is a Health Reimbursement Account (HRA), not a Health Savings Account (HSA).
HSAs should make the consumers conserve their expenditures more than HRAs because the year-end account balances are a real personal asset in HSA.
Implications: Assuming HRAs are a less restrictive form of health insurance than HSAs,
our results show that the plans have the potential to restrict expenditure growth more than a PPO.
New HSA-hybrid providing just a drug benefit may provide the same access to needed medications and less cost than the standard 3-tiered pharmaceutical benefit.
Extensions: Need to explicitly account for differences income to see policy impact of
Bush Administration’s proposals to (as stated on 9/2/2004): “offer a tax credit to encourage small businesses and their employees
to set up health savings accounts” “provide direct help for low-income Americans to purchase them
(HSAs)” We were have started a contract from DHHS to provide a micro-
simulation to provide cost estimates for tax credits and possibly vouchers for low-income Americans to purchase HSAs.

Next Steps Examine other employers’ data for
comparison. Examine three years of CDHP data. Compare with other CDHPs (e.g., Blue Cross,
Destiny Health, United Healthcare’s iPlan). Examine relationship between admissions and
pharmacy use for specific chronic illnesses where drug consumption is critical to treatment (e.g., depression, heart disease, epilepsy) and emergency hospital admissions are quality signals.