Embed Size (px)
Citation preview

Health Insurance Demand Responses from New Price Structures Offered by Consumer Directed Health Plans
Stephen T Parente$,#
Roger Feldman#
Jean Abraham#
Jon B Christianson#
University of Minnesota Department of Finance$ and Division of Health Policy and Management#
Funded by the Robert Wood Johnson Foundation Health Care Financing and Organization Initiative (HCFO) and the Department of Health and Human Services

Presentation Overview Consumer Driven Health Plan
Overview Research Questions Data & Analytic Approach New (and early) Plan Choice
Estimation Elasticity Results Limitations Summary Next Steps

‘Classic’ CDHP Model – Definity Health
Definity Definity HealthHealthCareCare
AdvantageAdvantage
Web- and Web- and Phone-Phone-Based Based ToolsTools
Health ToolsHealth Toolsand Resourcesand Resources
Health Tools and Resources• Care management
program• Internet enabled
Health Coverage• Preventive care covered
100%• Annual deductible• Expenses beyond the
HRA
Health Reimbursement Account (HRA)• Employer allocates HRA1
• Member directs HRA• Roll over at year-end • Apply toward deductible2
Annual Annual DeductibleDeductible
Annual Annual DeductibleDeductible
Pre
ven
tive
Care
10
0%
Pre
ven
tive
Care
10
0%
Health Health CoverageCoverage
An
nu
al
Ded
uct
ible
1 Employer selects which expense apply toward the Health Coverage annual deductible.2 Paid out of employer’s general assets.
HRAHRAHRAHRA
$$

Economic Analysis Motivation ‘Donut hole’ and savings account are new
‘prices’ to consider in the demand for health insurance with expected negative and positive responses, respectively.
Price sensitivity to different benefit options (i.e., premium, account, donut, coinsurance) could significantly affect take-up of CDHPs.
Builds on existing literature of high deductible health plans (HDHPs) (Keeler, Newhouse, Phelps, 1977). CDHPs (and in particular HSAs) introduce a new kink in the budget constraint.

Conceptual Model of CDHPMoney
Medical Care
CDHP Budget
CoinsurancePlan Budget
b
a
c
Low Use Medium Use High Use
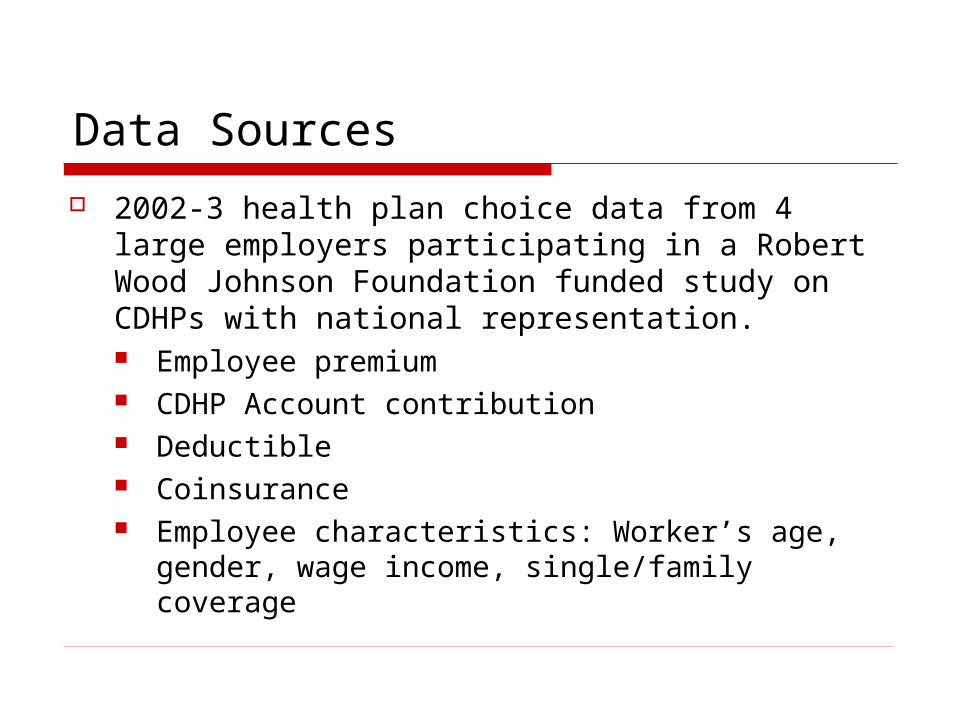
Data Sources
2002-3 health plan choice data from 4 large employers participating in a Robert Wood Johnson Foundation funded study on CDHPs with national representation. Employee premium CDHP Account contribution Deductible Coinsurance Employee characteristics: Worker’s age,
gender, wage income, single/family coverage

Plan Choice Model Analytic Approach Plan Choices: HMO, 3 PPOs (low, medium, high), 3
CDHPs with Health Reimbursement Accounts (low and high)
Utility-maximization assumption where Uhj = j + Zj + Xhj + ehj
Estimate a conditional logit model of plan choice using the pooled, employer data
Explanatory variables Plan attributes (Z)
Annual tax-adjusted employee premium ($1000s dollars) Savings/reimbursement account size ($1000s dollars) Donut hole: difference between annual deductible and
account size ($1000s dollars) Coinsurance rate (i.e., .10 = 10% coinsurance)
Interactions between employee and plan attributes (X) Age, female, wage income, family contract
Plan-specific constants (j )

Plan Choice – Descriptive Statistics
Total Low CDHP Medium CDHP High CDHP HMO Low PPO Med PPO High PPO
Observations 70,207 802 478 4,585 16,582 11,397 29,357 7,006
Employee Premium in $1,000 0.653 0.406 0.509 0.687 0.317 0.507 0.729 1.381
Health Account in $1,000 0.108 1.308 1.231 1.299 -- -- -- --
Donut Hole in $1,000 0.157 1.939 1.523 0.666 -- 0.232 0.055 0.201
Coinsurance 0.060 0.064 0.120 0.054 0.041 0.032 0.067 0.119
Female, 1=female, 0 else 0.371 0.367 0.249 0.351 0.422 0.328 0.344 0.452
Age (scaled in 100 years) 0.437 0.432 0.411 0.428 0.426 0.422 0.454 0.427
Income in $1,000 61.30 67.64 76.287 80.51 54.32 58.428 64.565 54.522
Family contract=1, else 0 0.497 0.420 0.452 0.566 0.469 0.541 0.488 0.494
Chronic illness, 1=yes, else 0 0.538 0.425 0.349 0.354 0.581 0.568 0.622 0.184
Notes: Chronic illness measure is for the household. Income is wage income.

Price elasticity estimates from the plan choice Model 1: Use only prices and plan effects
PriceVariable Elasticity
Coinsurance (e.g., 15% = .15) -0.7881
Tax adjusted Employee Premium in $1,000 -0.0963
Employee's Health Account in $1,000 0.3832
∆ Between Deductible and Health Account in $1,000 -0.2537

Price elasticity estimates from the plan choice Model 2: Add income, dependents,
gender, age
PriceVariable Elasticity
Coinsurance (e.g., 15% = .15) -0.8017
Tax adjusted Employee Premium in $1,000 -0.1170
Employee's Health Account in $1,000 0.7340
∆ Between Deductible and Health Account in $1,000 -0.4233

Price elasticity estimates from the plan choice Model 3: Add health status and interact w/prices
PriceVariable Elasticity
Coinsurance (e.g., 15% = .15) -0.8035
Tax adjusted Employee Premium in $1,000 -0.4301
Employee's Health Account in $1,000 0.8307
∆ Between Deductible and Health Account in $1,000 -0.4846

Results from full plan choice model Compared to a low option PPO:
Age affects Positive High option PPO effect Negative CDHP effect
Income effects CDHP has greatest positive relationship All plans are positive compared to low option PPO
Gender effects Positive High option PPO effect Negative CDHP effect
Chronic illness effects CDHP has greatest and large positive relation High option PPO has negative effect
Family coverage effects Negative relationships across the board compared to low option PPO. Strongest negative effect in low-option PPO.
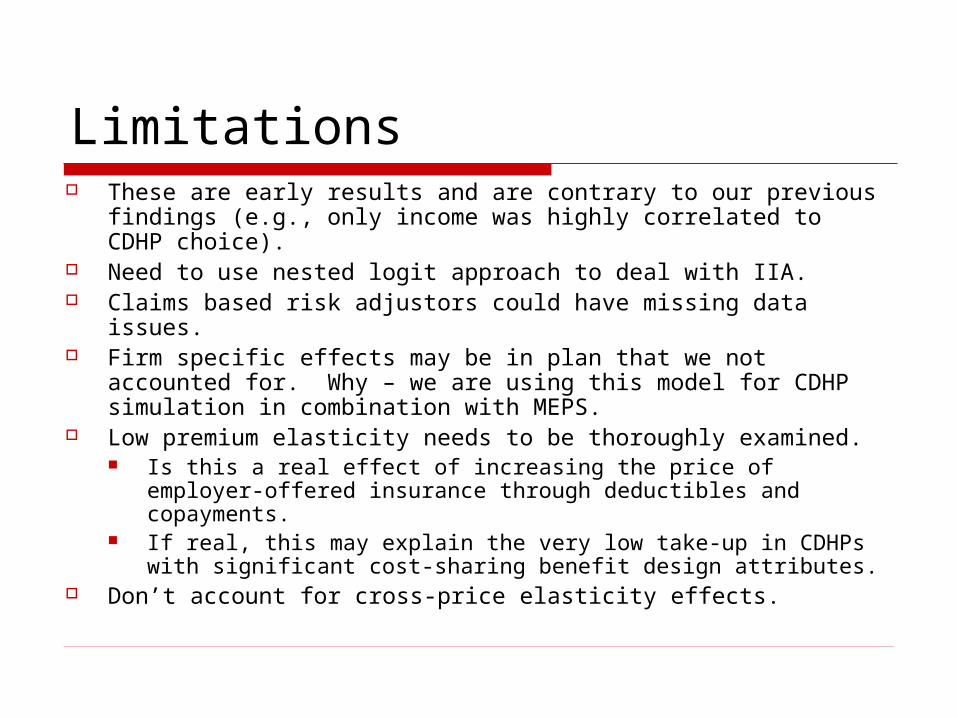
Limitations These are early results and are contrary to our previous
findings (e.g., only income was highly correlated to CDHP choice).
Need to use nested logit approach to deal with IIA. Claims based risk adjustors could have missing data
issues. Firm specific effects may be in plan that we not accounted
for. Why – we are using this model for CDHP simulation in combination with MEPS.
Low premium elasticity needs to be thoroughly examined. Is this a real effect of increasing the price of employer-
offered insurance through deductibles and copayments. If real, this may explain the very low take-up in CDHPs
with significant cost-sharing benefit design attributes. Don’t account for cross-price elasticity effects.

Summary Premium, coinsurance and Donut can and
ALL should be modeled when looking at CDHPs.
They produce different and significant effects. Across the largest set of employers examined
to date, we evidence of some favorable election to CDHPs in with respect to age, but not chronic illness.
Policy proposals will need to consider price effects to develop effective welfare improving social policy.
Next Steps CDHP & PPO Branches for Nested Logit
Design. Examine impact of other policy proposals
and/or HSA plan designs on take-up. Refresh model with 2004-2005 choices
currently being collected, including HSA choice in the FEHBP population.

Plan Choice – Conditional Logit (1 of 3)
Adjusted r-square: 0.43458 , Reference PPO_Low
StandardVariable Coefficient Error T-Statistic P-valueTax adjusted Employee Premium in $1,000 0.0358 0.0479 0.7484 0.4542Employee's Health Account in $1,000 1.8123 0.0971 18.6585 <.0001∆ Between Deductible and Health Account in $1,000 -0.8224 0.0520 -15.8186 <.0001Coinsurance (e.g., 15% = .15) -9.0806 0.2558 -35.4983 <.0001PPO Medium Plan Intercept=1, else=0 -0.5283 0.0669 -7.8929 <.0001PPO High Plan Intercept=1, else=0 -2.0062 0.0884 -22.6862 <.0001High CDHP Plan Intercept=1, else=0 -3.2200 0.1222 -26.3579 <.0001Medium CDHP Plan Intercept=1, else=0 -2.8963 0.2340 -12.3762 <.0001Low CDHP Plan Intercept=1, else=0 -3.8432 0.1837 -20.9158 <.0001HMO Plan Intercept=1, else=0 1.1122 0.0773 14.3904 <.0001Premium & Family Contract (0/1) Interaction 0.1534 0.0523 2.9335 0.0034PPO Medium & Age (in 100 years) Interacttion 0.9543 0.1497 6.3745 <.0001PPO High & Age (in 100 years) Interaction 2.6851 0.1885 14.2419 <.0001CDHP High & Age (in 100 years) Interaction -0.6225 0.2223 -2.8004 0.0051CDHP Medium & Age (in 100 years) Interaction -2.6326 0.5472 -4.8105 <.0001CDHP Low & Age (in 100 years) Interaction -0.6491 0.3770 -1.7219 0.0851
N=70,207

Plan Choice – Conditional Logit (2 of 3)
StandardVariable Coefficient Error T-Statistic P-valueHMO & Age (in 100 years) Interaction -1.6886 0.1754 -9.6246 <.0001PPO Medium & Income (in $1,000) Interaction 0.0060 0.0005 12.4876 <.0001PPO High & Income (in $1,000) Interaction 0.0059 0.0006 9.5257 <.0001CDHP High & Income (in $1,000) Interaction 0.0140 0.0006 23.6806 <.0001CDHP Medium & Income (in $1,000) Interaction 0.0117 0.0011 11.0833 <.0001CDHP Low & Income (in $1,000) Interaction 0.0144 0.0008 17.8783 <.0001HMO & Income (in $1,000) Interaction -0.0014 0.0006 -2.4335 0.0150PPO Medium & Female (0/1) Interaction -0.2340 0.0318 -7.3676 <.0001PPO High & Female (0/1) Interaction 0.3302 0.0400 8.2619 <.0001CDHP High & Female (0/1) Interaction -0.0773 0.0469 -1.6496 0.0990CDHP Medium & Female (0/1) Interaction -0.7339 0.1154 -6.3590 <.0001CDHP Low & Female (0/1) Interaction -0.5410 0.0834 -6.4863 <.0001HMO & Female (0/1) Interaction -0.1539 0.0380 -4.0530 0.0001PPO Medium & Family Contract (0/1) Interaction -0.2886 0.0310 -9.3068 <.0001PPO High & Family Contract (0/1) Interaction -0.3842 0.0543 -7.0790 <.0001CDHP High & Family Contract (0/1) Interaction -0.6233 0.1320 -4.7204 <.0001
N=70,207
Adjusted r-square: 0.43458 , Reference PPO_Low

Plan Choice – Conditional Logit (3 of 3)
StandardVariable Coefficient Error T-Statistic P-valueCDHP Medium & Family Contract (0/1) Interaction -1.6393 0.1853 -8.8445 <.0001CDHP Low & Family Contract (0/1) Interaction -1.8292 0.1869 -9.7860 <.0001HMO & Family Contract (0/1) Interaction -0.4057 0.0326 -12.4416 <.0001PPO Medium & Chronic Illness (0/1) Interaction 0.9900 0.0453 21.8421 <.0001PPO High & Chronic Illness (0/1) Interaction -0.2858 0.0697 -4.1026 <.0001CDHP High & Chronic Illness (0/1) Interaction 0.8146 0.1032 7.8905 <.0001CDHP Medium & Chronic Illness (0/1) Interaction 1.7733 0.1679 10.5625 <.0001CDHP Low & Chronic Illness (0/1) Interaction 1.0983 0.1394 7.8811 <.0001HMO & Chronic Illness (0/1) Interaction 0.3669 0.0425 8.6259 <.0001Chronic Illness and premium interaction -1.7921 0.0707 -25.3313 <.0001Chronic Illness and CDHP Account interaction 0.3316 0.0860 3.8569 0.0001Chronic Illness and donut iteraction -0.4348 0.0492 -8.8438 0.0000Chronic Illness and coinsurance interaction -2.1964 0.4458 -4.9269 <.0001Family Contract and CDHP Account interaction -0.7603 0.1116 -6.8127 <.0001Family Contract and Donut interaction 0.6999 0.0543 12.8952 <.0001
N=70,207
Adjusted r-square: 0.43458 , Reference PPO_Low