Embed Size (px)
Citation preview
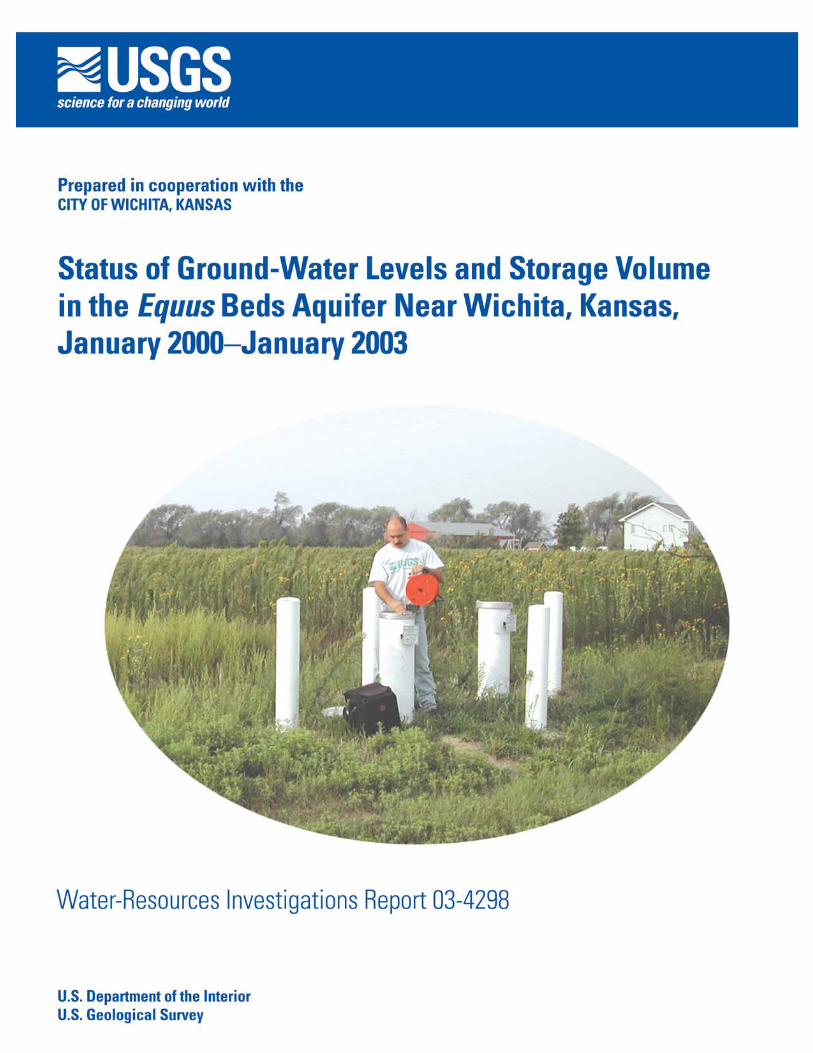

Cover photograph—Ray Casanova, USGS, Wichita, Kansas, measuring an areal index well (IW–22) in Harvey County, July 11, 2002 (photograph taken by Trudy Bennett, USGS, Wichita, Kansas).
Status of Ground-Water Levels and Storage Volume in the Equus Beds Aquifer Near Wichita, Kansas, January 2000–January 2003
By Cristi V. Hansen and Walter R. Aucott
U.S. Department of the InteriorU.S. Geological Survey
Prepared in cooperation with theCity of Wichita, Kansas
Water-Resources Investigations Report 03–4298
U.S. Department of the InteriorGale A. Norton, Secretary
U.S. Geological SurveyCharles G. Groat, Director
U.S. Geological Survey, Reston, Virginia: 2004
For sale by U.S. Geological Survey, Information ServicesBox 25286, Denver Federal CenterDenver, CO 80225
For more information about the USGS and its products:Telephone: 1-888-ASK-USGSWorld Wide Web: http://www.usgs.gov/
Any use of trade, product, or firm names in this publication is for descriptive purposes only and does not imply endorsement by the U.S. Government.
Although this report is in the public domain, permission must be secured from the individual copyright owners toreproduce any copyrighted materials contained within this report.
Suggested citation:Hansen, C.V., and Aucott, W.R., 2004, Status of ground-water levels and storage volume in the Equus Beds aquifernear Wichita, Kansas, January 2000–January 2003: U.S. Geological Survey Water-ResourcesInvestigations Report 03–4298, 36 p.
Prepared by the U.S. Geological Survey in Lawrence, Kansas (http://ks.water.usgs.gov)
iii
Contents
Abstract. . . . . . . . . . . . . . . . . . . . . . . . . . . . . . . . . . . . . . . . . . . . . . . . . . . . . . . . . . . . . . . . . . . . . . . . . . . . . . . . . . . . . . . . . . . . . . . . . . . . . 1Introduction . . . . . . . . . . . . . . . . . . . . . . . . . . . . . . . . . . . . . . . . . . . . . . . . . . . . . . . . . . . . . . . . . . . . . . . . . . . . . . . . . . . . . . . . . . . . . . . . . 1
Purpose and Scope . . . . . . . . . . . . . . . . . . . . . . . . . . . . . . . . . . . . . . . . . . . . . . . . . . . . . . . . . . . . . . . . . . . . . . . . . . . . . . . . . . . 3Methods. . . . . . . . . . . . . . . . . . . . . . . . . . . . . . . . . . . . . . . . . . . . . . . . . . . . . . . . . . . . . . . . . . . . . . . . . . . . . . . . . . . . . . . . . . . . . . 3Description of Study Area . . . . . . . . . . . . . . . . . . . . . . . . . . . . . . . . . . . . . . . . . . . . . . . . . . . . . . . . . . . . . . . . . . . . . . . . . . . . . 3Previous Studies . . . . . . . . . . . . . . . . . . . . . . . . . . . . . . . . . . . . . . . . . . . . . . . . . . . . . . . . . . . . . . . . . . . . . . . . . . . . . . . . . . . . . . 3
Geology and Ground Water . . . . . . . . . . . . . . . . . . . . . . . . . . . . . . . . . . . . . . . . . . . . . . . . . . . . . . . . . . . . . . . . . . . . . . . . . . . . . . . . . 5Ground-Water-Level Changes. . . . . . . . . . . . . . . . . . . . . . . . . . . . . . . . . . . . . . . . . . . . . . . . . . . . . . . . . . . . . . . . . . . . . . . . . . . . . . . 5Storage-Volume Changes . . . . . . . . . . . . . . . . . . . . . . . . . . . . . . . . . . . . . . . . . . . . . . . . . . . . . . . . . . . . . . . . . . . . . . . . . . . . . . . . . . 31Effects of Artificial Recharge. . . . . . . . . . . . . . . . . . . . . . . . . . . . . . . . . . . . . . . . . . . . . . . . . . . . . . . . . . . . . . . . . . . . . . . . . . . . . . . . 34Summary. . . . . . . . . . . . . . . . . . . . . . . . . . . . . . . . . . . . . . . . . . . . . . . . . . . . . . . . . . . . . . . . . . . . . . . . . . . . . . . . . . . . . . . . . . . . . . . . . . . 34Selected References. . . . . . . . . . . . . . . . . . . . . . . . . . . . . . . . . . . . . . . . . . . . . . . . . . . . . . . . . . . . . . . . . . . . . . . . . . . . . . . . . . . . . . . 35
Figures
1. Maps showing location of study area near Wichita, south-central Kansas. . . . . . . . . . . . . . . . . . . . . . . . . .2 2. Graphs showing relation of precipitation, water use for agricultural irrigation and by city of Wichita
for public supply, and water-level altitudes in observation wells 104 and 886 and Equus Beds aquifer storage-volume change in study area, 1938–January 2003. . . . . . . . . . . . . . . . . . . . . . . . . . . . . . . . . . . . . . . . . .4
3. Generalized geologic section. . . . . . . . . . . . . . . . . . . . . . . . . . . . . . . . . . . . . . . . . . . . . . . . . . . . . . . . . . . . . . . . . . . . . . .64–7. Maps showing water-level altitudes in Equus Beds aquifer in study area for:
4. August 1940 . . . . . . . . . . . . . . . . . . . . . . . . . . . . . . . . . . . . . . . . . . . . . . . . . . . . . . . . . . . . . . . . . . . . . . . . . . . . . . . . . .8 5. October 1992 . . . . . . . . . . . . . . . . . . . . . . . . . . . . . . . . . . . . . . . . . . . . . . . . . . . . . . . . . . . . . . . . . . . . . . . . . . . . . . . . .9 6. April 2000. . . . . . . . . . . . . . . . . . . . . . . . . . . . . . . . . . . . . . . . . . . . . . . . . . . . . . . . . . . . . . . . . . . . . . . . . . . . . . . . . . . 10 7. January 2003. . . . . . . . . . . . . . . . . . . . . . . . . . . . . . . . . . . . . . . . . . . . . . . . . . . . . . . . . . . . . . . . . . . . . . . . . . . . . . . 11
8–20. Maps showing water-level change in Equus Beds aquifer in study area:8. August 1940–January 2000 . . . . . . . . . . . . . . . . . . . . . . . . . . . . . . . . . . . . . . . . . . . . . . . . . . . . . . . . . . . . . . . . . 12 9. August 1940–April 2000. . . . . . . . . . . . . . . . . . . . . . . . . . . . . . . . . . . . . . . . . . . . . . . . . . . . . . . . . . . . . . . . . . . . . 13
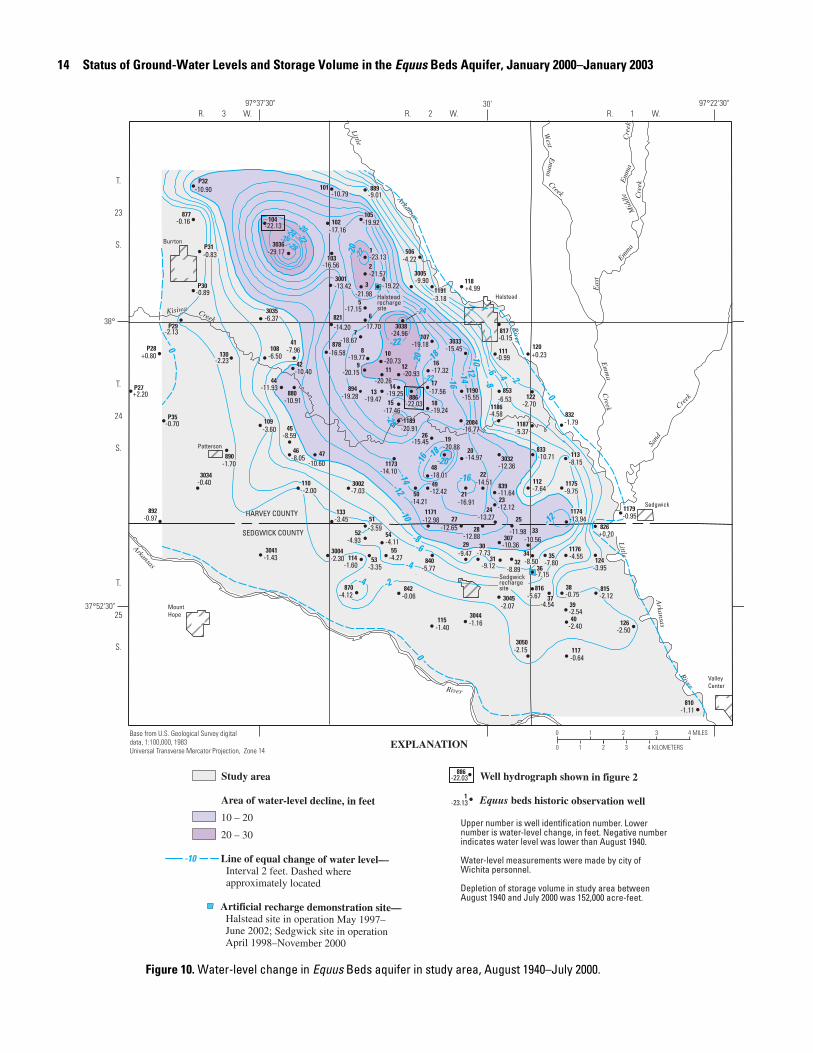
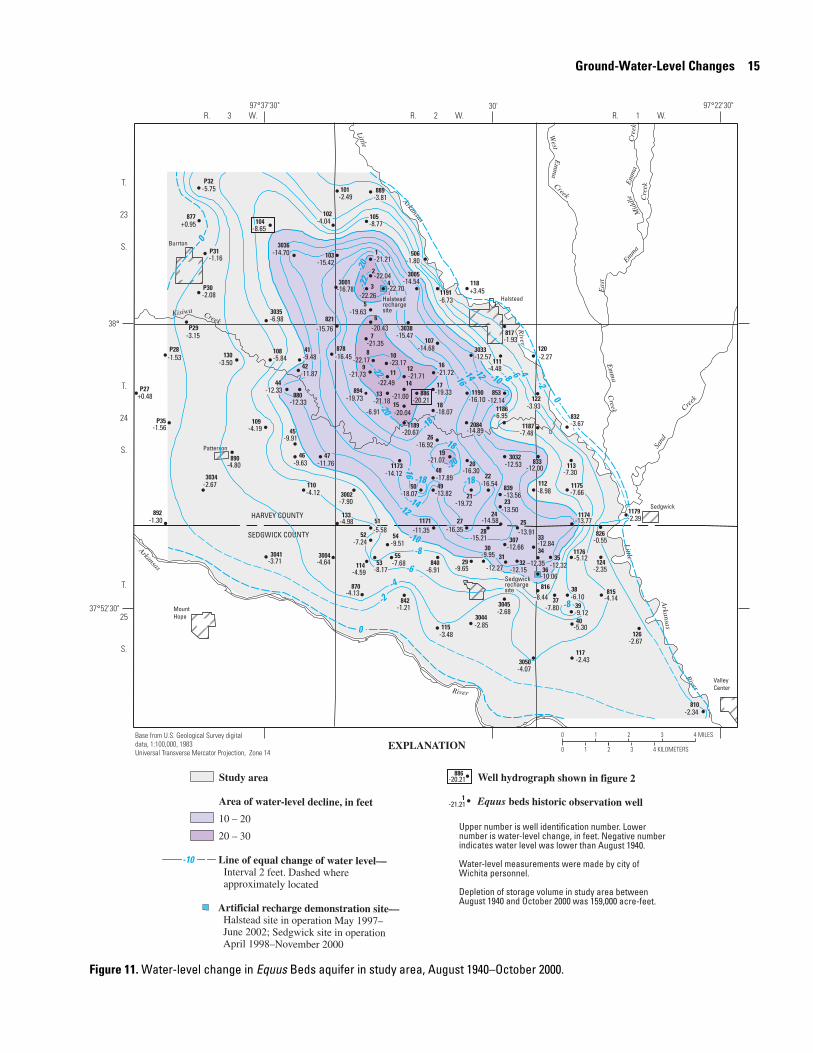
10. August 1940–July 2000 . . . . . . . . . . . . . . . . . . . . . . . . . . . . . . . . . . . . . . . . . . . . . . . . . . . . . . . . . . . . . . . . . . . . . 14 11. August 1940–October 2000 . . . . . . . . . . . . . . . . . . . . . . . . . . . . . . . . . . . . . . . . . . . . . . . . . . . . . . . . . . . . . . . . . 15 12. August 1940–January 2001 . . . . . . . . . . . . . . . . . . . . . . . . . . . . . . . . . . . . . . . . . . . . . . . . . . . . . . . . . . . . . . . . . 16 13. August 1940–April 2001. . . . . . . . . . . . . . . . . . . . . . . . . . . . . . . . . . . . . . . . . . . . . . . . . . . . . . . . . . . . . . . . . . . . . 17 14. August 1940–July 2001 . . . . . . . . . . . . . . . . . . . . . . . . . . . . . . . . . . . . . . . . . . . . . . . . . . . . . . . . . . . . . . . . . . . . . 18 15. August 1940–October 2001 . . . . . . . . . . . . . . . . . . . . . . . . . . . . . . . . . . . . . . . . . . . . . . . . . . . . . . . . . . . . . . . . . 19 16. August 1940–January 2002 . . . . . . . . . . . . . . . . . . . . . . . . . . . . . . . . . . . . . . . . . . . . . . . . . . . . . . . . . . . . . . . . . 20 17. August 1940–April 2002. . . . . . . . . . . . . . . . . . . . . . . . . . . . . . . . . . . . . . . . . . . . . . . . . . . . . . . . . . . . . . . . . . . . . 21 18. August 1940–July 2002 . . . . . . . . . . . . . . . . . . . . . . . . . . . . . . . . . . . . . . . . . . . . . . . . . . . . . . . . . . . . . . . . . . . . . 22 19. August 1940–October 2002 . . . . . . . . . . . . . . . . . . . . . . . . . . . . . . . . . . . . . . . . . . . . . . . . . . . . . . . . . . . . . . . . . 23 20. August 1940–January 2003 . . . . . . . . . . . . . . . . . . . . . . . . . . . . . . . . . . . . . . . . . . . . . . . . . . . . . . . . . . . . . . . . . 24
21. Map showing maximum seasonal water-level changes in Equus Beds aquifer in study area during January 2000–January 2003 . . . . . . . . . . . . . . . . . . . . . . . . . . . . . . . . . . . . . . . . . . . . . . . . . . . . . . . . . . . . . . . . . . . . . . 26
iv
22–25. Maps showing water-level change in Equus Beds aquifer in study area:22. October 1992–January 2003 . . . . . . . . . . . . . . . . . . . . . . . . . . . . . . . . . . . . . . . . . . . . . . . . . . . . . . . . . . . . . . . . .27 23. October 1992–April 2000 . . . . . . . . . . . . . . . . . . . . . . . . . . . . . . . . . . . . . . . . . . . . . . . . . . . . . . . . . . . . . . . . . . . . .28 24. April 2000–January 2003. . . . . . . . . . . . . . . . . . . . . . . . . . . . . . . . . . . . . . . . . . . . . . . . . . . . . . . . . . . . . . . . . . . . .29 25. January 2000–January 2003 . . . . . . . . . . . . . . . . . . . . . . . . . . . . . . . . . . . . . . . . . . . . . . . . . . . . . . . . . . . . . . . . .30
26. Graph showing storage-volume changes in Equus Beds aquifer in study area for significant periods during August 1940–January 2003 . . . . . . . . . . . . . . . . . . . . . . . . . . . . . . . . . . . . . . . . . . . . . . . . . . . . . . . . 33
Table
1. Storage-volume changes in Equus Beds aquifer near Wichita, south-central Kansas, August 1940–January 2003 . . . . . . . . . . . . . . . . . . . . . . . . . . . . . . . . . . . . . . . . . . . . . . . . . . . . . . . . . . . . . . . . . . . . . . . 32
Conversion Factors, Abbreviations, and Datums
Prior to April 2000, vertical coordinate information is referenced to the National Geodetic Vertical Datum of 1929 (NGVD 29). For April 2000 and after, vertical coordinate information is referenced to the North American Vertical Datum of 1988 (NAVD 88). NAVD 88 vertical coordinates are about 0.5 ft higher than NGVD 29 vertical coordinates in the part of south-central Kansas discussed in this report.
Horizontal coordinate information is referenced to the North American Datum of 1983 (NAD 83).
Multiply By To obtain
acre-foot (acre-ft) 1,233 cubic meter (m3)
acre-foot per year (acre-ft/yr) 1,233 cubic meter per year (m3/yr)
degree Fahrenheit (oF) (1)
1Temperature in degrees Celsius (°C) may be converted to degrees Fahrenheit (°F) as follows:
°F = (1.8 x °C) + 32
Temperature in degrees Fahrenheit (°F) may be converted to degrees Celsius (°C) as follows:
°C = (°F - 32) / 1.8
degrees Celsius (oC)
foot (ft) 0.3048 meter (m)
inch (in.) 25.4 millimeter (mm)
inch per year (in/yr) 25.4 millimeter per year (mm/yr)
mile (mi) 1.609 kilometer (km)
square mile (mi2) 2.590 square kilometer (km2)
Status of Ground-Water Levels and Storage Volume in the Equus Beds Aquifer Near Wichita, Kansas, January 2000–January 2003
By Cristi V. Hansen and Walter R. Aucott
Abstract
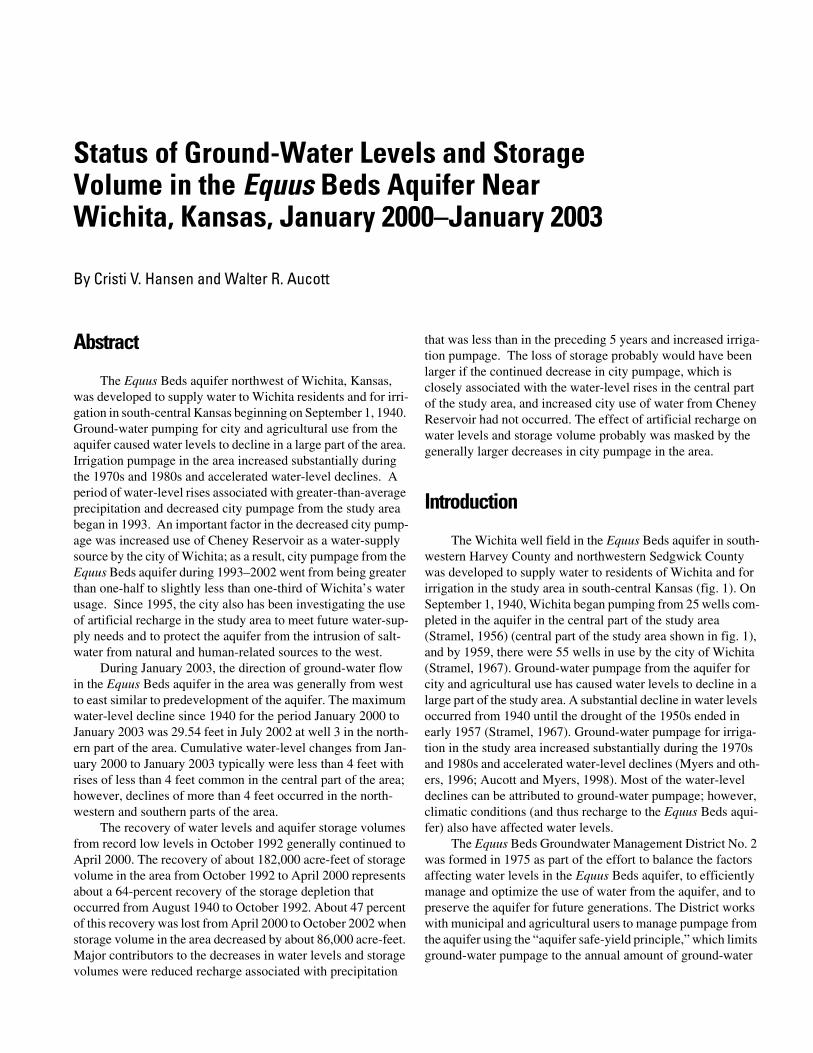
The Equus Beds aquifer northwest of Wichita, Kansas, was developed to supply water to Wichita residents and for irri-gation in south-central Kansas beginning on September 1, 1940. Ground-water pumping for city and agricultural use from the aquifer caused water levels to decline in a large part of the area. Irrigation pumpage in the area increased substantially during the 1970s and 1980s and accelerated water-level declines. A period of water-level rises associated with greater-than-average precipitation and decreased city pumpage from the study area began in 1993. An important factor in the decreased city pump-age was increased use of Cheney Reservoir as a water-supply source by the city of Wichita; as a result, city pumpage from the Equus Beds aquifer during 1993–2002 went from being greater than one-half to slightly less than one-third of Wichita’s water usage. Since 1995, the city also has been investigating the use of artificial recharge in the study area to meet future water-sup-ply needs and to protect the aquifer from the intrusion of salt-water from natural and human-related sources to the west.
During January 2003, the direction of ground-water flow in the Equus Beds aquifer in the area was generally from west to east similar to predevelopment of the aquifer. The maximum water-level decline since 1940 for the period January 2000 to January 2003 was 29.54 feet in July 2002 at well 3 in the north-ern part of the area. Cumulative water-level changes from Jan-uary 2000 to January 2003 typically were less than 4 feet with rises of less than 4 feet common in the central part of the area; however, declines of more than 4 feet occurred in the north-western and southern parts of the area.
The recovery of water levels and aquifer storage volumes from record low levels in October 1992 generally continued to April 2000. The recovery of about 182,000 acre-feet of storage volume in the area from October 1992 to April 2000 represents about a 64-percent recovery of the storage depletion that occurred from August 1940 to October 1992. About 47 percent of this recovery was lost from April 2000 to October 2002 when storage volume in the area decreased by about 86,000 acre-feet. Major contributors to the decreases in water levels and storage volumes were reduced recharge associated with precipitation
that was less than in the preceding 5 years and increased irriga-tion pumpage. The loss of storage probably would have been larger if the continued decrease in city pumpage, which is closely associated with the water-level rises in the central part of the study area, and increased city use of water from Cheney Reservoir had not occurred. The effect of artificial recharge on water levels and storage volume probably was masked by the generally larger decreases in city pumpage in the area.
Introduction
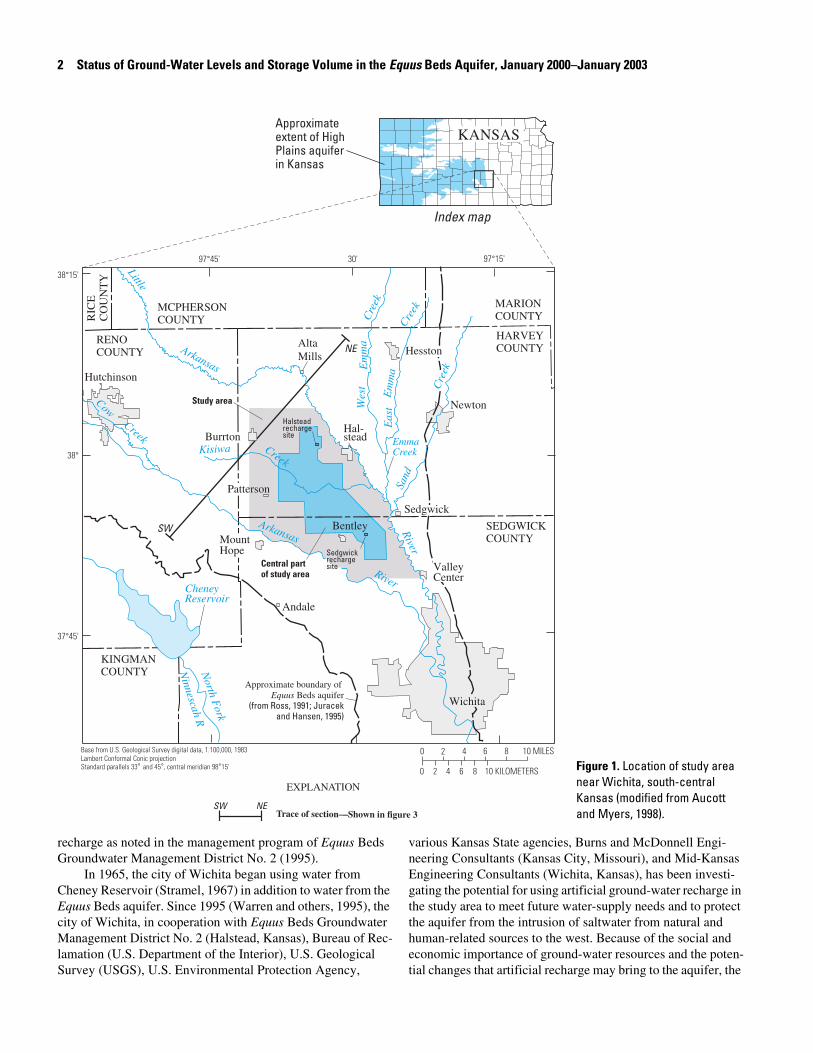
The Wichita well field in the Equus Beds aquifer in south-western Harvey County and northwestern Sedgwick County was developed to supply water to residents of Wichita and for irrigation in the study area in south-central Kansas (fig. 1). On September 1, 1940, Wichita began pumping from 25 wells com-pleted in the aquifer in the central part of the study area (Stramel, 1956) (central part of the study area shown in fig. 1), and by 1959, there were 55 wells in use by the city of Wichita (Stramel, 1967). Ground-water pumpage from the aquifer for city and agricultural use has caused water levels to decline in a large part of the study area. A substantial decline in water levels occurred from 1940 until the drought of the 1950s ended in early 1957 (Stramel, 1967). Ground-water pumpage for irriga-tion in the study area increased substantially during the 1970s and 1980s and accelerated water-level declines (Myers and oth-ers, 1996; Aucott and Myers, 1998). Most of the water-level declines can be attributed to ground-water pumpage; however, climatic conditions (and thus recharge to the Equus Beds aqui-fer) also have affected water levels.
The Equus Beds Groundwater Management District No. 2 was formed in 1975 as part of the effort to balance the factors affecting water levels in the Equus Beds aquifer, to efficiently manage and optimize the use of water from the aquifer, and to preserve the aquifer for future generations. The District works with municipal and agricultural users to manage pumpage from the aquifer using the “aquifer safe-yield principle,” which limits ground-water pumpage to the annual amount of ground-water
2 Status of Ground-Water Levels and Storage Volume in the Equus Beds Aquifer, January 2000–January 2003
recharge as noted in the management program of Equus Beds Groundwater Management District No. 2 (1995).
In 1965, the city of Wichita began using water from Cheney Reservoir (Stramel, 1967) in addition to water from the Equus Beds aquifer. Since 1995 (Warren and others, 1995), the city of Wichita, in cooperation with Equus Beds Groundwater Management District No. 2 (Halstead, Kansas), Bureau of Rec-lamation (U.S. Department of the Interior), U.S. Geological Survey (USGS), U.S. Environmental Protection Agency,
various Kansas State agencies, Burns and McDonnell Engi-neering Consultants (Kansas City, Missouri), and Mid-Kansas Engineering Consultants (Wichita, Kansas), has been investi-gating the potential for using artificial ground-water recharge in the study area to meet future water-supply needs and to protect the aquifer from the intrusion of saltwater from natural and human-related sources to the west. Because of the social and economic importance of ground-water resources and the poten-tial changes that artificial recharge may bring to the aquifer, the
Study area
SW
SW NE
NE
0 2 4 6 8 10 MILES
0 2 4 6 8 10 KILOMETERS
37˚45'
38˚
38˚15'
97˚45' 30' 97˚15'
Arkansas
River
Kisiwa
River
Arkansas
Little
Wes
t
Eas
t
Em
ma
Em
ma
Creek
Sand
Cre
ek
Cre
ek
Cre
ek
RIC
EC
OU
NT
Y
RENOCOUNTY
MARIONCOUNTY
MCPHERSONCOUNTY
Approximate extent of HighPlains aquiferin Kansas
SEDGWICKCOUNTY
HARVEYCOUNTYHesston
Newton
Bentley
Hutchinson
AltaMills
EmmaCreek
Hal-stead
Index map
CheneyReservoir
North F
ork
Ninnescah R
KANSAS
Approximate boundary of Equus Beds aquifer
(from Ross, 1991; Juracekand Hansen, 1995)
Andale
ValleyCenter
Sedgwick
Wichita
Burrton
Halsteadrechargesite
SedgwickrechargesiteCentral part
of study area
Base from U.S. Geological Survey digital data, 1:100,000, 1983 Lambert Conformal Conic projectionStandard parallels 33˚ and 45˚, central meridian 98˚15'
Trace of section—Shown in figure 3
EXPLANATION
CowCreek
KINGMANCOUNTY
Patterson
MountHope
Figure 1. Location of study area near Wichita, south-central Kansas (modified from Aucott and Myers, 1998).
Introduction 3
city of Wichita conducted a cooperative study with the USGS to document changes in historical hydrologic and water-quality conditions and the probable causes of these changes in the study area, to develop a baseline condition for evaluating the effects of artificial recharge on ground-water levels in the aquifer, and to periodically review changes in the ground-water flow system.
The USGS and the city of Wichita have worked coopera-tively since 1940 in evaluating the Equus Beds aquifer and its interaction with streams in the area to further the understanding of the entire hydrologic system and to provide information to aid local decisionmaking. The understanding gained from this cooperative study of the hydrologic system and the Equus Beds aquifer can contribute to the wise management of water resources where similar hydrologic conditions exist elsewhere. This report is prepared in cooperation with the city of Wichita.
Purpose and Scope
The purpose of this report is to describe ground-water-level and storage-volume changes in the Equus Beds aquifer northwest of Wichita during January 2000 to January 2003 as compared with predevelopment (1940) ground-water levels and to update historical information related to changes in the aquifer since 1940. Maps of ground-water-level measurements and water-level changes are presented. Two hydrographs of ground-water levels were selected to show historical water-level varia-tions. Historical water-use and climate information also are pre-sented. The information in this report can be used to monitor and improve understanding of the effects of climate, water use, and water-resource management practices on water supplies in the Equus Beds aquifer, an important source of water for the city of Wichita and the surrounding area.
Methods
Extensive information is available to describe hydrologic conditions in the study area. Water-level data have been col-lected periodically from more than 100 wells by city of Wichita personnel using standard water-level measurement techniques similar to USGS methods described in Stallman (1971). Data collection began just prior to the beginning of city pumpage from the aquifer in the study area in 1940; water levels in most wells have been measured at least quarterly. These data are stored by the city in paper and electronic form and by the USGS in electronic form.
During 2001 and 2002, 38 pairs of areal index wells were installed in and near the study area for the city of Wichita. Each pair of areal index wells consists of a well completed in the upper part of the aquifer and another well completed in the lower part of the aquifer. These wells were designed for use by the city to monitor the quality of water in the aquifer throughout the study area and to determine if there are any water-quality differences between the shallow and deep parts of the aquifer (Andrew C. Ziegler, U.S. Geological Survey, oral commun.,
September 2003). As water levels also can be measured in these wells, the wells were added to the water-level monitoring net-work in the study area in 2002. Water levels in these index wells are measured by the USGS and by Equus Beds Ground-water Management District No. 2 (GMD2). The data collected by the USGS are stored in the National Water Information Sys-tem (NWIS) database and are available at the following URL: http://ks.waterdata.usgs.gov/nwis/gw The data collected by GMD2 is stored in KGS’s Water Informa-tion Storage and Retrieval Database (WIZARD) and are avail-able at the following URL: http://www.kgs.ku.edu/Magellan/WaterLevels/index.html
Description of Study Area
The study area (fig. 1) includes 165 mi2 and is located in Harvey and Sedgwick Counties, northwest of Wichita, Kansas. The study area is in the Arkansas River section of the Central Lowlands physiographic province (Schoewe, 1949). There is little topographic relief in the study area. For the most part, the land surface slopes gently toward the major streams in the area. The study area is bounded on the southwest by the Arkansas River and on the northeast by the Little Arkansas River. The center or central part of the study area (fig. 1), which is referred to throughout this report, is the historic center of pumping in the study area and includes wells that supply water to the city of Wichita and for irrigation.
South-central Kansas has a continental climate that is char-acterized by large variations in seasonal temperatures, moderate precipitation, and windy conditions. In Wichita, Kansas, long-term daily average temperatures for 1971–2000 range from 30.2 oF in January to 81.0 oF in July (National Oceanic and Atmospheric Administration, 2002). The long-term annual mean precipitation for 1940–2002 at weather stations near the study area (at Hutchinson, Mount Hope, Newton, Sedgwick, and Wichita) is 31.18 in. (National Oceanic and Atmospheric Administration, 1998–2001b; Mary Knapp, State Climatolo-gist, written commun., March 20, 2003) (fig. 2A). Most of this precipitation commonly occurs during spring and summer (May–September). Although mean annual precipitation in 2002 was near average, about one-fourth of the year’s precipitation did not occur until the month of October (Mary Knapp, State Climatologist, Kansas State University, written commun., March 20, 2003)—after the growing season ended and in a month that normally receives less than one-tenth of the annual precipitation.
Previous Studies
Water-level data have been collected periodically by the city of Wichita in the study area since 1940 and are on file with the city and the USGS in Wichita and Lawrence, Kansas, respectively. Water-level data also have been collected by
4 Status of Ground-Water Levels and Storage Volume in the Equus Beds Aquifer, January 2000–January 2003
0
60
10
20
30
40
50
Prec
ipita
tion,
in in
ches
per
yea
r
Mean annualprecipitation
Long-term annual mean, 1940−2002 (average forweather stations at Hutchinson, Mount Hope,Newton, Sedgwick, and Wichita)
5-year moving average
A. Precipitation
80,000
0
20,000
40,000
60,000
Wat
er u
se, i
n ac
re-fe
et p
er y
ear
Total city water usefor public supply
City ground-water usefor public supply
City surface-water use fromCheney Reservoir for public supply
Estimated ground-water use for agricultural irrigation
Permitted ground-water use for agricultural irrigation in study area
B. Water use for agricultural irrigation and by city of Wichita for public supply
1938
1950
1940
1960
1970
1980
1990
2003
2000
1,480
1,350
1,360
1,370
1,380
1,390
1,400
1,410
1,420
1,430
1,440
1,450
1,460
1,470
Wat
er-le
vel a
ltitu
de, i
n fe
et a
bove
NAV
D 88
0
600
0
50
100
150
200
250
300
350
400
450
500
550
Stor
age-
volu
me
chan
ge, i
n th
ousa
nds
of a
cre-
feet
Storage-volume change
Water-level altitude in well 104
Water-level altitude in well 886
C. Water-level altitudes in observation wells 104 and 886 and Equus Beds aquifer storage-volume change in study area
1940–56 period 1957–77 period 1978–92 period1993–2003
period
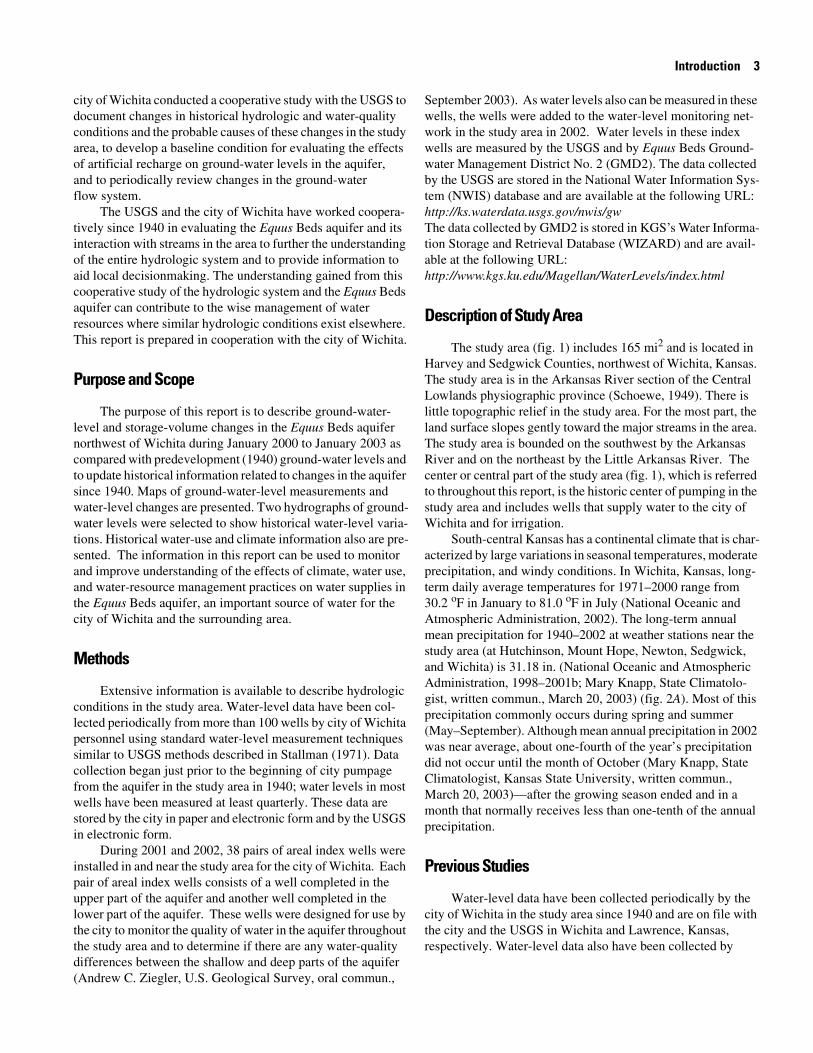
Figure 2. Relation of (A) precipitation, (B) water use for agricultural irrigation and by city of Wichita for public supply, and (C) water-level altitudes in observation wells 104 and 886 and Equus Beds aquifer storage-volume change in study area, 1938–January 2003 (modified from Aucott and others, 1998). Source: (A) precipitation data from National Oceanic and Atmospheric Administration (1998–2001b) and Mary Knapp (State Climatologist, Kansas State University, written commun., March 20, 2003); (B) water-use data from Stramel (1956, 1967), Gerald T. Blain (city of Wichita, written commun., 1997), Joan Kenny (U.S. Geological Survey, written commun., 2000 and 2003), Brownie Wilson (Kansas Water Office, written commun., 2000), and Kelly Emmons (Kansas Department of Agriculture, Division of Water Resources, written commun., 2003); (C) water-level altitude data from Stramel (1956, 1967) and from data collected by city of Wichita, Equus Beds Groundwater Management District No. 2, and on file with U.S. Geological Survey, Lawrence, Kansas. Location of observation wells is shown in figures 4–25. Storage-volume changes from Stramel (1956, 1967), Aucott and Myers (1998), Aucott and others (1998), Hansen and Aucott (2001), and data on file with U.S. Geological Survey in Lawrence, Kansas.
Geology and Ground Water 5
Equus Beds Groundwater Management District No. 2 since 1978 from wells completed in the Equus Beds aquifer (Equus Beds Groundwater Management District No. 2, 1995). Annual water-level data for the High Plains aquifer (fig. 1), which includes the Equus Beds aquifer, have been collected since 1937 by the Kansas Department of Agriculture (Division ofWater Resources), USGS, and the Kansas Geological Survey (KGS). The data on file with the USGS in Lawrence, Kansas, also are stored in the NWIS database and are available at URL http://ks.waterdata.usgs.gov/nwis/gw; data on file with the KGS are stored in their WIZARD database (Kansas Geological Survey, 2002). Historical and near-real-time data and reports associated with the Equus Beds Ground-Water Demonstration Recharge Project (Ziegler and others, 1999) are available at URLhttp://ks.water.usgs.gov/Kansas/studies/equus/
Williams and Lohman (1949) and Stramel (1956, 1967) have published water levels and water-level-altitude and decline maps for the study area. Ross and others (1997) noted water-level rises in the Equus Beds aquifer from 1993 to 1997 and attributed them largely to decreases in withdrawals by the city of Wichita. Aucott and Myers (1998), Aucott and others (1998), and Hansen and Aucott (2001) published water-level decline maps for the study area and discussed the changes in storage volume for noteworthy past and recent periods of time. Myers and others (1996) evaluated the hydrologic interaction between the Arkansas River and the Equus Beds aquifer in the study area. Water-level data for the Equus Beds and High Plains aquifers have been compiled and mapped recently in Kansas by Olea and Davis (2002) and Woods and Sophocleous (2002) and regionally by McGuire and Sharpe (1997), McGuire and Fis-cher (1999), and McGuire (2001).
Geology and Ground Water
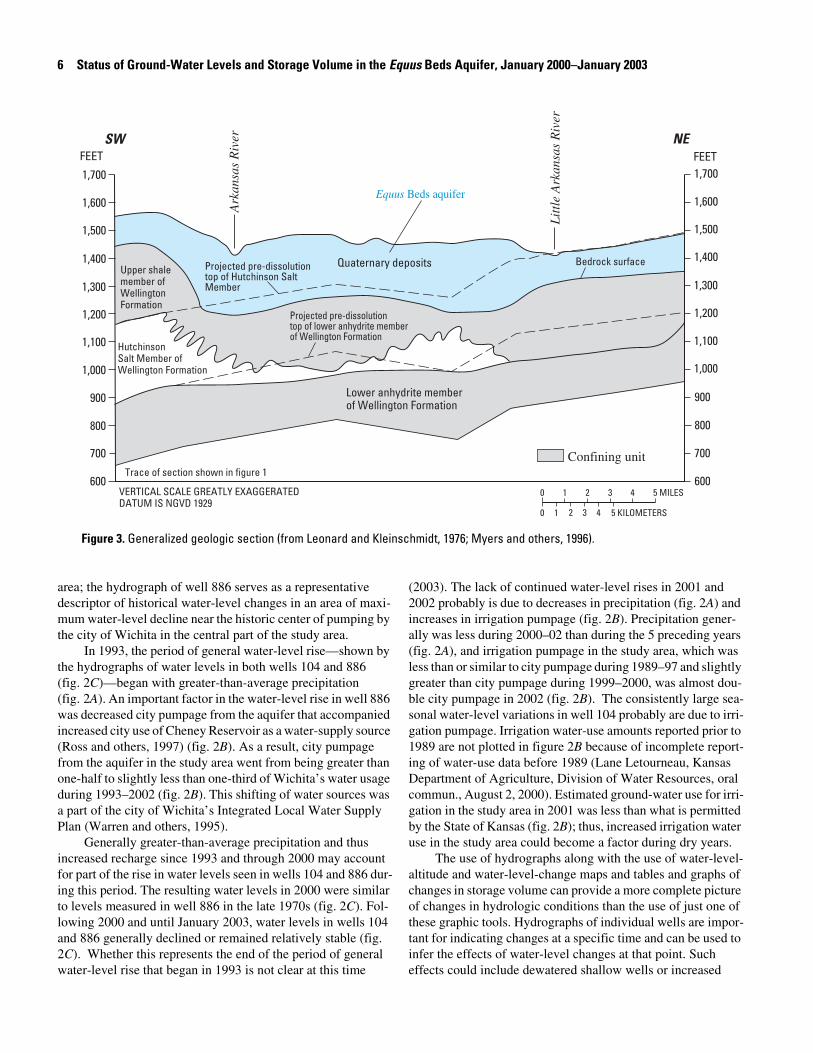
Quaternary deposits occur throughout the study area pri-marily as alluvial deposits. These alluvial deposits, known locally as the Equus beds, are as much as 250 ft thick in the study area (fig. 3). The Equus beds consist primarily of sand and gravel interbedded with clay or silt but locally may consist pri-marily of clay with thin sand and gravel layers (Lane and Miller, 1965a; Myers and others, 1996). The middle part of the depos-its generally has more fine-grained material than the lower and upper parts (Lane and Miller, 1965b; Myers and others, 1996).
The Wellington Formation of Permian age underlies the Quaternary deposits in the study area and forms the bedrock confining unit below these deposits. The Wellington Formation is about 700 ft thick (Bayne, 1956) and consists of three mem-bers—the lower anhydrite member, about 200 ft thick; the Hutchinson Salt Member, about 300 ft thick; and the upper shale member, about 200 ft thick (Myers and others, 1996). Dis-solution of the Hutchinson Salt Member has resulted in subsid-ence of the overlying upper shale member, formation of low areas in the bedrock surface, and concurrent accumulation of
alluvial deposits that now compose the Equus Beds aquifer (fig. 3) (Myers and others, 1996).
The Equus Beds aquifer is the easternmost extension of the High Plains aquifer in Kansas (Stullken and others, 1985; Hansen and Aucott, 2001). The Equus beds are an important source of ground water because of the generally shallow depth to the water table, the large saturated thickness, and the gener-ally good water quality. Near the Arkansas River, the water table may be as little as 10 ft below land surface. Farther from the Arkansas River and near the Little Arkansas River, the water table is at a greater depth, depending on the altitude of the land surface and the amount of water-level decline that has been caused by ground-water withdrawals. The maximum saturated thickness of the Equus Beds aquifer within the study area, almost 250 ft, is near the Arkansas River and corresponds to the lowest areas of the underlying bedrock surface (fig. 3).
Ground-Water-Level Changes
Ground-water-level declines can result from pumpage, decreased recharge resulting from less-than-average precipita-tion, and other factors. Droughts, such as occurred during 1952–56 and 1988–92 (fig. 2A), tend to decrease the amount of recharge available and increase the demand for and thus pump-age of ground water (fig. 2B), resulting in increased water-level declines (fig. 2C). Periods of greater-than-average rainfall, such as occurred in 1957–62 (fig. 2A), tend to increase the amount of recharge available and decrease the demand for and thus pump-age of ground water (fig. 2B), resulting in water-level rises (fig. 2C). If these water-level declines or rises are large enough, they may locally alter the direction of ground-water flow.
Aucott and Myers (1998) identified four noteworthy peri-ods of water-level change (fig. 2C): 1940–56, the initial water-level decline period when pumpage began in the study area, which includes a phase of accelerated declines in the mid-1950s coinciding with drought conditions; 1957–77, a period of gen-eral equilibrium with relatively stable city pumpage and water levels and increasing irrigation pumpage that became signifi-cant in the late 1970s; 1978–92, another period of water-level declines and increased city and irrigation pumpage due to increased demands and drought conditions; and 1993 to 1998, a period of water-level rises associated with generally greater-than-average precipitation and decreased city pumpage. The first three periods have been well documented by Aucott and Myers (1998) and will not be described in this report. Accord-ing to Hansen and Aucott (2001), the fourth period—the period of water-level rises seen by Aucott and Myers (1998) during 1993 to 1998—did not end in 1998 but rather continued during 1998 to 2000.
Description of noteworthy periods of water-level change in the study area is facilitated by the use of hydrographs of water levels in observation wells 104 and 886 (fig. 2C). The hydrograph of well 104 serves as a representative descriptor of agricultural irrigation effects near the northern edge of the study
6 Status of Ground-Water Levels and Storage Volume in the Equus Beds Aquifer, January 2000–January 2003
area; the hydrograph of well 886 serves as a representative descriptor of historical water-level changes in an area of maxi-mum water-level decline near the historic center of pumping by the city of Wichita in the central part of the study area.
In 1993, the period of general water-level rise—shown by the hydrographs of water levels in both wells 104 and 886 (fig. 2C)—began with greater-than-average precipitation (fig. 2A). An important factor in the water-level rise in well 886 was decreased city pumpage from the aquifer that accompanied increased city use of Cheney Reservoir as a water-supply source (Ross and others, 1997) (fig. 2B). As a result, city pumpage from the aquifer in the study area went from being greater than one-half to slightly less than one-third of Wichita’s water usage during 1993–2002 (fig. 2B). This shifting of water sources was a part of the city of Wichita’s Integrated Local Water Supply Plan (Warren and others, 1995).
Generally greater-than-average precipitation and thus increased recharge since 1993 and through 2000 may account for part of the rise in water levels seen in wells 104 and 886 dur-ing this period. The resulting water levels in 2000 were similar to levels measured in well 886 in the late 1970s (fig. 2C). Fol-lowing 2000 and until January 2003, water levels in wells 104 and 886 generally declined or remained relatively stable (fig. 2C). Whether this represents the end of the period of general water-level rise that began in 1993 is not clear at this time
(2003). The lack of continued water-level rises in 2001 and 2002 probably is due to decreases in precipitation (fig. 2A) and increases in irrigation pumpage (fig. 2B). Precipitation gener-ally was less during 2000–02 than during the 5 preceding years (fig. 2A), and irrigation pumpage in the study area, which was less than or similar to city pumpage during 1989–97 and slightly greater than city pumpage during 1999–2000, was almost dou-ble city pumpage in 2002 (fig. 2B). The consistently large sea-sonal water-level variations in well 104 probably are due to irri-gation pumpage. Irrigation water-use amounts reported prior to 1989 are not plotted in figure 2B because of incomplete report-ing of water-use data before 1989 (Lane Letourneau, Kansas Department of Agriculture, Division of Water Resources, oral commun., August 2, 2000). Estimated ground-water use for irri-gation in the study area in 2001 was less than what is permitted by the State of Kansas (fig. 2B); thus, increased irrigation water use in the study area could become a factor during dry years.
The use of hydrographs along with the use of water-level-altitude and water-level-change maps and tables and graphs of changes in storage volume can provide a more complete picture of changes in hydrologic conditions than the use of just one of these graphic tools. Hydrographs of individual wells are impor-tant for indicating changes at a specific time and can be used to infer the effects of water-level changes at that point. Such effects could include dewatered shallow wells or increased
Confining unit
0 1 2 3 4 5 MILES
0 1 2 3 4 5 KILOMETERS
VERTICAL SCALE GREATLY EXAGGERATEDDATUM IS NGVD 1929
Trace of section shown in figure 1
1,700
1,600
1,500
1,400
1,300
1,200
1,100
1,000
900
800
700
600
1,700
1,600
1,500
1,400
1,300
1,200
1,100
1,000
900
800
700
600
Ark
ansa
s R
iver
Lit
tle
Ark
ansa
s R
iver
Quaternary depositsProjected pre-dissolutiontop of Hutchinson Salt Member
Bedrock surface
Projected pre-dissolutiontop of lower anhydrite memberof Wellington Formation
Lower anhydrite memberof Wellington Formation
Upper shalemember ofWellingtonFormation
Hutchinson Salt Member of Wellington Formation
FEETFEETSW NE
Equus Beds aquifer
Figure 3. Generalized geologic section (from Leonard and Kleinschmidt, 1976; Myers and others, 1996).
Ground-Water-Level Changes 7
pumping costs to lift water from greater depths. Water-level-altitude maps show the gradient and direction of ground-water flow over a large area at a particular time. A single water-level-altitude map cannot indicate the distribution and extent of areas affected by water-level declines or rises. However, water-level-change maps can be used to illustrate the areal distribution and extent of water-level declines and rises. Tables and graphs showing changes in storage volume, which are derived from water-level-change maps and represent a decrease (or increase) in the ground-water resource available for use, are a good mea-sure of the cumulative effects of pumping and climatic condi-tions on the aquifer.
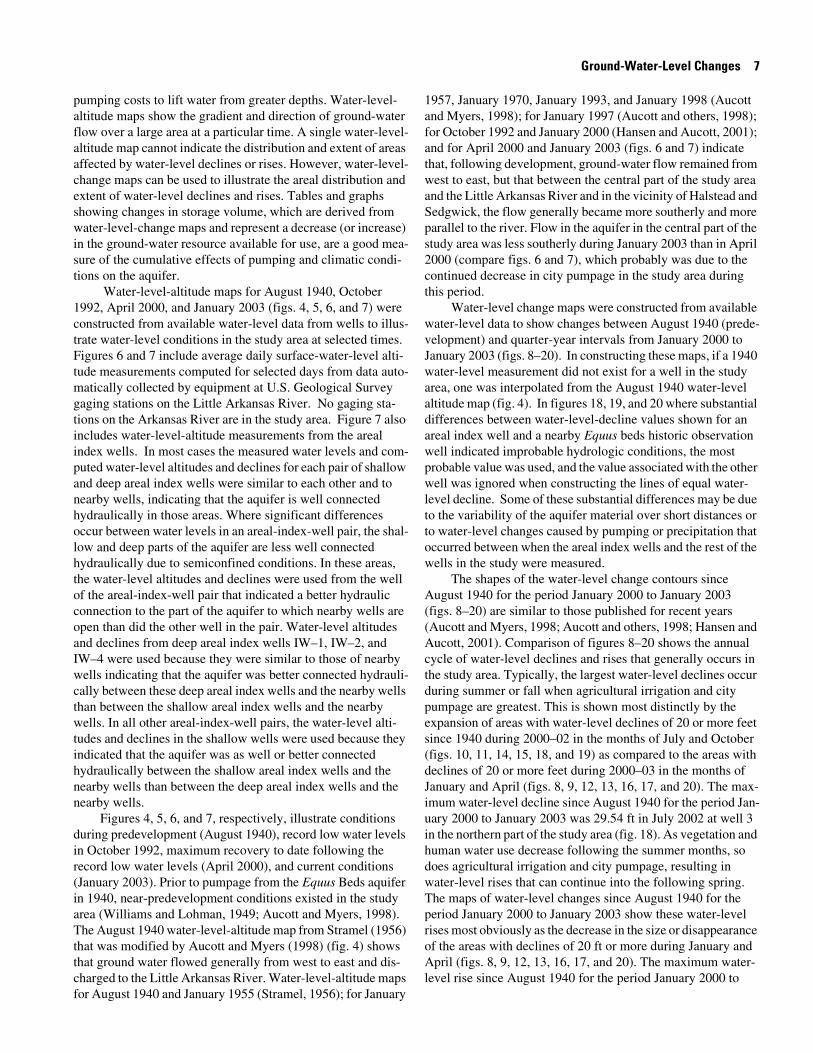
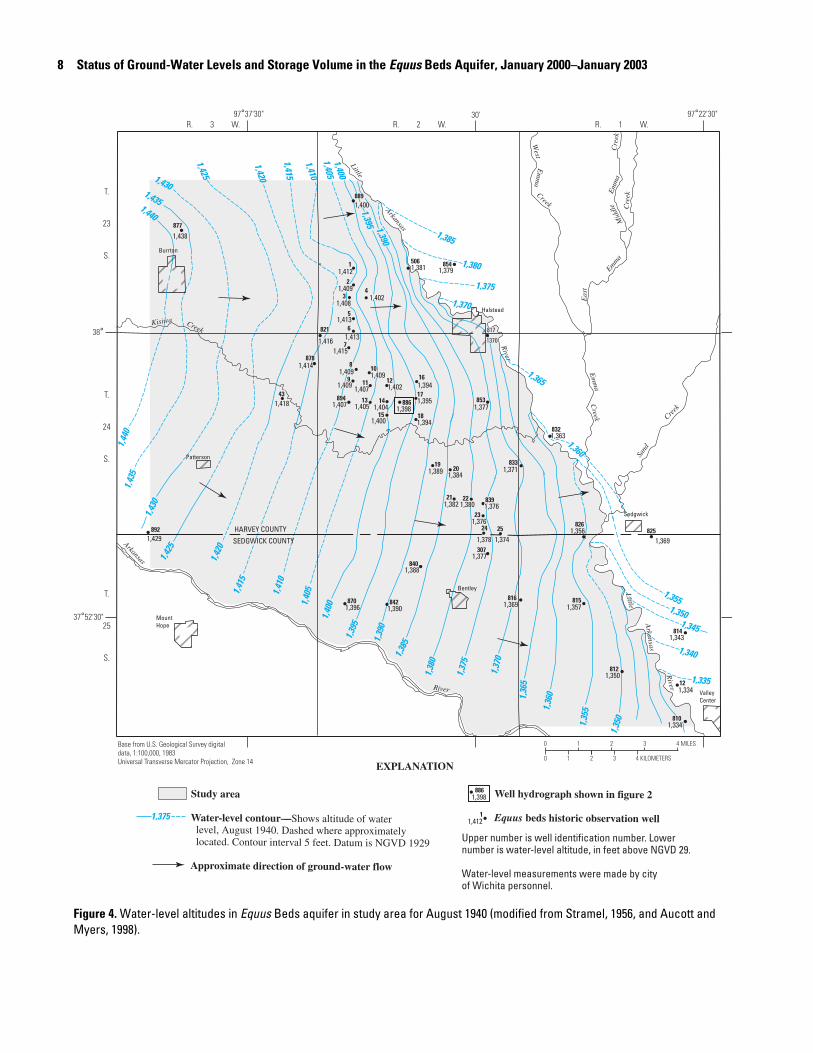
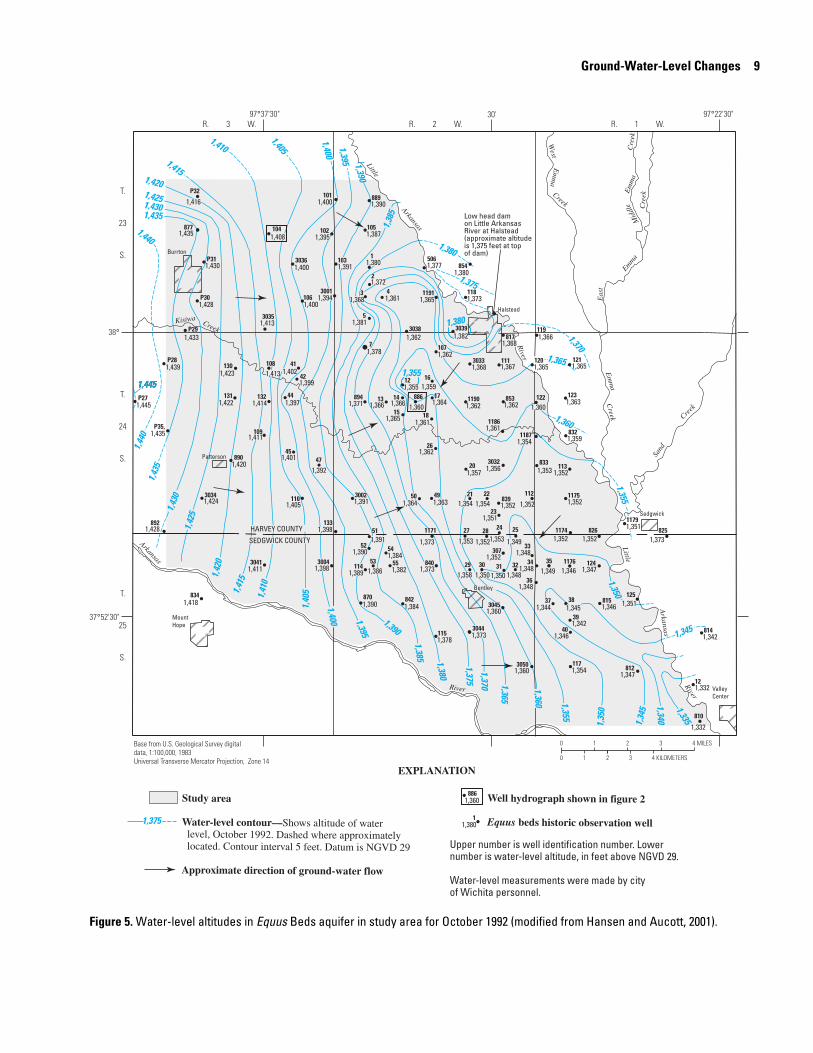
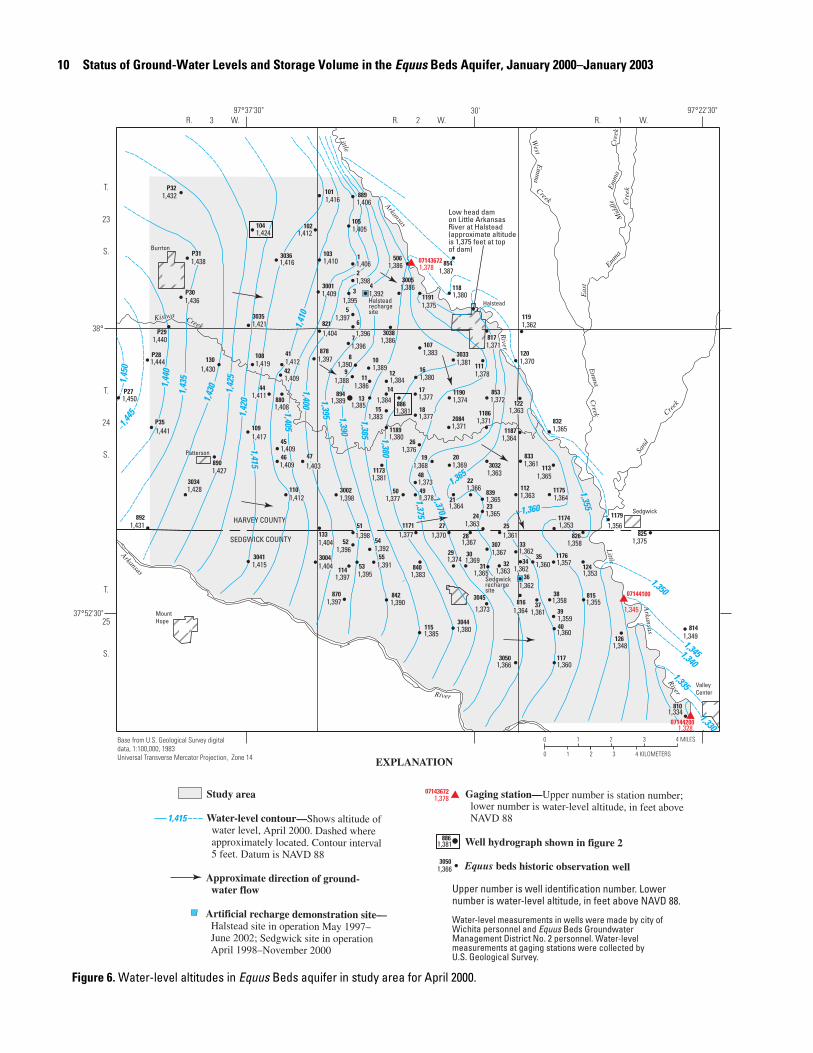
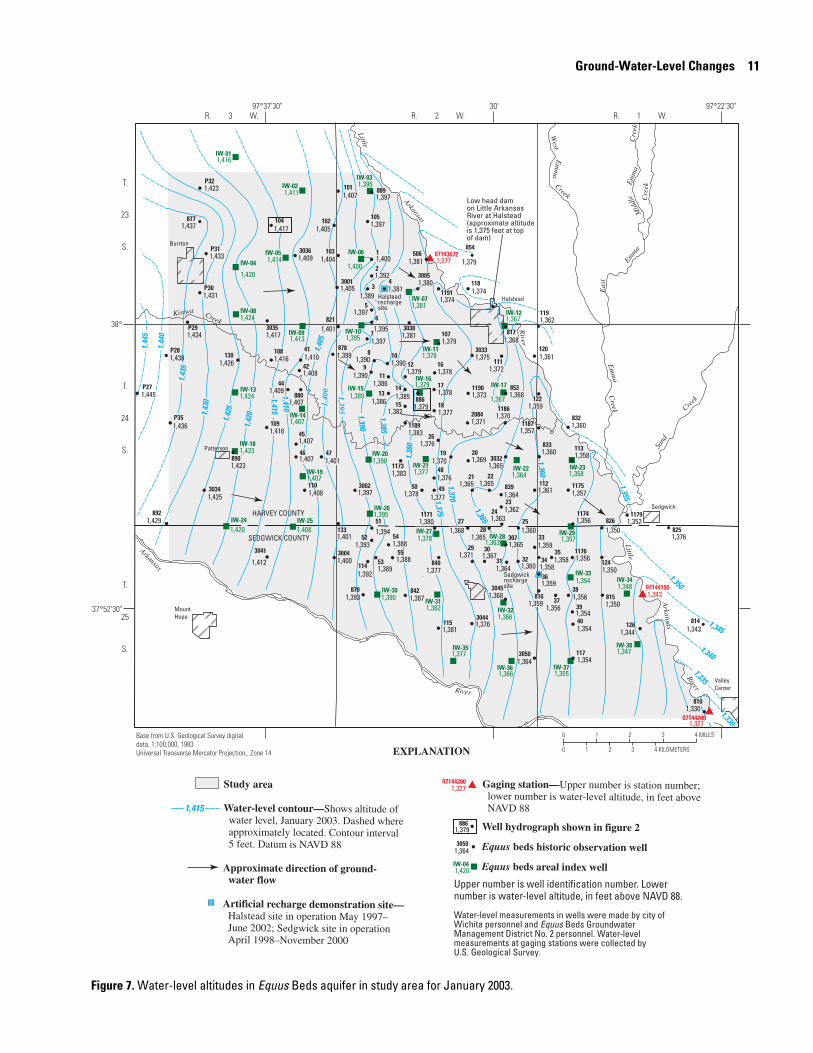
Water-level-altitude maps for August 1940, October 1992, April 2000, and January 2003 (figs. 4, 5, 6, and 7) were constructed from available water-level data from wells to illus-trate water-level conditions in the study area at selected times. Figures 6 and 7 include average daily surface-water-level alti-tude measurements computed for selected days from data auto-matically collected by equipment at U.S. Geological Survey gaging stations on the Little Arkansas River. No gaging sta-tions on the Arkansas River are in the study area. Figure 7 also includes water-level-altitude measurements from the areal index wells. In most cases the measured water levels and com-puted water-level altitudes and declines for each pair of shallow and deep areal index wells were similar to each other and to nearby wells, indicating that the aquifer is well connected hydraulically in those areas. Where significant differences occur between water levels in an areal-index-well pair, the shal-low and deep parts of the aquifer are less well connected hydraulically due to semiconfined conditions. In these areas, the water-level altitudes and declines were used from the well of the areal-index-well pair that indicated a better hydraulic connection to the part of the aquifer to which nearby wells are open than did the other well in the pair. Water-level altitudes and declines from deep areal index wells IW–1, IW–2, and IW–4 were used because they were similar to those of nearby wells indicating that the aquifer was better connected hydrauli-cally between these deep areal index wells and the nearby wells than between the shallow areal index wells and the nearby wells. In all other areal-index-well pairs, the water-level alti-tudes and declines in the shallow wells were used because they indicated that the aquifer was as well or better connected hydraulically between the shallow areal index wells and the nearby wells than between the deep areal index wells and the nearby wells.
Figures 4, 5, 6, and 7, respectively, illustrate conditions during predevelopment (August 1940), record low water levels in October 1992, maximum recovery to date following the record low water levels (April 2000), and current conditions (January 2003). Prior to pumpage from the Equus Beds aquifer in 1940, near-predevelopment conditions existed in the study area (Williams and Lohman, 1949; Aucott and Myers, 1998). The August 1940 water-level-altitude map from Stramel (1956) that was modified by Aucott and Myers (1998) (fig. 4) shows that ground water flowed generally from west to east and dis-charged to the Little Arkansas River. Water-level-altitude maps for August 1940 and January 1955 (Stramel, 1956); for January
1957, January 1970, January 1993, and January 1998 (Aucott and Myers, 1998); for January 1997 (Aucott and others, 1998); for October 1992 and January 2000 (Hansen and Aucott, 2001); and for April 2000 and January 2003 (figs. 6 and 7) indicate that, following development, ground-water flow remained from west to east, but that between the central part of the study area and the Little Arkansas River and in the vicinity of Halstead and Sedgwick, the flow generally became more southerly and more parallel to the river. Flow in the aquifer in the central part of the study area was less southerly during January 2003 than in April 2000 (compare figs. 6 and 7), which probably was due to the continued decrease in city pumpage in the study area during this period.
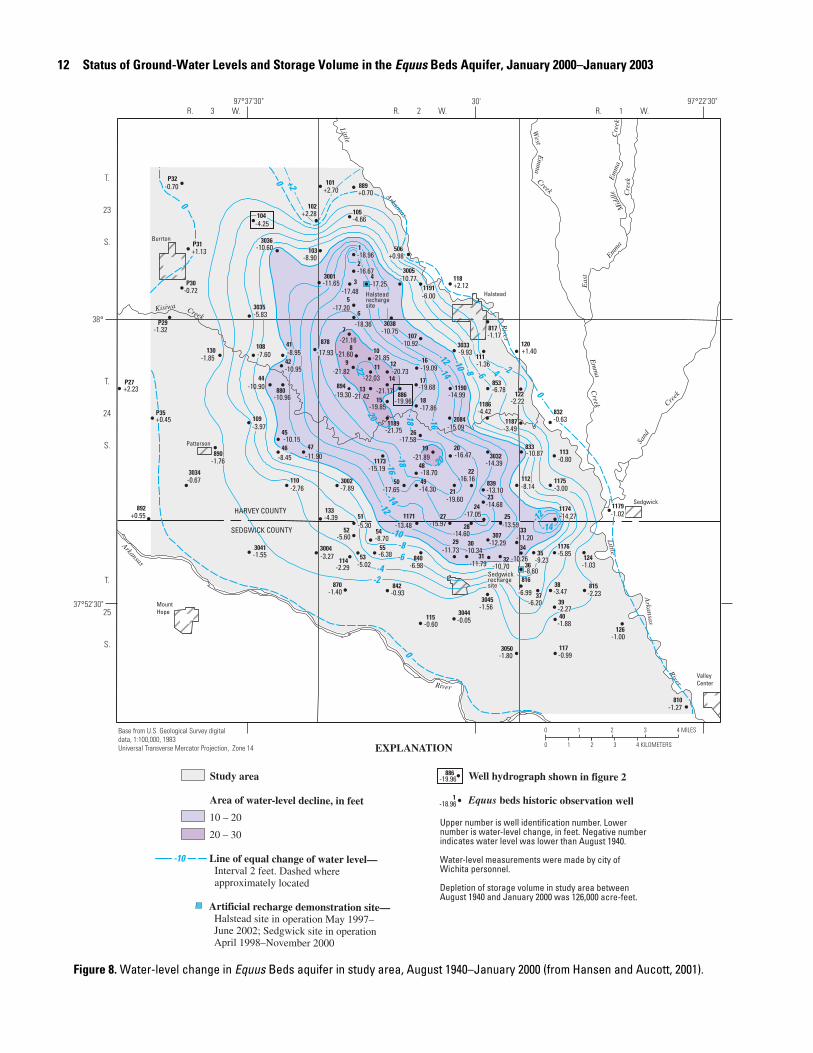
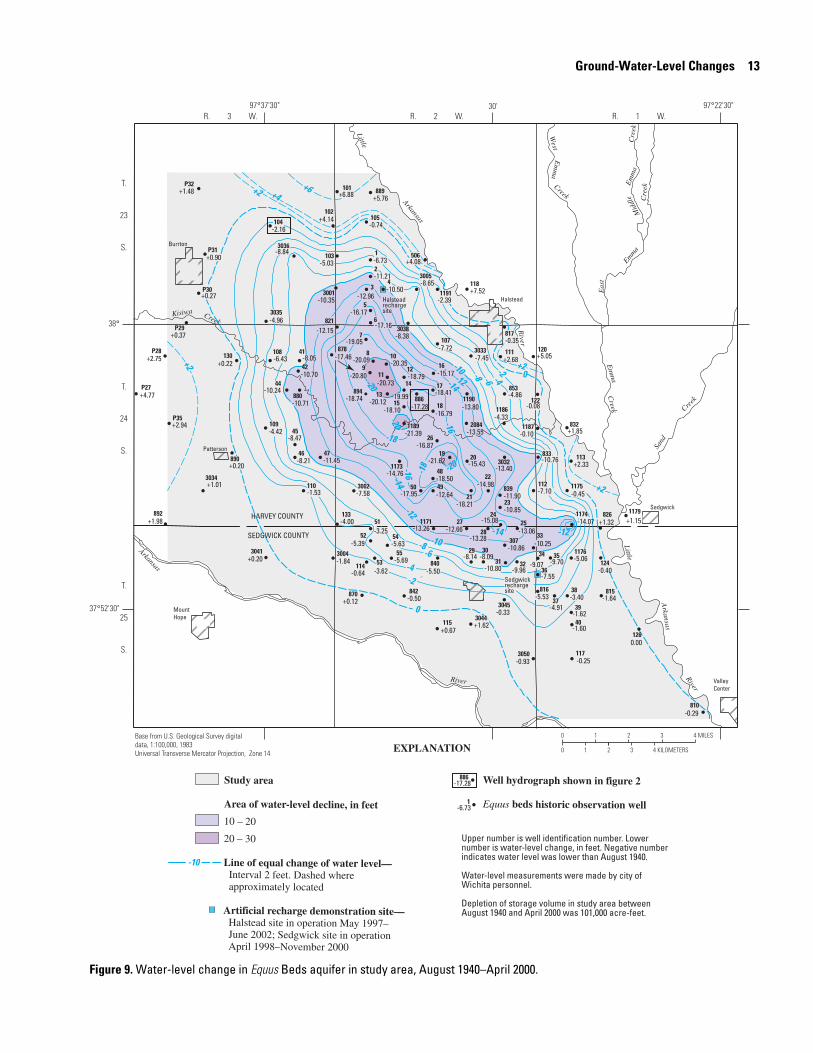
Water-level change maps were constructed from available water-level data to show changes between August 1940 (prede-velopment) and quarter-year intervals from January 2000 to January 2003 (figs. 8–20). In constructing these maps, if a 1940 water-level measurement did not exist for a well in the study area, one was interpolated from the August 1940 water-level altitude map (fig. 4). In figures 18, 19, and 20 where substantial differences between water-level-decline values shown for an areal index well and a nearby Equus beds historic observation well indicated improbable hydrologic conditions, the most probable value was used, and the value associated with the other well was ignored when constructing the lines of equal water-level decline. Some of these substantial differences may be due to the variability of the aquifer material over short distances or to water-level changes caused by pumping or precipitation that occurred between when the areal index wells and the rest of the wells in the study were measured.
The shapes of the water-level change contours since August 1940 for the period January 2000 to January 2003 (figs. 8–20) are similar to those published for recent years (Aucott and Myers, 1998; Aucott and others, 1998; Hansen and Aucott, 2001). Comparison of figures 8–20 shows the annual cycle of water-level declines and rises that generally occurs in the study area. Typically, the largest water-level declines occur during summer or fall when agricultural irrigation and city pumpage are greatest. This is shown most distinctly by the expansion of areas with water-level declines of 20 or more feet since 1940 during 2000–02 in the months of July and October (figs. 10, 11, 14, 15, 18, and 19) as compared to the areas with declines of 20 or more feet during 2000–03 in the months of January and April (figs. 8, 9, 12, 13, 16, 17, and 20). The max-imum water-level decline since August 1940 for the period Jan-uary 2000 to January 2003 was 29.54 ft in July 2002 at well 3 in the northern part of the study area (fig. 18). As vegetation and human water use decrease following the summer months, so does agricultural irrigation and city pumpage, resulting in water-level rises that can continue into the following spring. The maps of water-level changes since August 1940 for the period January 2000 to January 2003 show these water-level rises most obviously as the decrease in the size or disappearance of the areas with declines of 20 ft or more during January and April (figs. 8, 9, 12, 13, 16, 17, and 20). The maximum water-level rise since August 1940 for the period January 2000 to
8 Status of Ground-Water Levels and Storage Volume in the Equus Beds Aquifer, January 2000–January 2003
T.
25
S.
T.
24
S.
T.
23
S.
R. 3 W. R. 2 W. R. 1 W.
Base from U.S. Geological Survey digitaldata, 1:100,000, 1983 Universal Transverse Mercator Projection, Zone 14
Kisiwa
Little
Little
Arkansas
Arkansas
River
RiverRiver
Em
ma
Creek
West
Em
ma
Creek
Creek
Sand
Creek
Arkansas
877
889
1
2
34
5
6821
878
506 854
892
63
7
8
9
10
11 12
14
16
17
18
886
15
13
1920
21
23
24
22 839
894
886
853
817
25
833
832
826825
810
12
815
812
816870 842
840
307
Mount Hope
Patterson
Burrton
Bentley
Sedgwick
Halstead
ValleyCenter
HARVEY COUNTY
SEDGWICK COUNTY
43
814
0 1 2 3 4 MILES
0 1 2 3 4 KILOMETERS
Study area
Water-level contour—Shows altitude of water level, August 1940. Dashed where approximately located. Contour interval 5 feet. Datum is NGVD 1929
Approximate direction of ground-water flow
Well hydrograph shown in figure 2
Equus beds historic observation well1
EXPLANATION
1,375
30'
Eas
t
Emm
aM
iddl
eE
mm
aC
reek
Cre
ek
Upper number is well identification number. Lowernumber is water-level altitude, in feet above NGVD 29.
Water-level measurements were made by city of Wichita personnel.
97˚22'30"97˚37'30"
38˚
37˚52'30"
1,438
1,400
1,381
1,394
1,405
1,4091,409
1,409
1,4021,407
1,407
1,400 1,394
1,3981,4041,395
1,363
1,377
1,389
1,376
1,376
1,378
1,382 1,380
1,374
1,384
1,3561,369
1,371
1,402
1,412
1,412
1,409
1,408
1,413
1,413
1,4151,416
1,414
1,429
1,396 1,390
1,388
1,377
1,357
1,343
1,350
1,334
1,334
1,369
1,418
1,379
1370
1,4101,4051,400
1,395 1,390 1,385
1,380
1,375
1,370
1,365
1,360
1,3551,350
1,340
1,335
1,345
1,415
1,420
1,4251,4301,435
1,440
1,41
0
1,40
5
1,40
0
1,39
5
1,39
0
1,385
1,38
0
1,37
5
1,37
0
1,36
5
1,36
0
1,35
5
1,35
0
1,41
5
1,420
1,425
1,430
1,43
51,
440
1,398
Figure 4. Water-level altitudes in Equus Beds aquifer in study area for August 1940 (modified from Stramel, 1956, and Aucott and Myers, 1998).
Ground-Water-Level Changes 9
T.
25
S.
T.
24
S.
T.
23
S.
R. 3 W. R. 2 W. R. 1 W.
Base from U.S. Geological Survey digitaldata, 1:100,000, 1983 Universal Transverse Mercator Projection, Zone 14
Kisiwa
Little
Little
Arkansas
River
River
River
Em
ma
Creek
West
Em
ma
Creek
Creek
Sand
Creek
Arkansas
Mount Hope
Patterson
Burrton
Bentley
Sedgwick
Halstead
ValleyCenter
HARVEY COUNTY
SEDGWICK COUNTY
0 1 2 3 4 MILES
0 1 2 3 4 KILOMETERS
30'
Eas
t
Emm
aM
iddl
eE
mm
aC
reek
Cre
ek
Arkansas
97˚22'30"97˚37'30"
38˚
37˚52'30"
1,440
1,43
51,
430
1,42
5
1,42
0
1,41
5
1,41
0
1,40
5
1,400 1,395
1,390
1,380
1,38
51,385 1,380
1,375
1,370 1,365
1,360 1,355
1,35
0
1,34
5
1,340
1,350
1,345
1,355
1,355
1,360
1,365
1,370
1,375
1,380
1,395
1,400
1,405
1,4101,415
1,4201,4251,4301,435
1,440
1,390
1,335
1,4451,445
1,400
1,400
1,408
1,416
1,435
1,430
1,428
1,433
1,4391,423
1,422
1,420
1,424
1,428
1,418
1,414
1,411
1,405
1,411
1,391
1,398
1,3981,389
1,390 1,384
1,373
1,3731,390 1,384
1,3821,386
1,391
1,435
1,445
1,395
1,380
1,372
1,368 1,361
1,381
1,362
1,378
1,371
1,355
1,366 1,3601,364
1,359
1,362
1,362
1,357
1,363 1,354
1,353 1,352
1,352
1,360
1,3731,378
1,346
1,346
1,3541,360
1,351
1,347
1,342
1,332
1,332
1,352 1,352
1,351
1,373
1,358 1,350 1,350 1,348
1,348
1,348
1,348
1,349 1,347
1,344 1,345
1,346
1,342
1,353 1,349
1,354 1,352
1,351
1,364
1,356
1,361
1,362 1,360
1,3611,365
1,366
1,399
1,397
1,401
1,392
1,413
1,413
1,391
1,3941,400
1,387
1,377
1,365
1,380
1,373
1,3821,368
1,366
1,368 1,367 1,365 1,365
1,363
1,3591,354
1,353
1,352
1,352
1,352
1,362
1,390
1
2
3 4
506854
7
12
1413894
817
18
886
15
20
853
832
833
21 22
23
24 25
307
815
826 825
812
810
12
814
1,402
877
889
870 842
840
839
5
892
Low head dam on Little Arkansas River at Halstead(approximate altitude is 1,375 feet at topof dam)
886Study area
Water-level contour—Shows altitude of water level, October 1992. Dashed where approximately located. Contour interval 5 feet. Datum is NGVD 29 Approximate direction of ground-water flow
Well hydrograph shown in figure 2
Equus beds historic observation well1
EXPLANATION
Upper number is well identification number. Lowernumber is water-level altitude, in feet above NGVD 29.
Water-level measurements were made by city of Wichita personnel.
1,375 1,380
1,360
P32
P31
104
3036
102
106P30
P29
101
105
103
3001
3038
1191 118
3039
P28
P27
P35,
3034
890
110
47
109
131
130 108
132
45
44
41
42 16
17
26
50 49 112
3033
1190
107
111
3002
133
3032
1186
123
121
119
120
51 28271171
1179
1175
113
122
1174
1187
117
1176 124
125
39
37
36
34 35
38
40
114
3050
3044115
54
55
52 33
29 30 31 325330043041
834
3035
3045
Figure 5. Water-level altitudes in Equus Beds aquifer in study area for October 1992 (modified from Hansen and Aucott, 2001).
10 Status of Ground-Water Levels and Storage Volume in the Equus Beds Aquifer, January 2000–January 2003
Low head dam on Little Arkansas River at Halstead(approximate altitude is 1,375 feet at topof dam)
T.
25
S.
T.
24
S.
T.
23
S.
R. 3 W. R. 2 W. R. 1 W.
Base from U.S. Geological Survey digitaldata, 1:100,000, 1983 Universal Transverse Mercator Projection, Zone 14
Kisiwa
Little
Little
Arkansas
River
RiverRiver
Em
ma
Creek
West
Em
ma
Creek
Creek
Sand
Creek
Arkansas
Mount Hope
Patterson
Burrton
Sedgwick
Halstead
ValleyCenter
HARVEY COUNTY
SEDGWICK COUNTY
0 1 2 3 4 MILES
0 1 2 3 4 KILOMETERS
Study area
Water-level contour—Shows altitude of water level, April 2000. Dashed where approximately located. Contour interval 5 feet. Datum is NAVD 88 Approximate direction of ground- water flow
Artificial recharge demonstration site— Halstead site in operation May 1997– June 2002; Sedgwick site in operation April 1998–November 2000
Gaging station—Upper number is station number; lower number is water-level altitude, in feet above NAVD 88
Well hydrograph shown in figure 2
Equus beds historic observation well
EXPLANATION
30'
Eas
t
Emm
aM
iddl
eE
mm
aC
reek
Cre
ek
Arkansas
97˚22'30"97˚37'30"
38˚
37˚52'30"
1,415
1,415
1,41
0
1,42
01,43
0 1,42
5
1,390
1,395
1,400
1,405
1,380
1,385
1,43
5
1,375
1,370
1,365
1,360
1,355
1,44
0
1,445
1,45
0
1,345
1,350
1,340
1,335
1,330
Halsteadrechargesite
Sedgwickrechargesite
1
8
9
5
43
2
7
6
13
16
22
2524
2321
2019
18
14
12
33
3431
30
42
55
54
53
52
51
50 49
48
4746
45
44
41
40
39
38
37
36
3532
29
28
27
26
17
15
10
11
892
870 842
880
889
886
853
840
839
833
832
817
815
506
307
P31
P32
P30
P28
P29
101
P35
P27
890
133
130
126
810
124
122
120
119
118
117
115
114
113
112
111
110
109
108
107
105104
103
102
826 825
814
816
878
894
821
3032
3001
3035
3050
3050
3045
3044
3041
3038
3034
3033
3004
3002
1191
854
1190
1187
1186
1179
1176
1175
11741171
3036
2084
1189
1173
3005
07144200
07143672
07144100
07143672
1,328
1,378
1,345
1,378
1,389
1,363
1,431
1,397 1,390
1,406
1,385
1,380
1,408
1,390
1,366
1,361
1,363
1,3651,364
1,3691,368
1,377
1,384
1,3841,388
1,397
1,3921,395
1,398
1,406
1,381
1,372
1,383
1,365
1,361
1,365
1,371
1,355
1,334
1,386
1,367
1,438
1,432
1,436
1,444
1,4401,396
1,362
1,365
1,369
1,409
1,416
1,409
1,421
1,441
1,450
1,391
1,392
1,395
1,396
1,398
1,377 1,378
1,373
1,4031,409
1,409
1,411
1,412
1,360
1,359
1,358
1,361
1,362
1,3601,3621,363
1,374
1,3671,370
1,376
1,366
1,366
1,373
1,380
1,415
1,386
1,428
1,381
1,404
1,398
1,375
1,387
1,374
1,364
1,371
1,356
1,357
1,364
1,3531,377
1,427
1,404
1,430
1,348
1,353
1,363
1,370
1,362
1,380
1,360
1,385
1,397
1,365
1,363
1,378
1,412
1,417
1,4191,383
1,4051,424
1,410
1,412
1,416
1,358 1,375
1,349
1,364
1,3831,371
1,380
1,381
1,397
1,386
1,3961,404
1,386
1,377
1,389
8861,381
Upper number is well identification number. Lowernumber is water-level altitude, in feet above NAVD 88.
Water-level measurements in wells were made by city of Wichita personnel and Equus Beds GroundwaterManagement District No. 2 personnel. Water-level measurements at gaging stations were collected byU.S. Geological Survey.
Figure 6. Water-level altitudes in Equus Beds aquifer in study area for April 2000.
Ground-Water-Level Changes 11
T.
25
S.
T.
24
S.
T.
23
S.
R. 3 W. R. 2 W. R. 1 W.
Base from U.S. Geological Survey digitaldata, 1:100,000, 1983 Universal Transverse Mercator Projection, Zone 14
Kisiwa
Little
Little
Arkansas
River
RiverRiver
Em
ma
Creek
West
Em
ma
Creek
Creek
Sand
Creek
Arkansas
Mount Hope
Patterson
Burrton
Sedgwick
Halstead
ValleyCenter
HARVEY COUNTY
SEDGWICK COUNTY
0 1 2 3 4 MILES
0 1 2 3 4 KILOMETERS
30'
Eas
t
Emm
aM
iddl
eE
mm
aC
reek
Cre
ek
Arkansas
Low head dam on Little Arkansas River at Halstead(approximate altitude is 1,375 feet at topof dam)
97˚22'30"97˚37'30"
38˚
37˚52'30"
1,343
1,377
Halsteadrechargesite
Sedgwickrechargesite
1,415
1,40
5
1,410
1,42
0
1,42
5
1,390
1,385
1,38
0
1,375
1,43
0
1,365
1,370
1,43
5
1,360
1,44
0
1,355
1,350
1,345
1,340
1,44
5
1,335
1,330
1,3951,40
0
1,365
1,376
1,429
1,393 1,387
1,400
1,386
1,378
1,407
1,390
1,365
1,360
1,3631,362
1,365
1,3691,370
1,377
1,385
1,3791,390
1,397
1,3811,389
1,397
1,379
1,379
1,368
1,377
1,364
1,360
1,360
1,368
1,350
1,330
1,381
1,365
1,437
1,343
1,433
1,423
1,431
1,438
1,4341,397
1,359
1,364
1,367
1,408
1,407
1,405
1,417
1,436
1,445
1,388
1,388
1,389
1,393
1,394
1,378 1,377
1,376
1,4011,407
1,407
1,409
1,410
1,354
1,354
1,3561,356
1,359
1,3581,3581,360
1,371
1,3651,368
1,376
1,364
1,368
1,376
1,412
1,381
1,425
1,375
1,400
1,397
1,374
1,373
1,357
1,370
1,352
1,356
1,357
1,3561,380
1,423
1,401
1,426
1,344
1,350
1,359
1,361
1,362
1,374
1,354
1,381
1,392
1,358
1,361
1,372
1,408
1,416
1,416
1,379
1,3971,417
1,4041,409
1,350
1,359
1,3821,371
1,383
1,383
1,399
1,386
1,3951,401
1,3801,392
1,405
1,378
1,390
07144200
07144100
07143672
1,327
IW-38
IW-37IW-36
IW-35
IW-34IW-33
IW-32IW-31
IW-30
IW-29IW-28IW-27
IW-26
IW-25IW-24
IW-23IW-22IW-21
IW-20
IW-19
IW-18
IW-17IW-16
IW-15
IW-14
IW-13
IW-12
IW-11
IW-10IW-09
IW-08
IW-07
IW-06IW-05IW-04
IW-03IW-02
IW-01
1
8
9
5
43
2
7
6
13
16
22
2524
23
21
2019
18
14
12
33
31
30
42
55
54
53
52
51
50 49
48
4746
45
44
41
40
39
38
37
36
3435
32
29
2827
26
17
15
10
11
892
870 842
880
889
886
853
840
839
833
832
817
815
506854
307
P31
877
P32
P30
P28
P29
101
P35
P27
890
133
130
126 814
825
810
124
122
120
119
118
117
115
114
113
112
111
110
109
108
107
105104
103
102
826
816
878
821
3032
3001
3035
3050
3045
3044
3041
3038
3034
3033
3004
3002
1191
1190
1187
1186
1179
1176
1175
11741171
3036
2084
1189
1173
3005
1,347
1,3551,366
1,377
1,3481,354
1,3661,382
1,390
1,3571,3631,378
1,395
1,4081,420
1,3581,3641,3771,390
1,407
1,423
1,367
1,3791,389
1,407
1,424
1,367
1,378
1,3951,413
1,424
1,381
1,4001,414
1,420
1,3951,411
1,416
886
07144200
3050
1,415
Study area
Water-level contour—Shows altitude of water level, January 2003. Dashed where approximately located. Contour interval 5 feet. Datum is NAVD 88 Approximate direction of ground- water flow
Artificial recharge demonstration site— Halstead site in operation May 1997– June 2002; Sedgwick site in operation April 1998–November 2000
Gaging station—Upper number is station number; lower number is water-level altitude, in feet above NAVD 88
Well hydrograph shown in figure 2
Equus beds historic observation well
Equus beds areal index well
EXPLANATION
Upper number is well identification number. Lowernumber is water-level altitude, in feet above NAVD 88.
Water-level measurements in wells were made by city of Wichita personnel and Equus Beds GroundwaterManagement District No. 2 personnel. Water-level measurements at gaging stations were collected byU.S. Geological Survey.
1,364
1,379
1,327
1,420IW-04
Figure 7. Water-level altitudes in Equus Beds aquifer in study area for January 2003.
12 Status of Ground-Water Levels and Storage Volume in the Equus Beds Aquifer, January 2000–January 2003
T.
25
S.
T.
24
S.
T.
23
S.
R. 3 W. R. 2 W. R. 1 W.
Base from U.S. Geological Survey digitaldata, 1:100,000, 1983 Universal Transverse Mercator Projection, Zone 14
Kisiwa
Little
Little
Arkansas
River
RiverRiver
Em
ma
Creek
West
Em
ma
Creek
Creek
Sand
Creek
Arkansas
Mount Hope
Patterson
Burrton
Sedgwick
Halstead
ValleyCenter
HARVEY COUNTY
SEDGWICK COUNTY
0 1 2 3 4 MILES
0 1 2 3 4 KILOMETERS
30'
Eas
t
Emm
aM
iddl
eE
mm
aC
reek
Cre
ek
Arkansas
97˚22'30"97˚37'30"
38˚
37˚52'30"
0
0
0
0 +2
-4
-4
-6
-6
-8
-8
-10
-10
-12
-12
-2
-2
-14
-14
-16
-16
-18-18
-20
-22
-12
-20
-14
1
8
9
5
43
2
7
6
13
16
22
2524
2321
2019
18
14
12
33
3431
30
42
55
54
53
52
51
50 49
48
4746
45
44
41
40
39
38
37
36
3532
29
28
27
26
17
15
10
11
892
870 842
880
889
886
853
840
839
833
832
817
815
506
307
P31
P32
P30
P29
101
P35
P27
890
133
130
126
810
124
122
120
118
117
115
114
113
112
111
110
109
108
107
105104
103
102
816
878
894
3032
3001
3035
3050
3045
3044
3041
3038
3034
3033
3004
3002
1191
1190
1187
1186
1179
1176
1175
11741171
3036
20841189
1173
3005
+0.55
-1.40 -0.93
+0.70
-6.78
-6.98
-0.63
-1.17
-2.23
-1.27
+0.98+1.13
-0.70
-0.72
-1.32
+2.70
-5.83
+0.45
+2.23
-6.38
-8.70
-5.02
-5.60
-5.30
-8.45
-8.95
-1.88
-2.27
-3.47-6.20
-8.60-9.23
-1.80
-1.56
-0.05
-1.55
-0.67
-9.93
-3.27
-7.89
-6.00
-3.49
-4.42
-1.02
-5.85
-3.00
-1.76
-4.39
-1.85
-1.00
-1.03
-2.22
+1.40
+2.12
-0.99
-0.60
-2.29
-0.80
-8.14
-1.36
-2.76
-3.97
-7.60
-4.66-4.25
-8.90
+2.28
-6.99
-18.70
-19.30
-14.39
-18.96
-21.42
-19.09
-10.96
-21.60
-16.16
-13.59-17.05
-14.68-19.60
-16.47-21.89
-17.86
-21.17
-20.73-21.82
-17.20
-17.25-17.48
-16.67
-19.96
-13.10
-10.87
-12.29
-21.16
-11.20
-11.79
-10.34
-10.95
-11.65
-17.65 -14.30
-11.90
-10.15
-10.90
-10.26-10.70
-11.73
-14.60-15.97
-17.58
-10.75
-14.99
-14.27-13.48
-10.92
-10.60
-19.68
-19.85
-15.09-21.75
-15.19
-17.93
-22.03
-18.36
-10.77
-21.85
Halsteadrechargesite
Sedgwickrechargesite
-18.96
886-19.96
1
-10
Study area
Area of water-level decline, in feet
10 – 20
20 – 30
Line of equal change of water level— Interval 2 feet. Dashed where approximately located
Artificial recharge demonstration site— Halstead site in operation May 1997– June 2002; Sedgwick site in operation April 1998–November 2000
Well hydrograph shown in figure 2
Equus beds historic observation well
EXPLANATION
Upper number is well identification number. Lowernumber is water-level change, in feet. Negative numberindicates water level was lower than August 1940.
Water-level measurements were made by city of Wichita personnel.
Depletion of storage volume in study area between August 1940 and January 2000 was 126,000 acre-feet.
Figure 8. Water-level change in Equus Beds aquifer in study area, August 1940–January 2000 (from Hansen and Aucott, 2001).
Ground-Water-Level Changes 13
T.
25
S.
T.
24
S.
T.
23
S.
R. 3 W. R. 2 W. R. 1 W.
Base from U.S. Geological Survey digitaldata, 1:100,000, 1983 Universal Transverse Mercator Projection, Zone 14
Kisiwa
Little
Little
Arkansas
River
River
River
Em
ma
Creek
West
Em
ma
Creek
Creek
Sand
Creek
Arkansas
Mount Hope
Patterson
Burrton
Sedgwick
Halstead
ValleyCenter
HARVEY COUNTY
SEDGWICK COUNTY
0 1 2 3 4 MILES
0 1 2 3 4 KILOMETERS
Eas
t
Emm
aM
iddl
eE
mm
aC
reek
Cre
ek
Arkansas
30' 97˚22'30"97˚37'30"
38˚
37˚52'30" 0
0
-4
-4
-6
-6
-8
-8
-10
-10
-12
-12
-2
+2
+2 +4+6
-2
+2
+2
-14
-14
-14
-16
-16
-18
-18
-20
-20
-12
-20
11
8
9
5
43
2
7
6
13
16
22
2524
2321
2019
18
14
12
33
3431
30
42
55
54
53
52
51
50 49
48
4746
45
44
41
40
39
38
37
36
3532
29
28
27
26
17
15
10
11
892
870 842
880
889
886
853
840
839
833
832
817
815
826
506
307
P31
P32
P30
P29
P28
101
P35
P27
890
133
130
126
810
124
122
120
118
117
115
114
113
112
111
110
109
108
107
105104
103
102
816
878
821
894
3032
3001
3035
3050
3045
3044
3041
3038
3034
3033
3004
3002
1191
1190
1187
1186
1179
1176
1175
11741171
3036
20841189
1173
3005
Halsteadrechargesite
Sedgwickrechargesite
0.00
+1.98
+0.12 -0.50
-6.73
+5.76
-4.86
-5.50
+1.85
-0.35
-1.64
-0.29
+4.08+0.90
+1.48
+0.27
+2.75
+0.37
-8.09
+6.88
-4.96
+2.94
+4.77
-5.69
-5.63
-3.62
-5.39
-3.25
-8.21
-8.47
-8.05
-1.60
-1.62
-3.40-4.91
-7.55
-9.70-9.07-9.96
-8.14
-0.93
-0.33
+1.62
+0.20
-8.38
+1.01
-7.45
-1.84
-7.58
-2.39
-0.10
-4.33
+1.15
-5.06
-0.45
+0.20
-4.00
+0.22
-0.40
-0.08
+5.05
+7.52
-0.25
+0.67
-0.64
+2.33
-7.10
+2.68
-1.53
-4.42
-6.43-7.72
-0.74-2.16
-5.03
+4.14
-8.84
+1.32
-5.53
-8.65
-13.40
-20.12
-15.17
-10.71
-20.09
-14.98
-13.06-15.08
-10.85-18.21
-15.43-21.62
-16.79
-19.99
-18.79-20.80
-16.17
-10.50-12.96
-11.21
-17.28
-11.90
-10.76
-10.86
-19.05
-10.25
-10.80
-10.70
-10.35
-17.95 -12.64
-18.50
-11.45
-10.24
-13.28-12.66
-16.87
-13.80
-14.07-13.26
-18.41
-18.10
-13.55-21.39
-14.76
-17.46
-20.73
-17.16-12.15
-20.35
-18.74
-6.73
886-17.28
1
-10
Study area
Area of water-level decline, in feet
10 – 20
20 – 30
Line of equal change of water level— Interval 2 feet. Dashed where approximately located
Artificial recharge demonstration site— Halstead site in operation May 1997– June 2002; Sedgwick site in operation April 1998–November 2000
Well hydrograph shown in figure 2
Equus beds historic observation well
EXPLANATION
Upper number is well identification number. Lowernumber is water-level change, in feet. Negative numberindicates water level was lower than August 1940.
Water-level measurements were made by city of Wichita personnel.
Depletion of storage volume in study area between August 1940 and April 2000 was 101,000 acre-feet.
Figure 9. Water-level change in Equus Beds aquifer in study area, August 1940–April 2000.
14 Status of Ground-Water Levels and Storage Volume in the Equus Beds Aquifer, January 2000–January 2003
T.
25
S.
T.
24
S.
T.
23
S.
R. 3 W. R. 2 W. R. 1 W.
Base from U.S. Geological Survey digitaldata, 1:100,000, 1983 Universal Transverse Mercator Projection, Zone 14
Kisiwa
Little
Little
Arkansas
River
River
River
Em
ma
Creek
West
Em
ma
Creek
Creek
Sand
Creek
Arkansas
Mount Hope
Patterson
Burrton
Sedgwick
Halstead
ValleyCenter
HARVEY COUNTY
SEDGWICK COUNTY
0 1 2 3 4 MILES
0 1 2 3 4 KILOMETERS
Eas
t
Emm
aM
iddl
eE
mm
aC
reek
Cre
ek
Arkansas
30' 97˚22'30"97˚37'30"
38˚
37˚52'30"
0
0
0
-4
-4
-4
-6
-6
-8
-8
-10
-10
-12
-12
-2
-2
-14
-14
-16
-16
-16
-18
-18-20
-20
-20-22
-22
-24
-24
-22
-26-28
-20
-22
-12
-20
1
8
9
5
43
2
7
6
13
16
22
2524
2321
20
19
18
14
12
33
3431
30
42
55
54
53
52
51
5049
48
4746
45
44
41
40
39
38
37
36
3532
29
28
27
26
17
15
10
11
892
870 842
880
889
886853
840
839
833
832
817
815
826
506
307
P31
P32
877
P30
P29
P28
101
P35
P27
890
133
130
126
810
124
122
120
118
117
115
114
113
112
111
110
109
108
107
105104
103
102
816
878
821
894
3032
3001
3035
3050
3045
3044
3041
3038
3034
3033
3004
3002
1191
1190
1187
1186
1179
1176
1175
11741171
3036
20841189
1173
3005
-0.97
-4.12 -0.06
-9.01
-6.53
-5.77
-1.79
-0.15
-2.12
-1.11
-4.22
-0.16
-0.83
-0.89
+0.80
-2.13
-9.12
-7.73
-6.37
-0.70
+2.20
-4.27
-4.11
-3.35
-4.93
-3.59
-8.05
-8.59
-7.96
-2.40
-2.54
-0.75-4.54
-7.15
-7.80-8.50-8.89
-9.47
-2.15
-2.07
-1.16
-1.43
-0.40
-2.30
-7.03
-3.18
-5.37
-4.58
-0.95
-4.55
-9.75
-1.70
-3.45
-2.23
-2.50
-3.95
-2.70
+0.23
+4.99
-0.64
-1.40
-1.60
-8.15
-7.64
-0.99
-2.00
-3.60
-6.50
+0.20
-5.67
-9.90
-19.28
-12.36
-23.13
-19.47
-17.32
-10.91
-19.77
-14.51
-11.98
-13.27-12.12
-16.91
-14.97
-19.24
-19.25
-20.93-20.15
-17.15
-19.22-21.98
-21.57
-11.64
-10.71
-10.36
-10.90
-18.67
-10.56
-10.40
-10.79
-13.42
-14.21-12.42
-18.01
-10.60
-11.93
-12.88-12.65
-15.45
-15.45
-15.55
-13.94-12.98
-19.18
-19.92-22.13
-16.56
-17.16
-17.56
-17.46
-16.77-20.91
-14.10
-16.58
-20.26
-17.70-14.20
-20.88
-22.03
-24.96
-29.17
-20.73
Halsteadrechargesite
Sedgwickrechargesite
-23.13
886-22.03
1
-10
Study area
Area of water-level decline, in feet
10 – 20
20 – 30
Line of equal change of water level— Interval 2 feet. Dashed where approximately located
Artificial recharge demonstration site— Halstead site in operation May 1997– June 2002; Sedgwick site in operation April 1998–November 2000
Well hydrograph shown in figure 2
Equus beds historic observation well
EXPLANATION
Upper number is well identification number. Lowernumber is water-level change, in feet. Negative numberindicates water level was lower than August 1940.
Water-level measurements were made by city of Wichita personnel.
Depletion of storage volume in study area between August 1940 and July 2000 was 152,000 acre-feet.
Figure 10. Water-level change in Equus Beds aquifer in study area, August 1940–July 2000.
Ground-Water-Level Changes 15
T.
25
S.
T.
24
S.
T.
23
S.
R. 3 W. R. 2 W. R. 1 W.
Base from U.S. Geological Survey digitaldata, 1:100,000, 1983 Universal Transverse Mercator Projection, Zone 14
Kisiwa
Little
Little
Arkansas
River
RiverRiver
Em
ma
Creek
West
Em
ma
Creek
Creek
Sand
Creek
Arkansas
Mount Hope
Patterson
Burrton
Sedgwick
Halstead
ValleyCenter
HARVEY COUNTY
SEDGWICK COUNTY
0 1 2 3 4 MILES
0 1 2 3 4 KILOMETERS
30'
Eas
t
Emm
aM
iddl
eE
mm
aC
reek
Cre
ek
Arkansas
97˚22'30"97˚37'30"
38˚
37˚52'30"
0
0
0
-4
-4
-6
-6
-8
-8
-10
-10
-12
-12
-2
-2
-14
-14
-16
-18
-8
-16
-18
-18
-18-20
-20
-22
-22
-20
1
8
9
5
43
2
7
6
13
16
22
2524
2321
20
19
18
14
12
33
3431
30
42
55
54
53
52
51
50 49
48
4746
45
44
41
40
39
38
37
36
353229
28
27
26
17
15
10
11
892
870
842
880
889
886 853
840
839
833
832
817
815
506
307
P31
P32
877
P30
P29
P28
101
P35
P27
890
133
130
126
810
124
122
120
118
117
115
114
113
112
111
110
109
108
107
105104
103
102
816
878
821
894
3032
3001
3035
3050
3045
3044
3041
3038
3034
3033
3004
3002
1191
1190
1187
1186
1179
1176
1175
1174
826
1171
3036
20841189
1173
3005
-1.30
-4.13
-1.21
-3.81
-6.91
-6.91
-3.67
-1.93
-4.14
-2.34
-1.80
+0.95
-1.16
-5.75
-2.08
-1.53
-3.15
-9.95
-2.49
-6.98
-1.56
+0.48
-7.68
-9.51
-8.17
-7.24
-5.58
-9.63
-9.91
-9.48
-5.30
-9.12
-6.10-7.80
-9.65
-4.07
-2.68
-2.85
-3.71
-2.67
-4.64
-7.90
-6.73
-7.48
-6.95
-2.39
-5.12
-7.66
-4.80
-4.98
-3.50
-2.67
-2.35
-3.93
-2.27
+3.45
-2.43
-3.48
-4.59
-7.30
-8.98
-4.48
-4.12
-4.19
-5.84
-8.77-8.65
-4.04
-0.55
-8.44
-19.73
-12.53
-21.21
-21.18
-21.72
-12.33
-22.17
-16.54
-13.91
-14.58-13.50
-19.72
-16.30-21.07
-18.07
-21.00
-21.71
-19.63
-22.70-22.26
-20.21 -12.14
-13.56
-12.00
-12.66
-21.35
-12.84
-12.27
-11.87
-16.78
-18.07 -13.82
-11.76
-12.33
-10.06-12.32-12.35
-12.15
-15.21-16.35
-16.92
-15.47
-12.57
-16.10
-13.77-11.35
-14.68
-15.42-14.70
-19.33
-20.04
-14.89-20.67
-14.12
-16.45-23.17
-22.49
-20.43-15.76
-14.54
-21.73
-22.04
-17.89
Halsteadrechargesite
Sedgwickrechargesite
-21.21
886-20.21
1
-10
Study area
Area of water-level decline, in feet
10 – 20
20 – 30
Line of equal change of water level— Interval 2 feet. Dashed where approximately located
Artificial recharge demonstration site— Halstead site in operation May 1997– June 2002; Sedgwick site in operation April 1998–November 2000
Well hydrograph shown in figure 2
Equus beds historic observation well
EXPLANATION
Upper number is well identification number. Lowernumber is water-level change, in feet. Negative numberindicates water level was lower than August 1940.
Water-level measurements were made by city of Wichita personnel.
Depletion of storage volume in study area between August 1940 and October 2000 was 159,000 acre-feet.
Figure 11. Water-level change in Equus Beds aquifer in study area, August 1940–October 2000.
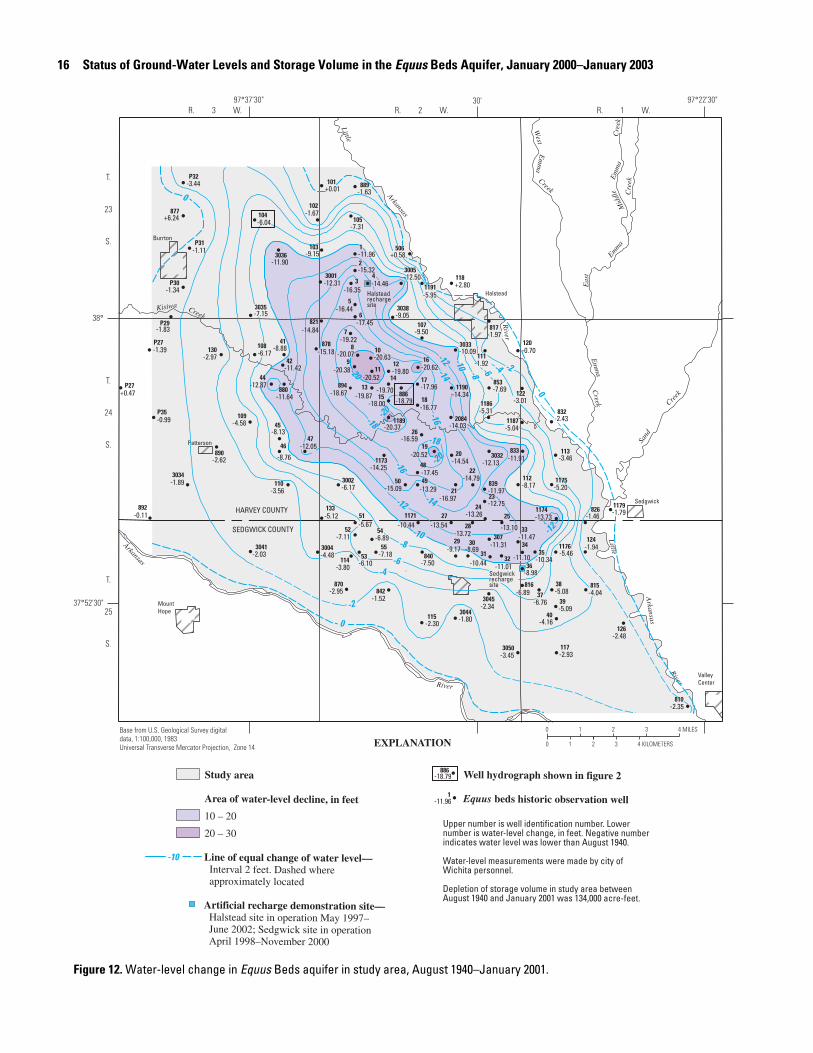
16 Status of Ground-Water Levels and Storage Volume in the Equus Beds Aquifer, January 2000–January 2003
T.
25
S.
T.
24
S.
T.
23
S.
R. 3 W. R. 2 W. R. 1 W.
Base from U.S. Geological Survey digitaldata, 1:100,000, 1983 Universal Transverse Mercator Projection, Zone 14
Kisiwa
Little
Little
Arkansas
River
RiverRiver
Em
ma
Creek
West
Em
ma
Creek
Creek
Sand
Creek
Arkansas
Mount Hope
Patterson
Burrton
Sedgwick
Halstead
ValleyCenter
HARVEY COUNTY
SEDGWICK COUNTY
0 1 2 3 4 MILES
0 1 2 3 4 KILOMETERS
Eas
t
Emm
aM
iddl
eE
mm
aC
reek
Cre
ek
Arkansas
30' 97˚22'30"97˚37'30"
38˚
37˚52'30"
0
0
0
-4
-4
-6
-6
-8
-8
-10
-10
-12
-12
-2
-2
-14
-14
-16
-16
-18
-18
-20
-12
-20
-20
1
8
9
5
43
2
7
6
13
16
22
2524
2321
2019
18
14
12
33
3431
30
42
55
54
53
52
51
50 49
48
4746
45
44
41
40
39
38
37
36
3532
29
28
27
26
17
15
10
11
892
870842
880
889
886
853
840
839
833
832
817
815
826
506
307
P31
P32
877
P30
P29
P27
101
P35
P27
890
133
130
126
810
124
122
120
118
117
115
114
113
112
111
110
109
108
107
105104
103
102
816
878
821
894
3032
3001
3035
3050
3045
3044
3041
3038
3034
3033
3004
3002
1191
1190
1187
1186
1179
1176
1175
11741171
3036
20841189
1173
3005
-0.11
-2.95-1.52
-1.63
-7.69
-7.50
-2.43
-1.97
-4.04
-2.35
+0.58
+6.24
-1.11
-3.44
-1.34
-1.39
-1.83
-8.69
+0.01
-7.15
-0.99
+0.47
-7.18
-6.89
-6.10
-7.11
-5.67
-8.76
-8.13
-8.88
-4.16
-5.09
-5.08-6.76
-8.98
-9.17
-3.45
-2.34
-1.80
-2.03
-9.05
-1.89
-4.48
-6.17
-5.95
-5.04
-5.31
-1.79
-5.46
-5.20
-2.62
-5.12
-2.97
-2.48
-1.94
-3.01
-0.70
+2.80
-2.93
-2.30
-3.80
-3.46
-8.17
-1.92
-3.56
-4.58
-6.17
-9.50
-7.31-6.04
-9.15
-1.67
-1.46
-6.89
-18.67
-12.13
-11.96
-19.87
-20.62
-11.64
-20.07
-14.79
-13.10
-13.26-12.75
-16.97
-14.54-20.52
-16.77
-19.70
-19.80-20.38
-16.44
-14.46-16.35
-15.32
-18.79
-11.97
-11.91
-11.31
-19.22
-11.47
-10.44
-11.42
-12.31
-15.09 -13.29
-17.45
-12.05
-12.87
-10.34-11.10-11.01
-13.72-13.54
-16.59
-10.09
-14.34
-13.73-10.44
-11.90
-17.96
-18.00
-20.37
-14.25
-15.18
-20.52
-17.45-14.84
-12.50
-14.03
-20.63
Halsteadrechargesite
Sedgwickrechargesite
-11.96
886-18.79
1
-10
Study area
Area of water-level decline, in feet
10 – 20
20 – 30
Line of equal change of water level— Interval 2 feet. Dashed where approximately located
Artificial recharge demonstration site— Halstead site in operation May 1997– June 2002; Sedgwick site in operation April 1998–November 2000
Well hydrograph shown in figure 2
Equus beds historic observation well
EXPLANATION
Upper number is well identification number. Lowernumber is water-level change, in feet. Negative numberindicates water level was lower than August 1940.
Water-level measurements were made by city of Wichita personnel.
Depletion of storage volume in study area between August 1940 and January 2001 was 134,000 acre-feet.
Figure 12. Water-level change in Equus Beds aquifer in study area, August 1940–January 2001.
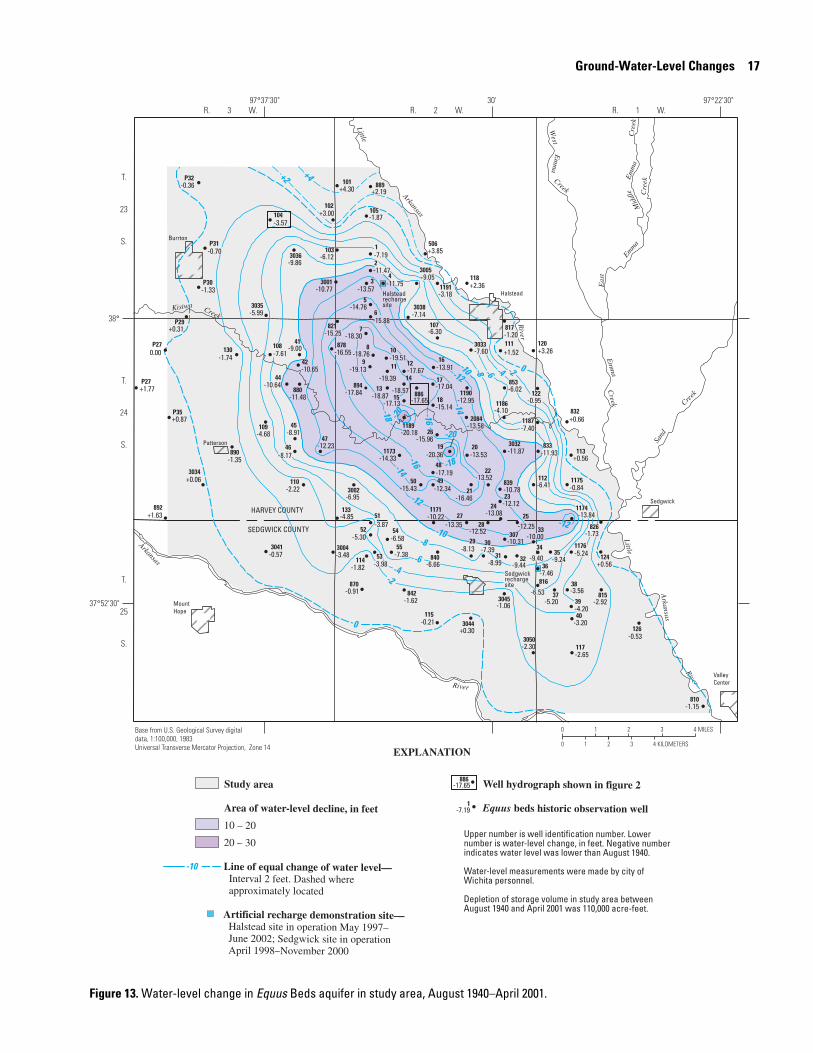
Ground-Water-Level Changes 17
T.
25
S.
T.
24
S.
T.
23
S.
R. 3 W. R. 2 W. R. 1 W.
Base from U.S. Geological Survey digitaldata, 1:100,000, 1983 Universal Transverse Mercator Projection, Zone 14
Kisiwa
Little
Little
Arkansas
River
RiverRiver
Em
ma
Creek
West
Em
ma
Creek
Creek
Sand
Creek
Arkansas
Mount Hope
Patterson
Burrton
Sedgwick
Halstead
ValleyCenter
HARVEY COUNTY
SEDGWICK COUNTY
0 1 2 3 4 MILES
0 1 2 3 4 KILOMETERS
Eas
t
Emm
aM
iddl
eE
mm
aC
reek
Cre
ek
Arkansas
30' 97˚22'30"97˚37'30"
38˚
37˚52'30"
0
0
-4
-4
-6
-6
-8
-8
-10
-10
-12
-12
-12
-2
-2
+2 +4
-14
-14
-16-16
-18
-18 -20
-20
1
8
9
5
43
2
7
6
13
16
22
2524
2321
2019
18
14
12
33
3431
30
42
55
54
53
52
51
50 49
48
4746
45
44
41
40
39
38
37
36
3532
29
2827
26
17
15
10
11
892
870842
880
889
886
853
840
839
833
832
817
815
826
506
307
P31
P32
P30
P29
P27
101
P35
P27
890
133
130
126
810
124
122
120
118
117
115
114
113
112
111
110
109
108
107
105104
103
102
816
878
821
894
3032
3001
3035
3050
3045
3044
3041
3038
3034
3033
3004
3002
1191
1190
1187
1186
1176
1175
11741171
3036
20841189
1173
3005
0.00
+1.63
-0.91-1.62
-7.19
+2.19
-6.02
-6.66
+0.66
-1.20
-2.92
-1.15
+3.85-0.70
-0.36
-1.33
+0.31
-8.99
-7.39
+4.30
-5.99
+0.87
+1.77
-7.38
-6.58
-3.98
-5.30
-3.87
-8.17
-8.91
-9.00
-3.20
-4.20
-3.56-5.20
-7.46
-9.24-9.40-9.44
-8.13
-2.30
-1.06
+0.30
-0.57
-7.14
+0.06
-7.60
-3.48
-6.95
-3.18
-7.40
-4.10
-5.24
-0.84
-1.35
-4.85
-1.74
-0.53
+0.56
-0.95
+3.26
+2.36
-2.65
-0.21
-1.82
+0.56
-6.41
+1.52
-2.22
-4.68
-7.61
-6.30
-1.87-3.57
-6.12
+3.00
-9.86
-1.73
-6.53
-9.05
-17.84
-11.87
-18.87
-13.91
-11.48
-18.76
-13.52
-12.25
-13.08-12.12
-16.46
-13.53
-15.14
-18.57
-17.67-19.13
-14.76
-11.75-13.57
-11.47
-17.65
-10.78
-11.93
-10.31
-18.30
-10.00
-10.65
-10.77
-15.43 -12.34
-17.19
-12.23
-10.64
-12.52-13.35
-15.96
-12.95
-10.22
-17.04
-17.13
-13.58-20.18
-14.33
-16.55
-19.39
-15.88
-15.25
-20.36
-13.84
-19.51
Halsteadrechargesite
Sedgwickrechargesite
-7.19
886-17.65
1
-10
Study area
Area of water-level decline, in feet
10 – 20
20 – 30
Line of equal change of water level— Interval 2 feet. Dashed where approximately located
Artificial recharge demonstration site— Halstead site in operation May 1997– June 2002; Sedgwick site in operation April 1998–November 2000
Well hydrograph shown in figure 2
Equus beds historic observation well
EXPLANATION
Upper number is well identification number. Lowernumber is water-level change, in feet. Negative numberindicates water level was lower than August 1940.
Water-level measurements were made by city of Wichita personnel.
Depletion of storage volume in study area between August 1940 and April 2001 was 110,000 acre-feet.
Figure 13. Water-level change in Equus Beds aquifer in study area, August 1940–April 2001.
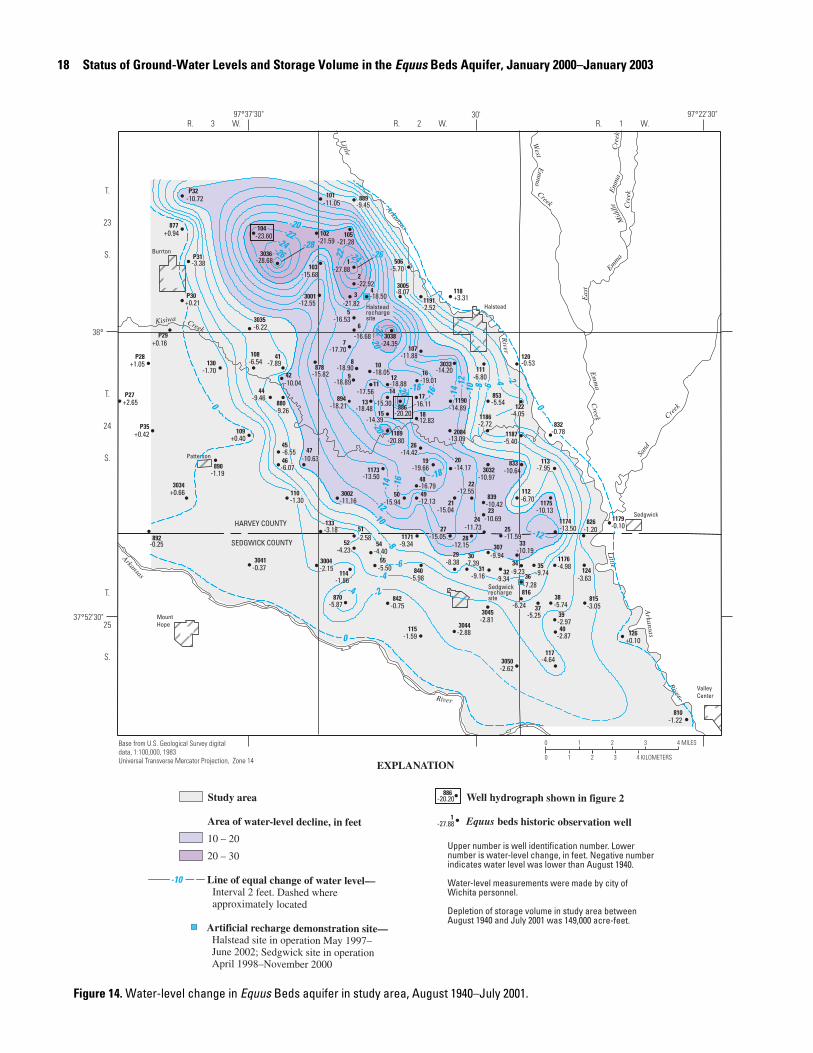
18 Status of Ground-Water Levels and Storage Volume in the Equus Beds Aquifer, January 2000–January 2003
T.
25
S.
T.
24
S.
T.
23
S.
R. 3 W. R. 2 W. R. 1 W.
Base from U.S. Geological Survey digitaldata, 1:100,000, 1983 Universal Transverse Mercator Projection, Zone 14
Kisiwa
Little
Little
Arkansas
River
RiverRiver
Em
ma
Creek
West
Em
ma
Creek
Creek
Sand
Creek
Arkansas
Mount Hope
Patterson
Burrton
Sedgwick
Halstead
ValleyCenter
HARVEY COUNTY
SEDGWICK COUNTY
0 1 2 3 4 MILES
0 1 2 3 4 KILOMETERS
Eas
t
Emm
aM
iddl
eE
mm
aC
reek
Cre
ek
Arkansas
30' 97˚22'30"97˚37'30"
38˚
37˚52'30"
0
00
-4-4
-4
-6
-6
-8
-8
-10
-10
-12
-12
-2
-2
-14
-14
-16
-16
-18
-18-20
-20-20
-20
-22
-22
-22
-24-24
-26 -26-28
-12
1
8
9
5
43
2
7
6
13
16
22
2524
2321
2019
18
14
12
33
3431
30
42
55
5452
51
50 49
48
47
46
45
44
41
40
39
38
37
36
3532
29
2827
26
17
15
10
11
892
870 842
880
889
886
853
840
839
833
832
815
826
506
307
P31
P32
877
P30
P29
101
P35
P27
P28
890
133
130
126
810
124
122
120
118
117
115
114
113
112
111
110
109
108107
105104
103
102
816
878
894
3032
3001
3035
3050
3045
3044
3041
3038
3034
3033
3004
3002
1191
1190
1187
1186
1179
1176
1175
1174
1171
3036
20841189
1173
3005
-0.25
-5.87 -0.75
-9.26
-9.45
-5.54
-5.98
-0.78
-3.05
-1.22
-5.70
-9.94
+0.94
-3.38
+0.21
+1.05
+0.16
-9.16
-7.39
-6.22
+0.42
+2.65
-5.50
-4.40-4.23
-2.58
-6.07
-6.55
-9.46
-7.89
-2.87
-2.97
-5.74-5.25
-7.28
-9.74-9.23-9.34
-8.38
-2.62
-2.81
-2.88
-0.37
+0.66
-2.15
-2.52
-5.40
-2.72
-0.10
-4.98
-9.34
-1.19
-3.18
-1.70
+0.10
-3.63
-4.05
-0.53
+3.31
-4.64
-1.59
-1.86
-7.95
-6.70
-6.80
-1.30
+0.40
-6.54
-1.20
-6.24
-8.07
-18.21
-10.97
-18.48
-19.01
-18.90
-12.55
-11.59-11.73
-10.69-15.04
-14.17-19.66
-12.83
-15.30
-18.88-18.89
-16.53
-18.50-21.82
-22.92
-10.42
-10.64
-10.72
-17.70
-10.19
-10.04
-11.05
-12.55
-15.94 -12.13
-16.79
-10.63
-12.15-15.05
-14.42
-14.20
-11.16
-14.89
-10.13
-13.50
-11.88
-21.28-23.60
-15.68
-21.59
-28.68
-16.11
-14.39
-13.09-20.80
-13.50
-15.82
-17.56
-16.68
-27.88
-20.20
-24.35
-18.05
Halsteadrechargesite
Sedgwickrechargesite
-27.88
886-20.20
1
-10
Study area
Area of water-level decline, in feet
10 – 20
20 – 30
Line of equal change of water level— Interval 2 feet. Dashed where approximately located
Artificial recharge demonstration site— Halstead site in operation May 1997– June 2002; Sedgwick site in operation April 1998–November 2000
Well hydrograph shown in figure 2
Equus beds historic observation well
EXPLANATION
Upper number is well identification number. Lowernumber is water-level change, in feet. Negative numberindicates water level was lower than August 1940.
Water-level measurements were made by city of Wichita personnel.
Depletion of storage volume in study area between August 1940 and July 2001 was 149,000 acre-feet.
Figure 14. Water-level change in Equus Beds aquifer in study area, August 1940–July 2001.
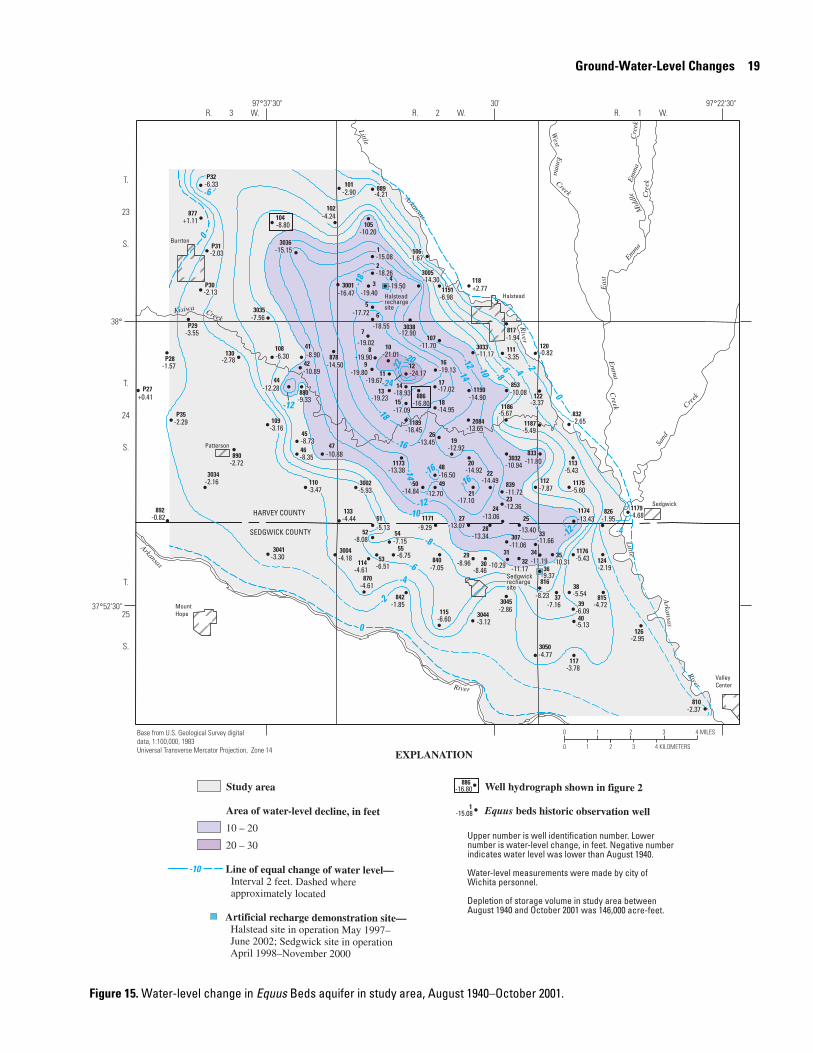
Ground-Water-Level Changes 19
T.
25
S.
T.
24
S.
T.
23
S.
R. 3 W. R. 2 W. R. 1 W.
Base from U.S. Geological Survey digitaldata, 1:100,000, 1983 Universal Transverse Mercator Projection, Zone 14
Kisiwa
Little
Little
Arkansas
River
RiverRiver
Em
ma
Creek
West
Em
ma
Creek
Creek
Sand
Creek
Arkansas
Mount Hope
Patterson
Burrton
Sedgwick
Halstead
ValleyCenter
HARVEY COUNTY
SEDGWICK COUNTY
0 1 2 3 4 MILES
0 1 2 3 4 KILOMETERS
30'
Eas
t
Emm
aM
iddl
eE
mm
aC
reek
Cre
ek
Arkansas
97˚22'30"97˚37'30"
38˚
37˚52'30"
0
0
0
-4
-4
-6
-6
-6
-8
-8
-10
-10
-12
-12
-2
-2
-14
-14
-16
-16-16
-18
-18
-20
-24
-12-2
2
-12 -4
1
8
9
5
43
2
7
6
13
16
22
2524
2321
20
19
18
14
12
33
3431
30
42
55
54
53
52
51
50 49
48
4746
45
44
41
40
39
38
37
36
3532
29
28
27
26
17
15
10
11
892
870
842
880
889
886
853
840
839
833
832
817
815
506
307
P31
P32
877
P30
P29
101
P35
P27
P28
890
133
130
126
810
124
122
120
118
117
115
114
113
112
111
110
109
108
107
105104
102
816
878
3032
3001
3035
3050
3045
3044
3041
3038
3034
3033
3004
3002
1191
1190
1187
1186
1179826
1176
1175
11741171
3036
20841189
1173
3005
-0.82
-4.61
-1.85
-9.33
-4.21
-7.05
-2.65
-1.94
-4.72
-2.37
-1.67
+1.11
-2.03
-6.33
-2.13
-1.57
-3.55
-8.46
-2.90
-7.56
-2.29
+0.41
-6.75
-7.15
-6.51
-8.08
-5.13
-8.35
-8.73
-8.90
-5.13
-6.09
-5.54-7.16
-9.37
-8.96
-4.77
-2.86
-3.12
-3.30
-2.16
-4.18
-5.93
-6.98
-5.49
-5.67
-4.68
-5.43
-5.60
-9.29
-2.72
-4.44
-2.78
-2.95
-2.19
-3.37
-0.82
+2.77
-3.78
-6.60
-4.61
-5.43
-7.87
-3.35
-3.47
-3.16
-6.30
-8.80-4.24
-1.95
-8.23
-10.94
-15.08
-19.23
-19.13
-19.90
-14.49
-13.40
-13.06-12.36
-17.10
-14.92
-12.92
-14.95
-18.93
-19.80
-17.72
-19.50-19.40
-18.26
-10.08
-11.72
-11.80
-11.06
-19.02
-11.66
-10.29
-10.89
-16.47
-14.84 -12.70
-10.88
-10.31-11.19-11.17
-13.34-13.07
-13.45
-12.90
-11.17
-14.90
-13.43
-11.70
-10.20
-15.15
-17.02
-17.09
-13.65-18.45
-13.38
-14.50
-19.67
-18.55
-14.30
-24.17
-16.80
-16.50
-12.28
-21.01
Halsteadrechargesite
Sedgwickrechargesite
-15.08
886-16.80
1
-10
Study area
Area of water-level decline, in feet
10 – 20
20 – 30
Line of equal change of water level— Interval 2 feet. Dashed where approximately located
Artificial recharge demonstration site— Halstead site in operation May 1997– June 2002; Sedgwick site in operation April 1998–November 2000
Well hydrograph shown in figure 2
Equus beds historic observation well
EXPLANATION
Upper number is well identification number. Lowernumber is water-level change, in feet. Negative numberindicates water level was lower than August 1940.
Water-level measurements were made by city of Wichita personnel.
Depletion of storage volume in study area between August 1940 and October 2001 was 146,000 acre-feet.
Figure 15. Water-level change in Equus Beds aquifer in study area, August 1940–October 2001.

20 Status of Ground-Water Levels and Storage Volume in the Equus Beds Aquifer, January 2000–January 2003
T.
25
S.
T.
24
S.
T.
23
S.
R. 3 W. R. 2 W. R. 1 W.
Base from U.S. Geological Survey digitaldata, 1:100,000, 1983 Universal Transverse Mercator Projection, Zone 14
Kisiwa
Little
Little
Arkansas
River
RiverRiver
Em
ma
Creek
West
Em
ma
Creek
Creek
Sand
Creek
Arkansas
Mount Hope
Patterson
Burrton
Sedgwick
Halstead
ValleyCenter
HARVEY COUNTY
SEDGWICK COUNTY
0 1 2 3 4 MILES
0 1 2 3 4 KILOMETERS
Eas
t
Emm
aM
iddl
eE
mm
aC
reek
Cre
ek
Arkansas
30' 97˚22'30"97˚37'30"
38˚
37˚52'30"
0
0
0
-4
-4
-6
-6
-8
-8
-10
-10
-12
-12
-2
-2
-14
-14
-16
-16
-18-18
-18
-20
-20
-22
-12
1
8
9
5
43
2
7
6
13
16
22
2524
23
21
2019
18
14
12
33
34
31
30
42
55
54
53
52
51
5049
48
47
46
45
44
41
40
39
38
37
36
353229
28
27
26
17
15
10
11
892
870
842
880
889
886
853
840
839
833
832
817
815
826
506
307
P31
P32
877
P30
P29
P28
101
P35
P27
890
133
130
126
810
124
122
120
118
117
115
114
113
112
111
110
109
108107
105104
103
102
816
878
3032
3001
3035
3050
3045
3044
3041
3038
3034
3033
3004
3002
1191
1190
1187
1186
1179
1176
1175
11741171
3036
20841189
1173
3005
-0.79
-4.05
-2.30
-3.37
-8.13
-9.73
-2.81
-2.29
-4.94
-3.09
-0.53
+0.78
-2.17
-5.24
-2.95
-1.17
-3.86
-9.79
-8.48
-1.61
-7.21
-1.55
+0.01
-6.02
-8.31
-6.54
-8.92
-6.00
-8.81
-8.90
-8.78
-5.40
-5.16
-5.56-7.39
-8.94
-9.80-9.73
-4.60
-3.05
-3.10
-2.90
-2.83
-4.97
-6.20
-7.14
-5.41
-5.40
-2.25
-5.57
-5.69
-9.40
-2.98
-5.54
-3.42
-3.47
-2.40
-3.33
-0.64
+2.27
-4.30
-3.59
-4.28
-4.01
-7.85
-2.38
-3.68
-4.25
-7.63
-9.43-7.47-2.95
-2.42
-8.21
-10.82
-14.73
-18.74
-16.35
-11.75
-18.41
-13.56
-12.97-12.47
-10.79
-15.54
-14.06-19.27
-15.00
-17.99
-18.38
-16.25
-19.60
-19.48
-17.56
-11.42
-11.76
-10.87
-18.80
-11.49
-11.48
-13.04
-13.75-12.21
-16.27
-11.97
-11.77
-10.43-10.74
-13.03-13.02
-14.69
-12.35
-10.02
-13.72
-13.37
-10.21
-10.17-12.95
-17.23
-17.09
-13.36-18.28
-13.38
-14.12
-19.48
-16.45
-13.43
-22.73
-20.29
-18.33
Halsteadrechargesite
Sedgwickrechargesite
-14.73
886-17.56
1
-10
Study area
Area of water-level decline, in feet
10 – 20
20 – 30
Line of equal change of water level— Interval 2 feet. Dashed where approximately located
Artificial recharge demonstration site— Halstead site in operation May 1997– June 2002; Sedgwick site in operation April 1998–November 2000
Well hydrograph shown in figure 2
Equus beds historic observation well
EXPLANATION
Upper number is well identification number. Lowernumber is water-level change, in feet. Negative numberindicates water level was lower than August 1940.
Water-level measurements were made by city of Wichita personnel.
Depletion of storage volume in study area between August 1940 and January 2002 was 142,000 acre-feet.
Figure 16. Water-level change in Equus Beds aquifer in study area, August 1940–January 2002.
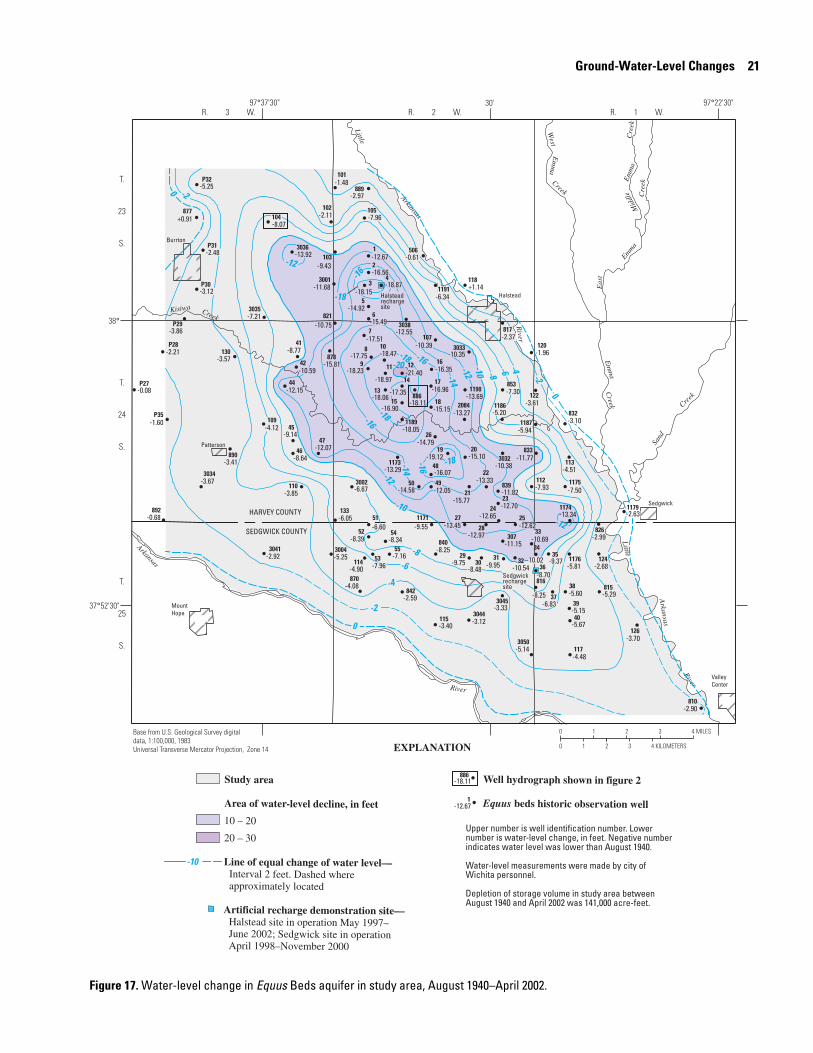
Ground-Water-Level Changes 21
T.
25
S.
T.
24
S.
T.
23
S.
R. 3 W. R. 2 W. R. 1 W.
Base from U.S. Geological Survey digitaldata, 1:100,000, 1983 Universal Transverse Mercator Projection, Zone 14
Kisiwa
Little
Little
Arkansas
River
River
River
Em
ma
Creek
West
Em
ma
Creek
Creek
Sand
Creek
Arkansas
Mount Hope
Patterson
Burrton
Sedgwick
Halstead
ValleyCenter
HARVEY COUNTY
SEDGWICK COUNTY
0 1 2 3 4 MILES
0 1 2 3 4 KILOMETERS
Eas
t
Emm
aM
iddl
eE
mm
aC
reek
Cre
ek
Arkansas
30' 97˚22'30"97˚37'30"
38˚
37˚52'30"
0
0
0
-4
-4
-6
-6
-8
-8
-10
-10
-12
-12
-2
-2
-2
-14
-14
-16
-16
-16
-12
-16
-18
-18
-18
-18
-20
-12
1
8
9
5
43
2
7
6
13
16
22
2524
2321
2019
18
14
12
33
3431
30
42
55
54
53
52
51
50 49
48
47
46
45
44
41
821
40
39
38
37
36
3532
29
28
27
26
17
15
10
11
892
870
842
889
886
853
840
839
833
832
817
815
826
506
307
P31
P32
877
P30
P29
101
P35
P27
P28
890
133
130
126
810
124
122
120
118
117
115
114
113
112110
109
107
105104
103
102
816
878
3032
3001
3035
3050
3045
3044
3041
3038
3034
3033
3004
3002
1191
1190
1187
1186
1179
1176
1175
1174
1171
3036
2084
1189
1173
-0.68
-4.08
-2.59
-2.97
-7.30
-8.25
-3.10
-2.37
-5.29
-2.90
-0.61
+0.91
-2.48
-5.25
-3.12
-2.21
-3.86
-9.95-8.48
-1.48
-7.21
-1.60
-0.08
-7.16
-8.34
-7.96
-8.39
-6.60
-8.64
-9.14
-8.77
-5.67
-5.15
-5.60-6.83
-8.70
-9.37-9.75
-5.14
-3.33
-3.12
-2.92
-3.67
-5.25
-6.67
-6.34
-5.94
-5.20
-2.63
-5.81
-7.50
-9.55
-3.41
-6.05
-3.57
-3.70
-2.68
-3.61
-1.96
+1.14
-4.48
-3.40
-4.90
-4.51
-7.93-3.85
-4.12
-7.96-8.07
-9.43
-2.11
-2.99
-8.25
-10.38
-12.67
-18.06
-16.35
-17.75
-13.33
-12.62-12.65
-12.70-15.77
-15.10-19.12
-15.15
-17.35
-18.23
-14.92
-18.87-18.15
-16.56
-18.11
-11.82
-11.77
-11.15
-17.51
-10.69
-10.59
-11.68
-14.58 -12.05
-16.07
-12.07
-12.15
-10.02-10.54
-12.97-13.45
-14.79
-12.55
-10.35
-13.69
-13.34
-10.39
-13.92
-16.96
-16.90 -13.27
-18.05
-13.29
-15.81
-18.97
-15.49-10.75
-21.40
-18.47
Halsteadrechargesite
Sedgwickrechargesite
-12.67
886-18.11
1
-10
Study area
Area of water-level decline, in feet
10 – 20
20 – 30
Line of equal change of water level— Interval 2 feet. Dashed where approximately located
Artificial recharge demonstration site— Halstead site in operation May 1997– June 2002; Sedgwick site in operation April 1998–November 2000
Well hydrograph shown in figure 2
Equus beds historic observation well
EXPLANATION
Upper number is well identification number. Lowernumber is water-level change, in feet. Negative numberindicates water level was lower than August 1940.
Water-level measurements were made by city of Wichita personnel.
Depletion of storage volume in study area between August 1940 and April 2002 was 141,000 acre-feet.
Figure 17. Water-level change in Equus Beds aquifer in study area, August 1940–April 2002.
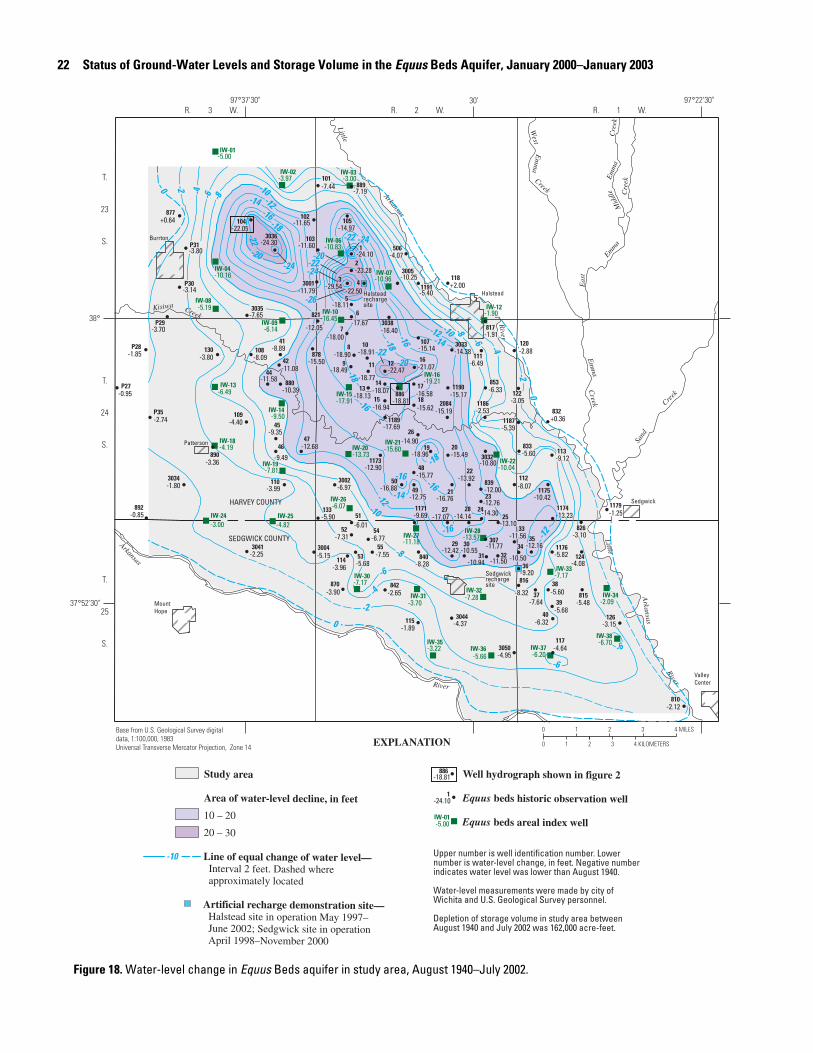
22 Status of Ground-Water Levels and Storage Volume in the Equus Beds Aquifer, January 2000–January 2003
T.
25
S.
T.
24
S.
T.
23
S.
R. 3 W. R. 2 W. R. 1 W.
Base from U.S. Geological Survey digitaldata, 1:100,000, 1983 Universal Transverse Mercator Projection, Zone 14
Kisiwa
Little
Little
Arkansas
River
RiverRiver
Em
ma
Creek
West
Em
ma
Creek
Creek
Sand
Creek
Arkansas
Mount Hope
Patterson
Burrton
Sedgwick
Halstead
ValleyCenter
HARVEY COUNTY
SEDGWICK COUNTY
0 1 2 3 4 MILES
0 1 2 3 4 KILOMETERS
Eas
t
Emm
aM
iddl
eE
mm
aC
reek
Cre
ek
Arkansas
30' 97˚22'30"97˚37'30"
38˚
37˚52'30"
0
0
0
-4
-4
-4
-6
-6
-6
-6
-6
-8
-8
-8
-10
-10
-12
-12
-12
-10
-2
-2
-2
-14
-14
-14
-20
-22
-24
-16
-16
-16
-16
-16
-16-18
-18-18
-18
-20-22
-20-22
-22
-24
-24
-26
-12
-0.85
-3.90 -2.65
-7.19
-6.33
-8.28
-5.60
+0.36
-1.91
-5.48
-2.12
-4.07
+0.64
-3.80
-3.14
-1.85
-3.70
-7.44
-7.65
-2.74
-0.95
-7.55
-6.77
-5.68
-7.31
-6.01
-9.49
-9.35
-8.89
-6.32
-5.68
-5.60-7.64
-9.20
-4.95
-4.37
-2.25
-1.80
-5.15
-6.97
-5.40
-5.39
-2.53
-1.25
-5.82
-9.69
-3.36
-5.90
-3.80
-3.15
-4.08
-3.05
-2.88
+2.00
-4.64
-1.89
-3.96
-9.12
-8.07
-6.49
-3.99
-4.40
-8.09
-3.10
-8.32
-10.80
-24.10
-18.13
-21.07
-10.39
-18.90
-13.92
-13.10-14.30-12.76-16.76
-15.49-18.96
-15.62
-22.47-18.49
-18.11
-22.50-29.54
-23.28
-18.81
-12.00
-11.77
-18.00
-11.56
-10.94
-10.55
-11.08
-11.79
-16.88-12.75
-15.77
-12.68
-11.58
-12.16
-11.50-12.42
-14.14-17.07
-14.90
-16.40
-14.38
-15.17
-10.42
-13.23
-15.14
-14.97-22.05
-11.60
-11.65
-24.30
-16.58
-16.94 -15.19
-17.69
-12.90
-15.50-18.91
-17.67-12.05
-10.25
-18.07
-10.50
-18.77
Halsteadrechargesite
Sedgwickrechargesite
IW-38
IW-37IW-36IW-35
IW-34
IW-33
IW-32IW-31
IW-30
IW-28IW-27
IW-26
IW-25IW-24
IW-22
IW-21IW-20
IW-19
IW-18
IW-16
IW-15
IW-14
IW-13
IW-12IW-10
IW-09
IW-08
IW-07
IW-06
IW-04
IW-03IW-02
IW-01
1
8
9
5
43
2
7
821 6
13
16
22
2524
2321
2019
18
14
12
33
3431
30
42
55
54
53
52
51
5049
48
4746
45
44
41
40
39
38
37
36
35
32
29
2827
26
17
15
10
11
892
870 842
880
889
886
853
840
839
833
832
817
815
826
506
307
P31
877
P30
P29
101
P35
P27
P28
890
133
130
126
810
124
122
120
118
117
115
114
113
112
111
110
109
108107
105104
103
102
816
878
3032
3001
3035
3050
3044
3041
3038
3034
3033
3004
3002
1191
1190
1187
1186
1179
1176
1175
11741171
3036
2084
1189
1173
3005
-6.70
-6.20-5.66-3.22
-2.09
-7.17
-7.28-3.70
-7.17
-6.07
-4.82-3.00
-7.81
-4.19
-9.50
-6.49
-1.90
-6.14
-5.19
-3.00-3.97
-5.00
-13.57-11.18
-10.04
-15.60-13.73
-19.21
-17.91
-16.45
-10.96
-10.83
-10.16
-24.10
886-18.81
1
-10
Study area
Area of water-level decline, in feet
10 – 20
20 – 30
Line of equal change of water level— Interval 2 feet. Dashed where approximately located
Artificial recharge demonstration site— Halstead site in operation May 1997– June 2002; Sedgwick site in operation April 1998–November 2000
Well hydrograph shown in figure 2
Equus beds historic observation well
Equus beds areal index well
EXPLANATION
-5.00IW-01
Upper number is well identification number. Lowernumber is water-level change, in feet. Negative numberindicates water level was lower than August 1940.
Water-level measurements were made by city of Wichita and U.S. Geological Survey personnel.
Depletion of storage volume in study area between August 1940 and July 2002 was 162,000 acre-feet.
Figure 18. Water-level change in Equus Beds aquifer in study area, August 1940–July 2002.
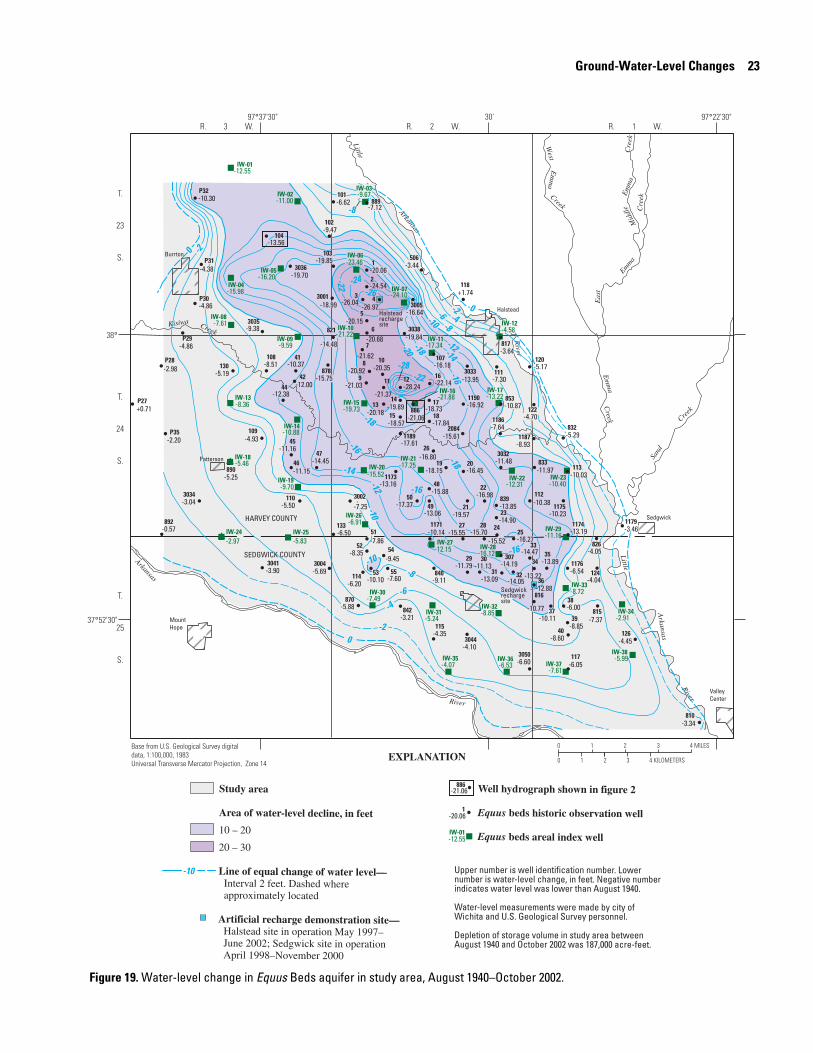
Ground-Water-Level Changes 23
T.
25
S.
T.
24
S.
T.
23
S.
R. 3 W. R. 2 W. R. 1 W.
Base from U.S. Geological Survey digitaldata, 1:100,000, 1983 Universal Transverse Mercator Projection, Zone 14
Kisiwa
Little
Little
Arkansas
River
RiverRiver
Em
ma
Creek
West
Em
ma
Creek
Creek
Sand
Creek
Arkansas
Mount Hope
Patterson
Burrton
Sedgwick
Halstead
ValleyCenter
HARVEY COUNTY
SEDGWICK COUNTY
0 1 2 3 4 MILES
0 1 2 3 4 KILOMETERS
30'
Eas
t
Emm
aM
iddl
eE
mm
aC
reek
Cre
ek
Arkansas
97˚22'30"97˚37'30"
38˚
37˚52'30"
0
0
0
-4
-4
-6
-6
-8
-8
-8
-10
-10
-10
-12
-12
-2
-2
-2
-14
-14
-16
-16
-16
-16
-18
-18
-18-20
-22-28
-22 -24-26
-0.57
-5.88-3.21
-9.11
-5.29
-3.64
-7.37
-3.34
-3.44-4.38
-4.86
-2.98
-4.86
-6.62
-9.38
-2.20
+0.71
-7.60
-9.45-8.35
-7.86
-8.60
-8.85
-6.00
-6.60
-4.10
-3.90
-3.04
-5.69
-7.25
-8.93
-7.64
-3.46
-6.54
-5.25
-6.50
-5.19
-4.45
-4.04
-4.70
-5.17
+1.74
-6.05
-4.35
-6.20
-7.30
-5.50
-4.93
-8.51
-9.47
-4.05
-11.48
-20.06
-20.18
-22.14
-20.92
-16.98
-16.27-15.52
-14.90-19.57
-16.45-18.15
-17.84
-19.89
-28.24-21.03
-20.15
-26.97-26.04
-10.87
-13.85
-11.97
-14.19
-10.30
-21.62
-14.47
-13.09
-11.13
-12.00
-18.99
-10.10
-17.37-13.06
-15.88
-14.45-11.15
-11.16
-12.38
-10.37
-10.11
-12.88
-13.89
-14.05
-11.79
-15.70-15.55
-16.80
-19.84
-13.95
-16.92
-10.23
-13.19-10.14
-10.03
-10.38
-16.18
-13.56
-19.85
-19.70
-10.77
-18.73
-18.57
-15.61-17.61
-13.16
-15.75-20.35
-20.68-14.48
-16.64
-7.12
-24.54
-21.06
-13.22
-21.37
Halsteadrechargesite
Sedgwickrechargesite
IW-38
IW-37IW-36IW-35
IW-34
IW-33
IW-32IW-31
IW-30
IW-29
IW-28IW-27
IW-26
IW-25IW-24
IW-23IW-22
IW-21IW-20
IW-19
IW-18
IW-17IW-16
IW-15
IW-14
IW-13
IW-12
IW-11
IW-10
IW-09
IW-08
IW-07
IW-06
IW-05
IW-04
IW-03IW-02
IW-01
1
8
9
5
43
2
7
821 6
13
16
22
2524
2321
2019
18
14
12
33
3431
30
42
55
54
53
52
51
5049
48
4746
45
44
41
40
39
38
37
36
35
32
29
2827
26
17
15
10
11
892
870
842
889
886
853
840
839
833
832
817
815
826
506
307
P31
P32
P30
P29
101
P35
P27
P28
890
133
130
126
810
124
122
120
118
117
115
114
113
112
111
110
109
108 107
104
103
102
816
878
3032
3001
3035
3050
3044
3041
3038
3034
3033
3004
3002
1190
1187
1186
1179
1176
1175
11741171
3036
20841189
1173
3005
-5.99
-7.61-6.53-4.07
-2.91
-8.72
-8.85-5.24
-7.49
-6.91
-5.83-2.97
-9.70
-5.46
-8.36
-4.58
-9.59
-7.61
-11.16
-16.12-12.15
-10.40-12.31
-17.25-15.52
-13.22
-19.73
-10.88
-17.34
-23.46
-16.20
-15.98
-11.00
-12.55
-9.67
-21.88
-21.22
-24.10
-20.06
886-21.06
1
-10
Study area
Area of water-level decline, in feet
10 – 20
20 – 30
Line of equal change of water level— Interval 2 feet. Dashed where approximately located
Artificial recharge demonstration site— Halstead site in operation May 1997– June 2002; Sedgwick site in operation April 1998–November 2000
Well hydrograph shown in figure 2
Equus beds historic observation well
Equus beds areal index well
EXPLANATION
-12.55IW-01
Upper number is well identification number. Lowernumber is water-level change, in feet. Negative numberindicates water level was lower than August 1940.
Water-level measurements were made by city of Wichita and U.S. Geological Survey personnel.
Depletion of storage volume in study area between August 1940 and October 2002 was 187,000 acre-feet.
Figure 19. Water-level change in Equus Beds aquifer in study area, August 1940–October 2002.
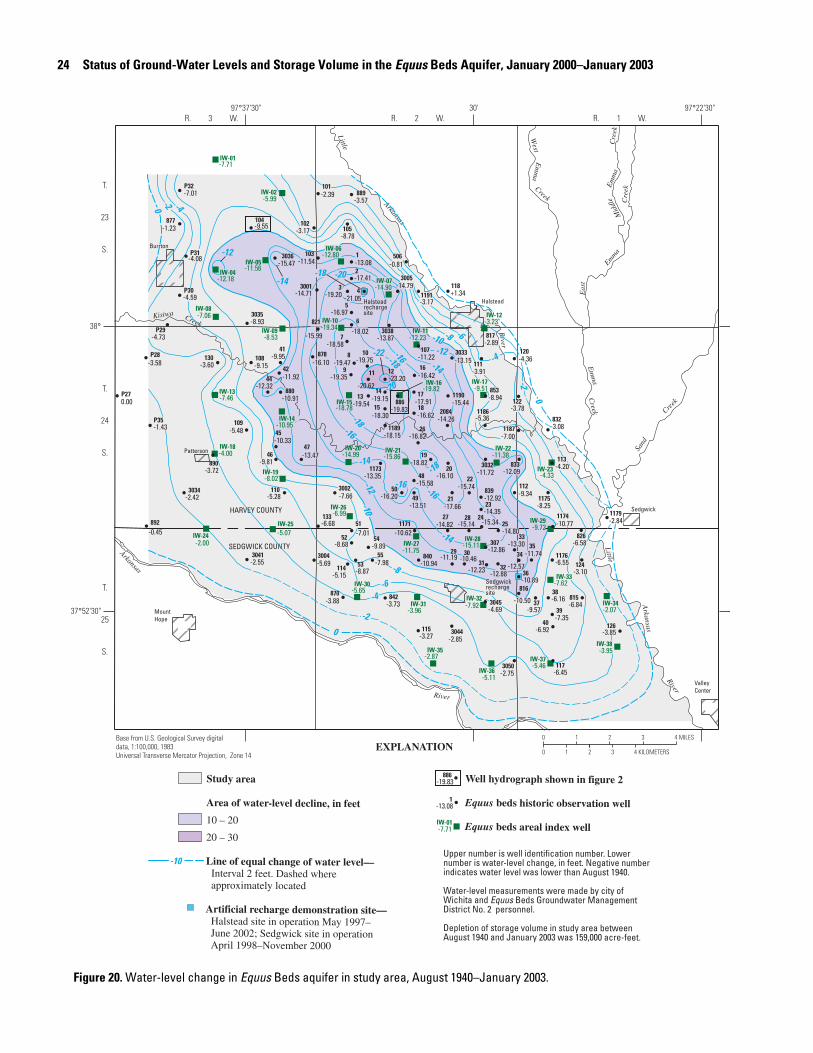
24 Status of Ground-Water Levels and Storage Volume in the Equus Beds Aquifer, January 2000–January 2003
T.
25
S.
T.
24
S.
T.
23
S.
R. 3 W. R. 2 W. R. 1 W.
Base from U.S. Geological Survey digitaldata, 1:100,000, 1983 Universal Transverse Mercator Projection, Zone 14
Kisiwa
Little
Little
Arkansas
River
River
River
Em
ma
Creek
West
Em
ma
Creek
Creek
Sand
Creek
Arkansas
Mount Hope
Patterson
Burrton
Sedgwick
Halstead
ValleyCenter
HARVEY COUNTY
SEDGWICK COUNTY
0 1 2 3 4 MILES
0 1 2 3 4 KILOMETERS
Eas
t
Emm
aM
iddl
eE
mm
aC
reek
Cre
ek
Arkansas
30' 97˚22'30"97˚37'30"
38˚
37˚52'30"
0
0
0
-4
-4
-4
-6
-6
-8
-8
-10
-10
-12
-12
-12
-14
-2
-2
-2
-14
-14
-16
-16
-16
-14
-16
-18
-18
-18
-20
-22
-20-18
0.00
-0.45
-3.88 -3.73
-3.57
-8.94
-3.08
-2.89
-6.84
-0.81
-1.23
-4.08
-7.01
-4.59
-3.58
-4.73
-2.39
-8.93
-1.43
-7.98
-9.89
-8.87
-8.68
-7.01
-9.81
-9.95
-6.92
-7.35
-6.16-9.57
-2.75
-4.69
-2.85
-2.55
-2.42
-5.69
-7.66
-3.17
-7.00
-5.36
-2.84
-6.55
-8.25
-3.72
-6.68
-3.60
-3.85
-3.10
-3.78
-4.36
+1.34
-6.45
-3.27
-5.15
-4.20
-9.34
-3.91
-5.28
-5.48
-9.15
-8.78-9.55 -3.17
-6.58
-11.72
-13.08
-19.54
-16.42
-10.91
-19.47
-15.74
-14.80-15.34-14.35
-17.66
-16.10
-18.82
-16.62
-19.35
-16.97
-21.05-19.20
-17.41
-19.83
-10.94
-12.92
-12.09
-12.86
-18.58
-13.30
-12.23-10.46
-11.92
-14.71
-16.20-13.51
-15.58
-13.47
-10.33
-12.32
-10.89
-11.74
-12.88
-11.19
-15.14-14.82
-16.82
-13.87
-13.15
-15.44
-10.77-10.62
-11.22
-11.54-15.47
-10.50
-17.91
-18.30 -14.26
-18.15
-13.35
-16.10 -19.75
-20.62
-18.02-15.99
-14.79
-19.15
-23.20
-12.57
Halsteadrechargesite
Sedgwickrechargesite
IW-38
IW-37
IW-36
IW-35
IW-34
IW-33
IW-32IW-31
IW-30
IW-29
IW-28IW-27
IW-26
IW-25
IW-24
IW-23
IW-22IW-21IW-20
IW-19
IW-18
IW-17IW-16
IW-15
IW-14
IW-13
IW-12
IW-11
IW-10IW-09
IW-08
IW-07
IW-06
IW-05IW-04
IW-02
IW-01
1
8
9
5
43
2
7
821 6
13
16
22
2524
2321
20
19
18
14
12
33
3431
30
42
55
54
53
52
51
5049
48
4746
45
44
41
40
39
38
37
36
35
32
29
2827
26
17
15
10
11
892
870 842
880
889
886
853
840
839
833
832
817
815
826
506
307
P31
877
P32
P30
P29
101
P35
P27
P28
890
133
130
126
124
122
120
118
117
115
114
113
112
111
110
109
108107
105104
103
102
816
878
3032
3001
3035
3050
3045
3044
3041
3038
3034
3033
3004
3002
1191
1190
1187
1186
1179
1176
1175
11741171
3036
2084
1189
1173
3005
-3.95
-5.46
-5.11
-2.87
-2.07
-7.62
-7.92-3.96
-5.65
-9.72
-6.99
-5.07-2.00
-4.33-8.02
-4.00
-9.51-7.46
-3.23
-8.53
-7.06
-5.99
-7.71
-15.11-11.75
-11.38-15.86-14.99
-19.82
-18.78
-10.95
-12.23
-12.80
-11.56
-19.34
-14.90-12.18
-13.08
886-19.83
1
-10
Study area
Area of water-level decline, in feet
10 – 20
20 – 30
Line of equal change of water level— Interval 2 feet. Dashed where approximately located
Artificial recharge demonstration site— Halstead site in operation May 1997– June 2002; Sedgwick site in operation April 1998–November 2000
Well hydrograph shown in figure 2
Equus beds historic observation well
Equus beds areal index well
EXPLANATION
Upper number is well identification number. Lowernumber is water-level change, in feet. Negative numberindicates water level was lower than August 1940.
Water-level measurements were made by city of Wichita and Equus Beds Groundwater ManagementDistrict No. 2 personnel.
Depletion of storage volume in study area between August 1940 and January 2003 was 159,000 acre-feet.
-7.71IW-01
Figure 20. Water-level change in Equus Beds aquifer in study area, August 1940–January 2003.
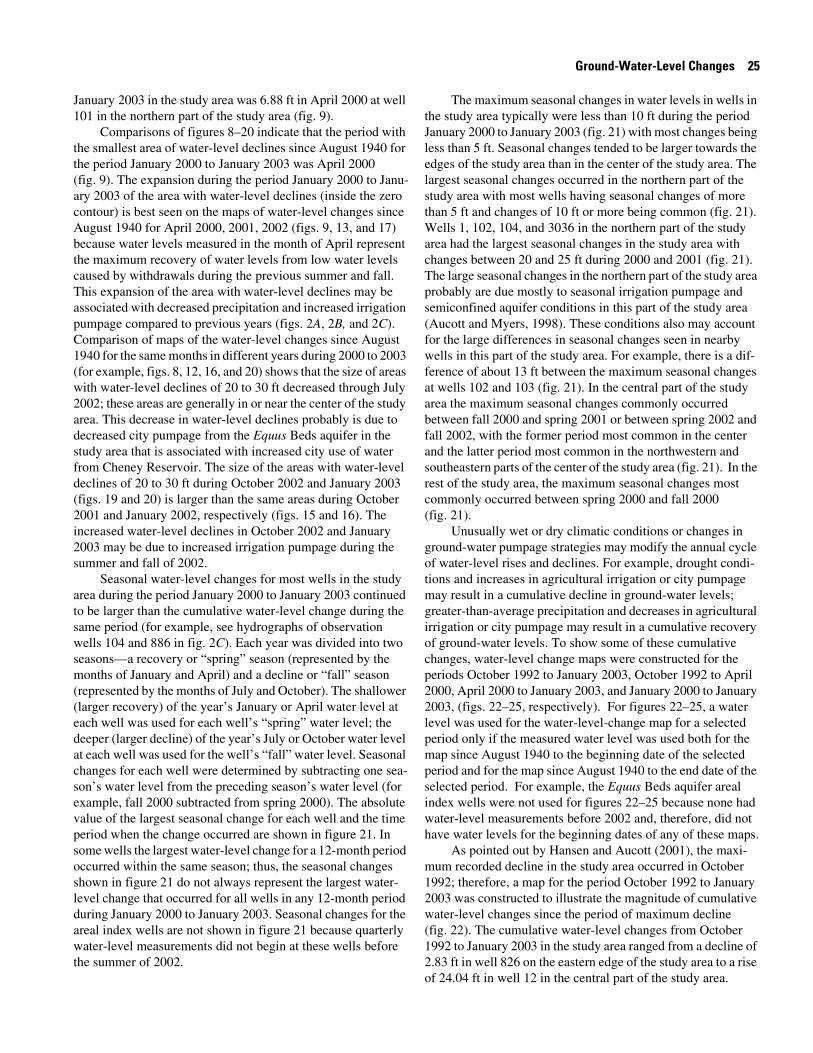
Ground-Water-Level Changes 25
January 2003 in the study area was 6.88 ft in April 2000 at well 101 in the northern part of the study area (fig. 9).
Comparisons of figures 8–20 indicate that the period with the smallest area of water-level declines since August 1940 for the period January 2000 to January 2003 was April 2000 (fig. 9). The expansion during the period January 2000 to Janu-ary 2003 of the area with water-level declines (inside the zero contour) is best seen on the maps of water-level changes since August 1940 for April 2000, 2001, 2002 (figs. 9, 13, and 17) because water levels measured in the month of April represent the maximum recovery of water levels from low water levels caused by withdrawals during the previous summer and fall. This expansion of the area with water-level declines may be associated with decreased precipitation and increased irrigation pumpage compared to previous years (figs. 2A, 2B, and 2C). Comparison of maps of the water-level changes since August 1940 for the same months in different years during 2000 to 2003 (for example, figs. 8, 12, 16, and 20) shows that the size of areas with water-level declines of 20 to 30 ft decreased through July 2002; these areas are generally in or near the center of the study area. This decrease in water-level declines probably is due to decreased city pumpage from the Equus Beds aquifer in the study area that is associated with increased city use of water from Cheney Reservoir. The size of the areas with water-level declines of 20 to 30 ft during October 2002 and January 2003 (figs. 19 and 20) is larger than the same areas during October 2001 and January 2002, respectively (figs. 15 and 16). The increased water-level declines in October 2002 and January 2003 may be due to increased irrigation pumpage during the summer and fall of 2002.
Seasonal water-level changes for most wells in the study area during the period January 2000 to January 2003 continued to be larger than the cumulative water-level change during the same period (for example, see hydrographs of observation wells 104 and 886 in fig. 2C). Each year was divided into two seasons—a recovery or “spring” season (represented by the months of January and April) and a decline or “fall” season (represented by the months of July and October). The shallower (larger recovery) of the year’s January or April water level at each well was used for each well’s “spring” water level; the deeper (larger decline) of the year’s July or October water level at each well was used for the well’s “fall” water level. Seasonal changes for each well were determined by subtracting one sea-son’s water level from the preceding season’s water level (for example, fall 2000 subtracted from spring 2000). The absolute value of the largest seasonal change for each well and the time period when the change occurred are shown in figure 21. In some wells the largest water-level change for a 12-month period occurred within the same season; thus, the seasonal changes shown in figure 21 do not always represent the largest water-level change that occurred for all wells in any 12-month period during January 2000 to January 2003. Seasonal changes for the areal index wells are not shown in figure 21 because quarterly water-level measurements did not begin at these wells before the summer of 2002.
The maximum seasonal changes in water levels in wells in the study area typically were less than 10 ft during the period January 2000 to January 2003 (fig. 21) with most changes being less than 5 ft. Seasonal changes tended to be larger towards the edges of the study area than in the center of the study area. The largest seasonal changes occurred in the northern part of the study area with most wells having seasonal changes of more than 5 ft and changes of 10 ft or more being common (fig. 21). Wells 1, 102, 104, and 3036 in the northern part of the study area had the largest seasonal changes in the study area with changes between 20 and 25 ft during 2000 and 2001 (fig. 21). The large seasonal changes in the northern part of the study area probably are due mostly to seasonal irrigation pumpage and semiconfined aquifer conditions in this part of the study area (Aucott and Myers, 1998). These conditions also may account for the large differences in seasonal changes seen in nearby wells in this part of the study area. For example, there is a dif-ference of about 13 ft between the maximum seasonal changes at wells 102 and 103 (fig. 21). In the central part of the study area the maximum seasonal changes commonly occurred between fall 2000 and spring 2001 or between spring 2002 and fall 2002, with the former period most common in the center and the latter period most common in the northwestern and southeastern parts of the center of the study area (fig. 21). In the rest of the study area, the maximum seasonal changes most commonly occurred between spring 2000 and fall 2000 (fig. 21).
Unusually wet or dry climatic conditions or changes in ground-water pumpage strategies may modify the annual cycle of water-level rises and declines. For example, drought condi-tions and increases in agricultural irrigation or city pumpage may result in a cumulative decline in ground-water levels; greater-than-average precipitation and decreases in agricultural irrigation or city pumpage may result in a cumulative recovery of ground-water levels. To show some of these cumulative changes, water-level change maps were constructed for the periods October 1992 to January 2003, October 1992 to April 2000, April 2000 to January 2003, and January 2000 to January 2003, (figs. 22–25, respectively). For figures 22–25, a water level was used for the water-level-change map for a selected period only if the measured water level was used both for the map since August 1940 to the beginning date of the selected period and for the map since August 1940 to the end date of the selected period. For example, the Equus Beds aquifer areal index wells were not used for figures 22–25 because none had water-level measurements before 2002 and, therefore, did not have water levels for the beginning dates of any of these maps.
As pointed out by Hansen and Aucott (2001), the maxi-mum recorded decline in the study area occurred in October 1992; therefore, a map for the period October 1992 to January 2003 was constructed to illustrate the magnitude of cumulative water-level changes since the period of maximum decline (fig. 22). The cumulative water-level changes from October 1992 to January 2003 in the study area ranged from a decline of 2.83 ft in well 826 on the eastern edge of the study area to a rise of 24.04 ft in well 12 in the central part of the study area.
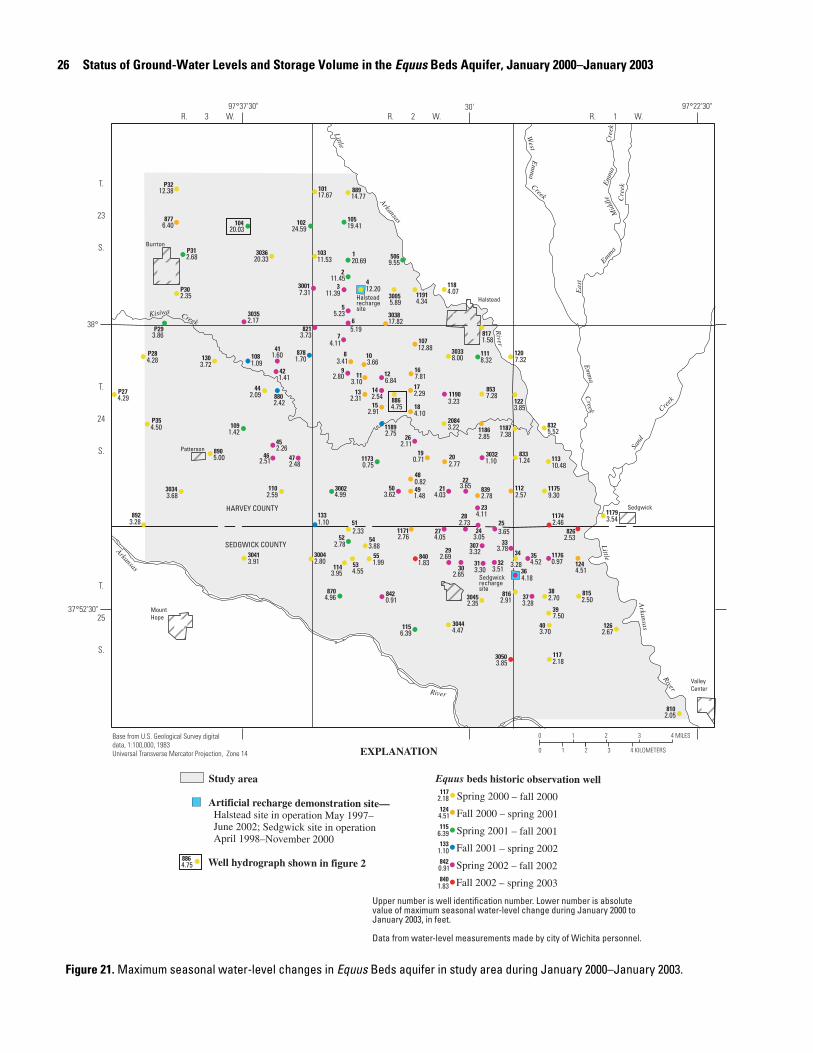
26 Status of Ground-Water Levels and Storage Volume in the Equus Beds Aquifer, January 2000–January 2003
Figure 21. Maximum seasonal water-level changes in Equus Beds aquifer in study area during January 2000–January 2003.
T.
25
S.
T.
24
S.
T.
23
S.
R. 3 W. R. 2 W. R. 1 W.
Base from U.S. Geological Survey digitaldata, 1:100,000, 1983 Universal Transverse Mercator Projection, Zone 14
Kisiwa
Little
Little
Arkansas
River
River
River
Em
ma
Creek
West
Em
ma
Creek
Creek
Sand
Creek
Arkansas
Mount Hope
Patterson
Burrton
Sedgwick
Halstead
ValleyCenter
HARVEY COUNTY
SEDGWICK COUNTY
0 1 2 3 4 MILES
0 1 2 3 4 KILOMETERS
Eas
t
Emm
aM
iddl
eE
mm
aC
reek
Cre
ek
Arkansas
30' 97˚22'30"97˚37'30"
38˚
37˚52'30"
1
8
9
5
43
2
7821
6
13
16
22
2524
23
21
2019
18
14
12
33
34
3130
42
55
54
53
52
51
50 49
48
4746
45
44
41
40
39
3837
36
3532
29
28
27
26
17
15
10
11
892
870 842
880
889
886
853
840
839
833
832
817
815
826
506
307
P31
877
P30
P32
P29
101
P35
P27
P28
890
133
130
126
810
124
122
120
118
117
115
114
113
112
111
110
109
108
107
105104
103
102
816
878
3032
3001
3035
3050
3045
3044
3041
3038
3034
3033
3004
3002
1191
1190
11871186
1179
1176
1175
1174
1171
3036
20841189
1173
3005
1.10
3.28
4.96 0.91
2.31
7.81
2.42
3.41
3.65
3.653.05
4.11
4.03
2.770.71
4.10
2.54
6.842.80
5.23
7.28
1.83
2.78
1.24
5.52
1.58
2.50
2.05
9.55
3.32
6.40
2.68
2.35
4.28
3.864.11
3.78
3.302.65
1.41
7.31
2.17
4.50
4.29
1.99
3.88
4.55
2.78
2.33
3.62 1.48
0.82
2.482.51
2.26
2.09
1.60
3.70
7.50
2.703.28
4.18
4.523.51
2.69
2.73
4.05
2.11
3.85
2.35
4.47
3.91
3.68
8.00
2.80
4.99
4.34
3.23
7.382.85
3.54
0.97
9.30
2.46
2.76
5.00
1.10
3.72
2.67
4.51
3.85
7.32
4.07
2.18
6.39
3.95
2.57
8.32
2.59
1.42
1.09
2.53
2.91
2.29
2.91
3.222.75
0.75
1.70 3.66
3.10
5.193.73
5.89
20.69
12.2011.39
11.45
14.7712.38 17.67
17.82
10.48
12.88
19.4120.03
11.53
24.59
20.33
4.75
3.28
Halsteadrechargesite
Sedgwickrechargesite
Study area
Artificial recharge demonstration site— Halstead site in operation May 1997– June 2002; Sedgwick site in operation April 1998–November 2000
Well hydrograph shown in figure 2
Equus beds historic observation well
Spring 2000 – fall 2000
Fall 2000 – spring 2001
Spring 2001 – fall 2001
Fall 2001 – spring 2002
Spring 2002 – fall 2002
Fall 2002 – spring 2003
EXPLANATION
0.91
1.83
1.10
4.51
2.18
6.39
842
840
133
124
117
115
4.75886
Upper number is well identification number. Lower number is absolute value of maximum seasonal water-level change during January 2000 to January 2003, in feet.
Data from water-level measurements made by city of Wichita personnel.
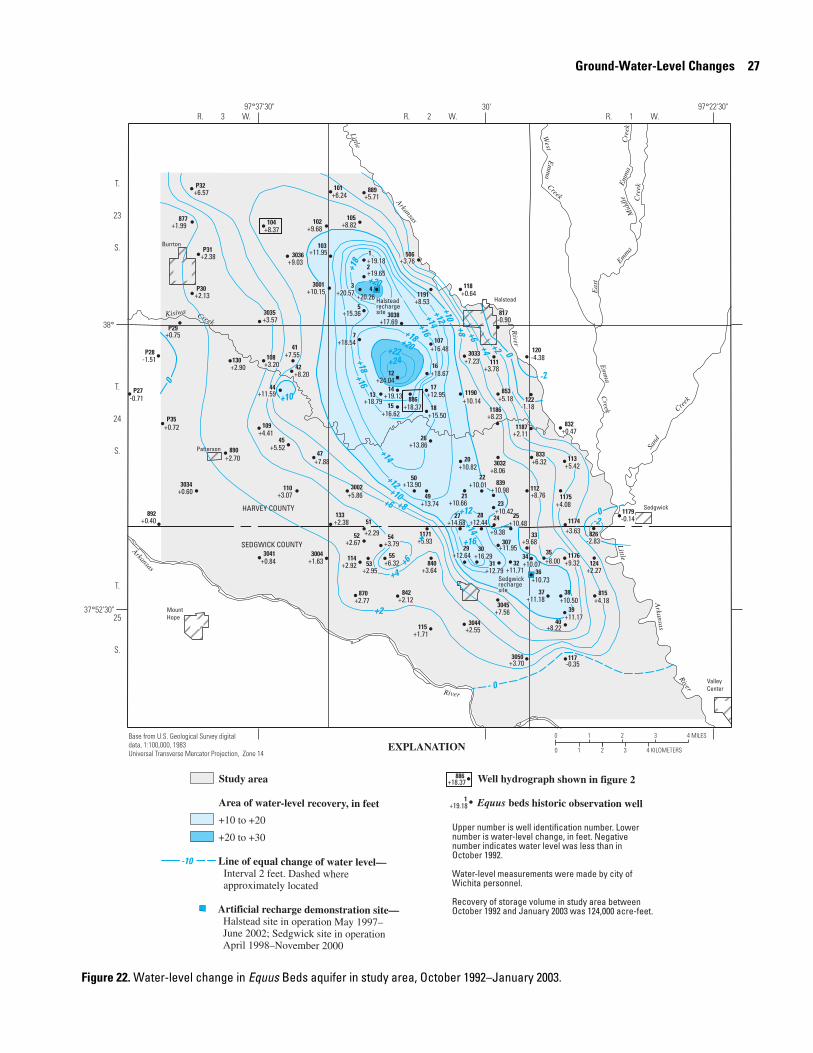
Ground-Water-Level Changes 27
T.
25
S.
T.
24
S.
T.
23
S.
R. 3 W. R. 2 W. R. 1 W.
Base from U.S. Geological Survey digitaldata, 1:100,000, 1983 Universal Transverse Mercator Projection, Zone 14
Kisiwa
Little
Little
Arkansas
River
River
River
Em
ma
Creek
West
Em
ma
Creek
Creek
Sand
Creek
Arkansas
Mount Hope
Patterson
Burrton
Sedgwick
Halstead
ValleyCenter
HARVEY COUNTY
SEDGWICK COUNTY
0 1 2 3 4 MILES
0 1 2 3 4 KILOMETERS
30'
Eas
t
Emm
aM
iddl
eE
mm
aC
reek
Cre
ek
Arkansas
97˚22'30"97˚37'30"
38˚
37˚52'30"
0
0
+4
+4
+6
+6
+6
+8
+8
+2
+2
-2
0
+16
+12
+16
0-2
+16
+18
+14
+18
+12
+14
+14
+10
+10
+10
+22+1
8+20
+20
+24
+12
1
5
43
2
7
13
16
22
2524
2321
20
18
14
12
33
3431
30
42
55
54
53
52
51
50
49
47
45
44
41
40
39
3837
36
35
32
29
2827
26
17
15
892
870 842
889
886853
840
839
833
832
817
815
826
506
307
P31
877
P30
P29
P32 101
P35
P27
P28
890
133
130
124
122
120
118
117
115
114
113
112
111
110
109
108
107
105104
103
102
3032
3001
3035
3050
3045
3044
3041
3038
3034
3033
3004
3002
1191
1190
1187
1186
1179
1176
1175
1174
1171
3036
+8.00
+8.06
+0.40
+2.77 +2.12
+9.38
+15.50
+5.71
+5.18
+3.64
+6.32
+0.47
-0.90
+4.18
+3.76
+1.99
+2.38
+6.57
+2.13
-1.51
+0.75
+9.68
+8.20
+6.24
+3.57
+0.72
-0.71
+6.32
+3.79
+2.95
+2.67+2.29
+7.88
+5.52
+7.55
+8.22
+10.50
+3.70
+7.56
+2.55
+0.84
+0.60
+7.23
+1.63
+5.86
+8.53
+2.11
+8.23
-0.14
+9.32
+4.08
+3.63+5.93
+2.70
+2.38
+2.90
+2.27
-1.18
-4.38
+0.64
-0.35
+1.71
+2.92
+5.42
+8.76
+3.78
+3.07
+4.41
+3.20
+8.82+8.37 +9.68
+9.03
-2.83
+19.18
+18.79
+18.67
+10.01
+10.48
+10.42+10.66
+10.82
+19.13
+24.04
+15.36
+20.26+20.57
+19.65
+18.37
+10.98
+11.95
+18.54
+12.79
+16.29
+10.15
+13.90
+13.74
+11.59
+11.17
+11.18
+10.73
+10.07+11.71
+12.64
+12.44+14.68
+13.86
+17.69
+10.14
+16.48
+11.95
+12.95
+16.62
Halsteadrechargesite
Sedgwickrechargesite
+19.18
886+18.37
1
-10
Study area
Area of water-level recovery, in feet
+10 to +20
+20 to +30
Line of equal change of water level— Interval 2 feet. Dashed where approximately located
Artificial recharge demonstration site— Halstead site in operation May 1997– June 2002; Sedgwick site in operation April 1998–November 2000
Well hydrograph shown in figure 2
Equus beds historic observation well
EXPLANATION
++
Upper number is well identification number. Lowernumber is water-level change, in feet. Negative number indicates water level was less than in October 1992.
Water-level measurements were made by city of Wichita personnel.
Recovery of storage volume in study area betweenOctober 1992 and January 2003 was 124,000 acre-feet.
Figure 22. Water-level change in Equus Beds aquifer in study area, October 1992–January 2003.
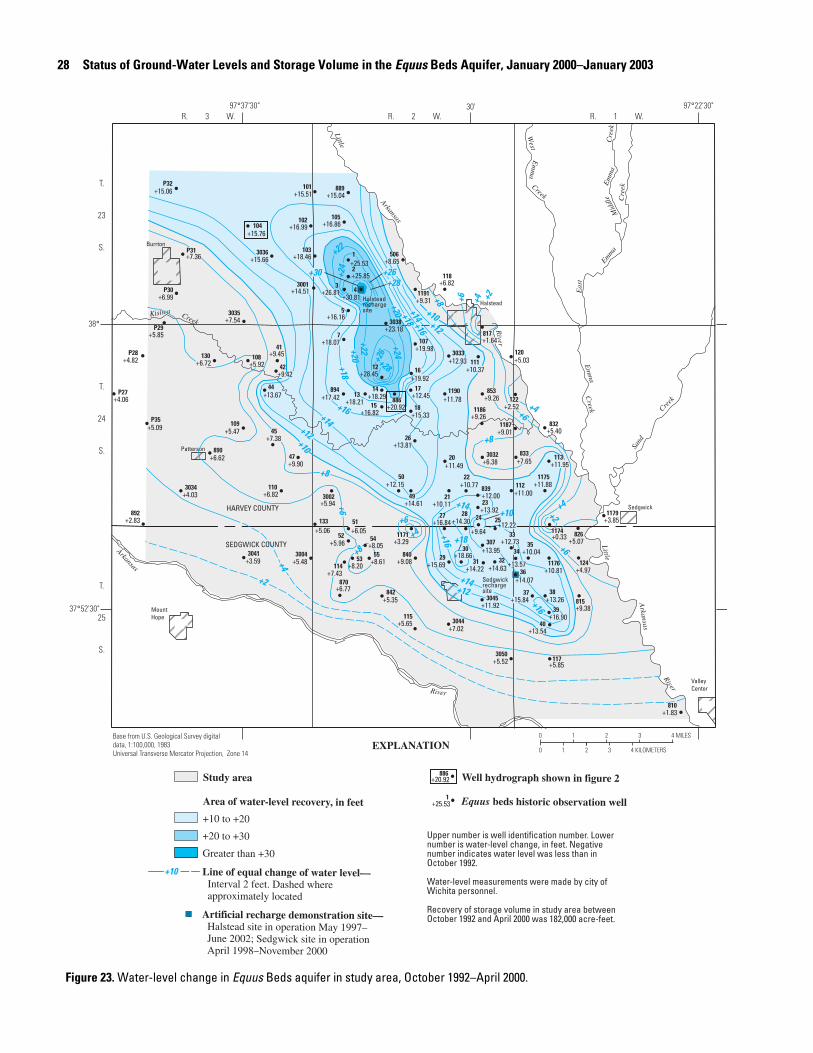
28 Status of Ground-Water Levels and Storage Volume in the Equus Beds Aquifer, January 2000–January 2003
T.
25
S.
T.
24
S.
T.
23
S.
R. 3 W. R. 2 W. R. 1 W.
Base from U.S. Geological Survey digitaldata, 1:100,000, 1983 Universal Transverse Mercator Projection, Zone 14
Kisiwa
Little
Little
Arkansas
River
RiverRiver
Em
ma
Creek
West
Em
ma
Creek
Creek
Sand
Creek
Arkansas
Mount Hope
Patterson
Burrton
Sedgwick
Halstead
ValleyCenter
HARVEY COUNTY
SEDGWICK COUNTY
0 1 2 3 4 MILES
0 1 2 3 4 KILOMETERS
30'
Eas
t
Emm
aM
iddl
eE
mm
aC
reek
Cre
ek
Arkansas
97˚22'30"97˚37'30"
38˚
37˚52'30"
+4
+2
+10
+10
+22
+22
+20
+20
+18+24
+24
+28+30 +26
+28
+4+6
+14
+12
+12
+12
+4
+2
+26
+14
+14
+14
+10
+18
+18
+4
+6
+6
24
+6
+6
+8
+8
+8
+8+16
+16+16
+4
+2
+16
1
5
43
2
7
13894
16
22
2524
2321
20
18
14
12
33
3431
30
42
55
54
53
52
51
50
49
47
45
44
41
40
39
3837
36
35
3229
2827
26
17
15
892
870842
889
886853
840
839
833
832
817
815
826
506
307
P31
P32
P30
P29
101
P35
P27
P28
890
133
130
810
124
122
120
118
117
115
114
113
112
111
110
109
108
107
105104
103
102
3032
3001
3035
3050
3045
3044
3041
3038
3034
3033
3004
3002
1191
1190
1187
1186
1179
1176
1175
11741171
3036
+12.00 +11.00
+6.38
+2.83
+6.77+5.35
+9.64
+9.26
+9.08
+7.65
+5.40
+1.64
+9.38
+1.83
+8.65+7.36
+6.99
+4.82
+5.85
+9.42
+7.54
+5.09
+4.06
+8.61
+8.05
+8.20
+5.96
+6.05
+9.90
+7.38
+9.45
+5.52
+7.02
+3.59
+4.03
+5.48
+5.94
+9.31
+9.01
+9.26
+3.85
+0.33+3.29
+6.62
+5.06
+6.72
+4.97
+2.52
+5.03
+6.82
+5.85
+5.65
+7.43
+6.82
+5.47
+5.92
+5.07
+17.42
+25.53
+18.29
+19.92
+10.77
+12.22
+13.92+10.11
+11.49
+15.33
+28.45
+18.21
+16.16
+30.81+26.81
+25.85
+15.04
+20.92
+13.95
+15.06
+18.07
+12.73
+14.22
+18.66
+15.51
+14.51
+12.15
+14.61
+13.67
+13.54
+16.90
+13.26+15.84
+14.07
+10.04
+13.57+14.63+15.69
+14.30+16.84
+13.81
+11.92
+23.18
+12.93
+11.78
+10.81
+11.88
+11.95
+10.37
+19.98
+16.86+15.76
+18.46
+16.99
+15.66
+16.82
+12.45
Halsteadrechargesite
Sedgwickrechargesite
+25.53
886+20.92
1
+10
Study area
Area of water-level recovery, in feet
+10 to +20
+20 to +30
Greater than +30
Line of equal change of water level— Interval 2 feet. Dashed where approximately located
Artificial recharge demonstration site— Halstead site in operation May 1997– June 2002; Sedgwick site in operation April 1998–November 2000
Well hydrograph shown in figure 2
Equus beds historic observation well
EXPLANATION
Upper number is well identification number. Lowernumber is water-level change, in feet. Negative number indicates water level was less than inOctober 1992.
Water-level measurements were made by city of Wichita personnel.
Recovery of storage volume in study area betweenOctober 1992 and April 2000 was 182,000 acre-feet.
Figure 23. Water-level change in Equus Beds aquifer in study area, October 1992–April 2000.
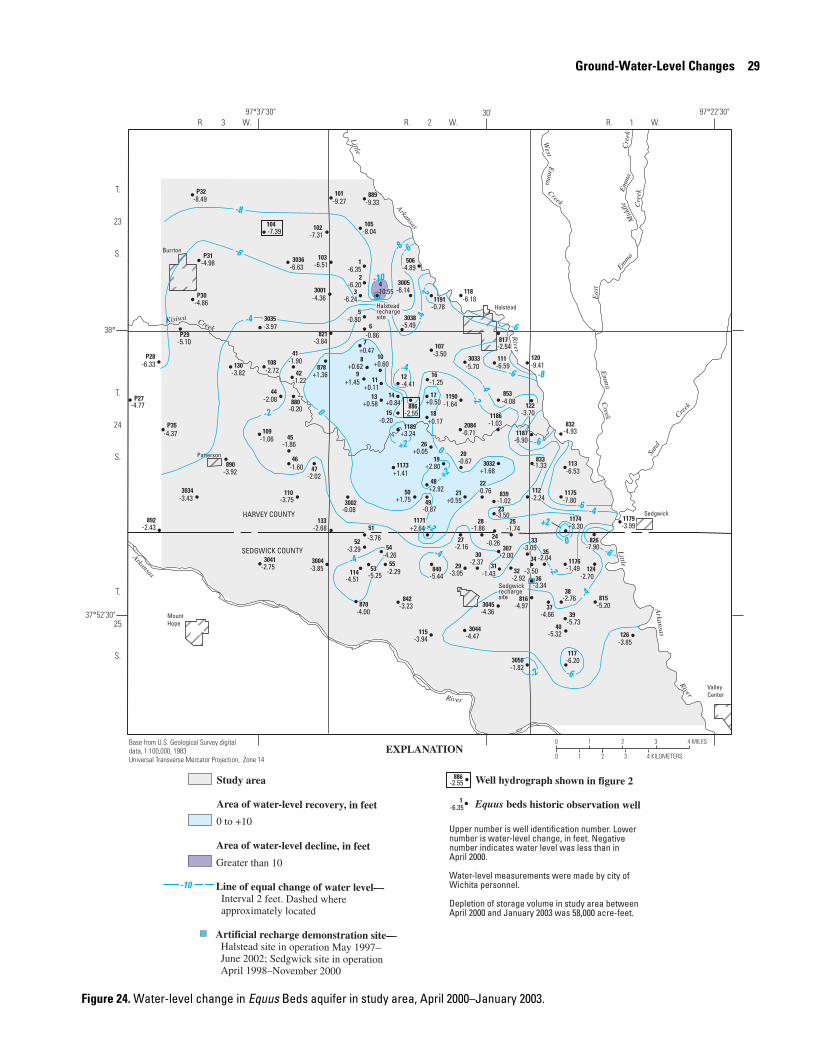
Ground-Water-Level Changes 29
T.
25
S.
T.
24
S.
T.
23
S.
R. 3 W. R. 2 W. R. 1 W.
Base from U.S. Geological Survey digitaldata, 1:100,000, 1983 Universal Transverse Mercator Projection, Zone 14
Kisiwa
Little
Little
Arkansas
River
River
River
Em
ma
Creek
West
Em
ma
Creek
Creek
Sand
Creek
Arkansas
Mount Hope
Patterson
Burrton
Sedgwick
Halstead
ValleyCenter
HARVEY COUNTY
SEDGWICK COUNTY
0 1 2 3 4 MILES
0 1 2 3 4 KILOMETERS
30'
Eas
t
Emm
aM
iddl
eE
mm
aC
reek
Cre
ek
Arkansas
97˚22'30"97˚37'30"
38˚
37˚52'30"
-10
-4
-6
-6
-6
-8
-6 -6
0
0-2
-2
-8
-8
+2
+2
-4
-4-4 -4
-4
+2
-6
-4-6
-2
+2
-4 -2
0
-6
-2
1
8
9
5
43
2
7821
6
13
16
22
25
24
23
21
2019
18
14
12
33
3431
30
42
55
54
53
52
51
50
49
48
4746
45
44
41
40
39
38
37
36
35
3229
28
27
26
17
15
10
11
892
870842
880
889
886
853
840
839
833
832
817
815
826
506
307
P31
P32
P30
P29
101
P35
P27
P28
890
133
130
126
124
122
120
118
117
115
114
113
112
111
110
109
108
107
105104
103
102
816
878
3032
3001
3035
3050
3045
3044
3041
3038
3034
3033
3004
3002
1191
1190
1187
1186
1179
1176
1175
11741171
3036
20841189
1173
3005
+1.68
-2.43
-4.00-3.23
-6.35
+0.58
-1.25
-0.20
+0.62
-0.76
-1.74
-0.26
-3.50
+0.55
-0.67+2.80
+0.17
+0.84
-4.41+1.45
-0.80
-6.24
-6.20
-9.33
-2.55
-4.08
-5.44
-1.02
-1.33
-4.93
-2.54
-5.20
-4.89
-2.00
-4.98
-8.49
-4.86
-6.33
-5.10+0.47
-3.05
-1.43
-2.37
-1.22
-9.27
-4.36
-3.97
-4.37
-4.77
-2.29
-4.26
-5.25
-3.29
-3.76
+1.75-0.87
+2.92
-2.02-1.60
-1.86
-2.08
-1.90
-5.32
-5.73
-2.76
-4.66
-3.34
-2.04
-3.50-2.92
-3.05
-1.86
-2.16
+0.05
-1.82
-4.36
-4.47
-2.75
-5.49
-3.43
-5.70
-3.85
-0.08
-0.78
-1.64
-6.90
-1.03
-3.99
-1.49
-7.80
+3.30+2.64
-3.92
-2.68
-3.82
-3.85
-2.70
-3.70
-9.41
-6.18
-6.20
-3.94
-4.51
-6.53
-2.24
-6.59
-3.75
-1.06
-2.72
-3.50
-8.04-7.39
-6.51
-7.31
-6.63
-7.90
-4.97
+0.50
-0.20
-0.71+3.24
+1.41
+1.36+0.60
+0.11
-0.86-3.84
-6.14-10.55
Halsteadrechargesite
Sedgwickrechargesite
-6.35
886-2.55
1
-10
Study area
Area of water-level recovery, in feet
0 to +10
Area of water-level decline, in feet
Greater than 10
Line of equal change of water level— Interval 2 feet. Dashed where approximately located
Artificial recharge demonstration site— Halstead site in operation May 1997– June 2002; Sedgwick site in operation April 1998–November 2000
Well hydrograph shown in figure 2
Equus beds historic observation well
EXPLANATION
Upper number is well identification number. Lowernumber is water-level change, in feet. Negative number indicates water level was less than inApril 2000.
Water-level measurements were made by city of Wichita personnel.
Depletion of storage volume in study area betweenApril 2000 and January 2003 was 58,000 acre-feet.
Figure 24. Water-level change in Equus Beds aquifer in study area, April 2000–January 2003.
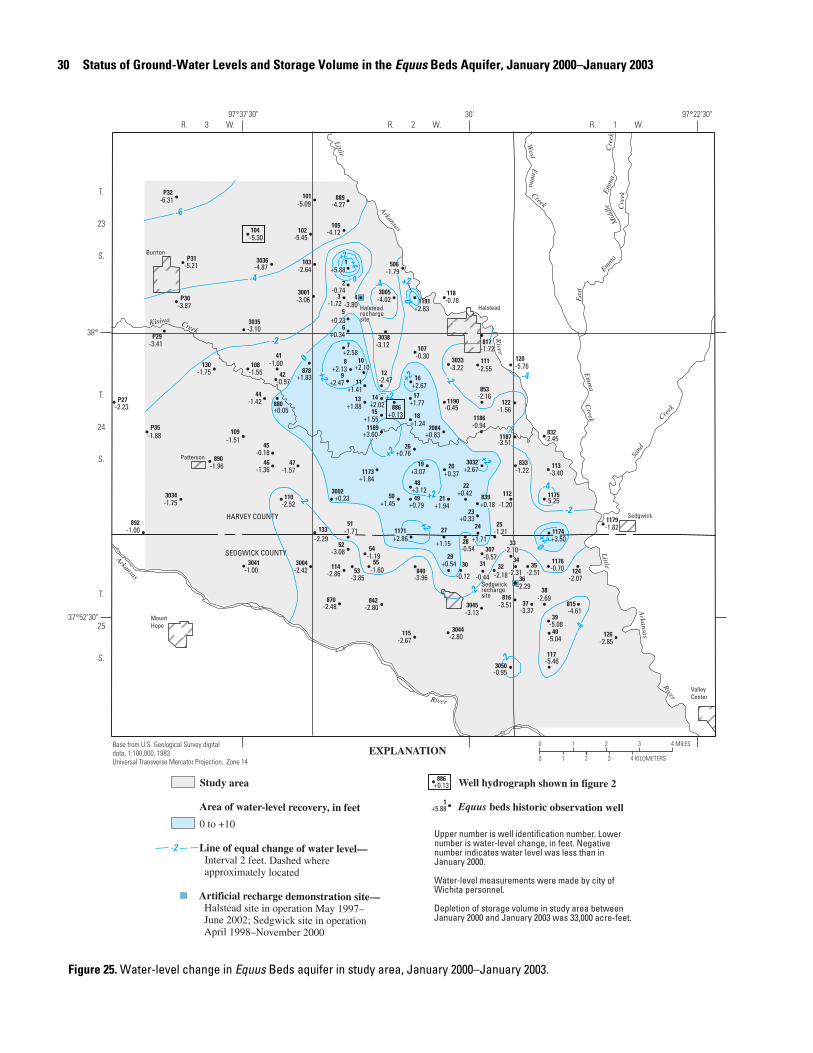
30 Status of Ground-Water Levels and Storage Volume in the Equus Beds Aquifer, January 2000–January 2003
T.
25
S.
T.
24
S.
T.
23
S.
R. 3 W. R. 2 W. R. 1 W.
Base from U.S. Geological Survey digitaldata, 1:100,000, 1983 Universal Transverse Mercator Projection, Zone 14
Kisiwa
Little
Little
Arkansas
River
RiverRiver
Em
ma
Creek
West
Em
ma
Creek
Creek
Sand
Creek
Arkansas
Mount Hope
Patterson
Burrton
Sedgwick
Halstead
ValleyCenter
HARVEY COUNTY
SEDGWICK COUNTY
0 1 2 3 4 MILES
0 1 2 3 4 KILOMETERS
Eas
t
Emm
aM
iddl
eE
mm
aC
reek
Cre
ek
Arkansas
30' 97˚22'30"97˚37'30"
38˚
37˚52'30"
-2
-2-2
-2
0
-4
-6
-4
+2
+4
+2
+2
-2
+2
+2
-4
+20
-4
-2
-2
+2
+2
0
+2
0
-4 +2
1
8
9
5
43
2
7
6
13
16
22
2524
23
21
2019
18
14
12
33
343130
42
55
54
53
52
51
50 49
48
4746
45
44
41
40
39
38
37
36
353229
28
27
26
17
15
10
11
892
870 842
880
889
886
853
840
839
833
832
817
815
506
307
P31
P32
P30
P29
101
P35
P27
890
133
130
126
124
120
122
118
117
115
114
113
112
111
110
109
108
107
105104
103
102
816
878
3032
3001
3035
3050
3045
3044
3041
3038
3034
3033
3004
3002
1191
1190
1187
1186
1179
1176
1175
11741171
3036
20841189
1173
3005
+2.67
-1.00
-2.48 -2.80
+5.88
+1.88
+2.67
+0.05
+2.13
+0.42
-1.21+1.71
+0.33
+1.94
+0.37+3.07
+1.24
+2.02
-2.47+2.47
+0.23
-3.80-1.72
-0.74
-4.27
+0.13
-2.16
-3.96
+0.18
-1.22
-2.45
-1.72
-4.61
-1.79
-0.57
-5.21
-6.31
-3.87
-3.41+2.58
-2.10
-0.44-0.12
-0.97
-5.09
-3.06
-3.10
-1.88
-2.23
-1.60
-1.19
-3.85
-3.08
-1.71
+1.45 +0.79
+3.12
-1.57-1.36
-0.18
-1.42
-1.00
-5.04
-5.08
-2.69
-3.37
-2.29
-2.51-2.31-2.18
+0.54
-0.54+1.15
+0.76
-0.95
-3.13
-2.80
-1.00
-3.12
-1.75
-3.22
-2.42
+0.23
+2.83
-0.45
-3.51
-0.94
-1.82
-0.70
-5.25
+3.50+2.86
-1.96
-2.29
-1.75
-2.85
-2.07
-1.56
-5.76
-0.78
-5.46
-2.67
-2.86
-3.40
-1.20
-2.55
-2.52
-1.51
-1.55
-0.30
-4.12-5.30
-2.64
-5.45
-4.87
-3.51
+1.77
+1.55
+0.83+3.60
+1.84
+1.83
+1.41
+0.34
-4.02
+2.10
Halsteadrechargesite
Sedgwickrechargesite
+5.881
Study area
Area of water-level recovery, in feet
0 to +10
Line of equal change of water level— Interval 2 feet. Dashed where approximately located
Artificial recharge demonstration site— Halstead site in operation May 1997– June 2002; Sedgwick site in operation April 1998–November 2000
Well hydrograph shown in figure 2
Equus beds historic observation well
EXPLANATION
Upper number is well identification number. Lowernumber is water-level change, in feet. Negative number indicates water level was less than in January 2000.
Water-level measurements were made by city of Wichita personnel.
Depletion of storage volume in study area betweenJanuary 2000 and January 2003 was 33,000 acre-feet.
+0.13886
Figure 25. Water-level change in Equus Beds aquifer in study area, January 2000–January 2003.
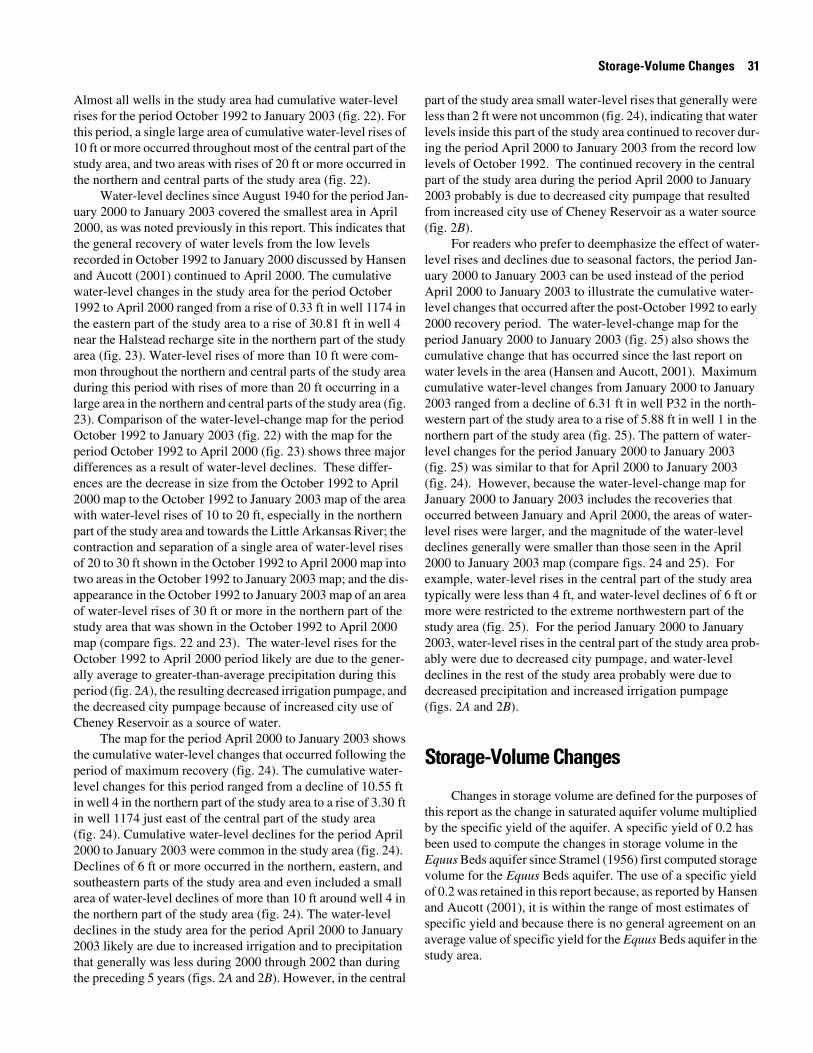
Storage-Volume Changes 31
Almost all wells in the study area had cumulative water-level rises for the period October 1992 to January 2003 (fig. 22). For this period, a single large area of cumulative water-level rises of 10 ft or more occurred throughout most of the central part of the study area, and two areas with rises of 20 ft or more occurred in the northern and central parts of the study area (fig. 22).
Water-level declines since August 1940 for the period Jan-uary 2000 to January 2003 covered the smallest area in April 2000, as was noted previously in this report. This indicates that the general recovery of water levels from the low levels recorded in October 1992 to January 2000 discussed by Hansen and Aucott (2001) continued to April 2000. The cumulative water-level changes in the study area for the period October 1992 to April 2000 ranged from a rise of 0.33 ft in well 1174 in the eastern part of the study area to a rise of 30.81 ft in well 4 near the Halstead recharge site in the northern part of the study area (fig. 23). Water-level rises of more than 10 ft were com-mon throughout the northern and central parts of the study area during this period with rises of more than 20 ft occurring in a large area in the northern and central parts of the study area (fig. 23). Comparison of the water-level-change map for the period October 1992 to January 2003 (fig. 22) with the map for the period October 1992 to April 2000 (fig. 23) shows three major differences as a result of water-level declines. These differ-ences are the decrease in size from the October 1992 to April 2000 map to the October 1992 to January 2003 map of the area with water-level rises of 10 to 20 ft, especially in the northern part of the study area and towards the Little Arkansas River; the contraction and separation of a single area of water-level rises of 20 to 30 ft shown in the October 1992 to April 2000 map into two areas in the October 1992 to January 2003 map; and the dis-appearance in the October 1992 to January 2003 map of an area of water-level rises of 30 ft or more in the northern part of the study area that was shown in the October 1992 to April 2000 map (compare figs. 22 and 23). The water-level rises for the October 1992 to April 2000 period likely are due to the gener-ally average to greater-than-average precipitation during this period (fig. 2A), the resulting decreased irrigation pumpage, and the decreased city pumpage because of increased city use of Cheney Reservoir as a source of water.
The map for the period April 2000 to January 2003 shows the cumulative water-level changes that occurred following the period of maximum recovery (fig. 24). The cumulative water-level changes for this period ranged from a decline of 10.55 ft in well 4 in the northern part of the study area to a rise of 3.30 ft in well 1174 just east of the central part of the study area (fig. 24). Cumulative water-level declines for the period April 2000 to January 2003 were common in the study area (fig. 24). Declines of 6 ft or more occurred in the northern, eastern, and southeastern parts of the study area and even included a small area of water-level declines of more than 10 ft around well 4 in the northern part of the study area (fig. 24). The water-level declines in the study area for the period April 2000 to January 2003 likely are due to increased irrigation and to precipitation that generally was less during 2000 through 2002 than during the preceding 5 years (figs. 2A and 2B). However, in the central
part of the study area small water-level rises that generally were less than 2 ft were not uncommon (fig. 24), indicating that water levels inside this part of the study area continued to recover dur-ing the period April 2000 to January 2003 from the record low levels of October 1992. The continued recovery in the central part of the study area during the period April 2000 to January 2003 probably is due to decreased city pumpage that resulted from increased city use of Cheney Reservoir as a water source (fig. 2B).
For readers who prefer to deemphasize the effect of water-level rises and declines due to seasonal factors, the period Jan-uary 2000 to January 2003 can be used instead of the period April 2000 to January 2003 to illustrate the cumulative water-level changes that occurred after the post-October 1992 to early 2000 recovery period. The water-level-change map for the period January 2000 to January 2003 (fig. 25) also shows the cumulative change that has occurred since the last report on water levels in the area (Hansen and Aucott, 2001). Maximum cumulative water-level changes from January 2000 to January 2003 ranged from a decline of 6.31 ft in well P32 in the north-western part of the study area to a rise of 5.88 ft in well 1 in the northern part of the study area (fig. 25). The pattern of water-level changes for the period January 2000 to January 2003 (fig. 25) was similar to that for April 2000 to January 2003 (fig. 24). However, because the water-level-change map for January 2000 to January 2003 includes the recoveries that occurred between January and April 2000, the areas of water-level rises were larger, and the magnitude of the water-level declines generally were smaller than those seen in the April 2000 to January 2003 map (compare figs. 24 and 25). For example, water-level rises in the central part of the study area typically were less than 4 ft, and water-level declines of 6 ft or more were restricted to the extreme northwestern part of the study area (fig. 25). For the period January 2000 to January 2003, water-level rises in the central part of the study area prob-ably were due to decreased city pumpage, and water-level declines in the rest of the study area probably were due to decreased precipitation and increased irrigation pumpage (figs. 2A and 2B).
Storage-Volume Changes
Changes in storage volume are defined for the purposes of this report as the change in saturated aquifer volume multiplied by the specific yield of the aquifer. A specific yield of 0.2 has been used to compute the changes in storage volume in the Equus Beds aquifer since Stramel (1956) first computed storage volume for the Equus Beds aquifer. The use of a specific yield of 0.2 was retained in this report because, as reported by Hansen and Aucott (2001), it is within the range of most estimates of specific yield and because there is no general agreement on an average value of specific yield for the Equus Beds aquifer in the study area.
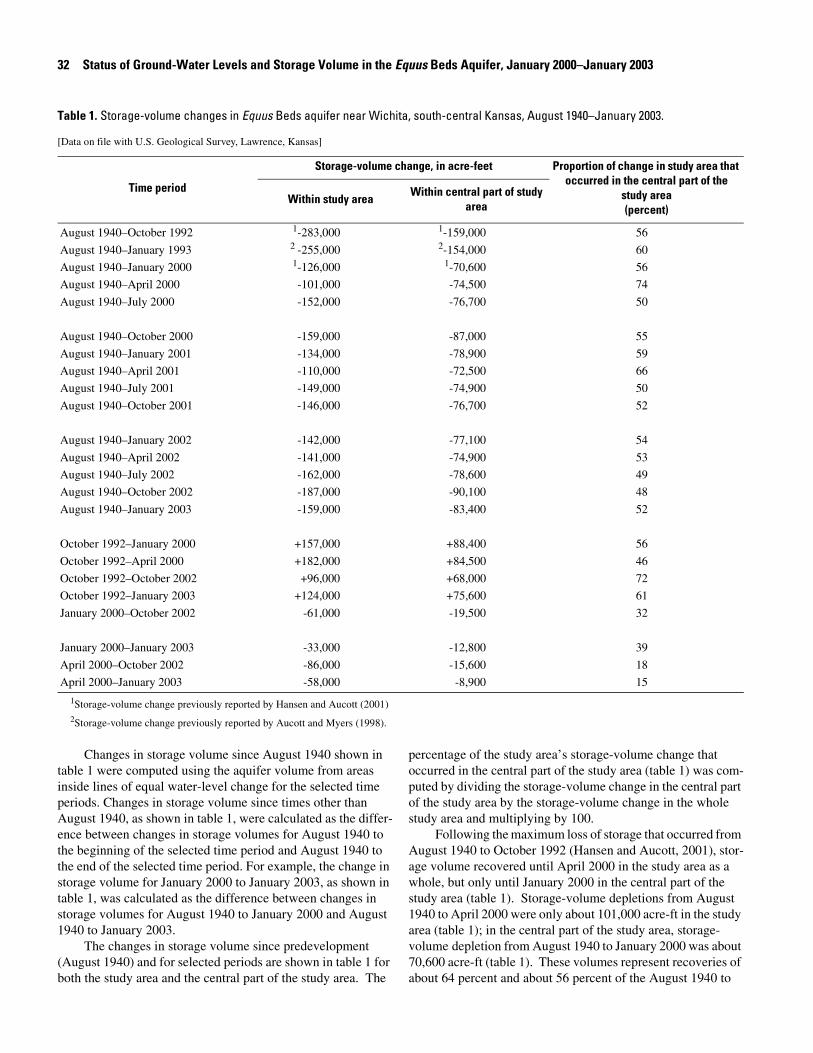
32 Status of Ground-Water Levels and Storage Volume in the Equus Beds Aquifer, January 2000–January 2003
Changes in storage volume since August 1940 shown in table 1 were computed using the aquifer volume from areas inside lines of equal water-level change for the selected time periods. Changes in storage volume since times other than August 1940, as shown in table 1, were calculated as the differ-ence between changes in storage volumes for August 1940 to the beginning of the selected time period and August 1940 to the end of the selected time period. For example, the change in storage volume for January 2000 to January 2003, as shown in table 1, was calculated as the difference between changes in storage volumes for August 1940 to January 2000 and August 1940 to January 2003.
The changes in storage volume since predevelopment (August 1940) and for selected periods are shown in table 1 for both the study area and the central part of the study area. The
percentage of the study area’s storage-volume change that occurred in the central part of the study area (table 1) was com-puted by dividing the storage-volume change in the central part of the study area by the storage-volume change in the whole study area and multiplying by 100.
Following the maximum loss of storage that occurred from August 1940 to October 1992 (Hansen and Aucott, 2001), stor-age volume recovered until April 2000 in the study area as a whole, but only until January 2000 in the central part of the study area (table 1). Storage-volume depletions from August 1940 to April 2000 were only about 101,000 acre-ft in the study area (table 1); in the central part of the study area, storage-volume depletion from August 1940 to January 2000 was about 70,600 acre-ft (table 1). These volumes represent recoveries of about 64 percent and about 56 percent of the August 1940 to
Table 1. Storage-volume changes in Equus Beds aquifer near Wichita, south-central Kansas, August 1940–January 2003.
[Data on file with U.S. Geological Survey, Lawrence, Kansas]
Time period
Storage-volume change, in acre-feet Proportion of change in study area that occurred in the central part of the
study area(percent)
Within study areaWithin central part of study
area
August 1940–October 1992 1-283,000
1Storage-volume change previously reported by Hansen and Aucott (2001)
1-159,000 56
August 1940–January 1993 2 -255,000 2-154,000 60
August 1940–January 2000 1-126,000 1-70,600 56
August 1940–April 2000 -101,000 -74,500 74
August 1940–July 2000 -152,000 -76,700 50
August 1940–October 2000 -159,000 -87,000 55
August 1940–January 2001 -134,000 -78,900 59
August 1940–April 2001 -110,000 -72,500 66
August 1940–July 2001 -149,000 -74,900 50
August 1940–October 2001 -146,000 -76,700 52
August 1940–January 2002 -142,000 -77,100 54
August 1940–April 2002 -141,000 -74,900 53
August 1940–July 2002 -162,000 -78,600 49
August 1940–October 2002 -187,000 -90,100 48
August 1940–January 2003 -159,000 -83,400 52
October 1992–January 2000 +157,000 +88,400 56
October 1992–April 2000 +182,000 +84,500 46
October 1992–October 2002 +96,000 +68,000 72
October 1992–January 2003 +124,000 +75,600 61
January 2000–October 2002 -61,000 -19,500 32
January 2000–January 2003 -33,000 -12,800 39
April 2000–October 2002 -86,000 -15,600 18
April 2000–January 2003 -58,000 -8,900 15
2Storage-volume change previously reported by Aucott and Myers (1998).
Storage-Volume Changes 33
October 1992 depletion that occurred, respectively, in the whole study area and in the central part of the study area. Although the central part of the study area makes up only 33 percent of the study area as a whole, it accounted for about 46 percent of the October 1992 to April 2000 storage-volume recovery in the study area (table 1). The storage-volume recov-eries since October 1992 in both the study area and the central part of the study area were due to the general rise in ground-water levels associated with average to greater-than-average precipitation and to decreases in city and irrigation pumpage (figs. 2A and 2B). Water levels and storage-volume changes from August 1940 to April 2000 for the study area and from August 1940 to January 2000 for the central part of the study area were similar to changes observed from August 1940 to Jan-uary 1970 (fig. 26), which occurred during the 1957–77 period of relatively stable water levels (figs. 2C) identified by Aucott and Myers (1998).
Since April 2000 in the study area and since January 2000 in the central part of the study area, aquifer storage volume has tended to decrease (table 1 and fig. 2C). Whether this indicates the end of the period of general water-level and storage-volume recovery that began in January 1993 (Aucott and Myers, 1998) is not clear at this time (2003). Seasonal water-level declines and storage-volume depletions during 2000–02 (represented by storage-volume changes in July and October) were not com-pletely recovered during the months that followed (represented by storage-volume changes in January and April) (table 1 and fig. 2C).
The largest storage-volume depletion since August 1940 for the period January 2000 to January 2003 occurred during October 2002 both in the study area and in the central part of the study area (table 1). The storage-volume changes for the period August 1940 to October 2002 (table 1) represent about 86,000 acre-ft or a 47-percent loss of the storage recovered
between October 1992 and April 2000 in the study area and about 19,500 acre-ft or a 22-percent loss of the storage recov-ered between October 1992 and January 2000 in the central part of the study area. Major factors in the decreases in water levels and storage volumes during the January 2000 to January 2003 period were reduced recharge associated with precipitation that generally was less than in the preceding 5 years and increased irrigation pumpage (figs. 2A, 2B, and 2C).
Table 1 shows the central part of the study area accounted for only 8,900 acre-ft or about 15 percent of the storage-volume depletion in the whole study area for the period April 2000 to January 2003. This disproportionately small storage-volume depletion that occurred in the central part of the study area prob-ably was the result of decreased city pumpage. This indicates that the loss of storage in the study area probably would have been larger if the continued decrease in city pumpage, which is closely associated with water-level rises in the central part of the study area and increased city use of Cheney Reservoir as a source of water, had not occurred. Storage volume in January 2003 in the study area was similar to volumes seen in the late 1970s and mid-1990s (fig. 2C).
Compared to the storage changes in the entire study area, the storage changes in the central part of the study area have remained relatively constant for the period January 2000 to Jan-uary 2003 (table 1). This may be due in part to the small water-level rises in the central part of the study area [which likely were due to decreased city pumpage as a result of increased city use of Cheney Reservoir as a water source (fig. 2B)] that mostly off-set the larger water-level declines along the edges of the central part of the study area (fig. 25). Thus, the loss of storage for this period probably would have been larger if the continued decrease in city pumpage had not occurred. It is interesting to note that the percentage of the study area depletion that occurred in the central part of the study area was less during the
-300,000
-250,000
-200,000
-150,000
-100,000
-50,000
0
Aug. 1940to Jan. 1957
Aug. 1940to Jan. 1970
Aug. 1940to Oct. 1992
Aug. 1940to Jan. 2000
Aug. 1940to Jan. 2003
Aug. 1940to Oct. 2002
Aug. 1940to Apr. 2000
Chan
ge in
sto
rage
, in
acre
-feet
Central part of study area
Study area
Figure 26. Storage-volume changes in Equus Beds aquifer in study area for significant periods during August 1940–January 2003 (source: data on file with the U.S. Geological Survey, Lawrence, Kansas).
34 Status of Ground-Water Levels and Storage Volume in the Equus Beds Aquifer, January 2000–January 2003
“fall” season (represented by the months of July and October) than during the “spring” season (represented by the months of January and April). This likely is due to seasonal effects of increased irrigation pumpage during the growing season and to decreased city pumpage during the period January 2000 to January 2003.
Effects of Artificial Recharge
In 1995, the city of Wichita began investigating the poten-tial for artificial recharge to meet future water-supply needs and to protect the Equus Beds aquifer from the intrusion of saltwater from natural and human-related sources to the west (Ziegler and others, 1999). Two artificial recharge demonstration sites are located in the central part of the study area near Halstead and Sedgwick (fig. 1). Artificial recharge operations occurred dur-ing May 1997–June 2002 at the Halstead site and during April 1998–November 2000 at the Sedgwick site.
Although artificial recharge has totaled more than 3,324 acre-ft during 1997 through May 2002 (U.S. Geological Survey, 2003b), this is equivalent to less than 3 percent of the approximately 139,000 acre-ft of water pumped by the city from the study area during 1997–2002 (Joan Kenny, U.S. Geo-logical Survey, written commun., 2000 and 2003). The effect of the artificial recharge on water-level changes and storage vol-ume is evident in wells near the recharge sites (Hansen and Aucott, 2001) but is not evident in study-area maps of water-level changes. For example, recharge occurred at the Halstead site throughout much of March and April 2001 (Heather Ross, U.S. Geological Survey, oral commun., September 2003), but no “mounding” of water from this recharge (indicated by con-tours bending around or enclosing an area of smaller declines) occurs on the August 1940–April 2001 water-level-change map near the Halstead site (fig. 13). The effects of artificial recharge probably were masked by the generally larger decreases in city pumpage in the central part of the study area, which went from about 24,600 acre-ft in 1997 to about 18,600 acre-ft in 2002 (fig. 2B). As artificial recharge moves from the demonstration stage to the production stage, its effect on water levels and stor-age volume in the study area may become more obvious.
Summary
The Equus Beds aquifer in southwestern Harvey County and northwestern Sedgwick County was developed to supply water to Wichita residents and for irrigation in south-central Kansas beginning on September 1, 1940. Ground-water pump-age for city and agricultural use from the aquifer caused water levels to decline in a large part of the area. Irrigation pumpage in the area increased substantially during the 1970s and 1980s and accelerated water-level declines. Most of the water-level declines can be attributed to ground-water pumping; however, climatic conditions (and thus recharge to the Equus Beds aqui-
fer) also have affected ground-water levels. In 1965, the city of Wichita began using water from Cheney Reservoir in addition to water from the Equus Beds aquifer. Since 1995, the city has been investigating the use of artificial recharge in the study area to meet future water-supply needs and to protect the aquifer from the intrusion of saltwater from natural and human-related sources to the west.
A period of water-level rises associated with generally greater-than-average precipitation and decreased city pumpage from the study area began in 1993. An important factor in the decreased city pumpage was increased use of Cheney Reservoir by the city of Wichita as a water-supply source; as a result, city pumpage from the Equus Beds aquifer during 1993–2002 went from being greater than one-half to slightly less than one-third of Wichita’s water usage.
During January 2003, the direction of ground-water flow in the Equus Beds aquifer in the study area generally was from west to east, similar to predevelopment of the aquifer. The max-imum water-level decline since 1940 for the period January 2000 to January 2003 was 29.54 ft in July 2002 in well 3 in the northern part of the study area. The period with the smallest area of water-level declines since August 1940 for the period Janu-ary 2000 to January 2003 was April 2000. The seasonal water-level changes in wells in most of the study area during the period January 2000 to January 2003 typically were less than 5 ft. However, during 2000 and 2001, seasonal water-level changes of 20 to 25 ft occurred in the northern part of the study area, probably due to seasonal agricultural irrigation pumpage and semiconfined aquifer conditions.
Almost all wells in the study area had cumulative water-level rises from the record low levels in October 1992 to Janu-ary 2003. Water-level rises following October 1992 continued until April 2000 when cumulative water-level rises of 10 ft or more were common in the study area, and rises of more than 20 ft occurred in a large area in the northern and central parts of the study area. These water-level rises likely were mostly due to generally average to greater-than-average precipitation and decreased city pumpage. Cumulative water-level declines, which likely were mostly due to increased irrigation pumpage and decreased precipitation, were common in the study area from April 2000 to January 2003, and declines of 6 or more ft occurred in the northern, eastern, and southeastern parts of the study area. However, small water-level rises that generally were less than 2 ft were not uncommon in the central part of the study area and probably were the result of the continued decrease in city pumpage.
Following the maximum loss of storage that occurred from August 1940 to October 1992, storage volume recovered until April 2000 in the study area. The storage-volume depletion of 101,000 acre-ft from August 1940 to April 2000 represents a recovery of about 64 percent of the January 1940 to October 1992 depletion in the study area; about 46 percent of this recov-ery occurred in the central part of the study area. The recovery was due to the general rises in ground-water levels associated with average to greater-than-average precipitation and to decreases in city and irrigation pumpage. Storage-volume
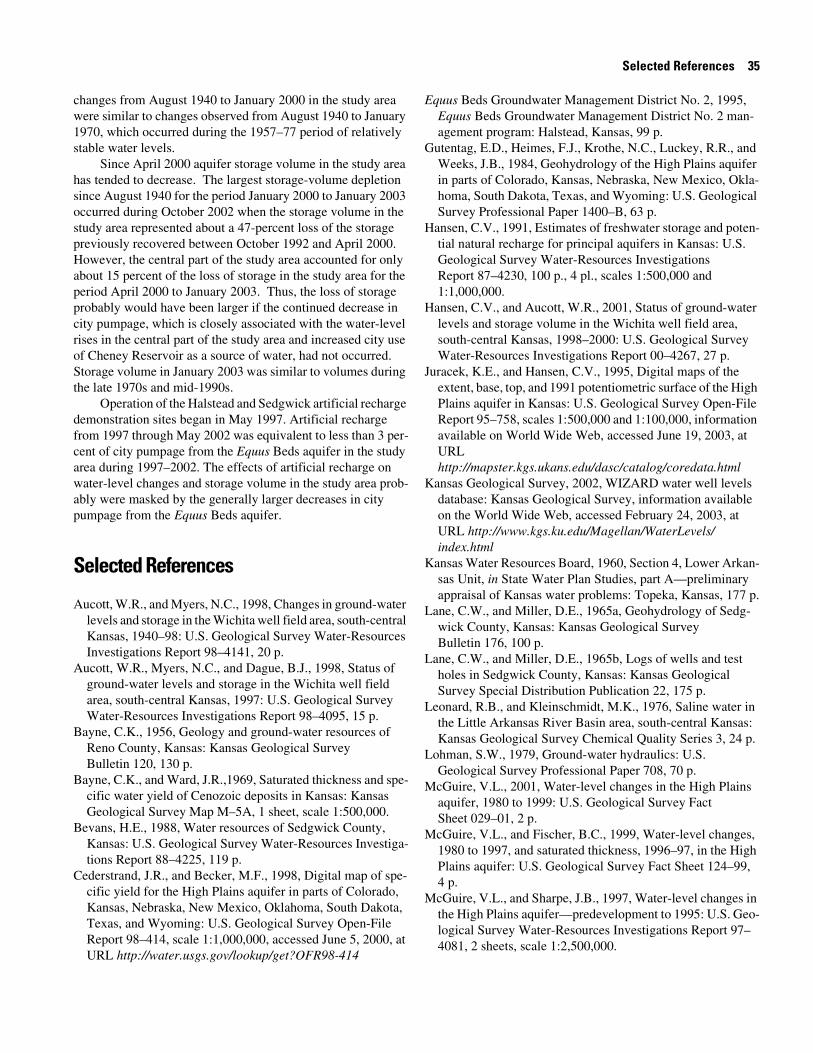
Selected References 35
changes from August 1940 to January 2000 in the study area were similar to changes observed from August 1940 to January 1970, which occurred during the 1957–77 period of relatively stable water levels.
Since April 2000 aquifer storage volume in the study area has tended to decrease. The largest storage-volume depletion since August 1940 for the period January 2000 to January 2003 occurred during October 2002 when the storage volume in the study area represented about a 47-percent loss of the storage previously recovered between October 1992 and April 2000. However, the central part of the study area accounted for only about 15 percent of the loss of storage in the study area for the period April 2000 to January 2003. Thus, the loss of storage probably would have been larger if the continued decrease in city pumpage, which is closely associated with the water-level rises in the central part of the study area and increased city use of Cheney Reservoir as a source of water, had not occurred. Storage volume in January 2003 was similar to volumes during the late 1970s and mid-1990s.
Operation of the Halstead and Sedgwick artificial recharge demonstration sites began in May 1997. Artificial recharge from 1997 through May 2002 was equivalent to less than 3 per-cent of city pumpage from the Equus Beds aquifer in the study area during 1997–2002. The effects of artificial recharge on water-level changes and storage volume in the study area prob-ably were masked by the generally larger decreases in city pumpage from the Equus Beds aquifer.
Selected References
Aucott, W.R., and Myers, N.C., 1998, Changes in ground-water levels and storage in the Wichita well field area, south-central Kansas, 1940–98: U.S. Geological Survey Water-Resources Investigations Report 98–4141, 20 p.
Aucott, W.R., Myers, N.C., and Dague, B.J., 1998, Status of ground-water levels and storage in the Wichita well field area, south-central Kansas, 1997: U.S. Geological Survey Water-Resources Investigations Report 98–4095, 15 p.
Bayne, C.K., 1956, Geology and ground-water resources of Reno County, Kansas: Kansas Geological Survey Bulletin 120, 130 p.
Bayne, C.K., and Ward, J.R.,1969, Saturated thickness and spe-cific water yield of Cenozoic deposits in Kansas: Kansas Geological Survey Map M–5A, 1 sheet, scale 1:500,000.
Bevans, H.E., 1988, Water resources of Sedgwick County, Kansas: U.S. Geological Survey Water-Resources Investiga-tions Report 88–4225, 119 p.
Cederstrand, J.R., and Becker, M.F., 1998, Digital map of spe-cific yield for the High Plains aquifer in parts of Colorado, Kansas, Nebraska, New Mexico, Oklahoma, South Dakota, Texas, and Wyoming: U.S. Geological Survey Open-File Report 98–414, scale 1:1,000,000, accessed June 5, 2000, at URL http://water.usgs.gov/lookup/get?OFR98-414
Equus Beds Groundwater Management District No. 2, 1995, Equus Beds Groundwater Management District No. 2 man-agement program: Halstead, Kansas, 99 p.
Gutentag, E.D., Heimes, F.J., Krothe, N.C., Luckey, R.R., and Weeks, J.B., 1984, Geohydrology of the High Plains aquifer in parts of Colorado, Kansas, Nebraska, New Mexico, Okla-homa, South Dakota, Texas, and Wyoming: U.S. Geological Survey Professional Paper 1400–B, 63 p.
Hansen, C.V., 1991, Estimates of freshwater storage and poten-tial natural recharge for principal aquifers in Kansas: U.S. Geological Survey Water-Resources Investigations Report 87–4230, 100 p., 4 pl., scales 1:500,000 and 1:1,000,000.
Hansen, C.V., and Aucott, W.R., 2001, Status of ground-water levels and storage volume in the Wichita well field area, south-central Kansas, 1998–2000: U.S. Geological Survey Water-Resources Investigations Report 00–4267, 27 p.
Juracek, K.E., and Hansen, C.V., 1995, Digital maps of the extent, base, top, and 1991 potentiometric surface of the High Plains aquifer in Kansas: U.S. Geological Survey Open-File Report 95–758, scales 1:500,000 and 1:100,000, information available on World Wide Web, accessed June 19, 2003, at URL http://mapster.kgs.ukans.edu/dasc/catalog/coredata.html
Kansas Geological Survey, 2002, WIZARD water well levels database: Kansas Geological Survey, information available on the World Wide Web, accessed February 24, 2003, at URL http://www.kgs.ku.edu/Magellan/WaterLevels/index.html
Kansas Water Resources Board, 1960, Section 4, Lower Arkan-sas Unit, in State Water Plan Studies, part A—preliminary appraisal of Kansas water problems: Topeka, Kansas, 177 p.
Lane, C.W., and Miller, D.E., 1965a, Geohydrology of Sedg-wick County, Kansas: Kansas Geological Survey Bulletin 176, 100 p.
Lane, C.W., and Miller, D.E., 1965b, Logs of wells and test holes in Sedgwick County, Kansas: Kansas Geological Survey Special Distribution Publication 22, 175 p.
Leonard, R.B., and Kleinschmidt, M.K., 1976, Saline water in the Little Arkansas River Basin area, south-central Kansas: Kansas Geological Survey Chemical Quality Series 3, 24 p.
Lohman, S.W., 1979, Ground-water hydraulics: U.S. Geological Survey Professional Paper 708, 70 p.
McGuire, V.L., 2001, Water-level changes in the High Plains aquifer, 1980 to 1999: U.S. Geological Survey Fact Sheet 029–01, 2 p.
McGuire, V.L., and Fischer, B.C., 1999, Water-level changes, 1980 to 1997, and saturated thickness, 1996–97, in the High Plains aquifer: U.S. Geological Survey Fact Sheet 124–99, 4 p.
McGuire, V.L., and Sharpe, J.B., 1997, Water-level changes in the High Plains aquifer—predevelopment to 1995: U.S. Geo-logical Survey Water-Resources Investigations Report 97–4081, 2 sheets, scale 1:2,500,000.
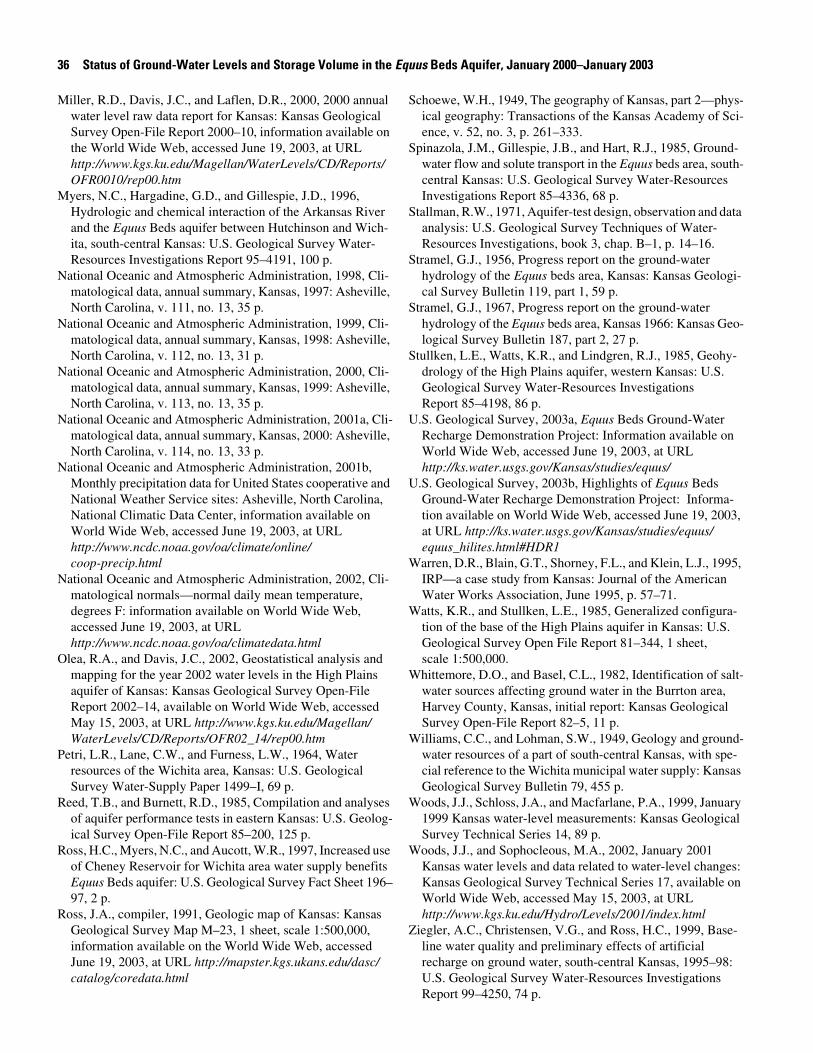
36 Status of Ground-Water Levels and Storage Volume in the Equus Beds Aquifer, January 2000–January 2003
Miller, R.D., Davis, J.C., and Laflen, D.R., 2000, 2000 annual water level raw data report for Kansas: Kansas Geological Survey Open-File Report 2000–10, information available on the World Wide Web, accessed June 19, 2003, at URL http://www.kgs.ku.edu/Magellan/WaterLevels/CD/Reports/OFR0010/rep00.htm
Myers, N.C., Hargadine, G.D., and Gillespie, J.D., 1996, Hydrologic and chemical interaction of the Arkansas River and the Equus Beds aquifer between Hutchinson and Wich-ita, south-central Kansas: U.S. Geological Survey Water-Resources Investigations Report 95–4191, 100 p.
National Oceanic and Atmospheric Administration, 1998, Cli-matological data, annual summary, Kansas, 1997: Asheville, North Carolina, v. 111, no. 13, 35 p.
National Oceanic and Atmospheric Administration, 1999, Cli-matological data, annual summary, Kansas, 1998: Asheville, North Carolina, v. 112, no. 13, 31 p.
National Oceanic and Atmospheric Administration, 2000, Cli-matological data, annual summary, Kansas, 1999: Asheville, North Carolina, v. 113, no. 13, 35 p.
National Oceanic and Atmospheric Administration, 2001a, Cli-matological data, annual summary, Kansas, 2000: Asheville, North Carolina, v. 114, no. 13, 33 p.
National Oceanic and Atmospheric Administration, 2001b, Monthly precipitation data for United States cooperative and National Weather Service sites: Asheville, North Carolina, National Climatic Data Center, information available on World Wide Web, accessed June 19, 2003, at URLhttp://www.ncdc.noaa.gov/oa/climate/online/coop-precip.html
National Oceanic and Atmospheric Administration, 2002, Cli-matological normals—normal daily mean temperature, degrees F: information available on World Wide Web, accessed June 19, 2003, at URL http://www.ncdc.noaa.gov/oa/climatedata.html
Olea, R.A., and Davis, J.C., 2002, Geostatistical analysis and mapping for the year 2002 water levels in the High Plains aquifer of Kansas: Kansas Geological Survey Open-File Report 2002–14, available on World Wide Web, accessed May 15, 2003, at URL http://www.kgs.ku.edu/Magellan/WaterLevels/CD/Reports/OFR02_14/rep00.htm
Petri, L.R., Lane, C.W., and Furness, L.W., 1964, Water resources of the Wichita area, Kansas: U.S. Geological Survey Water-Supply Paper 1499–I, 69 p.
Reed, T.B., and Burnett, R.D., 1985, Compilation and analyses of aquifer performance tests in eastern Kansas: U.S. Geolog-ical Survey Open-File Report 85–200, 125 p.
Ross, H.C., Myers, N.C., and Aucott, W.R., 1997, Increased use of Cheney Reservoir for Wichita area water supply benefits Equus Beds aquifer: U.S. Geological Survey Fact Sheet 196–97, 2 p.
Ross, J.A., compiler, 1991, Geologic map of Kansas: Kansas Geological Survey Map M–23, 1 sheet, scale 1:500,000, information available on the World Wide Web, accessed June 19, 2003, at URL http://mapster.kgs.ukans.edu/dasc/catalog/coredata.html
Schoewe, W.H., 1949, The geography of Kansas, part 2—phys-ical geography: Transactions of the Kansas Academy of Sci-ence, v. 52, no. 3, p. 261–333.
Spinazola, J.M., Gillespie, J.B., and Hart, R.J., 1985, Ground-water flow and solute transport in the Equus beds area, south-central Kansas: U.S. Geological Survey Water-Resources Investigations Report 85–4336, 68 p.
Stallman, R.W., 1971, Aquifer-test design, observation and data analysis: U.S. Geological Survey Techniques of Water-Resources Investigations, book 3, chap. B–1, p. 14–16.
Stramel, G.J., 1956, Progress report on the ground-water hydrology of the Equus beds area, Kansas: Kansas Geologi-cal Survey Bulletin 119, part 1, 59 p.
Stramel, G.J., 1967, Progress report on the ground-water hydrology of the Equus beds area, Kansas 1966: Kansas Geo-logical Survey Bulletin 187, part 2, 27 p.
Stullken, L.E., Watts, K.R., and Lindgren, R.J., 1985, Geohy-drology of the High Plains aquifer, western Kansas: U.S. Geological Survey Water-Resources Investigations Report 85–4198, 86 p.
U.S. Geological Survey, 2003a, Equus Beds Ground-Water Recharge Demonstration Project: Information available on World Wide Web, accessed June 19, 2003, at URL http://ks.water.usgs.gov/Kansas/studies/equus/
U.S. Geological Survey, 2003b, Highlights of Equus Beds Ground-Water Recharge Demonstration Project: Informa-tion available on World Wide Web, accessed June 19, 2003, at URL http://ks.water.usgs.gov/Kansas/studies/equus/equus_hilites.html#HDR1
Warren, D.R., Blain, G.T., Shorney, F.L., and Klein, L.J., 1995, IRP—a case study from Kansas: Journal of the American Water Works Association, June 1995, p. 57–71.
Watts, K.R., and Stullken, L.E., 1985, Generalized configura-tion of the base of the High Plains aquifer in Kansas: U.S. Geological Survey Open File Report 81–344, 1 sheet, scale 1:500,000.
Whittemore, D.O., and Basel, C.L., 1982, Identification of salt-water sources affecting ground water in the Burrton area, Harvey County, Kansas, initial report: Kansas Geological Survey Open-File Report 82–5, 11 p.
Williams, C.C., and Lohman, S.W., 1949, Geology and ground-water resources of a part of south-central Kansas, with spe-cial reference to the Wichita municipal water supply: Kansas Geological Survey Bulletin 79, 455 p.
Woods, J.J., Schloss, J.A., and Macfarlane, P.A., 1999, January 1999 Kansas water-level measurements: Kansas Geological Survey Technical Series 14, 89 p.
Woods, J.J., and Sophocleous, M.A., 2002, January 2001 Kansas water levels and data related to water-level changes: Kansas Geological Survey Technical Series 17, available on World Wide Web, accessed May 15, 2003, at URLhttp://www.kgs.ku.edu/Hydro/Levels/2001/index.html
Ziegler, A.C., Christensen, V.G., and Ross, H.C., 1999, Base-line water quality and preliminary effects of artificial recharge on ground water, south-central Kansas, 1995–98: U.S. Geological Survey Water-Resources Investigations Report 99–4250, 74 p.

![Agência Nacional de Águas - Associação Brasileira de ...conference1]paulo... · Plains (Ogallala, Great Bend Prairie e Equus Beds); Os aqüíferos High Plains se estendem por](https://img.dokumen.tips/doc/110x75/5c1b790009d3f2160d8c1da4/agencia-nacional-de-aguas-associacao-brasileira-de-conference1paulo.jpg)