Embed Size (px)
Citation preview
Baseline Data-Collection and Quality- Control Protocols and Procedures for the Equus Beds Ground-Water Recharge Demonstration Project Near Wichita, Kansas, 1995-96
By A.C. ZIEGLER and LJ. COMBS
U.S. GEOLOGICAL SURVEY
Open-File Report 97-235
Prepared in cooperation with the CITY OF WICHITA
Lawrence, Kansas 1997
BRUCE BABBITT, Secretary
U.S. DEPARTMENT OF THE INTERIOR
U.S. GEOLOGICAL SURVEY
GORDON P. EATON, Director
The use of firm, trade, and brand names in this report is for identification purposes only and does not constitute endorsement by the U.S. Geological Survey
For additional information write to:
District Chief U.S. Geological Survey 4821 Quail Crest Place Lawrence, Kansas 66049-3839
Copies of this report can be purchased from:
U.S. Geological Survey Information Services Box 25286 Federal Center Denver, CO 80225-0286
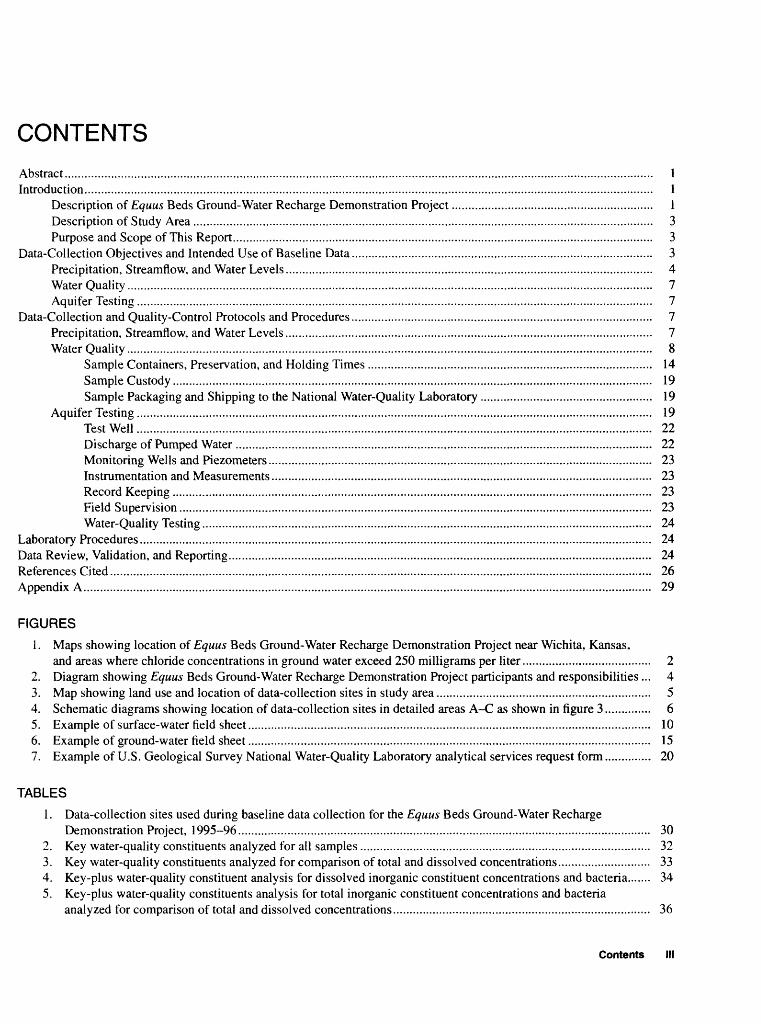
CONTENTS
Abstract........................................................................^ 1Introduction.................................................................................................................................................^ 1
Description of Equus Beds Ground-Water Recharge Demonstration Project............................................................. 1Description of Study Area ........................................................................................................................................... 3Purpose and Scope of This Report............................................................................................................................... 3
Data-Collection Objectives and Intended Use of Baseline Data........................................................................................... 3Precipitation, Streamflow, and Water Levels............................................................................................................... 4Water Quality ............................................... 7Aquifer Testing............................................................................................................................................................ 7
Data-Collection and Quality-Control Protocols and Procedures........................................................................................... 7Precipitation, Streamflow, and Water Levels............................................................................................................... 7Water Quality...........................................................................................................................................................^ 8
Sample Containers, Preservation, and Holding Times ...................................................................................... 14Sample Custody................................................................................................................................................. 19Sample Packaging and Shipping to the National Water-Quality Laboratory.................................................... 19
Aquifer Testing............................................................................................................................................................ 19Test Well............................................................................................................................................................ 22Discharge of Pumped Water .............................................................................................................................. 22Monitoring Wells and Piezometers.................................................................................................................... 23Instrumentation and Measurements................................................................................................................... 23Record Keeping................................................................................................................................................. 23Field Supervision............................................................................................................................................... 23Water-Quality Testing........................................................................................................................................ 24
Laboratory Procedures............................................................................................................._^ 24Data Review, Validation, and Reporting................................................................................................................................ 24References Cited.................................................................................................................................................................... 26Appendix A.................................................................................................................................................................^ 29
FIGURES
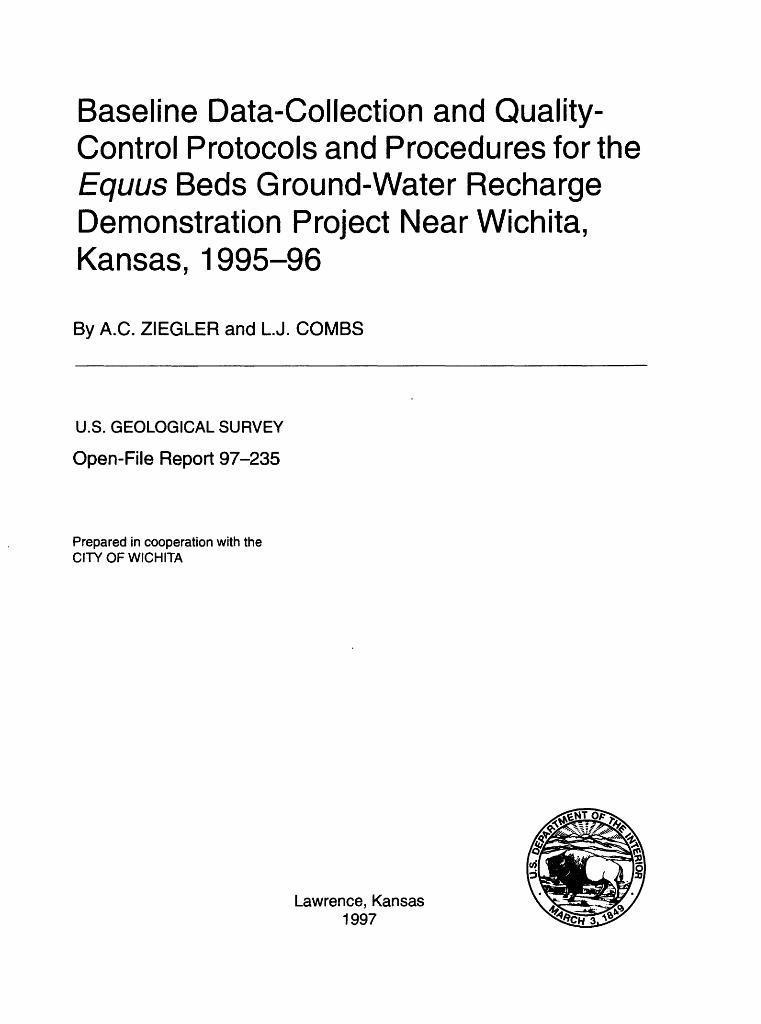
1. Maps showing location of Equus Beds Ground-Water Recharge Demonstration Project near Wichita, Kansas,and areas where chloride concentrations in ground water exceed 250 milligrams per liter....................................... 2
2. Diagram showing Equus Beds Ground-Water Recharge Demonstration Project participants and responsibilities... 43. Map showing land use and location of data-collection sites in study area................................................................. 54. Schematic diagrams showing location of data-collection sites in detailed areas A-C as shown in figure 3.............. 65. Example of surface-water field sheet.......................................................................................................................... 106. Example of ground-water field sheet.......................................................................................................................... 157. Example of U.S. Geological Survey National Water-Quality Laboratory analytical services request form.............. 20
TABLES
1. Data-collection sites used during baseline data collection for the Equus Beds Ground-Water RechargeDemonstration Project, 1995-96............................................................................................................................. 30
2. Key water-quality constituents analyzed for all samples ........................................................................................ 323. Key water-quality constituents analyzed for comparison of total and dissolved concentrations............................ 334. Key-plus water-quality constituent analysis for dissolved inorganic constituent concentrations and bacteria....... 345. Key-plus water-quality constituents analysis for total inorganic constituent concentrations and bacteria
analyzed for comparison of total and dissolved concentrations.............................................................................. 36
Contents III
TABLES Continued
6. Key-plus water-quality constituents and limited U.S. Environmental Protection Agency MaximumContaminant Level analysis for dissolved concentrations of selected pesticides................................................... 38
7. Key-plus water-quality constituents and limited U.S. Environmental Protection Agency MaximumContaminant Level analysis for total organonitrogen pesticides............................................................................ 40
8. Limited U.S. Environmental Protection Agency Maximum Contaminant Level analysis for dissolvedconcentrations of pesticides.................................................................................................................................... 41
9. Limited U.S. Environmental Protection Agency Maximum Contaminant Level analysis for total recoverableconcentrations of organochlorine and carbamate pesticides................................................................................... 43
10. Limited U.S. Environmental Protection Agency Maximum Contaminant Level analysis for total recoverablevolatile organic compounds.................................................................................................................................... 44
11. Full U.S. Environmental Protection Agency Maximum Contaminant Level analysis for dissolvedradionuclides........................................................................................................................................................... 47
12. Full U.S. Environmental Protection Agency Maximum Contaminant Level analysis for total recoverableconcentrations of organochlorine and organophosphate pesticides........................................................................ 48
13. Full U.S. Environmental Protection Agency Maximum Contaminant Level analysis for total recoverableconcentrations of acid and base/neutral organic compounds.................................................................................. 49
14. Schedule for baseline and event sampling from February through September 1995............................................. 5115. Schedule for baseline, event, and aquifer-test sampling from October 1995 through September 1996 ................ 5216. Sample bottles, treatment, and preservatives for key, key-plus, limited, and full U.S. Environmental
Protection Agency analyses of water-quality constituents..................................................................................... 5417. Water-quality sampling and analysis for 30-day aquifer test................................................................................. 57
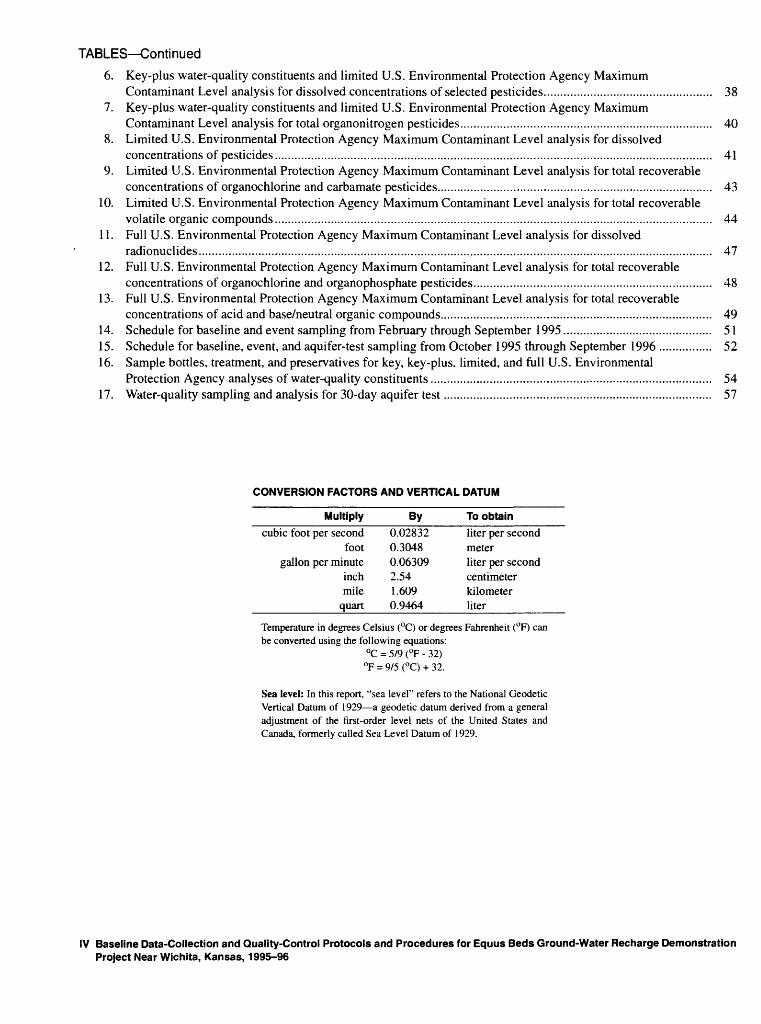
CONVERSION FACTORS AND VERTICAL DATUM
Multiply By To obtain____cubic foot per second 0.02832 liter per second
foot 0.3048 metergallon per minute 0.06309 liter per second
inch 2.54 centimetermile 1.609 kilometer
__________quart 0.9464_____liter_________
Temperature in degrees Celsius (°C) or degrees Fahrenheit (°F) can be converted using the following equations:
°C = 5/9 (°F - 32)°F = 9/5 (°C) + 32.
Sea level: In this report, "sea level" refers to the National Geodetic Vertical Datum of 1929 a geodetic datum derived from a general adjustment of the first-order level nets of the United States and Canada, formerly called Sea Level Datum of 1929.
IV Baseline Data-Collection and Quality-Control Protocols and Procedures for Equus Beds Ground-Water Recharge Demonstration Project Near Wichita, Kansas, 1995-96
Baseline Data-Collection and Quality-Control Protocols and Procedures for the Equus Beds Ground-Water Recharge Demonstration Project Near Wichita, Kansas, 1995-96ByA.C. Ziegler and L.J. Combs
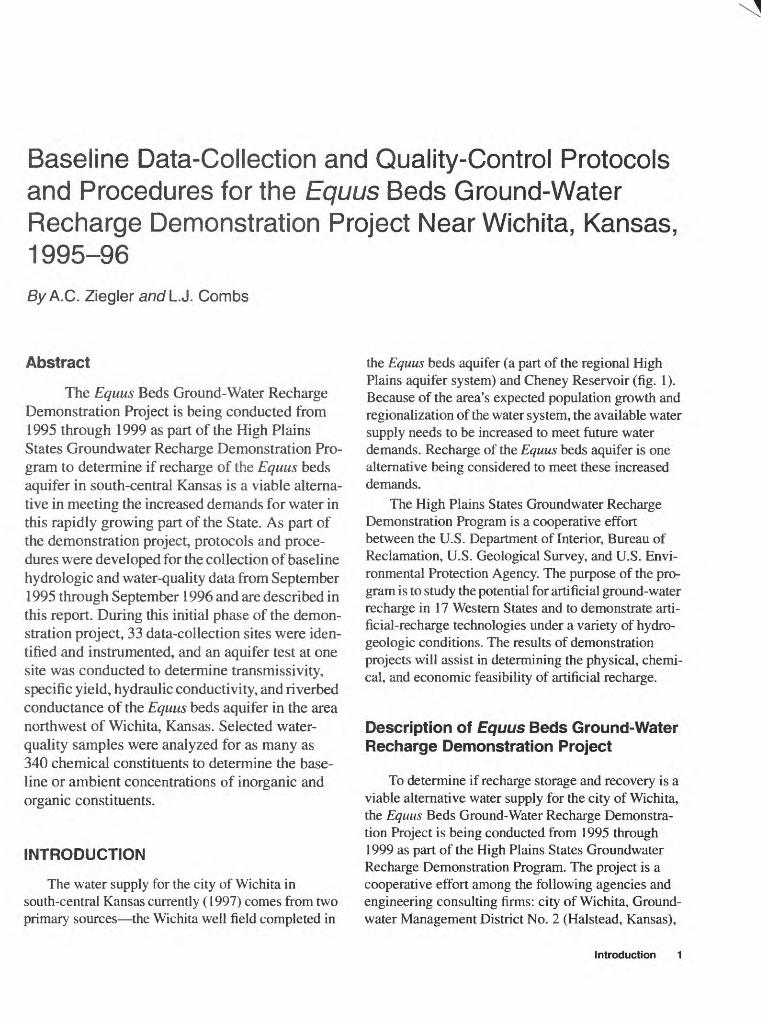
Abstract
The Equus Beds Ground-Water Recharge Demonstration Project is being conducted from 1995 through 1999 as part of the High Plains States Groundwater Recharge Demonstration Pro gram to determine if recharge of the Equus beds aquifer in south-central Kansas is a viable alterna tive in meeting the increased demands for water in this rapidly growing part of the State. As part of the demonstration project, protocols and proce dures were developed for the collection of baseline hydrologic and water-quality data from September 1995 through September 1996 and are described in this report. During this initial phase of the demon stration project, 33 data-collection sites were iden tified and instrumented, and an aquifer test at one site was conducted to determine transmissivity, specific yield, hydraulic conductivity, and riverbed conductance of the Equus beds aquifer in the area northwest of Wichita, Kansas. Selected water- quality samples were analyzed for as many as 340 chemical constituents to determine the base line or ambient concentrations of inorganic and organic constituents.
INTRODUCTION
The water supply for the city of Wichita in south-central Kansas currently (1997) comes from two primary sources the Wichita well field completed in
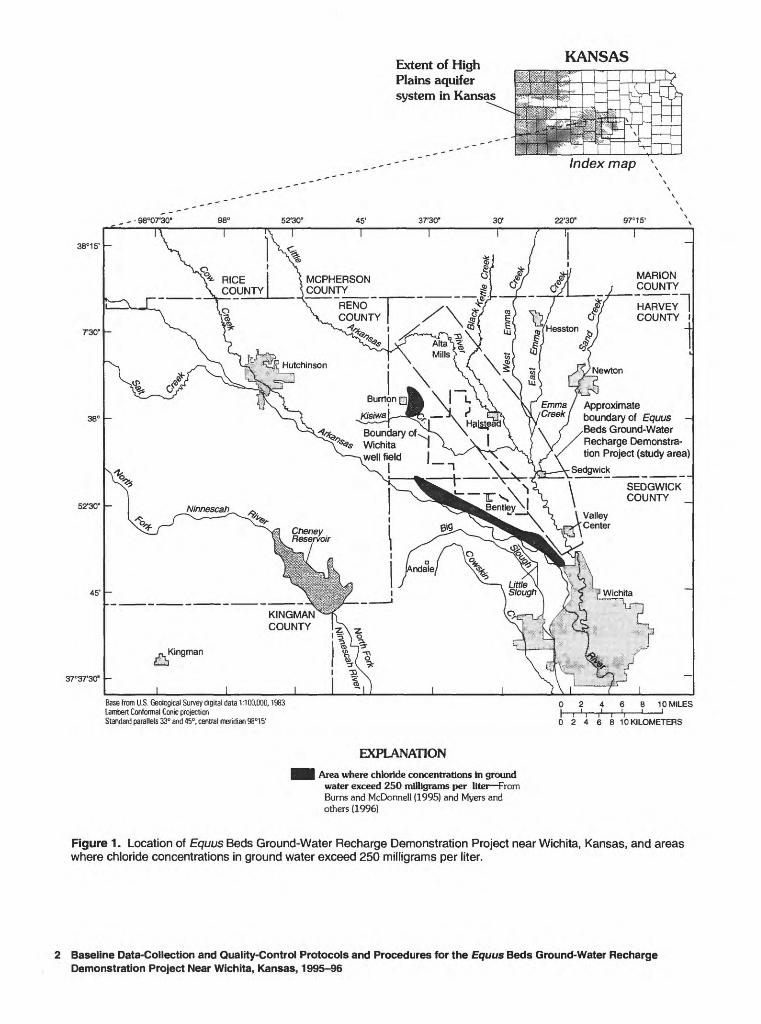
the Equus beds aquifer (a part of the regional High Plains aquifer system) and Cheney Reservoir (fig. 1). Because of the area's expected population growth and regionalization of the water system, the available water supply needs to be increased to meet future water demands. Recharge of the Equus beds aquifer is one alternative being considered to meet these increased demands.
The High Plains States Groundwater Recharge Demonstration Program is a cooperative effort between the U.S. Department of Interior, Bureau of Reclamation, U.S. Geological Survey, and U.S. Envi ronmental Protection Agency. The purpose of the pro gram is to study the potential for artificial ground-water recharge in 17 Western States and to demonstrate arti ficial-recharge technologies under a variety of hydro- geologic conditions. The results of demonstration projects will assist in determining the physical, chemi cal, and economic feasibility of artificial recharge.
Description of Equus Beds Ground-Water Recharge Demonstration Project
To determine if recharge storage and recovery is a viable alternative water supply for the city of Wichita, the Equus Beds Ground-Water Recharge Demonstra tion Project is being conducted from 1995 through 1999 as part of the High Plains States Groundwater Recharge Demonstration Program. The project is a cooperative effort among the following agencies and engineering consulting firms: city of Wichita, Ground- water Management District No. 2 (Halstead, Kansas),
Introduction 1
Extent of High Plains aquifer system in Kansas
KANSAS
Index map \
_ - - 98°07'30" 98° 52'30' 45'
38°15'
MARION COUNTY
HARVEY I COUNTY
MCPHERSON COUNTY__
RENO COUNTY
. Approximate
CreekJ boundary of Equus - Beds Ground-Water Recnar9e Demonstra- tion ProJect (study area)
odaryofWichita ' well field \_
SEDGWICK COUNTY _
KINGMAN COUNTY
52'30" -
45' -
37°37'30" -
Base from U.S. Geological Survey digital data 1:100.000.1983Lambert Conformal Conic projectionStandard parallels 33° and 45°. central meridian 98°15' 02468 10 KILOMETERS
EXPLANATION
^H Area where chloride concentrations in ground water exceed 250 milligrams per litei From Burns and McDonnell (1995) and Myers and others (1996)
Figure 1 . Location of Equus Beds Ground-Water Recharge Demonstration Project near Wichita, Kansas, and areas where chloride concentrations in ground water exceed 250 milligrams per liter.
2 Baseline Data-Collection and Quality-Control Protocols and Procedures for the Equus Beds Ground-Water Recharge Demonstration Project Near Wichita, Kansas, 1995-96
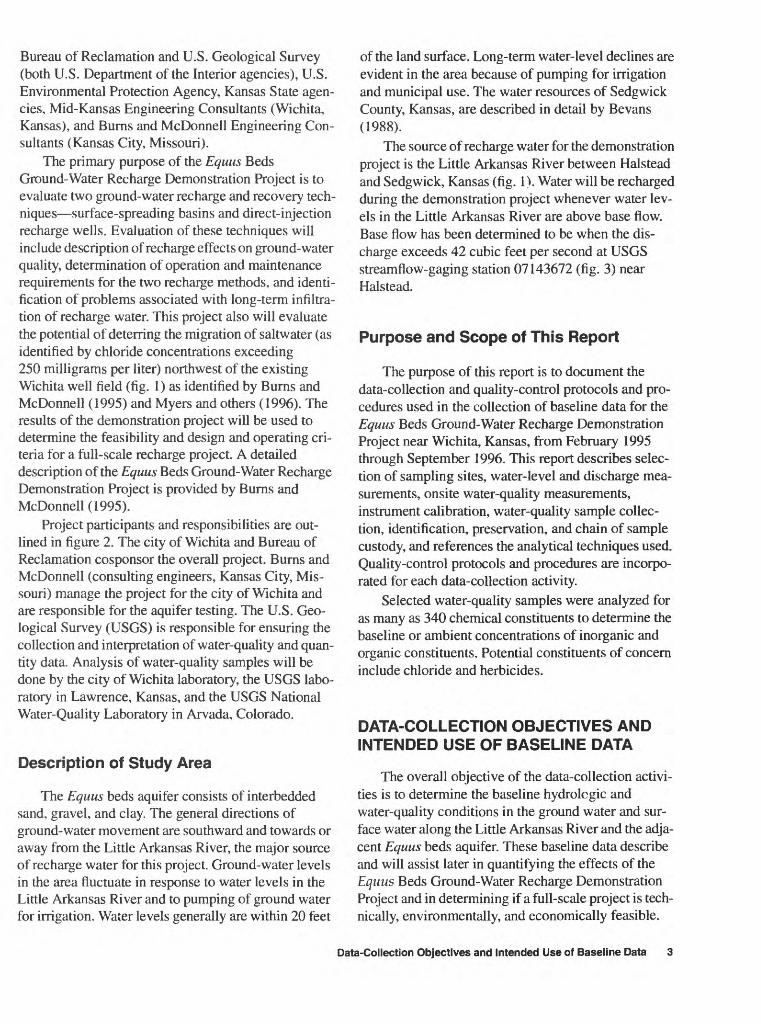
Bureau of Reclamation and U.S. Geological Survey (both U.S. Department of the Interior agencies), U.S. Environmental Protection Agency, Kansas State agen cies, Mid-Kansas Engineering Consultants (Wichita, Kansas), and Burns and McDonnell Engineering Con sultants (Kansas City, Missouri).
The primary purpose of the Equus Beds Ground-Water Recharge Demonstration Project is to evaluate two ground-water recharge and recovery tech niques surface-spreading basins and direct-injection recharge wells. Evaluation of these techniques will include description of recharge effects on ground-water quality, determination of operation and maintenance requirements for the two recharge methods, and identi fication of problems associated with long-term infiltra tion of recharge water. This project also will evaluate the potential of deterring the migration of saltwater (as identified by chloride concentrations exceeding 250 milligrams per liter) northwest of the existing Wichita well field (fig. 1) as identified by Burns and McDonnell (1995) and Myers and others (1996). The results of the demonstration project will be used to determine the feasibility and design and operating cri teria for a full-scale recharge project. A detailed description of the Equus Beds Ground-Water Recharge Demonstration Project is provided by Burns and McDonnell (1995).
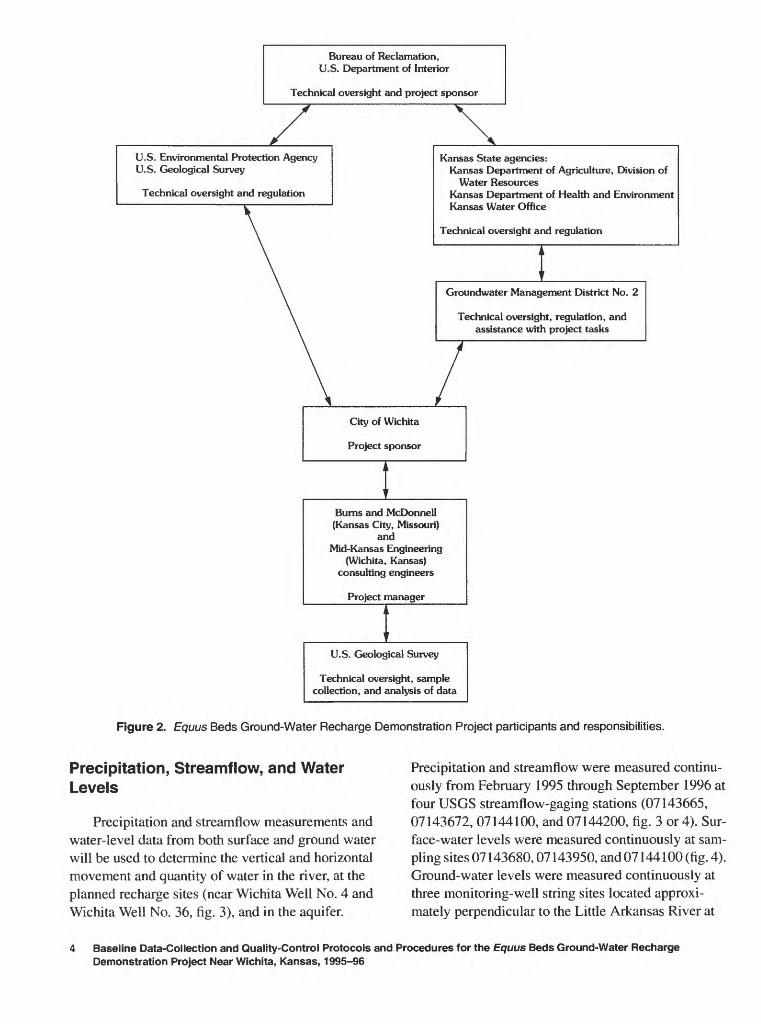
Project participants and responsibilities are out lined in figure 2. The city of Wichita and Bureau of Reclamation cosponsor the overall project. Burns and McDonnell (consulting engineers, Kansas City, Mis souri) manage the project for the city of Wichita and are responsible for the aquifer testing. The U.S. Geo logical Survey (USGS) is responsible for ensuring the collection and interpretation of water-quality and quan tity data. Analysis of water-quality samples will be done by the city of Wichita laboratory, the USGS labo ratory in Lawrence, Kansas, and the USGS National Water-Quality Laboratory in Arvada, Colorado.
Description of Study Area
The Equus beds aquifer consists of interbedded sand, gravel, and clay. The general directions of ground-water movement are southward and towards or away from the Little Arkansas River, the major source of recharge water for this project. Ground-water levels in the area fluctuate in response to water levels in the Little Arkansas River and to pumping of ground water for irrigation. Water levels generally are within 20 feet
of the land surface. Long-term water-level declines are evident in the area because of pumping for irrigation and municipal use. The water resources of Sedgwick County, Kansas, are described in detail by Be vans (1988).
The source of recharge water for the demonstration project is the Little Arkansas River between Halstead and Sedgwick, Kansas (fig. 1). Water will be recharged during the demonstration project whenever water lev els in the Little Arkansas River are above base flow. Base flow has been determined to be when the dis charge exceeds 42 cubic feet per second at USGS streamflow-gaging station 07143672 (fig. 3) near Halstead.
Purpose and Scope of This Report
The purpose of this report is to document the data-collection and quality-control protocols and pro cedures used in the collection of baseline data for the Equus Beds Ground-Water Recharge Demonstration Project near Wichita, Kansas, from February 1995 through September 1996. This report describes selec tion of sampling sites, water-level and discharge mea surements, onsite water-quality measurements, instrument calibration, water-quality sample collec tion, identification, preservation, and chain of sample custody, and references the analytical techniques used. Quality-control protocols and procedures are incorpo rated for each data-collection activity.
Selected water-quality samples were analyzed for as many as 340 chemical constituents to determine the baseline or ambient concentrations of inorganic and organic constituents. Potential constituents of concern include chloride and herbicides.
DATA-COLLECTION OBJECTIVES AND INTENDED USE OF BASELINE DATA
The overall objective of the data-collection activi ties is to determine the baseline hydrolcgic and water-quality conditions in the ground water and sur face water along the Little Arkansas River and the adja cent Equus beds aquifer. These baseline data describe and will assist later in quantifying the effects of the Equus Beds Ground-Water Recharge Demonstration Project and in determining if a full-scale project is tech nically, environmentally, and economically feasible.
Data-Collection Objectives and Intended Use of Baseline Data 3
Bureau of Reclamation, U.S. Department of Interior
Technical oversight and project sponsor
U.S. Environmental Protection Agency U.S. Geological Survey
Technical oversight and regulation
Kansas State agencies: Kansas Department of Agriculture, Division of
Water ResourcesKansas Department of Health and Environment Kansas Water Office
Technical oversight and regulation
Groundwater Management District No. 2
Technical oversight, regulation, and assistance with project tasks
City of Wichita
Project sponsor
Burns and McDonnell (Kansas City, Missouri)
and Mid-Kansas Engineering
(Wichita, Kansas) consulting engineers
Project manager
U.S. Geological Survey
Technical oversight, sample collection, and analysis of data
Figure 2. Equus Beds Ground-Water Recharge Demonstration Project participants and responsibilities.
Precipitation, Streamflow, and Water Levels
Precipitation and Streamflow measurements and water-level data from both surface and ground water will be used to determine the vertical and horizontal movement and quantity of water in the river, at the planned recharge sites (near Wichita Well No. 4 and Wichita Well No. 36, fig. 3), and in the aquifer.
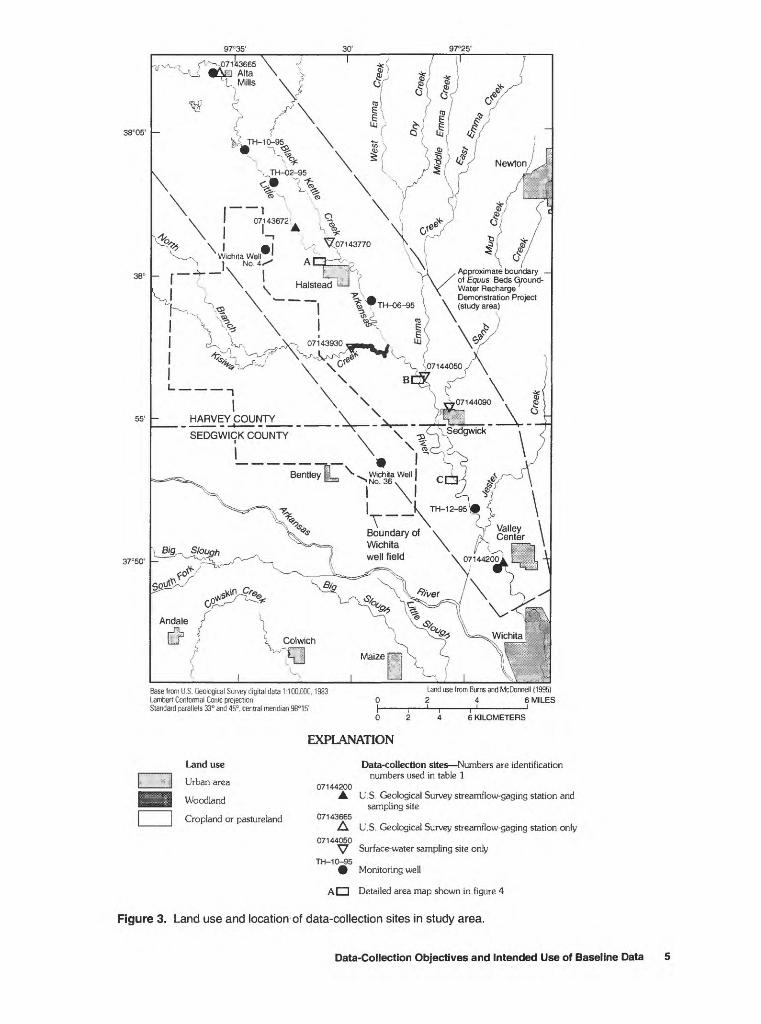
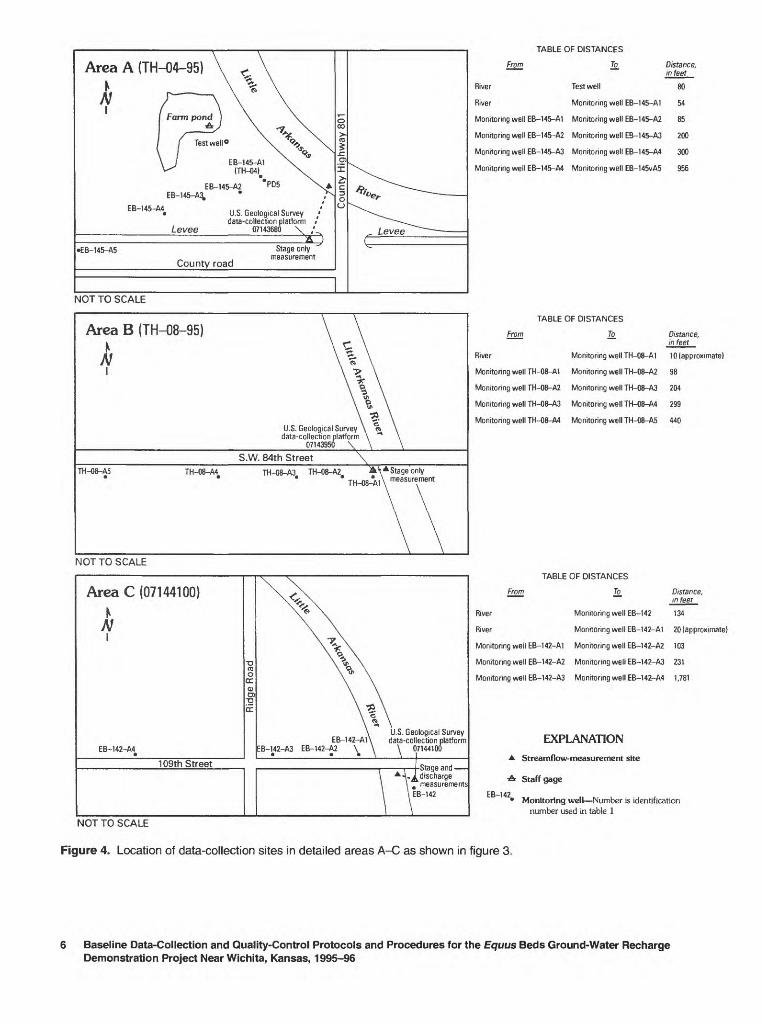
Precipitation and Streamflow were measured continu ously from February 1995 through September 1996 at fourUSGS streamflow-gaging stations (07143665, 07143672, 07144100, and 07144200, fig. 3 or 4). Sur face-water levels were measured continuously at sam pling sites 07143680,07143950, and 07144100 (fig. 4). Ground-water levels were measured continuously at three monitoring-well string sites located approxi mately perpendicular to the Little Arkansas River at
Baseline Data-Collection and Quality-Control Protocols and Procedures for the Equus Beds Ground-Water Recharge Demonstration Project Near Wichita, Kansas, 1995-96
97°35' 97°25'
38°05'
38°
55'
37°50'
'v.t£x"w.>~1 ^. x»I \^I x>, ! ^4^o
I "S^TH-06-951 ^>P| WA 1
07143930 « ** ^
^-W^^- "** v--u
v, IApproximate boundary of Equus Beds Ground- Water Recharge Demonstration Project
\ (study area)
v\\
IHARVEY COUNTY
SEDGWICK COUNTY
_ _ _ _ _ _Rontlov; !i > Bentley ,_ Wichita WellT"\i
l M II ____k TH-12-951
Boundary of v Wichita well field \
Base from U.S. Geological Survey digital data 1:100,000,1983Lambert Conformal Conic projectionStandard parallels 33° and 45°. central meridian 98°15'
Land use from Burns and McDonnell |1995) 246 MILES
6 KILOMETERS
EXPLANATION
Land use
Urban area
Woodland
Cropland or pastureland
Data-collection sites Numbers are identificationnumbers used in table 1
07144200A U.S. Geological Survey streamflow-gaging station and
sampling site 07143665
& U.S. Geological Survey streamflow-gaging station only07144050
^ Surface-water sampling site onlyTH-10-95
9 Monitoring well
Detailed area map shown in figure 4
Figure 3. Land use and location of data-collection sites in study area.
Data-Collection Objectives and Intended Use of Baseline Data 5
Area A (TH-04-95)
EB-145-A2 PD5EB-145-A3.
EB-145-A4
Levee
U.S. Geological Surveydata-collection platform
07143680 \
EB-145-A5
County road
Stage only measurement
Levee
NOT TO SCALE
Area B (TH-08-95)t
N
U.S. Geological Surveydata-collection platform
07143950 \
S.W. 84th StreetTH-08-A5 TH-08-A4 TH-08-A3_ TH-08-A2
" TH-08-A1\ measurement
NOT TO SCALE
Area C (07144100)
N
EB-142-A4
109th Street
EB-142-A1\EB-142-A3 EB-142-A2 \
k
U.S Geological Survey data-collection platform
\ 07144100
Stage and -l discharge
measurements EB-142
NOT TO SCALE
From
TABLE OF DISTANCES
To
River Test well
River Monitoring well EB-145-A1
Monitoring well EB-145-A1 Monitoring well EB-145-A2
Monitoring well EB-145-A2 Monitoring well EB-145-A3
Monitoring well EB-145-A3 Monitoring well EB-145-A4
Monitoring well EB-145-A4 Monitoring well EB-145vA5
Distance, in feet
80
54
85
200
300
956
TABLE OF DISTANCES
From To Distance, in feet
River Monitoring well TH-08-A1 10 (approximate)
Monitoring well TH-08-A1 Monitoring well TH-08-A2 98
Monitoring well TH-08-A2 Monitoring well TH-08-A3 204
Monitoring well TH-08-A3 Monitoring well TH-08-A4 299
Monitoring well TH-08-A4 Monitoring well TH-08-A5 440
From
TABLE OF DISTANCES
To Distance, in feet
River Monitoring well EB-142 134
River Monitoring well EB-142-A1 20 (approximate)
Monitoring well EB-142-A1 Monitoring well EB-142-A2 103
Monitoring well EB-142-A2 Monitoring well EB-142-A3 231
Monitoring well EB-142-A3 Monitoring well EB-142-A4 1,781
EXPLANATIONStreamflow-measurement site
Staff gage
EB-142,Monitoring well Number is identification
number used in table 1
Figure 4. Location of data-collection sites in detailed areas A-C as shown in figure 3.
Baseline Data-Collection and Quality-Control Protocols and Procedures for the Equus Beds Ground-Water Recharge Demonstration Project Near Wichita, Kansas, 1995-96
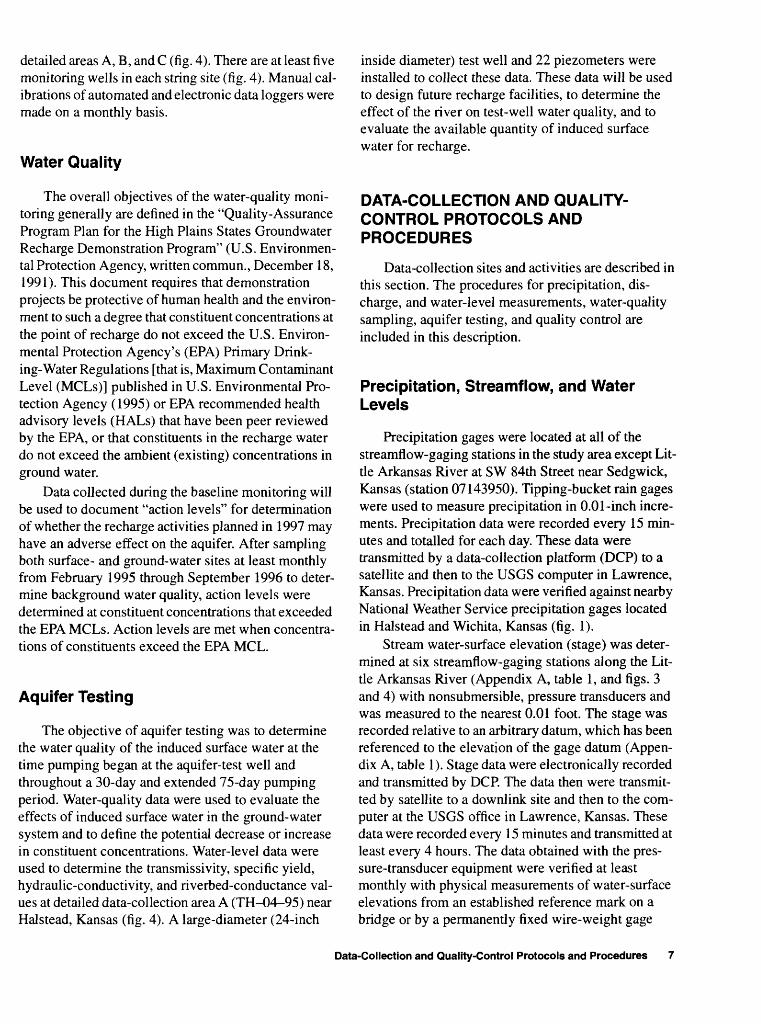
detailed areas A, B, and C (fig. 4). There are at least five monitoring wells in each string site (fig. 4). Manual cal ibrations of automated and electronic data loggers were made on a monthly basis.
Water Quality
The overall objectives of the water-quality moni toring generally are defined in the "Quality-Assurance Program Plan for the High Plains States Groundwater Recharge Demonstration Program" (U.S. Environmen tal Protection Agency, written commun., December 18, 1991). This document requires that demonstration projects be protective of human health and the environ ment to such a degree that constituent concentrations at the point of recharge do not exceed the U.S. Environ mental Protection Agency's (EPA) Primary Drink ing-Water Regulations [that is, Maximum Contaminant Level (MCLs)] published in U.S. Environmental Pro tection Agency (1995) or EPA recommended health advisory levels (HALs) that have been peer reviewed by the EPA, or that constituents in the recharge water do not exceed the ambient (existing) concentrations in ground water.
Data collected during the baseline monitoring will be used to document "action levels" for determination of whether the recharge activities planned in 1997 may have an adverse effect on the aquifer. After sampling both surface- and ground-water sites at least monthly from February 1995 through September 1996 to deter mine background water quality, action levels were determined at constituent concentrations that exceeded the EPA MCLs. Action levels are met when concentra tions of constituents exceed the EPA MCL.
Aquifer Testing
The objective of aquifer testing was to determine the water quality of the induced surface water at the time pumping began at the aquifer-test well and throughout a 30-day and extended 75-day pumping period. Water-quality data were used to evaluate the effects of induced surface water in the ground-water system and to define the potential decrease or increase in constituent concentrations. Water-level data were used to determine the transmissivity, specific yield, hydraulic-conductivity, and riverbed-conductance val ues at detailed data-collection area A (TH-04-95) near Halstead, Kansas (fig. 4). A large-diameter (24-inch
inside diameter) test well and 22 piezometers were installed to collect these data. These data will be used to design future recharge facilities, to determine the effect of the river on test-well water quality, and to evaluate the available quantity of induced surface water for recharge.
DATA-COLLECTION AND QUALITY- CONTROL PROTOCOLS AND PROCEDURES
Data-collection sites and activities are described in this section. The procedures for precipitation, dis charge, and water-level measurements, water-quality sampling, aquifer testing, and quality control are included in this description.
Precipitation, Streamflow, and Water Levels
Precipitation gages were located at all of the streamflow-gaging stations in the study area except Lit tle Arkansas River at SW 84th Street near Sedgwick, Kansas (station 07143950). Tipping-bucket rain gages were used to measure precipitation in 0.01-inch incre ments. Precipitation data were recorded every 15 min utes and totalled for each day. These data were transmitted by a data-collection platform (DCP) to a satellite and then to the USGS computer in Lawrence, Kansas. Precipitation data were verified against nearby National Weather Service precipitation gages located in Halstead and Wichita, Kansas (fig. 1).
Stream water-surface elevation (stage) was deter mined at six streamflow-gaging stations along the Lit tle Arkansas River (Appendix A, table 1, and figs. 3 and 4) with nonsubmersible, pressure transducers and was measured to the nearest 0.01 foot. The stage was recorded relative to an arbitrary datum, which has been referenced to the elevation of the gage datum (Appen dix A, table 1). Stage data were electronically recorded and transmitted by DCP. The data then were transmit ted by satellite to a downlink site and then to the com puter at the USGS office in Lawrence, Kansas. These data were recorded every 15 minutes and transmitted at least every 4 hours. The data obtained with the pres sure-transducer equipment were verified at least monthly with physical measurements of water-surface elevations from an established reference mark on a bridge or by a permanently fixed wire-weight gage
Data-Collection and Quality-Control Protocols and Procedures 7
(Buchanan and Somers, 1968). Elevations were sur veyed to the reference marks and gages and were veri fied annually. Methods used to determine streamflow are described in Carter and Davidian (1968) and Buchanan and Somers (1969).
Four of the six streamflow-gaging stations (07143665,07143672,07144100, and 07144200) were operated as continuous streamflow or discharge sta tions, and stage-discharge ratings were developed and maintained for these sites. The remaining two gaging stations (07143680 and 07143950) continuously recorded the water elevation or stage of the stream. Streamflow or discharge measurements were made at each station at least monthly by determining the cross-sectional area of the stream and measuring the flow velocity for at least 10 vertical transects in the cross section. Methods for discharge measurements are described by Buchanan and Somers (1969). A stage-discharge relation was developed on the basis of discharge measurements and the stage of the stream at the time of measurement. Methods used to develop the stage-discharge relations and to compute continuous discharge records for streamflow are described by Kennedy (1983, 1984).
Monitoring wells used in this study were con structed of poly vinyl chloride pipe. Well depth for most wells is shallow (about 50 feet below land surface), except for the aquifer-test well (depth 136.5 feet) and well TH-04-PD5 (depth 117 feet). The test well is screened from 71 to 132 feet below land surface; other monitoring wells typically are screened in the lower most 10 feet of the casing.
Water levels in the monitoring wells were recorded to the nearest 0.01 foot at 15-minute intervals and transmitted from the same DCP as the colocated streamflow-gaging stations at all of the sites listed in Appendix A, table 1, except sites TH-10-95, TH-02-95, TH-06-95, and TH-12-95, which were measured only at the time of sampling. Water-level sensing equipment consisted of submersible transduc ers that transmitted the water level to the DCP. Water levels were recorded and then transmitted every 4 hours to the USGS office in Lawrence, Kansas. The data from the transducers were verified at least monthly by manual measurements, and the computer data cor rected on the basis of the results of the manual mea surements. Water levels were measured manually at all sites by measurement to the water surface with either a steel or electric tape from a known reference-point ele vation on the top of the well casing. Methods used for
measurement of ground-water levels are described by Stallman(1971).
Water Quality
Water-quality data were collected during February 1995 through September 1996 to document a baseline for the quality of water in the Little Arkansas River and the quality of ground water in the adjacent Equm beds aquifer. Selected samples were analyzed for the con stituents listed in Appendix A, tables 2 through 13. The sampling frequency and constituents for analysis are presented in Appendix A, tables 14 and 15. At least one sample per month was collected from the two sur face-water sites (07143672 and 07144100), and quar terly samples were collected from six wells and analyzed for a subset of the EPA MCL list (Appendix A, tables 2 and 4) and other indicator constituents. Water-quality samples were collected once each quar ter during the first three quarters of the project and ana lyzed for all of the constituents listed in Appendix A, tables 2-13. Chloride and triazine herbicides were expected to be the primary constituents of concern.
Daily water samples from the Little Arkansas River and test well were collected and analyzed for tri azine herbicide concentrations during the aquifer test at site 07143672. On the basis of the quality-assur ance/quality-control (QA/QC) verified results from the aquifer test and from analytical results from the base line sampling, all inorganic and organic constituents with values greater than the MCL in these surface- water samples will be monitored for the remainder of the demonstration project. Subsequent data-collection activities will determine the possible effects of the withdrawal of test-well water and water from the river and of recharging the water 2 to 3 miles away in a dif ferent part of the aquifer.
Baseline data collected were of a definable and documented quality with respect to the precision and accuracy of the measurement (Appendix A, tables 1-12), representativeness of the sampled media, comparability between sites and sampling periods, and completeness of data (Appendix A, tables 2-13). Use of approved EPA or USGS onsite and laboratory meth ods helped ensure the precision and accuracy of the data. Representativeness of the samples was defined by the number of samples collected at the surface- and ground-water locations. The representativeness of each sample collected was described by the methods used for collection of samples. Detection limits, method
Baseline Data-Collection and Quality-Control Protocols and Procedures for the Equus Beds Ground-Water Recharge Demonstration Project Near Wichita, Kansas, 1995-96
detection limits, or reporting limits were used to quan tify concentrations in water samples at the levels of at least 20 percent of the currently published MCL for each constituent analyzed except for antimony, beryl lium, thallium, 1,2 dibromo-3-chloropropane, hep- tachlor, heptachlor epoxide, lindane, toxaphene, benzo(a-k)anthenes, bis(2-ethlyhexyl) phthalate, and chrysene (Appendix A, tables 2-13). Antimony and beryllium had reporting levels sufficient to quantify at the level of the MCL. The reporting limits for the organic constituents listed above were greater than the MCL; however, these constituents were not expected to be detected. Reporting limits for constituents without MCLs are listed in Appendix A, tables 2-13.
Onsite and laboratory quality-control samples included equipment and trip blanks, field spikes, refer ence water samples, replicate samples, and concurrent samples. Equipment blanks are collected by passing certified inorganic and organic blank water through the sample-collection and processing equipment. About 5 percent of samples collected were equipment blanks. Trip blanks are collected by filling the sample bottles with certified blank water and are analyzed at the end of the trip. About 1 percent of the samples collected were trip blanks. Field spikes were collected by adding a known quantity of analyte to the sample. Field spikes were about 1 percent of the sample total. Reference water samples are samples with known quantities of analytes in the sample. About 1 percent of the samples analyzed were reference water samples. Data from equipment and trip blanks, field spikes, and reference water samples were used to define the bias from the introduction of contamination at any stage in the sam ple-collection and analysis process.
Replicate samples are samples collected in an essentially identical manner as the environmental sam ples so that the replicate sample should have concentra tions equivalent to the environmental sample. Replicate split samples are samples collected from the same compositing container as the environmental sam ple. Concurrent samples are a type of replicate sample where samples are collected at the same time and placed in separate compositing containers. Replicate and concurrent samples were used to estimate the vari ability of the sample-collection and analysis process. Replicate and concurrent samples were about 2 percent of the sample total.
Each laboratory analyzing the samples had their own blanking and spiking protocols, usually 10 percent of the sample total. Consistent onsite and laboratory
methods ensured comparability for all samples unless the data were not within acceptability limits as defined in Appendix A, tables 2-13. The goal was to obtain at least 90-percent completeness of all data collected onsite and all data resulting from analysis of the samples.
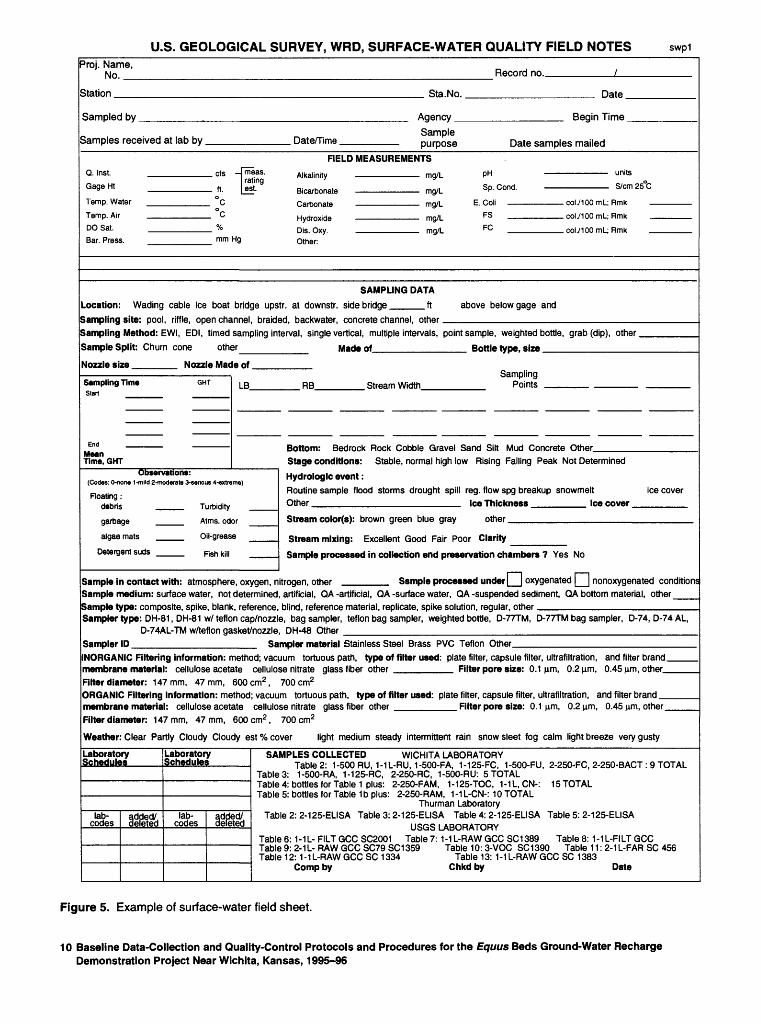
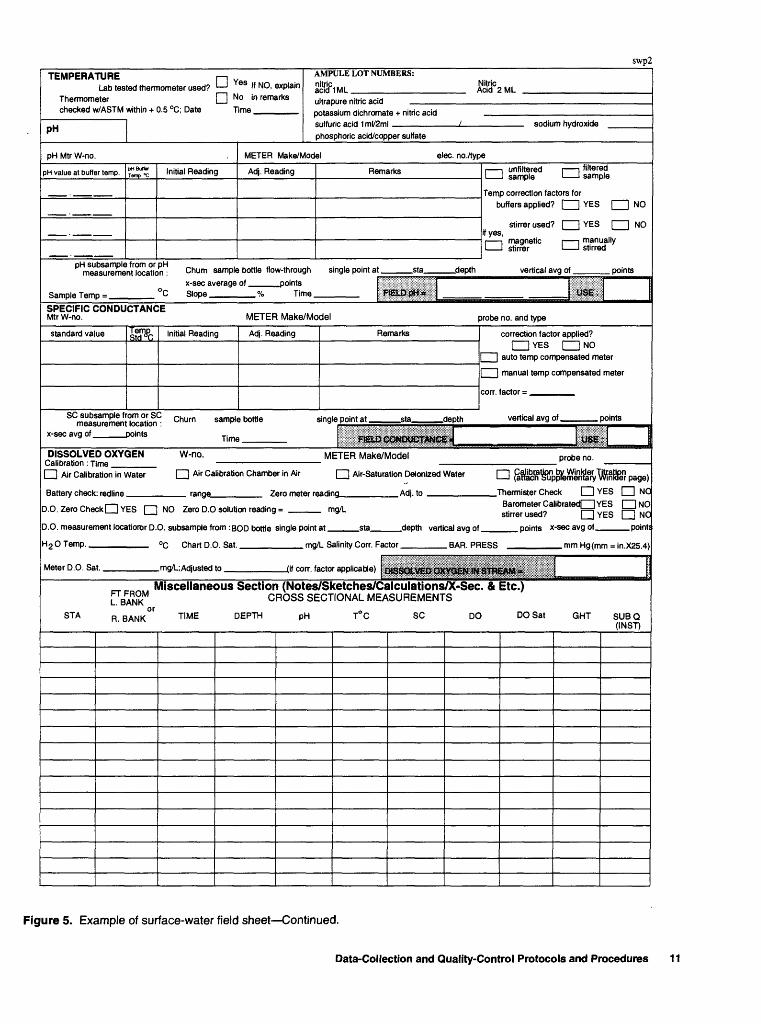
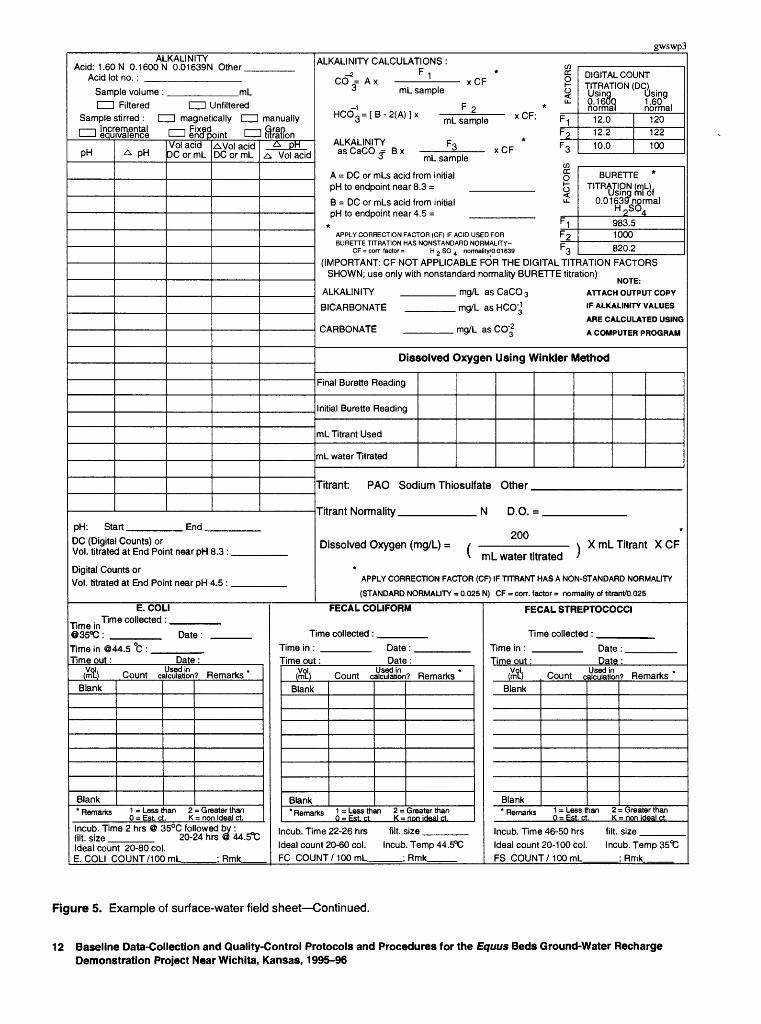
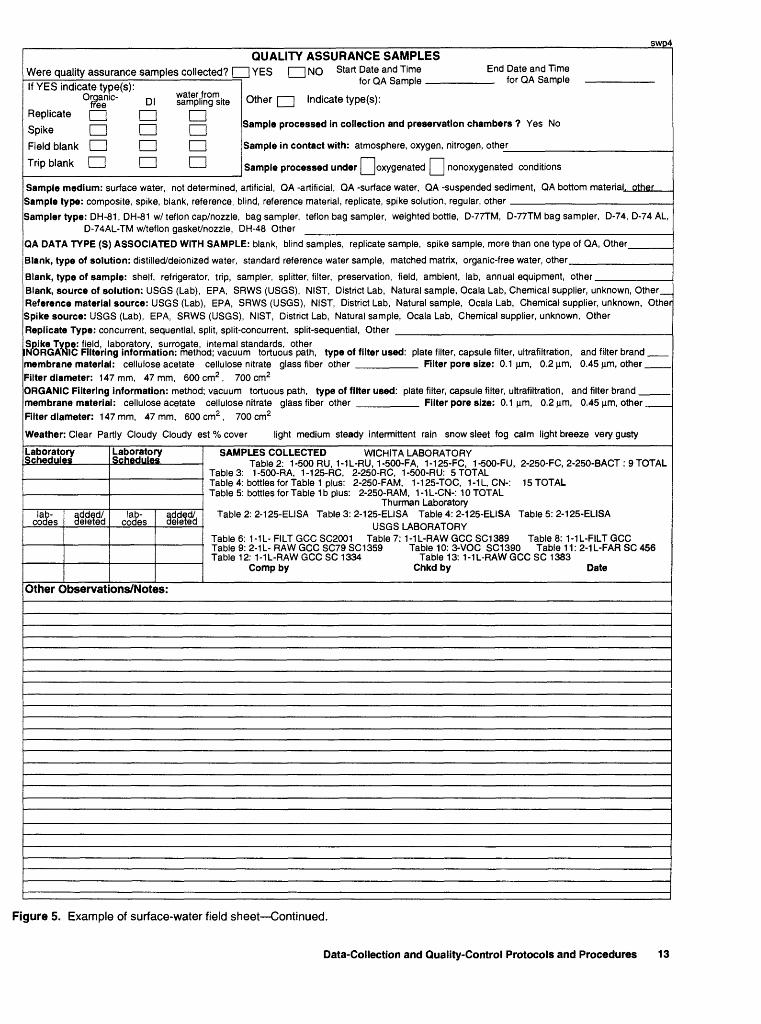
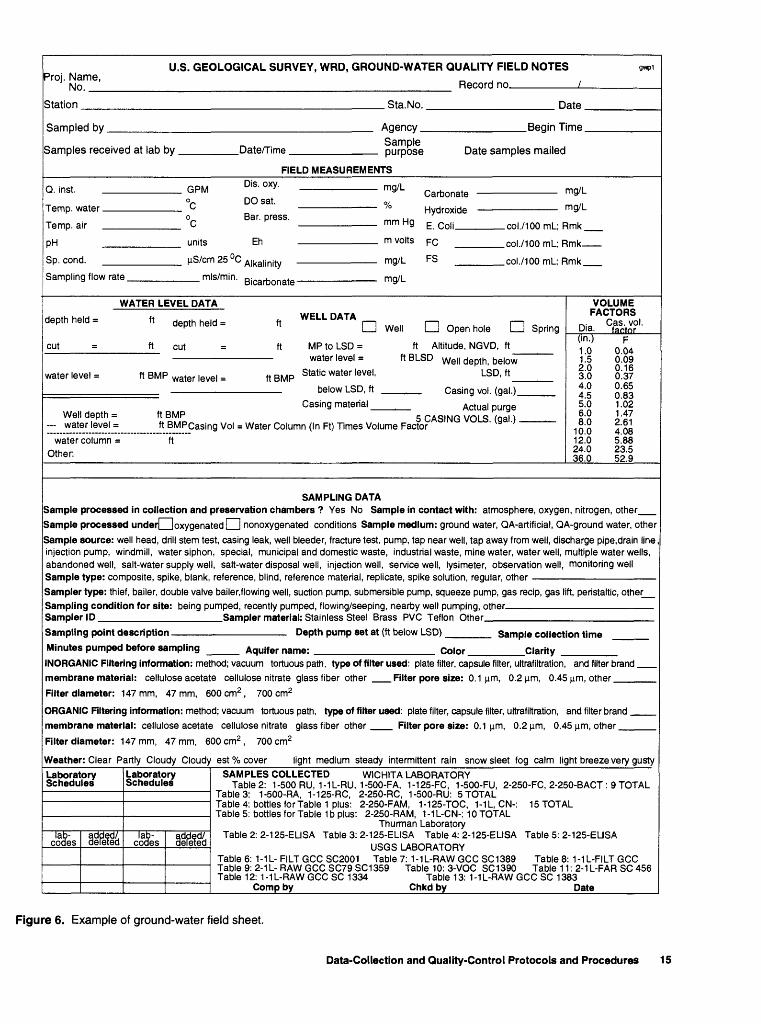
Before environmental sample collection, sampling equipment for both surface and ground water were cleaned with a nonphosphate-containing detergent, rinsed with deionized water, acid-rinsed with dilute hydrochloric acid (if equipment contained no metal parts), and rinsed again with deionized water. Equip ment blanks were collected before each environmental sampling to document the cleanliness of the equip ment. At the beginning of environmental sample col lection, instruments for the measurement of specific conductance, pH, water temperature, and dissolved oxygen were calibrated, and the calibration was checked after sampling at each site. A more detailed discussion of the specific procedures for equipment cleaning, collection of environmental samples, collec tion of blanks, and equipment calibration is provided by Guy and Norman (1970), Edwards and Glysson (1988), Ward and Harr (1990), Wells and others (1990), Horowitz and others (1994), Koterba and others (1995), and Puls and Barcelona (1996). Onsite notes were recorded on surface-water field sheets (fig. 5), during sample collection at each site and included the site location, date and time of collection, collectors' names, calibration information for the onsite instru mentation, methods and equipment used for collection, stream and weather conditions at the time of sampling, bottles collected, preservatives used, volumes purged from wells, and onsite measurements.
During the anticipated "spring flush" of herbicides from cropland in the study area, automated samplers collected two samples per day at surface-water sites (07143672 and 07144100) and were analyzed for triaz- ine herbicides by enzyme-linked immunosorbent assay (ELISA) (Thurman and others, 1990). Selected sam ples collected with autosamplers were verified by gas chromatography/mass spectrometry (GC/MS) analysis for triazine herbicide concentrations greater than 3.0 p,g/L (micrograms per liter). When the river stage became high enough to inundate the autosamplers, the samplers were removed, and daily grab samples were collected. Equipment blanks and trip blanks were 6 percent of the automated sample total. Replicate and concurrent samples were 2 percent of the automated sample total. About 2 percent of the automated sample
Data-Collection and Quality-Control Protocols and Procedures 9
U.S. GEOLOGICAL SURVEY, WRD, SURFACE-WATER QUALITY FIELD NOTES swpl
Station
Samples received at lab by.
'roj. Name, No. Record no..
Sta.No. Date
Sampled by.
. Date/Time.
Agency _Sample purpose
Begin Time.
Date samples mailedFIELD MEASUREMENTS
Q. Inst.
Gage Ht
Temp. Water
Temp. Air DO Sat. Bar. Press.
,cfs
ft. °c °c
I meas. rating
Lest.
mm Hg
Alkalinity
Bicarbonate
Carbonate
HydroxideDis. Oxy.Other:
mg/L
mg/L
mg/L
mg/L
mg/L
PH
Sp. Cond.
E. Coli
FS __
FC
units
S/cm 25°C
. coL/100 mL; Rmk
. coL/100 mL; Rmk
. col./100 mL; Rmk
Location:
SAMPLING DATA
Wading cable ice boat bridge upstr. at downstr. side bridge ____ ft above below gage andSampling site: pool, riffle, open channel, braided, backwater, concrete channel, other ________________________ Sampling Method: EWI, EDI, timed sampling interval, single vertical, multiple intervals, point sample, weighted bottle, grab (dip), other. Sample Split: Churn cone other________ Made of___________ Bottle type, size ____________
Nozzle size _____ Nozzle Made of _______Sampling
Sampling TimeStart
End Moan Time.GHT
LB RB_ Stream Width Points
Observations:(Codas: 0-none 1-mild 2-moderate 3-sertous 4-extrems)
Floating:dsbris __
garbage
algae mats
Detergent suds
Turbidity
Atms. odor
Oil-grease
Fish kill
Bottom: Bedrock Rock Cobble Gravel Sand Silt Mud Concrete Other_____Stage conditions: Stable, normal high low Rising Falling Peak Not Determined
Hydrologic event:Routine sample flood storms drought spill reg. flow spg breakup snowmeltOther __________________ Ice Thickness _______ Ice cover.
Stream color(s): brown green blue gray other _______________
Stream mixing: Excellent Good Fair Poor Clarity _______
Sample processed in collection end preservation chambers ? Yes No
Ssmple processed under LJ oxygenated | | nonoxygenated conditionsSample in contact with: atmosphere, oxygen, nitrogen, otherSample medium: surface water, not determined, artificial, QA-artificial, QA -surface water, QA-suspended sediment, QA bottom material, otherSample type: composite, spike, blank, reference, blind, reference material, replicate, spike solution, regular, other.Sampler type: DH-81, DH-81 w/teflon cap/nozzle, bag sampler, teflon bag sampler, weighted bottle, D-77TM, D-77TM bag sampler, D-74.D-74AL,
D-74AL-TM w/teflon gasket/nozzle, DH-48 Other ____________________________________________ Sampler ID _______________ Sampler material Stainless Steel Brass PVC Teflon Other______________________INORGANIC Filtering information: method; vacuum tortuous path, type of filter used: plate filter, capsule filter, ultrafiltration, and filter brand. membrane material: cellulose acetate cellulose nitrate glass fiber other _______ Filter pore size: 0.1 urn, 0.2 urn, 0.45 urn, other_ Filter diameter: 147mm, 47mm, 600cm2 , 700cm2ORGANIC Filtering information: method; vacuum tortuous path, type of filter used: plate filter, capsule filter, ultrafiltration, and filter brand _ membrane material: cellulose acetate cellulose nitrate glass fiber other _______ Filter pore size: 0.1 )im, 0.2 urn, 0.45 urn, other _ Filter diameter: 147mm, 47mm, 600cm2 , 700cm2
Weather: Clear Partly Cloudy Cloudy est % cover light medium steady intermittent rain snow sleet fog calm light breeze very gusty
Laboratory Schedules
Laboratory Schedules
lab- codes
added/3GIGT6O
lab- codes deleted
SAMPLES COLLECTED WICHITA LABORATORYTable 2: 1-500 RU, 1-1L-RU, 1-500-FA, 1-125-FC, 1-500-FU, 2-250-FC, 2-250-BACT : 9 TOTAL
TableS: 1-500-RA, 1-125-RC, 2-250-RC, 1-500-RU: 5 TOTAL Table 4: bottles for Table 1 plus: 2-250-FAM, 1-125-TOC, 1-1L.CN-: 15TOTAL Table 5: bottles for Table 1 b plus: 2-250-RAM, 1 -1L-CN-: 10 TOTAL
Thurman Laboratory Table2:2-125-ELISA Table3:2-125-ELISA Table 4: 2-125-ELISA Table 5: 2-125-ELISA
USGS LABORATORYTable6:1-1L-FILTGCC SC2001 Table7: 1-1L-RAW GCC SC1389 TableS: 1-1L-FILTGCC Table9:2-1L-RAWGCCSC79SC1359 Table 10: 3-VOC SC1390 Table 11: 2-1L-FAR SC 456 Table 12:1 -1L-RAW GCC SC 1334 Table 13: 1 -1L-RAW GCC SC 1383
Comp by Chkd by Date
Figure 5. Example of surface-water field sheet.
10 Baseline Data-Collection and Quality-Control Protocols and Procedures for the Equus Beds Ground-Water Recharge Demonstration Project Near Wichita, Kansas, 1995-96
swp2
TEMPERATURELab tested thermometer used?
Thermometer checked w/ASTM within + 0.5 °C; Date
PH
AMPLJ Yes if NO, explain nitjipD No in remarks ultra
Time 00,35
pH Mtr W-no.
pH value at buffer temp. *£*; Initial Reading
METER
sulfu phos
ULE LOT NUMBERS:
1ML
jure nitric acid .slum dichroma ric acid 1 ml/2m phoric acid/cop
te + nitric acid1>per sulfate
Nitric Acid 2 ML
m hydroxide
Make/Model elec. no./type
Adj. Reading Remarks
P m^asu^ementToca^on Chum sample bottle flow-through single point at sta dx-sec average of ____ points
Sample Temp = °C Slope % Time
SPECIFIC CONDUCTANCEMtr W-no.
standard value Terry Initial Reading
1
a unfiltered
Temp correction fa
a filtered sample
:tors forbuffers applied? | | YES | | NO
stirrer used' if yes,
stirrer
I | YES | | NO
a manually stirred
epth vertical avg of points
i!METER Make/Model
Adj. Reading Remarks
SC subsample from or SC Ch samnle bottle measurement location : uiurn sample Dome
x-sec avg of ____ points _.
DISSOLVECalibration : T
1 1 Air Calibr
Battery check
D.O. Zero Che
D.O. measurer
Meter D.O. Sa
STA
D OXYGEN
ation in )
: redline ckl~~lY
nentloc.
t.
Water
ES Q
itiortr D.
W-no.
sing
probe no. and type
111 1
correction factor applied?1 __ 1 YES 1 __ | NO
[__ | auto temp compensated meter
I | manual temp compensated meter
con- factor =
a point at sta ,. .depth vertical avq of
METER Make/Model
| | Air Calibration Chambe
rang^ 7
NO ZeroD.C
O. subsample fr
°C Chart D.C
mg/L; Adjusted
soluti
om:B
). Sat.
to
on readinc
OD bottle
r in Air
ero meter readir
single point at
mg/LS
_ points
probe no.
C] Air-Saturation Deionized Water HH (af^^Jp^
ig Adi. to Thermistor Check
ig/L
sta
alinity Corr. Fat
r applicable) 1
__depth vertical i
:tor BA
Barometer Ca stirrer used?
wg of points >
R PRESS
Jibrat
-sec
mr
entary Winkfer page]
n YES n NO3d! IYES 1 iNOn YES n NOavg of points
nHg(m;
Miscellaneous Section (Notes/Sketches/Calculations/X-Sec. & Etc.)FBANKM CROSS SECTIONAL MEASUREMENTSR. BANK°f TIME DEPTH pH T°C SC DO DO Sat GHT SUB Q
(INST)
Figure 5. Example of surface-water field sheet Continued.
Data-Collection and Quality-Control Protocols and Procedures 11
gwswp3ALKALINITY
Acid: 1.60 N 0.1600 N 0.01639N Other _______ Acid lot no. : _____________
Sample volume : _________mL CZH Filtered I I Unfiltered
Sample stirred: I I magnetically I I manuallyIncremental equivalence
PH
I I eria point I I mratic
A pHVol acid DC or mL
A Vol acid DC or mL Vol acid
ALKALINITY CALCULATIONS : F,
CO^AxmL sample
HCO~3 =[B-2(A)]x
xCF
mL sample xCF;
ALKALINITY as CaCO - B x
mL sample
A = DC or mLs acid from initial pH to endpoint near 8.3 =
B = DC or mLs acid from initial pH to endpoint near 4.5 =
xCF
FACTORS
F-,
F 2F 3
DIGITAL COUNT TITRATION (DC) Using Using 0.1600 1.60 , normal normal
12.012.2
10.0
120122
100
APPLY CORRECTION FACTOR (CF) IF ACID USED FOR BURETTE TITRATION HAS NONSTANDARD NORMALITY-
CF = corr factor = H 2 SO 4 normality/0.01639
cc P3U-
F 1F 2F3
BURETTE *TITRATION (mL),
Using ml of 0.01639normal
H oSO.£ 4
983.51000820.2
(IMPORTANT: CF NOT APPLICABLE FOR THE DIGITAL TITRATION FACTORS SHOWN; use only with nonstandard normality BURETTE titration)
ALKALINITY
BICARBONATE
CARBONATE
mg/L asCaCO 3
mg/L
. mg/L as CO;2
NOTE: ATTACH OUTPUT COPY
IF ALKALINITY VALUES
ARE CALCULATED USING
A COMPUTER PROGRAM
Dissolved Oxygen Using Winkler Method
Final Burette Reading
Initial Burette Reading
mL Titrant Used
mL water Titrated
Titrant: PAO Sodium Thiosulfate Other
Titrant Normality.pH: Start. EndDC (Digital Counts) orVol. titrated at End Point near pH 8.3 :
Digital Counts orVol. titrated at End Point near pH 4.5 :
Dissolved Oxygen (mg/L) =
.N D.O. = ^_
200
mL water titratedXmL Titrant X CF
APPLY CORRECTION FACTOR (CF) IF TTTRANT HAS A NON-STANDARD NORMALITY
(STANDARD NORMALITY = 0.025 N) CF = corr. factor = normality of titrant/0.025
Time in
E. COLI Time collected:
Date:Time in @44.5 °C : Time out : _____ Date:
Count calculation?Blank
Blank
Remarks
* Remarks 1 = Less than 0 = Est. ct.
2 = Greater than K = non ideal ct.
Incub. Time 2 hrs @ 35°C followed by:fill, size ______ 20-24 hrs @ 44.&CIdeal count 20-80 col.E. COLI COUNT/100 mL____: Rmk
FECAL COLIFORM
Time collected: ____ Time in : ______ Date:Time out: Date:
Vol. Used in . « (ml) Count calculation? Remarks
Blank
Blank* Remarks 1 = Less than 2 = Greater than
0 = Est ct K = non ideal ct
Incub. Time 22-26 hrs
Ideal count 20-60 col. FC COUNT/100 mL_
fill, size _____
Incub. Temp 44.5^ : Rmk____
FECAL STREPTOCOCCI
Time collected: _____Time in: Time out:
Date:. Date:
(mlBlank
Blank
_ . Used in _ . Count calculation? Remarks
* Remarks 1 = Less than 0 = Est. ct.
2 = Greater than K = non ideal ct.
Incub. Time 46-50 hrs Ideal count 20-100 col. FS COUNT/100 mL
fill, size _____
Incub. Temp 35*0 __; Rmk ___
Figure 5. Example of surface-water field sheet Continued.
12 Baseline Data-Collection and Quality-Control Protocols and Procedures for the Equus Beds Ground-Water Recharge Demonstration Project Near Wichita, Kansas, 1995-96
swp4
Sample medium: surface water, not determined, artificial, QA -artificial, QA -surface water, QA -suspended sediment, QA bottom material_Qlhfir_ Sample type: composite, spike, blank, reference, blind, reference material, replicate, spike solution, regular, other __________________
Sampler type: DH-81, DH-81 w/teflon cap/nozzle, bag sampler, teflon bag sampler, weighted bottle, D-77TM, D-77TM bag sampler, D-74, D-74AL, D-74AL-TM w/teflon gasket/nozzle, DH-48 Other ______________________________________________
QA DATA TYPE (S) ASSOCIATED WITH SAMPLE: blank, blind samples, replicate sample, spike sample, more than one type of QA, Other___
Blank, type of solution: distilled/deionized water, standard reference water sample, matched matrix, organic-free water, other___________
Blank, type of sample: shelf, refrigerator, trip, sampler, splitter, filter, preservation, field, ambient, lab, annual equipment, other _______ Blank, source of solution: USGS (Lab), EPA, SRWS (USGS), NIST, District Lab, Natural sample, Ocala Lab, Chemical supplier, unknown, Other_ Reference material source: USGS (Lab), EPA, SRWS (USGS), NIST, District Lab, Natural sample, Ocala Lab, Chemical supplier, unknown, Other Spike source: USGS (Lab), EPA, SRWS (USGS), NIST, District Lab, Natural sample, Ocala Lab, Chemical supplier, unknown, Other Replicate Type: concurrent, sequential, split, split-concurrent, split-sequential, Other _________________________________Spike Type: field, laboratory, surrogate, internal standards, otherINORGANIC Filtering information: method; vacuum tortuous path, type of filter used: plate filter, capsule filter, ultrafiltration, and filter brand.membrane material: cellulose acetate cellulose nitrate glass fiber other _______ Filter pore size: 0.1 pm, 0.2 urn, 0.45 urn, other _ Filter diameter: 147mm, 47mm, 600cm2 , 700cm2ORGANIC Filtering information: method; vacuum tortuous path, type of filter used: plate filter, capsule filter, ultrafiltration, and filter brand _ membrane material: cellulose acetate cellulose nitrate glass fiber other _______ Filter pore size: 0.1 jim, 0.2 jim, 0.45 jim, other _ Filter diameter: 147mm, 47mm, 600cm2 , 700cm2
Weather: Clear Partly Cloudy Cloudy est % cover light medium steady intermittent rain snow sleet fog calm light breeze very gusty
QUALITY ASSURANCE SAMPLESWere quality assurance samples collected? I I YES I I NO Start Date and Time
for QA Sample
Indicate type(s):If YES indicate type(s):
Organic- free
Replicate I ISpike Field blank
Trip blank
a a a
Dla a a a
water from sampling site
a a a a
End Date and Time _ for QA Sample
Other | |
Sample processed in collection and preservation chambers ? Yes No
Sample in contact with: atmosphere, oxygen, nitrogen, other______
Sample processed under |_[oxygenated nonoxygenated conditions
Laboratory Schedules
lab- codes
added/ deleted
Laboratory Schedules
lab- §dded/ codes deleted
SAMPLES COLLECTED WICHITA LABORATORYTable 2: 1-500 RU, 1-1L-RU, 1-500-FA, 1-125-FC, 1-500-FU, 2-250-FC, 2-250-BACT : 9 TOTAL
TableS: 1-500-RA, 1-125-RC, 2-250-RC, 1-500-RU: 5 TOTAL Table 4: bottles for Table 1 plus: 2-250-FAM, 1 -125-TOC, 1 -1L, CN-: 15 TOTAL Table 5: bottles for Table 1 b plus: 2-250-RAM, 1 -1L-CN-: 10 TOTAL
Thurman Laboratory Table 2: 2-125-ELISA Table 3:2-125-ELISA Table 4: 2-125-ELISA Table 5: 2-125-ELISA
USGS LABORATORYTable 6: 1-1 L- FILT GCC SC2001 Table 7: 1-1L-RAWGCC SC1389 Table 8: 1-1L-FILTGCC Table 9: 2-1L- RAW GCC SC79 SC1359 Table 10: 3-VOC SC1390 Table 11: 2-1L-FAR SC 456 Table 12: 1 -1L-RAW GCC SC 1334 Table 13: 1 -1L-RAW GCC SC 1383
Comp by Chkd by Date
Other Observations/Notes:
Figure 5. Example of surface-water field sheet Continued.
Data-Collection and Quality-Control Protocols and Procedures 13
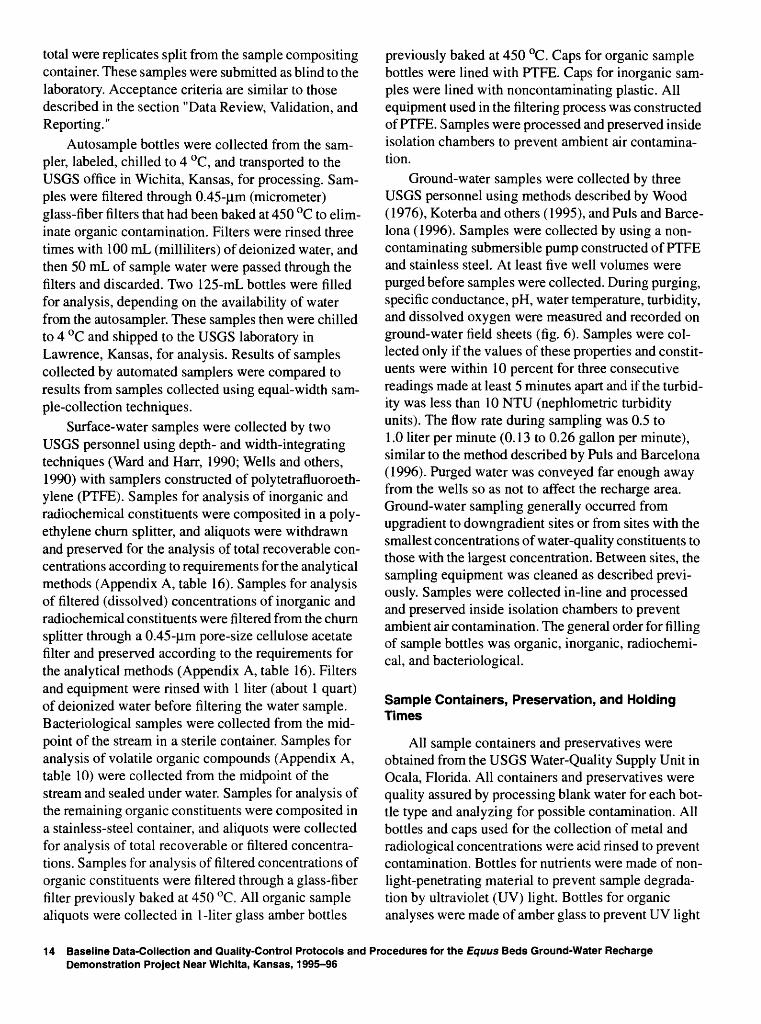
total were replicates split from the sample compositing container. These samples were submitted as blind to the laboratory. Acceptance criteria are similar to those described in the section "Data Review, Validation, and Reporting."
Autosample bottles were collected from the sam pler, labeled, chilled to 4 °C, and transported to the USGS office in Wichita, Kansas, for processing. Sam ples were filtered through 0.45-jim (micrometer) glass-fiber filters that had been baked at 450 °C to elim inate organic contamination. Filters were rinsed three times with 100 mL (milliliters) of deionized water, and then 50 mL of sample water were passed through the filters and discarded. Two 125-mL bottles were filled for analysis, depending on the availability of water from the autosampler. These samples then were chilled to 4 °C and shipped to the USGS laboratory in Lawrence, Kansas, for analysis. Results of samples collected by automated samplers were compared to results from samples collected using equal-width sam ple-collection techniques.
Surface-water samples were collected by two USGS personnel using depth- and width-integrating techniques (Ward and Harr, 1990; Wells and others, 1990) with samplers constructed of polytetrafluoroeth- ylene (PTFE). Samples for analysis of inorganic and radiochemical constituents were composited in a poly ethylene churn splitter, and aliquots were withdrawn and preserved for the analysis of total recoverable con centrations according to requirements for the analytical methods (Appendix A, table 16). Samples for analysis of filtered (dissolved) concentrations of inorganic and radiochemical constituents were filtered from the churn splitter through a 0.45-Jim pore-size cellulose acetate filter and preserved according to the requirements for the analytical methods (Appendix A, table 16). Filters and equipment were rinsed with 1 liter (about 1 quart) of deionized water before filtering the water sample. Bacteriological samples were collected from the mid point of the stream in a sterile container. Samples for analysis of volatile organic compounds (Appendix A, table 10) were collected from the midpoint of the stream and sealed under water. Samples for analysis of the remaining organic constituents were composited in a stainless-steel container, and aliquots were collected for analysis of total recoverable or filtered concentra tions. Samples for analysis of filtered concentrations of organic constituents were filtered through a glass-fiber filter previously baked at 450 °C. All organic sample aliquots were collected in 1-liter glass amber bottles
previously baked at 450 °C. Caps for organic sample bottles were lined with PTFE. Caps for inorganic sam ples were lined with noncontaminating plastic. All equipment used in the filtering process was constructed of PTFE. Samples were processed and preserved inside isolation chambers to prevent ambient air contamina tion.
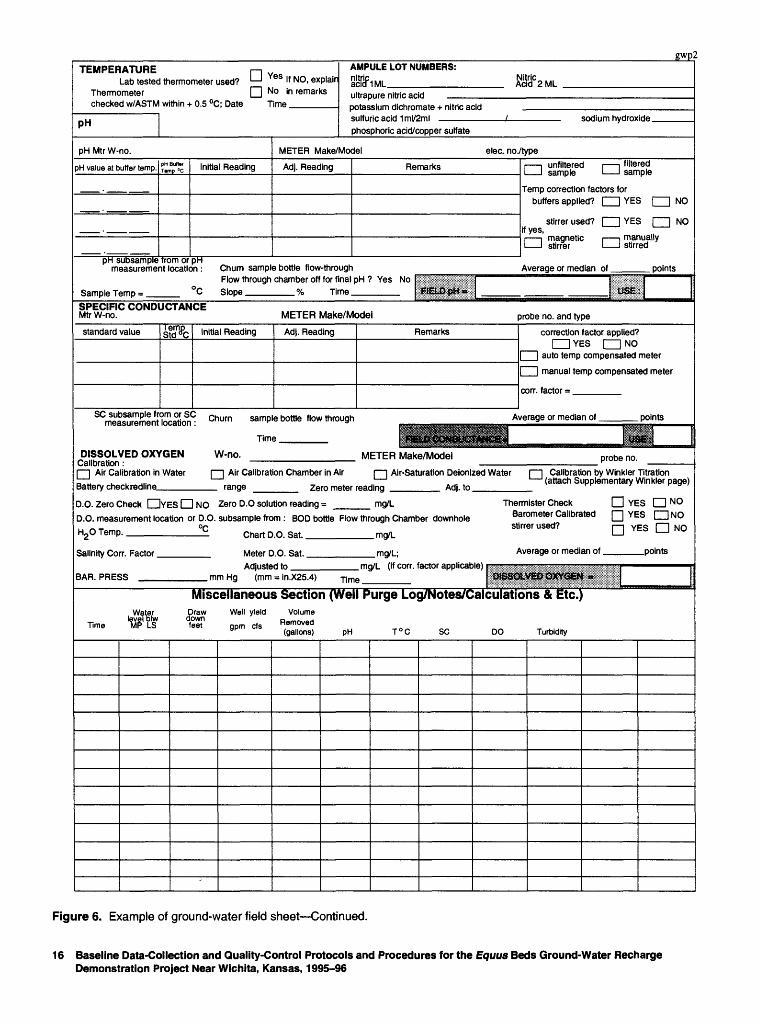
Ground-water samples were collected by three USGS personnel using methods described by Wood (1976), Koterba and others (1995), and Puls and Barce lona (1996). Samples were collected by using a non- contaminating submersible pump constructed of PTFE and stainless steel. At least five well volumes were purged before samples were collected. During purging, specific conductance, pH, water temperature, turbidity, and dissolved oxygen were measured and recorded on ground-water field sheets (fig. 6). Samples were col lected only if the values of these properties and constit uents were within 10 percent for three consecutive readings made at least 5 minutes apart and if the turbid ity was less than 10 NTU (nephlometric turbidity units). The flow rate during sampling was 0.5 to 1.0 liter per minute (0.13 to 0.26 gallon per minute), similar to the method described by Puls and Barcelona (1996). Purged water was conveyed far enough away from the wells so as not to affect the recharge area. Ground-water sampling generally occurred from upgradient to downgradient sites or from sites with the smallest concentrations of water-quality constituents to those with the largest concentration. Between sites, the sampling equipment was cleaned as described previ ously. Samples were collected in-line and processed and preserved inside isolation chambers to prevent ambient air contamination. The general order for filling of sample bottles was organic, inorganic, radiochemi cal, and bacteriological.
Sample Containers, Preservation, and Holding Times
All sample containers and preservatives were obtained from the USGS Water-Quality Supply Unit in Ocala, Florida. All containers and preservatives were quality assured by processing blank water for each bot tle type and analyzing for possible contamination. All bottles and caps used for the collection of metal and radiological concentrations were acid rinsed to prevent contamination. Bottles for nutrients were made of non- light-penetrating material to prevent sample degrada tion by ultraviolet (UV) light. Bottles for organic analyses were made of amber glass to prevent UV light
14 Baseline Data-Collection and Quality-Control Protocols and Procedures for the Equus Beds Ground-Water Recharge Demonstration Project Near Wichita, Kansas, 1995-96
Proi. Name, No.
Station
U.S. GEOLOGICAL SURVEY, WRD, GROUND-WATER QUALITY FIELD NOTES
Record no_______L
Sta.No. Date
Sampled by.
Samples received at lab by Date/Time
FIELD MEASUREMENTS
Agency _Sample purpose
.Begin Time.
Date samples mailed
Q. inst. ___
Temp, water
Temp, air ___
pH ___
Sp. cond. ___
Sampling flow rate.
GPM Dis. oxy.
DO sat.
Bar. press.C
units Eh
^s/cm25 °c Alkalinity
mg/L _ .Carbonate
% Hydroxide mm Hg E Co||__
m volts rr
mg/L
mg/L
mls/min. Bicarbonate -
mg/L
mg/L
FS
-col./100 mL; Rmk.
.col./100 mL; Rmk-
.col./100 mL; Rmk.
WATER LEVEL DATA
depth held = ft depth he)d _
cut = ft cut =
water level = ft BMP water | eve| = ft BMP
Well depth = --- water level =
water column = Other:
ft BMPft BMPCasing Vol = Water Column (In Ft) Times Volume Factor ............
WELL DATAEH Well EH Open hole EH Spring
MPtoLSD= ft Altitude, NGVD, ft _____ water level = ftBLSD WeN depth , below
Static water level, LSD, ft ___
below LSD, ft ____Casing material ____
Casing vol. (gal.).
Actual purge5 CASING VOLS. (gal.)
Dia.
VOLUME FACTORS
Cas. vol. factor
1.01.52.03.04.04.55.06.08.0
10.012.024.036.0
F0.04 0.09 0.16 0.37 0.65 0.83 1.02 1.47 2.61 4.08 5.88 23.5 52.9
SAMPLING DATASample processed in collection and preservation chambers ? Yes No Sample in contact with: atmosphere, oxygen, nitrogen, other__ Sample processed underEHoxygenated EH nonoxygenated conditions Sample medium: ground water, QA-artificial, QA-ground water, other Sample source: well head, drill stem test, casing leak, well bleeder, fracture test, pump, tap near well, tap away from well, discharge pipe.drain line injection pump, windmill, water siphon, special, municipal and domestic waste, industrial waste, mine water, water well, multiple water wells, abandoned well, salt-water supply well, salt-water disposal well, injection well, service well, lysimeter, observation well, monitoring well Sample type: composite, spike, blank, reference, blind, reference material, replicate, spike solution, regular, other Sampler type: thief, bailer, double valve bailer.flowing well, suction pump, submersible pump, squeeze pump, gas recip, gas lift, peristaltic, other_ Sampling condition for site: being pumped, recently pumped, flowing/seeping, nearby well pumping, other Sampler ID _______________Sampler material: Stainless Steel Brass PVC Teflon Other____________________Sampling point description Depth pump set at (ft below LSD) _____ Sample collection time ____Minutes pumped before sampling Aquifer name: Color .ClarityINORGANIC Filtering information: method; vacuum tortuous path, type of filter used: plate filter, capsule filter, ultrafiltration, and filter brand membrane material: cellulose acetate cellulose nitrate glass fiber other __ Filter pore size: 0.1 urn, 0.2 pm, 0.45pm, other _____
Filter diameter: 147mm, 47mm, 600cm2 , 700cm2
ORGANIC Filtering information: method; vacuum tortuous path, type of filter used: plate filter, capsule filter, ultrafiltration, and filter brand membrane material: cellulose acetate cellulose nitrate glass fiber other __ Filter pore size: 0.1 pm, 0.2pm, 0.45pm, other ____
Filter diameter: 147mm, 47mm, 600cm2 , 700cm2
Weather: Clear Partly Cloudy Cloudy est% cover light medium steady intermittent rain snow sleet fog calm light breeze very gustyLaboratory Schedules
lab- codes
Laboratory Schedules
lab- added/, codes deleted
SAMPLES COLLECTED WICHITA LABORATORYTable 2: 1-500 RU, 1-1L-RU, 1-500-FA, 1-125-FC, 1-500-FU, 2-250-FC, 2-250-BACT : 9 TOTAL
TableS: 1-500-RA, 1-125-RC, 2-250-RC, 1-500-RU: 5 TOTAL Table 4: bottles for Table 1 plus: 2-250-FAM, 1-125-TOC, ML, CN-: Table 5: bottles for Table 1 b plus: 2-250-RAM, 1 -1L-CN-: 10 TOTAL
Thurman Laboratory Table 2: 2-125-ELISA Table 3: 2-125-ELISA Table 4: 2-125-ELISA Table 5: 2-125-ELISA
USGS LABORATORYTable 6: ML- FILT GCC SC2001 Table 7: 1-1L-RAW GCC SC1389 Table 9: 2-1L- RAW GCC SC79 SC1359 Table 10: 3-VOC SC1390 Table 12: 1 -1L-RAW GCC SC 1334 Table 13: 1-1L-RAW GCC SC 1383 ____Comp by______________Chkd by_______________Date
15 TOTAL
Table8:1-1L-FILTGCC Table 11: 2-1L-FAR SC 456
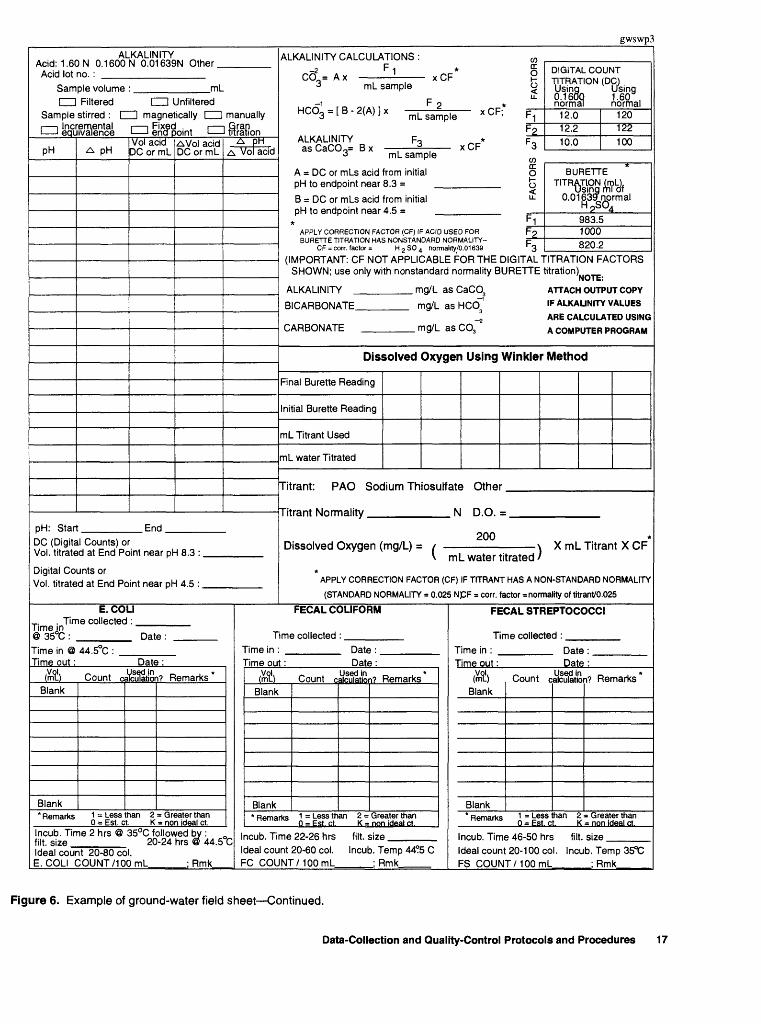
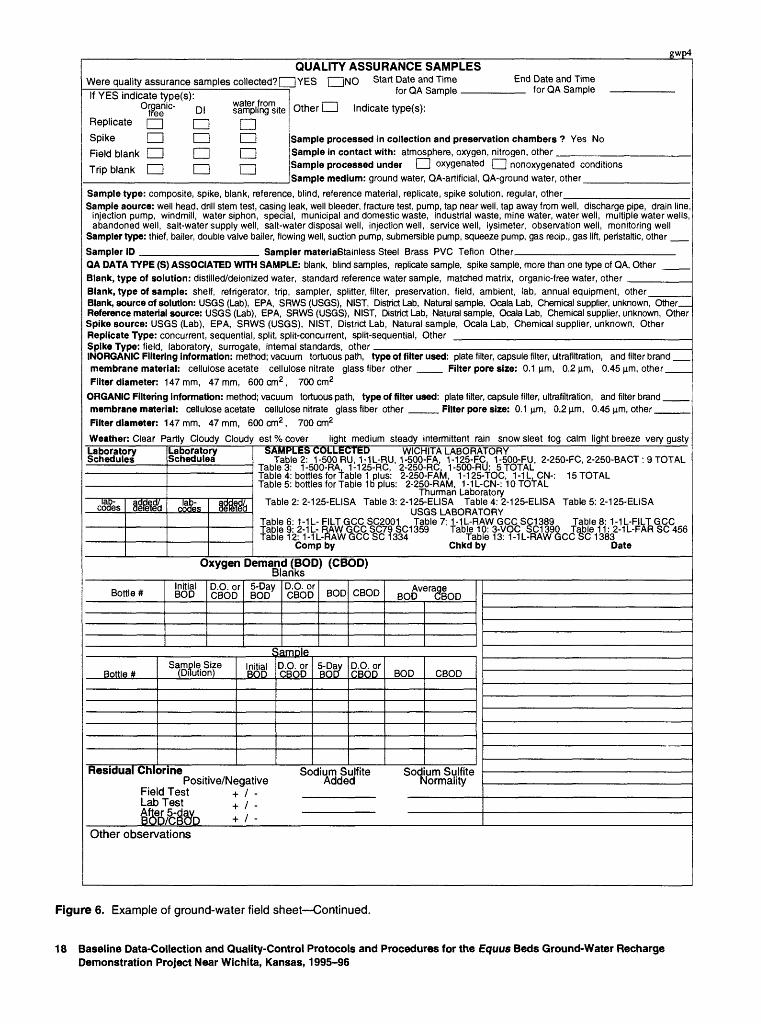
Figure 6. Example of ground-water field sheet.
Data-Collection and Quality-Control Protocols and Procedures 15
TEMPERATURELab tested thermometer used?
Thermometer checked w/ASTM within + 0.5 °C; Date
D Yes
| | No in remarksTime.
pH
AMPULE LOT NUMBERS:
ScTcflML__________
gwp2
;cld 2 MLultrapure nitric acid ____ potassium dichromate + nitric acid sulturic acid 1 ml/2ml sodium hydroxide.phosphoric acid/copper sulfate
pH Mtr W-no. METER Make/Model elec. no./typeunfiltered i i filtered sample I I samplepH value at buffer temp, y, Initial Reading Adj. Reading
pH subsample from or pH measurement location:
Remarksi i sample > > 01
Temp correction factors for __buffers applied? I I YES | | NO
stirrer used? | | YES [ I NOif yes, ' ' ' '
a magnetic i i manuallystirrer I I stirred
Sample Temp:
Chum sample bottle flow-throughFlow through chamber off for final pH ? Yes NoSlope ______ % Time ______
Average or median of. . points
SPECIFIC CONDUCTANCEMtr W-no. METER Make/Model probe no. and type
standard value emp itd^CStd Initial Reading Adj. Reading Remarks correction factor applied?
i i YES rn NOI [ auto temp compensated meter
[" I manual temp compensated meter
corr. factor =
SC subsample from or SC churn measurement location: OMUm sample bottle flow through
Time______
Average or median of. .points
DISSOLVED OXYGEN W-no.Calibration :[ | Air Calibration in Water
Battery checkredline____
METER Make/Model probe no.
| | Air Calibration Chamber in Air r ] Air-Saturation Deionlzed Water
range _____ Zero meter reading ______ Adj. to _____
I I Calibration by Winkler Titration (attach Supplementary Winkler page)
D.O. Zero Check CDYESI I NO Zero D.O solution reading = mg/L
D.O. measurement location or D.O. subsample from : BOD bottle Flow through Chamber downhole
H2° TemP- Chart D.O. Sat. _________ mg/L
Salinity Corr. Factor.
BAR. PRESS __
Meter D.O. Sat.. Adjusted to __
.mg/L;
Thermistor Check Barometer Calibrated stirrer used?
Average or median of.
DYES n N°Q YES Cm NO
[m YES cm NO_____points
. mg/L (if corr. factor applicable). mm Hg (mm = in.X25.4) jime
Miscellaneous Section (Well Purge Log/Notes/Calculations
TimeWater
levelblv MP LS
Draw down feet
Well yield
gpm cfs
Volume Removed (gallons) PH T°C SC DO Turbidity
Figure 6. Example of ground-water field sheet Continued.
16 Baseline Data-Collection and Quality-Control Protocols and Procedures for the Equus Beds Ground-Water Recharge Demonstration Project Near Wichita, Kansas, 1995-96
gwswp3
ALKALINITY Acid: 1. 60 N 0.1 600 N 0.01 639N OtherAcid lot no. :
Sample volume I I Filtered
Sample stirred : Ci i Incremental i i equivalence
PH
pH: StarlDC (Digits Vol. titrate
Digital Co Vol. titrate
A pH
mLCH Unfiltered
Z] magnetically I I manuallyi i Fixed . . i i Gran i i ena point ' ' OrationVol acid DC or mL
AVol acid DC or mL
A Dl-lA Vol acid
Endil Counts) or d at End Point near ph
unts or d at End Point near ph
E.COI_. . Time collected Time in© oc'V*
J*J w .
Time in @ Time out :
Ll
H8.3:
14.5:
Date :
44.5°C :Date :
ALKALINITY
c623 =/>
HC03 =
ALKALIN as CaCC
A = DC or pH to end
B = DC or pH to end
*APPLY COR BURETTE T
CF = c
(IMPORTAN SHOWN; i
ALKALINIP
BICARBON/
CARBONAT
CALCULATIONS :
nr
B-2(/
ITY )3=B
mLs ac Doint n«
mLs at Doint n«
RECTION TRATION
Drr. factor
T:CF se onlv
{
\TE
E
iLs
M
K
;id jar
:id ?ar
FAC HA
=
MO t w
sampleV PP
CO
eo
*x mL sample A or
F3 v rF*mLsanr
Tom initi 8.3 =
from initi 4.5 =
;TOR (CF) i5 NONSTAN
T APPLK th nonste
rr
r
pie
al
al
: ACID US DARD NC
normal
:ABLEindard
ig/L as
ng/L a
ng/L a
ED FOR RMALITY- ty/0.01639
FOR THE C normality B
CaCO3
3HCC-7
Dissolved Oxygen Using
Final Burette Reading
Initial Burette Reading
mL Titrant Used
mL water Titrated
F-)
F2
FACTORS J1
F-)
F2F3
DIGITAL" JRETTE
DIGITAL COUNT TITRATION (DC) Using using 0.1600 1.60 , normal normal
12.012.210.0
120122100
BURETTETITRATION (my.
Using mf of 0.01 639 normal
983.51000820.2
FITRATION FACTORS titration)
NOTE i ATTACH OUTPUT COPYIF ALKALINITY VALUES
ARE CALCULATED USING
A COMPUTER PROGRAM
Winkler Method
Titrant: PAO Sodium Thiosulfate Other
Titrant Norn
Dissolved
APR
(ST
nality
Oxygen (mg/L) =
_Y CORRECTION FAC
ANDARD NORMALITY
N D.O. =
200 ^\ mL water titrated/
TOR (CF) IF TITRANT HAS A N(
= 0.025 N£F = corr. factor =norr
FECAL COLIFORM
Time collected :Time in :Time out :
(ml) Count calculation? Remarks*Blank
Blank'Remarks 1 = Less than 2
0 = Est. ct. KIncub. Time 2 hrs @ 35°C f filt. size 2CIdeal count 20-80 col. E. COLI COUNT /1 00 mL
= Greater than = non ideal ct.
(ml) Count cBlank
Blank
Date:Date:
Used in alculatio
Remarks ^ssthan 2-
0-2rhers^44.5°C Incub. Time 22-26 hrs Ideal count 20-60 col.
:Rmk FC COUNT /1 00 mL
i? Remarks*
Greater than non ideal cL
filt. size
Incub. Temp 44?5 C : Rmk
X mL Titrant X CF*
DN-STANDARD NORMALITY
nality of titrant/0.025
FECAL STREPTOCOCCI
Time collected :
Time in :Time out :
Blank
Blank* Remarks
Date:Date:
Count calculatk n? Remarks*
1 = Less than 2 = Greater than 0 = Est ct K = non ideal ct
Incub. Time 46-50 hrs filt. sizeIdeal count 20-100 col. Incub. Temp 35^C FS COUNT /1 00 mL : Rmk
Figure 6. Example of ground-water field sheet Continued.
Data-Collection and Quality-Control Protocols and Procedures 17
gwp4QUALITY ASSURANCE SAMPLES
Were quality assurance samples collected? Q YES [ |NO Start Date and Timefor QA Sample
Other CH Indicate type(s):If YES indicate type(s):
Organic- free
Replicate | |
Spike I !
Field blank I !
Trip blank I I
Dl
n
water from sampling site
a a a
End Date and Time _ for QA Sample
Sample processed in collection and preservation chambers ? Yes No Sample in contact with: atmosphere, oxygen, nitrogen, other ________ Sample processed under I I oxygenated | | nonoxygenated conditions Sample medium: ground water, QA-artificial, QA-ground water, other_____
Sample type: composite, spike, blank, reference, blind, reference material, replicate, spike solution, regular, other________________Sample aource: well head, drill stem test, casing leak, well bleeder, fracture test, pump, tap near well, tap away from well, discharge pipe, drain line,
injection pump, windmill, water siphon, special, municipal and domestic waste, industrial waste, mine water, water well, multiple water wells, abandoned well, salt-water supply well, salt-water disposal well, injection well, service well, lysimeter, observation well, monitoring well
Sampler type: thief, bailer, double valve bailer, flowing well, suction pump, submersible pump, squeeze pump, gas recip., gas lift, peristaltic, other __
Sampler ID _______________ Sampler materiaBtainless Steel Brass PVC Teflon Other____________________ QA DATA TYPE (S) ASSOCIATED WITH SAMPLE: blank, blind samples, replicate sample, spike sample, more than one type of QA, Other ___ Blank, type of solution: distilled/deionized water, standard reference water sample, matched matrix, organic-free water, other _______ Blank, type of sample: shelf, refrigerator, trip, sampler, splitter, filter, preservation, field, ambient, lab, annual equipment, other_____ Blank, source of solution: USGS (Lab), ERA, SRWS (USGS), NIST, District Lab, Natural sample, Ocala Lab, Chemical supplier, unknown, Other_ Reference material source: USGS (Lab), ERA, SRWS (USGS), NIST, District Lab, Natural sample, Ocala Lab, Chemical supplier, unknown, Other Spike source: USGS (Lab), ERA, SRWS (USGS), NIST, District Lab, Natural sample, Ocala Lab, Chemical supplier, unknown, Other Replicate Type: concurrent, sequential, split, split-concurrent, split-sequential, Other ______________________________ Spike Type: field, laboratory, surrogate, internal standards, other ______________________________________ INORGANIC Filtering information: method; vacuum tortuous path, type of filter used: plate filter, capsule filter, ultrafiltration, and filter brand __membrane material: cellulose acetate cellulose nitrate glass fiber other ___ Filter pore size: 0.1 urn, 0.2 urn, 0.45 urn, other ___Filter diameter: 147mm, 47mm, 600cm2 , 700cm2
ORGANIC Filtering information: method; vacuum tortuous path, type of filter used: plate filter, capsule filter, ultrafiltration, and filter brand ___membrane material: cellulose acetate cellulose nitrate glass fiber other ___ Filter pore size: 0.1 urn, 0.2njn, 0.45 urn, other ____Filter diameter: 147mm, 47mm, 600cm2 , 700cm2
Weather: Clear Partly Cloudy Cloudy est % cover light medium steady intermittent rain snow sleet fog calm light breeze very gustyLaboratory Schedules
lap- codes
Laboratory Schedules
SAMPLES COLLECTED WICHITA LABORATORYTable 2: 1-500RU, 1-1L-RU, 1-500-FA, 1-125-FC. 1-500-FU, 2-250-FC, 2-250-BACT : 9 TOTAL
Table3: 1-500-RA, 1-125-RC, 2-250-RC. 1-500-Rll: 5 TOTAL Table 4: bottles for table 1 plus: 2-250-FAM, 1-125-TOC, 1-1L.CN-: 15 TOTAL Table 5: bottles for Table 1 b plus: 2-250-RAM, 1 -1L-CN-: 10 TOTAL
Thurman Laboratory Table 2: 2-125-ELISA Table 3: 2-125-ELISA Table 4: 2-125-ELISA Table 5: 2-125-ELISA
USGS LABORATORYTable 6: 1 -1L- FILT GCC SC2001 Table 7: 1 -1L-RAW GCC SC1389 Table9:2-1L-RAWGCCSC79SC1359 Table 10: 3-VOC SC1390 Tat.,..._ Table 12: 1-1 L-RAW GCC SC 1334 Table 13: 1-1 L-RAW GCC SC 1383
Comp by Chkd by Date
TableS: 1-1L-FILTGCC Table 11: 2-1L-FAR SC 456
Oxygen Demand (BOD) (CBOD)Blanks
Bottle #Initial BOD
D.O. or CBOD
5-Day BOD
D.O. or CBOD BOD CBOD Average
BOD CBOD
Sample
Bottle #Sample Size
(Dilution)
Residual Chlorine
Initial BOD
D.O. or CBOD
5-Day BOD
D.O. or CBOD BOD CBOD
Field Test Lab Test
Positive/NegativeSodium Sulfite
AddedSodium Sulfite
Normality+ / - + / .
Other observations
Figure 6. Example of ground-water field sheet Continued.
18 Baseline Data-Collection and Quality-Control Protocols and Procedures for the Equus Beds Ground-Water Recharge Demonstration Project Near Wichita, Kansas, 1995-96
degradation and baked at 450 °C to eliminate organic contamination. Bacteriological sample bottles were sterilized using an autoclave to prevent contamination. Sample bottles, holding times, preservatives for key, key-plus, limited, and full EPA water-quality constitu ent analyses are listed in Appendix A, table 16.
Preservation was performed, and holding times of samples were assessed according to the method requirements of the city of Wichita laboratory (city of Wichita, written commun., 1994, revised 1996), U.S. Environmental Protection Agency (1995, p. 643-645), the USGS laboratory in Lawrence, Kansas (Thurman and others, 1990), and the USGS National Water-Qual ity Laboratory in Arvada, Colorado. Methods used for analyses were those required by EPA or USGS as noted in Appendix A, tables 2 through 13. Metals and radio- chemical samples were preserved with concentrated nitric acid. Samples for anions and other inorganic con stituents were not preserved. Samples for nutrients were either chilled or preserved with concentrated sul- furic acid. Organic samples were chilled. If holding times were exceeded, the analyses were used only in a semiquantitative manner and were reported as having exceeded the holding time.
Sample Custody
The management of samples collected onsite used specific procedures to ensure their integrity. The pos session of samples also was traceable from the time the samples were collected.
Samples analyzed by the city of Wichita laboratory and the USGS laboratory in Lawrence, Kansas, were transported or shipped directly to the laboratory and logged in. A copy of the field sheet (fig. 5 or 6) accom panied the samples, and the receipt of the samples and date and time of receipt were acknowledged on the form. Samples analyzed at the USGS National Water-Quality Laboratory (NWQL) in Arvada, Colo rado, were shipped in a sealed cooler by an overnight carrier. Inside the cooler, a form outlining the request for analytical services and requestor for the services was sealed in a plastic bag. After receipt at all of the laboratories, the internal laboratory information man agement system tracked the custody of the samples.
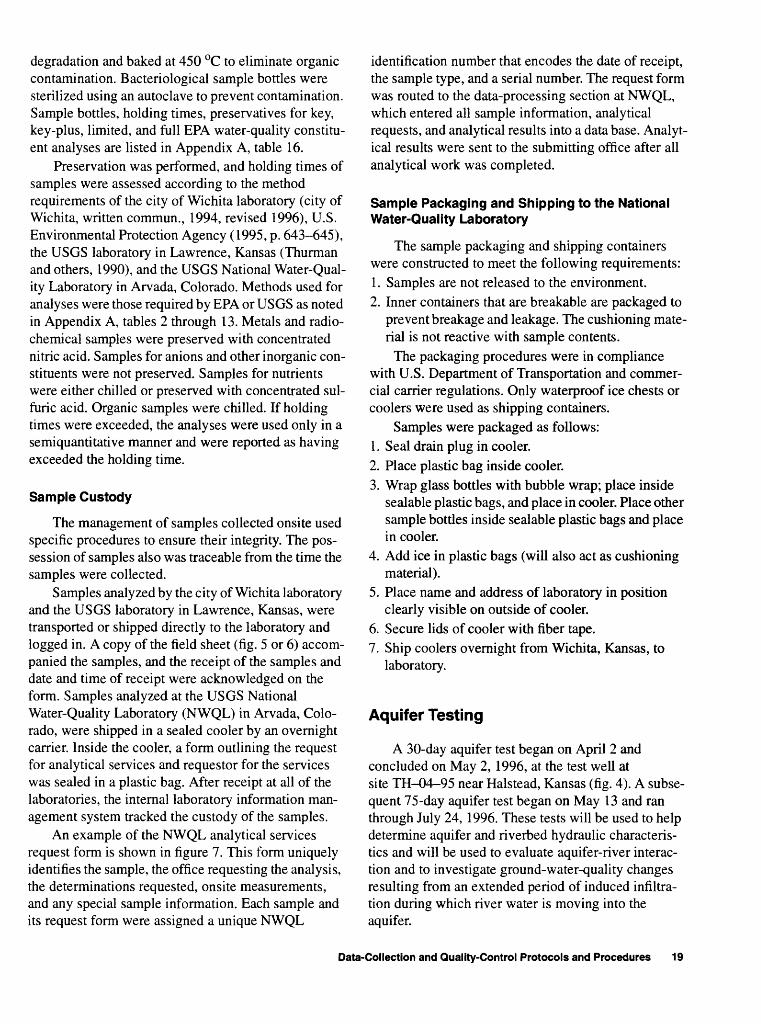
An example of the NWQL analytical services request form is shown in figure 7. This form uniquely identifies the sample, the office requesting the analysis, the determinations requested, onsite measurements, and any special sample information. Each sample and its request form were assigned a unique NWQL
identification number that encodes the date of receipt, the sample type, and a serial number. The request form was routed to the data-processing section at NWQL, which entered all sample information, analytical requests, and analytical results into a data base. Analyt ical results were sent to the submitting office after all analytical work was completed.
Sample Packaging and Shipping to the National Water-Quality Laboratory
The sample packaging and shipping containers were constructed to meet the following requirements:1. Samples are not released to the environment.2. Inner containers that are breakable are packaged to
prevent breakage and leakage. The cushioning mate rial is not reactive with sample contents.
The packaging procedures were in compliance with U.S. Department of Transportation and commer cial carrier regulations. Only waterproof ice chests or coolers were used as shipping containers.
Samples were packaged as follows:1. Seal drain plug in cooler.2. Place plastic bag inside cooler.3. Wrap glass bottles with bubble wrap; place inside
sealable plastic bags, and place in cooler. Place other sample bottles inside sealable plastic bags and place in cooler.
4. Add ice in plastic bags (will also act as cushioning material).
5. Place name and address of laboratory in position clearly visible on outside of cooler.
6. Secure lids of cooler with fiber tape.7. Ship coolers overnight from Wichita, Kansas, to
laboratory.
Aquifer Testing
A 30-day aquifer test began on April 2 and concluded on May 2, 1996, at the test well at site TH-04-95 near Halstead, Kansas (fig. 4). A subse quent 75-day aquifer test began on May 13 and ran through July 24, 1996. These tests will be used to help determine aquifer and riverbed hydraulic characteris tics and will be used to evaluate aquifer-river interac tion and to investigate ground-water-quality changes resulting from an extended period of induced infiltra tion during which river water is moving into the aquifer.
Data-Collection and Quality-Control Protocols and Procedures 19
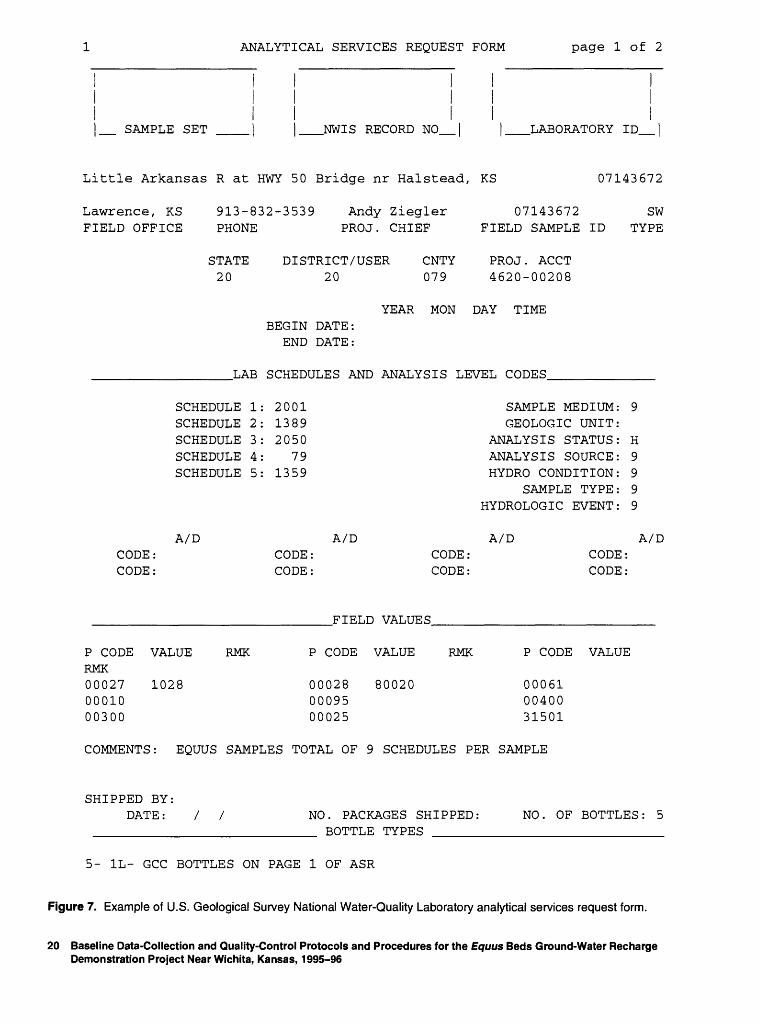
ANALYTICAL SERVICES REQUEST FORM page 1 of 2
SAMPLE SET NWIS RECORD NO LABORATORY ID
Little Arkansas R at HWY 50 Bridge nr Halstead, KS 07143672
Lawrence, KS FIELD OFFICE
913-832-3539 PHONE
Andy Ziegler PROJ. CHIEF
07143672 SW FIELD SAMPLE ID TYPE
STATE DISTRICT/USER CNTY PROJ. ACCT 20 20 079 4620-00208
YEAR MON DAY TIMEBEGIN DATE:
END DATE:
LAB SCHEDULES AND ANALYSIS LEVEL CODES
SCHEDULE 1: 2001SCHEDULE 2: 1389SCHEDULE 3: 2050
SAMPLE MEDIUM: 9 GEOLOGIC UNIT:
ANALYSIS STATUS: HSCHEDULE 4: SCHEDULE 5:
A/D CODE: CODE:
P CODE VALUE RMK RMK 00027 1028 00010 00300
79 1359
A/D CODE : CODE : CODE : CODE :
FIELD VALUES
P CODE VALUE RMK
00028 80020 00095 00025
ANALYSIS SOURCE: 9 HYDRO CONDITION: 9
SAMPLE TYPE: 9 HYDROLOGIC EVENT: 9
A/D A/D CODE: CODE:
P CODE VALUE
00061 00400 31501
COMMENTS: EQUUS SAMPLES TOTAL OF 9 SCHEDULES PER SAMPLE
SHIPPED BY:DATE: / / NO. PACKAGES SHIPPED:
BOTTLE TYPES _____NO. OF BOTTLES: 5
5- 1L- GCC BOTTLES ON PAGE 1 OF ASR
Figure 7. Example of U.S. Geological Survey National Water-Quality Laboratory analytical services request form.
20 Baseline Data-Collection and Quality-Control Protocols and Procedures for the Equus Beds Ground-Water Recharge Demonstration Project Near Wichita, Kansas, 1995-96
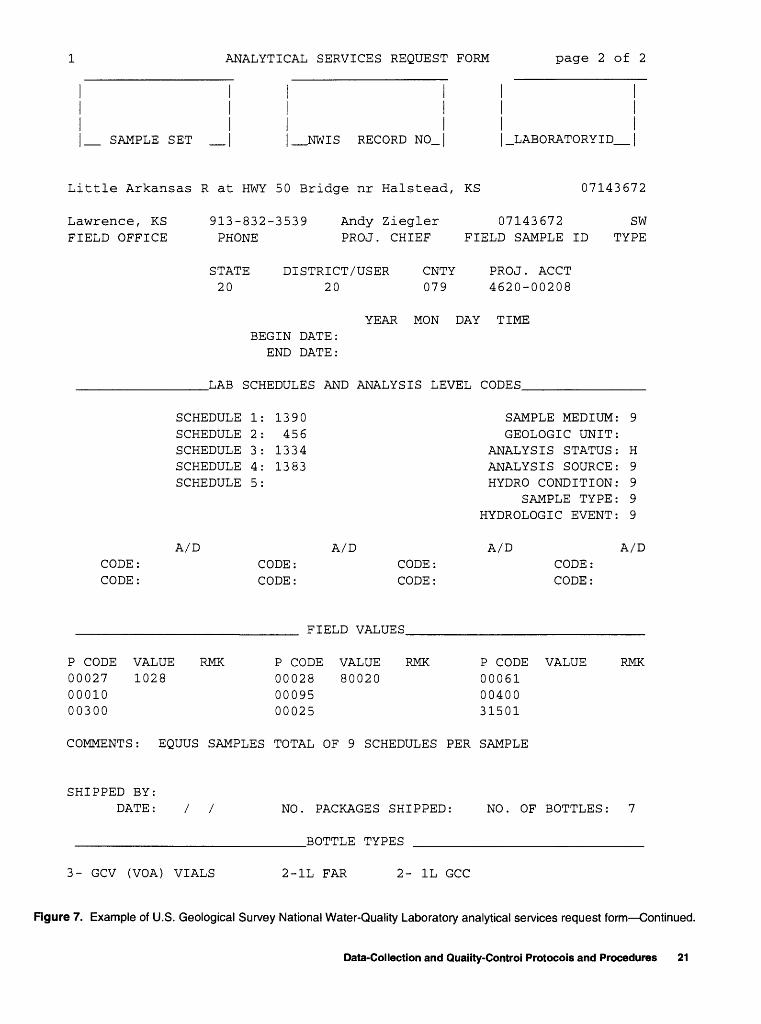
ANALYTICAL SERVICES REQUEST FORM page 2 of 2
SAMPLE SET NWIS RECORD NO LABORATORYID
Little Arkansas R at HWY 50 Bridge nr Halstead, KS 07143672
Lawrence, KS FIELD OFFICE
913-832-3539 PHONE
Andy Ziegler 07143672 SW PROJ. CHIEF FIELD SAMPLE ID TYPE
STATE DISTRICT/USER CNTY PROJ. ACCT 20 20 079 4620-00208
YEAR MON DAY TIMEBEGIN DATE:
END DATE:
LAB SCHEDULES AND ANALYSIS LEVEL CODES
SCHEDULE 1: 1390 SCHEDULE 2: 456 SCHEDULE 3: 1334 SCHEDULE 4: 1383 SCHEDULE 5:
SAMPLE MEDIUM: 9GEOLOGIC UNIT:
ANALYSIS STATUS: HANALYSIS SOURCE: 9HYDRO CONDITION: 9
SAMPLE TYPE: 9HYDROLOGIC EVENT: 9
A/D A/D
P CODE VALUE RMK 00027 1028 00010 00300
P CODE VALUE RMK 00028 80020 00095 00025
A/D A/DCODE:CODE:
CODE:CODE:
CODE:CODE:
FIELD VALUES
CODE:CODE:
P CODE VALUE RMK000610040031501
COMMENTS: EQUUS SAMPLES TOTAL OF 9 SCHEDULES PER SAMPLE
SHIPPED BY:DATE: / /
3- GCV (VOA) VIALS
NO. PACKAGES SHIPPED:
BOTTLE TYPES ^^__
NO. OF BOTTLES: 7
2-1L FAR 2- 1L GCC
Figure 7. Example of U.S. Geological Survey National Water-Quality Laboratory analytical services request form Continued.
Data-Collection and Quality-Control Protocols and Procedures 21
The aquifer test involved construction of a test well and installation of 22 piezometers surrounding the test well to measure changes in ground-water levels. The test well was constructed of stainless-steel screen and gravel pack with 24-inch diameter screen and casing. Screen length, slot size, and setting depth were based on analysis of site-specific drill-test data. The well was designed for a 900- to 1,000-gallons-per-minute capac ity, depending on site geology. The pump was an elec tric-driven, vertical turbine type. Pumped water was discharged to the river after measurement of flow.
The piezometers were installed surrounding the test well to measure the response of the water-table sur face during pumping. Strings of piezometers were con structed parallel and perpendicular to the river.
During the aquifer test, water-level measurements, pump discharge, river stage, specific conductance, pH, water temperature, and dissolved oxygen were recorded at least hourly. Ground-water-level measure ments were recorded using a combination of electronic data-logging units and manual methods. The hydrogeo- logic characteristics evaluated with this test were trans- missivity, specific yield, hydraulic conductivity, and riverbed conductance.
Water-level measurements were made using the methods described by Stallman (1971). Water-level measurements were verified with an electric or steel tape that had been previously verified to be accurate to the nearest 0.01 foot. Pump discharge was measured by a calibrated, totalizing water meter with a calibrated orifice weir, and an automated data-logging unit was used to record the discharge at 15-minute intervals.
Aquifer and water-quality testing procedures for the 30-day test of the deep part of the Equus beds aqui fer are described in the following paragraph.
The test well was located approximately 200 feet north-northwest from the original boring at well EB-145-A1 (fig. 4). The geological conditions at the selected test-well site vary and were used to design the screened intervals for the test well. The boring at well EB-145-A1 encountered a shallow sand zone, a 15-foot thick silty-clay layer, and a deeper sand and gravel aquifer zone. Testing included a 30-day pump ing test of the deep aquifer zone and use of clustered shallow and deep piezometers to measure aquifer response in the shallow and deep zones. Aquifer response in both the shallow and deep aquifer zones was recorded using automated data loggers. The gen eral sequence of activities was:
1. Test hole drilling at well location.2. Develop final well design and piezometer spacing.3. Construct well and piezometers.4. Develop well by surging and pumping.5. Perform 24-hour acceptance test to verify well
development and proper construction.6. Set test pump and instrumentation.7. Conduct 30-day aquifer test.8. Evaluate water-level data and available water-qual
ity data to determine if the deep aquifer zone is responding as a confined system. Review informa tion with Groundwater Management District No. 2.
9. Conduct a 75-day pumping test during spring and summer to evaluate atrazine fate through induced infiltration and to confirm the river/aquifer intercon nection.
10. Secure test-well site and equipment until construc tion of other demonstration recharge facilities near Wichita Well No. 4 and No. 36 (fig. 3) is complete.
Test Well
The test well was constructed as a full-scale pro duction well. The conceptual well design was deter mined from the boring logs from well EB-145-A1 (fig. 3). Final design was determined from a pilot hole drilled as part of a well-construction contract. Final construction was with a 24-inch casing and 60 feet of 60-slot, stainless-steel screen from 71 to 131.5 feet below land surface, with a zone from 110 to 114 feet blanked out because of fine-grained sand. Screen set ting and slot size were determined from grain-size determinations from split-spoon samples and boring logs from the pilot hole.
Discharge of Pumped Water
The 30- and 75-day aquifer tests were accom plished using a pump equipped with an electric motor. The test well was pumped at a rate of approximately 900 to 1,000 gallons per minute. The pump discharge was directed to the river using polyvinyl chloride (PVC) pipe and corrugated metal roofing used as a splash abutment to prevent bank erosion. Flow was controlled with a gate valve supplied by the drilling contractor.
Review of data from the USGS streamflow-gaging station at Halstead, Kansas (station 07143680), and the gaging station at U.S. Highway 50 (station 07143672) showed that the 1,000-gallon-per-minute pumping rate caused a 0.05-foot rise in the river stage at the test
22 Baseline Data-Collection and Quality-Control Protocols and Procedures for the Equus Beds Ground-Water Recharge Demonstration Project Near Wichita, Kansas, 1995-96
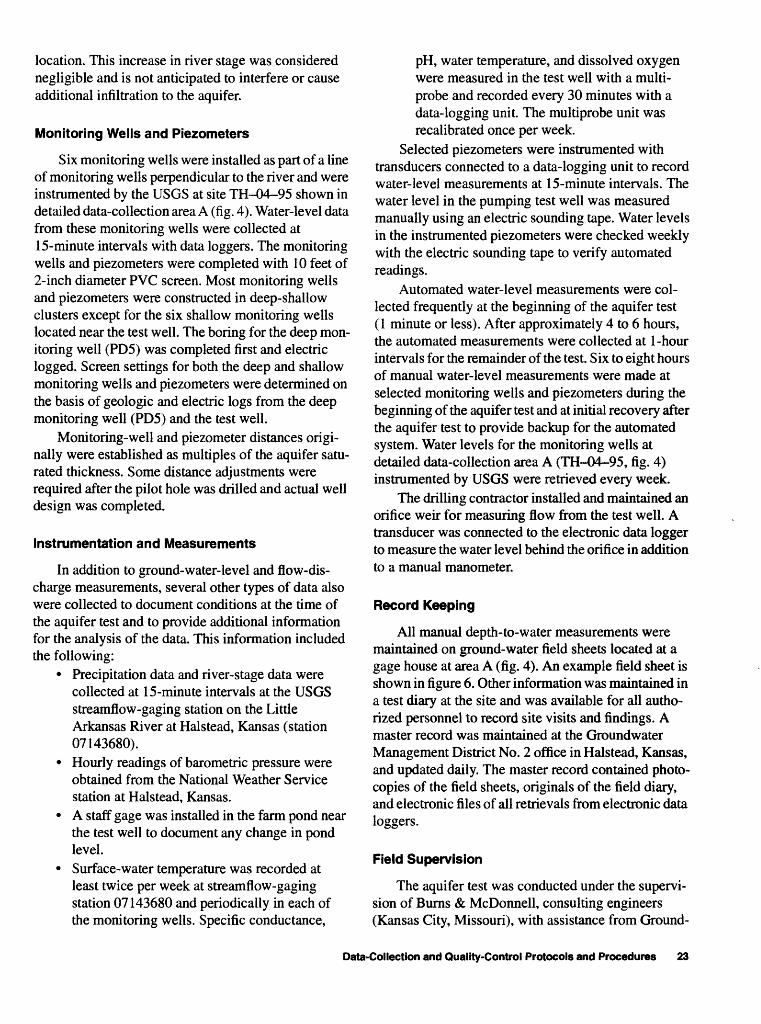
location. This increase in river stage was considered negligible and is not anticipated to interfere or cause additional infiltration to the aquifer.
Monitoring Wells and Piezometers
Six monitoring wells were installed as part of a line of monitoring wells perpendicular to the river and were instrumented by the USGS at site TH-04-95 shown in detailed data-collection area A (fig. 4). Water-level data from these monitoring wells were collected at 15-minute intervals with data loggers. The monitoring wells and piezometers were completed with 10 feet of 2-inch diameter PVC screen. Most monitoring wells and piezometers were constructed in deep-shallow clusters except for the six shallow monitoring wells located near the test well. The boring for the deep mon itoring well (PD5) was completed first and electric logged. Screen settings for both the deep and shallow monitoring wells and piezometers were determined on the basis of geologic and electric logs from the deep monitoring well (PD5) and the test well.
Monitoring-well and piezometer distances origi nally were established as multiples of the aquifer satu rated thickness. Some distance adjustments were required after the pilot hole was drilled and actual well design was completed.
Instrumentation and Measurements
In addition to ground-water-level and flow-dis charge measurements, several other types of data also were collected to document conditions at the time of the aquifer test and to provide additional information for the analysis of the data. This information included the following:
Precipitation data and river-stage data were collected at 15-minute intervals at the USGS streamflow-gaging station on the Little Arkansas River at Halstead, Kansas (station 07143680).
Hourly readings of barometric pressure were obtained from the National Weather Service station at Halstead, Kansas.
A staff gage was installed in the farm pond near the test well to document any change in pond level.
Surface-water temperature was recorded at least twice per week at streamflow-gaging station 07143680 and periodically in each of the monitoring wells. Specific conductance,
pH, water temperature, and dissolved oxygen were measured in the test well with a multi- probe and recorded every 30 minutes with a data-logging unit. The multiprobe unit was recalibrated once per week.
Selected piezometers were instrumented with transducers connected to a data-logging unit to record water-level measurements at 15-minute intervals. The water level in the pumping test well was measured manually using an electric sounding tape. Water levels in the instrumented piezometers were checked weekly with the electric sounding tape to verify automated readings.
Automated water-level measurements were col lected frequently at the beginning of the aquifer test (1 minute or less). After approximately 4 to 6 hours, the automated measurements were collected at 1-hour intervals for the remainder of the test. Six to eight hours of manual water-level measurements were made at selected monitoring wells and piezometers during the beginning of the aquifer test and at initial recovery after the aquifer test to provide backup for the automated system. Water levels for the monitoring wells at detailed data-collection area A (TH-04-95, fig. 4) instrumented by USGS were retrieved every week.
The drilling contractor installed and maintained an orifice weir for measuring flow from the test well. A transducer was connected to the electronic data logger to measure the water level behind the orifice in addition to a manual manometer.
Record Keeping
All manual depth-to-water measurements were maintained on ground-water field sheets located at a gage house at area A (fig. 4). An example field sheet is shown in figure 6. Other information was maintained in a test diary at the site and was available for all autho rized personnel to record site visits and findings. A master record was maintained at the Groundwater Management District No. 2 office in Halstead, Kansas, and updated daily. The master record contained photo copies of the field sheets, originals of the field diary, and electronic files of all retrievals from electronic data loggers.
Field Supervision
The aquifer test was conducted under the supervi sion of Burns & McDonnell, consulting engineers (Kansas City, Missouri), with assistance from Ground-
Data-Collection and Quality-Control Protocols and Procedures 23
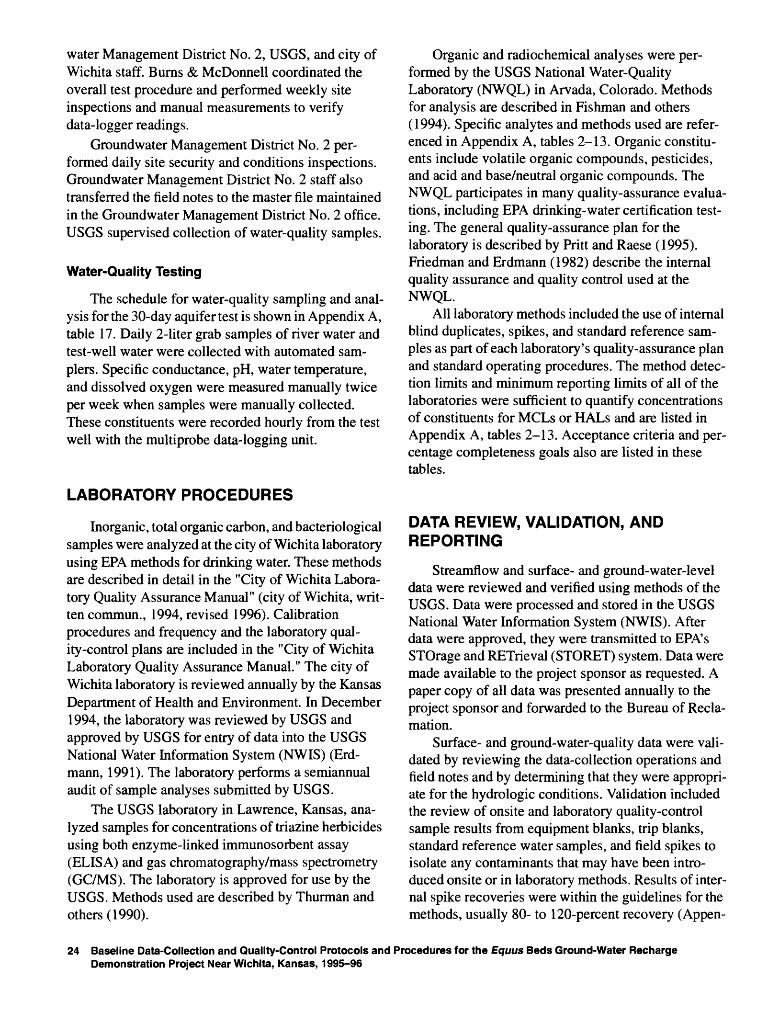
water Management District No. 2, USGS, and city of Wichita staff. Burns & McDonnell coordinated the overall test procedure and performed weekly site inspections and manual measurements to verify data-logger readings.
Groundwater Management District No. 2 per formed daily site security and conditions inspections. Groundwater Management District No. 2 staff also transferred the field notes to the master file maintained in the Groundwater Management District No. 2 office. USGS supervised collection of water-quality samples.
Water-Quality Testing
The schedule for water-quality sampling and anal ysis for the 30-day aquifer test is shown in Appendix A, table 17. Daily 2-liter grab samples of river water and test-well water were collected with automated sam plers. Specific conductance, pH, water temperature, and dissolved oxygen were measured manually twice per week when samples were manually collected. These constituents were recorded hourly from the test well with the multiprobe data-logging unit.
LABORATORY PROCEDURES
Inorganic, total organic carbon, and bacteriological samples were analyzed at the city of Wichita laboratory using EPA methods for drinking water. These methods are described in detail in the "City of Wichita Labora tory Quality Assurance Manual" (city of Wichita, writ ten commun., 1994, revised 1996). Calibration procedures and frequency and the laboratory qual ity-control plans are included in the "City of Wichita Laboratory Quality Assurance Manual." The city of Wichita laboratory is reviewed annually by the Kansas Department of Health and Environment. In December 1994, the laboratory was reviewed by USGS and approved by USGS for entry of data into the USGS National Water Information System (NWIS) (Erd- mann, 1991). The laboratory performs a semiannual audit of sample analyses submitted by USGS.
The USGS laboratory in Lawrence, Kansas, ana lyzed samples for concentrations of triazine herbicides using both enzyme-linked immunosorbent assay (ELISA) and gas chromatography/mass spectrometry (GC/MS). The laboratory is approved for use by the USGS. Methods used are described by Thurman and others (1990).
Organic and radiochemical analyses were per formed by the USGS National Water-Quality Laboratory (NWQL) in Arvada, Colorado. Methods for analysis are described in Fishman and others (1994). Specific analytes and methods used are refer enced in Appendix A, tables 2-13. Organic constitu ents include volatile organic compounds, pesticides, and acid and base/neutral organic compounds. The NWQL participates in many quality-assurance evalua tions, including EPA drinking-water certification test ing. The general quality-assurance plan for the laboratory is described by Pritt and Raese (1995). Friedman and Erdmann (1982) describe the internal quality assurance and quality control used at the NWQL.
All laboratory methods included the use of internal blind duplicates, spikes, and standard reference sam ples as part of each laboratory's quality-assurance plan and standard operating procedures. The method detec tion limits and minimum reporting limits of all of the laboratories were sufficient to quantify concentrations of constituents for MCLs or HALs and are listed in Appendix A, tables 2-13. Acceptance criteria and per centage completeness goals also are listed in these tables.
DATA REVIEW, VALIDATION, AND REPORTING
Streamflow and surface- and ground-water-level data were reviewed and verified using methods of the USGS. Data were processed and stored in the USGS National Water Information System (NWIS). After data were approved, they were transmitted to EPA's STOrage and RETrieval (STORET) system. Data were made available to the project sponsor as requested. A paper copy of all data was presented annually to the project sponsor and forwarded to the Bureau of Recla mation.
Surface- and ground-water-quality data were vali dated by reviewing the data-collection operations and field notes and by determining that they were appropri ate for the hydrologic conditions. Validation included the review of onsite and laboratory quality-control sample results from equipment blanks, trip blanks, standard reference water samples, and field spikes to isolate any contaminants that may have been intro duced onsite or in laboratory methods. Results of inter nal spike recoveries were within the guidelines for the methods, usually 80- to 120-percent recovery (Appen-
24 Baseline Data-Collection and Quality-Control Protocols and Procedures for the Equus Beds Ground-Water Recharge Demonstration Project Near Wichita, Kansas, 1995-96
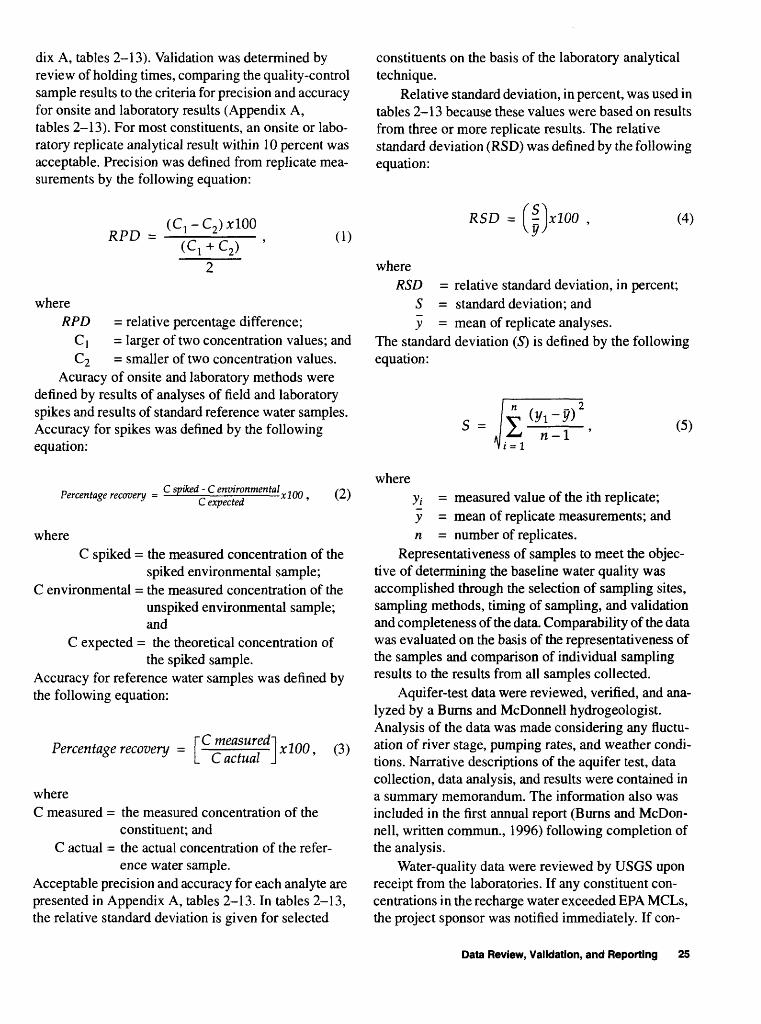
dix A, tables 2-13). Validation was determined by review of holding times, comparing the quality-control sample results to the criteria for precision and accuracy for onsite and laboratory results (Appendix A, tables 2-13). For most constituents, an onsite or labo ratory replicate analytical result within 10 percent was acceptable. Precision was defined from replicate mea surements by the following equation:
RPD =(C 1 -C2 )jclOO
(q + c2 > (i)
whereRPD = relative percentage difference;
G! = larger of two concentration values; and 2 = smaller of two concentration values.
Acuracy of onsite and laboratory methods were defined by results of analyses of field and laboratory spikes and results of standard reference water samples. Accuracy for spikes was defined by the following equation:
n . C spiked - C environmental , /o\ Percentage recovery = <- xlOO , (2)
whereC spiked = the measured concentration of the
spiked environmental sample; C environmental = the measured concentration of the
unspiked environmental sample;and
C expected = the theoretical concentration ofthe spiked sample.
Accuracy for reference water samples was defined by the following equation:
Percentage recovery - C measured C actual J
1x100, (3)
whereC measured = the measured concentration of the
constituent; andC actual = the actual concentration of the refer
ence water sample.Acceptable precision and accuracy for each analyte are presented in Appendix A, tables 2-13. In tables 2-13, the relative standard deviation is given for selected
constituents on the basis of the laboratory analytical technique.
Relative standard deviation, in percent, was used in tables 2-13 because these values were based on results from three or more replicate results. The relative standard deviation (RSD) was defined by the following equation:
(4)RSD = I r 1*100 ,y
whereRSD = relative standard deviation, in percent;
S = standard deviation; and y = mean of replicate analyses.
The standard deviation (5) is defined by the followingequation:
(5)
whereyt = measured value of the ith replicate; y = mean of replicate measurements; and n = number of replicates.
Representativeness of samples to meet the objec tive of determining the baseline water quality was accomplished through the selection of sampling sites, sampling methods, timing of sampling, and validation and completeness of the data. Comparability of the data was evaluated on the basis of the representativeness of the samples and comparison of individual sampling results to the results from all samples collected.
Aquifer-test data were reviewed, verified, and ana lyzed by a Burns and McDonnell hydrogeologist. Analysis of the data was made considering any fluctu ation of river stage, pumping rates, and weather condi tions. Narrative descriptions of the aquifer test, data collection, data analysis, and results were contained in a summary memorandum. The information also was included in the first annual report (Burns and McDon nell, written commun., 1996) following completion of the analysis.
Water-quality data were reviewed by USGS upon receipt from the laboratories. If any constituent con centrations in the recharge water exceeded EPA MCLs, the project sponsor was notified immediately. If con-
Data Review, Validation, and Reporting 25
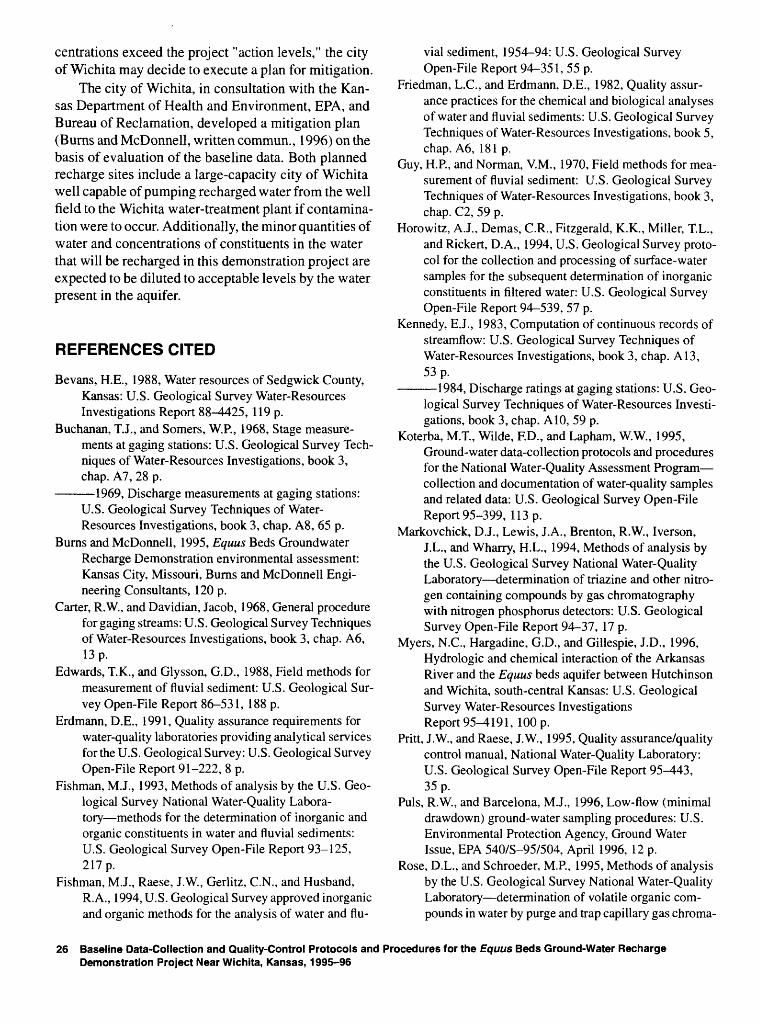
centrations exceed the project "action levels," the city of Wichita may decide to execute a plan for mitigation.
The city of Wichita, in consultation with the Kan sas Department of Health and Environment, EPA, and Bureau of Reclamation, developed a mitigation plan (Burns and McDonnell, written commun., 1996) on the basis of evaluation of the baseline data. Both planned recharge sites include a large-capacity city of Wichita well capable of pumping recharged water from the well field to the Wichita water-treatment plant if contamina tion were to occur. Additionally, the minor quantities of water and concentrations of constituents in the water that will be recharged in this demonstration project are expected to be diluted to acceptable levels by the water present in the aquifer.
REFERENCES CITED
Bevans, H.E., 1988, Water resources of Sedgwick County, Kansas: U.S. Geological Survey Water-Resources Investigations Report 88-4425, 119 p.
Buchanan, T.J., and Somers, W.P., 1968, Stage measure ments at gaging stations: U.S. Geological Survey Tech niques of Water-Resources Investigations, book 3, chap. A7, 28 p.
1969, Discharge measurements at gaging stations: U.S. Geological Survey Techniques of Water- Resources Investigations, book 3, chap. A8, 65 p.
Burns and McDonnell, 1995, Equus Beds Groundwater Recharge Demonstration environmental assessment: Kansas City, Missouri, Burns and McDonnell Engi neering Consultants, 120 p.
Carter, R.W., and Davidian, Jacob, 1968, General procedure for gaging streams: U.S. Geological Survey Techniques of Water-Resources Investigations, book 3, chap. A6, 13 p.
Edwards, T.K., and Glysson, G.D., 1988, Field methods for measurement of fluvial sediment: U.S. Geological Sur vey Open-File Report 86-531, 188 p.
Erdmann, D.E., 1991, Quality assurance requirements for water-quality laboratories providing analytical services for the U.S. Geological Survey: U.S. Geological Survey Open-File Report 91-222, 8 p.
Fishman, M.J., 1993, Methods of analysis by the U.S. Geo logical Survey National Water-Quality Labora tory methods for the determination of inorganic and organic constituents in water and fluvial sediments: U.S. Geological Survey Open-File Report 93-125, 217 p.
Fishman, M.J., Raese, J.W, Gerlitz, C.N., and Husband, R.A., 1994, U.S. Geological Survey approved inorganic and organic methods for the analysis of water and flu
vial sediment, 1954-94: U.S. Geological Survey Open-File Report 94-351, 55 p.
Friedman, L.C., and Erdmann, D.E., 1982, Quality assur ance practices for the chemical and biological analyses of water and fluvial sediments: U.S. Geological Survey Techniques of Water-Resources Investigations, book 5, chap. A6, 181 p.
Guy, H.P., and Norman, V.M., 1970, Field methods for mea surement of fluvial sediment: U.S. Geological Survey Techniques of Water-Resources Investigations, book 3, chap. C2, 59 p.
Horowitz, A.J., Demas, C.R., Fitzgerald, K.K., Miller, T.L., and Rickert, D.A., 1994, U.S. Geological Survey proto col for the collection and processing of surface-water samples for the subsequent determination of inorganic constituents in filtered water: U.S. Geological Survey Open-File Report 94-539, 57 p.
Kennedy, E.J., 1983, Computation of continuous records of streamflow: U.S. Geological Survey Techniques of Water-Resources Investigations, book 3, chap. A13, 53 p.
1984, Discharge ratings at gaging stations: U.S. Geo logical Survey Techniques of Water-Resources Investi gations, book 3, chap. A10, 59 p.
Koterba, M.T., Wilde, F.D., and Lapham, W.W., 1995,Ground-water data-collection protocols and procedures for the National Water-Quality Assessment Program collection and documentation of water-quality samples and related data: U.S. Geological Survey Open-File Report 95-399, 113 p.
Markovchick, D.J., Lewis, J.A., Brenton, R.W., Iverson, J.L., and Wharry, H.L., 1994, Methods of analysis by the U.S. Geological Survey National Water-Quality Laboratory determination of triazine and other nitro gen containing compounds by gas chromatography with nitrogen phosphorus detectors: U.S. Geological Survey Open-File Report 94-37, 17 p.
Myers, N.C., Hargadine, G.D., and Gillespie, J.D., 1996, Hydrologic and chemical interaction of the Arkansas River and the Equus beds aquifer between Hutchinson and Wichita, south-central Kansas: U.S. Geological Survey Water-Re sources Investigations Report 95-4191, 100 p.
Pritt, J.W, and Raese, J.W, 1995, Quality assurance/quality control manual, National Water-Quality Laboratory: U.S. Geological Survey Open-File Report 95-443, 35 p.
Puls, R.W., and Barcelona, M.J., 1996, Low-flow (minimal drawdown) ground-water sampling procedures: U.S. Environmental Protection Agency, Ground Water Issue, EPA 540/S-95/504, April 1996, 12 p.
Rose, D.L., and Schroeder, M.P., 1995, Methods of analysis by the U.S. Geological Survey National Water-Quality Laboratory determination of volatile organic com pounds in water by purge and trap capillary gas chroma-
26 Baseline Data-Collection and Quality-Control Protocols and Procedures for the Equus Beds Ground-Water Recharge Demonstration Project Near Wichita, Kansas, 1995-96
tography/mass spectrometry: U.S. Geological Survey Open-File Report 94-708, 26 p.
Sandstrom, M.W., Wydoski, D.S., Schroeder, M.R., Zam- boni, J.L., and Foreman, J.T., 1992, Methods of analy sis by the U.S. Geological Survey National Water- Quality Laboratory determination of organonitrogen herbicides in water by solid-phase extraction and capil lary-column gas chromatography/mass spectrometry with selected-ion monitoring: U.S. Geological Survey Open-File Report 91-519, 26 p.
Stallman, R.W., 1971, Aquifer-test design, observation, and data analysis: U.S. Geological Survey Techniques of Water-Resources Investigations, book 3, chap. Bl, 26 p.
Thurman, E.M., Meyer, M.T., Pomes, M.L., Perry, C.A., and Schwab, A.P., 1990, Enzyme-linked immunosorbent assay compared with gas chromatography/mass spec trometry for the determination of triazine herbicides in water: Analytical Chemistry, v. 62, no. 18, p. 2043-2048.
U.S. Environmental Protection Agency, 1995, Protection of environment: Code of Federal Regulations Title 40, parts 87-149, 1346 p.
Ward, J.R., and Harr, C.A., eds., 1990, Methods for collec tion and processing of surface-water and bed-material samples for physical and chemical analysis: U.S. Geo logical Survey Open-File Report 90-140, 79 p.
Wells, F.C., Gibbons, W.J., and Dorsey, M.E., 1990, Guide lines for collection and field analysis of water-quality samples from streams in Texas: U.S. Geological Survey Open-File Report 90-127, 79 p.
Werner, S.L., Burkhardt, M.R., and DeRusseau, S.N., 1996, Methods of analysis by the U.S. Geological Survey National Water-Quality Laboratory determination of pesticides in water by carbopak-B solid-phase extrac tion and high-performance liquid chromatography: U.S. Geological Survey Open-File Report 96-216, 42 p.
Werner, S.L., and Johnson, S.M., 1994, Methods of analysis by the U.S. Geological Survey National Water-Quality Laboratory determination of selected carbamate pes ticides in water by high-performance liquid chromatog raphy: U.S. Geological Survey Open-File Report 93-650, 29 p.
Wershaw, R.L., Fishman, M.J., Grabbe, R.R., and Lowe, L.E., 1987, Methods for the determination of organic substances in water and fluvial sediments: U.S. Geolog ical Survey Techniques of Water-Resources Investiga tions, book 5, chap. A3, 80 p.
Wood, W.W., 1976, Guidelines for collection and field anal ysis of ground-water samples for selected unstable con stituents: U.S. Geological Survey Techniques of Water-Resources Investigations, book 1, chap. D2, 24 p.
References Cited 27

28 Baseline Data-Collection and Quality-Control Protocols and Procedures for the Equus Beds Ground-Water Recharge Demonstration Project Near Wichita, Kansas 1995-96
APPENDIX A
Supplemental information related to sampling sites, sample analytes, sampling frequency and sample preservation,and holding times.
Appendix A
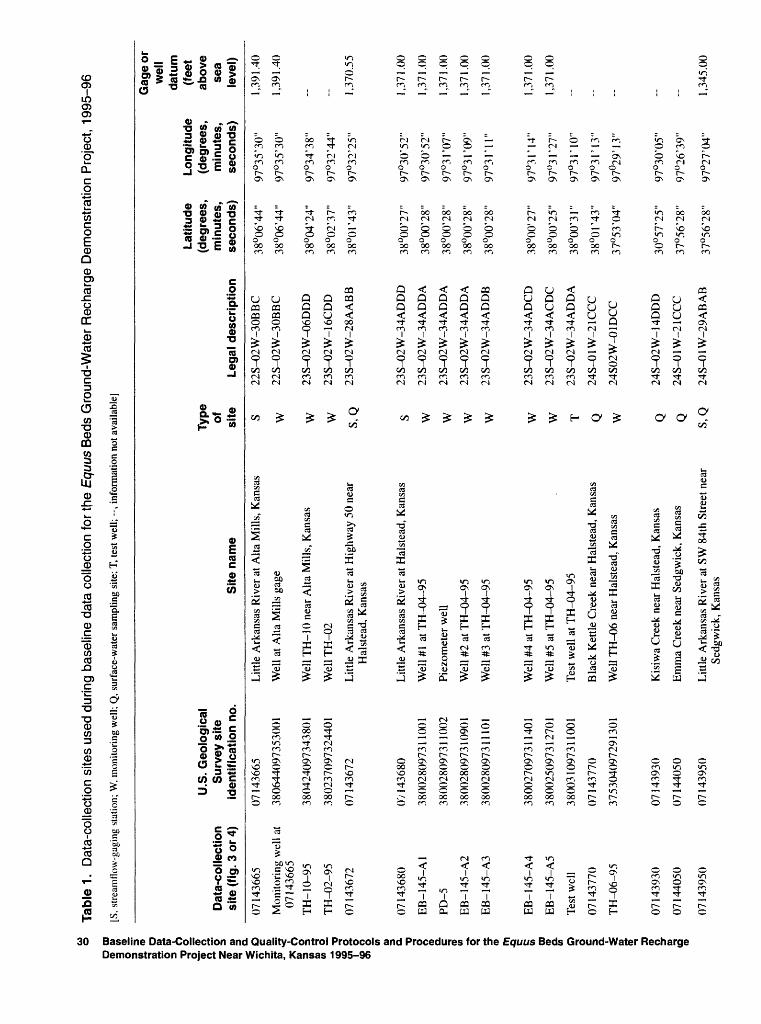
COopm
r.oCD'oolc
24-«CO
0ECDQCDO)
Water Rechai
73ca0 ^o 1C/J 'S a >0) f
SQ c3 oO" 1
LU 10> <££- "jlJ_ 1o ="* uC *O ^s 2 303 E-'
laseline data coll e-water sampling site;
tl O
0) tc i*»_3 O^73 ^r73 «
i C3 -cco 3
.t± 0co gC >'O >'o g_CD ~o ~O ao
i e_CO "SoCO ooLJ ^
c* 10) SjQ £
o _ E *- » c-a, = § oJ > <o ^jen 2 +- ® 2 5 >Q 73 ^" <0
o «f w "w12 $ 5? l>o>c g5r jjj * fl*Jj S C 0)
o> co /A" co8 Hi T^"S* 5*
"S 2^ .£ o vi "c? Q)-J 7i t w
c.0
Q. ~ U (0 0) o
To en0) ^
0) v§! "S "|2* w
0)E(0c
w
Q
O fl) c'&:S oo «> .2o afToS $ ua £ ^aiSl_; » 3 S
C IT'.2 ^' ^ AO ° J) COo chV£S Q)
Q 'io
00 un 0000000
en en rn en en en en en en en en
OO ooTfin oieNr^ON rt r- b en ?n inos^- enen enTfo4 <ntnOO- O4 OenO iinin TfcNoi b b Z- ^-^L.^^ bvor^enen en en en en m m en m rn m en m cN enoio4oo ooo ooooo ooooo oooOs Os Os ON Os Os Os ON ON ON ON Os Os Os Os ON ON ON
^t^fr ^fr^en F^oooooooo F~ in - en rf inoooo'TTf O4enrf O4O4O4O4O4 O4O4en^fO O4O4O4NO NO "^ O4 « O O O O O O O O ' m ^ NO NOoo ooo ooooo oooo«n <n«n«noo ooo ooooo ooooo ooo oooo oooooo oooooooooo oooooooor^ Or~r~enen en en en en en en en m enenenenen enenen
CQ Q<<<CQ QU< CQ UU QQca QQQQQ UQQu r QU< CQCQ QQ< QQQQQ QUQU^ QUCQ CQCQQU< <<<<< <<<U^ QU<OO NONOOO rt^J-TfrtTf TfTj-Tf Q "t ' ON
eneno 7 rr ^^^^^ ^^^^ 7^7 £££££ ^^^^^ ^^^^J ^^^O4O) O4O4O4 CNO4O4OJO4 O4O4O4^H?f (NJ^H^HOOOOO OOOOO 000004 000onon cooooo onoocoonon ononononon onononO4 O4 en en en en en en en en en en en ^ ^t" "^J" "^J" ^t"0404 0404O4 O4O4O4O4O4 O4O4O4O4O4 O4O4O4
.^.Q i^^-- -^ - o*^ ^ ^^. on^^^^ ^^HCX^ acy.^^^oo on
r . 03« u" T Ut c/5 ^ C
c S S . S S « e c e S*"0£ i3=«;sSs ^ * * « s s M^S>>t3 -aSeSj="5^5^ ^C^kyiS^^g>4> U m fv^ &C rjT
,»* * t ^?5 c^ t^ * ^^^ ^2 .2? 13 13 . -a -g >< ̂ HH T^ T* T3 03 .^M "^ J- a. K^U^OO
'osu'^'os « in^^~^P^i a i n i ? ^ ^ n 5 1 ? s 1 111 ! 11 1 I 1 f 1 ! H <§ S ! i 15c/3 ^ *~ «5_r c«K%KK BC BC f-i T, ^i>>c«-^oi22s§-o3 s t: S t: t: t t a 3 $ 8 « s-g |<i^|l 5 2 | 2 2 I^^SS ^u|| ^ 5 S S 2s 2?|^S ^l!^£ 1 1 2S£2 O U U i^ ^ OQ)4)O ^^)V503^) *^fl 4^
hj (^ !^^ (^ hj bp^ (^ fi^ ^^ (^ i^^ !^^ E^ CQ !^^ -^ \ ~\ hj
ooo oooo ooo oOoOTf O O ON . Tfr^O enenen^f _^,o ,04 i i*n T^ o4 ~~* *~ * * * *~* * * * * * * ONenenen enenenen enenen O4r~r~t~~ t~~r~t~~r~ t~~t~~t~~ r~
mOs ONONO4 OOsONOsOs OsOsOsOOs OOONOO ooi~^ oooooo oooi~^o enmmNO^ ^ft~~NO \ooooooooo t~~ <n t~~ rf osoos en-^ O4enen eno4O4O4O4 o4O4eneno enrfenTf\o TfO4^ TfOOOO OOO^en 'f'^'f
i~^oo oooor^ ^oooooooo 0000001^1^ i~~r~i~~Oen enenO Oenenenen enenenOen OOO
rt"u
f ' 04 en rt moo'n i/i i/-\ <£<£<!<!<! <n'^S'SoNONfN ^i ii ii O^ oooellS^^S el^SS SSIE^ g§§T*S~iT Tf rf 7'/?77 77 "^i ttt^^oKI^ fCcQQCQCQ CQCQuf^I ^ f^o2 HHo oWCuWW pJWHoH ooo
30 Baseline Data-Collection and Quality-Control Protocols and Procedures for the Equus Beds Ground-Water Recharge Demonstration Project Near Wichita, Kansas 1995-96
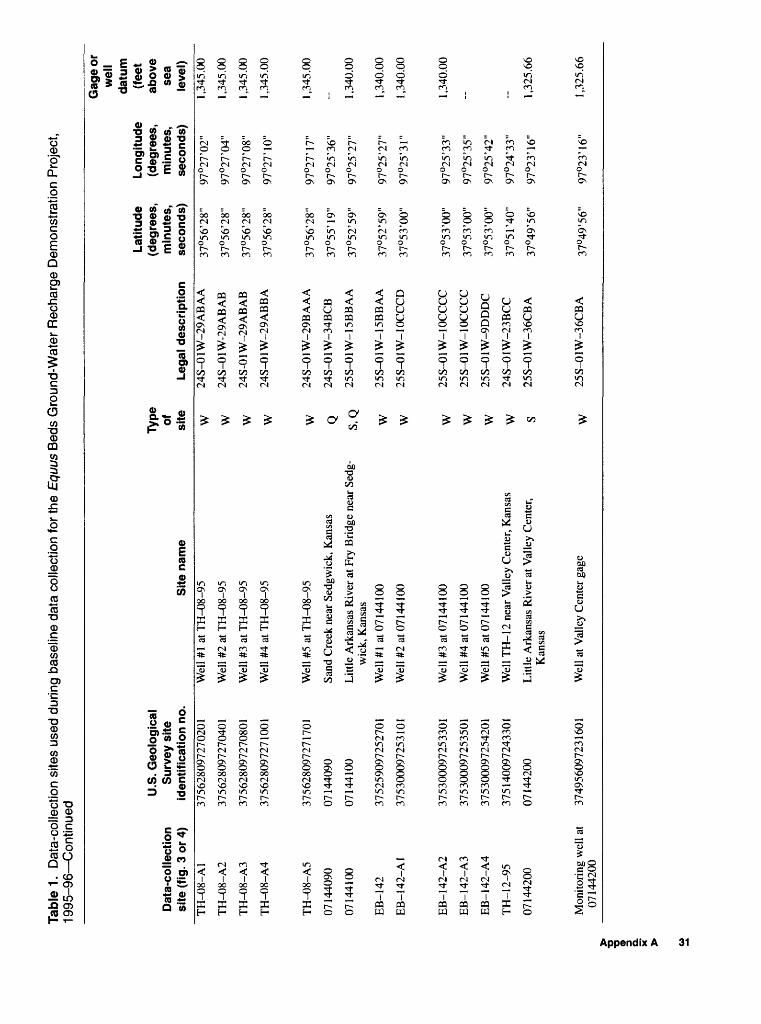
Tabl
e 1.
D
ata-
colle
ctio
n si
tes
used
dur
ing
base
line
data
col
lect
ion
for
the
EQUU
S B
eds
Gro
und-
Wat
er R
echa
rge
Dem
onst
ratio
n P
roje
ct,
1995
-96
Con
tinue
d
Dat
a-co
llect
ion
site
(fig
. 3 o
r 4)
TH
-08-
A1
TH
-08-
A2
TH
-08-
A3
TH
-08-
A4
TH
-08-
A5
0714
4090
0714
4100
EB
-142
EB
-142
-A1
EB
-142
-A2
EB
-142
-A3
EB
-142
-A4
TH
-12-
95
0714
4200
Mon
itori
ng w
ell
at
0714
4200
(D a
S'
U.S
. Geo
logi
cal
Surv
ey s
ite
iden
tific
atio
n no
.37
5628
0972
7020
1
3756
2809
7270
401
3756
2809
7270
801
3756
2809
7271
001
3756
2809
7271
701
0714
4090
0714
4100
3752
5909
7252
701
3753
0009
7253
101
3753
0009
7253
301
3753
0009
7253
501
3753
0009
7254
201
3751
4009
7243
301
0714
4200
3749
5609
7231
601
Site
nam
eW
ell
#1 a
t TH
-08-
95
Wel
l #2
at T
H-0
8-95
Wel
l #3
at T
H-0
8-95
Wel
l #4
at T
H-0
8-95
Wel
l #5
at T
H-0
8-95
Sand
Cre
ek n
ear
Sedg
wic
k, K
ansa
s
Litt
le A
rkan
sas
Riv
er a
t Fry
Bri
dge
near
Sed
g
wic
k, K
ansa
s
Wel
ltfl
at 0
7 14
4100
Wel
l #2
at 0
7 14
4 10
0
Wel
l #3
at 0
7 14
4 10
0
Wel
l #4
at 0
7 14
4 10
0
Wel
l #5
at 0
7 14
4 10
0
Wel
l T
H-1
2 ne
ar V
alle
y C
ente
r, K
ansa
s
Litt
le A
rkan
sas
Riv
er a
t Val
ley
Cen
ter,
K
ansa
s
Wel
l at
Val
ley
Cen
ter
gage
Type
of
si
te W w w w w Q S,Q w w w w w w s w
Lega
l de
scri
ptio
n24
S-0
1W-2
9AB
AA
24S-
01W
-29A
BA
B
24S
-01W
-29A
BA
B
24S
-01W
-29A
BB
A
24S
-01W
-29B
AA
A
24S
-01W
-34B
CB
25S
-01W
-15B
BA
A
25S
-01W
-15B
BA
A
25S
-01W
-10C
CC
D
25S
-01W
-10C
CC
C
25S
-01W
-10C
CC
C
25S
-01W
-9D
DD
C
24S
-01W
-23B
CC
25S
-01W
-36C
BA
25S
-01W
-36C
BA
Lat
itude
(d
egre
es,
min
utes
, se
cond
s)37
°56'
28"
37°5
6'28
"
37°5
6'28
"
37°5
6'28
"
37°5
6'28
"
37°5
5'19
"
37°5
2'59
"
37°5
2'59
"
37°5
3'00
"
37°5
3'00
"
37°5
3'00
"
37°5
3'00
"
37°5
1'40
"
37°4
9'56
"
37°4
9'56
"
Lon
gitu
de
(deg
rees
, m
inut
es,
seco
nds)
97°2
7'02
"
97°2
7'04
"
97°2
7'08
"
97°2
7'10
"
97°2
7'17
"
97°2
5'36
"
97°2
5'27
"
97°2
5'27
"
97°2
5'31
"
97°2
5'33
"
97°2
5'35
"
97°2
5'42
"
97°2
4'33
"
97°2
3'16
"
97°2
3'16
"
Gag
e or
w
ell
datu
m(f
eet
abov
e se
a le
vel)
1,34
5.00
1,34
5.00
1,34
5.00
1,34
5.00
1,34
5.00
-- 1,34
0.00
1,34
0.00
1,34
0.00
1,34
0.00
- - 1,32
5.66
1,32
5.66
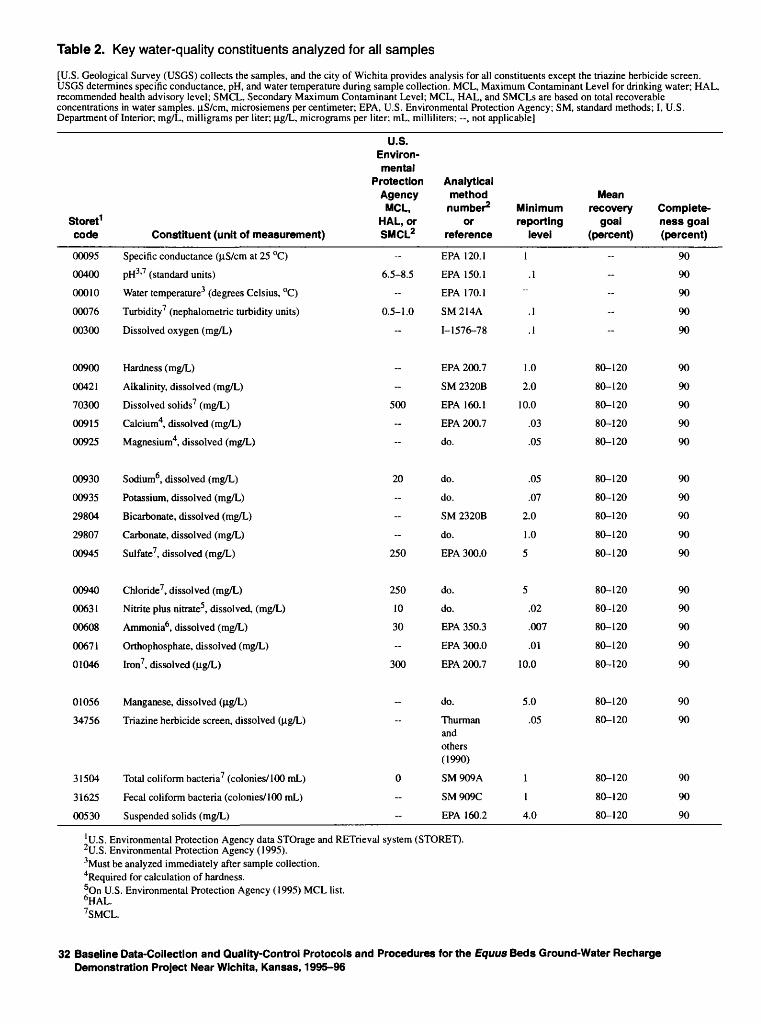
Table 2. Key water-quality constituents analyzed for all samples
[U.S. Geological Survey (USGS) collects the samples, and the city of Wichita provides analysis for all constituents except the triazine herbicide screen. USGS determines specific conductance, pH, and water temperature during sample collection. MCL, Maximum Contaminant Level for drinking water; HAL, recommended health advisory level; SMCL, Secondary Maximum Contaminant Level; MCL, HAL, and SMCLs are based on total recoverable concentrations in water samples. nS/cm, microsiemens per centimeter; EPA, U.S. Environmental Protection Agency; SM, standard methods; I, U.S. Department of Interior; mg/L, milligrams per liter; ng/L, micrograms per liter; mL, milliliters; -, not applicable]
Storet1 code
00095
00400
00010
00076
00300
00900
00421
70300
00915
00925
00930
00935
29804
29807
00945
00940
00631
00608
00671
01046
01056
34756
31504
31625
00530
Constituent (unit of measurement)
Specific conductance (nS/cm at 25 °C)
pH3'7 (standard units)
Water temperature3 (degrees Celsius, °C)
Turbidity7 (nephalometric turbidity units)
Dissolved oxygen (mg/L)
Hardness (mg/L)
Alkalinity, dissolved (mg/L)
Dissolved solids7 (mg/L)
Calcium4, dissolved (mg/L)
Magnesium4, dissolved (mg/L)
Sodium , dissolved (mg/L)
Potassium, dissolved (mg/L)
Bicarbonate, dissolved (mg/L)
Carbonate, dissolved (mg/L)
Sulfate7, dissolved (mg/L)
Chloride7, dissolved (mg/L)
Nitrite plus nitrate5 , dissolved, (mg/L)
Ammonia6, dissolved (mg/L)
Orthophosphate, dissolved (mg/L)
Iron7, dissolved (ng/L)
Manganese, dissolved (Hg/L)
Triazine herbicide screen, dissolved (ng/L)
Total coliform bacteria7 (colonies/ 100 mL)
Fecal coliform bacteria (colonies/ 100 mL)
Suspended solids (mg/L)
U.S. Environmental
Protection Agency MCL,
HAL, or SMCL2
--
6.5-8.5
--
0.5-1.0
--
-
-
500
-
-
20
-
-
-
250
250
10
30
--
300
-
0
---
Analytical method number2
or reference
EPA 120.1
EPA 150.1
EPA 170.1
SM214A
1-1576-78
EPA 200.7
SM 2320B
EPA 160.1
EPA 200.7
do.
do.
do.
SM 2320B
do.
EPA 300.0
do.
do.
EPA 350.3
EPA 300.0
EPA 200.7
do.
Thurman andothers(1990)
SM909A
SM909C
EPA 160.2
Minimum reporting
level
1.1
--
.1
.1
1.0
2.0
10.0
.03
.05
.05
.07
2.0
1.0
5
5
.02
.007
.01
10.0
5.0
.05
1
1
4.0
Mean recovery
goal (percent)
----
--
-
80-120
80-120
80-120
80-120
80-120
80-120
80-120
80-120
80-120
80-120
80-120
80-120
80-120
80-120
80-120
80-120
80-120
80-120
80-120
80-120
Complete ness goal (percent)
90
90
90
90
90
90
90
90
90
90
90
90
90
90
90
90
90
90
90
90
90
90
90
90
90
'U.S. Environmental Protection Agency data STOrage and RETrieval system (STORET).2U.S. Environmental Protection Agency (1995).3Must be analyzed immediately after sample collection.4Required for calculation of hardness.5On U.S. Environmental Protection Agency (1995) MCL list.6HAL.7SMCL.
32 Baseline Data-Collection and Quality-Control Protocols and Procedures for the Equus Beds Ground-Water Recharge Demonstration Project Near Wichita, Kansas, 1995-96
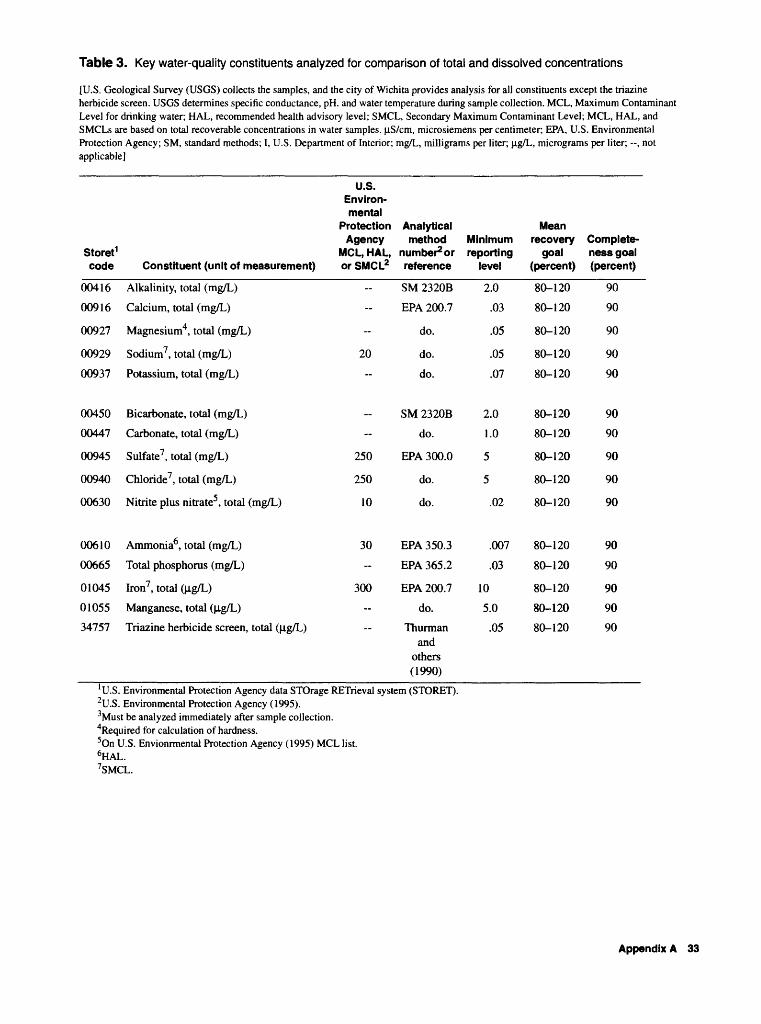
Table 3. Key water-quality constituents analyzed for comparison of total and dissolved concentrations
[U.S. Geological Survey (USGS) collects the samples, and the city of Wichita provides analysis for all constituents except the triazine herbicide screen. USGS determines specific conductance, pH. and water temperature during sample collection. MCL, Maximum Contaminant Level for drinking water; HAL, recommended health advisory level; SMCL, Secondary Maximum Contaminant Level; MCL, HAL, and SMCLs are based on total recoverable concentrations in water samples. uS/cm, microsiemens per centimeter; EPA, U.S. Environmental Protection Agency; SM, standard methods; I, U.S. Department of Interior; mg/L, milligrams per liter; ug/L, micrograms per liter; , not applicable]
Storet1 code
00416
00916
00927
00929
00937
00450
00447
00945
00940
00630
00610
00665
01045
01055
34757
Constituent (unit of measurement)
Alkalinity, total (mg/L)
Calcium, total (mg/L)
Magnesium4, total (mg/L)
Sodium7, total (mg/L)
Potassium, total (mg/L)
Bicarbonate, total (mg/L)
Carbonate, total (mg/L)
Sulfate7 , total (mg/L)
Chloride7, total (mg/L)
Nitrite plus nitrate5 , total (mg/L)
Ammonia6, total (mg/L)
Total phosphorus (mg/L)
Iron7, total (|ig/L)
Manganese, total (|ig/L)
Triazine herbicide screen, total (fig/L)
U.S. Environ mental
Protection Analytical Agency method
MCL, HAL, number2 or or SMCL2 reference
SM 2320B
EPA 200.7
do.
20 do.
do.
SM 2320B
do.
250 EPA 300.0
250 do.
10 do.
30 EPA 350.3
EPA 365.2
300 EPA 200.7
do.
Thurman and
others(1990)
Minimum reporting
level
2.0
.03
.05
.05
.07
2.0
1.0
5
5
.02
.007
.03
10
5.0
.05
Mean recovery Complete-
goal ness goal (percent) (percent)
80-120
80-120
80-120
80-120
80-120
80-120
80-120
80-120
80-120
80-120
80-120
80-120
80-120
80-120
80-120
90
90
90
90
90
90
90
90
90
90
90
90
90
90
90
1 U.S. Environmental Protection Agency data STOrage RETrieval system (STORET).2U.S. Environmental Protection Agency (1995).3Must be analyzed immediately after sample collection.4Required for calculation of hardness.5On U.S. Envionrmental Protection Agency (1995) MCL list.6HAL.7SMCL.
Appendix A 33
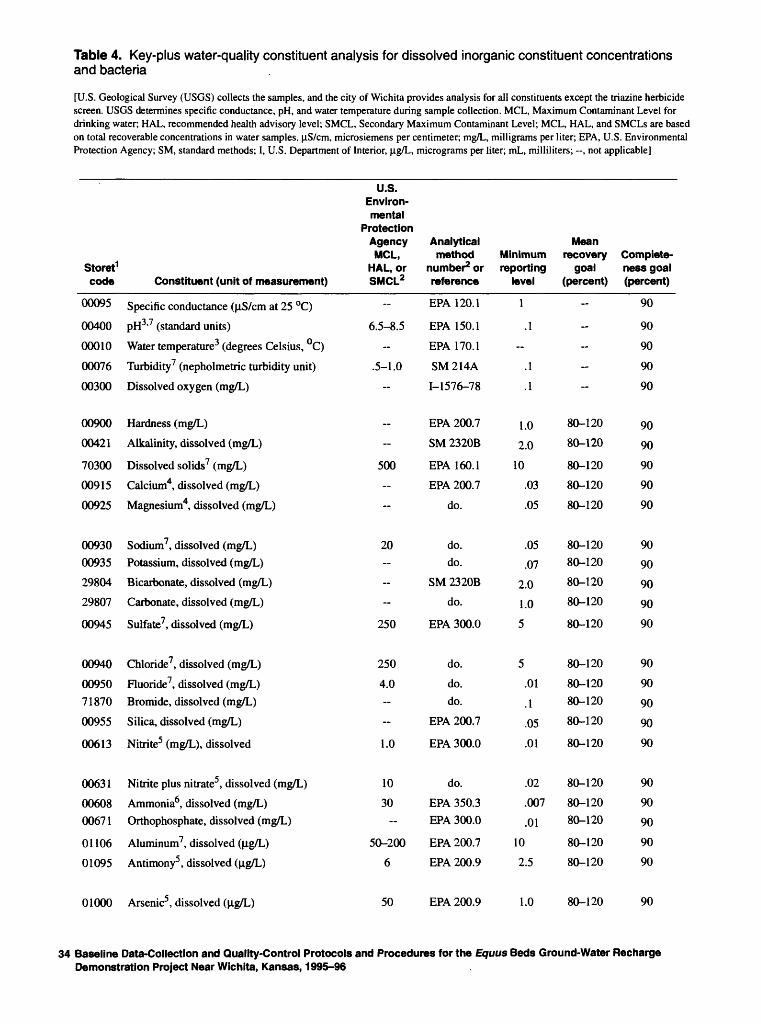
Table 4. Key-plus water-quality constituent analysis for dissolved inorganic constituent concentrations and bacteria
[U.S. Geological Survey (USGS) collects the samples, and the city of Wichita provides analysis for all constituents except the triazine herbicide screen. USGS determines specific conductance, pH, and water temperature during sample collection. MCL, Maximum Contaminant Level for drinking water; HAL, recommended health advisory level; SMCL, Secondary Maximum Contaminant Level; MCL, HAL, and SMCLs are based on total recoverable concentrations in water samples. uS/cm, microsiemens per centimeter; mg/L, milligrams per liter; EPA, U.S. Environmental Protection Agency; SM, standard methods; I, U.S. Department of Interior, Jig/L, micrograms per liter; mL, milliliters; , not applicable]
Storet1
code
00095
00400
00010
00076
00300
00900
00421
70300
00915
00925
0093000935
29804
29807
00945
00940
0095071870
00955
00613
00631
0060800671
01106
01095
Constituent (unit of measurement)
Specific conductance (jrS/cm at 25 °C)
pH3'7 (standard units)
Water temperature3 (degrees Celsius, °C)
Turbidity7 (nepholmetric turbidity unit)
Dissolved oxygen (mg/L)
Hardness (mg/L)
Alkalinity, dissolved (mg/L)
Dissolved solids7 (mg/L)
Calcium4, dissolved (mg/L)
Magnesium4, dissolved (mg/L)
Sodium7, dissolved (mg/L)Potassium, dissolved (mg/L)
Bicarbonate, dissolved (mg/L)
Carbonate, dissolved (mg/L)
Sulfate7, dissolved (mg/L)
Chloride7, dissolved (mg/L)
Fluoride7, dissolved (mg/L)Bromide, dissolved (mg/L)
Silica, dissolved (mg/L)
Nitrite5 (mg/L), dissolved
Nitrite plus nitrate5 , dissolved (mg/L)
Ammonia6, dissolved (mg/L)Orthophosphate, dissolved (mg/L)
Aluminum7, dissolved (ng/L)
Antimony5 , dissolved (ng/L)
U.S. Environ mental
ProtectionAgency MCL,
HAL, or SMCL2
--
6.5-8.5
--
.5-1.0
-
-
-
500--
--
20--
-
--
250
250
4.0--
--
1.0
10
30--
50-200
6
Analytical method
number2 or reference
EPA 120.1
EPA 150.1
EPA 170.1
SM 214A
1-1576-78
EPA 200.7
SM 2320B
EPA 160.1
EPA 200.7
do.
do.do.
SM 2320B
do.
EPA 300.0
do.
do.do.
EPA 200.7
EPA 300.0
do.
EPA 350.3EPA 300.0
EPA 200.7
EPA 200.9
Minimum reporting
level
1
.1
--
.1
.1
1.0
2.0
10
.03
.05
.05
.07
2.0
1.0
5
5
.01
.1
.05
.01
.02
.007
.01
10
2.5
Mean recovery Compiete-
goal ness goal (percent) (percent)
--
--
~
--
--
80-120
80-120
80-120
80-120
80-120
80-12080-120
80-120
80-120
80-120
80-120
80-12080-120
80-120
80-120
80-120
80-12080-120
80-120
80-120
90
90
90
90
90
90
90
90
90
90
90
90
90
90
90
90
90
90
90
90
90
90
90
90
90
01000 Arsenic5 , dissolved (Hg/L) 50 EPA 200.9 1.0 80-120 90
34 Baseline Data-Collection and Quality-Control Protocols and Procedures for the Equus Beds Ground-Water Recharge Demonstration Project Near Wichita, Kansas, 1995-96
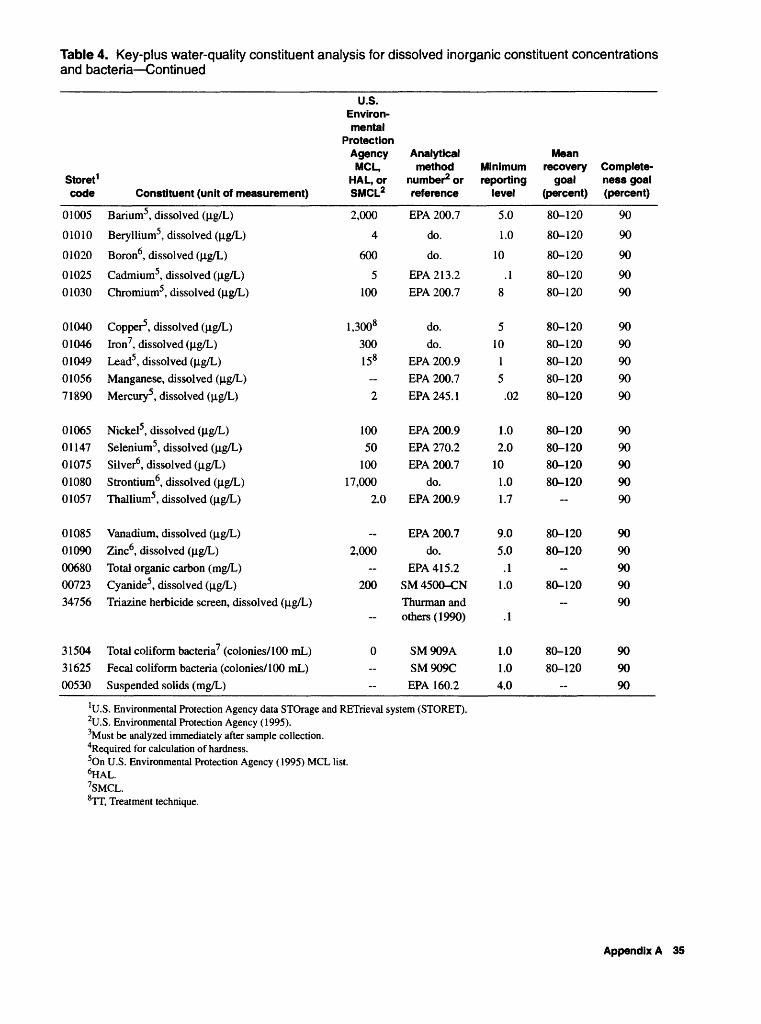
Table 4. Key-plus water-quality constituent analysis for dissolved inorganic constituent concentrations and bacteria Continued
Storet1code
01005
01010
01020
0102501030
0104001046010490105671890
0106501147010750108001057
0108501090006800072334756
315043162500530
Constituent (unit of measurement)
Barium5 , dissolved (|J.g/L)
Beryllium5 , dissolved (|J.g/L)
Boron6, dissolved (M£/L)
Cadmium5, dissolved (|J.g/L)Chromium5, dissolved (|J.g/L)
Copper5 , dissolved (|J.g/L)Iron7, dissolved (jig/L)Lead5 , dissolved (jig/L)Manganese, dissolved (jig/L)Mercury5 , dissolved (|J.g/L)
Nickel5 , dissolved (jig/L)Selenium5, dissolved (|ig/L)Silver6 , dissolved (|J.g/L)Strontium6, dissolved (jig/L)Thallium5 , dissolved (|J.g/L)
Vanadium, dissolved (Hg/L)Zinc6, dissolved (jig/L)Total organic carbon (mg/L)Cyanide5 , dissolved (|J.g/L)Triazine herbicide screen, dissolved (|J.g/L)
Total coliform bacteria7 (colonies/ 100 mL)Fecal coliform bacteria (colonies/ 100 mL)Suspended solids (mg/L)
U.S. Environ mental
ProtectionAgencyMCL,
HAL, orSMCL2
2,000
4
600
5100
1,3008300158
~
2
10050
10017,000
2.0
__
2,000
200
0----
Analyticalmethod
number2 orreference
EPA 200.7
do.
do.
EPA 213.2EPA 200.7
do.do.
EPA 200.9EPA 200.7EPA 245.1
EPA 200.9EPA 270.2EPA 200.7
do.EPA 200.9
EPA 200.7do.
EPA 41 5.2SM4500-CNThurmanandothers (1990)
SM909ASM909C
EPA 160.2
Minimumreporting
level
5.0
1.0
10
.18
510
15
.02
1.02.0
101.01.7
9.05.0
.11.0
.1
1.01.04.0
Meanrecovery
goal(percent)
80-120
80-120
80-120
80-12080-120
80-12080-12080-12080-12080-120
80-12080-12080-12080-120
~
80-12080-120
-
80-120-
80-12080-120
-
Completeness goal(percent)
90
90
90
9090
9090909090
9090909090
9090909090
909090
'U.S. Environmental Protection Agency data STOrage and RETrieval system (STORET).2U.S. Environmental Protection Agency (1995).3Must be analyzed immediately after sample collection.4Required for calculation of hardness.5On U.S. Environmental Protection Agency (1995) MCL list.6HAL.7SMCL.8TT, Treatment technique.
Appendix A 35
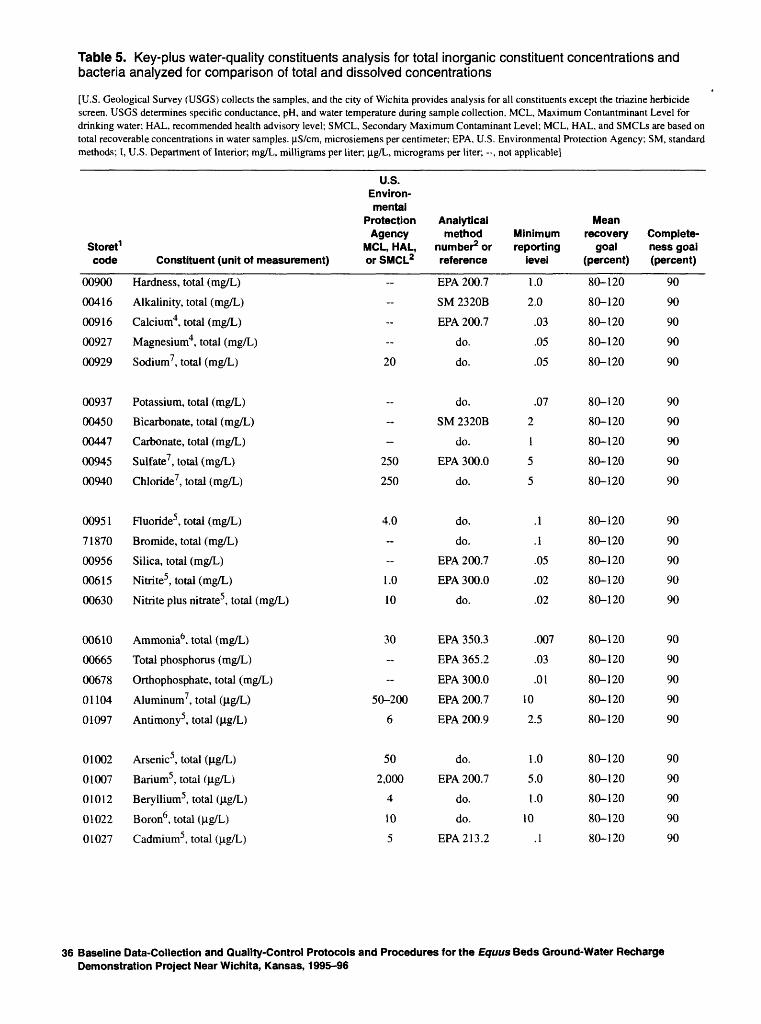
Table 5. Key-plus water-quality constituents analysis for total inorganic constituent concentrations and bacteria analyzed for comparison of total and dissolved concentrations
[U.S. Geological Survey (USGS) collects the samples, and the city of Wichita provides analysis for all constituents except the triazine herbicide screen. USGS determines specific conductance, pH, and water temperature during sample collection. MCL, Maximum Contantminant Level for drinking water; HAL, recommended health advisory level; SMCL, Secondary Maximum Contaminant Level; MCL, HAL, and SMCLs are based on total recoverable concentrations in water samples. |aS/cm, microsiemens per centimeter; EPA, U.S. Environmental Protection Agency; SM, standard methods; I, U.S. Department of Interior; mg/L, milligrams per liter; Jig/L, micrograms per liter; --, not applicable]
Storet1 code
00900
00416
00916
00927
00929
00937
00450
00447
00945
00940
00951
71870
00956
00615
00630
00610
00665
00678
01104
01097
01002
01007
01012
01022
01027
Constituent (unit of measurement)
Hardness, total (mg/L)
Alkalinity, total (mg/L)
Calcium4, total (mg/L)
Magnesium4, total (mg/L)
Sodium7 , total (mg/L)
Potassium, total (mg/L)
Bicarbonate, total (mg/L)
Carbonate, total (mg/L)
Sulfate7 , total (mg/L)
Chloride7, total (mg/L)
Fluoride5, total (mg/L)
Bromide, total (mg/L)
Silica, total (mg/L)
Nitrite5 , total (mg/L)
Nitrite plus nitrate5 , total (mg/L)
Ammonia6, total (mg/L)
Total phosphorus (mg/L)
Orthophosphate, total (mg/L)
Aluminum7 , total (|ig/L)
Antimony5 , total (|ig/L)
Arsenic5 , total (|ig/L)
Barium5, total (|ig/L)
Beryllium5, total (|ig/L)
Boron6 , total (|ig/L)
Cadmium5 , total (|ig/L)
U.S. Environmental
Protection Agency
MCL, HAL, or SMCL2
--
-
--
--
20
--
-
250
250
4.0
-
-
1.0
10
30--
--
50-200
6
50
2,000
4
10
5
Analytical method
number2 or reference
EPA 200.7
SM 2320B
EPA 200.7
do.
do.
do.
SM 2320B
do.
EPA 300.0
do.
do.
do.
EPA 200.7
EPA 300.0
do.
EPA 350.3
EPA 365.2
EPA 300.0
EPA 200.7
EPA 200.9
do.
EPA 200.7
do.
do.
EPA 213.2
Minimum reporting
level
1.0
2.0
.03
.05
.05
.07
2
1
5
5
.1
.1
.05
.02
.02
.007
.03
.01
10
2.5
1.0
5.0
1.0
10
.1
Mean recovery
goal (percent)
80-120
80-120
80-120
80-120
80-120
80-120
80-120
80-120
80-120
80-120
80-120
80-120
80-120
80-120
80-120
80-120
80-120
80-120
80-120
80-120
80-120
80-120
80-120
80-120
80-120
Complete ness goal (percent)
90
90
90
90
90
90
90
90
90
90
90
90
90
90
90
90
90
90
90
90
90
90
90
90
90
36 Baseline Data-Collection and Quality-Control Protocols and Procedures for the Equus Beds Ground-Water Recharge Demonstration Project Near Wichita, Kansas, 1995-96
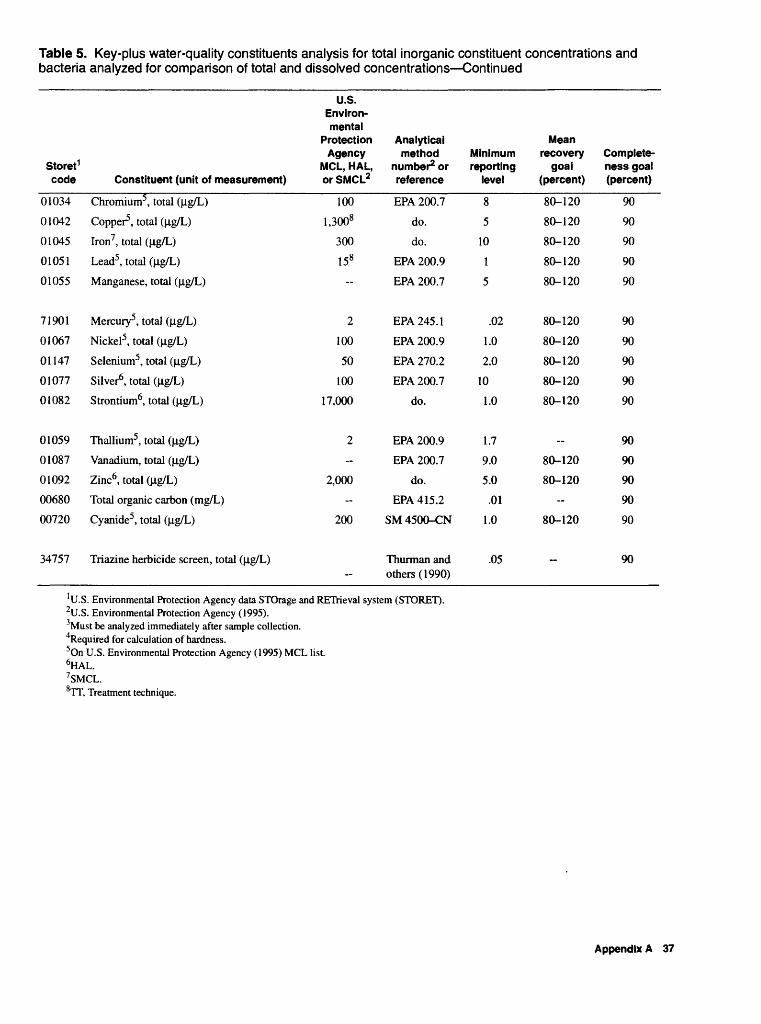
Table 5. Key-plus water-quality constituents analysis for total inorganic constituent concentrations and bacteria analyzed for comparison of total and dissolved concentrations Continued
Storet1 code
01034
01042
01045
01051
01055
71901
01067
01147
01077
01082
01059
01087
01092
00680
00720
34757
Constituent (unit of measurement)
Chromium5 , total (|ig/L)
Copper5 , total (|ig/L)
Iron7, total (|ig/L)
Lead5, total (|ig/L)
Manganese, total (|ig/L)
Mercury5, total (|J.g/L)
Nickel5 , total (|ig/L)
Selenium5, total (|ig/L)
Silver6, total (|ig/L)
Strontium6, total (|ig/L)
Thallium5 , total (|ig/L)
Vanadium, total (|ig/L)
Zinc6, total (ng/L)
Total organic carbon (mg/L)
Cyanide5, total (|ig/L)
Triazine herbicide screen, total (|ig/L)
U.S. Environmental
Protection Agency
MCL, HAL, or SMCL2
100
1,3008
30015 8
--
2
100
50
100
17,000
2--
2,000--
200
Analytical method
number2 or reference
EPA 200.7
do.
do.
EPA 200.9
EPA 200.7
EPA 245.1
EPA 200.9
EPA 270.2
EPA 200.7
do.
EPA 200.9
EPA 200.7
do.
EPA 415.2
SM4500-CN
Thurman andothers (1990)
Minimum reporting
level
8
5
10
1
5
.02
1.0
2.0
10
1.0
1.7
9.0
5.0
.01
1.0
.05
Mean recovery
goal (percent)
80-120
80-120
80-120
80-120
80-120
80-120
80-120
80-120
80-120
80-120
80-120
80-120--
80-120
_
Complete ness goal (percent)
90
90
90
90
90
90
90
90
90
90
90
90
90
90
90
90
'U.S. Environmental Protection Agency data STOrage and RETrieval system (STORET).U.S. Environmental Protection Agency (1995).
3Must be analyzed immediately after sample collection.Required for calculation of hardness.
5On U.S. Environmental Protection Agency (1995) MCL list. 6HAL. 7SMCL.TT, Treatment technique.
Appendix A 37
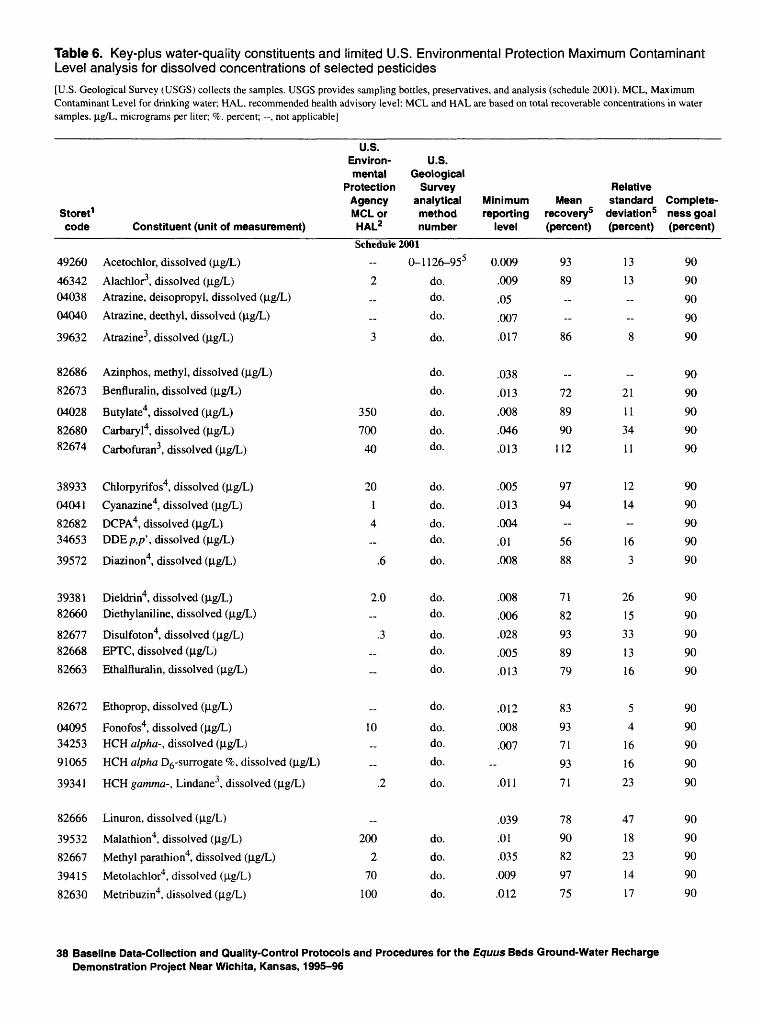
Table 6. Key-plus water-quality constituents and limited U.S. Environmental Protection Maximum Contaminant Level analysis for dissolved concentrations of selected pesticides
[U.S. Geological Survey (USGS) collects the samples. USGS provides sampling bottles, preservatives, and analysis (schedule 2001). MCL, Maximum Contaminant Level for drinking water; HAL, recommended health advisory level; MCL and HAL are based on total recoverable concentrations in water samples. |ig/L, micrograms per liter; %. percent; , not applicable]
Storet1 code Constituent (unit of measurement)
U.S. Environ mental
Protection Agency MCL or HAL2
U.S. Geological
Survey analytical method number
Minimum reporting
level
Mean recovery5 (percent)
Relative standard
deviation5 (percent)
Complete ness goal (percent)
Schedule 2001
49260
4634204038
04040
39632
8268682673
040288268082674
38933040418268234653
39572
3938182660
826778266882663
82672
0409534253
91065
39341
82666
395328266739415
82630
Acetochlor, dissolved (fig/L)
Alachlor3 , dissolved (fig/L)Atrazine, deisopropyl, dissolved (fig/L)Atrazine, deethyl, dissolved (|J.g/L)
Atrazine3 , dissolved (|ig/L)
Azinphos, methyl, dissolved (|ig/L)Benfluralin, dissolved (|ig/L)
Butylate4, dissolved (Hg/L)Carbaryl4, dissolved (|ig/L)
Carbofuran3, dissolved (|ig/L)
Chlorpyrifos4, dissolved (|ig/L)
Cyanazine4, dissolved (|ig/L)DCPA4, dissolved (|ig/L)DDEp,p\ dissolved (|ig/L)
Diazinon4, dissolved (|ig/L)
Dieldrin4, dissolved (|ig/L)Diethylaniline, dissolved (fig/L)
Disulfoton4, dissolved (|ig/L)EPIC, dissolved (|ig/L)Ethalfluralin, dissolved (|ig/L)
Ethoprop, dissolved (fig/L)
Fonofos4, dissolved (|ig/L)HCH alpha-, dissolved (|ig/L)HCH alpha D6-surrogate %, dissolved (|ig/L)
HCH gamma-, Lindane3 , dissolved (|ig/L)
Linuron, dissolved (fig/L)
Malathion4, dissolved (|ig/L)Methyl parathion4, dissolved (|ig/L)
Metolachlor4, dissolved (|ig/L)
Metribuzin4, dissolved (|ig/L)
--
2--
3
35070040
2014
.6
2.0
.3 --
..
10
.2
..
2002
70100
0-1126-955
do.do.
do.
do.
do.do.
do.do.do.
do.do.do.do.
do.
do.do.
do.do.do.
do.
do.do.do.
do.
do.do.do.
do.
0.009.009
.05
.007
.017
.038
.013
.008
.046
.013
.005
.013
.004
.01
.008
.008
.006
.028
.005
.013
.012
.008
.007--
.011
.039
.01
.035
.009
.012
9389--
86
_
72
8990
112
97
94--
5688
71
82
938979
83
9371
93
71
789082
9775
1313--
8
_
21
1134
11
1214--
16
3
2615
331316
54
1616
23
47182314
17
90
90
90
90
90
90
90
90
90
90
90
90
90
90
90
90
90
90
90
90
90
90
90
90
90
90
90
90
90
90
38 Baseline Data-Collection and Quality-Control Protocols and Procedures for the Equus Beds Ground-Water Recharge Demonstration Project Near Wichita, Kansas, 1995-96
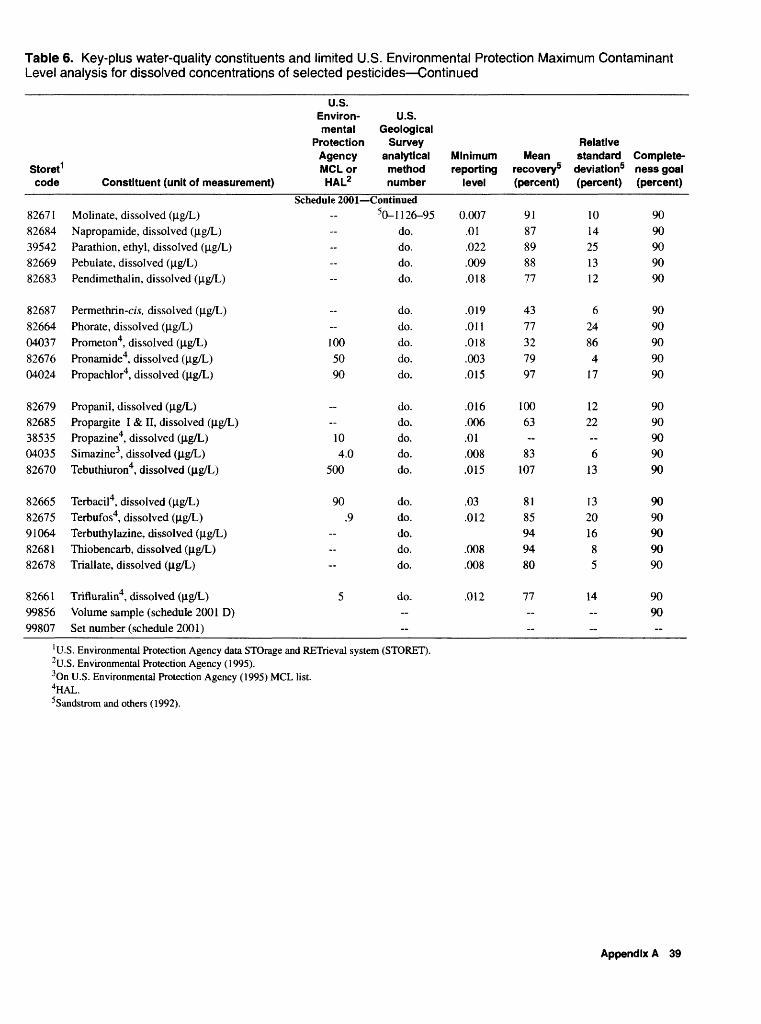
Table 6. Key-plus water-quality constituents and limited U.S. Environmental Protection Maximum Contaminant Level analysis for dissolved concentrations of selected pesticides Continued
Storet1 code Constituent (unit of measurement)
U.S. Environ mental
Protection Agency MCLor HAL2
U.S. Geological
Survey analytical method number
Minimum reporting
level
Mean recovery5 (percent)
Relative standard
deviation5 (percent)
Complete ness goal (percent)
Schedule 2001 Continued8267182684395428266982683
8268782664040378267604024
8267982685385350403582670
8266582675910648268182678
826619985699807
Molinate, dissolved (|ig/L)Napropamide, dissolved (|ig/L)Parathion, ethyl, dissolved (|ig/L)Pebulate, dissolved (|ig/L)Pendimethalin, dissolved (|ig/L)
Permethrin-c/5, dissolved (|ig/L)Phorate, dissolved (|ig/L)Prometon4, dissolved (|ig/L)Pronamide4, dissolved (|ig/L)Propachlor4, dissolved (|ig/L)
Propanil, dissolved (|ig/L)Propargite I & II, dissolved (u,g/L)Propazine4, dissolved (jig/L)Simazine3, dissolved (u,g/L)Tebuthiuron4, dissolved (u,g/L)
Terbacil4, dissolved (|ig/L)Terbufos4, dissolved (Jig/L)Terbuthylazine, dissolved (|ig/L)Thiobencarb, dissolved (u,g/L)Triallate, dissolved (u,g/L)
Trifluralin4, dissolved (ng/L)Volume sample (schedule 2001 D)Set number (schedule 2001)
--------
---
1005090
-104.0
500
90.9
---
5
5o_ 11 26-95do.do.do.do.
do.do.do.do.do.
do.do.do.do.do.
do.do.do.do.do.
do.----
0.007.01.022.009.018
.019
.011
.018
.003
.015
.016
.006
.01
.008
.015
.03
.012
.008
.008
.012
9187898877
4377327997
10063
83107
8185949480
77----
1014251312
624864
17
1222 6
13
13201685
14--
9090909090
9090909090
9090909090
9090909090
9090-
1 U.S. Environmental Protection Agency data STOrage and RETrieval system (STORET).2U.S. Environmental Protection Agency (1995).3On U.S. Environmental Protection Agency (1995) MCL list.4HAL.5Sandstrom and others (1992).
Appendix A 39
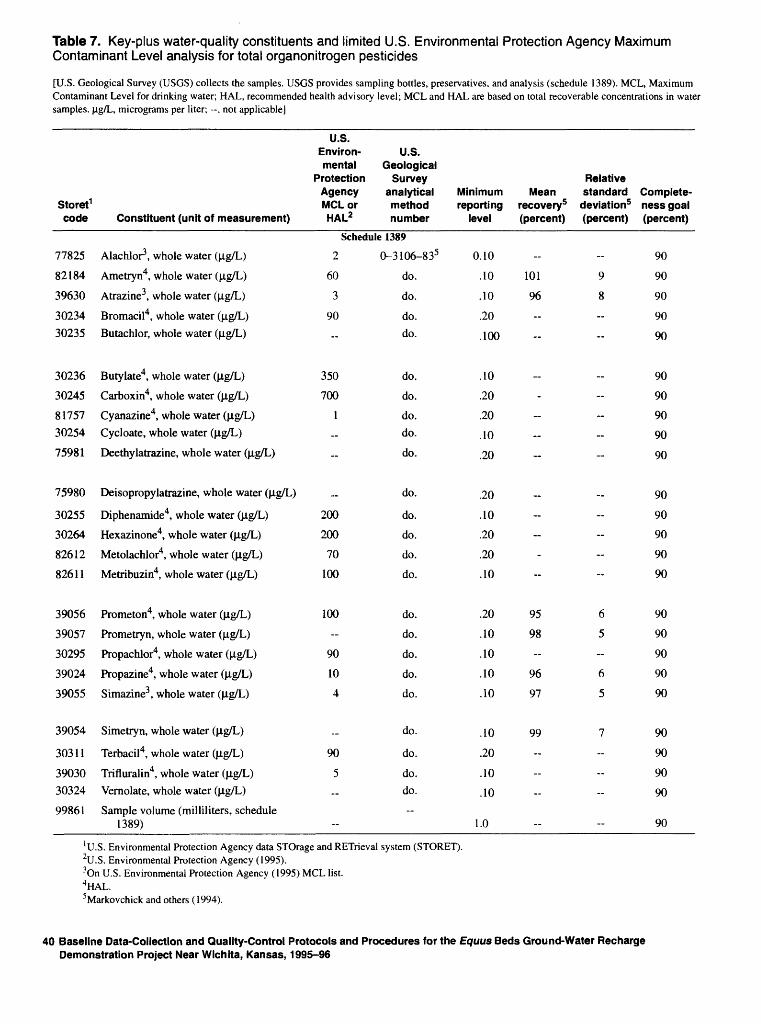
Table 7. Key-plus water-quality constituents and limited U.S. Environmental Protection Agency Maximum Contaminant Level analysis for total organonitrogen pesticides
[U.S. Geological Survey (USGS) collects the samples. USGS provides sampling bottles, preservatives, and analysis (schedule 1389). MCL, Maximum Contaminant Level for drinking water; HAL, recommended health advisory level; MCL and HAL are based on total recoverable concentrations in water samples. Ug/L, micrograms per liter; -. not applicable]
Storet1 code
77825
82184
39630
3023430235
30236
30245
8175730254
75981
75980
30255
30264
82612
82611
39056
39057
30295
39024
39055
39054
30311
3903030324
99861
Constituent (unit of measurement)
Alachlor3 , whole water (|ig/L)
Ametryn4, whole water (|ig/L)
Atrazine3 , whole water (|ig/L)
Bromacil , whole water (|ig/L)Butachlor, whole water (|ig/L)
Butylate4, whole water (^ig/L)
Carboxin4, whole water (^ig/L)
Cyanazine4, whole water (M-g/L)Cycloate, whole water (M-g/L)
Deethylatrazine, whole water (p.g/L)
Deisopropylatrazine, whole water (M-g/L)
Diphenamide4, whole water (M-g/L)
Hexazinone4, whole water ((ig/L)
Metolachlor4, whole water (M-g/L)
Metribuzin4, whole water (M-g/L)
Prometon4 , whole water (M-g/L)
Prometryn, whole water (|ig/L)
Propachlor4, whole water (|ig/L)
Propazine4, whole water (M-g/L)
Simazine3 , whole water (M-g/L)
Simetryn, whole water ((ig/L)
Terbacil4, whole water (p.g/L)
Trifluralin4, whole water (^.g/L)Vernolate, whole water (M-g/L)
Sample volume (milliliters, schedule 1389)
U.S. Environ mental
Protection Agency MCL or HAL2
U.S. Geological
Survey analytical method number
Schedule 1389
2 0-3106-835
60
3
90
-
350
700
1-
-
_
200
200
70
100
100-
90
10
4
_
90
5--
-
do.
do.
do.do.
do.
do.
do.do.
do.
do.
do.
do.
do.
do.
do.
do.
do.
do.
do.
do.
do.
do.do.
Minimum reporting
level
0.10
.10
.10
.20
.100
.10
.20
.20
.10
.20
.20
.10
.20
.20
.10
.20
.10
.10
.10
.10
.10
.20
.10
.10
1.0
Relative Mean standard Complete-
recovery5 deviation5 ness goal (percent) (percent) (percent)
90
101 9 90
96 8 90
90
90
90
90
90
90
90
90
90
90
90
90
95 6 90
98 5 90
90
96 6 90
97 5 90
99 7 90
90
90
90
90
[ U.S. Environmental Protection Agency data STOrage and RETrieval system (STORET).2U.S. Environmental Protection Agency (1995).3On U.S. Environmental Protection Agency (1995) MCL list.4HAL.5 Markovchick and others (1994).
40 Baseline Data-Collection and Quality-Control Protocols and Procedures for the Equus Beds Ground-Water Recharge Demonstration Project Near Wichita, Kansas, 1995-96
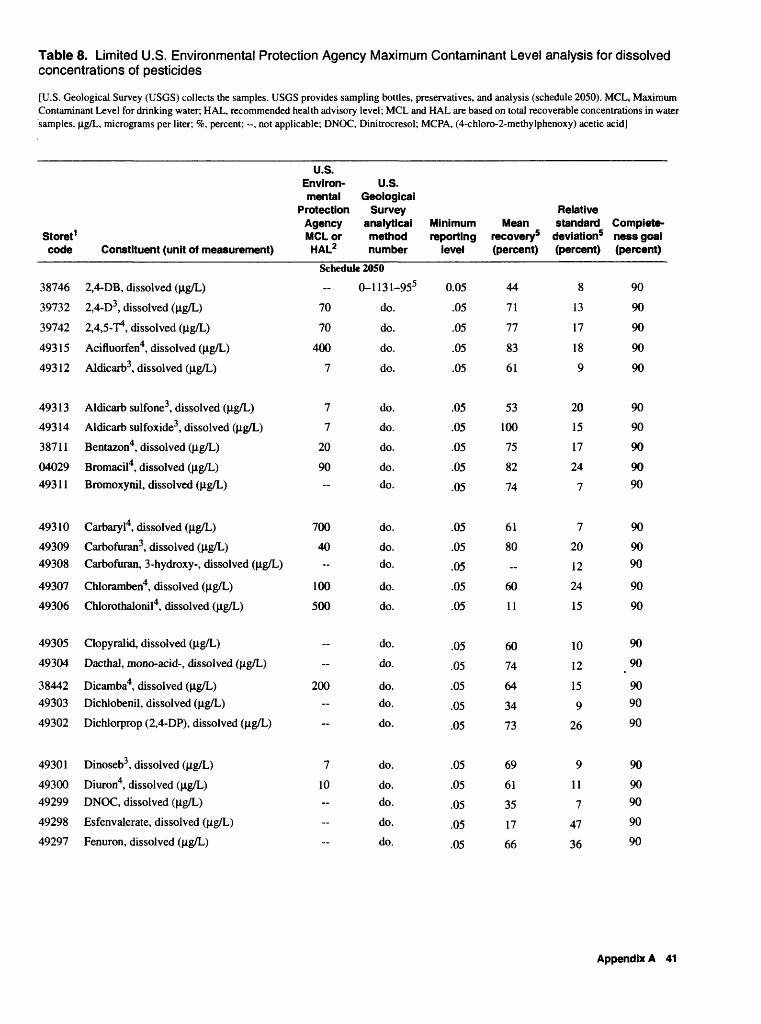
Table 8. Limited U.S. Environmental Protection Agency Maximum Contaminant Level analysis for dissolved concentrations of pesticides
[U.S. Geological Survey (USGS) collects the samples. USGS provides sampling bottles, preservatives, and analysis (schedule 2050). MCL, Maximum Contaminant Level for drinking water; HAL, recommended health advisory level; MCL and HAL are based on total recoverable concentrations in water 'samples. |ig/L, micrograms per liter; %, percent; --, not applicable; DNOC, Dinitrocresol; MCPA, (4-chloro-2-methylphenoxy) acetic acid]
Storet1
code
38746
39732
39742
49315
49312
49313
49314
38711
0402949311
49310
4930949308
49307
49306
49305
49304
3844249303
49302
49301
4930049299
49298
49297
Constituent (unit of measurement)
2,4-DB, dissolved (|ig/L)
2,4-D3 , dissolved (|lg/L)
2,4,5-T4, dissolved (|ig/L)
Acifluorfen4, dissolved (|ig/L)
Aldicarb3, dissolved (|Xg/L)
Aldicarb sulfone3, dissolved (|ig/L)
Aldicarb sulfoxide3 , dissolved (fig/L)
Bentazon4, dissolved (|Xg/L)
Bromacil4, dissolved (|ig/L)
Bromoxynil, dissolved (|ig/L)
Carbaryl4, dissolved (|lg/L)
Carbofuran3, dissolved (|ig/L)Carbofuran, 3-hydroxy-, dissolved (|lg/L)
Chloramben4, dissolved (|Xg/L)
Chlorothalonil4, dissolved (|lg/L)
Clopyralid, dissolved (|Xg/L)
Dacthal, mono-acid-, dissolved (|ig/L)
Dicamba4, dissolved (|ig/L)Dichlobenil, dissolved (|lg/L)
Dichlorprop (2,4-DP), dissolved (|ig/L)
Dinoseb3 , dissolved (|ig/L)
Diuron4, dissolved (|ig/L)DNOC, dissolved (|Xg/L)
Esfenvalerate, dissolved (|ig/L)
Fenuron, dissolved (|ig/L)
U.S. Environ mental
Protection Agency MCL or HAL2
U.S. Geological
Survey analytical method number
Schedule 2050
0-1131-955
70
70
400
7
7
7
20
90
700
40--
100
500
~
--
200-
~
7
10-
-
--
do.
do.
do.
do.
do.
do.
do.
do.do.
do.
do.do.
do.
do.
do.
do.
do.do.
do.
do.
do.do.
do.
do.
Minimum reporting
level
0.05
.05
.05
.05
.05
.05
.05
.05
.05
.05
.05
.05
.05
.05
.05
.05
.05
.05
.05
.05
.05
.05
.05
.05
.05
Mean recovery5 (percent)
44
71
77
83
61
53
100
75
82
74
61
80
60
11
60
74
64
34
73
69
61
35
17
66
Relative standard
deviation5 (percent)
8
13
17
18
9
20
15
17
24
7
7
20
12
24
15
10
12
15
9
26
9
11
7
47
36
Complete ness goal (percent)
90
90
90
90
90
90
90
90
9090
90
9090
90
90
90
90
9090
90
90
9090
90
90
Appendix A 41
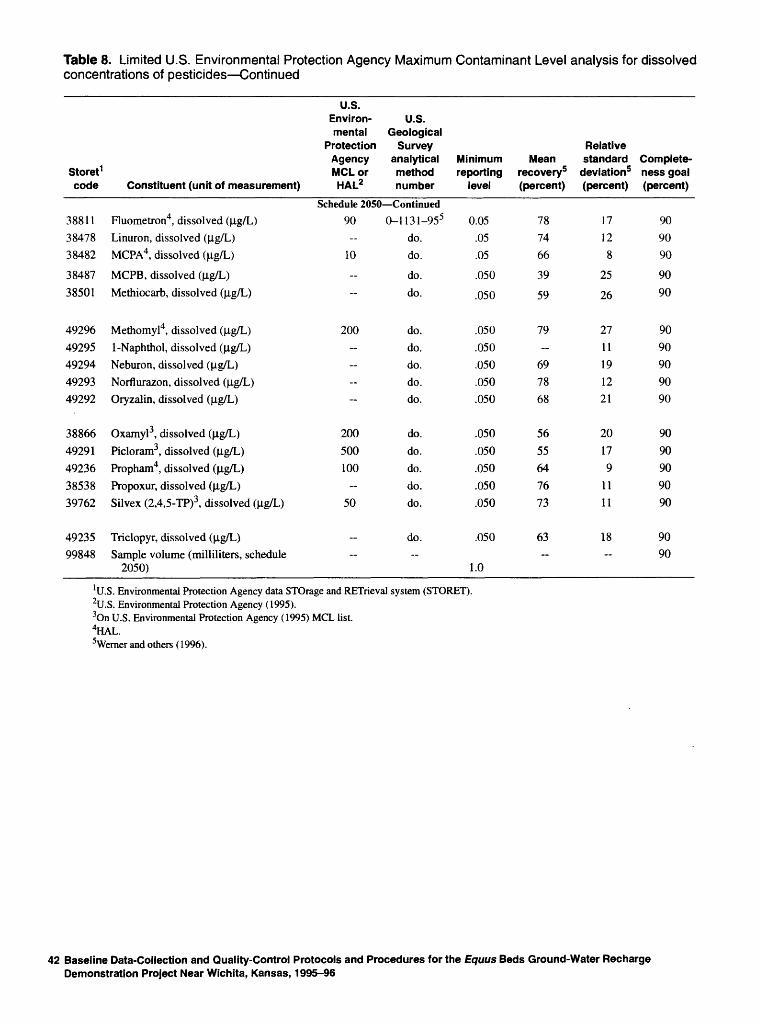
Table 8. Limited U.S. Environmental Protection Agency Maximum Contaminant Level analysis for dissolved concentrations of pesticides Continued
Storet1 code
3881138478 38482
3848738501
49296
49295492944929349292
38866 49291
4923638538 39762
4923599848
Constituent (unit of measurement)
Fluometron4, dissolved (|ig/L)Linuron, dissolved (|ig/L) MCPA4, dissolved (\ig/L)
MCPB, dissolved (^ig/L)
Methiocarb, dissolved (|ig/L)
Methomyl4, dissolved (|ig/L)1-Naphthol, dissolved (|ig/L)Neburon, dissolved (jig/L)Norflurazon, dissolved (|J.g/L)Oryzalin, dissolved (|J.g/L)
Oxamyl3 , dissolved (Hg/L) Picloram3, dissolved (|ig/L) Propham4, dissolved (jig/L)Propoxur, dissolved (jig/L) Silvex (2,4,5-TP)3, dissolved (\ig/L)
Triclopyr, dissolved (|ig/L)Sample volume (milliliters, schedule
2050)
U.S.Environmental
Protection Agency MCL or HAL2
U.S.Geological
Survey analytical method number
Schedule 2050 Continued90 0-1131-955
10
--
200-------
200 500 100
50
do. do.
do.do.
do.do.do.do.do.
do. do. do.do. do.
do.
Minimum reporting
level
0.05.05 .05
.050
.050
.050
.050
.050
.050
.050
.050
.050
.050
.050
.050
.050
1.0
Mean recovery5 (percent)
7874 66
39
59
79--
697868
5655 64
7673
63
Relative standard
deviation5 (percent)
1712 8
25
26
2711191221
20 17 9
11 11
18
Complete ness goal (percent)
9090 90
90
90
9090909090
90 90 9090 90
9090
'U.S. Environmental Protection Agency data STOrage and RETrieval system (STORET).2U.S. Environmental Protection Agency (1995).3On U.S. Environmental Protection Agency (1995) MCL list.4HAL.5Wemer and others (1996).
42 Baseline Data-Collection and Quality-Control Protocols and Procedures for the Equus Beds Ground-Water Recharge Demonstration Project Near Wichita, Kansas, 1995-96
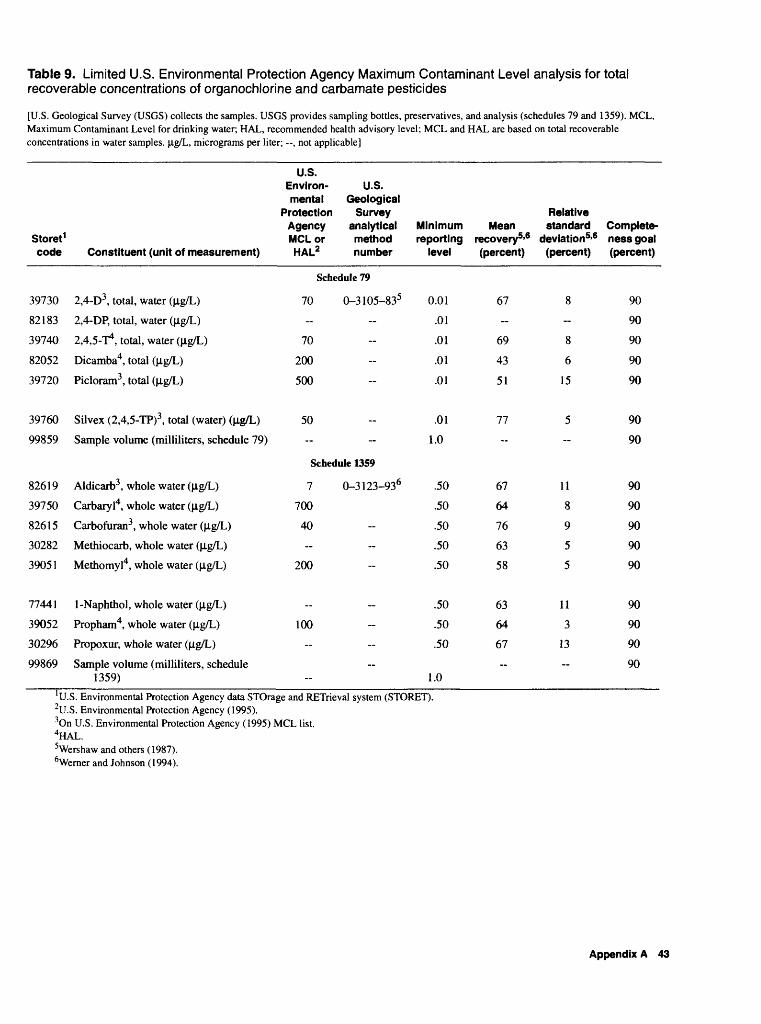
Table 9. Limited U.S. Environmental Protection Agency Maximum Contaminant Level analysis for total recoverable concentrations of organochlorine and carbamate pesticides
[U.S. Geological Survey (USGS) collects the samples. USGS provides sampling bottles, preservatives, and analysis (schedules 79 and 1359). MCL, Maximum Contaminant Level for drinking water; HAL, recommended health advisory level; MCL and HAL are based on total recoverable concentrations in water samples. |J.g/L, micrograms per liter; --, not applicable]
Storet1 code
39730
82183
39740
82052
39720
39760
99859
82619
39750
82615
30282
39051
77441
39052
30296
99869
Constituent (unit of measurement)
2,4-D3 , total, water (\ig/L)
2,4-DP, total, water (Hg/L)
2,4,5-T4, total, water (ng/L)
Dicamba4, total (Hg/L)
Picloram3 , total (p.g/L)
Silvex (2,4,5-TP)3 , total (water) (^g/L)
Sample volume (milliliters, schedule 79)
Aldicarb3 , whole water (Hg/L)
Carbaryl4, whole water (\ig/L)
Carbofuran3, whole water (Hg/L)
Methiocarb, whole water (p.g/L)
Methomyl4, whole water (Hg/L)
1-Naphthol, whole water (|ig/L)
Propham4, whole water (Hg/L)
Propoxur, whole water (Hg/L)
Sample volume (milliliters, schedule 1359)
U.S.Environ- U.S.mental Geological
Protection Survey Agency analytical MCL or method HAL2 number
Schedule 79
70 0-3105-835--
70
200
500
50-
Schedule 1359
7 0-3123-936
700
40
-
200
100--
~
Minimum reporting
level
0.01
.01
.01
.01
.01
.01
1.0
.50
.50
.50
.50
.50
.50
.50
.50
1.0
Mean recovery5'6 (percent)
67
--
69
43
51
77--
67
64
76
63
58
63
64
67
Relative standard
deviation5'6 (percent)
8-
8
6
15
5--
11
8
9
5
5
11
3
13
Complete ness goal (percent)
90
90
90
90
90
90
90
90
90
90
90
90
90
90
90
90
'U.S. Environmental Protection Agency data STOrage and RETrieval system (STORET).2U.S. Environmental Protection Agency (1995).3On U.S. Environmental Protection Agency (1995) MCL list.4HAL.5Wershaw and others (1987).6Werner and Johnson (1994).
Appendix A 43
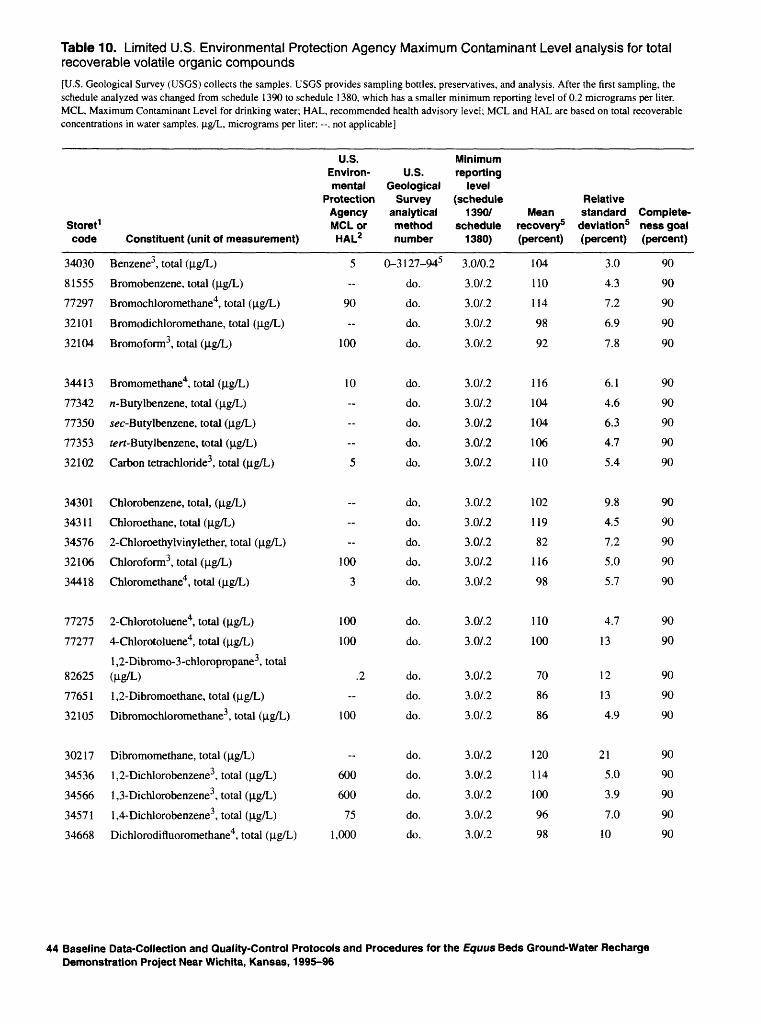
Table 10. Limited U.S. Environmental Protection Agency Maximum Contaminant Level analysis for total recoverable volatile organic compounds
[U.S. Geological Survey (USGS) collects the samples. USGS provides sampling bottles, preservatives, and analysis. After the first sampling, the schedule analyzed was changed from schedule 1390 to schedule 1380, which has a smaller minimum reporting level of 0.2 micrograms per liter. MCL. Maximum Contaminant Level for drinking water; HAL, recommended health advisory level; MCL and HAL are based on total recoverable concentrations in water samples. |ig/L, micrograms per liter: . not applicable]
Storet1 code
34030
81555
77297
32101
32104
34413
77342
77350
77353
32102
34301
34311
34576
32106
34418
77275
77277
82625
77651
32105
30217
34536
34566
34571
34668
Constituent (unit of measurement)
Benzene3 , total (jig/L)
Bromobenzene, total (ng/L)
Bromochloromethane4, total (jig/L)
Bromodichloromethane, total (Hg/L)
Bromoform3 , total (|ig/L)
Bromomethane4, total (ng/L)
n-Butylbenzene, total (ng/L)
,sec-Butylbenzene, total (Hg/L)
tert-Butylbenzene, total (ng/L)
Carbon tetrachloride3, total (ng/L)
Chlorobenzene, total, (ng/L)
Chloroethane, total (ng/L)
2-Chloroethylvinylether, total (ng/L)
Chloroform3 , total (ng/L)
Chloromethane4, total (ng/L)
2-Chlorotoluene4, total (ng/L)
4-Chlorotoluene4, total (ng/L)
l,2-Dibromo-3-chloropropane3, total (Hg/L)
1,2-Dibromoethane, total (ng/L)
Dibromochloromethane3 , total (ng/L)
Dibromomethane, total (ng/L)
1,2-Dichlorobenzene3, total (ng/L)
1,3-Dichlorobenzene3, total (ng/L)
1 ,4-Dichlorobenzene3 , total (ng/L)
Dichlorodifluoromethane4, total (ng/L)
U.S.Environ- U.S. mental Geological
Protection Survey Agency analytical MCL or method
HAL2 number
5 0-3127-945
do.
90 do.
do.
100 do.
10 do.
do.
do.
do.
5 do.
do.
do.
do.
100 do.
3 do.
100 do.
100 do.
.2 do.
do.
100 do.
do.
600 do.
600 do.
75 do.
1,000 do.
Minimumreporting
level (schedule
1390/ schedule
1380)
3.0/0.2
3.0/.2
3.0/.2
3.0/.2
3.0/.2
3.0/.2
3.0/.2
3.0/.2
3.0/.2
3.0/.2
3.0/.2
3.0/.2
3.0/.2
3.0/.2
3.0/.2
3.0/.2
3.0/.2
3.0/.2
3.0/.2
3.0/.2
3.0/.2
3.0/.2
3.0/.2
3.0/.2
3.0/.2
Mean recovery5 (percent)
104
110
114
98
92
116
104
104
106
110
102
119
82
116
98
110
100
70
86
86
120
114
100
96
98
Relative standard Complete-
deviation5 ness goal (percent) (percent)
3.0
4.3
7.2
6.9
7.8
6.1
4.6
6.3
4.7
5.4
9.8
4.5
7.2
5.0
5.7
4.7
13
12
13
4.9
21
5.0
3.9
7.0
10
90
90
90
90
90
90
90
90
90
90
90
90
90
90
90
90
90
90
90
90
90
90
90
90
90
44 Baseline Data-Collection and Quality-Control Protocols and Procedures for the Equus Beds Ground-Water Recharge Demonstration Project Near Wichita, Kansas, 1995-96
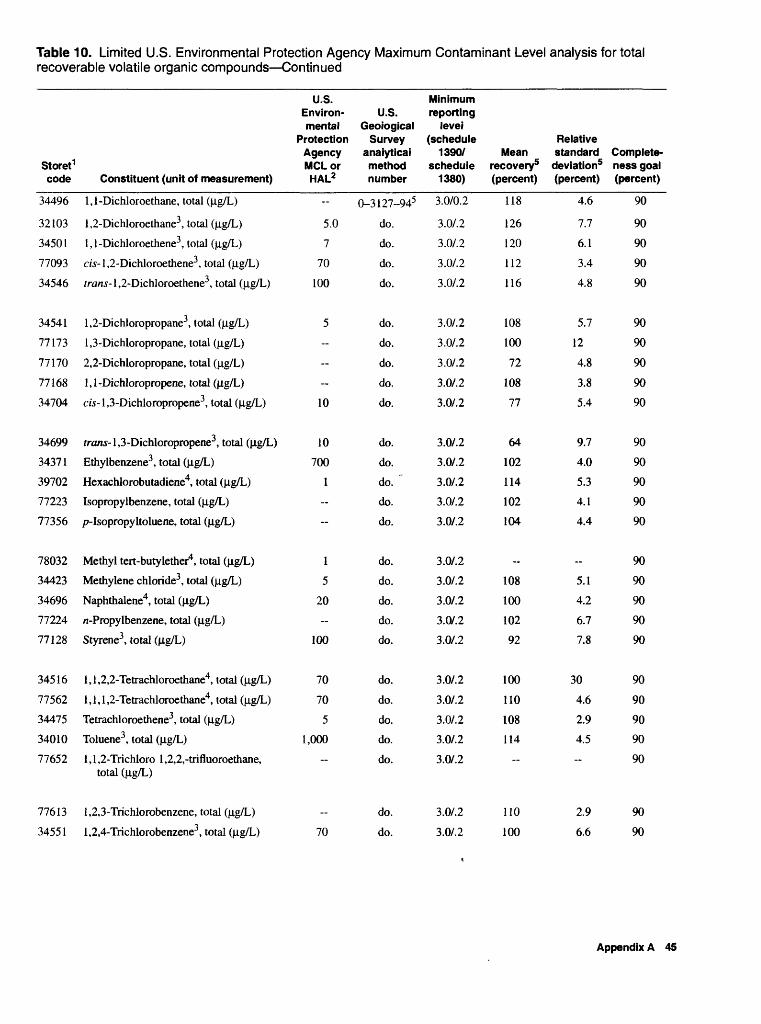
Table 10. Limited U.S. Environmental Protection Agency Maximum Contaminant Level analysis for total recoverable volatile organic compounds Continued
Storet1 code
34496
32103
34501
77093
34546
34541
77173
77170
77168
34704
34699
34371
39702
77223
77356
78032
34423
34696
77224
77128
34516
77562
34475
34010
77652
77613
34551
Constituent (unit of measurement)
1,1-Dichloroethane, total (|0.g/L)
1,2-Dichloroethane3 , total ((ig/L)
1,1-Dichloroethene3 , total ((Ig/L)
cw-l,2-Dichloroethene3 , total ((Ig/L)
/rans-l,2-Dichloroethene3 , total ((Ig/L)
1,2-Dichloropropane3 , total ((Ig/L)
1,3-Dichloropropane, total ((Ig/L)
2,2-Dichloropropane, total ((ig/L)
1,1-Dichloropropene, total (\ig/L)
cw-l,3-Dichloropropene3 , total (\ig/L)
fra/w-l,3-Dichloropropene3 , total (u.g/L)
Ethylbenzene3 , total (^ig/L)
Hexachlorobutadiene4, total (\ig/L)
Isopropylbenzene, total (^ig/L)
/7-Isopropyltoluene, total (\ig/L)
Methyl tert-butylether4, total (^ig/L)
Methylene chloride3 , total ((Ig/L)
Naphthalene4, total (^ig/L)
n-Propylbenzene, total (^ig/L)
Styrene3, total (|Xg/L)
1,1,2,2-Tetrachloroethane4, total ((Ig/L)
1,1,1,2-Tetrachloroethane4, total ((ig/L)
Tetrachloroethene3 , total (ng/L)
Toluene3 , total (^ig/L)
1 , 1 ,2-Trichloro 1 ,2,2,-trifluoroethane, total ((ig/L)
1,2,3-Trichlorobenzene, total ((Ig/L)
1,2,4-Trichlorobenzene3 , total ((Ig/L)
U.S.Environ- U.S. mental Geological
Protection Survey Agency analytical MCL or method HAL2 number
-
5.0
7
70
100
5-
--
--
10
10
700
1--
-
1
5
20--
100
70
70
5
1,000~~
70
0-3127-945
do.
do.
do.
do.
do.
do.
do.
do.
do.
do.
do.
do.
do.
do.
do.
do.
do.
do.
do.
do.
do.
do.
do.
do.
do.
do.
Minimumreporting
level (schedule
1390/ schedule
1380)
3.0/0.2
3.0/.2
3.0/.2
3.0/.2
3.0/.2
3.0/.2
3.0/.2
3.0/.2
3.0/.2
3.0/.2
3.0/.2
3.0/.2
3.0/.2
3.0/.2
3.0/.2
3.0/.2
3.0/.2
3.0/.2
3.0/.2
3.0/.2
3.0/.2
3.0/.2
3.0/.2
3.0/.2
3.0/.2
3.0/.2
3.0/.2
Mean recovery5 (percent)
118
126
120
112
116
108
100
72
108
77
64
102
114
102
104
_
108
100
102
92
100
110
108
114
~~
110
100
Relative standard Complete-
deviation5 ness goal (percent) (percent)
4.6
7.7
6.1
3.4
4.8
5.7
12
4.8
3.8
5.4
9.7
4.0
5.3
4.1
4.4
._
5.1
4.2
6.7
7.8
30
4.6
2.9
4.5
2.9
6.6
90
90
90
90
90
90
90
90
90
90
90
90
90
90
90
90
90
90
90
90
90
90
90
90
90
90
90
Appendix A 45
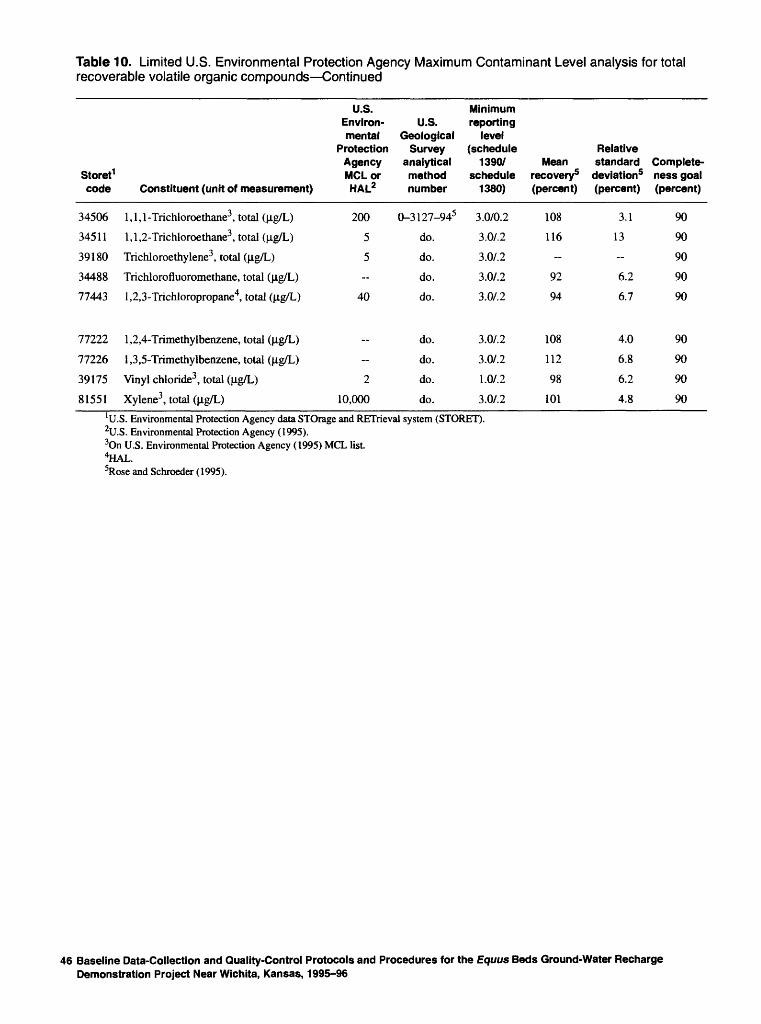
Table 10. Limited U.S. Environmental Protection Agency Maximum Contaminant Level analysis for total recoverable volatile organic compounds Continued
Storet1code
34506
34511
39180
34488
77443
77222
77226
39175
81551
Constituent (unit of measurement)
1,1,1-Trichloroethane3 , total ((J-g/L)
1,1,2-Trichloroethane3 , total (|lg/L)
Trichloroethylene3 , total (jxg/L)
Trichlorofluoromethane, total (jig/L)
1,2,3-Trichloropropane4, total (|ig/L)
1,2,4-Trimethylbenzene, total (Hg/L)
1,3,5-Trimethylbenzene, total (jxg/L)
Vinyl chloride3 , total (|ig/L)
Xylene3 , total (fig/L)
U.S. Environ mental
ProtectionAgencyMCLorHAL2
200
5
5--
40
--
2
10,000
U.S. Geological
Surveyanalyticalmethodnumber
0-3127-945
do.
do.
do.
do.
do.
do.
do.
do.
Minimum reporting
level(schedule
1390/schedule
1380)
3.0/0.2
3.0/.2
3.0/.2
3.0/.2
3.0/.2
3.0/.2
3.0/.2
1.0/.2
3.0/.2
Meanrecovery5(percent)
108
116-
92
94
108
112
98
101
Relativestandard
deviation5(percent)
3.1
13
--
6.2
6.7
4.0
6.8
6.2
4.8
Completeness goal(percent)
90
90
90
90
90
90
90
90
90
l \J.S. Environmental Protection Agency data STOrage and RETrieval system (STORET).2U.S. Environmental Protection Agency (1995).3On U.S. Environmental Protection Agency (1995) MCL list4HAL.5Rose and Schroeder (1995).
46 Baseline Data-Collection and Quality-Control Protocols and Procedures for the Equus Beds Ground-Water Recharge Demonstration Project Near Wichita, Kansas, 1995-96
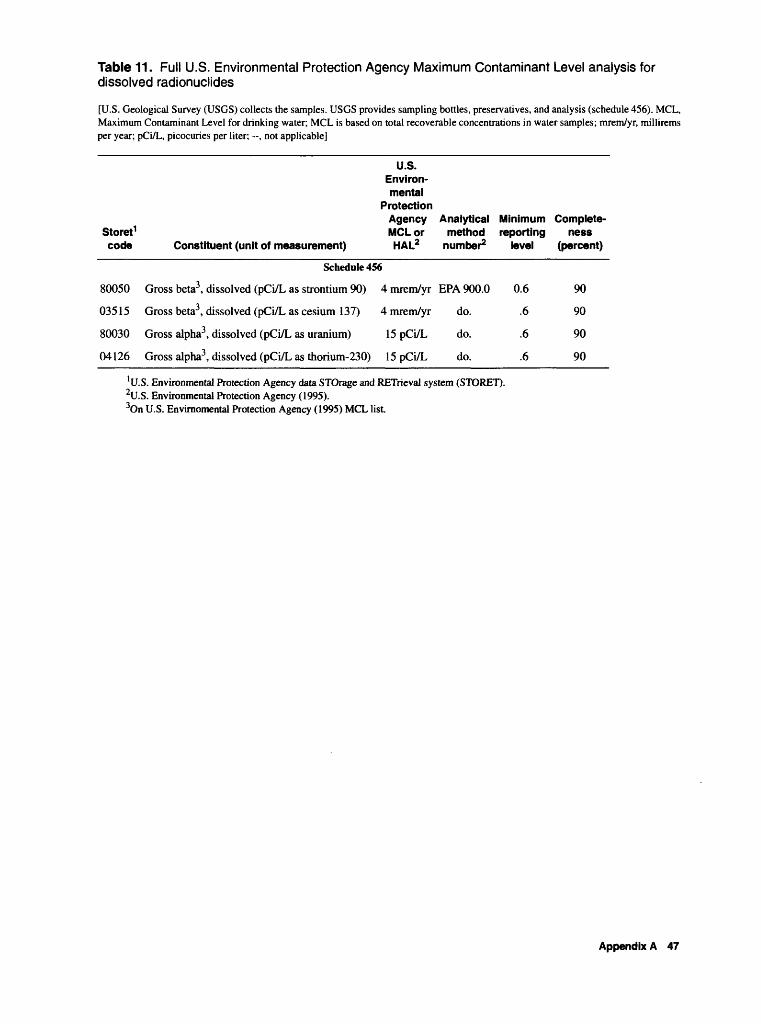
Table 11. Full U.S. Environmental Protection Agency Maximum Contaminant Level analysis for dissolved radionuclides
[U.S. Geological Survey (USGS) collects the samples. USGS provides sampling bottles, preservatives, and analysis (schedule 456). MCL, Maximum Contaminant Level for drinking water; MCL is based on total recoverable concentrations in water samples; mrem/yr, millirems per year; pCi/L, picocuries per liter; , not applicable]
U.S.Environ mental
Protection Agency Analytical Minimum Complete-
Storet1 code Constituent (unit of measurement)
MCL or HAL2
method reporting number2 level
ness (percent)
Schedule 456
80050
03515
80030
04126
Gross beta3 ,
Gross beta ,
Gross alpha3
Gross alpha3
dissolved (pCi/L as strontium 90)
dissolved (pCi/L as cesium 1 37)
, dissolved (pCi/L as uranium)
, dissolved (pCi/L as thorium- 230)
4 mrem/yr
4 mrem/yr
15pCi/L
15pCi/L
EPA 900.0
do.
do.
do.
0.6
.6
.6
.6
90
90
90
90
1 U.S. Environmental Protection Agency data STOrage and RETrieval system (STORET).2U.S. Environmental Protection Agency (1995).3On U.S. Envimomental Protection Agency (1995) MCL list
Appendix A 47
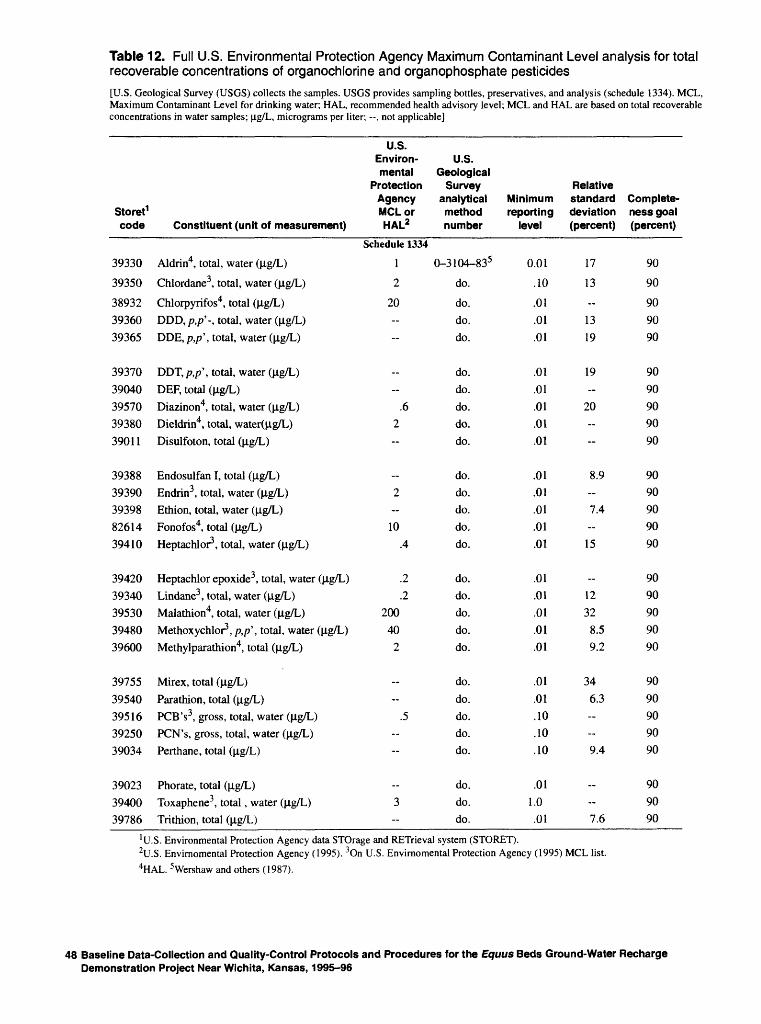
Table 12. Full U.S. Environmental Protection Agency Maximum Contaminant Level analysis for total recoverable concentrations of organochlorine and organophosphate pesticides
[U.S. Geological Survey (USGS) collects the samples. USGS provides sampling bottles, preservatives, and analysis (schedule 1334). MCL, Maximum Contaminant Level for drinking water; HAL, recommended health advisory level; MCL and HAL are based on total recoverable concentrations in water samples; [LgfL, micrograms per liter; --, not applicable]
Storet1
code
39330
39350
389323936039365
3937039040395703938039011
3938839390393988261439410
3942039340395303948039600
3975539540395163925039034
390233940039786
Constituent (unit of measurement)
Aldrin4, total, water (jig/L)
Chlordane3 , total, water (jig/L)
Chlorpyrifos4 , total (jig/L)DDD, p,p'-, total, water (|J,g/L)DDE, p,p\ total, water (|J,g/L)
DDT,p,p\ total, water (jig/L)DBF, total (|ig/L)Diazinon4, total, water (|J,g/L)Dieldrin4, total, water(|ig/L)Disulfoton, total (|J,g/L)
Endosulfan I, total (|J.g/L)Endrin3 , total, water (jig/L)Ethion, total, water (|J,g/L)Fonofos4, total (jig/L)Heptachlor3 , total, water (pig/L)
Heptachlor epoxide3 , total, water (jig/L)Lindane3 , total, water (|J,g/L)Malathion4, total, water (jig/L)Methoxychlor3 , p,p\ total, water ((J-g/L)Methylparathion4, total (|ig/L)
Mirex, total (jig/L)
Parathion, total (|J,g/L)PCB's3 , gross, total, water (jig/L)PCN's, gross, total, water (|J.g/L)Perthane, total (|J,g/L)
Phorate, total (|J,g/L)Toxaphene3 , total , water (jig/L)Trithion, total (|J,g/L)
U.S. Environ mental
Protection Agency MCL or HAL2
Schedule 1334
1
2
20--~
--
.62--
__
2--
10.4
.2
.2200
402
-
.5--
3-
U.S. Geological
Survey analytical method number
0-3104-835
do.
do.do.do.
do.do.do.do.do.
do.do.do.do.do.
do.do.do.do.do.
do.
do.do.do.do.
do.do.do.
Minimum reporting
level
0.01
.10
.01
.01
.01
.01
.01
.01
.01
.01
.01
.01
.01
.01
.01
.01
.01
.01
.01
.01
.01
.01
.10
.10
.10
.011.0.01
Relative standard deviation (percent)
17
13--
1319
19-
20--~
8.9--
7.4--
15
1232
8.59.2
346.3----
9.4
--
7.6
Complete ness goal (percent)
90
90
909090
9090909090
9090909090
9090909090
9090909090
909090
'U.S. Environmental Protection Agency data STOrage and RETrieval system (STORET).2U.S. Envirnomental Protection Agency (1995). 3On U.S. Envirnomental Protection Agency (1995) MCL list.
4HAL. 5Wershaw and others (1987).
48 Baseline Data-Collection and Quality-Control Protocols and Procedures for the Equus Beds Ground-Water Recharge Demonstration Project Near Wichita, Kansas, 1995-96
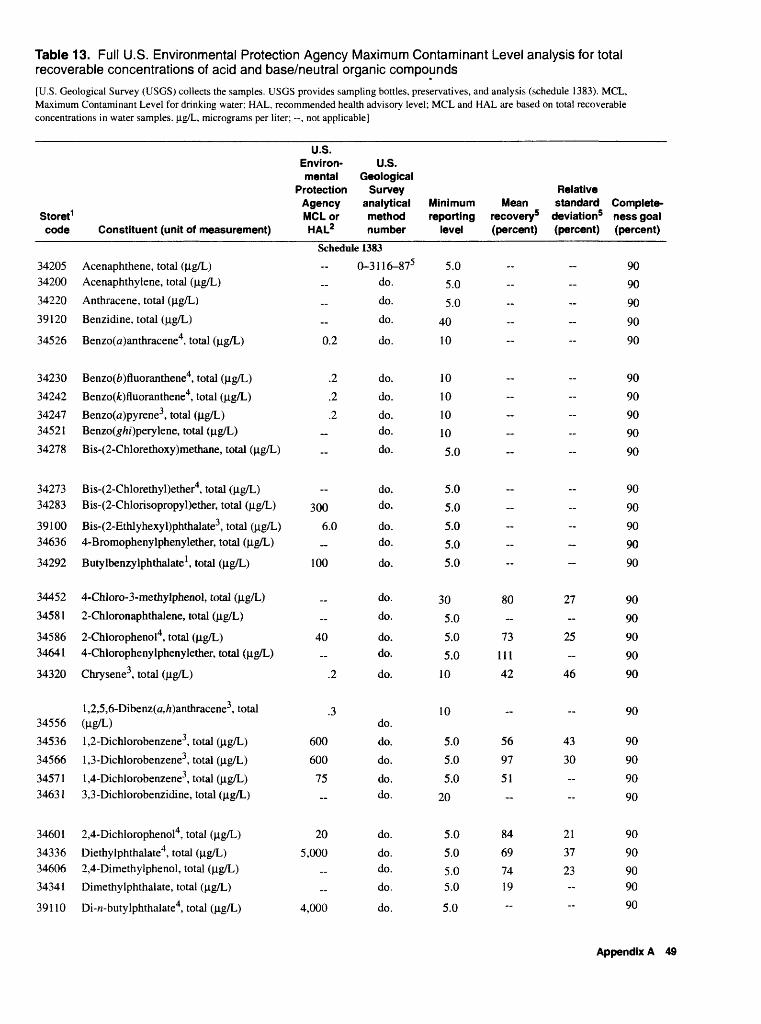
Table 13. Full U.S. Environmental Protection Agency Maximum Contaminant Level analysis for total recoverable concentrations of acid and base/neutral organic compounds
[U.S. Geological Survey (USGS) collects the samples. USGS provides sampling bottles, preservatives, and analysis (schedule 1383). MCL, Maximum Contaminant Level for drinking water; HAL, recommended health advisory level; MCL and HAL are based on total recoverable concentrations in water samples. (ig/L, micrograms per liter; , not applicable]
Storet1 code Constituent (unit of measurement)
U.S. Environ mental
Protection Agency MCL or HAL2
U.S. Geological
Survey analytical method number
Minimum reporting
level
Relative Mean standard Complete-
recovery5 deviation5 ness goal (percent) (percent) (percent)
Schedule 1383
3420534200
34220
39120
34526
34230342423424734521
34278
3427334283
3910034636
34292
34452
34581
3458634641
34320
345563453634566
3457134631
34601
343363460634341
39110
Acenaphthene, total (Hg/L)Acenaphthylene, total (ng/L)
Anthracene, total (Hg/L)
Benzidine, total (ng/L)
Benzo(a)anthracene4, total (ng/L)
Benzo(£)fluoranthene4, total (ng/L)
Benzo(fc)fluoranthene4, total (ng/L)Benzo(a)pyrene3, total ([ig/L)Benzo(g/»')perylene, total (ng/L)Bis-(2-Chlorethoxy)methane, total (ng/L)
Bis-(2-Chlorethyl)ether4, total (Hg/L)Bis-(2-Chlorisopropyl)ether, total (ng/L)
Bis-(2-Ethlyhexyl)phthalate3 , total (ng/L)4-Bromophenylphenylether, total (|ig/L)
Butylbenzylphthalate 1 , total (jig/L)
4-Chloro-3-methylphenol, total (ng/L)
2-Chloronaphthalene, total (ng/L)
2-Chlorophenol4, total (Hg/L)4-Chlorophenylphenylether, total (jig/L)
Chrysene3 , total (ng/L)
l,2,5,6-Dibenz(a,/z)anthracene3 , total(Ug/L)
1,2-Dichlorobenzene3 , total (ng/L)
1,3-Dichlorobenzene3 , total (Hg/L)
1,4-Dichlorobenzene3 , total (ng/L)3,3-Dichlorobenzidine, total (ng/L)
2,4-Dichlorophenol4, total (jig/L)
Diethylphthalate4 , total (|ag/L)2,4-Dimethylphenol, total (ng/L)Dimethylphthalate, total (|ig/L)
Di-n-butylphthalate4, total (ng/L)
0.2
.2
.2
.2
--
_
3006.0
100
_
40
.2
.3
600
600
75--
20
5,000
4,000
0-3116-875do.
do.
do.
do.
do.do.do.do.do.
do.do.
do.do.
do.
do.
do.
do.do.
do.
do.
do.do.
do.do.
do.do.do.do.
do.
5.05.0
5.0
40
10
10
101010
5.0
5.0
5.0
5.05.05.0
305.0
5.05.0
10
10
5.05.0
5.020
5.0
5.05.05.0
5.0
9090
90
90
90
90909090
90
90
90909090
80 27 90
9073 25 90
111 - 9042 46 90
90
56 43 9097 30 90
51 -- 90
90
84 21 9069 37 9074 23 9019 -- 90
90
Appendix A 49
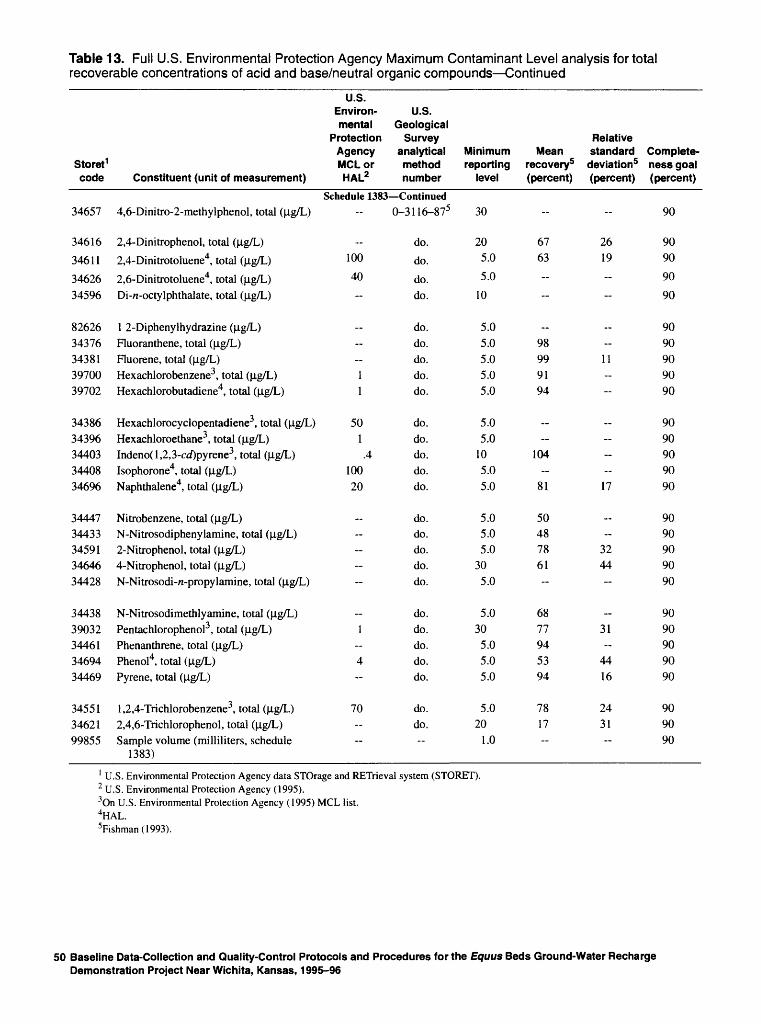
Table 13. Full U.S. Environmental Protection Agency Maximum Contaminant Level analysis for total recoverable concentrations of acid and base/neutral organic compounds Continued
Storet1 code
U.S. Environ mental
Protection Agency MCLor
Constituent (unit of measurement) HAL2
U.S. Geological
Survey analytical method number
Minimum reporting
level
Mean recovery5 (percent)
Relative standard Complete-
deviation5 ness goal (percent) (percent)
Schedule 1383 Continued34657
34616
34611
3462634596
8262634376343813970039702
3438634396344033440834696
3444734433345913464634428
3443839032344613469434469
345513462199855
4,6-Dinitro-2-methylphenol, total (^g/L)
2,4-Dinitrophenol, total (fig/L)2,4-Dinitrotoluene4, total (|ig/L)
2,6-Dinitrotoluene4, total (^g/L)Di-n-octylphthalate, total (^g/L)
1 2-Diphenylhydrazine (^g/L)Fluoranthene, total (^g/L)Fluorene, total (^g/L)Hexachlorobenzene3 , total (|ig/L)Hexachlorobutadiene4, total (^g/L)
Hexachlorocyclopentadiene3, total (^g/L)Hexachloroethane3 , total (^g/L)Indeno(l,2,3-of)pyrene3, total (^g/L)Isophorone4, total (^g/L)Naphthalene4, total (^g/L)
Nitrobenzene, total (^g/L)N-Nitrosodiphenylamine, total (^g/L)2-Nitrophenol, total (^g/L)4-Nitrophenol, total (^g/L)N-Nitrosodi-n-propylamine, total (^g/L)
N-Nitrosodimethlyamine, total (^g/L)Pentachlorophenol3 , total (^g/L)Phenanthrene, total (^g/L)Phenol4, total (ng/L)Pyrene, total (^g/L)
1,2,4-Trichlorobenzene3, total (fig/L)2,4,6-Trichlorophenol, total (^g/L)Sample volume (milliliters, schedule
1383)
0-3116-875
100
40--
--
11
501.4
10020
-----~
_
1~
4--
70--
--
do.
do.
do.do.
do.do.do.do.do.
do.do.do.do.do.
do.do.do.do.do.
do.do.do.do.do.
do.do.--
30
205.0
5.0
10
5.05.05.05.05.0
5.05.0
105.05.0
5.05.05.0
305.0
5.030
5.05.05.0
5.020
1.0
--
6763-
~
98999194
_
104
81
50487861
6877945394
7817--
--
2619-
---
11 -
_ ----
17
~
3244~
_.
31--
44
16
24
31--
90
9090
90
90
9090909090
9090909090
9090909090
9090909090
909090
1 U.S. Environmental Protection Agency data STOrage and RETrieval system (STORET).2 U.S. Environmental Protection Agency (1995).3On U.S. Environmental Protection Agency (1995) MCL list.4HAL.5Fishman(1993).
50 Baseline Data-Collection and Quality-Control Protocols and Procedures for the Equus Beds Ground-Water Recharge Demonstration Project Near Wichita, Kansas, 1995-96
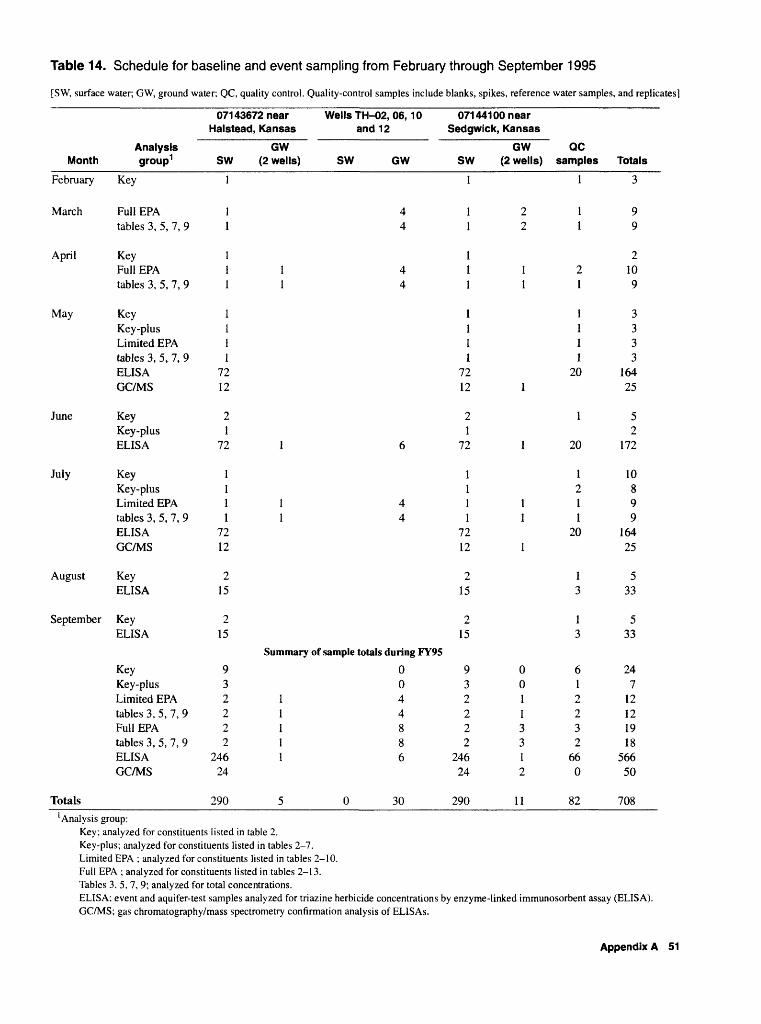
Table 14. Schedule for baseline and event sampling from February through September 1995
[SW, surface water; GW, ground water: QC, quality control. Quality-control samples include blanks, spikes, reference water samples, and replicates]
071 43672 near Wells TH-02, 06, 1 0 Halstead, Kansas and 12
Month
February
March
April
May
June
July
August
September
Totals
Analysis group1
Key
Full EPAtables 3, 5, 7, 9
KeyFull EPAtables 3, 5, 7, 9
KeyKey-plusLimited EPAtables 3, 5, 7, 9ELISAGC/MS
KeyKey-plusELISA
KeyKey-plusLimited EPAtables 3, 5, 7, 9ELISAGC/MS
KeyELISA
KeyELISA
KeyKey-plusLimited EPAtables 3, 5, 7, 9Full EPAtables 3, 5, 7, 9ELISAGC/MS
SW
1
11
111
1111
7212
21
72
1111
7212
215
215
932222
24624
290
GW (2 wells) SW GW
44
1 41 4
1 6
1 41 4
Summary of sample totals during FY95
00
1 41 41 81 81 6
5 0 30
071 441 00 near Sedgwick, Kansas
SW
1
11
111
1111
7212
21
72
1111
7212
215
215
932222
24624
290
GW (2 wells)
22
11
1
1
11
1
00113312
11
QC samples
1
11
21
1111
20
1
20
1211
20
13
13
612232
660
82
Totals
3
99
2109
3333
16425
52
172
10899
16425
533
533
247
12121918
56650
708'Analysis group:
Key; analyzed for constituents listed in table 2.Key-plus; analyzed for constituents listed in tables 2-7.Limited EPA ; analyzed for constituents listed in tables 2-10.Full EPA ; analyzed for constituents listed in tables 2-13.Tables 3, 5, 7, 9; analyzed for total concentrations.ELISA; event and aquifer-test samples analyzed for triazine herbicide concentrations by enzyme-linked immunosorbent assay (ELISA).GC/MS; gas chromatography/mass spectrometry confirmation analysis of ELlSAs.
Appendix A 51
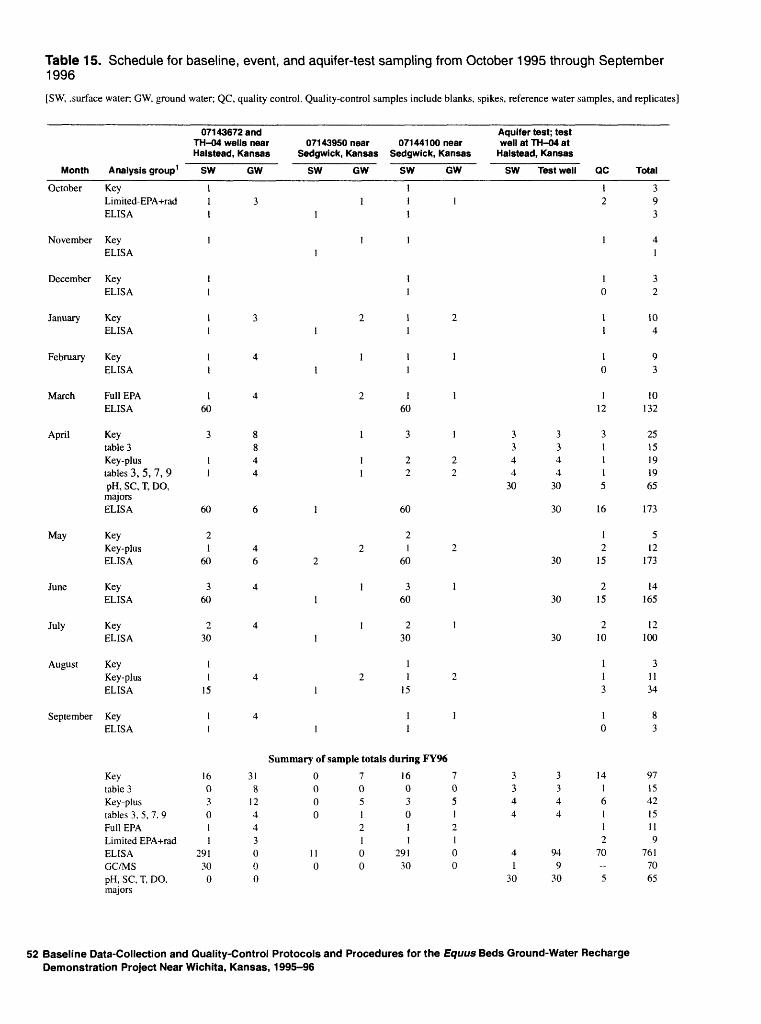
Table 15. Schedule for baseline, event, and aquifer-test sampling from October 1995 through September 1996
[SW, .surface water; GW, ground water; QC, quality control. Quality-control samples include blanks, spikes, reference water samples, and replicates]
071 43672 and TH-04 wells near 071 43950 near Halstead, Kansas Sedgwick, Kansas
Month
October
November
December
January
February
March
April
May
June
July
August
September
Analysis group1
KeyLimited- EPA+radELISA
KeyELISA
KeyELISA
KeyELISA
KeyELISA
Full EPAELISA
Keytable 3Key-plustables 3, 5, 7, 9pH, SC, T, DO,
majorsELISA
KeyKey-plusELISA
KeyELISA
KeyELISA
KeyKey-plusELISA
KeyELISA
SW
111
1
,1
,1
11
160
3
11
60
21
60
360
230
11
15
11
GW
3
3
4
4
8844
6
46
4
4
4
4
SW GW
11
11
21
11
2
1
11
1
22
11
11
21
1
071 441 00 near Sedgwick, Kansas
SW GW
11 11
1
11
1 21
1 11
1 160
3 1
2 22 2
60
21 2
60
3 160
2 130
11 2
15
1 11
Aquifer test; test well at TH-04 at
Halstead, Kansas
SW Test well QC
12
1
10
11
10
112
3 3 33 3 14 4 14 4 1
30 30 5
30 16
12
30 15
230 15
230 10
113
10
Total
393
41
32
104
93
10132
2515191965
173
512
173
14165
12100
31134
83
Summary of sample totals during FY96
Keytable 3Key-plustables 3. 5, 7, 9Full EPALimited EPA+radELISAGC/MSpH, SC, T, DO,majors
1603011
29130
0
318
12443000
0 70 00 50 1
21
11 00 0
16 70 03 50 11 21 1
291 030 0
3 3 143 3 14464 4 1
12
4 94 701 9
30 30 5
97154215119
7617065
52 Baseline Data-Collection and Quality-Control Protocols and Procedures for the Equus Beds Ground-Water Recharge Demonstration Project Near Wichita, Kansas, 1995-96
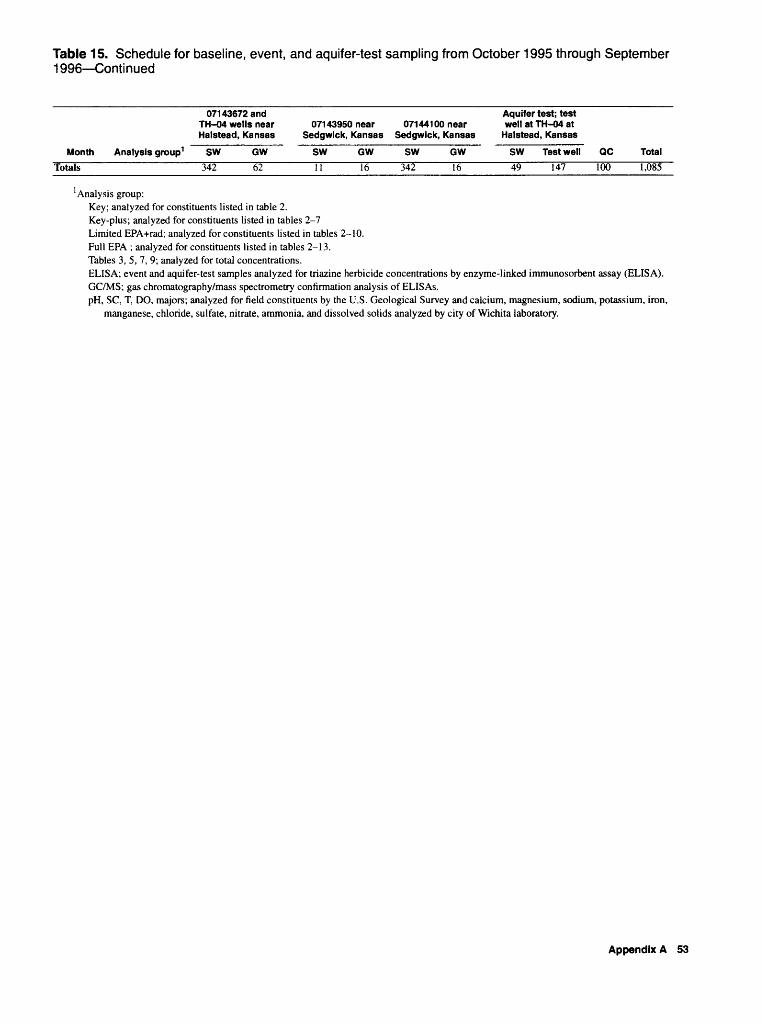
Table 15. Schedule for baseline, event, and aquifer-test sampling from October 1995 through September 1996 Continued
071 43672 and TH-04 wells near Halstead, Kansas
Month
Totals
Analysis group1 SW
342
GW
62
071 43950 near Sedgwick, Kansas
SW
11
GW
16
071 441 00 near Sedgwick, Kansas
SW
342
GW
16
Aquifer test; test well at TH-04 at
Halstead, Kansas
SW
49
Test well
147
QC
100
Total
1,085
Analysis group:Key; analyzed for constituents listed in table 2. Key-plus; analyzed for constituents listed in tables 2-7 Limited EPA+rad; analyzed for constituents listed in tables 2-10. Full ERA ; analyzed for constituents listed in tables 2-13. Tables 3, 5, 7, 9; analyzed for total concentrations.ELISA; event and aquifer-test samples analyzed for triazine herbicide concentrations by enzyme-linked immunosorbent assay (ELISA). GC/MS; gas chromatography/mass spectrometry confirmation analysis of ELISAs.pH, SC, T, DO, majors; analyzed for field constituents by the U.S. Geological Survey and calcium, magnesium, sodium, potassium, iron,
manganese, chloride, sulfate, nitrate, ammonia, and dissolved solids analyzed by city of Wichita laboratory.
Appendix A 53
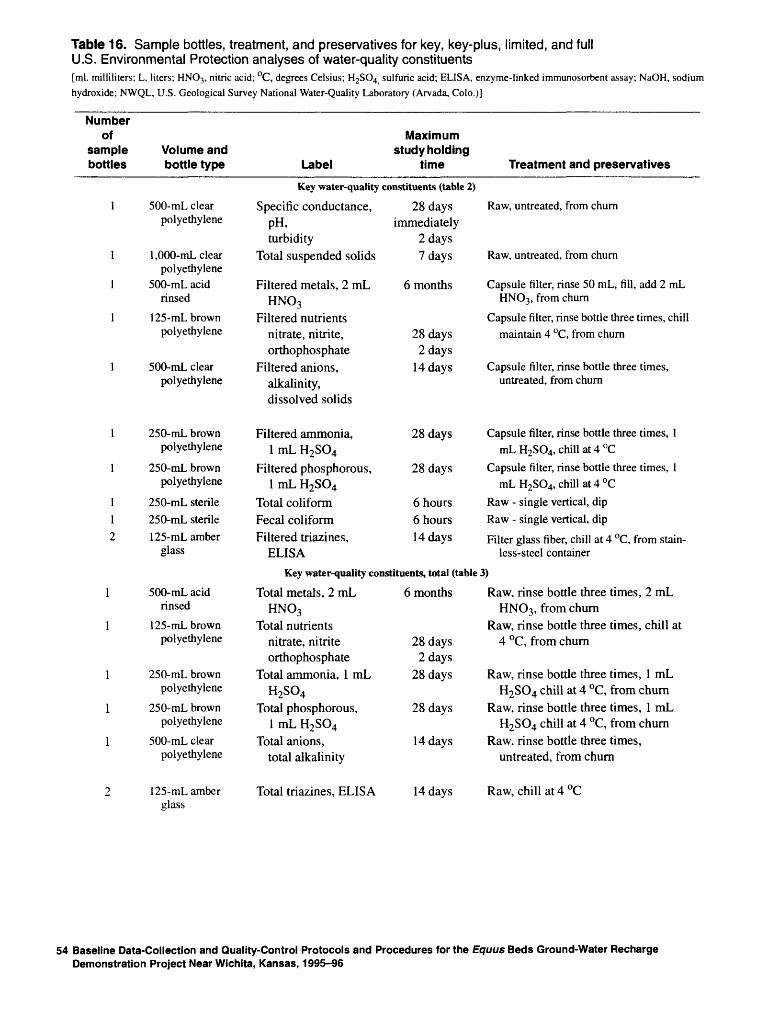
Table 16. Sample bottles, treatment, and preservatives for key, key-plus, limited, and full U.S. Environmental Protection analyses of water-quality constituents[ml. milliliters; L, liters; HNO3 , nitric acid; °C, degrees Celsius; H2SO4 sulfuric acid; ELISA, enzyme-linked immunosorbent assay; NaOH, sodium
hydroxide; NWQL, U.S. Geological Survey National Water-Quality Laboratory (Arvada, Colo.)]
Number of
sample bottles
Volume and bottle type Label
Maximum study holding
time Treatment and preservatives
Key water-quality constituents (table 2)
1
1
1
1
1
1
1
1
1
2
500-mL clearpolyethylene
1,000-mL clearpolyethylene
500-mL acidrinsed
1 25 -mL brownpolyethylene
500-mL clearpolyethylene
250-mL brownpolyethylene
250-mL brownpolyethylene
250-mL sterile250-mL sterile1 25-mL amber
glass
Specific conductance,pH,turbidity
Total suspended solids
Filtered metals, 2 mLHNO3
Filtered nutrientsnitrate, nitrite,orthophosphate
Filtered anions,alkalinity,dissolved solids
Filtered ammonia,1 mL H2SO4
Filtered phosphorous,1 mL H2SO4
Total coliformFecal coliformFiltered triazines,
ELISA
28 daysimmediately
2 days7 days
6 months
28 days2 days
14 days
28 days
28 days
6 hours6 hours14 days
Raw, untreated, from churn
Raw, untreated, from churn
Capsule filter, rinse 50 mL, fill, add 2 mLHNO3 , from churn
Capsule filter, rinse bottle three times, chillmaintain 4 °C, from churn
Capsule filter, rinse bottle three times,untreated, from churn
Capsule filter, rinse bottle three times, 1mL H2SO4, chill at 4 °C
Capsule filter, rinse bottle three times, 1mL H2SO4, chill at 4 °C
Raw - single vertical, dipRaw - single vertical, dip
Filter glass fiber, chill at 4 °C, from stainless-steel container
Key water-quality constituents, total (table 3)
1
1
1
1
1
2
500-mL acidrinsed
1 25-mL brownpolyethylene
250-mL brownpolyethylene
250-mL brownpolyethylene
500-mL clearpolyethylene
1 25-mL amberglass
Total metals, 2 mLHNO3
Total nutrientsnitrate, nitriteorthophosphate
Total ammonia, 1 mLH2SO4
Total phosphorous,1 mL H2SO4
Total anions,total alkalinity
Total triazines, ELISA
6 months
28 days2 days
28 days
28 days
14 days
14 days
Raw, rinse bottle three times, 2 mLHNO3 , from churn
Raw, rinse bottle three times, chill at4 °C, from churn
Raw, rinse bottle three times, 1 mLH2SO4 chill at 4 °C, from churn
Raw, rinse bottle three times, 1 mLH2SO4 chill at 4 °C, from churn
Raw, rinse bottle three times,untreated, from churn
Raw, chill at 4 °C
54 Baseline Data-Collection and Quality-Control Protocols and Procedures for the Equus Beds Ground-Water Recharge Demonstration Project Near Wichita, Kansas, 1995-96
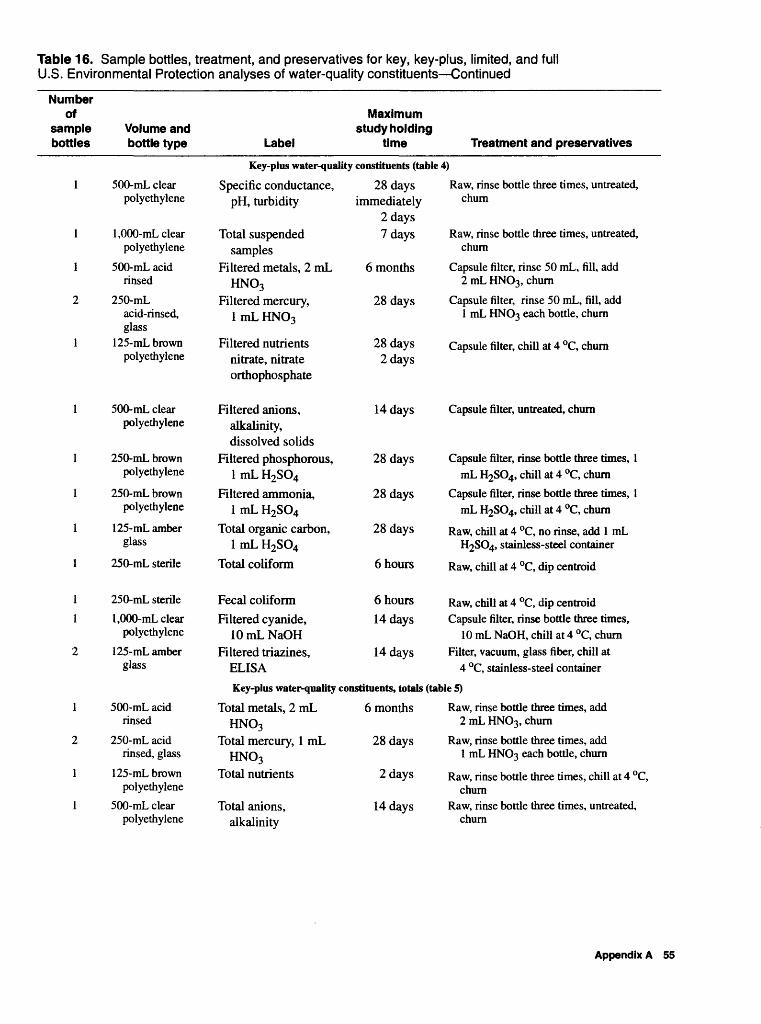
Table 16. Sample bottles, treatment, and preservatives for key, key-plus, limited, and full U.S. Environmental Protection analyses of water-quality constituents Continued
Number of
sample Volume and bottles bottle type Label
Maximum study holding
time Treatment and preservatives
Key-plus water-quality constituents (table 4)
1 500-mL clearpolyethylene
1 1,000-mL clearpolyethylene
1 500-mL acidrinsed
2 250-mLacid-rinsed, glass
1 125-mL brownpolyethylene
1 500-mL clearpolyethylene
1 250-mL brownpolyethylene
1 250-mL brownpolyethylene
1 125-mL amberglass
1 250-mL sterile
1 250-mL sterile
1 1,000-mL clearpolyethylene
2 125-mL amberglass
Specific conductance,pH, turbidity
Total suspendedsamples
Filtered metals, 2 mLHNO3
Filtered mercury,lmLHNO3
Filtered nutrientsnitrate, nitrateorthophosphate
Filtered anions,alkalinity,dissolved solids
Filtered phosphorous,1 mL H2SO4
Filtered ammonia,1 mL H2SO4
Total organic carbon,1 mL H2SO4
Total coliform
Fecal coliformFiltered cyanide,
10 mL NaOHFiltered triazines,
ELISA
28 daysimmediately
2 days7 days
6 months
28 days
28 days2 days
14 days
28 days
28 days
28 days
6 hours
6 hours14 days
14 days
Raw, rinse bottle three times, untreated,churn
Raw, rinse bottle three times, untreated,churn
Capsule filter, rinse 50 mL, fill, add2 mL HNO3, churn
Capsule filter, rinse 50 mL, fill, add1 mL HNO3 each bottle, churn
Capsule filter, chill at 4 °C, churn
Capsule filter, untreated, churn
Capsule filter, rinse bottle three times, 1mL H2SO4, chill at 4 °C, churn
Capsule filter, rinse bottle three times, 1mL H2SO4, chill at 4 °C, churn
Raw, chill at 4 °C, no rinse, add 1 mLH2SO4, stainless-steel container
Raw, chill at 4 °C, dip centroid
Raw, chill at 4 °C, dip centroidCapsule filter, rinse bottle three times,
10 mL NaOH, chill at 4 °C, churnFilter, vacuum, glass fiber, chill at
4 °C, stainless-steel container
Key-plus water-quality constituents, totals (table 5)
1 500-mL acidrinsed
2 250-mL acidrinsed, glass
1 125-mL brownpolyethylene
1 500-mL clearpolyethylene
Total metals, 2 mLHNO3
Total mercury, 1 mLHNO3
Total nutrients
Total anions,alkalinity
6 months
28 days
2 days
14 days
Raw, rinse bottle three times, add2 mL HNO3, churn
Raw, rinse bottle three times, add1 mL HNO3 each bottle, churn
Raw, rinse bottle three times, chill at 4 °C,churn
Raw, rinse bottle three times, untreated.churn
Appendix A 55
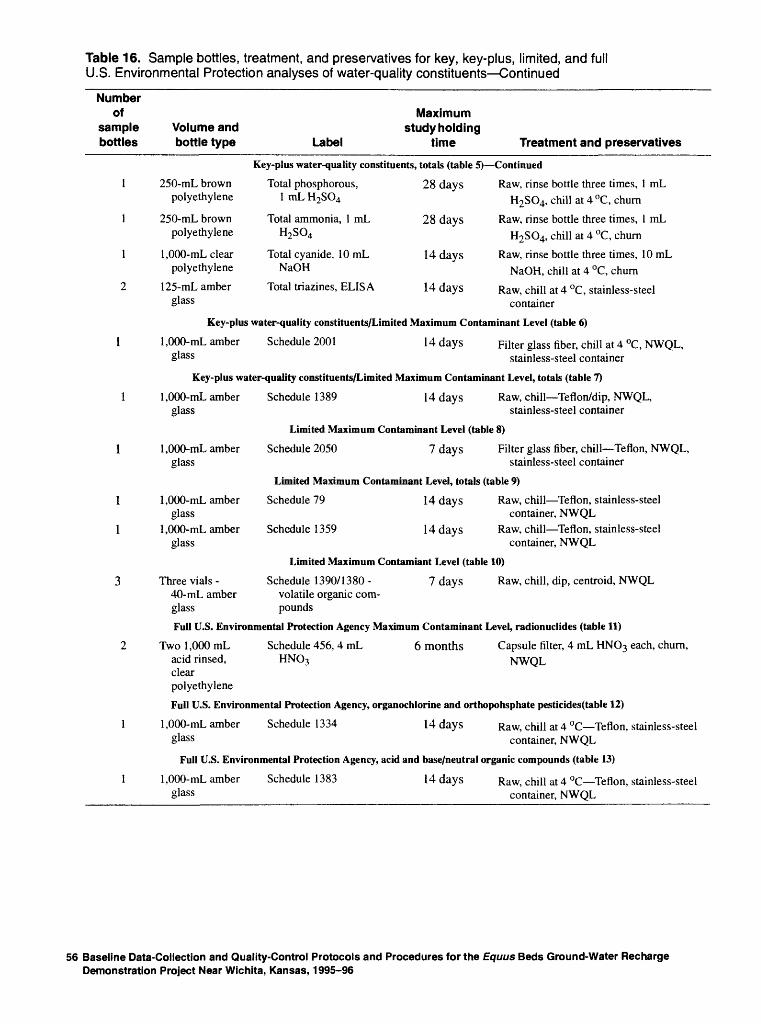
Table 16. Sample bottles, treatment, and preservatives for key, key-plus, limited, and full U.S. Environmental Protection analyses of water-quality constituents Continued
Number of
sample bottles
l
i
l
2
1
Volume and bottle type Label
Maximum study holding
time Treatment and preservatives
Key-plus water-quality constituents, totals (table 5) Continued
250-mL brown Total phosphorous, 28 days Raw, rinse bottle three times, 1 mL polyethylene 1 mL H2SO4 H2SO4, chill at 4 °C, churn
250-mL brown Total ammonia, 1 mL 28 days Raw, rinse bottle three times, 1 mL polyethylene H2SO4 H2SO4, chill at 4 °C, churn
1,000-mL clear Total cyanide, 1 0 mL 14 days Raw, rinse bottle three times, 10 mL polyethylene NaOH NaOH chill at 4 OQ chum
125-mL amber Total triazines, ELISA 14 days Raw, chill at 4 °C, stainless-steel §lass container
Key-plus water-quality constituents/Limited Maximum Contaminant Level (table 6)
1,000-mL amber Schedule 2001 14 days Filter glass fiber, chill at 4 °C, NWQL, §lass stainless-steel container
Key-plus water-quality constituents/Limited Maximum Contaminant Level, totals (table 7)
1,000-mL amber Schedule 1389 14 daysglass
1,000-mL amber glass
1,000-mL amberglass
1,000-mL amberglass
Three vials - 40-mL amber glass
Raw, chill Teflon/dip, NWQL, stainless-steel container
Limited Maximum Contaminant Level (table 8)
Schedule 2050 7 days Filter glass fiber, chill Teflon, NWQL, stainless-steel container
Limited Maximum Contaminant Level, totals (table 9)
Schedule 79 14 days Raw, chill Teflon, stainless-steelcontainer, NWQL
Schedule 1359 14 days Raw, chill Teflon, stainless-steelcontainer, NWQL
Limited Maximum Contamiant Level (table 10)
Schedule 1390/1380 - 7 days Raw, chill, dip, centroid, NWQL volatile organic com pounds
Full U.S. Environmental Protection Agency Maximum Contaminant Level, radionuclides (table 11)
Two 1,000 mL Schedule 456, 4 mL 6 months Capsule filter, 4 mL HNO3 each, churn,NWQLHNOiacid rinsed,
clearpolyethylene
Full U.S. Environmental Protection Agency, organochlorine and orthopohsphate pesticides(table 12)
1,000-mL amber Schedule 1334 14 days Raw, chill at 4 °C Teflon, stainless-steel glass container, NWQL
Full U.S. Environmental Protection Agency, acid and base/neutral organic compounds (table 13)
1,000-mL amber glass
Schedule 1383 14 days Raw? chill at 4 °C Teflon, stainless-steel container, NWQL
56 Baseline Data-Collection and Quality-Control Protocols and Procedures for the Equus Beds Ground-Water Recharge Demonstration Project Near Wichita, Kansas, 1995-96
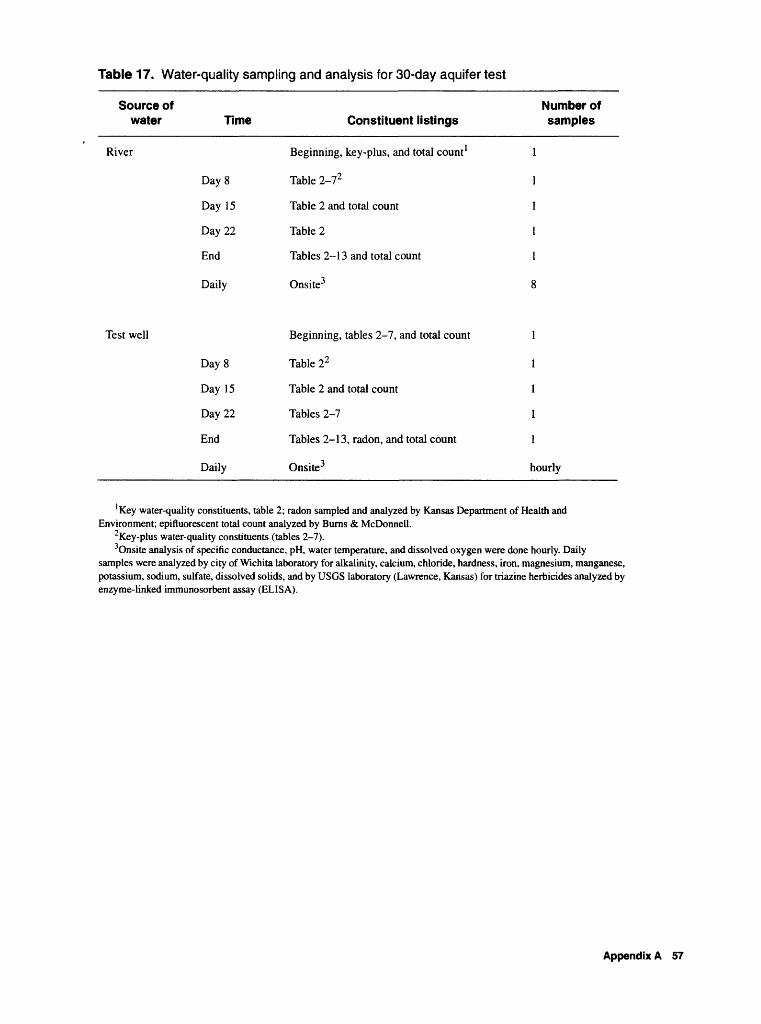
Table 17. Water-quality sampling and analysis for 30-day aquifer test
Source of water
River
Time
DayS
Day 15
Day 22
End
Daily
Constituent listings
Beginning, key-plus, and total count1
Table 2-72
Table 2 and total count
Table 2
Tables 2-13 and total count
Onsite3
Number of samples
1
1
1
l
l
8
Test well Beginning, tables 2-7, and total count
Day8
Day 15
Day 22
End
Daily
Table 22
Table 2 and total count
Tables 2-7
Tables 2-13, radon, and total count
Onsite3
1
1
1
1
hourly
'Key water-quality constituents, table 2; radon sampled and analyzed by Kansas Department of Health and Environment; epifluorescent total count analyzed by Burns & McDonnell.
"Key-plus water-quality constituents (tables 2-7).3Onsite analysis of specific conductance, pH, water temperature, and dissolved oxygen were done hourly. Daily
samples were analyzed by city of Wichita laboratory for alkalinity, calcium, chloride, hardness, iron, magnesium, manganese, potassium, sodium, sulfate, dissolved solids, and by USGS laboratory (Lawrence, Kansas) for triazine herbicides analyzed by enzyme-linked immunosorbent assay (ELISA).
Appendix A 57