Embed Size (px)
Citation preview

Statistics Study Guide
Matthew ChesnesThe London School of Economics
September 22, 2001

1 Descriptive Statistics
• Pictures of Data: Histograms, pie charts, stem and leafs plots, scatter plots, OGives
– OGive: A measure of cummulative distribution percentages. Compute reason-able intervals for data and determine their frequency, then their cummulativefrequency, and finally their percentage frequency (percentile). Plot percentagesat the upper end of the intervals. Easy way to display quartiles.
– Stem and Leaf Plot: Stem is the major part of the data and leaves are minorpart. Choose a reasonable unit for the stem. Organize leaves in order of magni-tude. If leaves are too large, split stem into smaller intervals. Placing the leavesequidistant, provides a histogram like representation.
– ”A Diagram is Interacting the Eye” - B. Blight.
• Measures of Data: Mean, Median, Mode, Standard Deviation, Quartiles
• Right Skewed Data - positively skewed - long right tail
• Left Skewed Data - negatively skewed - long left tail
• Measures of Location and Spread
– Mean: Average (stable value and useful in analysis though sensitive to outliers).
– Mode: Data value that occurs most often ... highest peak in the pdf of thecontinuous case.
– Median: 50th percentile (Insensitive to outliers though not as useful in statisticalinference)
– Range: Max - Min (Crude and inaccurate)
– Interquartile Range: 75th − 25th quartile.
– Sample standard deviation, s, an estimate of population standard deviation, σ,
s =
√Corrected sum of Squares
n− 1=
√∑ni=1(xi − x)2
n− 1.
– The standard deviation is calulated on n-1 degrees of freedom rather than nbecause dividing by n would yield a biased estimator.
– Alternative form of s:
CSS =n∑
i=1
x2i − nx2 = Raw sum of squares - correction
s =
√∑ni=1 x2
i − nx2
n− 1.
• Location Transformations: y = x + 5 −→ sd(y) = sd(x).
• Scale Transformations: y = 5x −→ sd(y) = 5sd(x).
2

2 Probability
• Additive Law: P (A ∪B) = P (A) + P (B)− P (A ∩B).
• Exclusive Events: P (A ∪B) = P (A) + P (B).
• Total Probability: P (A) + P (Ac) = 1.
• Demorgan’s Laws: P (Ac ∩Bc) = P ((A ∪B)c), and P (Ac ∪Bc) = P ((A ∩B)c).
• Combinatorial: nCx =n!
x!(n− x)!.
2.1 Conditional Probability - Baysian Statistics
• Bayes Rule: P (A|F ) =P (A ∩ F )
P (F )=
P (F |A) ∗ P (A)
P (F ).
• Independence: A and B are independent iff: P (A|B) = P (A). ThereforeP (A ∩B)
P (B)=
P (A). Thus, P (A ∩B) = P (A) ∗ P (B). **Only if A and B are independent.**
• Exclusive events are VERY dependent. One happening completely excludes the possi-bility of the other occuring.
• The Law of Total Probability: P (A) = P (A ∩ B) + P (A ∩ Bc) = P (A|B) ∗ P (B) +P (A|Bc) ∗ P (Bc).
• So in general, Bayes Law can be written,
P (Bi|A) =P (A|Bi) ∗ P (Bi)∑ni=1 P (A|Bi) ∗ P (Bi)
.
3
3 Discrete Probability Distributions of Random Vari-
ables
3.1 The Binomial Distribution
• Bernoulli Trials: A series of n independent trials under the same circumstances. Theprobability of success, P(success), in all trials is identical.
• P (k successes in n trials) = (nCk)pk(1− p)n−k.
• Cumulative Distribution Function: Fk = P (K ≤ k).
3.2 Other Discrete Distributions
• Hypergeometric: Not independent trials, sampling without replacement. As n → ∞,hypergeometric → Binomial.
• Negative Binomial: The distribution of the number of trials needed to get k successes.
• Multinomial: Generalization of binomial for more than 2 classifications.
3.3 The Poisson Distribution
• Discrete Distribution
• Applications: Measuing random arrival times: components that break down over time,Defective items in a large batch.
• Memoryless Property: A every point in time, there is always the same chance of theevent occurring.
• Arrival rate: λ.
• P (r arrivals in time t) =λre−λ
r!.
• The rate, λ, is in terms of time, t.
• Use Poisson approximation for the binomial when n is large AND p is either large (∼ 1)or small (∼ 0). Thus, use the poisson approximation if np < 10. Then PDFPoisson =(np)re−np
r!.
4

4 Properties of Random Variables
• A random variable is not a number, it’s a concept.
• The mean of X.
– The probability weighted average of all the values that the random variable cantake.
– µ =∑n
i=1 xipi = E[X].
– If X is distributed binomially, E[X] = np.
– If X is distributed poisson, E[X] = λ.
– Expectation is a linear operator.
– E[a + bX] = a + bE[X].
• Variance and Standard Deviation of X.
– R is a random variable
– σ2R = E[(R− µ)2] =
∑r(r − µ)2pr.
– Alternate Form: σ2R = E[(R)2]− (E[R])2.
– Rearranging for an important and useful result: σ2R + µ2 = E[(R)2].
– If X is distributed binomially, σ2X = npq.
– If X is distributed poisson, σ2X = λ.
5

5 Continuous Probability Distributions
• X is a continuous random variable.
• P (X ≤ 2) = P (X < 2).
• Cumulative Distribution Function: CDF = F (x) = P (X ≤ x).
• F (−∞) = 0. and F (+∞) = 1.
• E[X] = µ =∫ +∞−∞ xf(x)dx.
• σ2X = E[(X)2]− (E[X])2.
5.1 The Uniform Distribution
• Constant PDF over the range of the distribution.
5.2 The Exponential Distribution
• Consider the Poisson process with points occuring at random in time. λ is the averagenumber of occurances per unit of time. The time between occurances is a continuousrandom variable, X, and it follows an exponential distribution.
• 1− F (x) = P (X > x) = P (0 occurances over the interval from (0,x)) =
e−λx(λx)0
0!= e−λx.
• Thus F (x) = 1− e−λx.
• Thus f(x) = ddx
(1− e−λx) = λe−λx.
• If X is distributed exponentially, E[X] = 1λ.
• If X is distributed exponentially, σ2X = 1
λ2 .
5.3 The Normal Distribution
• The Central Limit Theorem: If n value are sampled from a population and if n issufficiently large, then the sample mean (or sum) is normally distributed whatever thedistribution of the parent population.
• If parent is normal, “n large” → n relatively small.
• If parent is very nonnormal, “n large” → about 50 at most.
• Standard Normal Distribution: µ = 0, σ = 1.
6

• Probability Density function for standard normal:
f(z) =1√2π
e−12z2
.
• The general normal probability density function X ∼ N(µ, σ2):
f(x) =1√
2πσ2e
12(x−µ
σ)2 .
• Standardization procedure: z =x− µ
σ
• Combining Random Variables
– E[aX + bY ] = aE[X] + bE[Y ] = aµX + bµY .
– σ2[aX + bY ] = a2σ2X + b2σ2
Y + 2ab ∗ Cov(X, Y ).
– σ2[aX − bY ] = a2σ2X + b2σ2
Y − 2ab ∗ Cov(X,Y ).
– σ2[3 + 2X] = 4σ2X .
– Theorem: Any linear function of normal variables is itself normally distributed.
• Normal Approximation to the binomial: If R ∼ Binomially with n trials and p, theprobability of success, as n → ∞, but p remains constant, R → Normal. As n → ∞,but np remains constant (therefore p → 0), R → Poisson (Use Poisson if np < 10). IfR → Normal, R ∼ N(np, npq). IMPORTANT ... when using the normal approximationto the binomial, remember to add or subtract a half when computing intervals or findingcritical values to reflect the discreteness of the original distribution.
7

6 Sampling Theory
• Let X ∼ N(µ, σ2).
• Let Q =∑
i xi∀xi ∈ X.
• Then Q ∼ N(nµ, nσ2).
• Thus X = Qn.X ∼ N(µ, σ2
n).
• The Standard Deviation of X =σ√n
= The standard error.
• Parameters, Estimators, and Standard Errors.
– Parameter = µ ; Estimator = x ; Standard Error =σ√n
.
– Parameter = p ; Estimator =r
n; Standard Error =
√pq
n.
– Parameter = µX − µY ; Estimator = x− y; Standard Error =
√σ2
X
nX
+σ2
Y
nY
.
– Parameter = p1 − p2 ; Estimator = r1
n1− r2
n2; Standard Error =
√p1q1
n1
+p2q2
n2
.
• Distribution of Sample Variance:
(n− 1)s2
σ2∼ χ2
n−1.
• Application of χ2: ∑(xi − x)2
σ2=
CSS
σ2=
Sxx
σ2∼ χ2
n−1.
• E[χ2n] = n.
• σ2[χ2n] = 2n.
8
7 Estimation
7.1 Point Estimation
• We want to estimate some parameter, Θ using an estimator, µ.
• Calculate The Mean Square Error = MSE = E[(µ−Θ)2].
• Square out to find MSE = σ2µ + (E[µ]−Θ)2.
• Or otherwise written, MSE = Variance + bias2.
• Desirable properties of estimators: unbiased: E[estimator] = parameter. Efficient:Small variance.
• For example, E[s2] = E[CSS
n− 1] = E[
∑(x− x)2
n− 1] = σ2.
• Hence dividing by the n-1 is explained because it gives us an unbiased estimator.
• However, efficiency is more important than unbiasedness. If one estimator is slightlybiased but extremely efficient, use it because of the high variability of the alternative.
7.2 Interval Estimation
• A 95% confidence interval for the mean, µ, of a normally distributed X is,
µ ∈ (x± Zcrit(2.5%) ∗ SE(x) = µ ∈ (x± 1.96 ∗ σ√n
).
• An incorrect interpretation of this interval would be: “There is a 95 percent chancethat x is within 1.96 standard errors of µ.”
• A correct (purist) statement would be: “if you took many samples and calculatedthe confidence interval for a parameter each time, then 95 percent of the confidenceintervals would contain the true value of the parameter.”
• This is because the interval is the thing that has variability, not µ. µ is a constant.
• Confidence intervals for proportions:
p ∈ (r
n± Zcrit
√rn(1− r
n)
n).
• A 95 percent CI for Comparing Proportions:
p1 − p2 ∈ (r1
n1
− r2
n2
± Zcrit
√p1q1
n1
+p2q2
n2
).
9

• Sample size Determination. Define d to be the Tolerance or the half length of theconfidence interval. To obtain a 95 percent confidence interval for a mean to be with
in a certain tolerance, d, set n =Zcritσ
d
2
. One may have to estimate σ with s using a
small sample first and then determine optimal n.
• In general, d = Zcrit ∗ SE, and the SE involves n, so solve for n and plug in d.
• Exact formulation of the variance of x :
V ar(x) =σ2
n(1− n
N).
If N is very large, this correction term has little to no effect.
7.3 Confidence Intervals for Small samples
• Suppose the sample is small and the variance is unknown. A confidence interval for µis,
µ ∈ (x± tcritn−1 ∗
s√n
).
• The t distribution, AKA, the student’s t distribution, is more spread out to allow forthe variability of both x and s. If σ is known, use Z distribution for sure. (Unlessn is incredibly low). If n is large, use Z because even though the t distribution istheoretically correct, t → Z as n →∞.
• One other case: if n is small and the distribution is really not normal (the central limittheory does not apply), then one must use a non paratmetric approximation.
• Comparison of Means: 3 cases.
– Paired Data. Calculate di = xi − yi. We want an estimate for µd = µx − µy. Soconfidence interval becomes,
µd ∈ (d± tn−1(sd√n
)).
We use the t distribution because n is small and we are estimating sd.
– Unpaired Large Samples. µx − µy estimated by x − y. Thus the standard errorhere is,
Sx−y =
√S2
x
nx
+S2
y
ny
.
And thus a confidence interval becomes,
µx − µy ∈ (x− y ± Zcrit ∗
√S2
x
nx
+S2
y
ny
).
10

– Unpaired Small samples. Must make the assumption that the variances of thetwo samples is the same! Risky assumption. Assume σ1 = σ2 = σp. Thus,
Sp =
√CSS1 + CSS2
n1 + n2 − 2=
√(n1 − 1)S2
1 + (n2 − 1)S22
n1 + n2 − 2.
And,
SE = Sp
√1
n1
+1
n2
=
√(n1 − 1)S2
1 + (n2 − 1)S22
n1 + n2 − 2
√1
n1
+1
n2
.
Notice that S2p is a weighted function of the sample variances with each’s degrees
of freedom as the weights. The test statistic for a hypothesis test or a confidenceinterval will follow a t distribution with n1 + n2 − 2 degrees of freedom.
7.4 Confidence Intervals for a Variance
• S2 =Sxx
n− 1. S2 is not normally distributed. Since E[S2] = σ2, we can rearrange the
terms and it can be shown that,Sxx
σ2∼ χ2
n−1. Read off Chi squared values off the table
for upper and lower limits for n− 1 degrees of freedom. Then,
0.95 = P (χ2 <Sxx
σ2< χ2).
0.95 = P (Sxx
χ2< σ2 <
Sxx
χ2).
Thus,
σ2 ∈ ((n− 1)S2
χ2n−1
,(n− 1)S2
χ2n−1
).
11

8 Hypothesis Testing
• Testing H0 versus H1.
• Always choose the null hypothesis to be the simpler of the two alternatives.
• Type I Error: Rejecting H0 when it is true. (α)
• Type II Error: Failing to reject H0 when it is false. (β)
• α and β both decrease with a larger sample size.
• Power Function: The probability of accepting H1 (rejecting H0) for different values ofthe true parameter, µ.
• Some might use the terminology, “Accepting H1.” But this would be incorrect if itimplies proof. All we are saying is that the available data supports the hypothesis.Purists would never just accept, they would use the terminology, “Fail to reject H0.
• To carry out test, define hypotheses, compute test statistic and compare with therelevant distribution.
• If n is large, use the Z distribution for your decision.
• If n is smaller and σ is unknown, use the t distribution.
• If a test statistic is on a division point of the critical values, maybe you cannot confi-dently reject H0, but you should be very suspicious that it is actually true.
• Always report lowest possible α level (highest possible confidence). Doing otherwise isjust ignorant. - C.Dougherty
• The P value of the test tells you exactly where the test statistic lies: it’s the probabiltythat under the null hypothesis, you observe an estimate as or more extreme then yourvalue.
• When computing standard errors for test, always compute them with null values. Sincewe are assuming that the null is true until proven guilty, one must use its values whendoing the test.
• Advantage of Paired Test: must less sensitive.
• Never use the data to form your hypothesis: choose the nature of the test (one tailedor two tailed, null and alternative hypotheses, etc) first and then carry out the testusing the data.
12

9 Tests for Association
• Association: Relating factors via cross tabulated data. (catagorized data)
• Correlation: Relating variables via measurement data.
• Display data in a mXn contingency table. Where m and n are the number of factorsyour comparing, not the levels. Usually just a 2X2.
• Test H0 = No Association Versus H1 =Association.
• After setting up the tables you have your O’s (observed data).
• Compute the E’s (Expected data) as, E =Row Total * Column Total
Grand Total.
• Find Peirceson’s Test Statistic as,
P =∑
i
(Oi − Ei)2
Ei
∼ χ2(r−1)(c−1).
• The larger the statistic, P, the larger the likelihood of rejecting H0 in favor of Associ-ation.
• The statistic is distributed as a Chi Squared with (row-1)(col-1) degress of freedom.
13

10 Further Properties of Random Variables
• Let R be a random variable with p.d.f, pr.
• Let T be some function, φ(R).
• Then Prob(T=t) =∑
pr where∑
is over all the values of r such that φ(r) = t. Workout the distributions of R and then T to see that this is true.
• Theorem: For a random variable X and a random variable Y = φ(X) such that φ is amonotonic function, the c.d.f. for X equals the c.d.f. for Y . F (x) = G(y).
• Also, (IMPORTANT THEOREM), for the same transformation, φ, g(y) = f(x)|dxdy|.
• For a general transformation on a random variable (φ not necessarily monotonic), justlook at the graph of the transformed X, and evaluate the above theorem over eachmonotonic section.
• Joint density functions of two random variables: f(x, y). This is simply a surface inthree dimensions with the volume under the surface (instead of area under the curve)representing probability. Total volume under the surface is again equal to one. All ofBaye’s calculus on probabilities also applies to density functions.
• f(y) =∫
f(y|x)f(x)dx.
• If X and Y are independent, f(x, y) = f(x)f(y).
10.1 Covariance and Correlation
• Covariance: Cov(X, Y ) = γ = E[(X − µX)(Y − µY )].
• If γ > 0, X and Y work in the same direction.
• If γ < 0, X and Y work in the opposite direction.
• It can also be shown that Cov(X, Y ) = E[XY ]− E[X]E[Y ].
• Since the covariance depends on the units of the random variable, we define the corre-lation coefficient to be,
ρ =γ
σXσY
.
• ρ is the “Linear Correlation Coefficient,” and it lies between -1 and 1.
• If X and Y are independent, it can be shown that the Cov(X, Y ) = 0
• If X is a linear function of Y , then ρXY = ±1.
• Properties of Variance and Covariance.
14

– V ar(aX + bY ) = a2V ar(X) + b2V ar(Y ) + 2abCov(X, Y ).
– Variance is a “second-order” operator.
– Variances always add, though the covariance term takes the sign of ab.
– 3 variable case: V ar(aX + bY + cZ) = a2V ar(X) + b2V ar(Y ) + +c2V ar(Z) +2abCov(X,Y ) + 2acCov(X, Z) + 2bcCov(Y, Z).
– Cov(aX+bY, cS+dT ) = acCov(X, S)+adCov(X,T )+bcCov(Y, S)+bdCov(Y, T ).
15

11 Matrix Notation for the Multivariate Normal Dis-
tribution
• Define ~X to be a p column vector of random variables.
• ~X ∼ N(~µ, ~∑).
• ~∑ is the correlation matrix. All diagonal elements of this matrix are the variances ofeach of the random variables. The off diagonal entries are covariances. It is of coursea symmetric matrix.
• ~∑ = E[( ~X − ~µ)( ~X − ~µ)T ].
• Theorem: If ~X ∼ N(0, ~∑), (ie, is multivariate normal), Then ~XT ~∑−1~X ∼ χ2
p.
16
12 Correlation and Regression
• 6 Basic Statistics needed for regression.
• n, sample size; x, sample mean of independent variable; y, sample mean of dependentvariable; Sxx, the corrected sum of squares for the x’s; Syy, the corrected sum of squaresfor the y’s; Sxy, the corrected sum of products for x and y.
• Sxx =∑
i(xi − x)2.
• Syy =∑
i(yi − y)2.
• Sxy =∑
i(xi − x)2(yi − y)2 =∑
i(xiyi)− nxy.
12.1 Correlation Coefficient and Tests
• Covariance = c =Sxy
n− 1.
• Correlation = r =c
SxSy
=Sxy√SxxSyy
.
• A correlation of zero means that there is no “linear” relationship between X and Y butdoes not necessarily mean there is no relationship at all ... it could be nonlinear.
• Test for Correlation: H0 : ρ = 0 versus H1 : ρ 6= 0.
• Test Statistic =r√
n− 2√1− r2
.
12.2 Simple Linear Regression
• Use scatterplots of the data as a starting point.
• Simple Linear Model: yi = α + βxi + εi.
• Error term, εi ∼iid N(0, σ2).
• Least Squares Criteria: Minimize wrt α and β,
Q =∑
i
(yi − α− βxi)2.
• Yields estimators,
b =Sxy
Sxx
.
a = y − bx.
• It can be shown that a and b are B.L.U.E. : Best, Linear, Unbiased, Estimators.
17

• Property: (x, y) always lies on the LS regression line.
• Property:∑
i ei = 0. (The residuals always sum to 0).
• In general, with n observations and p parameters (including the constant),
s2 =
∑i e
2i
n− pis an unbiased estimator ofσ2.
• Define RSS = Residual Sums of Squares =∑
i(yi − a− bxi)2. Thus RSS =
∑i e
2i .
• Thus s2 =RSS
n− p.
• Arranging the definition of RSS, we find,
RSS = Syy − b2Sxx.
Or in other words, RSS is the extra variability in y that we cannot explain after fittingthe model.
• If Syy is the total variability, then b2Sxx is the explained variability.
• Analysis of Variance Table.
Source Degrees of Freedom Sums of Squares Mean SquareRegression (Explained) p− 1 b2Sxx S2
r
Residual (Unexplained) n− p RSS = Syy − b2Sxx S2 = RSSn−p
Total n− 1 Syy S2T
• Define,
R2 =b2Sxx
Syy
=S2
xy
SxxSyy
.
• R2 is the percentage of the variability in y that is explained by the independent variablesvia the regression equation. In words, it is the explained variability over the totalvariability, so it is a good measure of how well the line fits the data.
• In simple linear regression, we saw the that the correlation coefficient, r =Sxy√SxxSyy
.
Thus, in SLR, R2 = r2. This doesn’t apply to multiple regression because there wehave many correlations and only one R2 value.
• Adjusted R2. Good for comparing models in the multiple regression setting. Reflectsthe addition of more variables, while always increasing R2, might lead to a worse model.Define,
R2adj =
S2T − S2
S2T
.
18
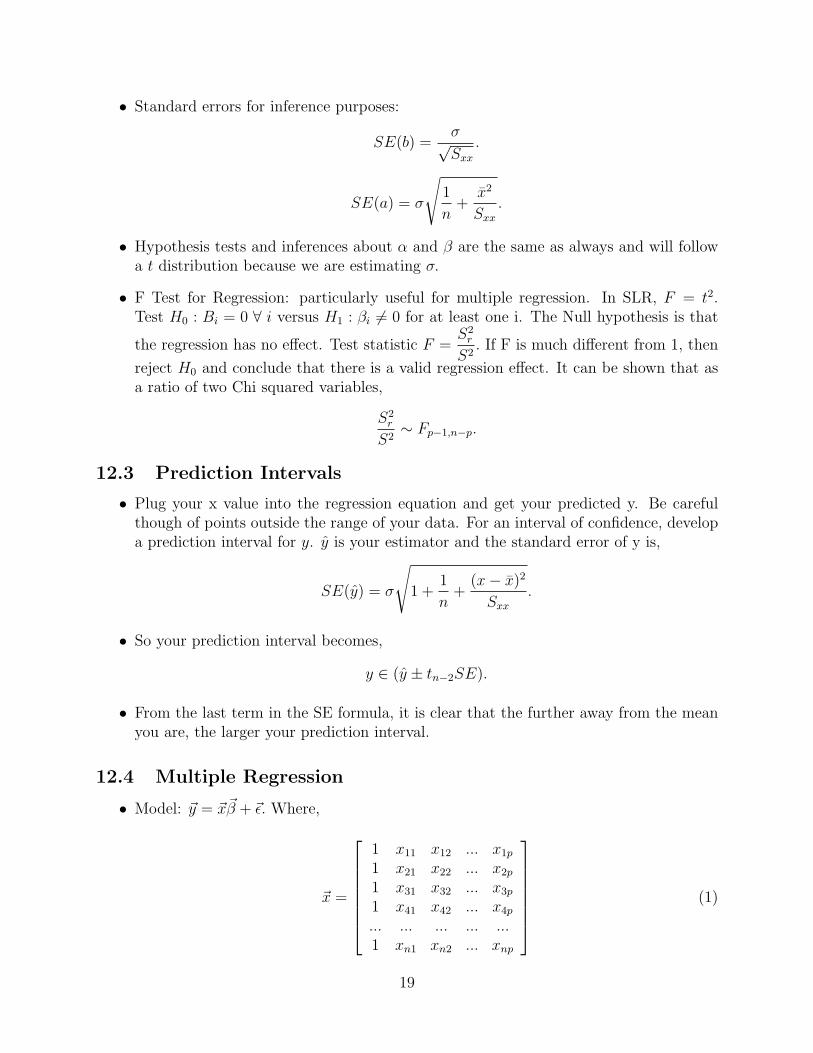
• Standard errors for inference purposes:
SE(b) =σ√Sxx
.
SE(a) = σ
√1
n+
x2
Sxx
.
• Hypothesis tests and inferences about α and β are the same as always and will followa t distribution because we are estimating σ.
• F Test for Regression: particularly useful for multiple regression. In SLR, F = t2.Test H0 : Bi = 0 ∀ i versus H1 : βi 6= 0 for at least one i. The Null hypothesis is that
the regression has no effect. Test statistic F =S2
r
S2. If F is much different from 1, then
reject H0 and conclude that there is a valid regression effect. It can be shown that asa ratio of two Chi squared variables,
S2r
S2∼ Fp−1,n−p.
12.3 Prediction Intervals
• Plug your x value into the regression equation and get your predicted y. Be carefulthough of points outside the range of your data. For an interval of confidence, developa prediction interval for y. y is your estimator and the standard error of y is,
SE(y) = σ
√1 +
1
n+
(x− x)2
Sxx
.
• So your prediction interval becomes,
y ∈ (y ± tn−2SE).
• From the last term in the SE formula, it is clear that the further away from the meanyou are, the larger your prediction interval.
12.4 Multiple Regression
• Model: ~y = ~x~β + ~ε. Where,
~x =
1 x11 x12 ... x1p
1 x21 x22 ... x2p
1 x31 x32 ... x3p
1 x41 x42 ... x4p
... ... ... ... ...1 xn1 xn2 ... xnp
(1)
19

And,
~β =
αβ1
β2
...βp
. (2)
• Thus, for OLS, we minimize:
(~y − ~x~β)T (~y − ~x~β).
Which yeilds,~β = b = (~xT~x)−1(~xT~y).
20

13 Time Series
• Index numbers for a series of prices, p0, p1, ..., pt, ...
• Index = pt = 100 pt
p0.
• Laspeyres Index: For comparing prices using quantity at the base time, t0.
Pt = 100 ∗∑
q0pt∑q0p0
.
• Paasche Price Index:
Pt = 100 ∗∑
qtpt∑qtp0
.
• Quantity Index:
Pt = 100 ∗∑
qtp0∑q0p0
.
• Value Index:
Pt = 100 ∗∑
qtpt∑q0p0
.
• Index Linking. Useful to reindex from time to time, but to avoid jumps, define,
Pt = P0,t for t = 0, ..., 10.
Pt =P10,t − P0,t
100= p0,10 ∗
∑q10pt∑q10p10
for t = 10, ..., 20.
• Time Series: x0, x1, x2, ..., xt, ...
• Classical Economic Time series: xt = Tt + St + Ct + It. (Trend + Seasonal + Cyclical+ Irregular stationary component.)
• Stationary Time Series: Relate variable to itself using 1 or more lags.
• Autoregression: (xt − x) = b(xt−1 − x).
• Auto Correlation (τ is the number of lags) :
rτ =
∑(xt−x)(xt+τ−x)
n−τ−1∑(xt−x)2
n−1
.
• Models
– 1st order Autoregressive Model.
xt = λxt−1 + εt.
Where, λ ∈ (0, 1) for a stationary time series and λ > 1 for a non-stationary timeseries.
21
– 2nd order Autoregressive Model.
xt = λ1xt−1 + λ2xt−2 + εt.
– Moving Average Model.xt = εt + bεt−1.
xt+1 = εt+1 + bεt.
xt+2 = εt+2 + bεt+1.
Where every neighboring term is correlated with each other, but others are not.This can be extended to more than one lagged interaction.
– Mixed Models : ARMA Model - AutoRegressive Moving Average Models -
p∑i=0
aixt−i =
q∑i=0
biεt−i.
22