Embed Size (px)
Citation preview
Wharton Statistics Department
Feature SelectionFeature Selectionin Models For Data Miningin Models For Data Mining
Robert Stine
Statistics Department
The Wharton School, Univ of Pennsylvania
January, 2005
www-stat.wharton.upenn.edu/~stine
Wharton Statistics Department
TCNJ January, 2005 2
Questions Asked by Data MinersQuestions Asked by Data Miners Anticipate bankruptcy
- Which borrowers are most likely to default?
Adverse effects- Are patients at risk of adverse side effects from medication?
Facial recognition- How can we train computers to find faces in images?
Other domains…- Employee evaluation: Who should we hire?- Genomics: Which genes indicate risk of a disease?- Document classification: Which papers resemble this one?
Wharton Statistics Department
TCNJ January, 2005 3
Common Answer is PredictionCommon Answer is Prediction
Regardless of the context- Anticipating default on loan- Identifying presence of unexpected side effect- Deciding if there’s a face in an image
Want the model with the best predictions- Best prediction = smallest costs
Desire for accuracy motivates numerous methods- Equations: regression, logistic regression- Combined equations: graphical models, neural networks- Trees- Clustering, nearest neighbor
Wharton Statistics Department
TCNJ January, 2005 4
Similar Issues to OvercomeSimilar Issues to Overcome
Rare events- Few cases frequently dominate costs- Lots of images, but few faces most of the time- Numerous credit cards, few that will default
Wide data sets: more features than cases- Cheaper to get measurements than cases- Categorical data, networks, missing data…
Synergies add further possibilities- Long lists of database features, none predictive- Combinations are predictive, but so many.

Wharton Statistics Department
TCNJ January, 2005 5
DataData’’s getting obese!s getting obese!
Number of RawFeatures
Number ofCases
Application
3503,000,000Bankruptcy
1,40010,000Faces
10,0001,000Genetics
∞500CiteSeer
Wharton Statistics Department
TCNJ January, 2005 6
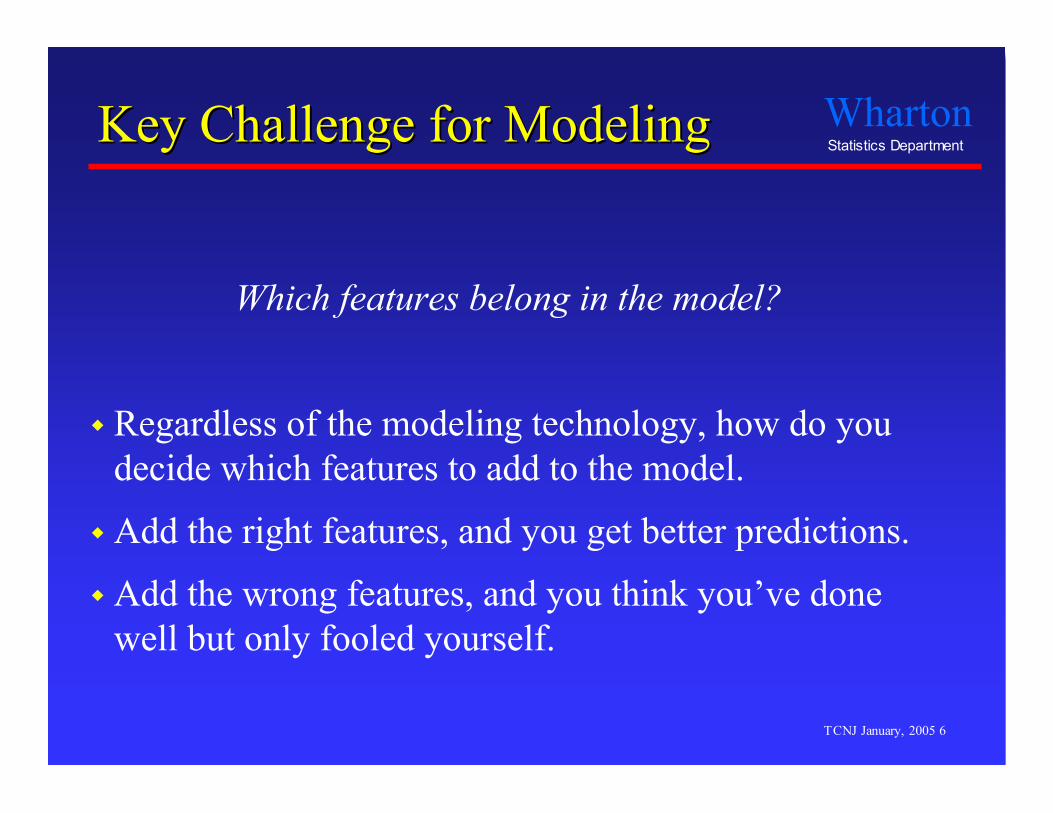
Key Challenge for ModelingKey Challenge for Modeling
Which features belong in the model?
Regardless of the modeling technology, how do youdecide which features to add to the model.
Add the right features, and you get better predictions.
Add the wrong features, and you think you’ve donewell but only fooled yourself.
Wharton Statistics Department
TCNJ January, 2005 7
ExampleExample
Predict the direction of the stock market- Use data from 2004 to predict market returns in 2005.
Data- Daily returns (percentage changes) on the S&P 500 index
during the last 3 months of 2004.
Predictors- 12 technical trading rules- These are known for January 2005 ahead of time and so can
be used to predict future returns.
Next slides show plots, then the model…
Wharton Statistics Department
TCNJ January, 2005 8
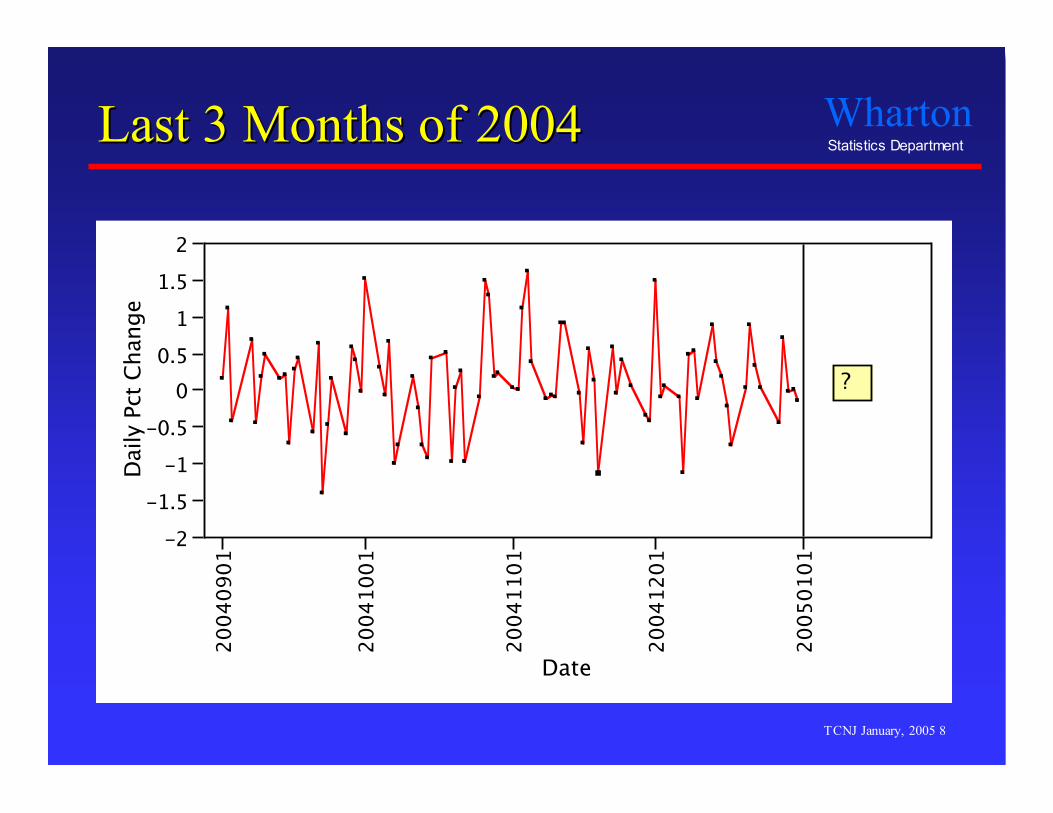
Last 3 Months of 2004Last 3 Months of 2004
-2
-1.5
-1
-0.5
0
0.5
1
1.5
2
Daily P
ct
Change
20
04
09
01
20
04
10
01
20
04
11
01
20
04
12
01
20
05
01
01
Date
?
Wharton Statistics Department
TCNJ January, 2005 9
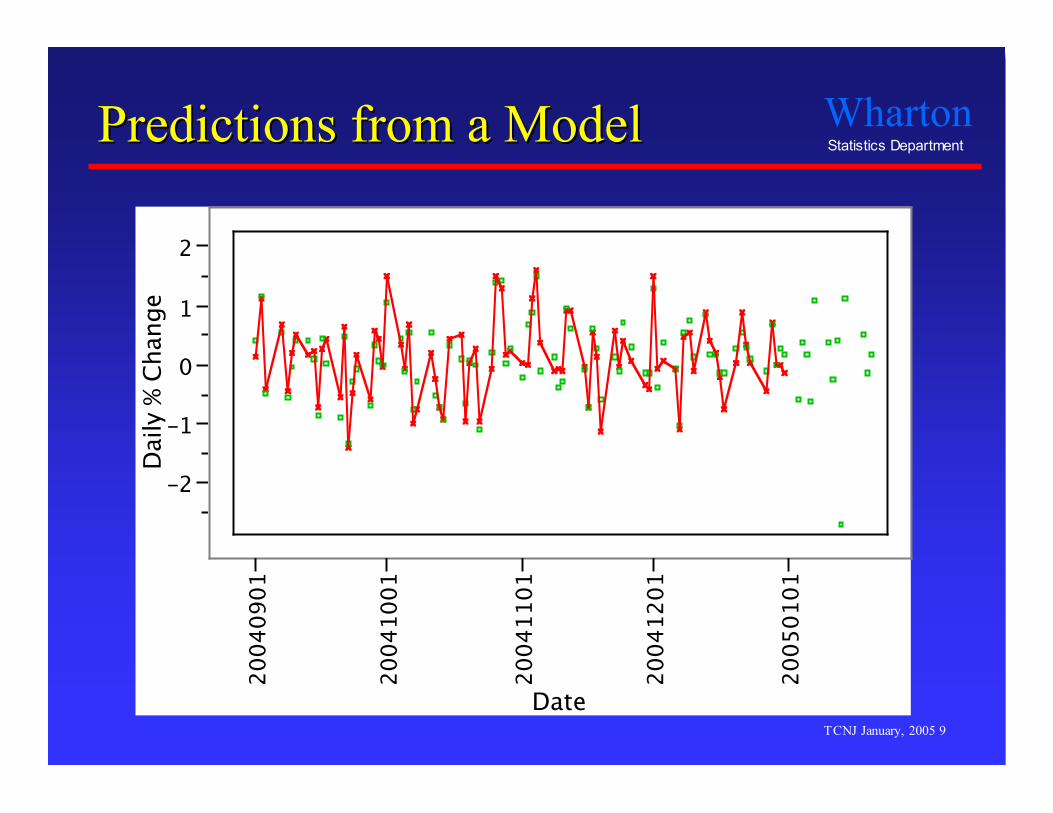
Predictions from a ModelPredictions from a Model
-2
-1
0
1
2
Daily %
Change
20
04
09
01
20
04
10
01
20
04
11
01
20
04
12
01
20
05
01
01
Date
Wharton Statistics Department
TCNJ January, 2005 10
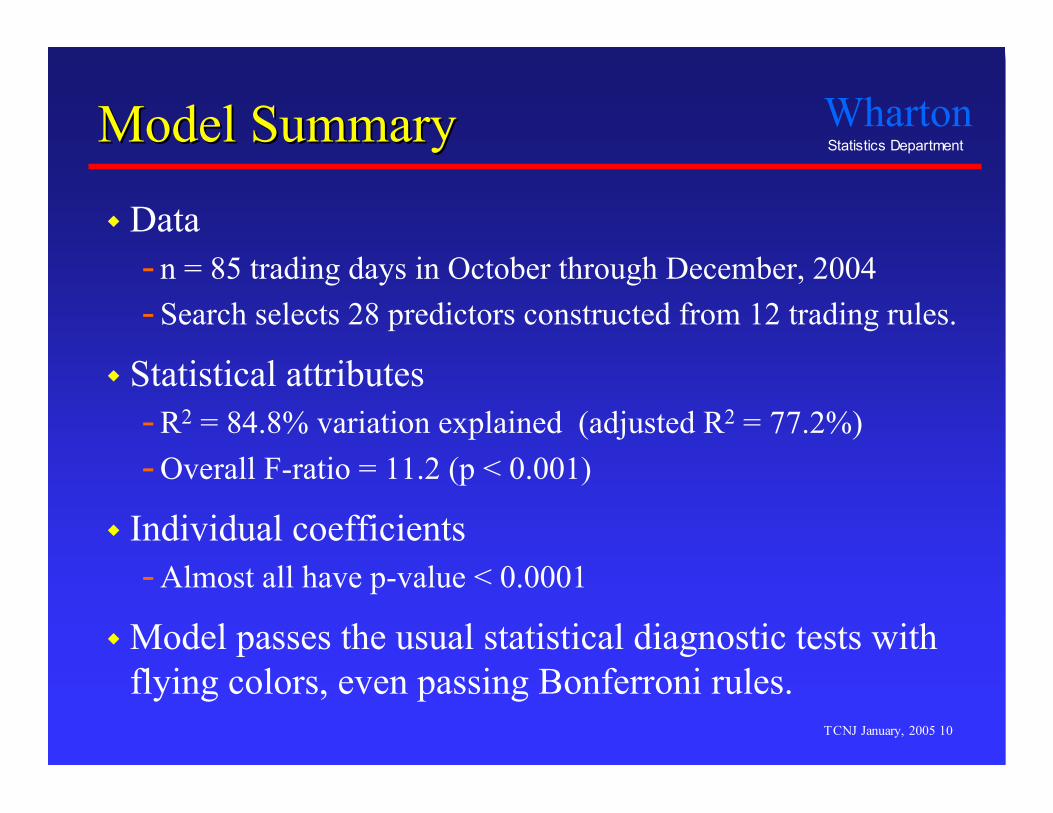
Model SummaryModel Summary
Data- n = 85 trading days in October through December, 2004- Search selects 28 predictors constructed from 12 trading rules.
Statistical attributes- R2 = 84.8% variation explained (adjusted R2 = 77.2%)- Overall F-ratio = 11.2 (p < 0.001)
Individual coefficients- Almost all have p-value < 0.0001
Model passes the usual statistical diagnostic tests withflying colors, even passing Bonferroni rules.
Wharton Statistics Department
TCNJ January, 2005 11
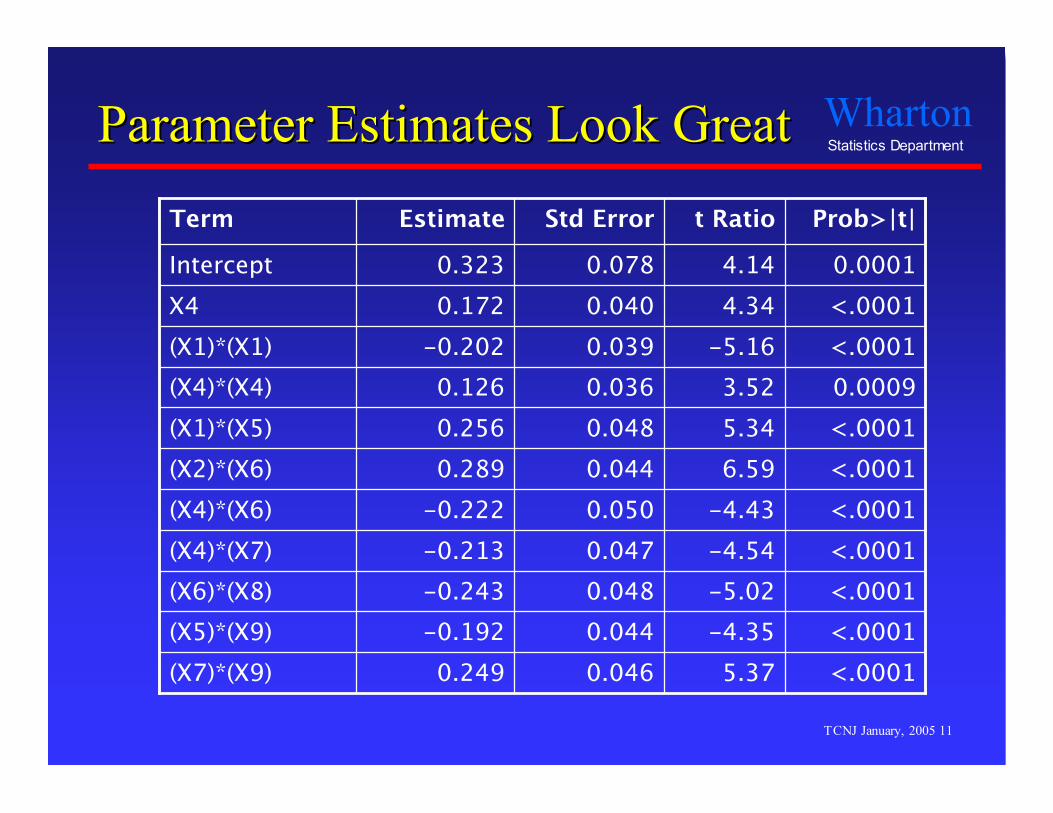
Parameter Estimates LookParameter Estimates Look GreatGreat
<.00015.370.0460.249(X7)*(X9)<.0001-4.350.044-0.192(X5)*(X9)<.0001-5.020.048-0.243(X6)*(X8)<.0001-4.540.047-0.213(X4)*(X7)<.0001-4.430.050-0.222(X4)*(X6)<.00016.590.0440.289(X2)*(X6)<.00015.340.0480.256(X1)*(X5)0.00093.520.0360.126(X4)*(X4)<.0001-5.160.039-0.202(X1)*(X1)<.00014.340.0400.172X40.00014.140.0780.323Intercept
Prob>|t|t RatioStd ErrorEstimateTerm
Wharton Statistics Department
TCNJ January, 2005 12
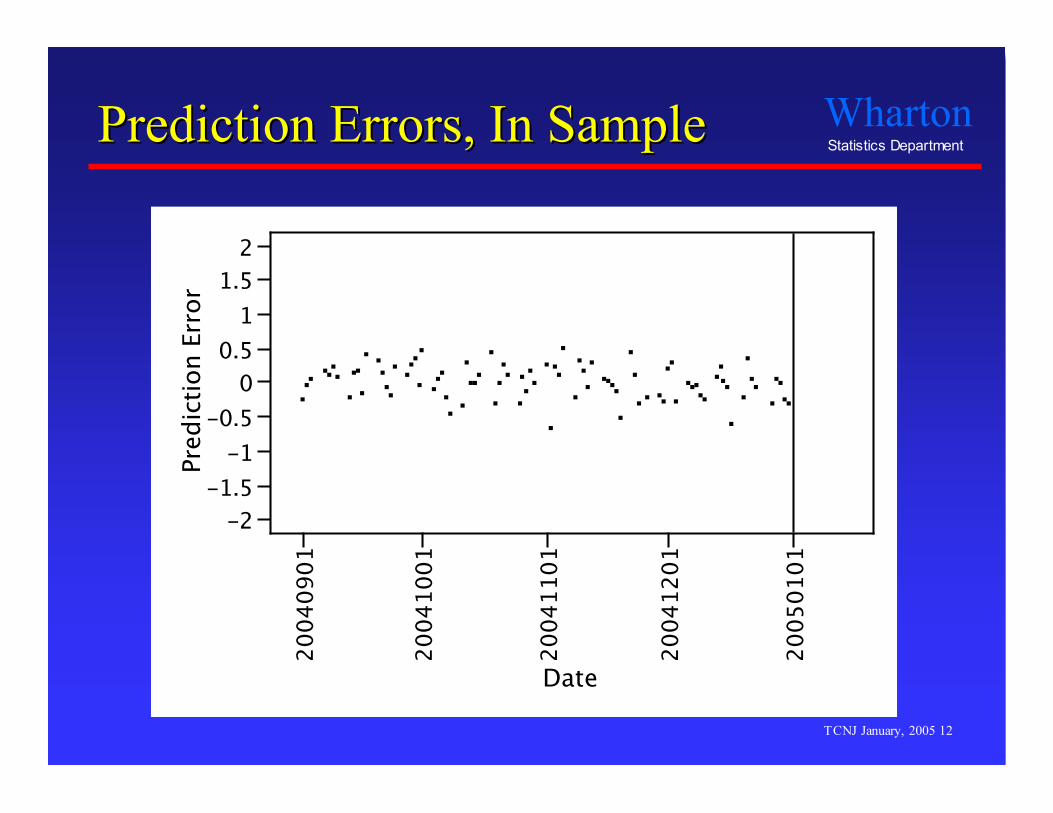
Prediction Errors, In SamplePrediction Errors, In Sample
-2
-1.5
-1
-0.5
0
0.5
1
1.5
2
Predic
tion E
rror
20
04
09
01
20
04
10
01
20
04
11
01
20
04
12
01
20
05
01
01
Date
Wharton Statistics Department
TCNJ January, 2005 13
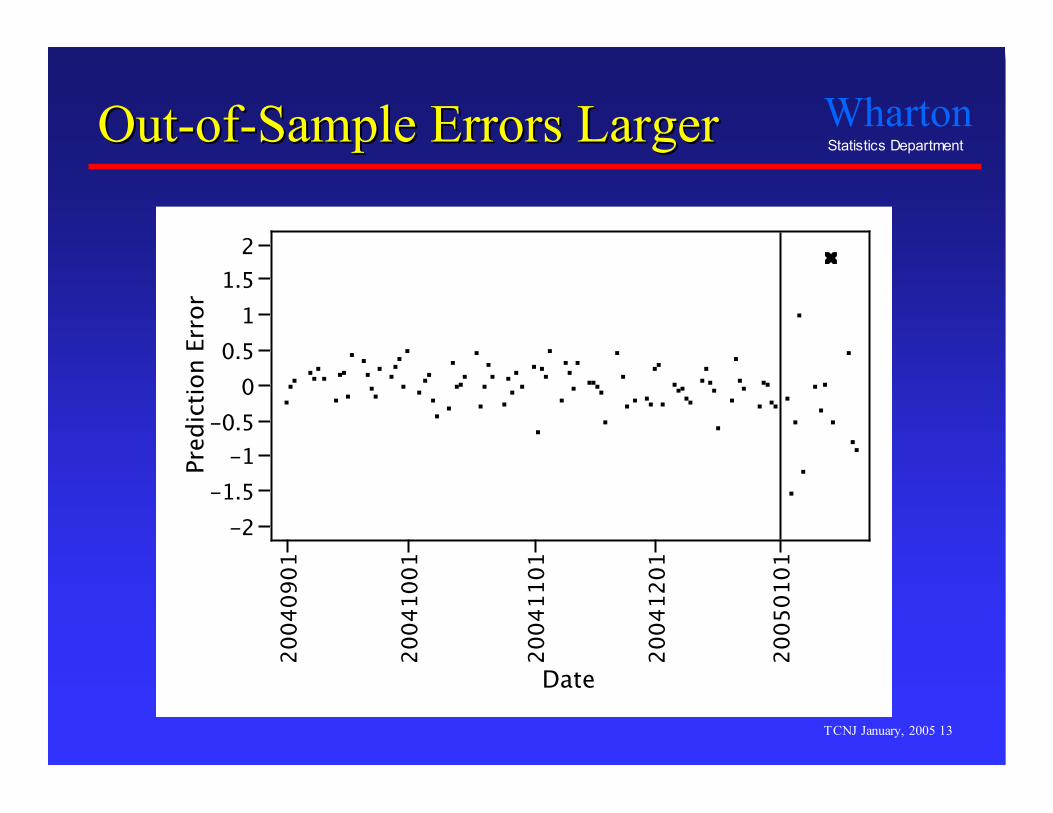
Out-of-Sample ErrorsOut-of-Sample Errors LargerLarger
-2
-1.5
-1
-0.5
0
0.5
1
1.5
2
Predic
tion E
rror
20
04
09
01
20
04
10
01
20
04
11
01
20
04
12
01
20
05
01
01
Date
Wharton Statistics Department
TCNJ January, 2005 14
So, howSo, how’’d you lose the house?d you lose the house? How can a model look so good (summary statistics,
in-sample fit), but predict the future so poorly? Overfitting
“Optimization capitalizes on chance.” (Tukey)
- Overfitting describes a model that captures random patternsin the observed data as if these patterns can be extrapolatedto other data.
All those significant coefficients… these cannot berandom, not with these statistics! Can they?
Wharton Statistics Department
TCNJ January, 2005 15
What are those predictors?What are those predictors?
Random noise- Filled columns with a normal random number generator.
Model built predictors from 12 columns of randomnoise, plus
Squares of the columnsCross-products of the columns
Total of 12 + 12 + 66 = 90 predictors considered- Random patterns in these predictors match patterns in the
S&P so well that it fools the standard diagnostics.- More predictors to consider than observations
Wharton Statistics Department
TCNJ January, 2005 16
Moral of the StoryMoral of the Story
Shouldn’t leverage the house,
but if you do,
Only trust a model if you understand the process usedto choose the form of the model.- Automated modeling procedures have to be carefully
monitored, or the results are likely to be spurious.
In this example, it’s easy to avoid the problem.- Cross-validation is not so appealing.- Bonferroni can control the process.- Ensure that the model never adds noise.
Wharton Statistics Department
TCNJ January, 2005 17
Stepwise RegressionStepwise Regression
Where’d that model come from?- Ran stepwise regression in “forward selection mode” to
select predictors from the list of 90 features.- “Promiscuous” threshold for adding variables kept the
default p-to-enter = 0.25 criterion.- Ran backward elimination to clean up the model so the final
structure looks impressive.
Process generates a biased estimate of noise variationand a cascade of noisy predictors in the model.
Better way to run software avoids the problem- Set the p-to-enter to 0.05/90 at the start.- Nothing added to the model, the right choice.
Wharton Statistics Department
TCNJ January, 2005 18
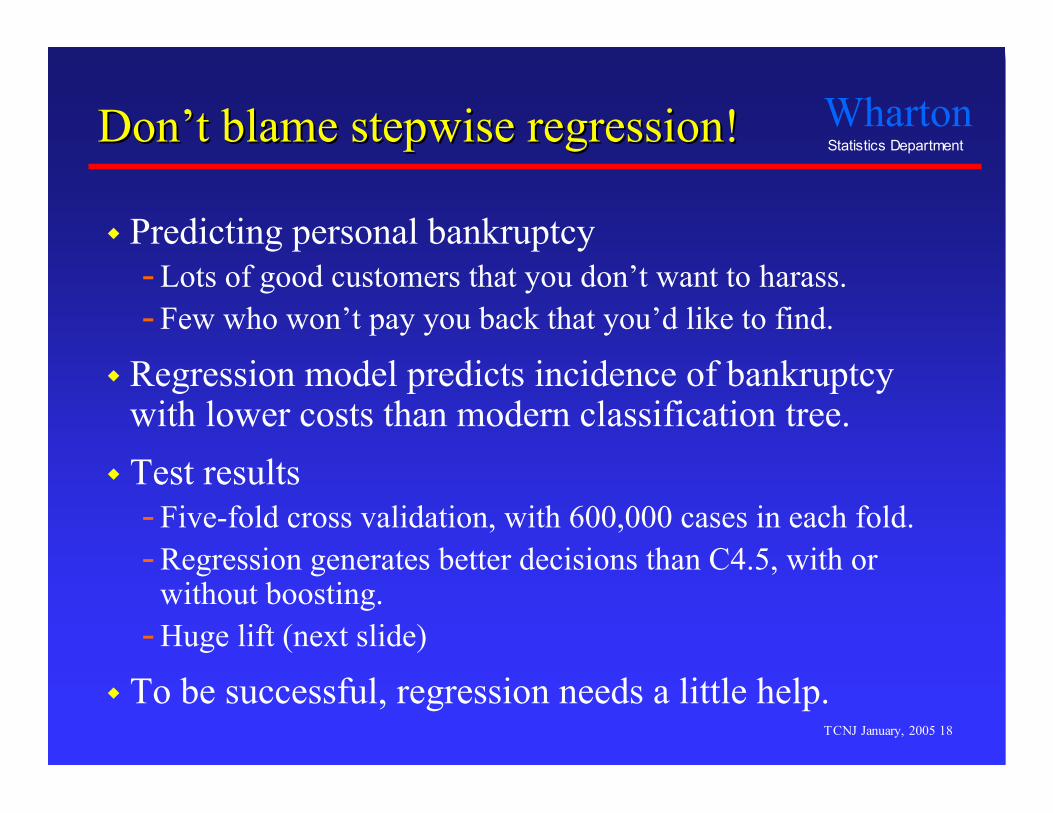
DonDon’’t blame stepwise regression!t blame stepwise regression!
Predicting personal bankruptcy- Lots of good customers that you don’t want to harass.- Few who won’t pay you back that you’d like to find.
Regression model predicts incidence of bankruptcywith lower costs than modern classification tree.
Test results- Five-fold cross validation, with 600,000 cases in each fold.- Regression generates better decisions than C4.5, with or
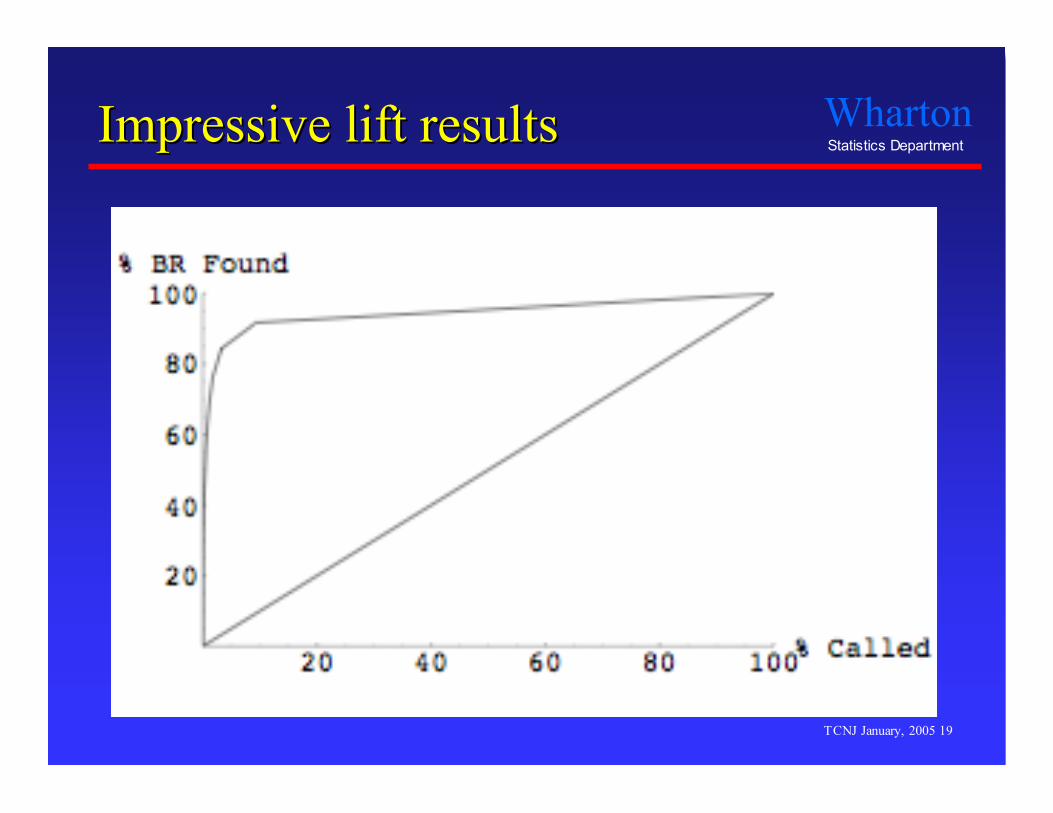
without boosting.- Huge lift (next slide)
To be successful, regression needs a little help.
Wharton Statistics Department
TCNJ January, 2005 19
Impressive lift resultsImpressive lift results
Wharton Statistics Department
TCNJ January, 2005 20
Helping Regression Helping Regression
Lessons from regression applicable to any model andfitting process
Expand the scope of features to find structure- Don’t pretend the right features are the ones in the database.- Recognize there’s not a true model.- Consider the possibility of higher-order interactions, subsets,
and nonlinearity.
Evaluate features to avoid overfitting- Estimate standard errors using the fit computed before
adding a predictor rather than after.- Construct p-values to allow for rare, high leverage points.
Wharton Statistics Department
TCNJ January, 2005 21
Expanding the ScopeExpanding the Scope
Began bankruptcy modeling with 350 predictors- These include categorical factors, such as region.- Missing data indicators
Add all possible interactions
Use forward stepwise to search the collection of350 base predictors
+ 350 squares of predictors+ 350*349/2 = 66,430 interactions
= 67,610 features
Wharton Statistics Department
TCNJ January, 2005 22
Evaluating the FeaturesEvaluating the Features
Selection from a large collection of features requiresa different method for deciding what it means to be“statistically significant”- Proliferation of features overwhelms standard method.- Large n ≠ normal sampling distribution (no CLT)
Approaches- Cross-validation: Save some data to test the model to help
you decide if you’ve really done better.- Thresholding: Use an in-sample test to avoid the sacrifice of
data and the time to compute.
Wharton Statistics Department
TCNJ January, 2005 23
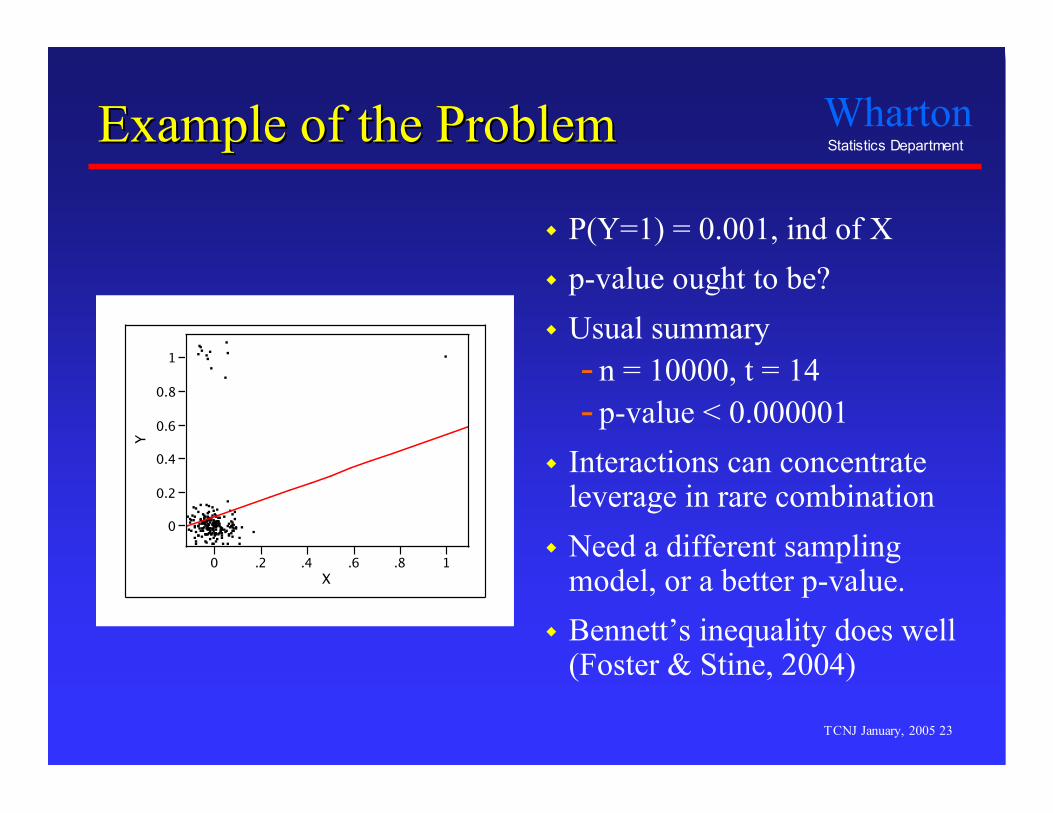
Example of the ProblemExample of the Problem
P(Y=1) = 0.001, ind of X p-value ought to be? Usual summary
- n = 10000, t = 14- p-value < 0.000001
Interactions can concentrateleverage in rare combination
Need a different samplingmodel, or a better p-value.
Bennett’s inequality does well(Foster & Stine, 2004)
0
0.2
0.4
0.6
0.8
1
Y
0 .2 .4 .6 .8 1
X
Wharton Statistics Department
TCNJ January, 2005 24
Regression Can Succeed, butRegression Can Succeed, but
Fits as well as modern classifier, but…
“Rigid and clumsy” search of interactions- Begins with the list of all features to consider.- If X1 and X2 are in model, why not try their interaction? No!
Slow- “Breadth-first” search for next predictor
Omits substantive features, domain knowledge- If you were to talk to an expert, they could offer ideas.
• Genomics, credit modeling, database structure- Can you use this knowledge to find better models?
Wharton Statistics Department
TCNJ January, 2005 25
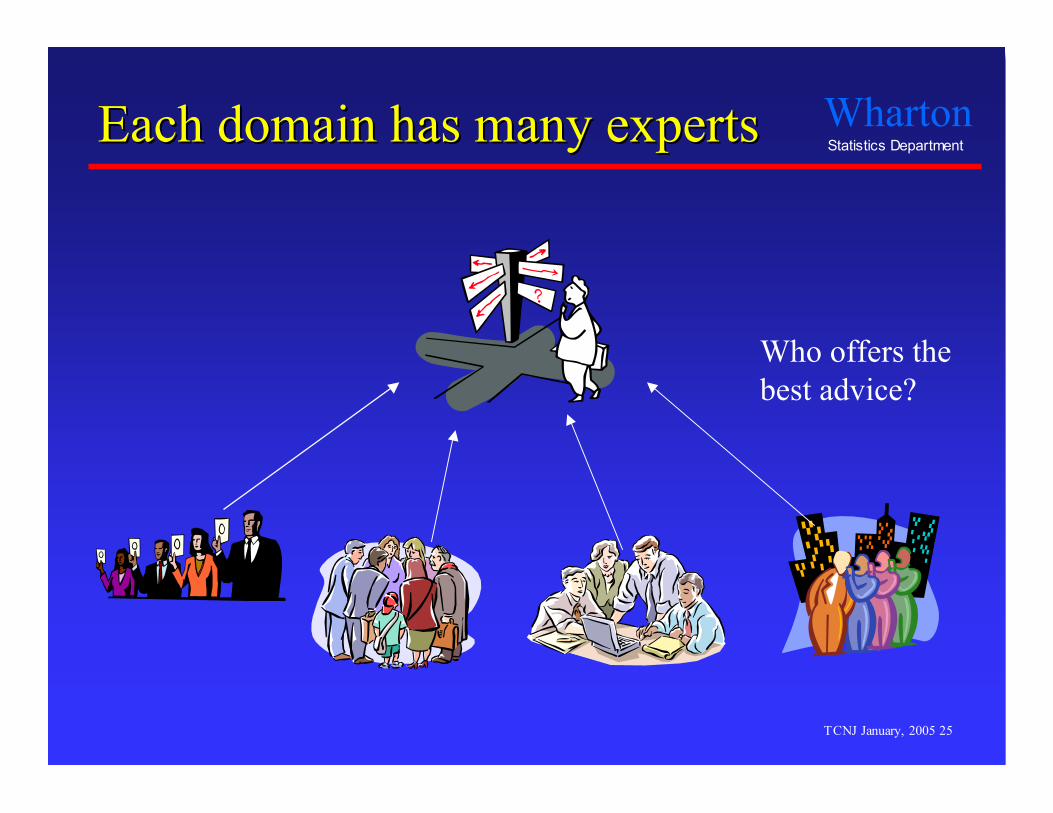
Each domain has many expertsEach domain has many experts
Who offers thebest advice?
Wharton Statistics Department
TCNJ January, 2005 26
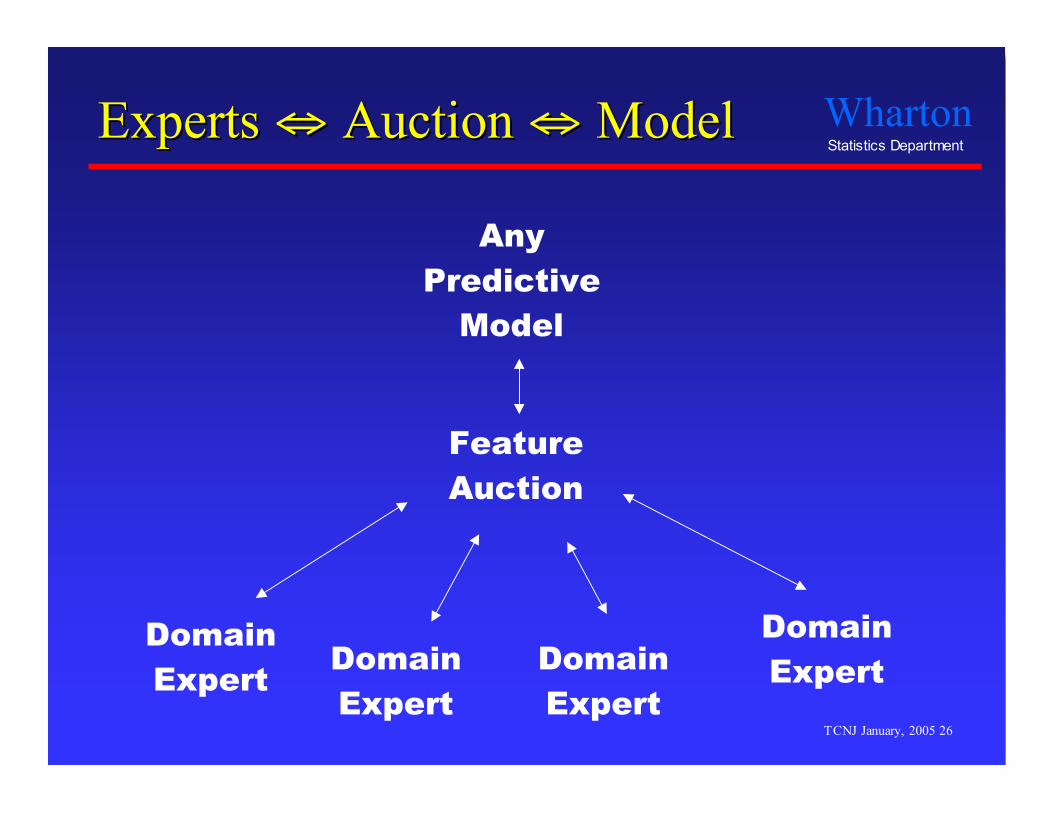
ExpertsExperts ⇔⇔ Auction Auction ⇔⇔ Model Model
AnyPredictiveModel
FeatureAuction
DomainExpert
DomainExpert
DomainExpert
DomainExpert
Wharton Statistics Department
TCNJ January, 2005 27
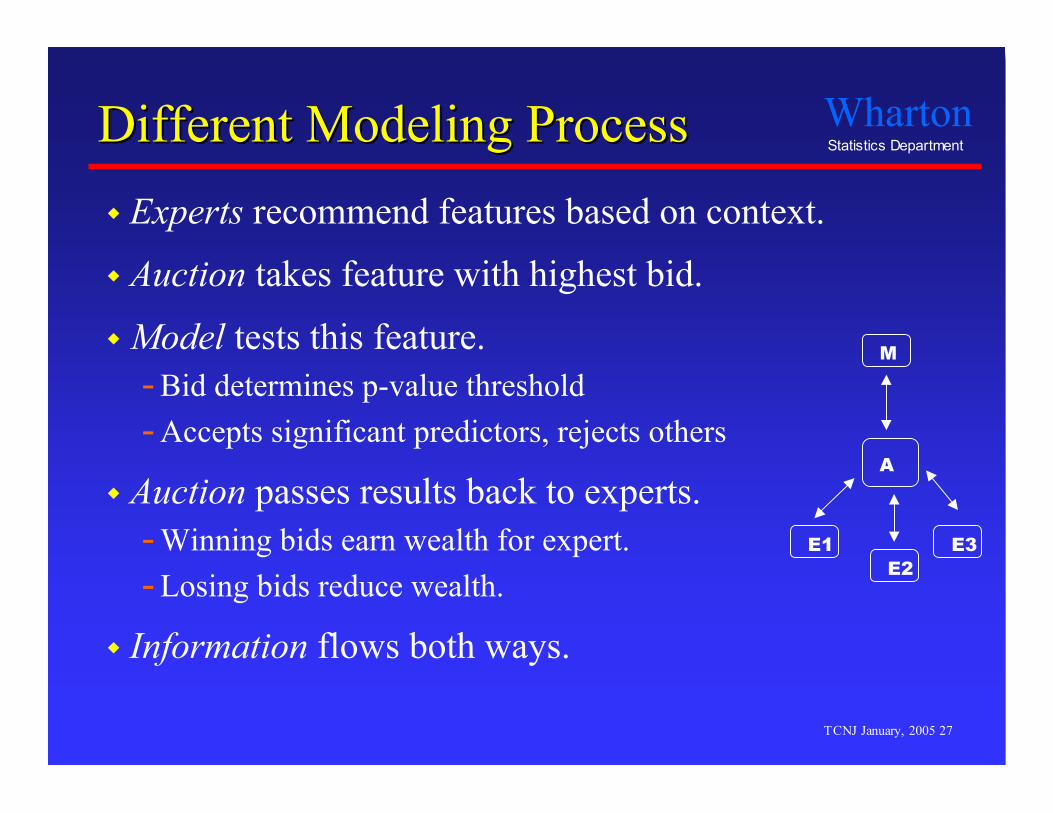
Different Modeling ProcessDifferent Modeling Process Experts recommend features based on context.
Auction takes feature with highest bid.
Model tests this feature.- Bid determines p-value threshold- Accepts significant predictors, rejects others
Auction passes results back to experts.- Winning bids earn wealth for expert.- Losing bids reduce wealth.
Information flows both ways.
M
E2
A
E3E1
Wharton Statistics Department
TCNJ January, 2005 28
Experts recommend featuresExperts recommend features Substantive experts order features
- Offer a sorted list of features to consider, or- Propose a strategy to generate “next” predictors
Automatic experts- Interactions piggy-back on success of others
• Allows search to consider high-order interactions- Principal components- Feature bundles that combine several variables to
include as one• Allows search to include parameter shrinkage
- Nearest neighbor predictors• Singular value decompositions
Wharton Statistics Department
TCNJ January, 2005 29
Auction is sequentialAuction is sequential Each expert offers a predictor to the auction given the
history and state of the model.- Each expert has wealth as allowed Type 1 error rate.- Experts bid on predictors.- Each bid is a p-to-enter threshold.
Auction takes the predictor with the highest total bid.- It collects the bids on this feature from the experts.
Auction passes the chosen predictor to model.- Model assigns p-value to feature.- If p-value < bid, add the feature and “pay” bidders.
Continue
Wharton Statistics Department
TCNJ January, 2005 30
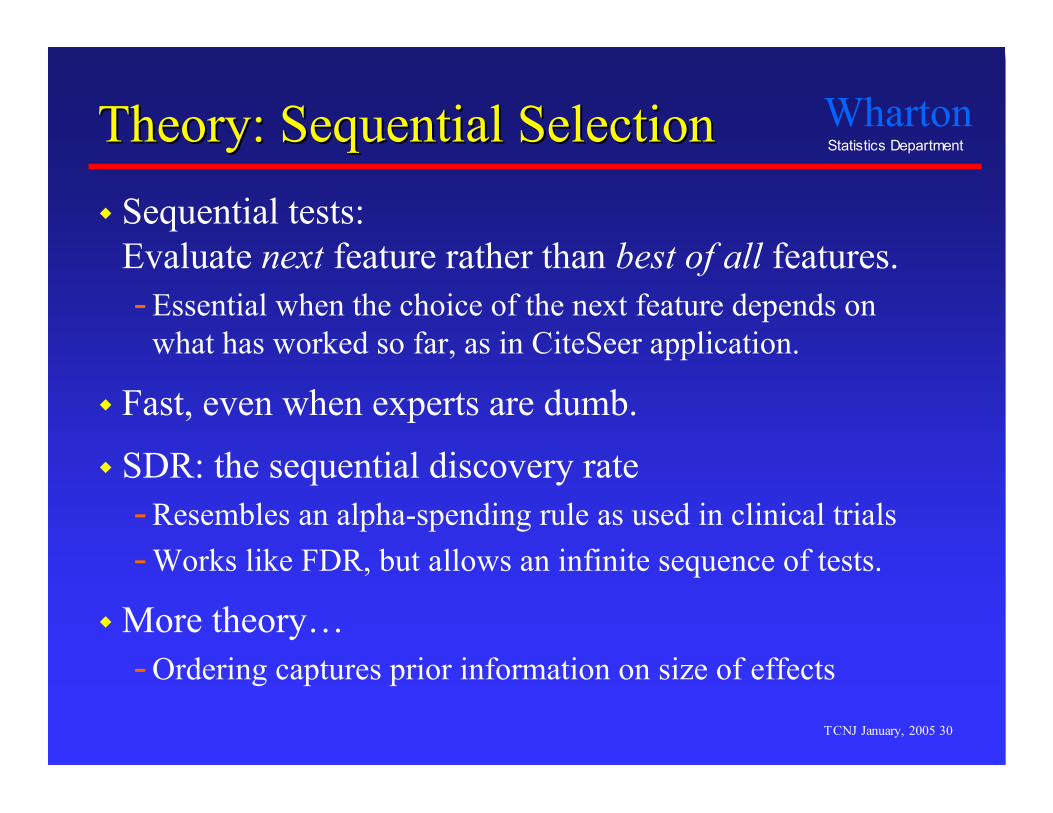
Theory: Sequential SelectionTheory: Sequential Selection Sequential tests:
Evaluate next feature rather than best of all features.- Essential when the choice of the next feature depends on
what has worked so far, as in CiteSeer application.
Fast, even when experts are dumb.
SDR: the sequential discovery rate- Resembles an alpha-spending rule as used in clinical trials- Works like FDR, but allows an infinite sequence of tests.
More theory…- Ordering captures prior information on size of effects
Wharton Statistics Department
TCNJ January, 2005 31
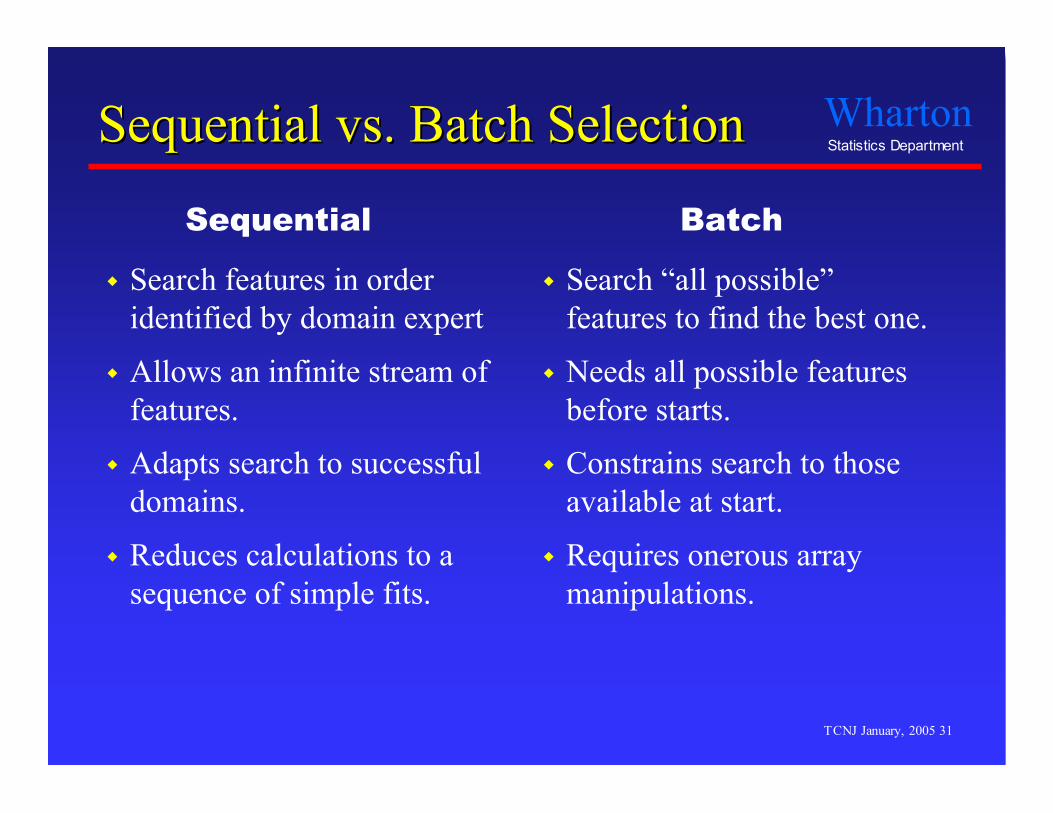
Sequential vs. Batch SelectionSequential vs. Batch Selection
Search features in orderidentified by domain expert
Allows an infinite stream offeatures.
Adapts search to successfuldomains.
Reduces calculations to asequence of simple fits.
Search “all possible”features to find the best one.
Needs all possible featuresbefore starts.
Constrains search to thoseavailable at start.
Requires onerous arraymanipulations.
BatchSequential
Wharton Statistics Department
TCNJ January, 2005 32
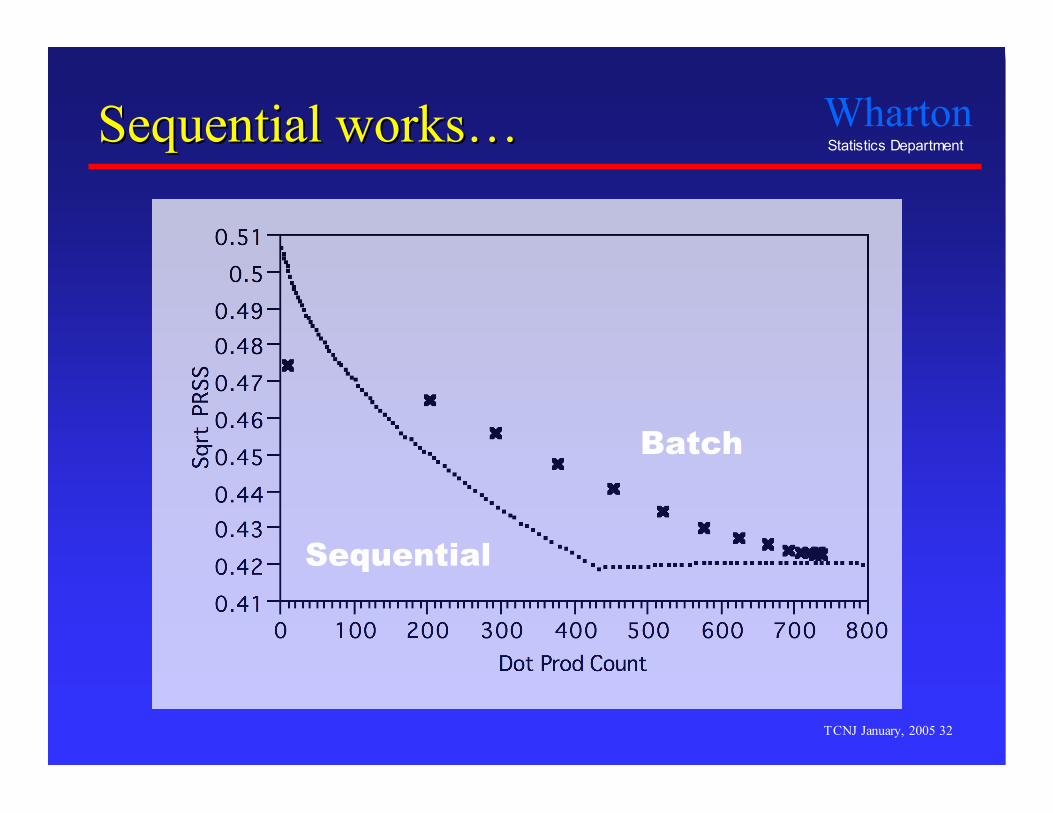
Sequential worksSequential works……
Sequential
Batch
Wharton Statistics Department
TCNJ January, 2005 33
Theory: Bidding StrategyTheory: Bidding Strategy
Auction prevents “strategic betting”- Experts offer honest estimate of value of the predictor.
Multiple bidders represent each expert- Geometric bidder: Spend λ% of current wealth on next bid.- Use mixture of bidders with varying λ.
Auction adaptively discovers smart experts- Auction rewards the bidder/expert with the right rate- Wipes out the others.
Universal bidding strategies (universal Bayes prior)
Wharton Statistics Department
TCNJ January, 2005 34
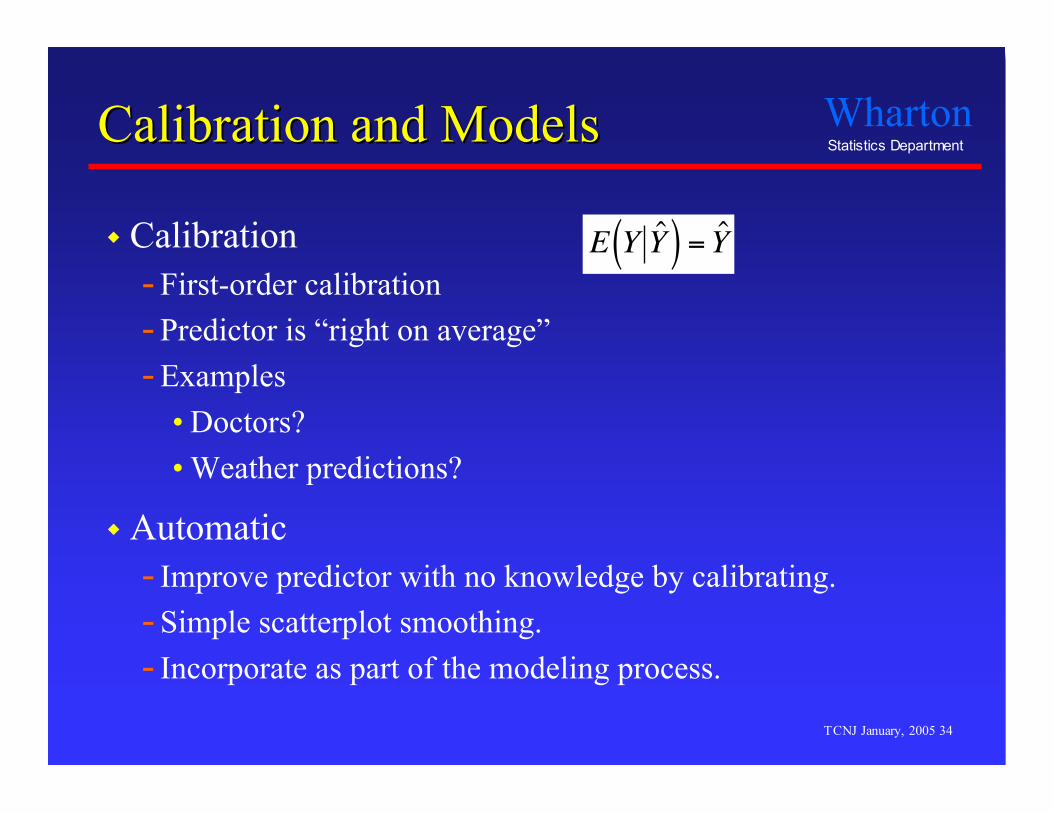
Calibration and ModelsCalibration and Models
Calibration- First-order calibration- Predictor is “right on average”- Examples
• Doctors?• Weather predictions?
Automatic- Improve predictor with no knowledge by calibrating.- Simple scatterplot smoothing.- Incorporate as part of the modeling process.
!
E Y ˆ Y ( ) = ˆ Y
Wharton Statistics Department
TCNJ January, 2005 35
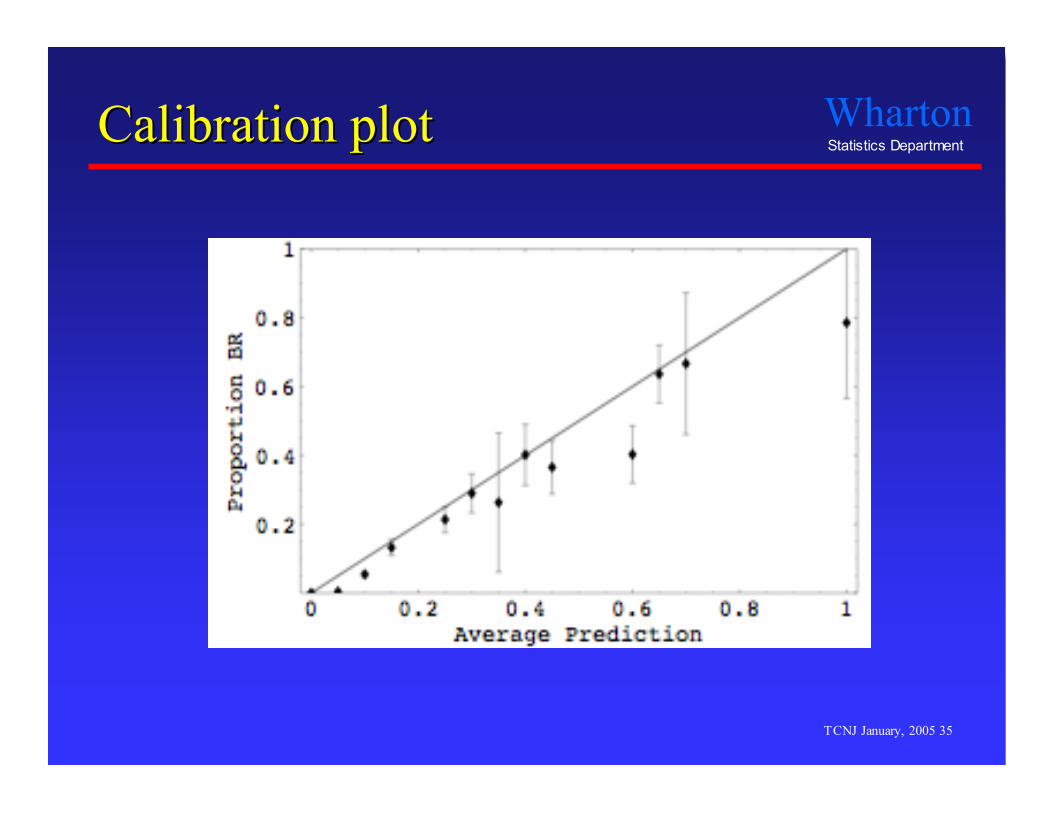
Calibration plotCalibration plot
Wharton Statistics Department
TCNJ January, 2005 36
Auction: Some ResultsAuction: Some Results
Rare events data Five-fold “reversed” cross-validation
- 100,000 cases per fold- Fit on one fold, predict other 4 folds
Methods- C 4.5 with boosting- Auction with calibrated logistic regression and multiple
experts using SDR to spend alpha rate.
Goal: Minimize costs of classification errors in thevalidation data.
Wharton Statistics Department
TCNJ January, 2005 37
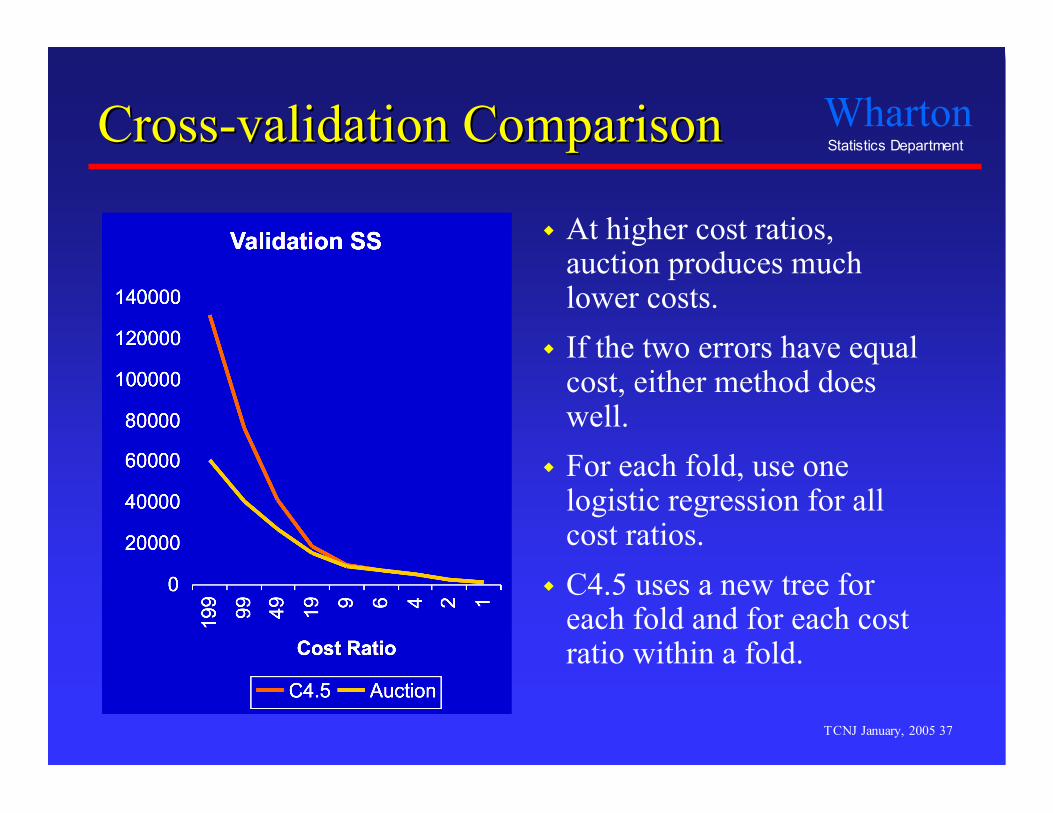
Cross-validation ComparisonCross-validation Comparison
At higher cost ratios,auction produces muchlower costs.
If the two errors have equalcost, either method doeswell.
For each fold, use onelogistic regression for allcost ratios.
C4.5 uses a new tree foreach fold and for each costratio within a fold.
Wharton Statistics Department
TCNJ January, 2005 38
Comments on ComputingComments on Computing
Prior code- Monolithic C program
Auction- Written in C++, using objects and standard libraries- Modular design
• Templates (e.g., can swap in different type of model)• Runs as a unix command-line task• Separate commands for data processing, modeling, and
validation• Adopt C4.5 data file format
Wharton Statistics Department
TCNJ January, 2005 39
Closing CommentsClosing Comments Key problem of data mining
Find the right features without over-fitting Can learn from study of what it takes to adapt
familiar methods like regression to data mining- Thresholding allows you to avoid extra cross-validation.- p-values are powerful way to communicate effect size.
Auction modeling offers a framework that- Exploits domain knowledge if it exists- Combines various automated methods of feature creation- Runs quickly with any type of underlying model
More information…www-stat.wharton.upenn.edu/~stine