Embed Size (px)
Citation preview
1
U.S. Department of Health and Human Services
Food and Drug Administration Center for Drug Evaluation and Research
Office of Translational Sciences Office of Biostatistics
STATISTICAL REVIEW AND EVALUATION
ANTIEPILEPTIC DRUGS AND SUICIDALITY
Drug Class: Antiepileptic drugs
Drug Names (NDA Numbers):
Carbamazepine (21-710) Divalproex (18-723, 19-680, 21-168) Felbamate (20-189) Gabapentin (20-235, 20-882, 21-129, 21-216) Lamotrigine (20-241, 20-764) Levetiracetam (21-035, 21-505, 21-872) Oxcarbazepine (21-014, 21-285) Pregabalin (21-446) Tiagabine (20-646) Topiramate (20-505, 20-844) Zonisamide (20-789)
Indication(s): Epilepsy, psychiatric disorders, other
Date: 23 May 2008
Biometrics Division: Division of Biometrics 6
Statistical Reviewer: Mark Levenson, Ph.D.
Statistical Team Leader: C. George Rochester, Ph.D., RAC
Medical Division: Division of Neurology Products
Clinical Team: Evelyn Mentari, MD Alice Hughes, MD John Feeney III, MD Marc Stone, MD
Project Manager: Jacqueline Ware, Pharm.D., RAC
Keywords: Epilepsy, psychiatric, bipolar, suicide, suicidality, meta-analysis

2
TABLE OF CONTENTS List of Tables ...................................................................................................................... 3 List of Figures ..................................................................................................................... 4 Executive Summary ............................................................................................................ 5
1.1 Overview............................................................................................................. 5 1.2 Findings............................................................................................................... 5 1.3 Conclusions......................................................................................................... 6
2 Introduction................................................................................................................. 7 2.1 Background......................................................................................................... 7 2.2 Review Objectives .............................................................................................. 7
3 Data Sources ............................................................................................................... 7 3.1 Data Requests...................................................................................................... 7 3.2 Trial Summary .................................................................................................... 9
4 Methods..................................................................................................................... 12 4.1 Endpoints .......................................................................................................... 12 4.2 Analysis Population .......................................................................................... 13 4.3 Subgroups and Special Populations .................................................................. 13 4.4 Statistical Methods............................................................................................ 14
5 Patient Summary....................................................................................................... 16 5.1 Drugs and Demographics.................................................................................. 16 5.2 Discontinuation and Duration ........................................................................... 20
6 Findings..................................................................................................................... 22 6.1 Suicidal Behavior or Ideation ........................................................................... 22 6.2 Suicidal Behavior and Suicidal Ideation........................................................... 26 6.3 Sensitivity Analysis .......................................................................................... 27 6.4 Exploratory Analysis ........................................................................................ 32
7 Findings in Special/Subgroup Populations ............................................................... 35 7.1 Drug Groups...................................................................................................... 35 7.2 Trial Indication.................................................................................................. 37 7.3 Demographics ................................................................................................... 39
8 Post-Hoc Analyses .................................................................................................... 45 8.1 Lamotrigine Additional Data ............................................................................ 45 8.2 Alternative Age Subgroups............................................................................... 47
9 Summary and Conclusions ....................................................................................... 47 9.1 Review Summary.............................................................................................. 47 9.2 Conclusions....................................................................................................... 49
10 References............................................................................................................. 49

3
LIST OF TABLES Table 1: Suicidality Events and Codes. .............................................................................. 8 Table 2: Antiepileptic Drugs under Review. ...................................................................... 9 Table 3: Indication Categories. ......................................................................................... 10 Table 4: Trials by Comparator Type and Drug................................................................. 11 Table 5: Trials by Indication Group and Therapy (Monotherapy, Adjunctive Therapy, Other). ............................................................................................................................... 12 Table 6: Patients by Treatment Arm and Comparator Type............................................. 16 Table 7: Patients by Treatment Arm and Drug, Placebo-Controlled Trials. .................... 17 Table 8: Patients by Indication Group and Drug, Placebo-Controlled Trials................... 18 Table 9: Demographics by Treatment Arm, Placebo-Controlled Trials........................... 19 Table 10: Patients by Drug Class and Treatment Arm, Placebo-Controlled Trials.......... 20 Table 11: Patient Treatment Discontinuation and Duration by Treatment Arm, Placebo-Controlled Trials. .............................................................................................................. 21 Table 12: Events by Type and Treatment Arm, Placebo-Controlled Trials. .................... 22 Table 13: Suicidal Behavior or Ideation Events and Patients by Drug, Placebo-Controlled Trials. ................................................................................................................................ 23 Table 14: Suicidal Behavior or Ideation Hazard Estimates by Treatment Arm, Placebo-Controlled Trials. .............................................................................................................. 32 Table 15: Events from Patients with Multiple Events, Placebo-Controlled Trials........... 34 Table 16: Placebo and Drug Suicidal Behavior or Ideation Event Rates and Risk Difference by Indication, Placebo-Controlled Trials........................................................ 38

4
LIST OF FIGURES Figure 1: Mean Trial Duration by Treatment Arm, Placebo-Controlled Trials................ 21 Figure 2: Suicidal Behavior or Ideation Odds Ratio Estimates, Placebo-Controlled Trials............................................................................................................................................ 25 Figure 3: Suicidal Behavior versus Suicidal Ideation Odds Ratio Estimates, Placebo-Controlled Trials. .............................................................................................................. 26 Figure 4: Suicidal Behavior or Ideation Risk Difference Estimates, Placebo-Controlled Trials. ................................................................................................................................ 28 Figure 5: Suicidal Behavior or Ideation Rate Ratio Estimates, Placebo-Controlled Trials............................................................................................................................................ 31 Figure 6: Kaplan-Meier Suicidal Behavior or Ideation Incidence Curves by Treatment Arm, Placebo-Controlled Trials........................................................................................ 33 Figure 7: Suicidal Behavior or Ideation Odds Ratio Estimates by Drug Group, Placebo-Controlled Trials. .............................................................................................................. 36 Figure 8: Suicidal Behavior or Ideation Odds Ratio Estimates by Indication Group, Placebo-Controlled Trials. ................................................................................................ 37 Figure 9: Suicidal Behavior or Ideation Odds Ratio Estimates by Age Group, Placebo-Controlled Trials. .............................................................................................................. 40 Figure 10: Suicidal Behavior or Ideation Odds Ratio Estimates by Gender, Placebo-Controlled Trials. .............................................................................................................. 41 Figure 11: Suicidal Behavior or Ideation Odds Ratio Estimates by Race Group, Placebo-Controlled Trials. .............................................................................................................. 42 Figure 12: Suicidal Behavior or Ideation Odds Ratio Estimates by Setting, Placebo-Controlled Trials. .............................................................................................................. 43 Figure 13: Suicidal Behavior or Ideation Odds Ratio Estimates by Location, Placebo-Controlled Trials. .............................................................................................................. 44 Figure 14: Suicidal Behavior or Ideation Odds Ratio Estimates, Placebo-Controlled and Low-Dose-Controlled Trials. ............................................................................................ 45 Figure 15: Suicidal Behavior or Ideation Odds Ratio Estimates with Additional Lamotrigine Data, Placebo-Controlled Trials................................................................... 46 Figure 16: Suicidal Behavior or Ideation Odds Ratio Estimates by Post-Hoc Age Group, Placebo-Controlled Trials. ................................................................................................ 47

5
EXECUTIVE SUMMARY1
1.1 Overview The Food and Drug Administration (FDA) concerned about the potential for elevated risk of suicidality (suicidal behavior or ideation) from the use of antiepileptic drugs carried out a meta-analysis of 11 drugs. Antiepileptic drugs are also used for indications other than epilepsy including psychiatric disorders. In March 2005, FDA sent letters to sponsors of antiepileptic drugs requesting that they submit data from placebo-controlled trials for the FDA to review the possible association of suicidality events and antiepileptic drugs. Letters in July 2005, May 2006, and January 2007 requested additional information to obtain the data necessary for the review. The letters specified detailed instructions for the identification of suicidality events and the format of the data to be submitted. Prior to the analysis of the data, medical reviewers in the Division of Neurology and statistical reviewers in the Quantitative Safety and Pharmacoepidemiology Group agreed upon the definition of the research objectives, endpoints, study population, and subgroups and upon the specification of the statistical methods. These elements were incorporated into a statistical analysis plan prior to the review. The statistical methods maintained the integrity of placebo-controlled trials. This allowed for trials to have different background rates of events.
1.2 Findings There were 199 placebo-controlled trials consisting of 27,863 patients in drug arms and 16,029 patients in placebo arms from 11 drugs that formed the primary analysis population. The average age of patients was 42 years. The majority of patients were female (55%), white (79%), and from North American locations (61%). The placebo patients had statistically higher treatment duration (77 days for placebo versus 73 days for drug). There were no statistical differences among the baseline characteristics of the drug and placebo patients for age, gender, race, and location. There were 4 completed suicides among drug patients and none among placebo patients. The majority of suicidality events for both drug and placebo patients were Suicidal Ideation. The second most frequent type of event was Suicide Attempt. Without adjusting for differences among trials, 0.37% of the drug patients had a Suicidal Behavior or Ideation event versus 0.24% of the placebo patients.
1 This review replaces the March 5, 2008 version. Two small discrepancies in the data have been corrected for this version.

6
Overall, patients who received an antiepileptic drug had statistically significant increased risk of Suicidal Behavior or Ideation relative to placebo patients. The estimated overall odds ratio (OR) of a drug patient experiencing a Suicidal Behavior or Ideation event versus a placebo patient was 1.80 (95% CI: 1.24, 2.66). The results for individual drugs were generally consistent with the overall result. Suicidal Behavior had a larger estimated odds ratio [2.92 (95% CI: 1.44, 6.47)] than Suicidal Ideation [1.45 (95% CI: 0.93, 2.30)]. Sensitivity analyses showed that the results were robust to statistical methods and differences in the treatment durations between the treatment groups. Indication and location appeared to have the largest effects on the odds ratio among the subgroups considered. The epilepsy indication subgroup had the largest estimated odds ratio [3.53 (95% CI: 1.28, 12.10)] compared to the psychiatric indication subgroup [1.51 (95% CI: 0.95, 2.45)] and the other indication subgroup [1.87 (95% CI: 0.81, 4.76)]. However, the psychiatric indication subgroup had the largest placebo risk and the risk difference for the psychiatric indications subgroup was the largest. The estimated odds ratio for the Non-North American subgroup [4.53 (95% CI: 1.86, 13.18)] was notably larger than that of the North American subgroup [1.38 (95% CI: 0.90, 2.13)]. The higher risk of events for the drug-treated patients was observed as early as 1 week from initiating treatment until at least 24 weeks. After 24 weeks, it was not possible to draw conclusions due to the scarcity of data beyond 24 weeks. There was no obvious pattern in the drug effect with respect to age subgroups. Likewise, there were no patterns with respect to subgroups based on gender, race, setting, and prespecified drug groups (sodium channel blocking, GABAergic and GABAmimetric, and carbonic anhydrase inhibitors).
1.3 Conclusions In conclusion, antiepileptic drugs are associated with increased risk of suicidality relative to placebo in randomized placebo-controlled trials. The effect appears consistent among the group of 11 drugs. There are 1.9 per 1000 (95% CI: 0.6, 3.9) more antiepileptic drug patients than placebo patients who experience Suicidal Behavior or Ideation. In terms of adjusted risk estimates for the treatment groups, 0.43% of the drug patients experience Suicidal Behavior or Ideation compared to 0.24% of the placebo patients. There is no obvious subgroup of patients to which the increased risk is specifically attributed. The increased risk was seen in almost all subgroups, although epileptic and Non-North American patients may have higher relative risks.
7
2 INTRODUCTION
2.1 Background The Food and Drug Administration (FDA) concerned about the potential for elevated risk of suicidality (suicidal behavior or ideation) from the use of antiepileptic drugs carried out a meta-analysis of 11 drugs. Antiepileptic drugs are also used for indications other than epilepsy including psychiatric disorders. In March 2005 FDA initiated requests to the sponsors of antiepileptic drugs for data to address the suicidality concern. Prior to the analysis of the antiepileptic data, medical reviewers in the Division of Neurology and statistical reviewers in the Quantitative Safety and Pharmacoepidemiology Group agreed upon the definition of the research objectives, endpoints, study population, and subgroups and upon the specification of the statistical methods. These elements were incorporated into a statistical analysis plan prior to the review. This review replaces the March 5, 2008 version. Two small discrepancies in the data have been corrected for this version.
2.2 Review Objectives 1. Examine whether 11 antiepileptic drugs as a group are associated with increased
risk of suicidality relative to placebo in randomized placebo-controlled trials. 2. Examine whether the risk of suicidality varies by (a) individual drug, (b) drug
subgroups, (c) indication subgroups, and (d) demographic subgroups.
3 DATA SOURCES
3.1 Data Requests In March 2005, FDA sent letters to sponsors of antiepileptic drugs requesting that they submit data from placebo-controlled trials for the FDA to review the possible association of suicidality events and antiepileptic drugs. Sponsors of all drugs with available registration trials were contacted. Letters in July 2005, May 2006, and January 2007 requested additional information to obtain the data necessary for the review. The letters specified detailed instructions for the identification of suicidality events and the format of the data to be submitted.
3.1.1 Trial Inclusion Criteria The final directions to the sponsors called for the submission of data for all randomized parallel-arm, placebo-controlled trials, regardless of indication and duration, with at least 30 patients total. Trials may have had active-control arms as well. In additional to parallel-arm trials, data from the first period of cross-over trials that otherwise met the trial inclusion criteria were also included. In addition to placebo-controlled trials, trials with subtherapeutic comparator arms, known as “low-dose placebo” were to be included. The low-dose controlled studies were not included in the primary analysis. The July 2005

8
FDA letter specified that studies with ongoing blinded treatment phases should not be included.
3.1.2 Identification of Suicidality Events FDA specified the procedure for the identification of suicidality events. The procedure called for a search of “possibly suicide-related” adverse events (PSRAEs). The search was to be strictly limited to events that occurred during the double-blind phase of treatment, or within 1 day of stopping randomized treatment. All deaths and serious adverse events (SAEs) were to be included as PSRAEs. In addition, events were identified through a search of specified text-strings in the adverse event data. For each PSRAE, a narrative was to be prepared. Based on blinded versions of the narratives, the PSRAEs were to be classified into mutually exclusive suicidality events using the approach employed in classification of outcomes as implemented in the pediatric antidepressant analysis (Posner et al. 2007). Table 1 gives the suicidality events. Sponsors were responsible for the classification of events. Table 1: Suicidality Events and Codes. Event Code Event 0 No Event 1 Completed suicide 2 Suicide attempt 3 Preparatory acts toward imminent suicidal behavior 4 Suicidal ideation 5 Self-injurious behavior, intent unknown 6 Not enough information, fatal 7 Not enough information, non-fatal
3.1.3 Dataset Definition FDA specified the format of patient-level and trial-level datasets to be submitted. The patient-level dataset was to have one record per event. Patients with multiple events were to have multiple records in the dataset corresponding to each event. Patients without events were to be assigned an event code of 0. The patient-level dataset included variables for trial identification, patient identification, age, gender , race, setting of trial (inpatient, outpatient, both), location of trial (North America, Non-North America), treatment drug, event code, day of event, and discontinuation status. For location, FDA did not specify the meaning of North America. The trial-level dataset summarized and characterized the trial. This information included indication, nominal duration, treatment arm sizes, inclusion and exclusion criteria, dosage, and design features.

9
3.2 Trial Summary Sponsors submitted datasets from 12 drug programs. One of these drugs, vigabatrin, is not currently approved in the United States and was not part of the review. Table 2 gives the names of the 11 drugs that were included in the review. Table 2: Antiepileptic Drugs under Review. Drug NDA Number Carbamazepine 21-710 Divalproex 18-723, 19-680, 21-168 Felbamate 20-189 Gabapentin 20-235, 20-882, 21-129, 21-216 Lamotrigine 20-241, 20-764 Levetiracetam 21-035, 21-505, 21-872 Oxcarbazepine 21-014, 21-285 Pregabalin 21-446 Tiagabine 20-646 Topiramate 20-505, 20-844 Zonisamide 20-789
The medical officer, Dr. Evelyn Mentari, Division of Neurology Products, performed some initial data processing of the submitted patient-level datasets including:
1. Checking the correctness of the data submission to the FDA instructions 2. Concatenating the data from the 11 drug programs into a single dataset 3. Removing trials based on exclusion criteria (described below) 4. Reducing multiple events in a single day to a single event (described below) 5. Removing patients under the age of 5 6. Creating indication categories (described below)
Trials were excluded if the duration was less than 7 days, there were fewer than 20 patients in any arm, all patients were less than 5-years old, or the trial had a randomized withdrawal design (including withdrawal to placebo). For patients with multiple events on a single day, only the most critical event (based on the event codes shown in Table 1) on the day was retained.

10
The medical officer categorized the numerous indications into 21 indication categories. These 21 indication categories were further categorized into three categories: (1) epilepsy, (2) psychiatric, and (3) other. Table 3 gives the 21 indication categories and their further classification into three categories. Table 3: Indication Categories. Epilepsy Psychiatric Other Epilepsy Anxiety Agitation Binge eating disorder Chronic pain Bipolar disorder Fibromyalgia Depression Impaired cognition Panic disorder Insomnia Post-Traumatic Stress Disorder Migraine Schizophrenia Neuropathy Social phobia Obesity Radiculopathy Spasticity Tremor Note: The other indication category included volunteer studies. The review was based on the datasets prepared by Dr. Mentari and provided on 7 November 2007.

11
Table 4 gives the number of trials by comparator type and drug. There were 210 trials. Of these, 199 were placebo controlled and 11 were low-dose controlled. No study had both a placebo arm and a low-dose arm. There were 23 trials that also had an active-control arm. Table 4: Trials by Comparator Type and Drug. Number of Trials
Drug Placebo-Controlled
Low-Dose Controlled
Total
Carbamazepine 3 0 3
Divalproex 13 1 14
Felbamate 6 3 9
Gabapentin 28 0 28
Lamotrigine 27 2 29
Levetiracetam 21 0 21
Oxcarbazepine 10 1 11
Pregabalin 38 1 39
Tiagabine 6 0 6
Topiramate 42 3 45
Zonisamide 5 0 5
Total 199 11 210
12
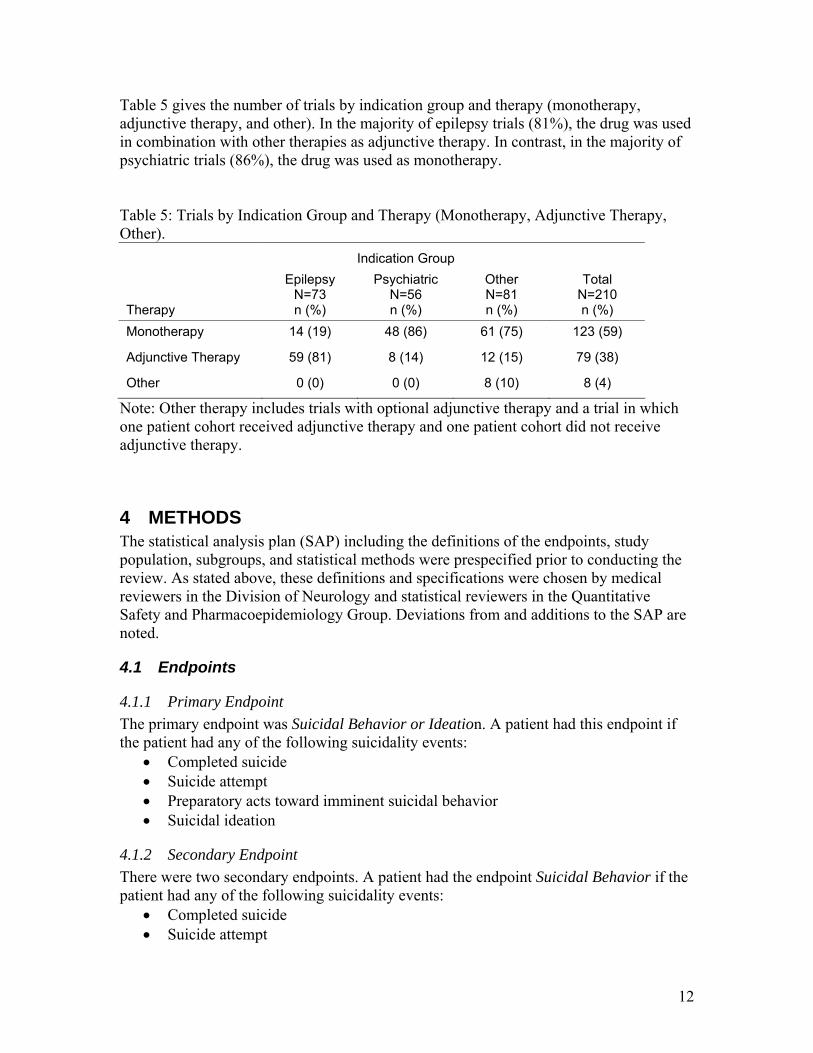
Table 5 gives the number of trials by indication group and therapy (monotherapy, adjunctive therapy, and other). In the majority of epilepsy trials (81%), the drug was used in combination with other therapies as adjunctive therapy. In contrast, in the majority of psychiatric trials (86%), the drug was used as monotherapy. Table 5: Trials by Indication Group and Therapy (Monotherapy, Adjunctive Therapy, Other). Indication Group
Therapy
Epilepsy N=73 n (%)
Psychiatric N=56 n (%)
Other N=81 n (%)
Total N=210 n (%)
Monotherapy 14 (19) 48 (86) 61 (75) 123 (59)
Adjunctive Therapy 59 (81) 8 (14) 12 (15) 79 (38)
Other 0 (0) 0 (0) 8 (10) 8 (4)
Note: Other therapy includes trials with optional adjunctive therapy and a trial in which one patient cohort received adjunctive therapy and one patient cohort did not receive adjunctive therapy.
4 METHODS The statistical analysis plan (SAP) including the definitions of the endpoints, study population, subgroups, and statistical methods were prespecified prior to conducting the review. As stated above, these definitions and specifications were chosen by medical reviewers in the Division of Neurology and statistical reviewers in the Quantitative Safety and Pharmacoepidemiology Group. Deviations from and additions to the SAP are noted.
4.1 Endpoints
4.1.1 Primary Endpoint The primary endpoint was Suicidal Behavior or Ideation. A patient had this endpoint if the patient had any of the following suicidality events:
• Completed suicide • Suicide attempt • Preparatory acts toward imminent suicidal behavior • Suicidal ideation
4.1.2 Secondary Endpoint There were two secondary endpoints. A patient had the endpoint Suicidal Behavior if the patient had any of the following suicidality events:
• Completed suicide • Suicide attempt

13
• Preparatory acts toward imminent suicidal behavior A patient had the endpoint Suicidal Ideation if the patient had only a Suicidal Ideation event. Note that the endpoint Suicidal Ideation was not part of the SAP.
4.2 Analysis Population The primary analysis population was all patients in test drug and placebo arms from placebo-controlled trials that met the trial and patient inclusion criteria described in Section 3.2.
4.3 Subgroups and Special Populations
4.3.1 Drugs Each drug was considered separately
4.3.2 Drug Groups Three groups of drugs were considered. These groupings were chosen by the medical officers from the Division of Neurology. Each group of drugs was compared to the complementary group of drugs. Note that the drug groups are not mutually exclusive or exhaustive. 1. Sodium Channel Blocking Drugs
• Carbamazepine • Lamotrigine • Oxcarbazepine • Topiramate • Zonisamide
2. GABAergic Drugs and GABAmimetic Drugs • Divalproex • Gabapentin • Pregabalin • Tiagabine • Topiramate
3. Carbonic Anhydrase Inhibitors • Topiramate • Zonisamide
4.3.3 Trial Indication Three indication groups were considered as defined in Table 3: 1. Epilepsy 2. Psychiatric Indications 3. Other Indications
4.3.4 Demographics The following subgroup classes were considered: 1. Age
• 5-17

14
• 18-24 • 25-30 • 31-64 • ≥ 65
2. Gender • Male • Female
3. Race • White Caucasian • Other
4. Setting • Inpatient or Inpatient/Outpatient Combined • Outpatient
5. Location • North America • Non-North America
The age subgroups were chosen to be the same as used in FDA analysis of the antidepressant suicidality. Only two race subgroups were used because the overwhelming majority of patients were white. “Other” for race included African American, Hispanic, Asian, and other. For location, FDA did not specify the meaning of North America.
4.3.5 Comparator Type The group of patients from low-dose-controlled trials was considered. This group was compared to the primary analysis group of placebo-control trial patients and the group of patients from both placebo-controlled and low-dose-controlled trials. For the analysis of patients from both types of trials, the test drug patients were compared to the patients in the corresponding trial control arm patients (placebo or low-dose).
4.4 Statistical Methods
4.4.1 Primary Method The primary analysis method was the exact method for a stratified odds ratio and associated 95% confidence interval (Cytel 2005, Ch. 19). The odds ratio was in terms of patient units. The stratification factor was the trial.
4.4.2 Sensitivity Methods Three sensitivity analyses were employed to examine the robustness of the primary method.
4.4.2.1 Zero-Event Trials The first sensitivity analysis examined the consequences of the fact that a large number of the trials were expected to have no events. The exact method for a stratified odds ratio does not make use of these trials. The Mantel-Haenszel risk difference and associated confidence interval (Greenland and Robins 1985), which makes use of these trials, was

15
used for this sensitivity analysis. However, if there are no events for any trials, for example in a subgroup, then the estimated variance will be zero. In this case, it is not appropriate to use the variance estimate, and no estimate and confidence intervals were presented.
4.4.2.2 Trial Heterogeneity The second sensitivity analysis examined between-trial heterogeneity of the effect measure. Zelen’s test (Cytel 2005, Ch. 19), an exact test, was used to test the hypothesis of a common odds ratio. However, because of the small number of events, it was expected that there would be little power to detect heterogeneity of the odds ratio across trials. The result of the test was intended for qualitative purposes. The trial weight of the Mantel-Haenszel odds ratio estimator was used to quantitatively identify trials with large influence. The weight was equal to (control patients with events)*(test patients without events)/(total patients). Trials with no events had a weight of zero. For trials with events in one arm only, the weight was equal to (control patients with events +0.5)*(test patients without events +0.5)/(total patients +2). Note that the SAP incorrectly specified “+1” rather than “+2” in the denominator. A generalized linear mixed model (GLMM) (McCulloch and Searle 2001) was used to estimate the overall odds ratio in the presence of trial heterogeneity of the odds ratio. The model used the binomial error distribution and logit link function. The model included fixed effects for the trial and treatment effects and a random effect on the trial-level for the treatment-trial interaction. The estimate and the 95% confidence interval of the treatment effect were qualitatively compared to those from the primary method to examine the effect of trial heterogeneity. The confidence interval of the variance component of the random effect was also examined to evaluate trial heterogeneity.
4.4.2.3 Duration Differences The third sensitivity method, which was not part of the SAP, examined the consequences of the observed difference in treatment duration between the treatment arms. The method was similar to the primary method, but used person-time rather than patients as the unit of analysis (Cytel 2005, Ch. 15). Because the duration difference was small, an assumption of constant hazards was not key.
4.4.3 Exploratory Methods
4.4.3.1 Time Pattern Kaplan-Meier incidence curves were used to examine the time-pattern (hazard function) of the Suicidal Behavior or Ideation events. For patients with multiple events, only the most critical event was used. No stratification was employed in the analysis.
16
4.4.3.2 Demographics, Duration and Discontinuation Differences in treatment arms within trials of demographics, treatment duration, and premature discontinuation of patients were examined. For categorical variables, p-values for differences between treatment groups were based on the Cochran-Mantel-Haenszel test stratifying on trial. For continuous variables, p-values and least-squares means were based on a 2-way ANOVA controlling for trial.
4.4.3.3 Multiple Events For each patient that had multiple events, the events were summarized.
4.4.4 Missing values There were no missing values allowed for trial, treatment arm, and event codes. Therefore, the primary analysis was not be affected by missing values. For each subgroup analysis, all patients with the necessary information to determine the subgroup membership were used.
4.4.5 Statistical Significance Statistical significance refers to a two-sided type 1 error of 0.05. Because the analysis was exploratory in nature, no adjustments for multiplicity were be made.
5 PATIENT SUMMARY
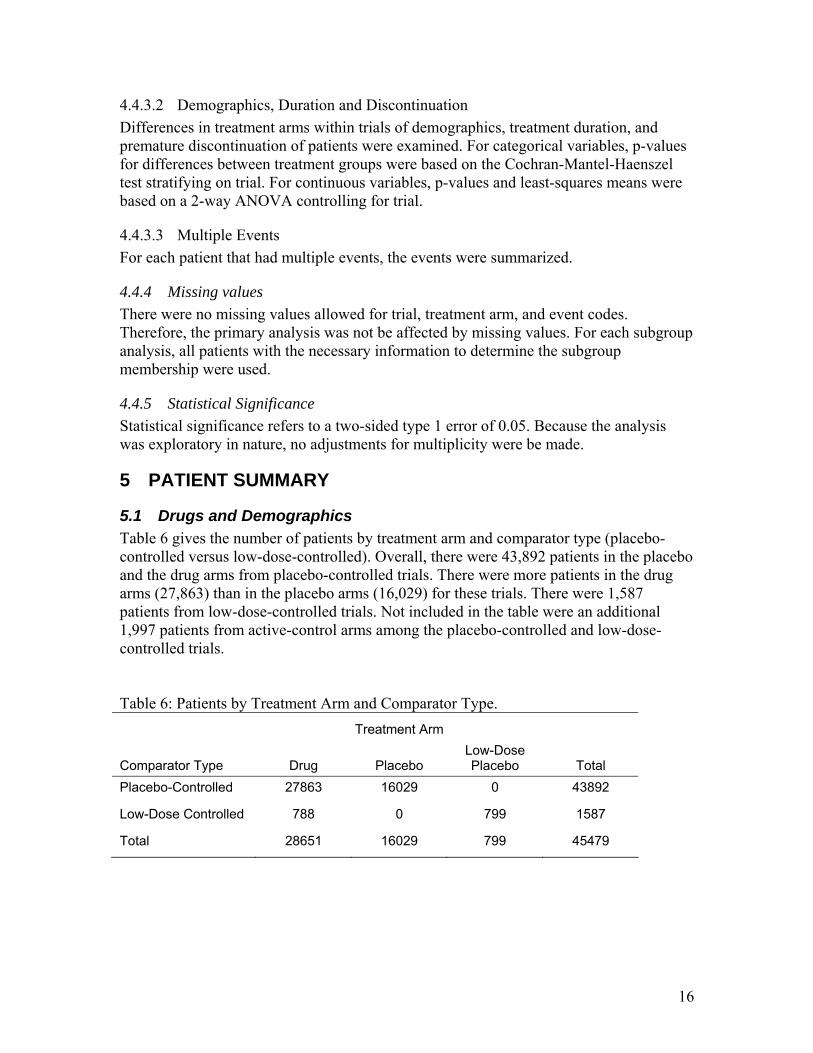
5.1 Drugs and Demographics Table 6 gives the number of patients by treatment arm and comparator type (placebo-controlled versus low-dose-controlled). Overall, there were 43,892 patients in the placebo and the drug arms from placebo-controlled trials. There were more patients in the drug arms (27,863) than in the placebo arms (16,029) for these trials. There were 1,587 patients from low-dose-controlled trials. Not included in the table were an additional 1,997 patients from active-control arms among the placebo-controlled and low-dose-controlled trials. Table 6: Patients by Treatment Arm and Comparator Type. Treatment Arm
Comparator Type Drug Placebo Low-Dose Placebo Total
Placebo-Controlled 27863 16029 0 43892
Low-Dose Controlled 788 0 799 1587
Total 28651 16029 799 45479

17
Table 7 gives the number of patients by treatment arm and drug for placebo-controlled trials. The drugs topiramate and pregabalin accounted for approximately half of the overall patients: 27% for topiramate and 24% for pregabalin. Table 7: Patients by Treatment Arm and Drug, Placebo-Controlled Trials.
Treatment Group
Drug Drug N = 27863
n (%)
Placebo N = 16029
n (%)
Total N = 43892
n (%) Carbamazepine 252 (1) 250 (2) 502 (1)
Divalproex 1327 (5) 992 (6) 2319 (5)
Felbamate 170 (1) 170 (1) 340 (1)
Gabapentin 2903 (10) 2029 (13) 4932 (11)
Lamotrigine 2865 (10) 2070 (13) 4935 (11)
Levetiracetam 2554 (9) 1549 (10) 4103 (9)
Oxcarbazepine 1342 (5) 827 (5) 2169 (5)
Pregabalin 7201 (26) 3125 (19) 10326 (24)
Tiagabine 835 (3) 608 (4) 1443 (3)
Topiramate 7742 (28) 3971 (25) 11713 (27)
Zonisamide 672 (2) 438 (3) 1110 (3)

18
Table 8 gives the number of patients by indication group and drug. Seven of the 11 drugs had patients in all three indication groups. Large percentages of gabapentin and topiramate patients were in the Other Indication group (non-epilepsy, non-psychiatric). Overall, the Other Indication group had the most patients with 48% of the patients. The Epilepsy and Psychiatric Indication groups had similar percentages of the patients to each other with roughly 25% of the patients each. Table 8: Patients by Indication Group and Drug, Placebo-Controlled Trials. Indication Group
Drug Epilepsy n (n/N%)
Psychiatric n (n/N%)
Other n (n/N%)
Total N
Carbamazepine 0 (0) 502 (100) 0 (0) 502
Divalproex 147 (6) 1285 (55) 887 (38) 2319
Felbamate 340 (100) 0 (0) 0 (0) 340
Gabapentin 1485 (30) 331 (7) 3116 (63) 4932
Lamotrigine 1408 (29) 2313 (47) 1214 (25) 4935
Levetiracetam 1634 (40) 1609 (39) 860 (21) 4103
Oxcarbazepine 1110 (51) 115 (5) 944 (44) 2169
Pregabalin 1685 (16) 3204 (31) 5437 (53) 10326
Tiagabine 939 (65) 504 (35) 0 (0) 1443
Topiramate 1346 (11) 1933 (17) 8434 (72) 11713
Zonisamide 848 (76) 0 (0) 262 (24) 1110
Total 10942 (25) 11796 (27) 21154 (48) 43892
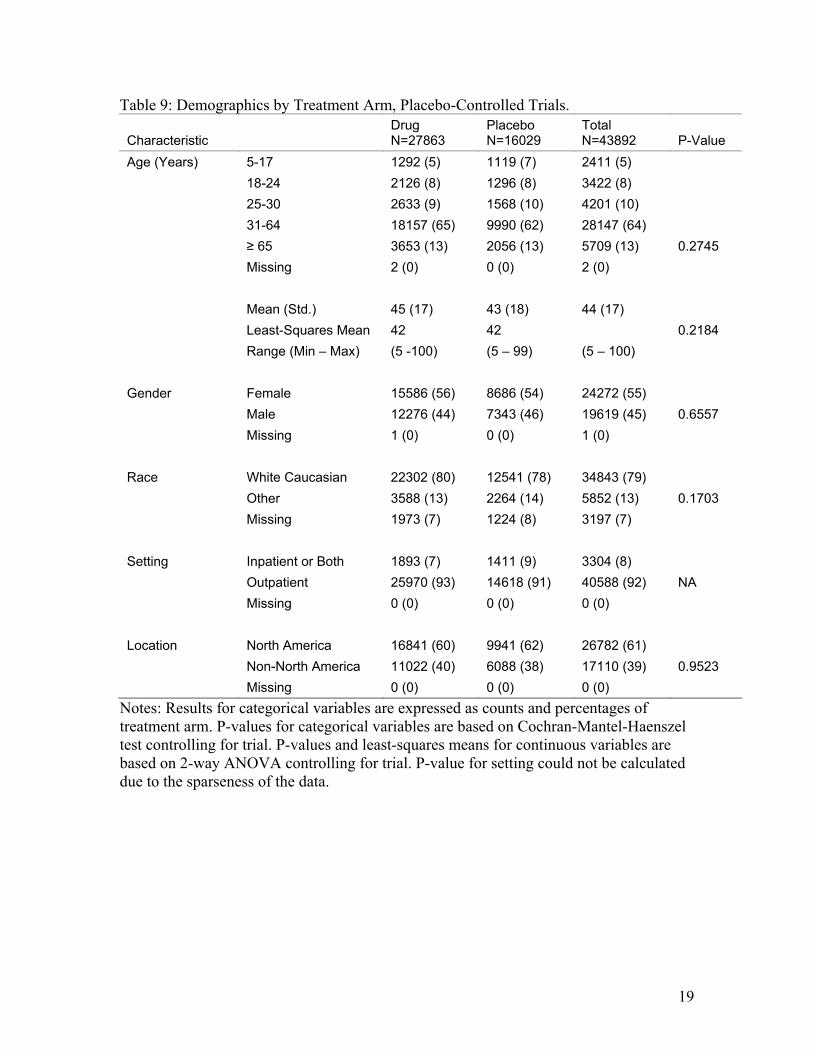
Table 9 gives the demographics of the patients by treatment arm. For age, gender, race, and location there were no statistically significant differences between the treatment arms. P-value for setting could not be calculated due to the sparseness of the data, but the observed percentages were similar between the treatment arms. The least-squares means for age was 42 for both treatment arms. The least-squares means control for differences among the trials and are more appropriate measures than the ordinary means in the context of the meta-analysis, which controls for differences among the trials. Roughly 5% of the patients were under the age of 18 and 13% of the patients were age 65 or older. A majority of the patients were female (55%). A large majority of the patients were white Caucasian (79%). A large majority of patients had out-patient treatment only (92%) and a majority of the patients were in North America (61%).
19
Table 9: Demographics by Treatment Arm, Placebo-Controlled Trials.
Characteristic Drug N=27863
Placebo N=16029
Total N=43892 P-Value
Age (Years) 5-17 1292 (5) 1119 (7) 2411 (5) 18-24 2126 (8) 1296 (8) 3422 (8) 25-30 2633 (9) 1568 (10) 4201 (10) 31-64 18157 (65) 9990 (62) 28147 (64) ≥ 65 3653 (13) 2056 (13) 5709 (13) 0.2745 Missing 2 (0) 0 (0) 2 (0) Mean (Std.) 45 (17) 43 (18) 44 (17) Least-Squares Mean 42 42 0.2184 Range (Min – Max) (5 -100) (5 – 99) (5 – 100) Gender Female 15586 (56) 8686 (54) 24272 (55) Male 12276 (44) 7343 (46) 19619 (45) 0.6557 Missing 1 (0) 0 (0) 1 (0) Race White Caucasian 22302 (80) 12541 (78) 34843 (79) Other 3588 (13) 2264 (14) 5852 (13) 0.1703 Missing 1973 (7) 1224 (8) 3197 (7) Setting Inpatient or Both 1893 (7) 1411 (9) 3304 (8) Outpatient 25970 (93) 14618 (91) 40588 (92) NA Missing 0 (0) 0 (0) 0 (0) Location North America 16841 (60) 9941 (62) 26782 (61) Non-North America 11022 (40) 6088 (38) 17110 (39) 0.9523 Missing 0 (0) 0 (0) 0 (0)
Notes: Results for categorical variables are expressed as counts and percentages of treatment arm. P-values for categorical variables are based on Cochran-Mantel-Haenszel test controlling for trial. P-values and least-squares means for continuous variables are based on 2-way ANOVA controlling for trial. P-value for setting could not be calculated due to the sparseness of the data.

20
Table 10 gives the number of patients for the three drug groups. No p-values are available because drug class does not vary within a trial. As stated in Section 4.3, the three drug groups are not mutually exclusive. Drugs and therefore patients appear in multiple drug groups. Table 10: Patients by Drug Class and Treatment Arm, Placebo-Controlled Trials.
Drug Group Drug N=27863
Placebo N=16029
Total N=43892
Sodium Channel Blocking Yes 12873 (46) 7556 (47) 20429 (47) No 14990 (54) 8473 (53) 23463 (53) GABAergic and GABAmimetic Yes 20008 (72) 10725 (67) 30733 (70) No 7855 (28) 5304 (33) 13159 (30) Carbonic Anhydrase Inhibitors Yes 8414 (30) 4409 (28) 12823 (29) No 19449 (70) 11620 (72) 31069 (71)
5.2 Discontinuation and Duration Table 11 gives the treatment discontinuation status and the duration by treatment arm. A statistically significant larger percentage of drug patients discontinued prematurely than placebo patients. The placebo patients had a statistically significant larger least-squares mean for duration than drug patients. However, the drug patients had a larger ordinary mean for duration than the placebo patients. The difference in results between the least-squares means and the ordinary means is influenced by a single trial. Figure 1 plots for each trial, the mean placebo duration versus the mean drug duration. The overall consistency of the durations within trials is seen by the fact that most trials fall near the 45-degree line. The trial with the largest durations (topiramate OBES002) had a large imbalance of patients between the arms: 960 drug patients and 322 placebo patients. This imbalance in arm sizes had large influence on the ordinary means. Removing this trial, the ordinary means were more similar, 82 days for each arm. Overall, for 131 of the 199 trials, the placebo arm had a higher duration than the drug arm. Since the meta-analysis controlled for differences in trials, the least-squares means are more appropriate to examine differences in duration. The least-squares means show that the placebo patients had larger durations (77 days for placebo versus 73 days for drug). If events were related to duration, the placebo patients may be expected to have more events independent of any treatment effect. The person-time analysis described in Section 4.4, which was not part of the Statistical Analysis Plan, was performed to account for the possibility of a duration effect.

21
Table 11: Patient Treatment Discontinuation and Duration by Treatment Arm, Placebo-Controlled Trials.
Characteristic Drug
N=27863 Placebo N=16029
Total N=43892 P-Value
Discontinue No 17889 (64) 11118 (69) 29007 (66) Yes 9974 (36) 4911 (31) 14885 (34) <.0001 Missing 0 (0) 0 (0) 0 (0) Duration (Days) Mean (Std.) 90 (89) 87 (78) 89 (85) Least-Squares Mean 73 77 <.0001 Range (Min – Max) (0 – 575) (1 – 582) (0 – 582) Missing 9 8 17
Notes: Results for categorical variables are expressed as counts and percentages of treatment arm. P-values for categorical variables are based on Cochran-Mantel-Haenszel test controlling for trial. P-values and least-squares means for continuous variables are based on 2-way ANOVA controlling for trial.
0 50 100 150 200 250 300 350
050
100
150
200
250
300
350
Drug
Pla
cebo
Topiram ate OBES002
Figure 1: Mean Trial Duration by Treatment Arm, Placebo-Controlled Trials.

22
6 FINDINGS
6.1 Suicidal Behavior or Ideation Table 12 gives the number of patients with a Suicidal Behavior or Ideation event by type of event and treatment arm. There were 4 completed suicides among patients in the drug arms and none among patients in the placebo arms. Of the 4 completed suicides, 2 were in the Epilepsy Indication subgroup and 2 were in the Psychiatric Indication subgroup. The majority of events for both arms were Suicidal ideation. The second most frequent type of event for both arms was Suicide Attempt. Note that as seen on Table 6, there were more drug patients than placebo patients. Without adjusting for differences among trials, 0.37% of the drug patients had a Suicidal Behavior or Ideation event versus 0.24% of the placebo patients. Of the 199 placebo-controlled trials, 66 (33%) had at least one Suicidal Behavior or Ideation event in the test drug or placebo arms. Table 12: Events by Type and Treatment Arm, Placebo-Controlled Trials. Event Drug Placebo Total Completed suicide 4 0 4 Suicide attempt 30 8 38 Preparatory acts 3 1 4 Suicidal ideation 67 29 96 Total 104 38 142
Notes: Events include only the most critical event for each patient.

23
Table 13 gives the number of patients with a Suicidal Behavior or Ideation event, the number of patients, and the crude odds ratios by drug. The drug felbamate had no events and therefore the odds ratio for the drug is not defined. The drug tiagabine had events only in the drug arm and therefore the odds ratios for this drug was infinity. No drug had events only in the placebo arm. The range of the finite crude odds ratios was from 0.66 to 2.57. Table 13: Suicidal Behavior or Ideation Events and Patients by Drug, Placebo-Controlled Trials.
Drug Drug
Events/Patients Placebo
Events/Patients Crude OR Carbamazepine 2/252 3/250 0.66
Divalproex 11/1327 9/992 0.91
Felbamate 0/170 0/170 ND
Gabapentin 2/2903 1/2029 1.40
Lamotrigine 27/2865 11/2070 1.78
Levetiracetam 8/2554 2/1549 2.43
Oxcarbazepine 2/1342 1/827 1.23
Pregabalin 7/7201 2/3125 1.52
Tiagabine 2/835 0/608 Inf.
Topiramate 40/7742 8/3971 2.57
Zonisamide 3/672 1/438 1.96
Total 104/27863 38/16029 1.58
Notes: Events include only most critical event for each patient. ND: Not defined. Inf.: Infinity.

24
Figure 2 gives a forest plot of the estimated odds ratios and 95% confidence intervals for Suicidal Behavior or Ideation by drug and overall. The estimated overall odds ratio was 1.80 (95% CI: 1.24, 2.66). The odds ratio was greater than 1 and the confidence interval did not contain the value of 1. Therefore, the drugs were associated with statistically significant increased risk of Suicidal Behavior or Ideation events relative to placebo. Based on the overall odds ratio estimate and the observed rate of 0.24% for Suicidal Behavior or Ideation events among placebo patients, there was an estimated 1.9 per 1000 (95% CI: 0.6, 3.9) more antiepileptic drug patients than placebo patients who experienced Suicidal Behavior or Ideation in placebo-controlled trials. In terms of adjusted risk estimates for the treatment groups, 0.43% of the drug patients experienced Suicidal Behavior or Ideation compared to the 0.24% of placebo patients. Among the 10 drugs with any events, the estimated odds ratios for 8 drugs were greater than 1. For 2 of these 8 drugs, the confidence interval did not contain the value of 1.
Odds Ratio
0.1 0.3 1 3.2 10
Overall
Zonisam ide
Topiram ate
Tiagabine
Pregabalin
Oxcarbazepine
Levetiracetam
Lam otrigine
Gabapentin
Felbam ate
Divalproex
Carbam azepine
1.80 (1.24, 2.66) [104/27863 38/16029]
2.52 (0.26, 67.94) [3/672 1/438]
2.53 (1.21, 5.85) [40/7742 8/3971]
inf (0.20, inf) [2/835 0/608]
1.88 (0.41, 13.58) [7/7201 2/3125]
1.91 (0.15, 56.33) [2/1342 1/827]
2.75 (0.62, 19.36) [8/2554 2/1549]
2.08 (1.03, 4.40) [27/2865 11/2070]
1.57 (0.12, 47.66) [2/2903 1/2029]
ND. (ND., ND.) [0/170 0/170]
0.72 (0.29, 1.84) [11/1327 9/992]
0.65 (0.08, 4.42) [2/252 3/250]
Drug OR (95% CI) [Sample Sizes]*
*[Treat. Events /Treat. n Plac. Events /Placebo n] Figure 2: Suicidal Behavior or Ideation Odds Ratio Estimates, Placebo-Controlled Trials.

25
6.2 Suicidal Behavior and Suicidal Ideation Figure 3 gives the overall odds ratio estimates for the two endpoints: (1) Suicidal Behavior and (2) Suicidal Ideation. The odds ratio estimate for Suicidal Behavior was greater than the odds ratio for Suicidal Ideation. The confidence interval for Suicidal Behavior did not contain the value of 1, whereas the confidence interval for Suicidal Ideation contained the value of 1.
Odds Ratio
0.1 0.3 1 3.2 10
Suicidal Behavior or Ideation
Suicidal Ideation Only
Suicidal Behavior
1.80 (1.24, 2.66) [104/27863 38/16029]
1.45 (0.93, 2.30) [67/27863 29/16029]
2.92 (1.44, 6.47) [37/27863 9/16029]
Endpoint OR (95% CI) [Sample Sizes]*
*[Treat. Events /Treat. n Plac. Events /Placebo n] Figure 3: Suicidal Behavior versus Suicidal Ideation Odds Ratio Estimates, Placebo-Controlled Trials.
6.3 Sensitivity Analysis
6.3.1 Zero-Event Trials Figure 4 gives the estimated risk differences and 95% confidence intervals for Suicidal Behavior or Ideation by drug and overall. Unlike the odds ratio analysis, this risk difference analysis makes uses of trials without any events.

26
The overall risk difference was 1.79 (95% CI: 0.70, 2.87) per 1000 patients. The risk difference was greater than 0 and the confidence interval did not contain the value of 0. As was the case, for the odds ratio analysis, this result supports the finding that the drugs were associated with statistically significant increased risk of Suicidal Behavior or Ideation events relative to placebo. For each of the 11 drugs, the risk difference estimate had the same direction as the odds ratio estimate relative to the null value of no effect.
Risk Difference per 1000 Subjects
-15 -10 -5 0 5 10 15
Overall
Zonisam ide
Topiram ate
Tiagabine
Pregabalin
Oxcarbazepine
Levetiracetam
Lam otrigine
Gabapentin
Felbam ate
Divalproex
Carbam azepine
1.79 (0.70, 2.87) [104/27863 38/16029]
3.09 (-3.80, 9.98) [3/672 1/438]
3.05 (0.98, 5.11) [40/7742 8/3971]
2.43 (-0.99, 5.85) [2/835 0/608]
0.52 (-0.77, 1.81) [7/7201 2/3125]
0.97 (-2.47, 4.41) [2/1342 1/827]
2.13 (-0.54, 4.80) [8/2554 2/1549]
5.40 (0.24, 10.57) [27/2865 11/2070]
0.28 (-1.37, 1.92) [2/2903 1/2029]
ND. (ND., ND.) [0/170 0/170]
-2.75 (-10.68, 5.17) [11/1327 9/992]
-4.16 (-21.34, 13.03) [2/252 3/250]
Drug RD (95% CI) [Sample Sizes]*
*[Treat. Events /Treat. n Plac. Events /Placebo n] Figure 4: Suicidal Behavior or Ideation Risk Difference Estimates, Placebo-Controlled Trials.
6.3.2 Trial Heterogeneity The primary analysis method was a fixed-effect method. Fixed effect methods assume that all the trials had a common treatment effect. The p-value based on Zelen’s test for the null hypothesis that all trials had a common odds ratio test was 0.735. This value does not provide evidence for trial heterogeneity in the odds ratio. However, the lack evidence does not imply that there was no trial heterogeneity. The general linear mixed model (GLMM) that allows for trial heterogeneity produced an overall odds ratio estimate of 1.86 (95% CI: 1.24, 2.78). Both the estimate and the

27
confidence interval were very similar to those from the primary analysis method. The similarity implies that trial heterogeneity was not a major concern. The variance component estimate for the trial heterogeneity effect from the GLLM was 0.13 with a standard error of 0.26. The scale of the component is complex. However, the fact that the estimate was small relative to its standard error again does not provide evidence for trial heterogeneity. The Mantel-Haenszel odds ratio weights were calculated to examine if there were trials with large influence on the overall odds ratio estimate. On a normalized scale such that the weights add to one, the largest five weights were 0.060, 0.020, 0.019, 0.017, and 0.016. The weight of 0.06 corresponded to the trial divalproex M92822. Except for this trial, no trial accounted for more than one fiftieth of the total weight. The overall odds ratio estimated using the exact method and excluding this trial was 2.12 (95% CI: 1.42, 3.25). This estimate was slightly larger than the estimate with all the trials. However, the two sets of estimates and confidence intervals were qualitatively similar.

28
6.3.3 Person-Time Analysis Based on the finding that there was a statistically significant difference in treatment duration between the treatment arms (least-squares means 77 days for placebo versus 73 days for drug), an analysis that adjusts for differences in duration was performed. Figure 5 gives the estimated rate ratio and 95% confidence intervals from this analysis for Suicidal Behavior or Ideation by drug and overall. The overall rate ratio was 1.82 (95% CI: 1.25, 2.68). This result was very similar to the overall odds ratio result, which does not adjusted for difference in treatment duration. Additionally, for each of the 11 drugs, the rate estimate was very similar to the odds ratio estimate.
Rate Ratio
0.1 0.3 1 3.2 10
Overall
Zonisam ide
Topiram ate
Tiagabine
Pregabalin
Oxcarbazepine
Levetiracetam
Lam otrigine
Gabapentin
Felbam ate
Divalproex
Carbam azepine
1.82 (1.25, 2.68) [103/27853 38/16021]
2.66 (0.28, 71.03) [3/672 1/438]
2.61 (1.25, 6.03) [39/7740 8/3970]
inf (0.22, inf) [2/829 0/603]
1.95 (0.42, 14.07) [7/7201 2/3125]
1.99 (0.15, 58.71) [2/1342 1/827]
2.84 (0.64, 19.93) [8/2554 2/1549]
2.14 (1.07, 4.52) [27/2865 11/2070]
1.49 (0.11, 44.82) [2/2903 1/2029]
ND. (ND., ND.) [0/169 0/170]
0.64 (0.26, 1.63) [11/1327 9/992]
0.64 (0.08, 4.30) [2/251 3/248]
Drug OR (95% CI) [Sample Sizes]*
*[Treat. Events /Treat. n Plac. Events /Placebo n] Figure 5: Suicidal Behavior or Ideation Rate Ratio Estimates, Placebo-Controlled Trials. Note: 18 Patients with missing or zero duration were not included in this analysis.
29
6.4 Exploratory Analysis
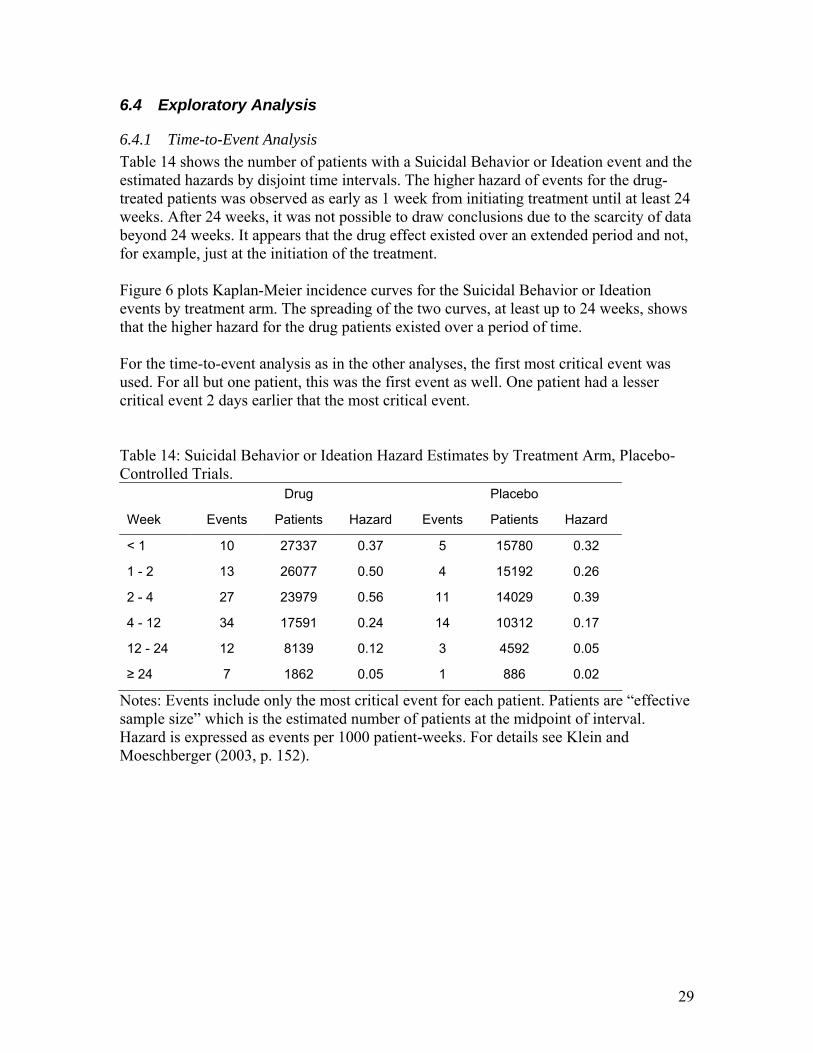
6.4.1 Time-to-Event Analysis Table 14 shows the number of patients with a Suicidal Behavior or Ideation event and the estimated hazards by disjoint time intervals. The higher hazard of events for the drug-treated patients was observed as early as 1 week from initiating treatment until at least 24 weeks. After 24 weeks, it was not possible to draw conclusions due to the scarcity of data beyond 24 weeks. It appears that the drug effect existed over an extended period and not, for example, just at the initiation of the treatment. Figure 6 plots Kaplan-Meier incidence curves for the Suicidal Behavior or Ideation events by treatment arm. The spreading of the two curves, at least up to 24 weeks, shows that the higher hazard for the drug patients existed over a period of time. For the time-to-event analysis as in the other analyses, the first most critical event was used. For all but one patient, this was the first event as well. One patient had a lesser critical event 2 days earlier that the most critical event. Table 14: Suicidal Behavior or Ideation Hazard Estimates by Treatment Arm, Placebo-Controlled Trials. Drug Placebo
Week Events Patients Hazard Events Patients Hazard
< 1 10 27337 0.37 5 15780 0.32
1 - 2 13 26077 0.50 4 15192 0.26
2 - 4 27 23979 0.56 11 14029 0.39
4 - 12 34 17591 0.24 14 10312 0.17
12 - 24 12 8139 0.12 3 4592 0.05
≥ 24 7 1862 0.05 1 886 0.02
Notes: Events include only the most critical event for each patient. Patients are “effective sample size” which is the estimated number of patients at the midpoint of interval. Hazard is expressed as events per 1000 patient-weeks. For details see Klein and Moeschberger (2003, p. 152).

30
Weeks
Cum
ulat
ive
Inci
denc
e
0 12 24 36 48 60
0.00
00.
005
0.01
00.
015
27854 12549 3716 1610 1178 494 Drug
16021 7410 1770 714 465 153 Placebo
Drug
Placebo
Num ber At Risk
Figure 6: Kaplan-Meier Suicidal Behavior or Ideation Incidence Curves by Treatment Arm, Placebo-Controlled Trials.

31
6.4.2 Multiple Events Among the placebo-controlled trials, 9 patients had more than one Suicidal Behavior or Ideation event. Table 15 lists the events for these patients. One patient had two suicide attempts. Another patient had one suicide attempt. The events of the remaining 7 patients were all suicidal ideation. Table 15: Events from Patients with Multiple Events, Placebo-Controlled Trials. Patient Event Event Day Carbamazepine 105.301 004004 Ideation 11 Ideation 12 Divalproex M92822 13709 Ideation 44 Ideation 234 Divalproex M96493 20101 Ideation 17 Suicide attempt 19 Lamotrigine P42040 37004 Ideation 5 Ideation 75 Ideation 83 Ideation 88 Lamotrigine SCA3092/0946 63307 Ideation 56 Ideation 78 Lamotrigine SCAA2010 03168 Suicide attempt 23 Suicide attempt 30 Topiramate CAPSS168 00013403 Ideation 25 Ideation 56 Topiramate OBES002 7123 Ideation 51 Ideation 82 Topiramate PDMD005 10004 Ideation 1 Ideation 11

32
7 FINDINGS IN SPECIAL/SUBGROUP POPULATIONS
7.1 Drug Groups Figure 7 gives the estimated odds ratios and 95% confidence intervals for Suicidal Behavior or Ideation by drug group. The estimated odds ratio for each drug group and its complement were all greater than one. Except for the group made of drugs that are not in the Sodium Channel Blocking group, the confidence intervals for all drug groups did not contain the value of 1. As stated above, the three drug groups are not disjoint. Topiramate is in all three drugs groups, and there were a large number of patients from topiramate trials. Therefore, treatment effects of topiramate can be expected to have large influence on all three drugs classes.
Odds Ratio
0.1 0.3 1 3.2 10
Overall
Non-Carbonic
Carbonic
Non-GABA
GABA
Non-Na Channel Blocking
Na Channel Blocking
1.80 (1.24, 2.66) [104/27863 38/16029]
1.56 (1.00, 2.47) [61/19449 29/11620]
2.53 (1.25, 5.56) [43/8414 9/4409]
1.94 (1.12, 3.47) [42/7855 18/5304]
1.68 (1.02, 2.88) [62/20008 20/10725]
1.33 (0.70, 2.61) [30/14990 14/8473]
2.08 (1.31, 3.39) [74/12873 24/7556]
Drug OR (95% CI) [Sample Sizes]*
*[Treat. Events /Treat. n Plac. Events /Placebo n] Figure 7: Suicidal Behavior or Ideation Odds Ratio Estimates by Drug Group, Placebo-Controlled Trials.

33
7.2 Trial Indication Figure 8 gives the estimated odds ratios and 95% confidence intervals for Suicidal Behavior or Ideation by indication group. The epilepsy indication group had the highest estimated odds ratio and its confidence interval did not contain the value of 1. The odds ratios for the other two indication groups, psychiatric and other, were greater than 1, but the lower end of the confidence intervals were slightly below 1.
Odds Ratio
0.1 0.3 1 3.2 10
Overall
Other
Psychiatric
Epilepsy
1.80 (1.24, 2.66) [104/27863 38/16029]
1.87 (0.81, 4.76) [24/14051 7/7103]
1.51 (0.95, 2.45) [57/7025 27/4771]
3.53 (1.28, 12.10) [23/6787 4/4155]
Indication Class OR (95% CI) [Sample Sizes]*
*[Treat. Events /Treat. n Plac. Events /Placebo n] Figure 8: Suicidal Behavior or Ideation Odds Ratio Estimates by Indication Group, Placebo-Controlled Trials.

34
Although the estimated odds ratio was higher in the epilepsy indication group than in the psychiatric indication group, the excess drug risks in the two indication groups were similar. Table 16 gives estimates of the placebo and drug event rates and the risk difference risk by indication group. The psychiatric indication group had a notably higher placebo event rate than the other indication groups and had the highest risk difference, whereas, the epilepsy indication group had the highest odds ratio. Table 16: Placebo and Drug Suicidal Behavior or Ideation Event Rates and Risk Difference by Indication, Placebo-Controlled Trials.
Indication Odds Ratio
Placebo Patients with
Events Per 1000 Patients
Drug Patients with Events Per 1000 Patients
Risk Difference:
Additional Drug Patients with Events Per
1000 Patients Risk Ratio Epilepsy 3.53 1.0 3.4 2.4 3.5
Psychiatric 1.51 5.7 8.5 2.9 1.5
Other 1.87 1.0 1.8 0.9 1.9
Total 1.80 2.4 4.3 1.9 1.8
Notes: Drug event rate was calculated as the product of the placebo event rate and estimated odds ratio. Risk difference was calculated as the drug event rate minus the placebo event rate. Risk ratio was calculated as the ratio of the drug event rate to the placebo event rate.

35
7.3 Demographics
7.3.1 Age Figure 9 gives the estimated odds ratios and 95% confidence intervals for Suicidal Behavior or Ideation by age group. For all but the 25 – 30 age group, the estimated odds ratios were greater than 1. Only the 31 – 64 age group had a confidence interval that did not contain the value of 1. However, the other age-groups had smaller numbers of patients resulting in wider confidence intervals. Overall, there was no clear pattern across age groups.
Odds Ratio
0.1 0.3 1 3.2 10
Overall
65 and Up
31 to 64
25 to 30
18 to 24
5 to 17
1.80 (1.24, 2.66) [104/27863 38/16029]
inf (0.23, inf) [3/3653 0/2056]
1.78 (1.13, 2.89) [70/18157 25/9990]
0.82 (0.31, 2.27) [11/2633 8/1568]
2.65 (0.90, 9.45) [15/2126 4/1296]
4.26 (0.58, 102.10) [5/1292 1/1119]
Age Class OR (95% CI) [Sample Sizes]*
*[Treat. Events /Treat. n Plac. Events /Placebo n] Figure 9: Suicidal Behavior or Ideation Odds Ratio Estimates by Age Group, Placebo-Controlled Trials.

36
7.3.2 Gender Figure 10 gives the estimated odds ratios and 95% confidence intervals for Suicidal Behavior or Ideation trials by gender. For both females and males, the estimated odds ratios were greater than 1. The confidence interval for males did not contain the value of 1, whereas the confidence interval for females did contain the value of 1.
Odds Ratio
0.1 0.3 1 3.2 10
Overall
Male
Fem ale
1.80 (1.24, 2.66) [104/27863 38/16029]
2.44 (1.38, 4.51) [54/12276 15/7343]
1.39 (0.85, 2.35) [50/15586 23/8686]
Gender OR (95% CI) [Sample Sizes]*
*[Treat. Events /Treat. n Plac. Events /Placebo n] Figure 10: Suicidal Behavior or Ideation Odds Ratio Estimates by Gender, Placebo-Controlled Trials.

37
7.3.3 Race Figure 11 gives the estimated odds ratios and 95% confidence intervals for Suicidal Behavior or Ideation by race. For both the white and other subgroups, the estimated odds ratios were greater than 1. The estimate for the other subgroup was higher than that for white subgroup. The confidence interval for the white subgroup did not contain the value of 1. The confidence interval for other subgroup contained the value of 1, but because of the small number of patients in this group, the confidence interval was wide.
Odds Ratio
0.1 0.3 1 3.2 10
Overall
Other
White
1.80 (1.24, 2.66) [104/27863 38/16029]
2.23 (0.73, 8.12) [13/3588 4/2264]
1.78 (1.19, 2.70) [89/22302 33/12541]
Race OR (95% CI) [Sample Sizes]*
*[Treat. Events /Treat. n Plac. Events /Placebo n] Figure 11: Suicidal Behavior or Ideation Odds Ratio Estimates by Race Group, Placebo-Controlled Trials.

38
7.3.4 Setting Figure 12 gives the estimated odds ratios and 95% confidence intervals for Suicidal Behavior or Ideation by setting. For both settings, the estimated odds ratios were greater than 1. The confidence interval for outpatient setting did not contain the value of 1. The confidence interval for the inpatient or both setting contained the value of 1, but because of the small number of patients in this group, the confidence interval was very wide.
Odds Ratio
0.1 0.3 1 3.2 10
Overall
Outpatient
Inpatient or Both
1.80 (1.24, 2.66) [104/27863 38/16029]
1.84 (1.24, 2.78) [97/25970 34/14618]
1.42 (0.40, 5.62) [7/1893 4/1411]
Setting OR (95% CI) [Sample Sizes]*
*[Treat. Events /Treat. n Plac. Events /Placebo n] Figure 12: Suicidal Behavior or Ideation Odds Ratio Estimates by Setting, Placebo-Controlled Trials.
39
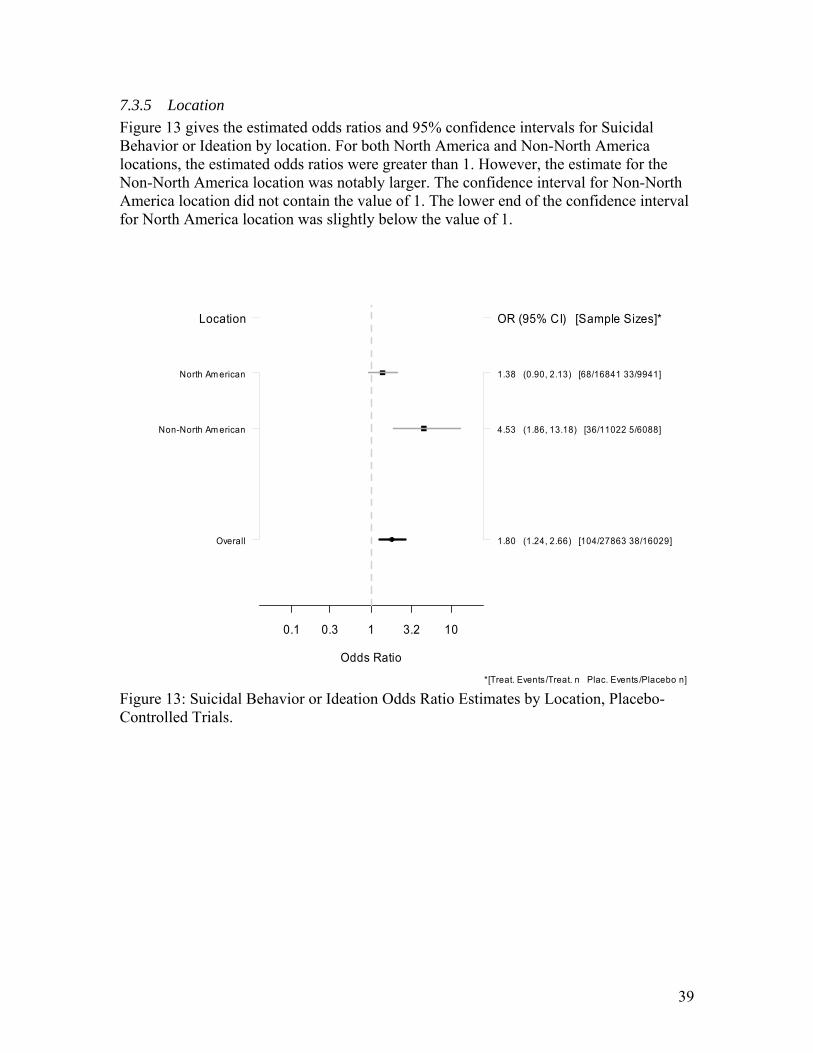
7.3.5 Location Figure 13 gives the estimated odds ratios and 95% confidence intervals for Suicidal Behavior or Ideation by location. For both North America and Non-North America locations, the estimated odds ratios were greater than 1. However, the estimate for the Non-North America location was notably larger. The confidence interval for Non-North America location did not contain the value of 1. The lower end of the confidence interval for North America location was slightly below the value of 1.
Odds Ratio
0.1 0.3 1 3.2 10
Overall
Non-North Am erican
North Am erican
1.80 (1.24, 2.66) [104/27863 38/16029]
4.53 (1.86, 13.18) [36/11022 5/6088]
1.38 (0.90, 2.13) [68/16841 33/9941]
Location OR (95% CI) [Sample Sizes]*
*[Treat. Events /Treat. n Plac. Events /Placebo n] Figure 13: Suicidal Behavior or Ideation Odds Ratio Estimates by Location, Placebo-Controlled Trials.

40
7.3.6 Comparator Type Figure 14 gives the estimated overall odds ratios and 95% confidence intervals for Suicidal Behavior or Ideation for placebo-controlled, low-dose-controlled trials, and all trials. The estimated odds ratio was 1.83 (95% CI: 1.26, 2.69) for all controlled trials. This result was very similar to the result for placebo-controlled trial, since most trials were placebo-controlled. The estimated odds ratio for low-dose-controlled trials was 3.09 (95% CI: 0.33, 81.51). The large confidence interval indicates that the result was not precise.
Odds Ratio
0.1 0.3 1 3.2 10
All Control
Low-Dose
Placebo
1.83 (1.26, 2.69) [107/28651 39/16828]
3.09 (0.33, 81.51) [3/788 1/799]
1.80 (1.24, 2.66) [104/27863 38/16029]
Control OR (95% CI) [Sample Sizes]*
*[Treat. Events /Treat. n Plac. Events /Placebo n] Figure 14: Suicidal Behavior or Ideation Odds Ratio Estimates, Placebo-Controlled and Low-Dose-Controlled Trials.
8 POST-HOC ANALYSES In addition to the deviations and additions to the SAP noted above, there were analyses performed not specified in the SAP and performed after reviewing the initial analysis.
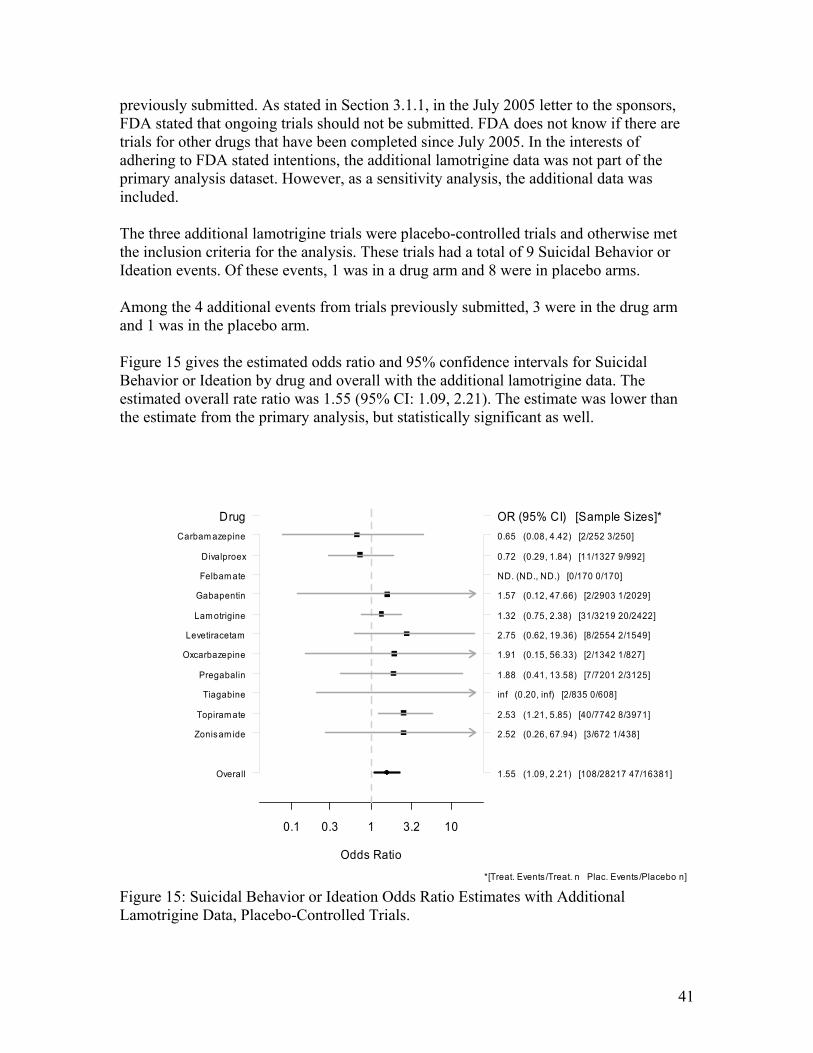
8.1 Lamotrigine Additional Data On November 21, 2007, the sponsor of lamotrigine submitted additional data for the drug. The submission included (1) data from three trials that were ongoing at the time of the data requests to the sponsors and (2) 4 additional suicidality events from trials
41
previously submitted. As stated in Section 3.1.1, in the July 2005 letter to the sponsors, FDA stated that ongoing trials should not be submitted. FDA does not know if there are trials for other drugs that have been completed since July 2005. In the interests of adhering to FDA stated intentions, the additional lamotrigine data was not part of the primary analysis dataset. However, as a sensitivity analysis, the additional data was included. The three additional lamotrigine trials were placebo-controlled trials and otherwise met the inclusion criteria for the analysis. These trials had a total of 9 Suicidal Behavior or Ideation events. Of these events, 1 was in a drug arm and 8 were in placebo arms. Among the 4 additional events from trials previously submitted, 3 were in the drug arm and 1 was in the placebo arm. Figure 15 gives the estimated odds ratio and 95% confidence intervals for Suicidal Behavior or Ideation by drug and overall with the additional lamotrigine data. The estimated overall rate ratio was 1.55 (95% CI: 1.09, 2.21). The estimate was lower than the estimate from the primary analysis, but statistically significant as well.
Odds Ratio
0.1 0.3 1 3.2 10
Overall
Zonisam ide
Topiram ate
Tiagabine
Pregabalin
Oxcarbazepine
Levetiracetam
Lam otrigine
Gabapentin
Felbam ate
Divalproex
Carbam azepine
1.55 (1.09, 2.21) [108/28217 47/16381]
2.52 (0.26, 67.94) [3/672 1/438]
2.53 (1.21, 5.85) [40/7742 8/3971]
inf (0.20, inf) [2/835 0/608]
1.88 (0.41, 13.58) [7/7201 2/3125]
1.91 (0.15, 56.33) [2/1342 1/827]
2.75 (0.62, 19.36) [8/2554 2/1549]
1.32 (0.75, 2.38) [31/3219 20/2422]
1.57 (0.12, 47.66) [2/2903 1/2029]
ND. (ND., ND.) [0/170 0/170]
0.72 (0.29, 1.84) [11/1327 9/992]
0.65 (0.08, 4.42) [2/252 3/250]
Drug OR (95% CI) [Sample Sizes]*
*[Treat. Events /Treat. n Plac. Events /Placebo n] Figure 15: Suicidal Behavior or Ideation Odds Ratio Estimates with Additional Lamotrigine Data, Placebo-Controlled Trials.

42
8.2 Alternative Age Subgroups In order to further explore the possibility of an interaction of age with the drug effect, a finer partition of the age subgroups was analyzed post-hoc. The 31 to 64 years age subgroup, which was part of the SAP, was partitioned into 4 age subgroups. Figure 16 gives the estimated odds ratios and 95% confidence intervals for Suicidal Behavior or Ideation by the post-hoc age groups. As was the case with the prospectively defined age subgroups, there was no clear pattern across age groups.
Odds Ratio
0.1 0.3 1 3.2 10
Overall
65 and Up
55 to 64
45 to 54
35 to 44
31 to 34
25 to 30
18 to 24
5 to 17
1.80 (1.24, 2.66) [104/27863 38/16029]
inf (0.23, inf) [3/3653 0/2056]
1.53 (0.39, 7.46) [8/4286 3/2240]
4.06 (1.32, 17.25) [23/5899 3/3196]
1.28 (0.64, 2.64) [24/5978 13/3350]
1.43 (0.53, 4.23) [15/1994 6/1204]
0.82 (0.31, 2.27) [11/2633 8/1568]
2.65 (0.90, 9.45) [15/2126 4/1296]
4.26 (0.58, 102.10) [5/1292 1/1119]
Age Class OR (95% CI) [Sample Sizes]*
*[Treat. Events /Treat. n Plac. Events /Placebo n] Figure 16: Suicidal Behavior or Ideation Odds Ratio Estimates by Post-Hoc Age Group, Placebo-Controlled Trials.
9 SUMMARY AND CONCLUSIONS
9.1 Review Summary This reviewed analyzed data from 210 placebo-controlled and low-dose-controlled trials of antiepileptic drugs. The trials came from 11 different antiepileptic drugs. The indications for the trials included epilepsy, psychiatric disorders, and other indications. The primary focus of the review was on the 199 placebo-controlled trials. In these trials,
43
there were 27,863 patients in the drug arms and 16,029 patients in the placebo arms that met the analysis criteria of being at least 5 years of age. There were no statistical differences among the baseline characteristics of the drug and placebo patients for age, gender, race, and location. The placebo patients had a statistically lower treatment discontinuation rate than the drug patients. Likewise, the placebo patients had statistically higher treatment duration (77 days for placebo versus 73 days for drug). There were 4 completed suicides among drug patients and none among placebo patients. The majority of suicidality events for both drug and placebo patients were Suicidal Ideation. The second most frequent type of event was Suicide Attempt. Without adjusting for differences among trials, 0.37% of the drug patients had a Suicidal Behavior or Ideation event versus 0.24% of the placebo patients. A meta-analysis was conducted to estimate an overall treatment effect for drug versus placebo patients and for various subgroups. The meta-analysis controlled for differences in background rates of events among the trials. Overall, the drugs were associated with statistically significant increased the risk of Suicidal Behavior or Ideation relative to placebo. The estimated overall odds ratio was 1.80 (95% CI: 1.24, 2.66). There was consistency among the results for individual drugs. The estimated odds ratio was greater than 1 for 8 drugs and less than 1 for 2 drugs. The estimated odds ratio was greater for the Suicidal Behavior endpoint than the Suicidal Ideation endpoint. Several sensitivity analyses were performed to examine the robustness of the result to the sparseness of the events, heterogeneity of the treatment effect, and differences in treatment duration between the placebo and drug arms. All the sensitivity analyses produced very similar results to the results of primary analysis for both the overall odds ratio and the individual drug odds ratios. The higher risk of events for the drug-treated patients was observed as early as 1 week from initiating treatment until at least 24 weeks. After 24 weeks, it was not possible to draw conclusions due to the scarcity of data beyond 24 weeks. Several subgroups were considered. Indication and location appeared to have the largest effects among the subgroups considered. The epilepsy indication subgroup had the largest estimated odds ratio compared to the psychiatric indication subgroup and the other indication subgroup. However, the psychiatric indication subgroup had the largest placebo risk of events. The result does not appear to be driven by particular drugs, since several drugs contributed comparable numbers of patients to the epilepsy subgroup. The estimated odds ratio for the Non-North American subgroup was notably larger than that of North American subgroup.

44
There was no obvious pattern in the risk with the age subgroups. For 4 of the 5 age subgroups, the estimated odds ratios were greater than 1. Likewise, there were no patterns in the risks for subgroups based on gender, race, setting, and prespecified drug groups.
9.2 Conclusions In conclusion, antiepileptic drugs are associated with increased risk of suicidality relative to placebo in randomized placebo-controlled trials. The effect appears consistent among the group of 11 drugs. There are 1.9 per 1000 (95% CI: 0.6, 3.9) more antiepileptic drug patients than placebo patients who experience Suicidal Behavior or Ideation. In terms of adjusted risk estimates for the treatment groups, 0.43% of the drug patients experience Suicidal Behavior or Ideation compared to 0.24% of the placebo patients. There is no obvious subgroup of patients to which the increased risk is specifically attributed. The increased risk was seen in almost all subgroups, although epileptic and Non-North American patients may have higher relative risks.
10 REFERENCES Cytel 2005. StatXact 7 PROCs for SAS Users. Cambridge (MA): Cytel Inc. Greenland S, Robins JM 1985. Estimation of a common effect parameter from sparse follow-up data. Biometrics 41:55-68 Klein JP, Moeschberger ML 2003. Survival Analysis 2nd Ed. New York (NY):Springer. McCulloch CE, Searle SR 2001. Generalized, Linear, and Mixed Models. New York (NY): John Wiley & Sons. Posner K, Oquendo MA, Gould M, Stanley B, Davies M 2007. Columbia Classification Algorithm of Suicide Assessment (C-CASA): classification of suicidal events in the FDA's pediatric suicidal risk analysis of antidepressants. Am J Psychiatry. 164:1035-43.

---------------------------------------------------------------------------------------------------------------------This is a representation of an electronic record that was signed electronically andthis page is the manifestation of the electronic signature.--------------------------------------------------------------------------------------------------------------------- /s/---------------------Mark Levenson5/23/2008 12:10:57 PMBIOMETRICSThis version replaces the March 5, 2008 version.
George Rochester5/23/2008 03:58:10 PMBIOMETRICSThis document is a revised review which reflects the most recent updates to the database.