Embed Size (px)
Citation preview

Statistical Models of Water Temperature in
the Delta under Climate-Change
Scenarios: A CASCaDE Project
October 24, 2008
Wayne Wagner & Mark StaceyUC-Berkeley

CASCaDE project
• Combine climate, hydrodynamic, sediment, biologic models for future scenarios
• Need quick temperature models to inform scenario choices– The Model– Results– Requirements and Limitations

2
3
4
56 9
1012
13
14
15
16
18 117
Data Sources for Model Development
o IEP- Provides water data
• Water temperature• Salinity
o CIMIS- Provides atmospheric forcing data
• Insolation• Wind• Air temperature

The Model
• Pure Statistic Model– Mulitple linear regression at each location
– Tair refers to average of daily max and min – Can be used to predict Tw,max , Tw,avg , Tw,min
• Data split for calibration/verification– Calibrate with first half for b0 , b1 , b2 , b3
– Initialize second half w/ measured data

Jan86 Dec86 Nov87 Oct88 Sep89 Sep90 Aug91 Jul92 Jun93 Jun94 May95 Apr96 Mar97
10
15
20
25
T max
[οC
]
SJ Antioch
PredictedMeasured
Apr97 Mar98 Feb99 Jan00 Dec00 Dec01 Nov02 Oct03 Sep04 Sep05 Aug06 Jul07 Jun08
10
15
20
25
T max
[οC
]
SJ Antioch
PredictedMeasured
Water Temperature Model
Verification r2 = .974
Calibration r2 = .975
• Projections at Antioch – Top panel: Calibration period (defines 4 parameters)– Bottom panel: Unconstrained calculation to test model
performance. Parameters defined in calibration period.
Jan86 Sep86 Jun87 Feb88 Oct88 Jul89 Mar90 Nov90 Aug91 Apr92 Jan93 Sep935
10
15
20
25
30
T max
[οC
]
SJ Mossdale
PredictedMeasured
May94 Jan95 Oct95 Jun96 Mar97 Nov97 Jul98 Apr99 Dec99 Sep00 May01 Jan02
10
15
20
25
T max
[οC
]
SJ Mossdale
PredictedMeasured
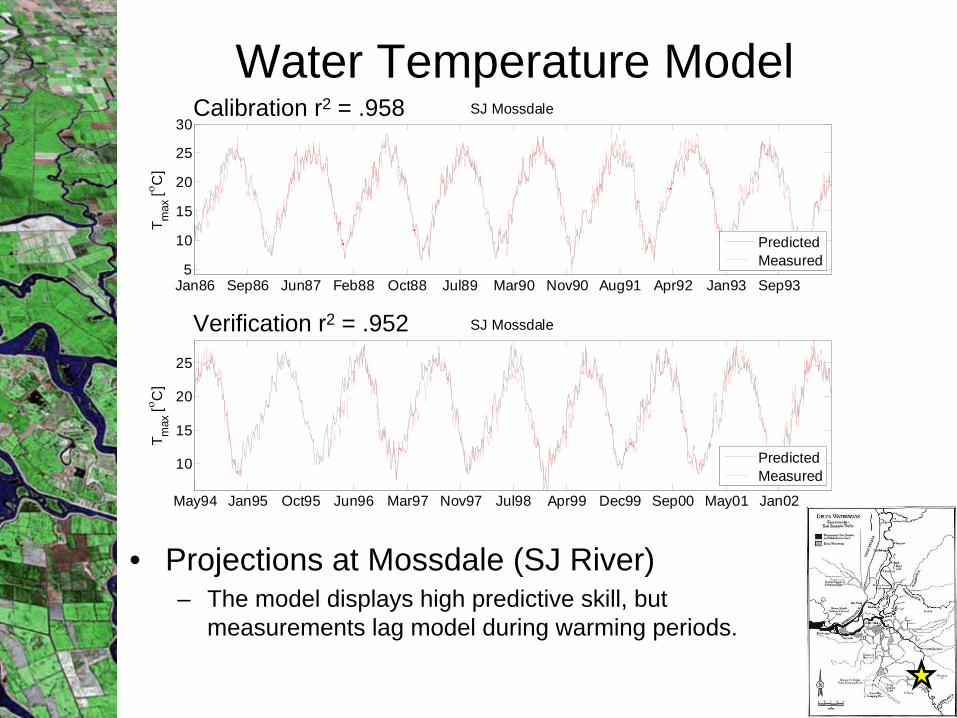
Water Temperature Model
Verification r2 = .952
Calibration r2 = .958
• Projections at Mossdale (SJ River) – The model displays high predictive skill, but
measurements lag model during warming periods.

• Projections at Rio Vista (Sacramento River)- The model displays high predictive skill with respect to
the yearly cycle and yearly maximums in the northern Delta.
Jan86 Sep86 May87 Feb88 Oct88 Jun89 Mar90 Nov90 Aug91 Apr92 Dec92 Sep93
10
15
20
25T m
ax [ο
C]
Sac Rio Vista
PredictedMeasured
May94 Jan95 Oct95 Jun96 Mar97 Nov97 Jul98 Apr99 Dec99 Aug00 May01 Jan02
10
15
20
25
T max
[οC
]
Sac Rio Vista
PredictedMeasured
Water Temperature Model
Verification r2 = .968
Calibration r2 = .974

• Projections at Rio Vista (Sacramento River) – The model displays high predictive skill at with respect
to the yearly cycle and yearly maximums in the northern Delta.
– Note finer scale comparisons.
Jan86 Sep86 May87 Feb88 Oct88 Jun89 Mar90 Nov90 Aug91 Apr92 Dec92 Sep93
10
15
20
25T m
ax [ο
C]
Sac Rio Vista
PredictedMeasured
May94 Jan95 Oct95 Jun96 Mar97 Nov97 Jul98 Apr99 Dec99 Aug00 May01 Jan02
10
15
20
25
T max
[οC
]
Sac Rio Vista
PredictedMeasured
Water Temperature Model
Verification r2 = .968
Calibration r2 = .974

Water Temperature Model
Feb99 May99 Sep99 Dec994
6
8
10
12
14
16
18
20
22
24T m
ax [ο
C]
Sac Rio Vista
PredictedMeasured
• Measurements lead model during cooling periods.

Water Temperature Model
Feb99 May99 Sep99 Dec994
6
8
10
12
14
16
18
20
22
24T m
ax [ο
C]
Sac Rio Vista
PredictedMeasured
• Measurements lead model during cooling periods.
• Model reproduces temperature fluctuations on weekly timescales

Variability of Predictive Skill
• Model parameters are calculated at each location in the Delta.– Model does not include flow term.
• Model performance is variable.– Performance is a function of
• Length of data record used for calibration.• Location in the Delta with respect to principal water
masses.

0 500 1000 1500 2000 2500 3000 3500 4000 45000.5
0.55
0.6
0.65
0.7
0.75
0.8
0.85
0.9
0.95
1
Length of Calibration Period (days)
r2
Effects of Short Calibration Periods
Verification r2 vs. Length of Calibration Period

0 500 1000 1500 2000 2500 3000 3500 4000 45000.5
0.55
0.6
0.65
0.7
0.75
0.8
0.85
0.9
0.95
1
Length of Calibration Period (days)
r2
Effects of Short Calibration Periods
• Calibration periods > 1 year greatly improve predictive skill of the model.

Spatial Variability of Model Skill
-122.2 -122.1 -122 -121.9 -121.8 -121.7 -121.6 -121.5 -121.4 -121.3 -121.2
37.8
37.9
38
38.1
38.2
38.3
Longitude
Latit
ude
r2 vs. Position
0.9
0.92
0.94
0.96
0.98
1
-122.2 -122.1 -122 -121.9 -121.8 -121.7 -121.6 -121.5 -121.4 -121.3 -121.2
37.8
37.9
38
38.1
38.2
38.3
Longitude
Latit
ude
r2 vs. Position
0.9
0.92
0.94
0.96
0.98
1
Tidal dominanceSan Joaquin dominance
Sacramento dominance
Spatial Variability of Model Skill

-122.2 -122.1 -122 -121.9 -121.8 -121.7 -121.6 -121.5 -121.4 -121.3 -121.2
37.8
37.9
38
38.1
38.2
38.3
Longitude
Latit
ude
r2 vs. Position
0.9
0.92
0.94
0.96
0.98
1
Tidal dominanceSan Joaquin dominance
Sacramento dominance
Spatial Variability of Model Skill

-122.2 -122.1 -122 -121.9 -121.8 -121.7 -121.6 -121.5 -121.4 -121.3 -121.2
37.8
37.9
38
38.1
38.2
38.3
Longitude
Latit
ude
r2 vs. Position
0.9
0.92
0.94
0.96
0.98
1
Tidal dominance
Sacramento dominance
San Joaquin dominance
Mixed Influence
Spatial Variability of Model Skill

Projections for CASCaDE Scenarios
• Statistical model– Verification r2 >.90 provided enough calibration data.– Timing off seasonally in some locations.
• Projection– Calibrate with full dataset.– Initialize with measured water temperature.– Force with downscaled climate data from Mike Dettinger
(CASCaDE) .
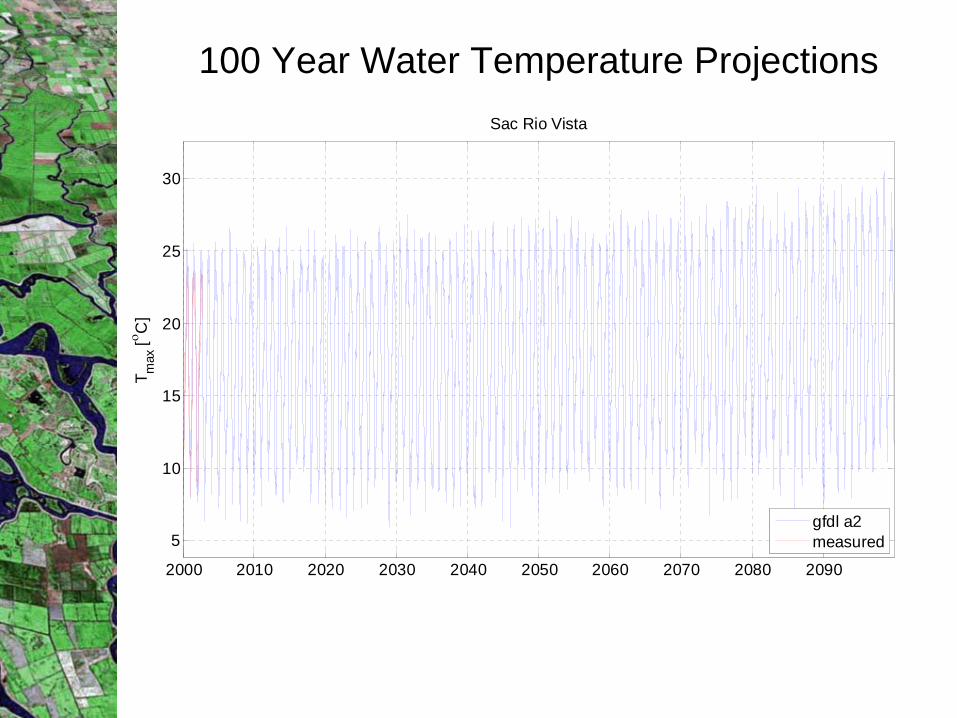
100 Year Water Temperature Projections
2000 2010 2020 2030 2040 2050 2060 2070 2080 2090
5
10
15
20
25
30
T max
[οC
]Sac Rio Vista
gfdl a2measured

2000 2010 2020 2030 2040 2050 2060 2070 2080 2090
5
10
15
20
25
30
T max
[οC
]Sac Rio Vista
gfdl a2measured
Smelt threshold100 Year Water Temperature Projections

2000 2010 2020 2030 2040 2050 2060 2070 2080 2090
5
10
15
20
25
30
T max
[οC
]
gfdl a2
2000 2010 2020 2030 2040 2050 2060 2070 2080 20900
20
40
60
80
100
120
140
Day
s/Y
ear >
25ο C
Sac Rio Vista
• Dramatic increase in the number of days exceeding 250C under this scenario.
100 Year Water Temperature Projections

Projections (2010 - 2030)
-122.2 -122.1 -122 -121.9 -121.8 -121.7 -121.6 -121.5 -121.4 -121.3 -121.2
37.8
37.9
38
38.1
38.2
38.3
Longitude
Latit
ude
Days Exceedence/Year (2010-2030) vs. Position
Dot size is proportional to the average number of days per year in exceedence of 250C at each location under gfdl a2 forcing.

Projections (2040 - 2060)
-122.2 -122.1 -122 -121.9 -121.8 -121.7 -121.6 -121.5 -121.4 -121.3 -121.2
37.8
37.9
38
38.1
38.2
38.3
Longitude
Latit
ude
Days Exceedence/Year (2040-2060) vs. Position
2040 - 20602010 - 2030
Dot size is proportional to the average number of days per year in exceedence of 250C at each location under gfdl a2 forcing.

Projections (2070 - 2090)
-122.2 -122.1 -122 -121.9 -121.8 -121.7 -121.6 -121.5 -121.4 -121.3 -121.2
37.8
37.9
38
38.1
38.2
38.3
Longitude
Latit
ude
Days Exceedence/Year (2070-2090) vs. Position
2070 - 20902010 - 2030
Dot size is proportional to the average number of days per year in exceedence of 250C at each location under gfdl a2 forcing.

-122.2 -122.1 -122 -121.9 -121.8 -121.7 -121.6 -121.5 -121.4 -121.3 -121.2
37.8
37.9
38
38.1
38.2
38.3
Longitude
Latit
ude
Days Exceedence/Year (2070-2090) vs. Position
2070 - 20902010 - 2030
Biggest change along Sacramento corridor
Projections (2070 - 2090)
Dot size is proportional to the average number of days per year in exceedence of 250C at each location under gfdl a2 forcing.

100 Year Water Temperature Projections
2000 2010 2020 2030 2040 2050 2060 2070 2080 2090
5
10
15
20
25
30T m
ax [ο
C]
Sac Rio Vista
gfdl b1measured

100 Year Water Temperature Projections
2000 2010 2020 2030 2040 2050 2060 2070 2080 2090
5
10
15
20
25
30T m
ax [ο
C]
Sac Rio Vista
gfdl b1measured
Smelt threshold

100 Year Water Temperature Projections
2000 2010 2020 2030 2040 2050 2060 2070 2080 2090
5
10
15
20
25
30T m
ax [ο
C]
gfdl b1
2000 2010 2020 2030 2040 2050 2060 2070 2080 20900
10
20
30
40
50
60
70
80
90
100
Day
s/Y
ear >
25ο C
Sac Hood
• Significant increase in the number of days exceeding 250C under this scenario.
Projections (2010 - 2030)
-122.2 -122.1 -122 -121.9 -121.8 -121.7 -121.6 -121.5 -121.4 -121.3 -121.2
37.8
37.9
38
38.1
38.2
38.3
Longitude
Latit
ude
Days Exceedence/Year (2010-2030) vs. Position
Dot size is proportional to the average number of days per year in exceedence of 250C at each location under gfdl b1 forcing.

Projections (2040 - 2060)
-122.2 -122.1 -122 -121.9 -121.8 -121.7 -121.6 -121.5 -121.4 -121.3 -121.2
37.8
37.9
38
38.1
38.2
38.3
Longitude
Latit
ude
Days Exceedence/Year (2040-2060) vs. Position
2040 - 20602010 - 2030
Dot size is proportional to the average number of days per year in exceedence of 250C at each location under gfdl b1 forcing.

Projections (2070 - 2090)
-122.2 -122.1 -122 -121.9 -121.8 -121.7 -121.6 -121.5 -121.4 -121.3 -121.2
37.8
37.9
38
38.1
38.2
38.3
Longitude
Latit
ude
Days Exceedence/Year (2070-2090) vs. Position
2070 - 20902010 - 2030
Dot size is proportional to the average number of days per year in exceedence of 250C at each location under gfdl b1 forcing.

Biggest change along Sacramento corridor
Projections (2070 - 2090)
Dot size is proportional to the average number of days per year in exceedence of 250C at each location under gfdl b1 forcing.
-122.2 -122.1 -122 -121.9 -121.8 -121.7 -121.6 -121.5 -121.4 -121.3 -121.2
37.8
37.9
38
38.1
38.2
38.3
Longitude
Latit
ude
Days Exceedence/Year (2070-2090) vs. Position
2070 - 20902010 - 2030

Conclusions
• Simple statistical model shows high predictive skill of water temperatures at locations throughout the Delta– Model is computationally cheap.– Model requires > 1 year of calibration data.– Model does not include flow term.– Model does not work as well in central Delta due to mixing.
• When forced by climate data from CASCaDE, the model predicts much higher frequency of exceedence of 250C along Sacramento corridor.


Dependence on Air Temperature
-122.2 -122.1 -122 -121.9 -121.8 -121.7 -121.6 -121.5 -121.4 -121.3 -121.2
37.8
37.9
38
38.1
38.2
38.3
Longitude
Latit
ude
b2 (air temperature coefficient)
1
1.5
2
2.5
3
x 10-3