Embed Size (px)
Citation preview

Statistical Methods for real-time monitoringof health outcomes
Peter J Diggle
CHICAS, Faculty of Health and Medicine, LancasterUniversity
September 2015
Peter J Diggle Statistical Methods for real-time monitoring of health outcomes
Context
increasing availability of electronically recorded healthoutcome data
community and/or individual level
accruing in “real-time”
often spatially referenced
prediction and/or explanation
case-studies:
monitoring progression towards end-stage renal failurehuman and veterinary surveillance of gastro-enteric illnesslocal-scale malaria prevalence mapping
Peter J Diggle Statistical Methods for real-time monitoring of health outcomes

Chronic renal failure: UK mortality data
2002 2004 2006 2008 2010
8000
1000
012
000
1400
016
000
year
deat
hs
http://www.endoflifecare-intelligence.org.uk
Peter J Diggle Statistical Methods for real-time monitoring of health outcomes

Diagnosis, treatment and survival
Diagnosis
Serum creatinine ⇒ estimated glomerular filtration rate
eGFR = 186×(
SCr
88.4
)−1.154
× age−0.203(×0.742 if female)
progression can be asymptomatic for many years
SCr easy to measure from blood-sample
Treatment and survival
aggressive control of blood-pressure
renal replacement therapy: dialysis and transplantation
early diagnosis can slow rate of progression
Survival rate (%) to year1 2 5 10
Dialysis 79.3 64.7 33.6 10.2Transplant (living) 98.4 96.5 90.0 76.0
Peter J Diggle Statistical Methods for real-time monitoring of health outcomes

Royal Salford Hospital, NW England
Clinical guideline
Loss of > 5% eGFR per year ⇒ refer to secondary care
Data
measurements Yij = log eGFR at times tij,
explanatory variables xi (age, sex)
i = 1, ..., m = 22, 910 “at-risk” primary care patients
j = 1, ..., ni ≤ 305 (median ni = 12)
0 ≤ 10.02 years follow-up (median 4.46)
Hi(t) = {xi, (tij, yij) : tij ≤ t}
Statistical objective
P
(d
dtlog GFR < −0.05|Hi(t)
)= ?
Peter J Diggle Statistical Methods for real-time monitoring of health outcomes

Data: all cross-sectional
Peter J Diggle Statistical Methods for real-time monitoring of health outcomes

Data: all cross-sectional and selected longitudinal
Peter J Diggle Statistical Methods for real-time monitoring of health outcomes

Data: all cross-sectional and selected longitudinal
Peter J Diggle Statistical Methods for real-time monitoring of health outcomes

Dynamic regression model
subjects i = 1, ..., n observed at times tij, j = 1, ...ni
Yij = log(eGFR)
expected value of Yij linear in initial age and time sincerecruitment
rate of progression varies randomly:
between subjects: random effect Ui
within subjects: random effect Ci(tij)
Peter J Diggle Statistical Methods for real-time monitoring of health outcomes

Dynamic Regression Model
Yij = α0 + α1 × I(female)
+ α2 × agei1 + α3 × (ageij − agei1) + α4 ×max(0, ageij − 56.5)
+ Ui + Ci(tij) + Zij
Zij: measurement error, N(0, τ 2)
Ui: between-subject random intercept, N(0, ω2)
Ci(t): within-subject stochastic process
Model Ci(t) as integrated Brownian motion
Ci(t) =
∫ t
0
Bi(u)du
Bi(u)|Bi(s) ∼ N(Bi(u), (u− s)σ2
)Bi(u) is rate of progression for subject i at time t
Peter J Diggle Statistical Methods for real-time monitoring of health outcomes

Maximum likelihood estimates of model parameters
RE(%)= 100(exp(α)− 1) corresponds to estimated annualpercentage change in renal function.
Parameter Estimate SE RE(%)α0 intercept 4.6006 0.0203α1 female -0.0877 0.0048 -8.4α2 age on entry -0.0048 0.0004 -0.5α3 follow-up -0.0232 0.0011 -2.3α4 age>56.5 -0.0075 0.0006 -0.6
ω2 intercept 0.1111 0.0012σ2 signal 0.0141 0.0002τ 2 noise 0.0469 0.0001
Peter J Diggle Statistical Methods for real-time monitoring of health outcomes

Sample data-sequences
0 2 4 6 8 10
2.5
3.0
3.5
4.0
4.5
5.0
5.5
age
log(
eGF
R)
Peter J Diggle Statistical Methods for real-time monitoring of health outcomes

Simulations
0 2 4 6 8 10
34
56
age
log(
eGF
R)
Peter J Diggle Statistical Methods for real-time monitoring of health outcomes

Prediction: classic progression pattern
●
●
●●
●
●●
●●
●
●
●
●
●
●
●●●●●
●
●●
●
0.0 0.5 1.0 1.5 2.0
2.5
3.0
3.5
Follow−up time (in years)
log(
eGF
R)
0.0 0.5 1.0 1.5 2.0
−0.
8−
0.6
−0.
4−
0.2
0.0
0.2
Follow−up time (in years)
B~
0.0 0.5 1.0 1.5 2.0
0.0
0.2
0.4
0.6
0.8
1.0
Follow−up time (in years)
Pro
babi
lity
Peter J Diggle Statistical Methods for real-time monitoring of health outcomes

Prediction: AKI (Acute Kidney Injury) recovery
● ● ●●
●
●
●●
●
●●
●
●
●
●●
●
●
●
●●● ●
●
●
●
●
●
●
●
●
●
●
●
●●●●
0 1 2 3 4 5
3.8
4.0
4.2
4.4
4.6
4.8
5.0
Follow−up time (in years)
log(
eGF
R)
0 1 2 3 4 5
−0.
4−
0.2
0.0
0.2
0.4
Follow−up time (in years)
B~
0 1 2 3 4 5
0.0
0.2
0.4
0.6
0.8
1.0
Follow−up time (in years)
Pro
babi
lity
Peter J Diggle Statistical Methods for real-time monitoring of health outcomes

Prediction: non-recovery from AKI
●●
●
●
●
●
●●
●
●●
●
●
●
●●●●●
●
●
●●●●
●●
●
●●
●
●●●●●
●
●
●
●
●●
●●●●●●
●
●●
●●
●● ●
●
●
●
●
●●
●
●
●
●
●
●●●●
●●●●●●●
●
●●●
●●●
●
0.0 0.5 1.0 1.5 2.0 2.5
2.5
3.0
3.5
4.0
Follow−up time (in years)
log(
eGF
R)
0.0 0.5 1.0 1.5 2.0 2.5
−1.
0−
0.5
0.0
0.5
Follow−up time (in years)
B~
0.0 0.5 1.0 1.5 2.0 2.5
0.0
0.2
0.4
0.6
0.8
1.0
Follow−up time (in years)
Pro
babi
lity
Peter J Diggle Statistical Methods for real-time monitoring of health outcomes

Work-in-prospect
Field-testing: comparative evaluation against current methods
eye-balling
OLS fit to three most recent values
Informative follow-up: eGFR more likely to be measured whensubject is in poor health
⇒ joint modelling of eGFR measurements and follow-up times
Implementation: in clinical practice...needs informatics expertise
Peter J Diggle Statistical Methods for real-time monitoring of health outcomes

Gastro-intestinal disease
Reported UK annual incidence
Campylobacter 50, 000
Salmonella 10, 000
Cryptosporidium 5, 000
Giardia 3, 000
E Coli,... ?
Peter J Diggle Statistical Methods for real-time monitoring of health outcomes

Real-time spatial surveillance, ca 2003
AEGISS: Ascertainment and Enhancement of
Gastroenteric Infection Surveillance Statistics
largely sporadic incidence pattern
concentration in population centres
occasional “clusters” of cases
Can spatial statistical modelling enable earlier detection of“clusters”?
Peter J Diggle Statistical Methods for real-time monitoring of health outcomes

AEGISS: Cox process model
actual = expected× unexpected
λ(x, t) = λ0(x, t)× R(x, t)
Scientific objective
use incident data up to time t to construct predictivedistribution for current “risk” surface, R(x, t),
hence identify anomalies, for further investigation.
Peter J Diggle Statistical Methods for real-time monitoring of health outcomes

AEGISS model formulation
λ(x, t) = λ0(x, t)R(x, t)
λ0(x, t) = λ0(x)µ0(t)
R(x, t) = exp{S(x, t)}
S(x, t) = spatio-temporal Gaussian process
Conditional on R(x, t), incident cases form an
inhomogeneous Poisson process with intensity λ(x, t)
Peter J Diggle Statistical Methods for real-time monitoring of health outcomes

λ0(x): adaptive kernel smoothing
420 440 460 480
100
120
140
160
Northing (Kilometers)
Eas
ting
(Kilo
met
ers)
00.000720.00140.00220.00290.00360.00430.00510.00580.0065
Peter J Diggle Statistical Methods for real-time monitoring of health outcomes

µ0(t): Poisson log-linear modelav
erag
e ad
just
ed d
aily
cou
nt
46
810
1214
1618
Jan 01 Apr 01 Jul 01 Oct 01 Jan 02 Apr 02 Jul 02 Oct 02 Dec 02
Peter J Diggle Statistical Methods for real-time monitoring of health outcomes

Spatio-temporal covariance
ρ(u, v) = ρx(u)ρt(v)
0.0 0.5 1.0 1.5 2.0
−1
01
23
45
Distance(Kilometers)
Log
Pai
r C
orre
latio
n F
unct
ion
FittedEmpirical
0 2 4 6 8 10 12 14
−1
01
23
4
Time lag(Days)
Aut
ocov
aria
nce
func
tion
FittedEmpirical
Peter J Diggle Statistical Methods for real-time monitoring of health outcomes

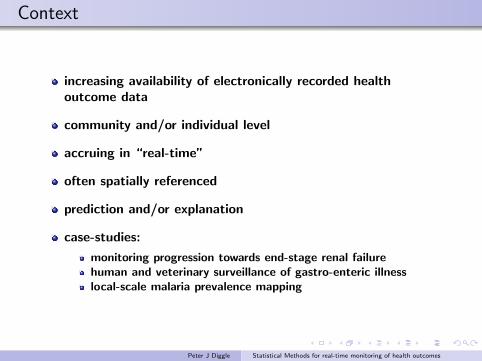
Spatial prediction
plug-in for estimated model parameters
MCMC to generate samples from conditionaldistribution of S(x, t) given data up to time t
choose critical threshold value c > 1
map empirical exceedance probabilities,
pt(x) = P (exp{S(x, t)} > c|data)
web-based reporting with daily updates
(www.lancs.ac.uk/staff/diggle/aegiss/)
Peter J Diggle Statistical Methods for real-time monitoring of health outcomes

Spatial prediction: 6 March 2003
c = 2
Peter J Diggle Statistical Methods for real-time monitoring of health outcomes
Spatial prediction: 6 March 2003
c = 4
Peter J Diggle Statistical Methods for real-time monitoring of health outcomes

Spatial prediction: 6 March 2003
c = 8
Peter J Diggle Statistical Methods for real-time monitoring of health outcomes

Fast-forward to 2015
expand to national coverage
integrate human and small-animal veterinary surveillance
BUT...
replacement of single NHS Direct by multiple NHS111 services
full post-code data no longer available!
SAVSNET: real-time data-feed from network of small-animal vetpractices:
practice location
species (cat or dog)
diagnosis
http://www.savsnet.co.uk/realtimedata/
Peter J Diggle Statistical Methods for real-time monitoring of health outcomes

Work-in-prospect
re-calibration of AEGISS model
coarser spatial resolution...fitting spatially continuous modelsto spatially discrete data
joint modelling of human and animal incidence
implementation as part of routine surveillance systems
Peter J Diggle Statistical Methods for real-time monitoring of health outcomes

Malaria prevalence mapping
Peter J Diggle Statistical Methods for real-time monitoring of health outcomes

Prevalence mapping 1
Single prevalence survey
Sample n individuals, observe Y positives
Y ∼ Bin(n, p)
Multiple prevalence surveys
Sample ni individuals, observe Yi positives, i = 1, ...,m
Yi ∼ Bin(ni, pi) ?
Peter J Diggle Statistical Methods for real-time monitoring of health outcomes

Prevalence mapping 2
Extra-binomial variation
Sample ni individuals, observe Yi positives, i = 1, ...,m
Yi|di,Ui ∼ Bin(ni, pi) log{pi/(1− pi)} = d′iβ + Ui
Question: What to do if the di and/or the Ui are spatiallystructured
Peter J Diggle Statistical Methods for real-time monitoring of health outcomes

Geostatistical model for prevalence data
Latent spatially correlated process
S(x) ∼ SGP{0, σ2, ρ(u))} ρ(u) = exp(−|u|/φ)
Latent spatially independent random effects
Ui ∼ iidN(0, ν2)
Linear predictor (regression model)
d(x) = environmental variables at location xη(xi) = d(xi)′β + S(xi) + Ui
p(xi) = log[η(xi)/{1− η(xi)}]
Conditional distribution for positive proportion Yi/ni
Yi|S(·) ∼ Bin{ni, p(xi)} (binomial sampling)
Peter J Diggle Statistical Methods for real-time monitoring of health outcomes

Multiple surveys (Giorgi et al, 2015)
Surveys: i = 1, . . . , r locations xij : j = 1, . . . , ni
ηij = d(xij)>β1 + Si(xij) + I(i ∈ B)[Bi(xij) + d(xij)
′βi] + Uij
1
S1
2*
B2
2
S2
Peter J Diggle Statistical Methods for real-time monitoring of health outcomes

Malaria mapping, Chikhwawa district, Malawi(Giorgi et al, 2015): rMIS individual locations
34.72 34.74 34.76 34.78 34.80 34.82 34.84
-16.10
-16.05
-16.00
(a)
Longitude
Latitude
Peter J Diggle Statistical Methods for real-time monitoring of health outcomes

Malaria mapping, Chikhwawa district, Malawi(Giorgi et al, 2015): eMIS individual locations
34.72 34.74 34.76 34.78 34.80 34.82 34.84
-16.10
-16.05
-16.00
(b)
Longitude
Latitude
Peter J Diggle Statistical Methods for real-time monitoring of health outcomes

Malaria mapping, Chikhwawa district, Malawi(Giorgi et al, 2015): EAG village locations and prevalences
34.70 34.75 34.80 34.85 34.90
-16.10
-16.05
-16.00
-15.95
(c)
Longitude
Latitude
Peter J Diggle Statistical Methods for real-time monitoring of health outcomes

Continuous time: rolling malaria indicator surveys
Hotspots: P(prevalence > 20%)
Peter J Diggle Statistical Methods for real-time monitoring of health outcomes

Continuous time: rolling malaria indicator surveys
Coldspots: P(prevalence < 5%)
Peter J Diggle Statistical Methods for real-time monitoring of health outcomes
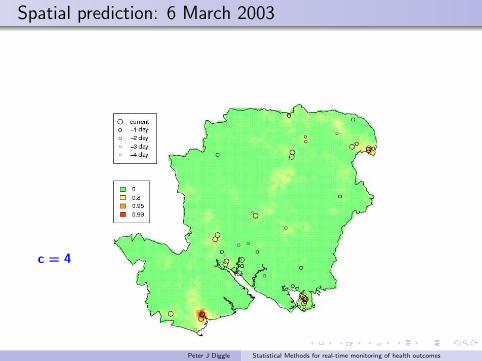
Work-in-prospect: Majete national park project, Malawi
adaptive design strategies
embedded RCT of community-level interventions
Peter J Diggle Statistical Methods for real-time monitoring of health outcomes
Closing remarks
Operational issues
predictive probability of exceedance over intervention threshold
to inform, but not to over-ride, clinical judgement
Methodological issues:
observational studies vs trials
long series with irregular follow-up times
informative follow-up...marked point process models
Peter J Diggle Statistical Methods for real-time monitoring of health outcomes

References
Monitoring renal function
Diggle, P.J., Sousa, I. and Asar, O. (2014). Real-time monitoring ofprogression towards renal failure in primary care patients. (submitted)
Gastro-enteric surveillance
Diggle, P.J., Rowlingson, B. and Su, T-L. (2005). Point processmethodology for on-line spatio-temporal disease surveillance.Environmetrics, 16, 423–34.
Malaria prevalence mapping
Giorgi, E., Sesay, S.S., Terlouw, D.J. and Diggle, P.J. (2015). Combiningdata from multiple spatially referenced prevalence surveys usinggeneralized linear geostatistical models. Journal of the Royal StatisticalSociety A 178, 445–464.
Peter J Diggle Statistical Methods for real-time monitoring of health outcomes