Embed Size (px)
Citation preview

Study Design & Methodology
Declan Lyons MSc FRCP FRCPI MD
Research in Health SciencesStudy Design & Methodology
Dr Jean Saunders C.Stat
Inc extra slides by Declan Lyons MSc FRCP FRCPI MD
Hours worked
6050403020
Cur
rent
inco
me
(Eur
os)
140000
120000
100000
80000
60000
40000
20000
0
Gender
Male
Female595149 405153N =
Treatment
time
to re
solu
tion
of c
ough
16
14
12
10
8
6
4
2
0
-2
Male
Female
28
36
UNIVERSITY of LIMERICKOLLSCOIL LUIMNIGH
STATISTICAL CONSULTING UNIT

Study Design
AimsInfluenced by:
Resources
Ethics

The Scientific Method: A Model for Conducting Scientific Research
(Writing the Protocol)
1. Defining the Question2. Locating Resources/Gathering
Information & Materials3. Forming a Hypothesis/Hypotheses4. Planning the Research/Developing Data
Collection Methods5. Collecting Data6. Organising & Analysing the Data7. Interpreting the Data & Drawing
Conclusions8. Communicating the Results

Defining the Question:Specifically, what do I want to know? What is the purpose of asking this question?What will the answer tell me? Can this question be answered through research? (Can I describe how I might answer it?)What do I expect to find once I've conducted my research?

gResources/Gathering Information & Materials:
What do I know about my topic? What additional information would help me? How can I use different sources of information (experts, books, articles, computer databases) to gather the information I need? Where will I conduct this research? Where are the organisms or events I want to study?What resources are available to me--time, equipment, people, money, facilities, etc.?
Forming a Hypothesis/Hypotheses:
What do I expect to find once I've conducted my research? (Keep it simple)
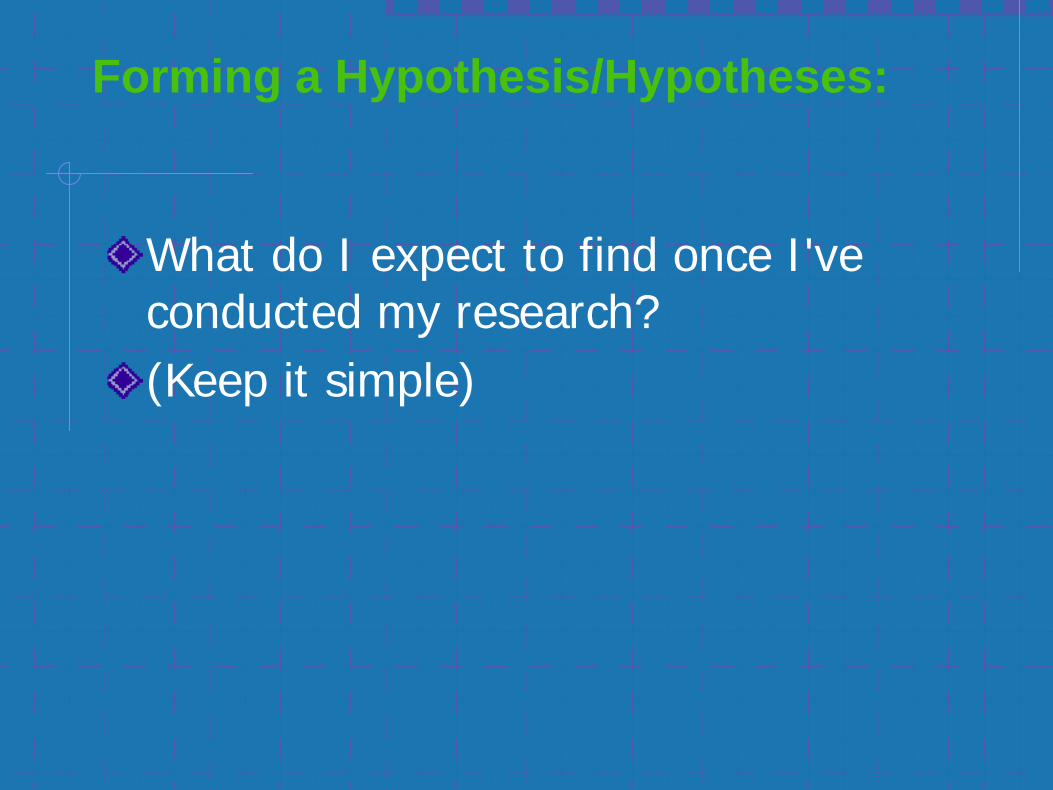
Planning the Research/Developing Data Collection Methods:
How will I answer my research question/test my hypotheses? What data do I need to collect? How will I collect these data? What equipment or supplies do I need?Do I have a reference point (control) with which to compare my data?To answer my question, do I need to manipulate variables?How many (samples, sites, tests, etc.) do I need?What record-keeping techniques (e.g. data sheet, journal) will I use? Are my data collection techniques organised and thorough?Are there sequential steps to my research? If so, what are they?How will I plan my time?

Collecting Data:
Am I recording all relevant data? Can I read and understand my notes?Am I keeping track of what I did at each step?Am I being objective in my data collection?

Organising & Analysing the Data:
How will I organise and summarise the data I've collected? What do my data show? How should I present my data graphically so that others can see the results clearly? (e.g. bar graphs, tables, pie charts, line graphs, etc.) Are the results significant? Are there tests I might use to tell me if the results are significant?
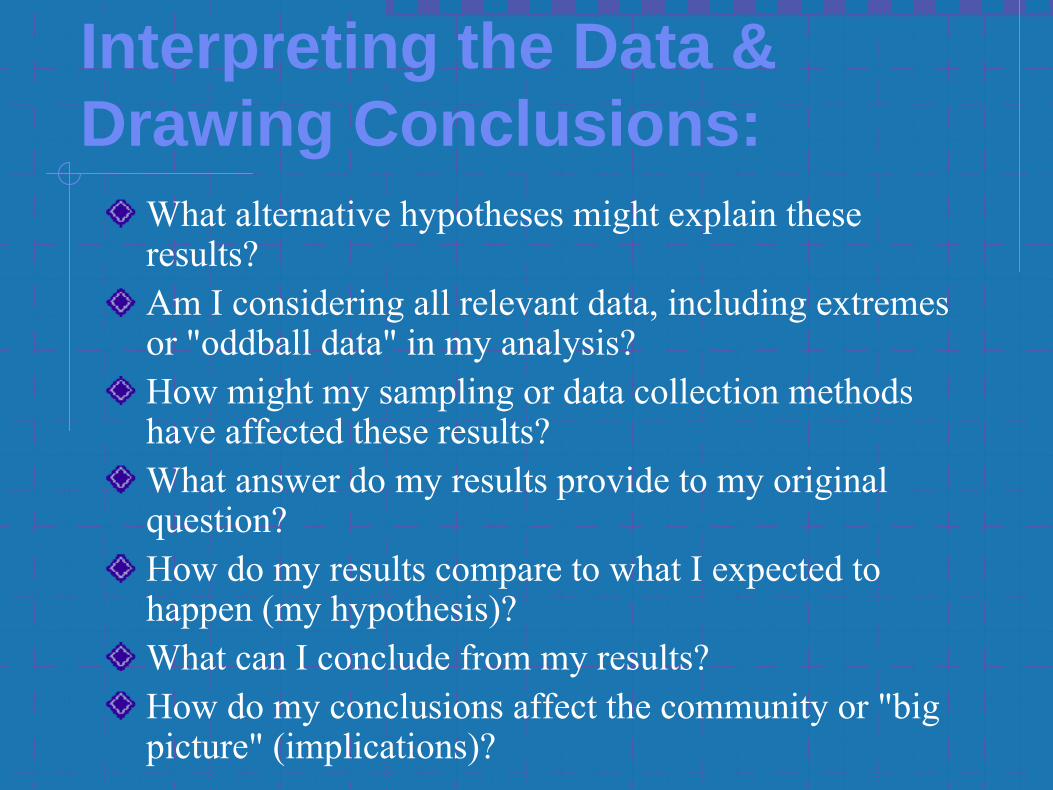
Interpreting the Data & Drawing Conclusions:
What alternative hypotheses might explain these results? Am I considering all relevant data, including extremes or "oddball data" in my analysis? How might my sampling or data collection methods have affected these results? What answer do my results provide to my original question? How do my results compare to what I expected to happen (my hypothesis)?What can I conclude from my results? How do my conclusions affect the community or "big picture" (implications)?

gResults:
Who is my audience? What is the best way to communicate to my audience? (e.g. written report, oral or poster presentation, video, etc.) What visual aids will help my audience clearly understand this research? Have I addressed all of the following components of my research in my communication?:
Introduction to question, purpose of this research and why it is interesting or matters Description of methods used to collect data Results Conclusions What questions are raised by my research? How do others respond to my work?
Experimental Design eg. RCT, animal,laboratory
Observational eg. cohort, case control
Study Types 1
Cross-sectional studies eg. census, survey, point prevalence
no use for evaluating incidence
Longitudinal studiesprospective or retrospective
Repeated Cross sectional
Study Types 2
Control Group
Biassystematic difference between the results of a study & the true state of affairs
ObserverConfoundingSelectionInformationPublication
Study Types 3
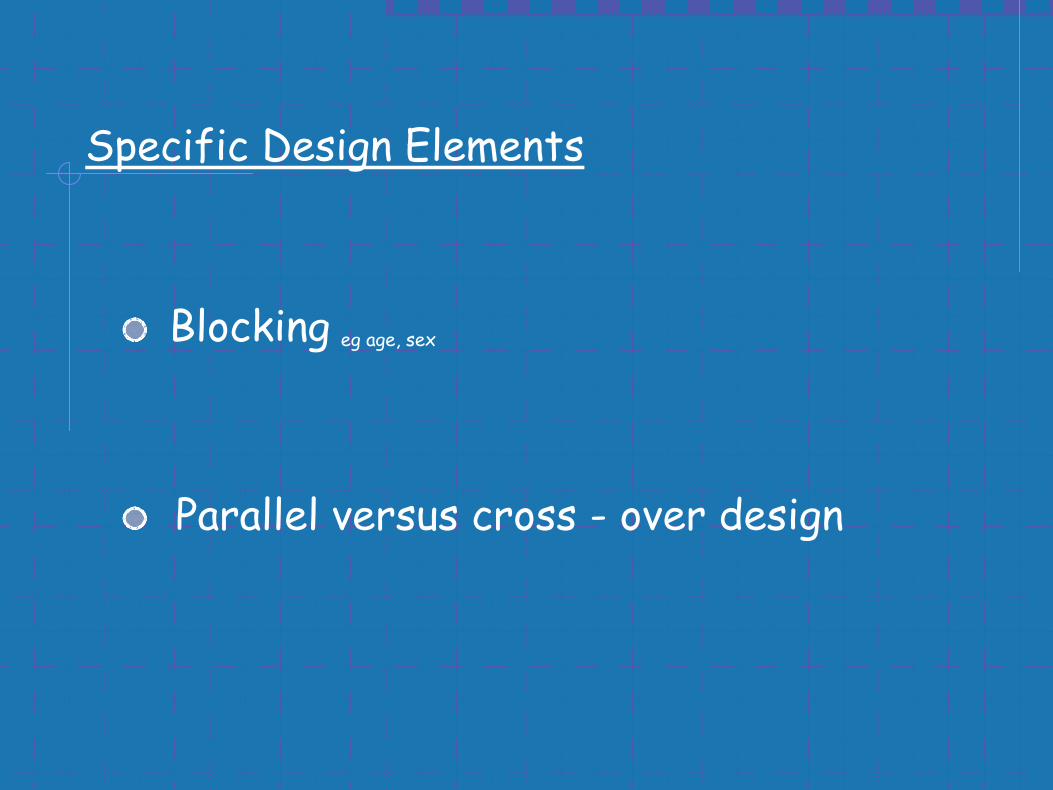
Blocking
Parallel versus cross - over design
Specific Design Elements
eg age, sex
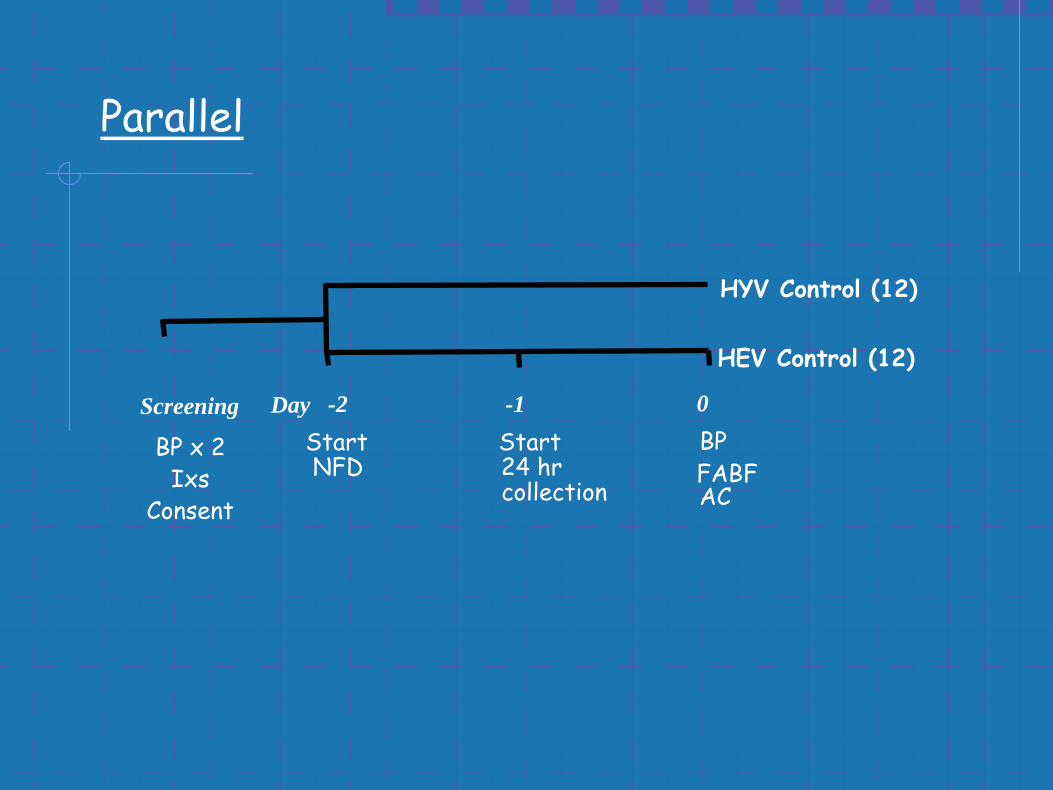
Screening Day -2StartNFD
-1Start24 hr collection
0BPFABFAC
HYV Control (12)
HEV Control (12)
BP x 2Ixs
Consent
Parallel
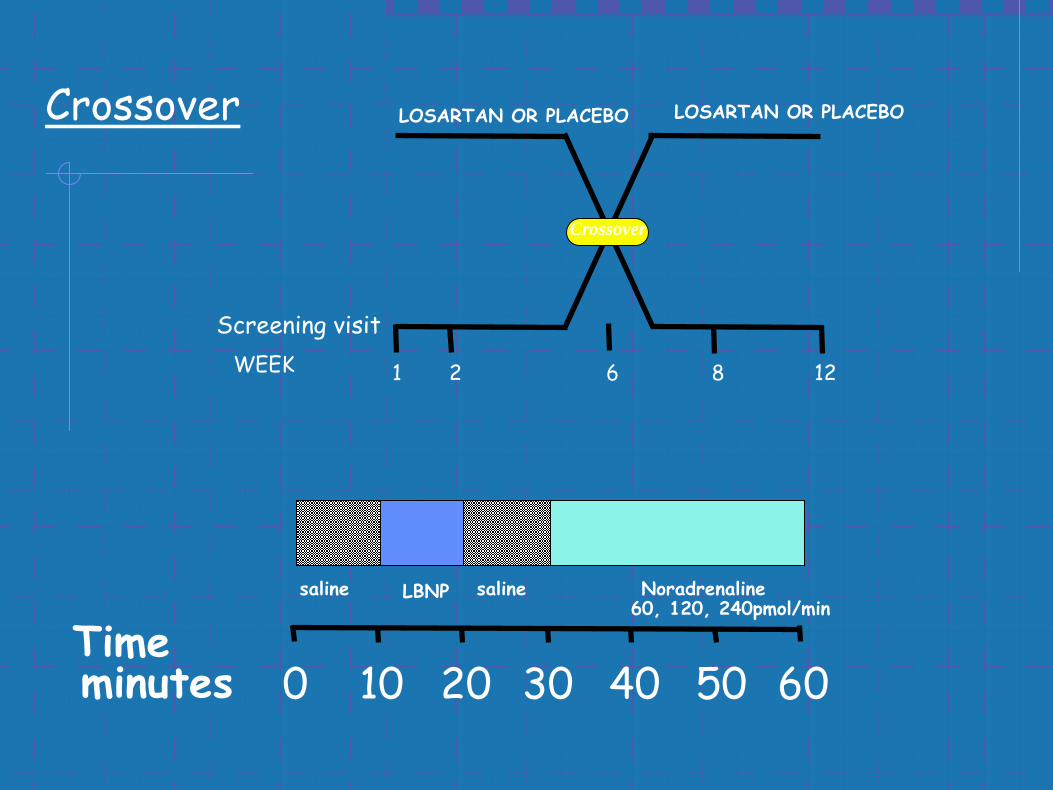
saline LBNP saline Noradrenaline60, 120, 240pmol/min
Timeminutes 100 20 30 40 50 60
Screening visit
LOSARTAN OR PLACEBO LOSARTAN OR PLACEBO
WEEK 1 2 6 8 12
Crossover
Crossover
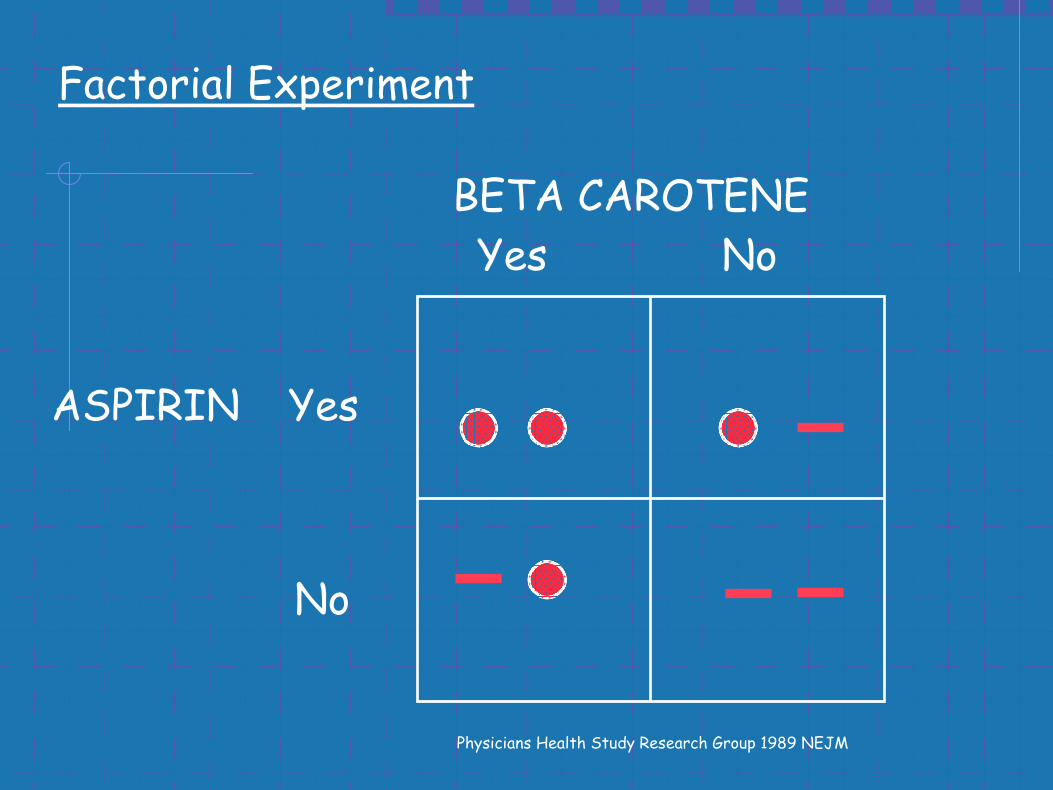
ASPIRIN
BETA CAROTENE
Yes
No
Yes No
Physicians Health Study Research Group 1989 NEJM
Factorial Experiment
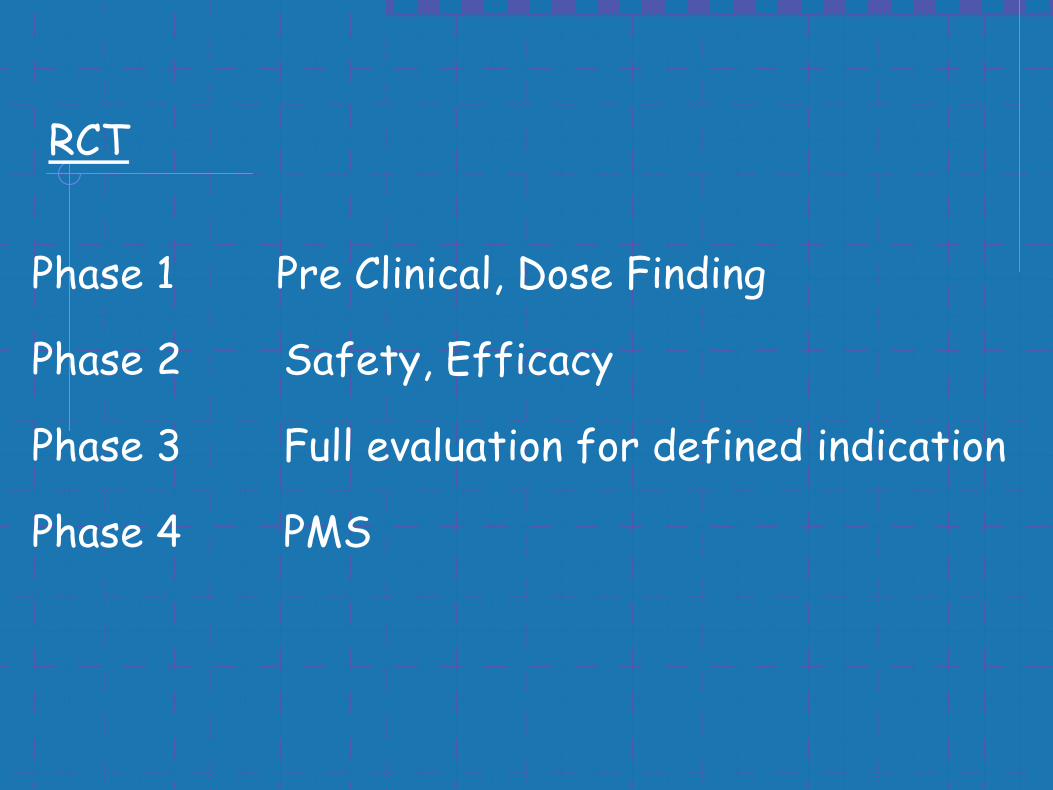
RCT
Phase 1 Pre Clinical, Dose Finding
Phase 2 Safety, Efficacy
Phase 3 Full evaluation for defined indication
Phase 4 PMS
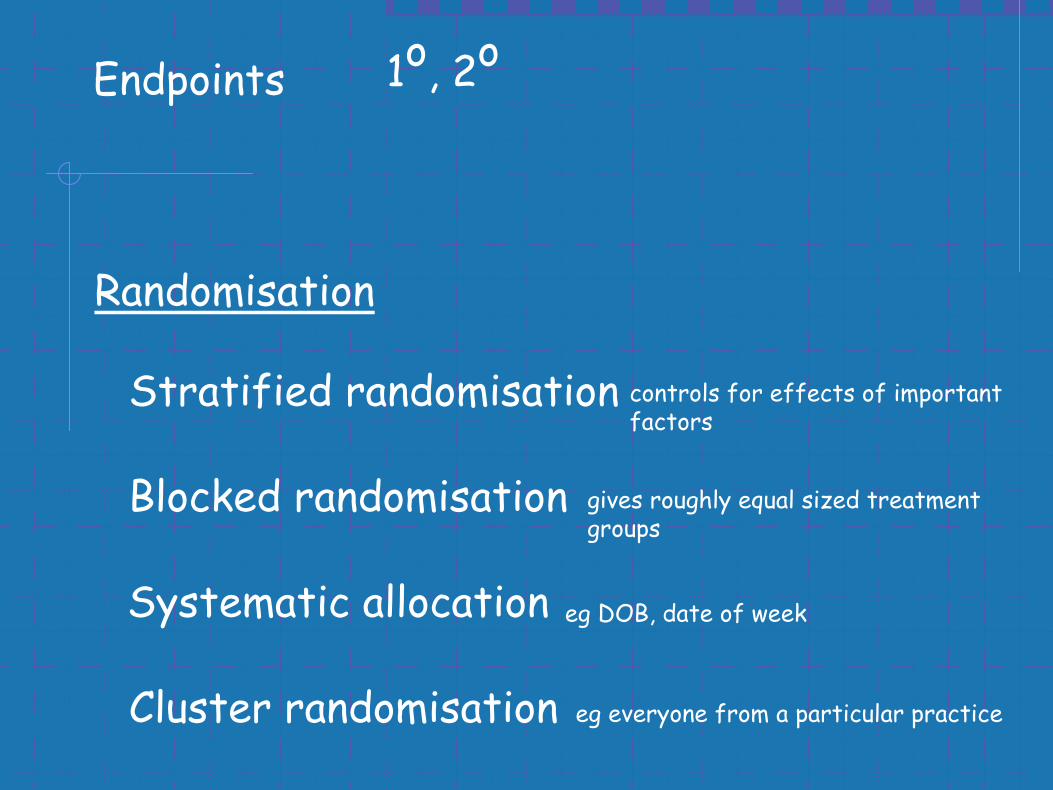
Endpoints 1o, 2o
Randomisation
Stratified randomisation
Blocked randomisation
Systematic allocation
Cluster randomisation
controls for effects of important factors
gives roughly equal sized treatment groups
eg DOB, date of week
eg everyone from a particular practice
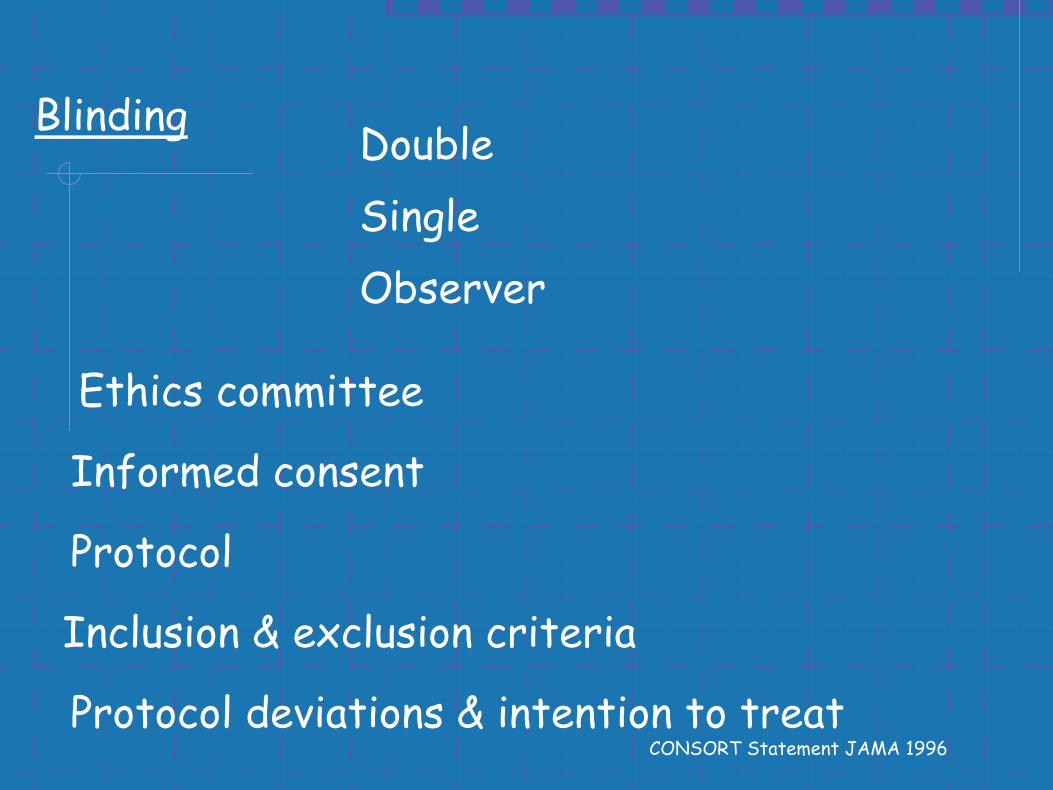
Blinding DoubleSingleObserver
Ethics committee
Informed consent
Protocol
Inclusion & exclusion criteria
Protocol deviations & intention to treatCONSORT Statement JAMA 1996

Cohort Studies
eg risk factor evaluation
fixed or dynamic
YES NO TOTAL
EVER 563 (9.5%)
5336(90.5%)
5899
NEVER87
(4.8%)1732
(95.2%)1819
TOTAL650
(8.4%)7068
(71.6%)7718
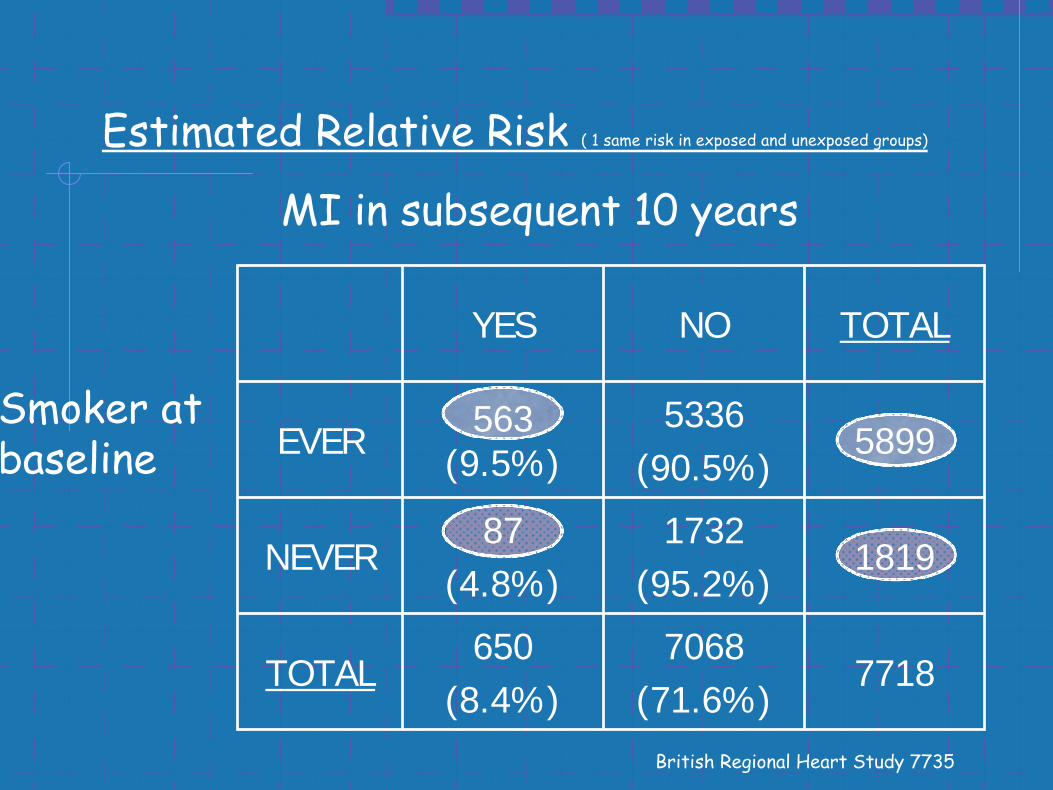
MI in subsequent 10 years
Smoker at baseline
Estimated Relative Risk ( 1 same risk in exposed and unexposed groups)
British Regional Heart Study 7735
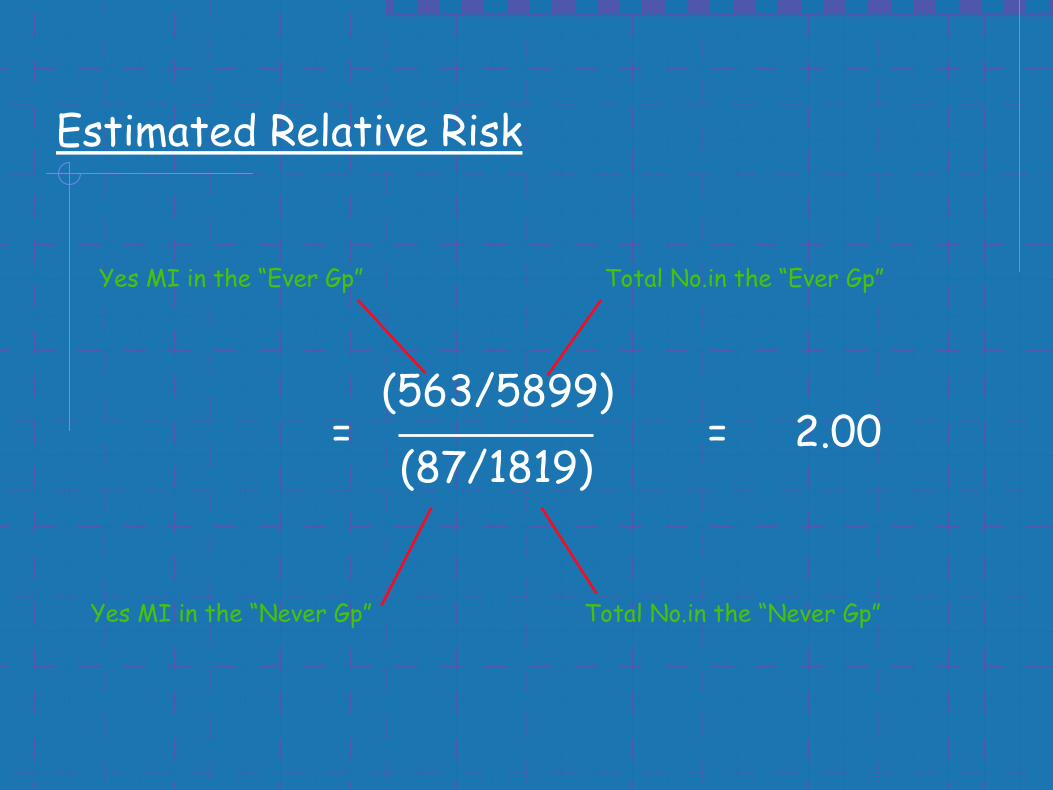
Estimated Relative Risk
=(563/5899)
(87/1819)= 2.00
Yes MI in the “Ever Gp”
Yes MI in the “Never Gp”
Total No.in the “Ever Gp”
Total No.in the “Never Gp”
Case - control studies
Incident cases
Prevalent cases
Matching

YES NO TOTAL
EVER40
(14%)1287
(30%)1327
NEVER 239 3023 3262
TOTAL 279 4310 4589
Current use of HRT
Odds Ratio
HRT & Hip Fracture BMJ N = 1327
Hip Fracture

Observed Odds Ratio
= (40 X 3023)/(239 X 1287)
= 0.39
A postmenopausal woman who is a current user of HRT had 39% of the risk of hip fracture of a woman who had never used HRT ie being a current user of HRT reduced the risk of hip fracture by 61%
Yes fracture in the “HRT Gp” NO fracture in the “HRT Gp”
Yes fracture in the “ NO HRT Gp”NO fracture in the “ NO HRT Gp”
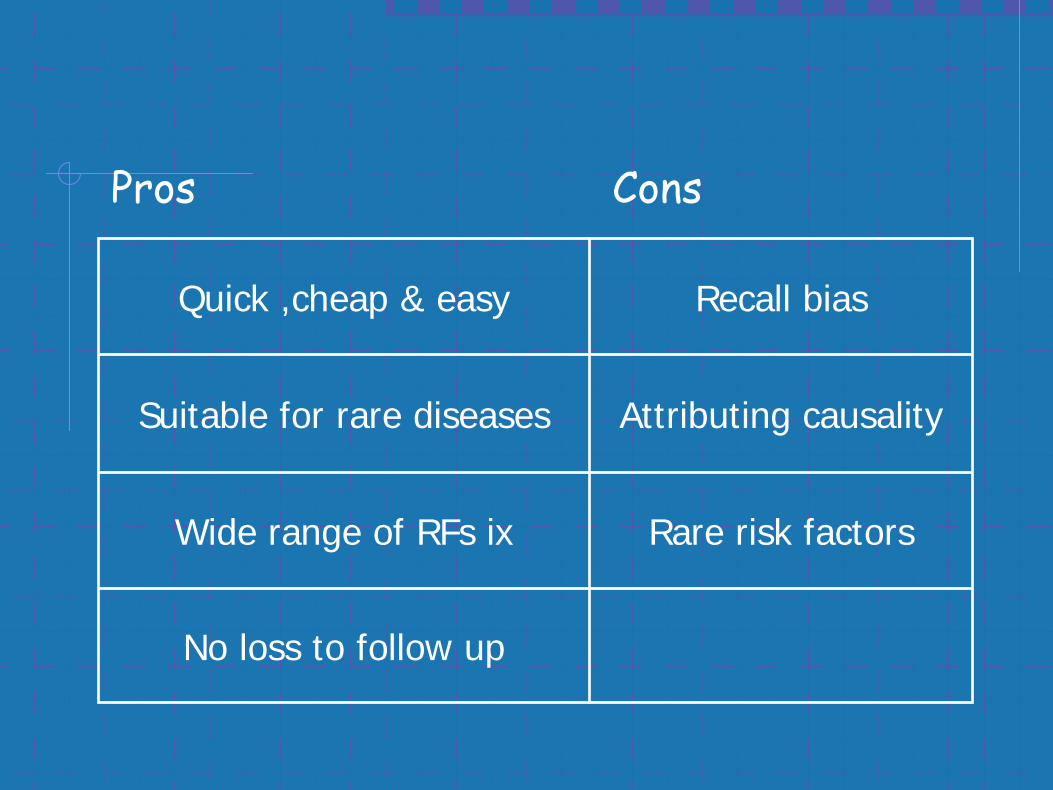
Quick ,cheap & easy Recall bias
Suitable for rare diseases Attributing causality
Wide range of RFs ix Rare risk factors
No loss to follow up
Pros Cons
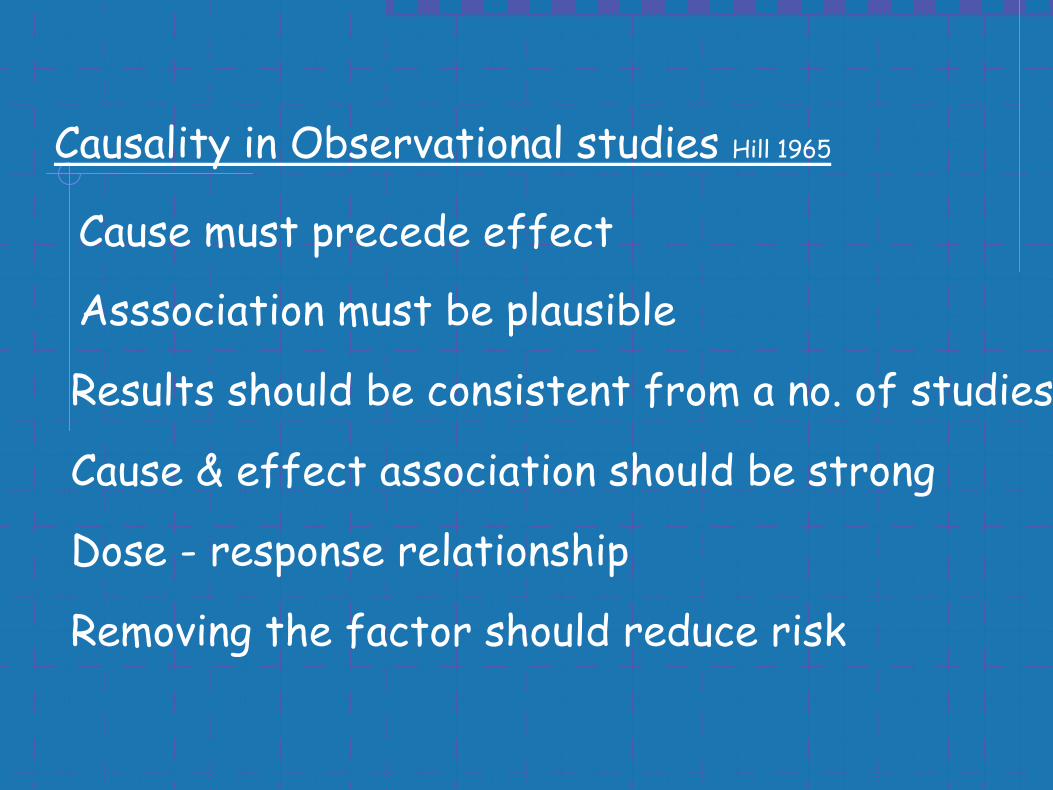
Causality in Observational studies Hill 1965
Cause must precede effect
Asssociation must be plausible
Results should be consistent from a no. of studies
Cause & effect association should be strong
Dose - response relationship
Removing the factor should reduce risk
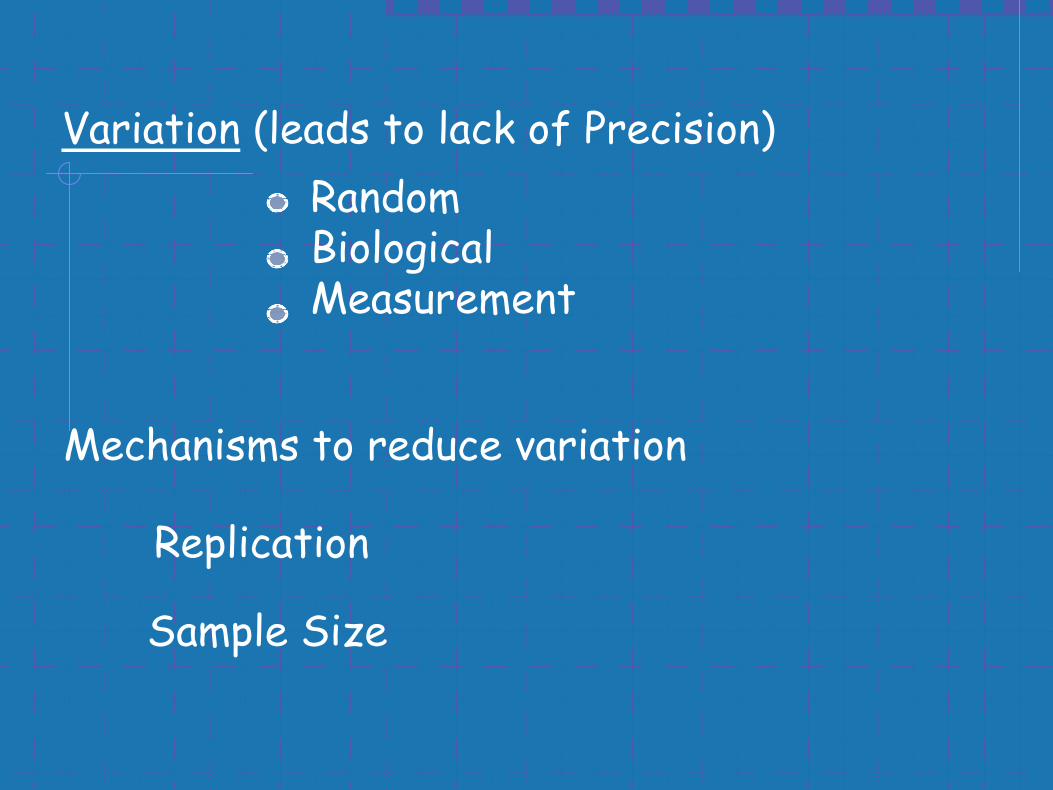
Variation (leads to lack of Precision)RandomBiologicalMeasurement
Mechanisms to reduce variation
Replication
Sample Size
SAMPLE SIZE &
POWER CALCULATION

Why perform sample size calculations?Why perform sample size calculations?
• We need to know how many people are required to detect a treatment difference should it exist. If a study is too small, it may lack the power to pick up differences.
• Clinical trials can be expensive – we don’t want to waste time, money and resources on a study that will unable to pick up clinically relevant differences. We also don’t want to study more people than necessary.
• It is unethical to subject patients to treatment unnecessarily – either by performing a trial with low power or by recruiting more patients than necessary.
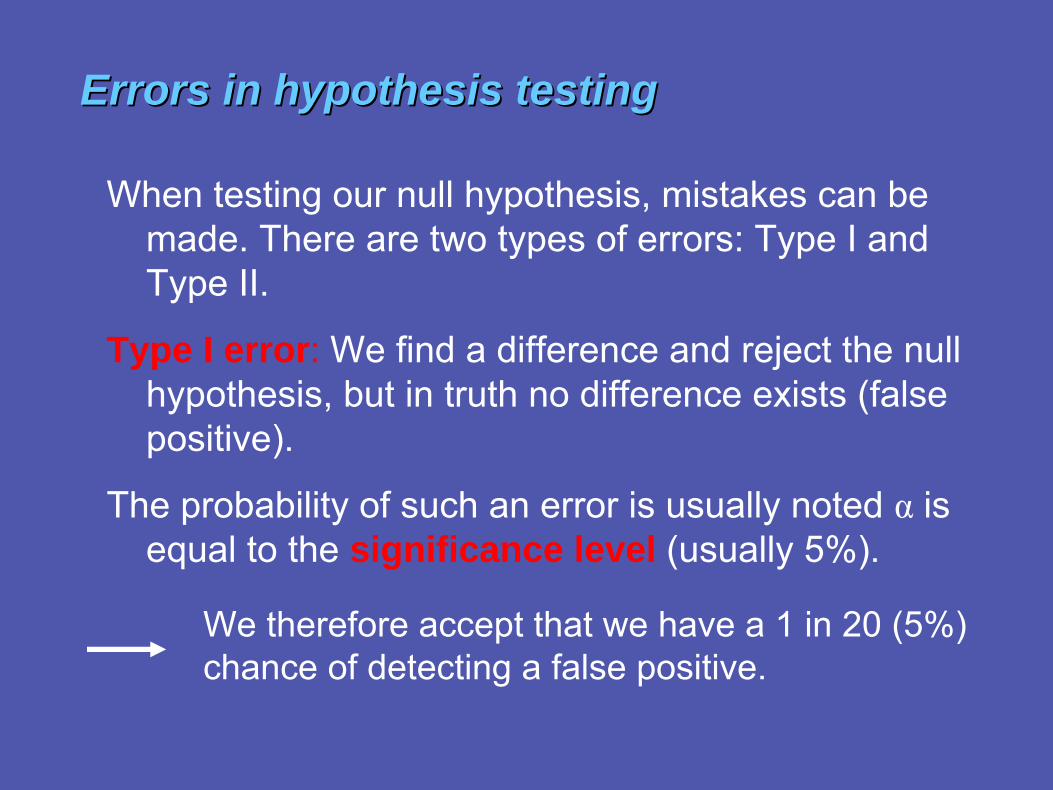
Errors in hypothesis testingErrors in hypothesis testing
When testing our null hypothesis, mistakes can be made. There are two types of errors: Type I and Type II.
Type I error: We find a difference and reject the null hypothesis, but in truth no difference exists (false positive).
The probability of such an error is usually noted α is equal to the significance level (usually 5%).
We therefore accept that we have a 1 in 20 (5%) chance of detecting a false positive.
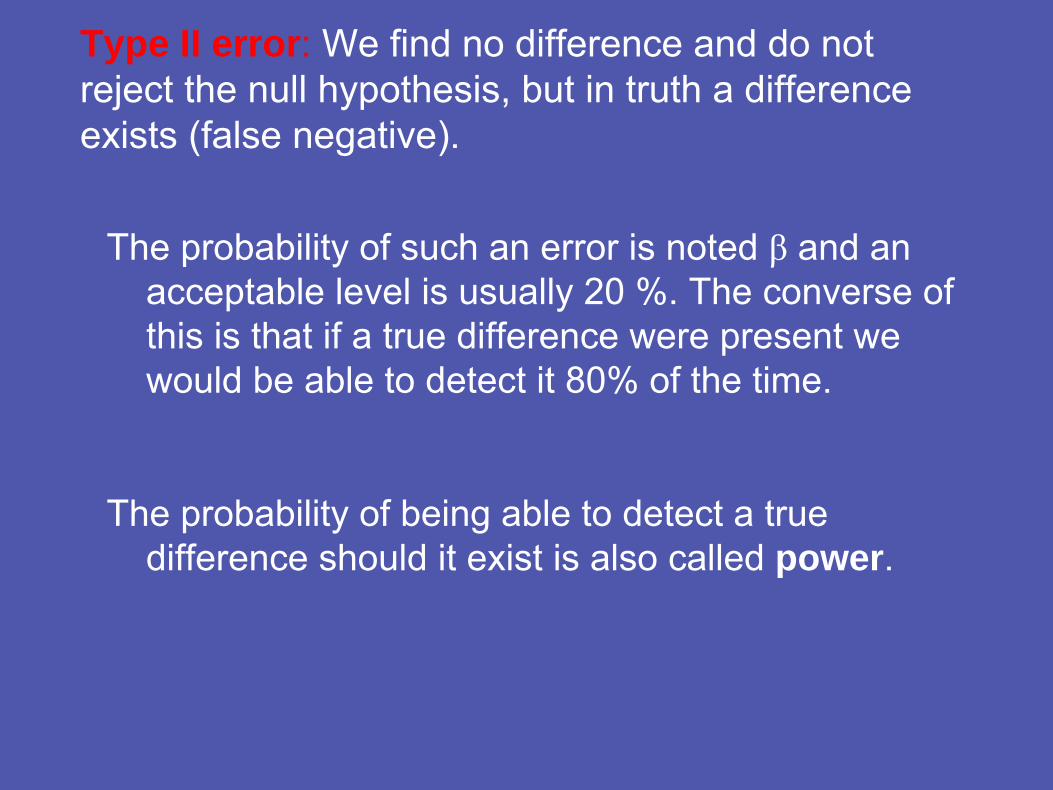
Type II error: We find no difference and do not reject the null hypothesis, but in truth a difference exists (false negative).
The probability of such an error is noted β and an acceptable level is usually 20 %. The converse of this is that if a true difference were present we would be able to detect it 80% of the time.
The probability of being able to detect a true difference should it exist is also called power.
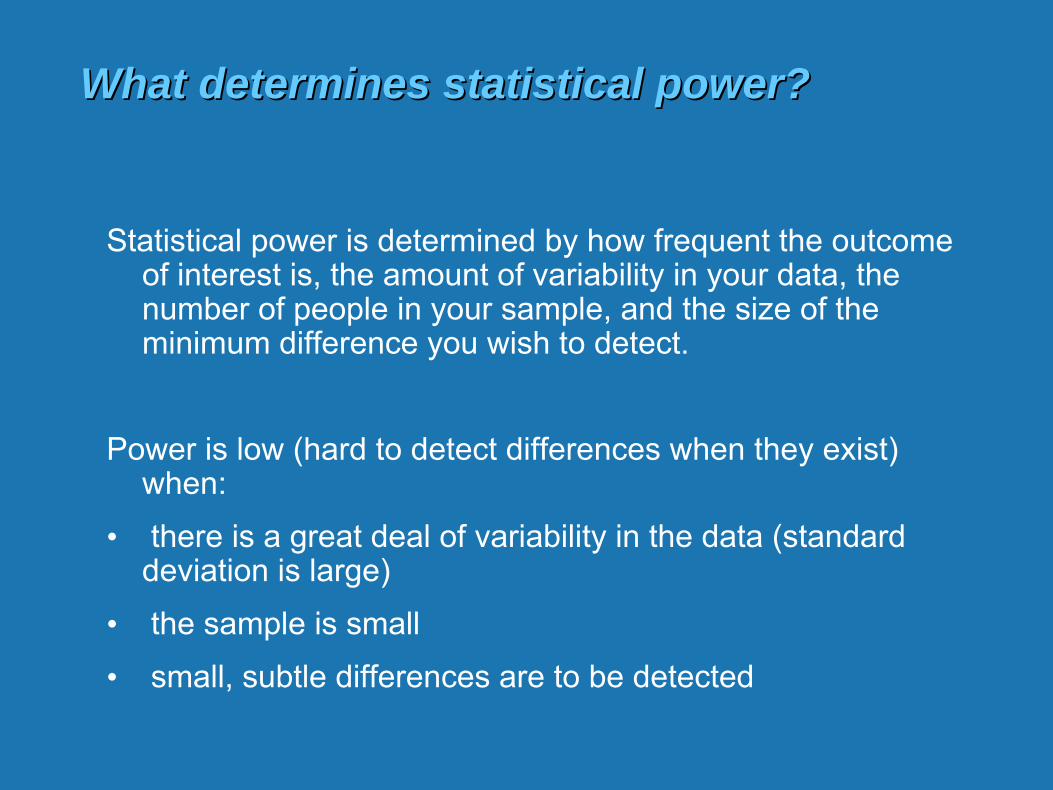
What determines statistical power?What determines statistical power?
Statistical power is determined by how frequent the outcome of interest is, the amount of variability in your data, the number of people in your sample, and the size of the minimum difference you wish to detect.
Power is low (hard to detect differences when they exist) when:
• there is a great deal of variability in the data (standard deviation is large)
• the sample is small
• small, subtle differences are to be detected

Usually, we set power to a desired level and then design the study in such a way that this level of power is achieved. Most studies seek to have power of 80% - 90%.
Once we have set the desired power of the study, we can estimate how many subjects we would require to be able to detect the minimum clinically relevant difference (decided in advance) should it exist. This calculation is the sample size calculation.
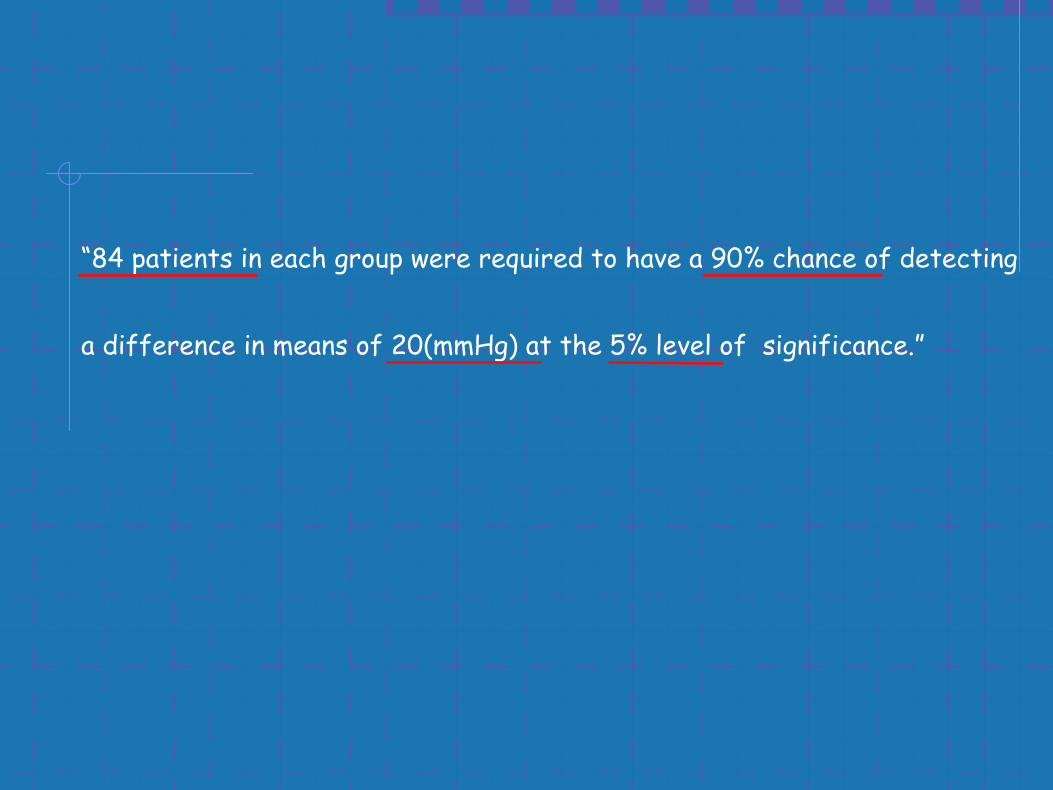
“84 patients in each group were required to have a 90% chance of detecting
a difference in means of 20(mmHg) at the 5% level of significance.”

“84 patients in each group were required to have a 90% chance
of detecting a difference in means of 20(mmHg) at the 5% level of
significance.”
POWER
SL(α):
We need to know STANDARD DEVIATION (σ)
WHAT IS CLINICALLY RELEV (δ)
N
We calculate the Standardised Difference (δ/ σ)
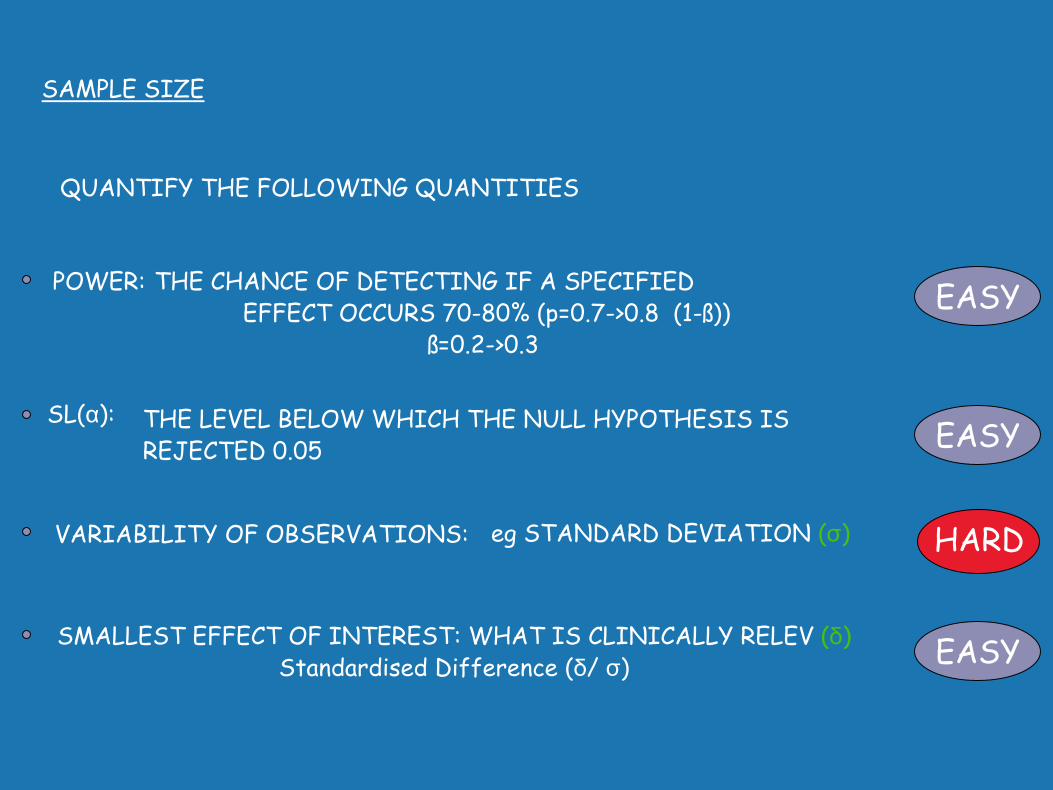
SAMPLE SIZE
QUANTIFY THE FOLLOWING QUANTITIES
POWER: THE CHANCE OF DETECTING IF A SPECIFIED EFFECT OCCURS 70-80% (p=0.7->0.8 (1-ß))
ß=0.2->0.3
SL(α): THE LEVEL BELOW WHICH THE NULL HYPOTHESIS IS REJECTED 0.05
VARIABILITY OF OBSERVATIONS: eg STANDARD DEVIATION (σ)
SMALLEST EFFECT OF INTEREST: WHAT IS CLINICALLY RELEV (δ)Standardised Difference (δ/ σ)
EASY
HARD
EASY
EASY
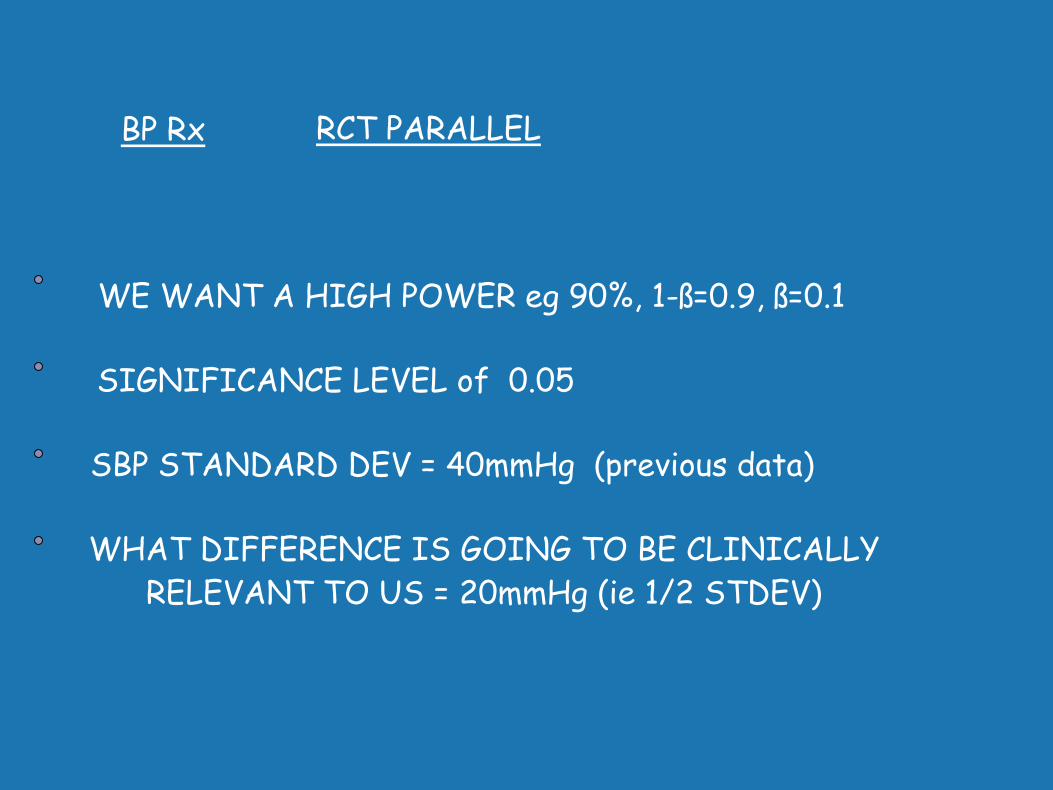
BP Rx RCT PARALLEL
SBP STANDARD DEV = 40mmHg (previous data)
WHAT DIFFERENCE IS GOING TO BE CLINICALLYRELEVANT TO US = 20mmHg (ie 1/2 STDEV)
SIGNIFICANCE LEVEL of 0.05
WE WANT A HIGH POWER eg 90%, 1-ß=0.9, ß=0.1
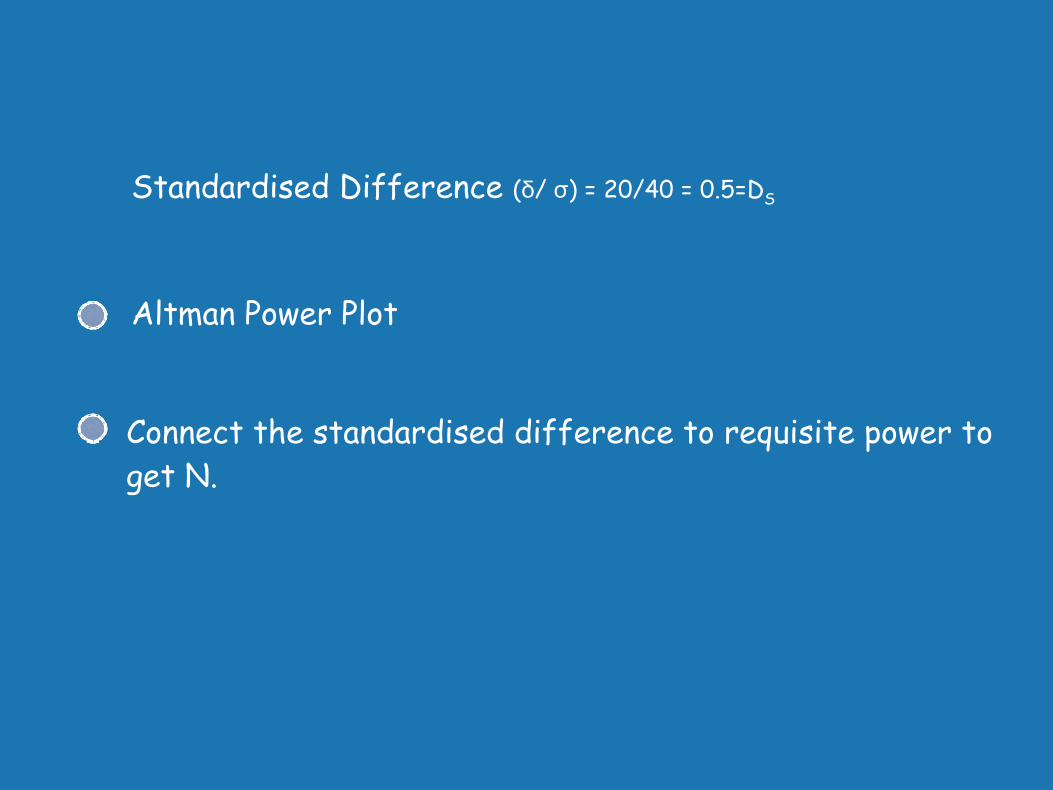
Standardised Difference (δ/ σ) = 20/40 = 0.5=DS
Altman Power Plot
Connect the standardised difference to requisite power toget N.

N* in each group = f(α,β) x2 σ2
(μ1- μ2)2
Where f(α,β) =
0.05 0.1 0.2 0.5
0.05 13.0 10.5 7.85 3.84
0.01 17.8 14.9 11.7 6.63
β
α
* Assumes equal numbers in each group. Other formulae exist when this is not the case.
= f(α,β) x 2DS
2
Therefore for DS = 0.5, α = 0.05 and β = 0.1
N = 10.5 X 2/ (0.5)2 = 84 in each group
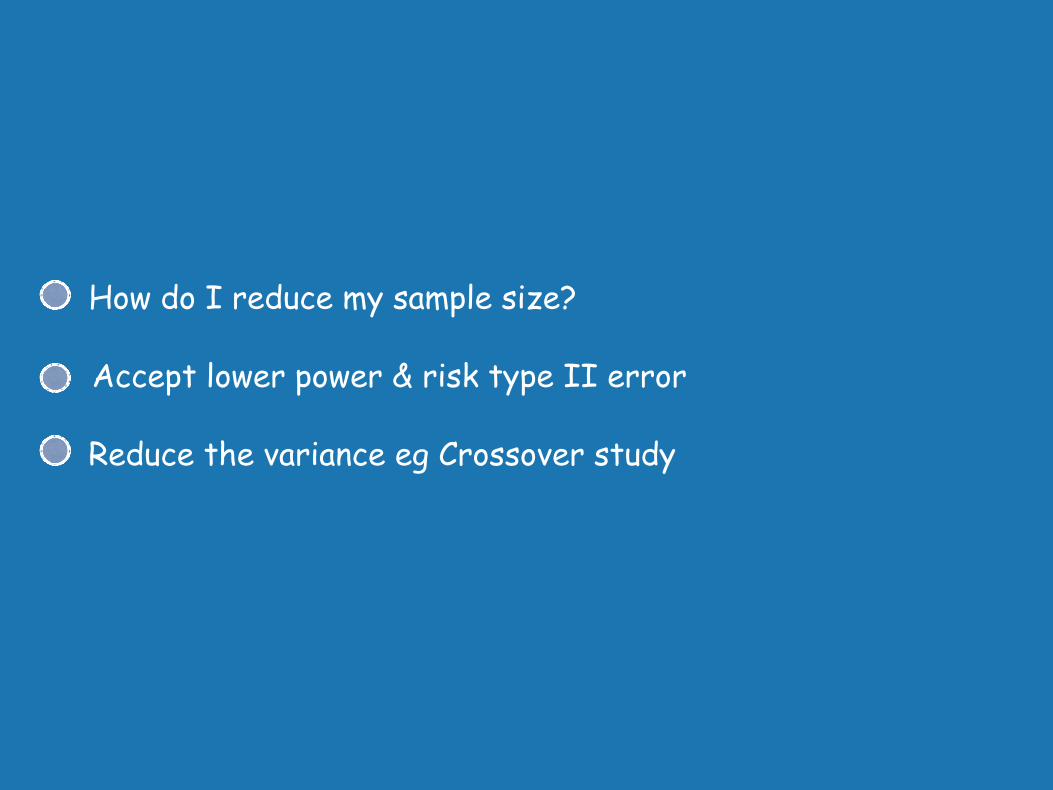
How do I reduce my sample size?
Accept lower power & risk type II error
Reduce the variance eg Crossover study
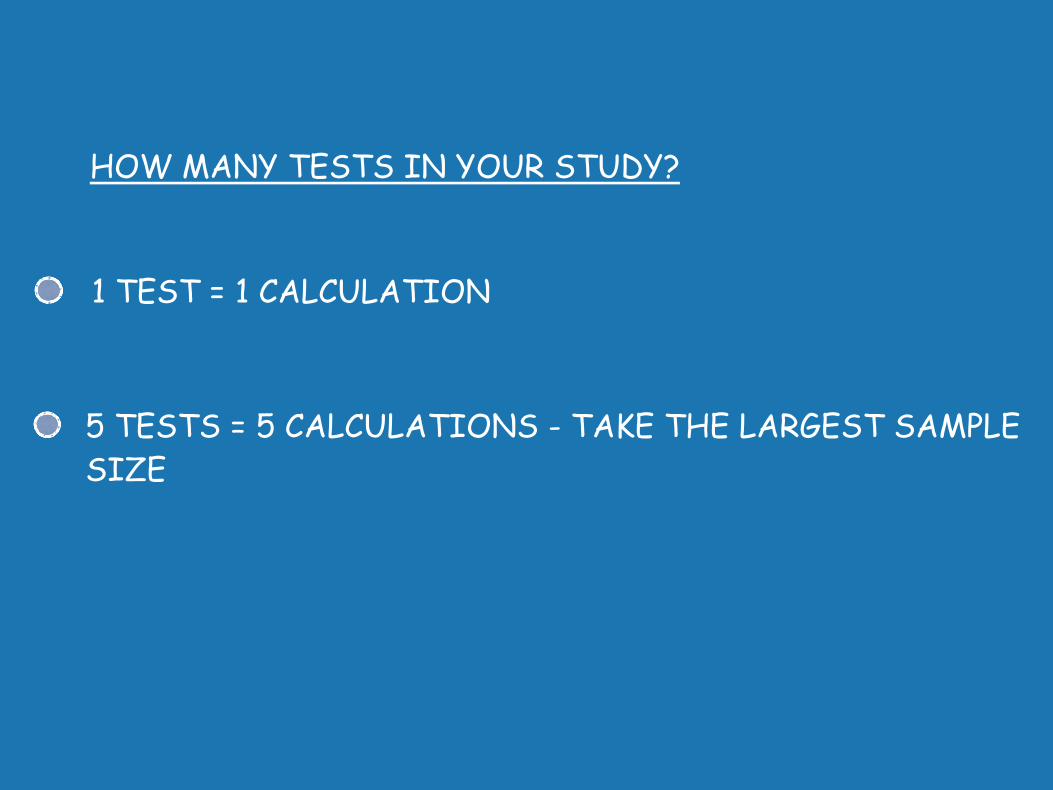
HOW MANY TESTS IN YOUR STUDY?
1 TEST = 1 CALCULATION
5 TESTS = 5 CALCULATIONS - TAKE THE LARGEST SAMPLE SIZE

SCU – Contact DetailsDr Jean Saunders Executive Director Statistical Consulting Unit(Office of the Vice President Academic &
Registrar) Department of Mathematics and StatisticsUniversity of LimerickTel: +353 - 61 – 213471Mob: +353 – 86 - 3866353 Fax: +353 - 61 - 334927email [email protected]