Embed Size (px)
Citation preview

Statistical Brief
No. 14 December 1994
Statistical Brief on the National Agricultural Research System
of
CAPE VERDE
Nienke M. BeintemaPhilip G. Pardey
Johannes Roseboom
ISNAR INDICATOR SERIES PROJECT: PHASE II
International Service for National Agricultural Research
with support from
the Government of Italy
and
Special Program for African Agricultural Research (SPAAR)

ISNAR INDICATOR SERIES PROJECT PHASE II
Decision making in the agricultural research policy area in either domestic, regional, or internationalfora can only be aided by access to reliable and comprehensive data on these systems. It is for thisreason that ISNAR initiated its Indicator Series Project in 1986. The major objective of this project isto collect, process, and analyze reliable and comprehensive time-series data on national agriculturalresearch systems (NARSs) throughout the world in order to identify and report on major trends andemerging policy issues with regard to the development of NARSs. To this end a database has beendeveloped that contains time-series data on agricultural research expenditures and personnel formore than 150 developing and developed countries. These data provide a quantitative basis for morein-depth research policy studies by ISNAR and others.
During the first phase of the project (1986-91), the Indicator Series project team produced two majorpublications published by Cambridge University Press, namely:
Pardey, P.G., and J. Roseboom. (1989)ISNAR Agricultural Research Indicator Series: A GlobalData Base on National Agricultural Research Systems, 547 pp.; and
Pardey, P.G., J. Roseboom, and J.R. Anderson, eds. (1991)Agricultural Research Policy:International Quantitative Perspectives, 462 pp..
The first publication is a statistical reference volume that provides system-level data on agriculturalresearch personnel and expenditures for 154 countries. The second publication draws on the databaseto report on the major policy dimensions of agricultural research, with a primary focus onless-developed countries.
Phase II of the Indicator Series Project was initiated in 1992 and seeks to update the database and thepolicy analyses that accompany it. New ISNAR survey data are being used in conjunction with alarge variety of published and “informal” reports in order to produce reliable as well as up-to-dateinformation and statistics about the NARSs.
The country-level data are being published in a series of NARS Statistical Briefs. These briefsinclude more detailed descriptive information about the institutional structure of the NARS as well asa more comprehensive set of statistics than were reported in the 1989 Indicator Series volume. It isenvisaged the country-level data will be assembled and analyzed in a series of regional researchreports.
These statistical briefs are not official ISNAR publications; they are not edited or reviewed byISNAR. The information and data presented have been collected and compiled with due care and allreasonable efforts have been made to ensure their accuracy. Comments, corrections, and additions tothe material reported in this brief are welcomed. These briefs may be cited with dueacknowledgment.
ISNAR • P.O. Box 93375• 2509 AJ The Hague, The Netherlands.Tel: (31) (70) 349-6100• Fax: (31) (70) 381-9677Email: Internet: [email protected]
Statistical Brief on the National Agricultural Research System
of
CAPE VERDE
Nienke M. BeintemaPhilip G. Pardey
Johannes Roseboom
ISNAR INDICATOR SERIES PROJECT: PHASE II
Acknowledgments
The authors thank Fionnuala Hawes for her assistance in preparing the graphics for this reportand general secretarial support to the project. Helpful comments and assistance with datagathering were obtained from A.J. Correia, P. Eyzaguirre, A.A. Lopes, and P. Vandor.


Contents
1. Introduction 1
2. Agricultural Research Institutions 2
2.1 Historical Evolution 22.2 Present Structure 4
3. Statistics 5
3.1 Long term Development 53.2 Human Resources 73.3 Financial Resources 83.4 Research Focus 9
Bibliography 10
Appendix 1: Country background information 12Appendix 2: Definitions and concepts 13Appendix 3: Organizational charts of the agricultural research institutes 15Appendix 4: Addresses of the agricultural research institutes 17Appendix 5: Researcher and research expenditure totals, 1978-91 18Appendix 6: Research staff development by institute, 1978-91 19
Acronyms
CDP Centro de Desenvolvimento PecuárioCEA Centro de Estudos AgráriosCVE Cape Verdean EscudosCGIAR Consultative Group on International
Agricultural ResearchDGASP Direção Geral de Agricultura,
Silvicultura e PecuáriaDGCSAFER Direção Geral de Conservação de Solos e
Agua, Florestas, e Engenheria RuralFAO Food and Agricultural OrganizationFTE Full-Time EquivalentGDP Gross Domestic ProductCOVC Government of Cape VerdeIDEPE Instituto de Promoção e
Desenvolvimento da Pesca ArtesanalINDP Instituto Nacional de Desenvolvimento
das PescasINERF Instituto Nacional de Engenheria Rural e
FlorestasINFA Instituto Nacional de Fomento
Agro-Pecuário
INIA Instituto Nacional de InvestigaçãoAgrária
INIDA Instituto Nacional de Investigação eDesenvolvimento Agrária
INIP Instituto Nacional de InvestigaçãoPescária
ISNAR International Service for NationalAgricultural Research
MDRP Ministério de DesenvolvimentoRural e Pescas
MPAAR Ministério das Pescas, Agricultura eAnimação Rural
NARS National Agricultural ResearchSystem
OECD Organization for EconomicCo-operation and Development
UNDP United Nations DevelopmentProgram
USAID United States Agency forInternational Development
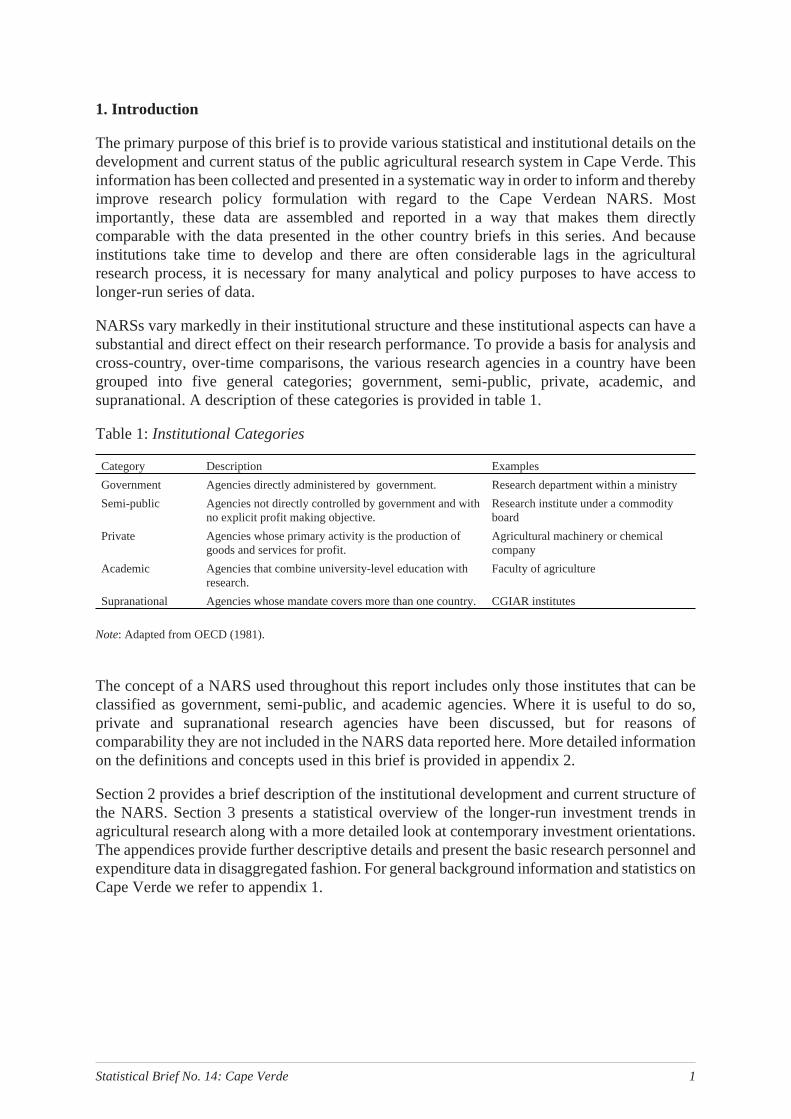
1. Introduction
The primary purpose of this brief is to provide various statistical and institutional details on thedevelopment and current status of the public agricultural research system in Cape Verde. Thisinformation has been collected and presented in a systematic way in order to inform and therebyimprove research policy formulation with regard to the Cape Verdean NARS. Mostimportantly, these data are assembled and reported in a way that makes them directlycomparable with the data presented in the other country briefs in this series. And becauseinstitutions take time to develop and there are often considerable lags in the agriculturalresearch process, it is necessary for many analytical and policy purposes to have access tolonger-run series of data.
NARSs vary markedly in their institutional structure and these institutional aspects can have asubstantial and direct effect on their research performance. To provide a basis for analysis andcross-country, over-time comparisons, the various research agencies in a country have beengrouped into five general categories; government, semi-public, private, academic, andsupranational. A description of these categories is provided in table 1.
Table 1:Institutional Categories
Category Description Examples
Government Agencies directly administered by government. Research department within a ministry
Semi-public Agencies not directly controlled by government and withno explicit profit making objective.
Research institute under a commodityboard
Private Agencies whose primary activity is the production ofgoods and services for profit.
Agricultural machinery or chemicalcompany
Academic Agencies that combine university-level education withresearch.
Faculty of agriculture
Supranational Agencies whose mandate covers more than one country. CGIAR institutes
Note: Adapted from OECD (1981).
The concept of a NARS used throughout this report includes only those institutes that can beclassified as government, semi-public, and academic agencies. Where it is useful to do so,private and supranational research agencies have been discussed, but for reasons ofcomparability they are not included in the NARS data reported here. More detailed informationon the definitions and concepts used in this brief is provided in appendix 2.
Section 2 provides a brief description of the institutional development and current structure ofthe NARS. Section 3 presents a statistical overview of the longer-run investment trends inagricultural research along with a more detailed look at contemporary investment orientations.The appendices provide further descriptive details and present the basic research personnel andexpenditure data in disaggregated fashion. For general background information and statistics onCape Verde we refer to appendix 1.
Statistical Brief No. 14: Cape Verde 1
2. Agricultural Research Institutions
2.1 Historical Evolution1
Until 1975, Cape Verde was a colony of Portugal. Prior to independence the country had variousresearch stations, built by the Portuguese, that were permanently staffed with Portuguese andCape Verdean scientists. These research stations were part of the Portuguese OverseasScientific Research Service. Following independence the Government of Cape Verderestructured and reformed the research infrastructure assumed from the Portuguese in an effortto address the food security and resource management priorities of the new administration.
The Government of Cape Verde established a national agricultural research agency, the “Centrode Estudos Agrários” (CEA, the Center of Agrarian Studies), in 1978 with financial supportfrom various donors (e.g., USAID, FAO, and the Governments of Germany, Netherlands, andUnited Kingdom). CEA was under the administrative and financial responsibility of the“Ministério de Desenvolvimento Rural e Pescas” (MDRP, the Ministry of AgriculturalDevelopment and Fisheries). In 1985 CEA was renamed the “Instituto Nacional de InvestigaçãoAgrária” (INIA, the National Institute for Agricultural Research). The institute became asemi-autonomous body under the supervision of MDRP but had financial and administrativeautonomy.
In its initial years CEA undertook some research on animal production, but in 1982 the “Centrode Desenvolvimento Pecuário” (CDP, the Center for Animal Development) was established asa semi-autonomous body under the supervision of MDRP and assumed responsibility forlivestock research. The institute began operations using only expatriate scientists, who weregradually replaced by Cape Verdean scientists as they returned from training abroad. CDPconducted some research on the production and health of swine, rabbits, poultry, and goats, aswell as on pasture development and was also heavily engaged in extension activities regardinganimal production. In 1990 the center had 20 extension agents located at various stationsthroughout the country.
Although fisheries production is the most important source of export earnings for Cape Verde,and in value terms fish products are also the largest component of the food and agriculturalsector, fisheries research was only recently initiated with the establishment of the “InstitutoNacional de Investigação Pescária” (INIP, the National Institute for Fisheries Research) in1985. The institute became operational in 1988.
An overview of the structure of the Cape Verdean NARS prior to 1992 is presented in table 2.
In late 1992 those public agencies concerned with agriculture, including the national researchinstitutes, were reorganized in an attempt to achieve a more efficient use of the country’s modestresearch resources. MDRP became the “Ministério das Pescas, Agricultura e Animação Rural"(MPAAR, the Ministry of Fisheries, Agriculture, and Livestock). The research activities ofCDP were integrated into INIA which was renamed the “Instituto Nacional de Investigação eDesenvolvimento Agrária” (INIDA, the National Institute of Agricultural Research andDevelopment). The extension activities of CDP were merged into the newly created “InstitutoNational de Fomento Agro-Pecuário” (INFA, National Institute for the Promotion ofAgriculture and Animal Husbandry).
2 Statistical Brief No. 14: Cape Verde
1 The material presented in this section drawslargely from Institut du Sahel and DEVRES (1984), FAO (1990), Sabino (1992), andUSDAI/WARD (1994).

Statistical Brief No. 14: Cape Verde 3
Tab
le2:
Ove
rvie
wo
fth
eS
tru
ctu
reo
fNA
RS
,19
91
a
Inst
itutio
nal
cate
gory
Sup
ervi
sing
agen
cy
Exe
cutin
gag
ency
Res
earc
hfo
cus
Sta
ffed
rese
arch
site
sb
Num
ber
ofre
sear
cher
s
Nam
eA
cron
ymN
atio
nal
Exp
ats
Tot
alF
TE
s
Gov
ernm
ent
Min
isté
riode
Des
envo
lvim
ento
Rur
ale
Pes
cas,
Dire
ção
Ger
alde
Agr
icul
tura
,Silv
icul
tura
eP
ecuá
ria
Inst
ituto
Nac
iona
lde
Inve
stig
ação
Agr
ária
INIA
crop
s,liv
esto
ckfo
rest
ry,n
atur
alre
sour
ces,
wild
life
soci
oeco
nom
ics
6(6
)20
828
28
Cen
tro
deD
esen
volv
imen
toP
ecuá
rioC
DP
anim
alpr
oduc
tion
nana
na4
4
Min
isté
riode
Des
envo
lvim
ento
Rur
ale
Pes
cas
Dire
ção
Ger
alde
Con
serv
ação
deS
olos
eA
gua,
Flo
rest
as,e
Eng
enhe
riaR
ural
DG
CS
AF
ER
fore
stry
,co
nser
vatio
nna
nana
nana
Inst
ituto
Nac
iona
lde
Inve
stig
ação
Pes
cária
INIP
fishe
ries
nana
na6
6
To
tal
na
na
na
na
na
So
urc
e:09
99an
d12
14.
No
te:T
hein
form
atio
nre
fers
to19
91fo
rIN
IAan
dto
1990
for
CD
Pan
dIN
IP.
aS
truc
ture
ofN
AR
Sof
Cap
eV
erde
befo
reth
ere
orga
niza
tion
in19
92.
bS
taffe
dw
ithre
sear
cher
san
d/or
tech
nici
ans.
Bra
cket
edsi
tes
are
perm
anen
tlyst
affe
dw
ithre
sear
cher
s.
Prior to the reorganization in 1992 the “Direção Geral de Conservação de Solos e Agua,Florestas e Engenheria Rural” (DGCSAFER, the Directorate General for the Conservation ofSoils and Water, Forestry, and Rural Engineering) of MDRP conducted environmental researchand conservation works. In 1992 DGCSAFER’s research and conservation activities weretransferred to a newly established, semi-autonomous institute, the “Instituto Nacional deEngenheria Rural e Florestas” (INERF, the National Institute of Rural Engineering andForestry).
In 1993, INIP and the “Instituto de Promoção e Desenvolvimento da Pesca Artesanal” (IDEPE,Institute for Fisheries Promotion and Development) were merged into the “Instituto Nacional deDesenvolvimento das Pescas” (INDP, Institute for Fisheries Development) therebyconsolidating fisheries research and extension in one institute. Most of INDP’s staff weretransferred form Praia to Mindelo, São Vicente.
2.2 Present Structure
By way of background to describing the current structure of the Cape Verdean agriculturalresearch system this section begins with a brief overview of contemporary developments in thecountry’s agricultural sector. Cape Verde consists of a group of ten islands 500 km off the coastof West Africa. Although the soils are of volcanic origin, vegetation is sparse because of theerratic rainfall, adverse topography, and prior degradation of the country’s natural resourcebase. The major constraints to agricultural production are water and arable land. Only 16% ofthe country’s land is classified as potentially suitable for agriculture. About 61% of thepotentially agricultural land is cropped, with 5% of the cropped land under irrigation. Theremaining 39% of agricultural land is pastureland. Around one half of the country’s labor forceworks in agriculture, but in 1991 agricultural GDP accounted for only 14% of total GDP. Localagricultural production is insufficient to satisfy the domestic demand for food. In good rainfallyears Cape Verde produces 30-35% of its total food demand, but in drought years this figure canfall to less than 10%. For these reasons the country has been particularly dependent on food aid.
The fisheries subsector is an important component of Cape Verde’s economy and accounted foralmost one-half of agricultural GDP and over two-thirds of the country’s export earnings in1991. Since 1992, however, fisheries exports dropped markedly which resulted in a drasticdecline in the country’s export earnings. Livestock and crop production are equally importantand each account for one-quarter of agricultural GDP.
The main agricultural research institute in Cape Verde is the “Instituto Nacional de Investigaçãoe Desenvolvimento Agrária” (INIDA). INIDA is headquartered in São Jorge, Santiago and hasfive substations, three on the island of Santiago, one on São Nicolau, and one on Santo Antão.INIDA’s research focuses mainly on crop and animal production, as well as forestry, naturalresources, and, recently, farming systems. INIDA is organized into five departments, namelyagriculture and livestock, environmental sciences, social sciences, training, and finance andadministration (see appendix 3). The Department of Agriculture and Livestock conductsresearch on corn, legumes, roots, tubers, horticultural crops, banana, sugarcane, irrigation,water harvesting, integrated pest management, biotechnology, industrial crops, foodtechnologies, animal health, and forestry. The Department of Environmental Sciences conductsresearch on vegetation, wildlife, soil science, agroclimatology, and hydrology. The Departmentof Social Sciences conducts farming systems research and research related to socioeconomicissues. In addition, the Department of Training provides training for extension workers. Thetraining is conducted by INIDA staff.
4 Statistical Brief No. 14: Cape Verde

Fisheries research is carried out by the “Instituto Nacional de Desenvolvimento das Pescas”(INDP, Institute for Fisheries Development), a semi-autonomous body under the responsibilityof the “Ministério das Pescas, Agricultura e Animação Rural” (MPAAR). INDP conductsapplied and development research on lobster, tuna, other small ocean fish, and aquaculture, aswell as testing fisheries technologies. INDP’s organizational structure in diagrammic form ispresented in appendix 3.
The “Instituto Nacional de Engenheria Rural e Florestas” (INERF) was created as part of therestructuring that took place in 1992 by combining sections that were formally administered bythe “Direção Geral de Conservação de Solos e Agua, Florestas e Engenheria Rural”(DGCSAFER) and INIA. INERF conducts research on soil and water conservation, forestry,and rural engineering and is divided into five divisions; rural engineering, renewable energy,soil and forest conservation, studies and plan, and administration. INERF’s organizationalstructure is presented in diagrammic form in appendix 3.
INIDA, INERF, INFA, INDP, and INC are semi-autonomous bodies with administrative andsome financial autonomy under the overall responsibility of MPAAR. The institutes have theirown statutes, budgets, and personnel (i.e., their personnel are no longer governmentemployees). They engage in fee-for-service activities although their chief client remains thegovernment.
No university level training facilities are available in Cape Verde. All national scientistsreceived their university education outside the country, which was often undertaken withsubstantial donor support. The country’s first tertiary level education program began in 1993.The program consists of a three year agroforestry diploma course offered by INIDA withstudents from Cape Verde and other countries and financial support from the Governments ofCape Verde, Portugal, and FAO.
3. NARS Statistics
The data in this report refer to the period prior to 1992. This is the year in which the CapeVerdean NARS underwent a major structural reorganization that resulted in the formation ofINIDA. INIDA’s predecessor, INIA, was the only Cape Verdean research agency to respond tothe ISNAR survey. The information provided by INIA was combined with the data andinformation obtained from the secondary sources cited at the conclusion of this report .
The expenditure data presented in this brief are based on the actual expenditures as reported byINIA. However, institutes systematically underestimate the degree of donor support becausethey only have information about the donor support that is channeled through their accountingsystem. Most importantly they often underreport or fail to report the salaries and supplementspaid directly to expatriate researchers by the donors. To correct for this problem in the estimateprovided by INIA, we constructed an implicit cost series for expatriate researchers (seeappendix 2) and, where necessary, added this to the expenditures reported by the variousinstitutes.
Statistical Brief No. 14: Cape Verde 5

3.1 Long-Term Development
Although locally executed research began in 1978 expenditure data were only available forINIA for the period 1985-91 (table 3). Although the number of full-time equivalent researchersis quite small in absolute terms they represent around 400-500 researchers per millioneconomically active agricultural population. This ratio is ten times higher than thecorresponding sub-Saharan African weighted average of 42 researchers per millioneconomically active agricultural population for the period 1981-85 (see Pardey, Roseboom andAnderson 1991). If CDP, DGCSAFER, and INIP were included in the 1990 researcher totals forCape Verde the country’s researchers per million economically active agricultural populationratio would have been at least 27% higher than that reported in table 3 and 14 fold higher thanthe corresponding sub-Saharan African average.
Agricultural research spending expressed as a percent of agricultural GDP averaged 6.3% forthe 1985-91 period, nearly 13-times higher than the average for sub-Saharan Africa thatprevailed in the mid-1980s. However as Pardey, Roseboom and Anderson (1991) note, it is notunusual for countries with small populations, especially in sub-Saharan Africa, to have higherthan average research intensity ratios. This highlights the real difficulties for small countriessuch as Cape Verde of maintaining even a very modest agricultural research capacity based onlyon local sources of support.
Total expenditures fluctuated markedly during the period 1985-91 and so the correspondingexpenditures per researcher estimates ranged from $108,000 in 1989 to $277,000 in 1986, withthe period average being $172,000.
Table 3:NARS Researcher and Expenditure Series, 1985-91
1985 1986 1987 1988 1989 1990 1991
Annualgrowth
ratea
%
Researchers (FTEs) 23 18 26 27 31 26 28 5.5
Expenditures (millions 1985Cape Verdean Escudos per year)
111.332 113.672 72.633 111.023 76.527 81.526 106.117 -2.7
Expenditures (millions 1985PPP dollars per year)
4.876 4.979 3.181 4.863 3.352 3.571 4.648 -2.7
Expenditures per researcher(1985 PPP dollars per year)
212,000 277,000 122,000 180,000 108,000 137,000 167,000 -2.7
Number of econ. active agr.population (millions)
0.05 0.05 0.05 0.05 0.06 0.06 0.06 0.4
Researchers per million econ.act. agr. population
425.9 333.3 481.5 500.0 563.6 472.7 500.0 6.3
AgGDP (million 1985 PPPdollars)
49.668 53.091 68.532 75.225 74.997 72.182 78.876 7.8
Expenditures as a % of AgGDP 9.82 9.71 4.76 6.71 4.90 4.91 6.30 -9.1
Source: See appendices 5 and 6.Note: Includes data for INIA only.a Least square growth rate for the 1985-91 period.
6 Statistical Brief No. 14: Cape Verde

3.2 Human Resources
Degree and Nationality Status of Researchers
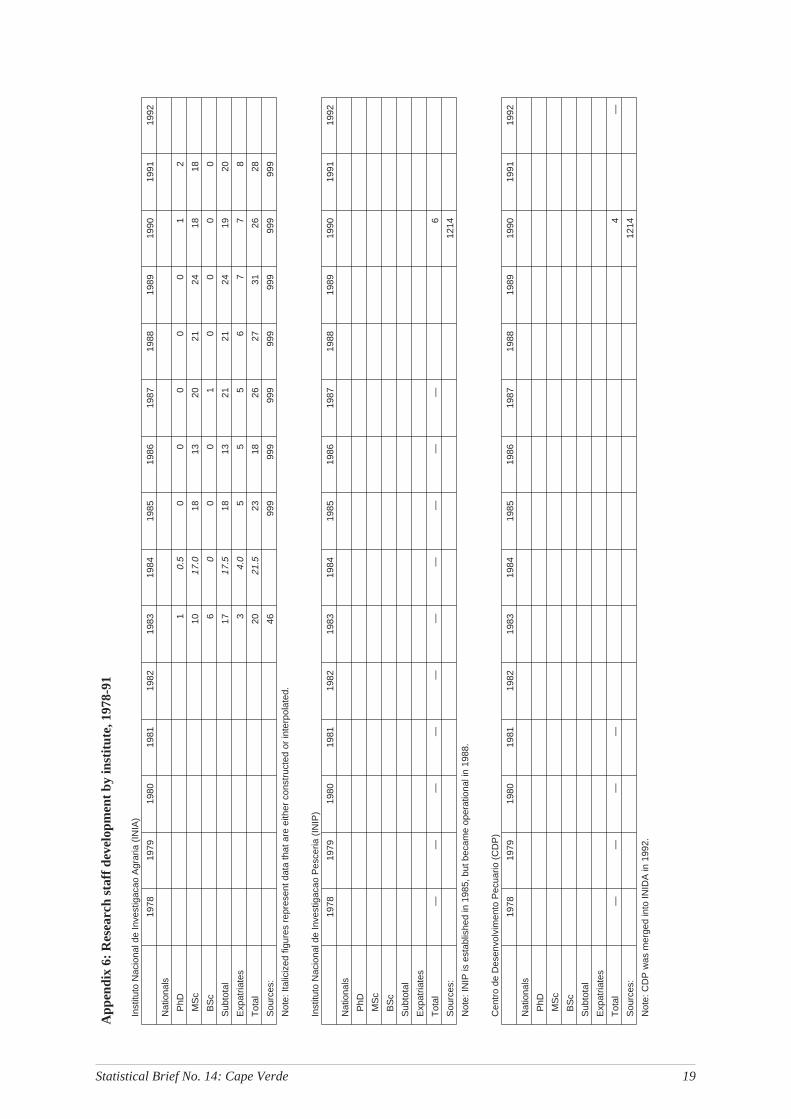
A detailed breakdown of the educational status of INIA’s staff is provided in table 4. INIA isstaffed mainly with researchers holding an MSc (or equivalent) degree. In 1984 the onlynational researcher with a PhD degree left the institute and for the subsequent four years INIAhad no national researchers with a PhD degree. The number of expatriate researchers working atINIA increased from three researchers in 1983 to eight researchers in 1991.
Table 4:Educational and Nationality Status of Researchers of INIA
Institutionalcategory
Researcherstatus 1983 1985 1986 1987 1988 1989 1990 1991
(full-time equivalents)
Government PhD 1 0 0 0 0 0 1 2
MSc 10 18 13 20 21 24 18 18
BSc 6 0 0 1 0 0 0 0
Subtotal 17 18 13 21 21 24 19 20
Expat 3 5 5 5 6 7 7 8
Total 20 23 18 26 27 31 26 28
Sources: See appendices 5 and 6.
Gender
INIA employs a high proportion of female researchers compared with most other AfricanNARSs. From 1985 to 1991 around 40% of INIA’s scientific staff were female. For each of theyears 1987 to 1989 the female share was 38% and in 1986 it was 46%. No information on thegender status of expatriate staff was available.
Staff Composition
INIA’s total research staff has tended to fluctuate around a post-1985 average of 26. Likewisethe number of administrative and “other” support personnel has remained fairly stable since themid-1980s while the number of technical support staff has more than doubled (table 5). As aconsequence the institute’s technical support per researcher ratio grew from 0.30 in 1985 to 0.64in 1991.
In 1990 CDP had four researchers supported by five other staff, while INIP employed sixresearchers and 15 support staff (FAO 1990).
Statistical Brief No. 14: Cape Verde 7
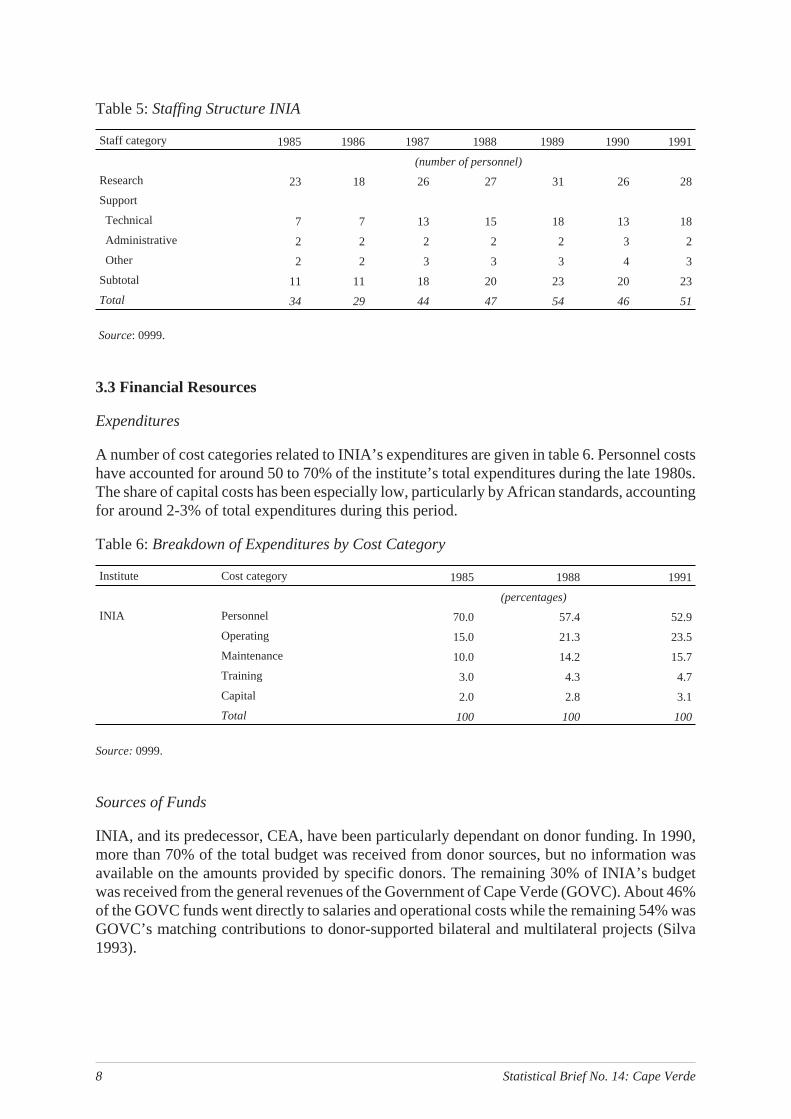
Table 5:Staffing Structure INIA
Staff category 1985 1986 1987 1988 1989 1990 1991
(number of personnel)
Research 23 18 26 27 31 26 28
Support
Technical 7 7 13 15 18 13 18
Administrative 2 2 2 2 2 3 2
Other 2 2 3 3 3 4 3
Subtotal 11 11 18 20 23 20 23
Total 34 29 44 47 54 46 51
Source: 0999.
3.3 Financial Resources
Expenditures
A number of cost categories related to INIA’s expenditures are given in table 6. Personnel costshave accounted for around 50 to 70% of the institute’s total expenditures during the late 1980s.The share of capital costs has been especially low, particularly by African standards, accountingfor around 2-3% of total expenditures during this period.
Table 6:Breakdown of Expenditures by Cost Category
Institute Cost category 1985 1988 1991
(percentages)
INIA Personnel 70.0 57.4 52.9
Operating 15.0 21.3 23.5
Maintenance 10.0 14.2 15.7
Training 3.0 4.3 4.7
Capital 2.0 2.8 3.1
Total 100 100 100
Source:0999.
Sources of Funds
INIA, and its predecessor, CEA, have been particularly dependant on donor funding. In 1990,more than 70% of the total budget was received from donor sources, but no information wasavailable on the amounts provided by specific donors. The remaining 30% of INIA’s budgetwas received from the general revenues of the Government of Cape Verde (GOVC). About 46%of the GOVC funds went directly to salaries and operational costs while the remaining 54% wasGOVC’s matching contributions to donor-supported bilateral and multilateral projects (Silva1993).
8 Statistical Brief No. 14: Cape Verde
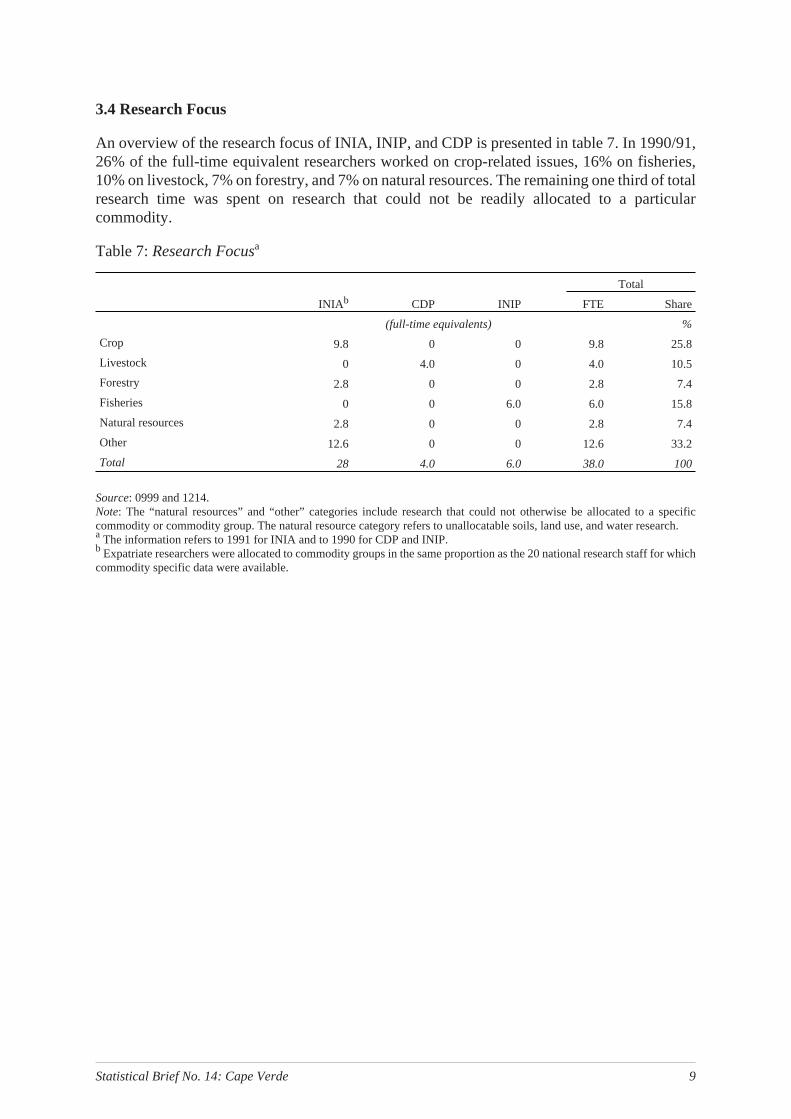
3.4 Research Focus
An overview of the research focus of INIA, INIP, and CDP is presented in table 7. In 1990/91,26% of the full-time equivalent researchers worked on crop-related issues, 16% on fisheries,10% on livestock, 7% on forestry, and 7% on natural resources. The remaining one third of totalresearch time was spent on research that could not be readily allocated to a particularcommodity.
Table 7:Research Focusa
Total
INIA b CDP INIP FTE Share
(full-time equivalents) %
Crop 9.8 0 0 9.8 25.8
Livestock 0 4.0 0 4.0 10.5
Forestry 2.8 0 0 2.8 7.4
Fisheries 0 0 6.0 6.0 15.8
Natural resources 2.8 0 0 2.8 7.4
Other 12.6 0 0 12.6 33.2
Total 28 4.0 6.0 38.0 100
Source: 0999 and 1214.Note: The “natural resources” and “other” categories include research that could not otherwise be allocated to a specificcommodity or commodity group. The natural resource category refers to unallocatable soils, land use, and water research.a The information refers to 1991 for INIA and to 1990 for CDP and INIP.b Expatriate researchers were allocated to commodity groups in the same proportion as the 20 national research staff for whichcommodity specific data were available.
Statistical Brief No. 14: Cape Verde 9

Bibliography
This bibliography comprises three different sets of ref-erences. The “references” section relates to referencescited in the text, the “data sources” to references fromwhich data have been extracted to construct the time se-ries (see appendices 5 and 6), and “other references” toreferences that have been consulted in the process ofdata collection but not used explicitly.
References
Europa Publications.Africa South of the Sahara 1992.21 Edition. London: Europa Publications Ltd., 1992a.
Europa Publications.The World of Learning 1992.42nd Edition. London: Europa Publications Ltd.,1992b.
FAO. La Recherche Agronomique au Cap-Vert. Rap-port d’une Mission de Revue. Rome: FAO, July 1990.
FAO. AGROSTAT Diskettes.Rome: FAO, 1993.
Institut du Sahel, and DEVRES, Inc.Assessment ofAgricultural Research Resources in the Sahel, VolumeIII: National Report Cape Verde. Washington, D.C.:DEVRES, Inc., August 1984.
OECD.The Measurement of Scientific and TechnicalActivities: Frascati Manual 1980.Paris: OECD, 1981.
Pardey, P.G., and J. Roseboom.ISNAR AgriculturalResearch Indicator Series: A Global Data Base onNational Agricultural Research Systems.Cambridge,UK: Cambridge University Press, 1989.
Pardey, P.G., J. Roseboom, and J.R. Anderson, eds.Agricultural Research Policy: InternationalQuantitative Perspectives.Cambridge, UK: Cam-bridge University Press, 1991.
Pardey, P.G., J. Roseboom, and B.J. Craig. “AYardstick for International Comparisons: AnApplication to National Agricultural ResearchExpenditures.”Economic Development and CulturalChangeVol. 40, No. 2 (January 1992): 333-349.
Roseboom, J., and P.G. Pardey. “Measuring theDevelopment of National Agricultural ResearchSystems.” ScientometricsVol. 23, No. 1 (1992):169-190.
Sabino, A.A. “INIA National Institute of AgrarianResearch. Agricultural Research in Cape Verde.” Paperpresented at the International Workshop onManagement Strategies and Policies for AgriculturalResearch in Small Countries, ISNAR, Réduit,Mauritius, 20 April-2 May 1992.
Silva, C. “Institut National de Recherche etDéveloppement Agraire.” Paper presented at theRegional Workshop on the Politics of AgriculturalResearch in the Sahel, Bamako, Mali, 30 August-3 Sep-tember 1993.
Summers, R., and A. Heston. “The Penn World Table(Mark 5): An Expanded Set of InternationalComparisons, 1950-1988.”The Quarterly Journal ofEconomics, May 1991.
UNESCO Office of Statistics - Division of Statistics onScience and Technology.Manual for Statistics onScientific and Technological Activities.Paris:UNESCO, June 1984.
USAID/WARDA. “Watershed and Applied ResearchDevelopment (WARD) Project Paper AmendmentNumber One”. 1994. Mimeo.
World Bank. World Tables Diskettes (Version 2.5).Washington, D.C.: World Bank, April 1992.
World Bank. World Tables Diskettes (Version ??).Washington, D.C.: World Bank, 1993.
Data Sources(listed by source code)
0046 Institut du Sahel, and DEVRES, Inc.Assess-ment of Agricultural Research Resources inthe Sahel, Volume III: National Report CapeVerde. Washington, D.C.: DEVRES, Inc., Au-gust 1984.
0999 ISNAR “Survey of National Agricultural Re-search Systems: Unpublished QuestionnaireResponses.” The Hague, 1992. Mimeo.
1212 Sabino, A.A. “INIA National Institute ofAgrarian Research. Agricultural Research inCape Verde.” Paper presented at the Interna-tional Workshop on Management Strategiesand Policies for Agricultural Research inSmall Countries, ISNAR, Réduit, Mauritius,20 April-2 May 1992.
1214 FAO. La Recherche Agronomique auCap-Vert. Rapport d’une Mission de Revue.Rome: FAO, July 1990.
1298 Silva, C. “Institut National de Recherche etDéveloppement Agraire.” Paper presented atthe Regional Workshop on the Politics of Agri-cultural Research in the Sahel, Bamako, Mali,30 August-3 September 1993.
Other Sources(listed by source code)
0021 OECD.OECD Science and Technology Indi-cators. Paris: OECD, 1984.
0045 Institut du Sahel, and DEVRES, Inc.Bilan desRessources de la Recherche Agricole dans les
10 Statistical Brief No. 14: Cape Verde

Pays du Sahel, Volume I: Analyse et StratégieRégionale. Washington, D.C.: DEVRES, Inc.,1984.
0068 Conte, S. “West Africa Agricultural ResearchData Base Building Task: Termination Re-port.” World Bank, Washington, D.C., 1985.Mimeo.
0083 Institut du Sahel, and DEVRES, Inc.Bilan desRessources de la Recherche Agricole dans lesPays du Sahel, Volume II: Resûmes des Rap-ports Nationaux. Washington, D.C.:DEVRES, Inc., August 1984.
0088 Swanson, B.E., and W.H. Reeves. “Agricul-tural Research West Africa: Manpower andTraining.” World Bank, Washington, D.C.,November 1985. Mimeo.
0089 Oram, P. “Report on National Agricultural Re-search in West Africa.” IFPRI, Washington,D.C., February 1986. Mimeo.
0163 CGIAR. “National Agricultural Research.”CGIAR, Washington, D.C., 1985. Mimeo.
0258 “Effort Français en Faveur de la RechercheAgronomique dans les Pays du Sahel1984-1985.” 1985. Mimeo.
0372 Gabas, J.J.La Recherche Agricole dans lesPays Membres du CILSS. Club du Sahel, Sep-tember 1986.
0384 Institut du Sahel, and DEVRES, Inc.Sahel Re-gion Agricultural Research Resource Assess-ment — Data Base Management InformationSystem: Diskettes and User’s Guide. Printouts.Washington, D.C.: Institut du Sahel, andDEVRES, Inc, n.d.
0466 World Bank — West Africa Agricultural Re-search Review Team. “National AgriculturalResearch Systems (NARS): A Regional Ap-praisal and Selected Issues.” World Bank,Washington, D.C., August 1986. Mimeo.
0744 Agricultural Research Centres: A World Di-rectory of Organizations and Programmes.
Eighth Edition, Two Volumes. Harlow, U.K.:Longman, 1986.
1213 Morais, J. “l’Information Scientifique et Tech-nique au Cap-Vert.” Paper presented at the In-ternational Workshop on ManagementStrategies and Policies for Agricultural Re-search in Small Countries, ISNAR, Réduit,Mauritius, 20 April-2 May 1992.
1215 Nacional de Investigação Agraria (INIA).Relatorio de Actividades 1989. S. Jorge, CapeVerde: INIA, January 1990.
1216 FAO.Republic of Cape Verde. Report of theFAO Mission. Rome: FAO, June 1988.
1217 Inter Etats de Lutte Contre la Secheresse auSahel (CILSS).Développement des CulturesIrriguées aux Iles du Cap Vert. CILSS, Octo-ber 1979.
1218 FAO.Rapport de la Mission de Haut Niveaupour la Mise en Oeuvre du Plan d’Action de laConférence Mondiale sur la Reforme Agraireet le Développement Rural en République duCap-Vert. Rome: FAO, 1981.
1219 Finan, T.J. “The Farm System Under Duress:Agricultural Adaptations on the Cape VerdeIslands.”Human OrganizationVol. 47, No. 2(1988): 109-118.
1270 FAO.Les Systèmes Nationaux de RechercheAgronomique dans le Pays de l’AfriqueOccidentale et Centrale. Rome: FAO, 1993.
1295 SAREC.National Research Councils in De-veloping Countries. SAREC Seminar withCollaborating Agencies, Stockholm,Tammsvik, 16-21 January, 1983. SAREC Re-port R3, 1984. Stockholm: SAREC, May1984.
1437 USAID/WARDA. “Watershed and AppliedResearch Development (WARD) Project Pa-per Amendment Number One”. 1994. Mimeo.
Statistical Brief No. 14: Cape Verde 11
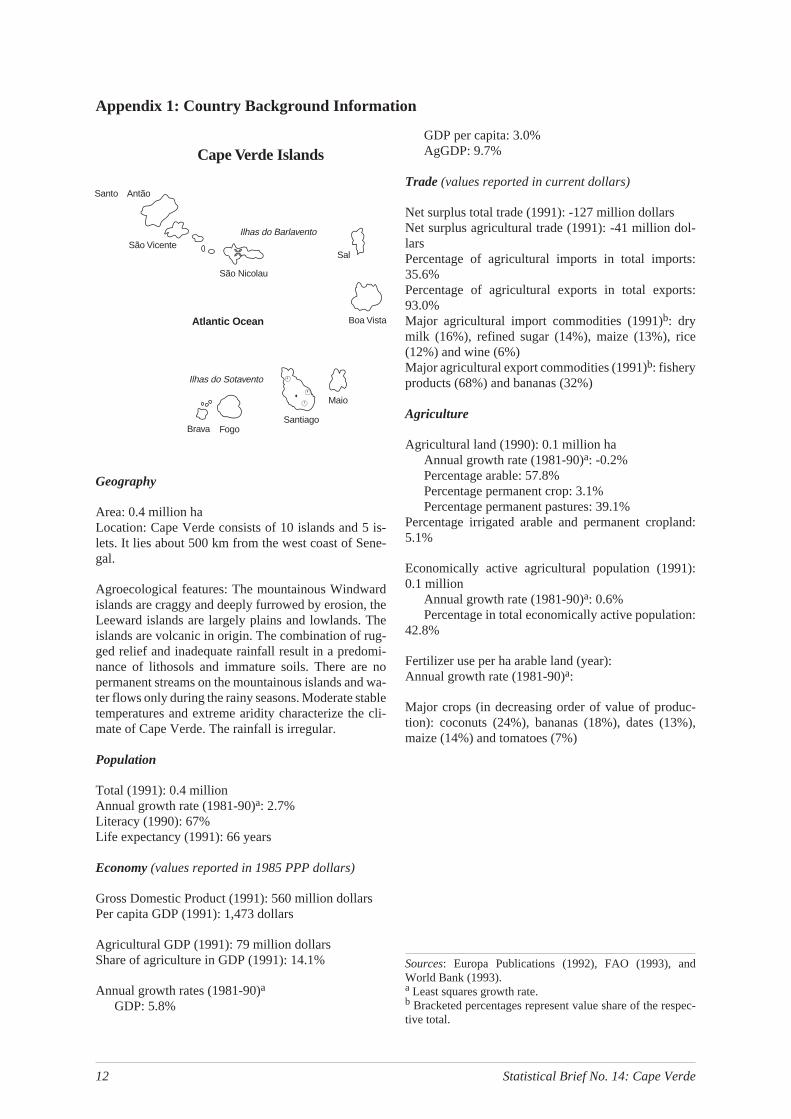
Appendix 1: Country Background Information
Geography
Area: 0.4 million haLocation: Cape Verde consists of 10 islands and 5 is-lets. It lies about 500 km from the west coast of Sene-gal.
Agroecological features: The mountainous Windwardislands are craggy and deeply furrowed by erosion, theLeeward islands are largely plains and lowlands. Theislands are volcanic in origin. The combination of rug-ged relief and inadequate rainfall result in a predomi-nance of lithosols and immature soils. There are nopermanent streams on the mountainous islands and wa-ter flows only during the rainy seasons. Moderate stabletemperatures and extreme aridity characterize the cli-mate of Cape Verde. The rainfall is irregular.
Population
Total (1991): 0.4 millionAnnual growth rate (1981-90)a: 2.7%Literacy (1990): 67%Life expectancy (1991): 66 years
Economy(values reported in 1985 PPP dollars)
Gross Domestic Product (1991): 560 million dollarsPer capita GDP (1991): 1,473 dollars
Agricultural GDP (1991): 79 million dollarsShare of agriculture in GDP (1991): 14.1%
Annual growth rates (1981-90)a
GDP: 5.8%
GDP per capita: 3.0%AgGDP: 9.7%
Trade(values reported in current dollars)
Net surplus total trade (1991): -127 million dollarsNet surplus agricultural trade (1991): -41 million dol-larsPercentage of agricultural imports in total imports:35.6%Percentage of agricultural exports in total exports:93.0%Major agricultural import commodities (1991)b: drymilk (16%), refined sugar (14%), maize (13%), rice(12%) and wine (6%)Major agricultural export commodities (1991)b: fisheryproducts (68%) and bananas (32%)
Agriculture
Agricultural land (1990): 0.1 million haAnnual growth rate (1981-90)a: -0.2%Percentage arable: 57.8%Percentage permanent crop: 3.1%Percentage permanent pastures: 39.1%
Percentage irrigated arable and permanent cropland:5.1%
Economically active agricultural population (1991):0.1 million
Annual growth rate (1981-90)a: 0.6%Percentage in total economically active population:
42.8%
Fertilizer use per ha arable land (year):Annual growth rate (1981-90)a:
Major crops (in decreasing order of value of produc-tion): coconuts (24%), bananas (18%), dates (13%),maize (14%) and tomatoes (7%)
Sources: Europa Publications (1992), FAO (1993), andWorld Bank (1993).a Least squares growth rate.b Bracketed percentages represent value share of the respec-tive total.
12 Statistical Brief No. 14: Cape Verde
Cape Verde Islands
Santo Antão
FogoSantiago
Brava
Maio
São Vicente
São Nicolau
Sal
Boa VistaAtlantic Ocean
Ilhas do Barlavento
Ilhas do Sotavento
s
À
Á
Â
Ë
Appendix 2: Definitions and concepts
NARS
The construction of quantitative and internationallycomparable expenditure, personnel, and related mea-sures of a national agricultural research system (NARS)requires a precise idea of what, in fact, is being mea-sured. Since the term NARS is subject to a variety of in-terpretations, it is necessary to define rather preciselythe NARS concept used here. Our approach adheres,wherever possible, to the internationally accepted sta-tistical procedures and definitions developed by theOECD and UNESCO for compiling R&D statistics(OECD 1981 and UNESCO 1984). For statistical pur-poses a NARS is defined in terms of the following char-acteristics:
(a) National. The concept of a “national” system usedin this report refers to domestically targeted researchactivities funded and/or executed by thepublicsector ofa particular country. A relatively broad concept of thepublic sector is taken to include government,semi-public, and academic research institutes. How-ever, private, for-profit research as well as the researchactivities of supranational research agencies that are notexecuted through national institutes are excluded. Alsoexcluded is research undertaken by short-term develop-ment projects.
(b) Agricultural. Agricultural research, as defined here,includes crop, livestock, forestry, and fisheries re-search, as well as research on agricultural inputs, thenatural resource base, and socio-economic aspects ofprimary agricultural production. It excludes, wherepossible, research concerning the off-farm storage andprocessing of agricultural products, commonly referredto as post-harvest research and food-processing re-search. This delineation corresponds with the nationalaccounts definition of the agricultural sector.
(c) Research. Research is often performed in conjunc-tion with other activities such as extension, education,and production. To the extent possible, research activi-ties (in terms of expenditures and staff) are differenti-ated from these other activities. However, ifnon-research activities were an integral part of an insti-tute’s research activities and accounted for less than20% of the resources of the institute, it was expedient toclassify all the activities of the institute as being re-search-related.
Full-Time Equivalent (FTE)
A full-time equivalent researcher year is taken to be aperson who holds a full-time position as a researcherduring the whole year. Adjustments to full-time equiva-lents have only been made when: (a) a research positionwas part-time; (b) a research position was not filled forthe whole year; or (c) if the position explicitly involved
tasks other than agricultural research. In the latter casean estimate was made of the time spent on agriculturalresearch. No adjustments were made, however, for va-cation or sick leave nor for time spent on administra-tion, meetings, travel or other activities that form part ofthe normal duties required to support a research en-deavor. Following this line of reasoning, professionalstaff in management positions were classified as re-searchers.
The degree status of researchers is determined on thefollowing basis: 3-4 years full-time university educa-tion (BSc), 5-6 years (MSc), and more than 6 years plusdoctorate thesis (PhD).
Expatriate Researcher Costs
Many expatriate researchers working on do-nor-supported projects in NARSs are paid their salariesand living expenses directly by the donor agency. All(or some substantial fraction) of these costs do not getincluded in the financial reports of the agricultural re-search organizations. To calculate theseimplicit costswe took the average cost per researcher in 1985 to be120,000 “1985 PPP dollars” and backcast this figureusing the rate of change in real personnel costs per FTEresearcher in the US state agricultural experiment sta-tion system. This extrapolation procedure makes the as-sumption that the personnel-cost trend for USresearchers is a reasonable proxy of the trend in realcosts of internationally recruited staff working inNARSs. Unless otherwise stated, FTE expatriate re-searchers were costed at $80,000 “1985 PPP dollars”per researcher for the 1961-65 period, $85,000 per re-searcher for 1966-70, $90,000 per researcher for1971-75, $110,000 per researcher for 1976-80, and$120,000 per researcher for 1981-91.
Deflators and Exchange Rates
All expenditure figures were first compiled in currentlocal currency units (appendix 5). In order to facilitatecomparisons over time and across countries these fig-ures are deflated with a local GDP deflator to base year1985, and then converted to a common currency (USdollars) using the 1985 purchasing power parity (PPP)over GDP. PPPs are synthetic exchange rates that at-tempt to reflect the purchasing power of a country’scurrency. The PPPs used here are derived from thePenn World Table (Mark 5), which is based on thebenchmark studies of the International ComparisonProject (Summers and Heston 1991). For additional in-formation on currency conversion methods in this con-text see Pardey, Roseboom, and Craig (1992).
Statistical Brief No. 14: Cape Verde 13
Nomenclature for tables in text
A zero indicates an actual observation of zero, a dashindicates an observation is not relevant (due to institu-tional mergers, closures, and so on), while “na” indi-cates an observation that is not available.
In the text we note any marked deviations from thesedata compilation norms and include points of clarifica-tion if warranted.
14 Statistical Brief No. 14: Cape Verde
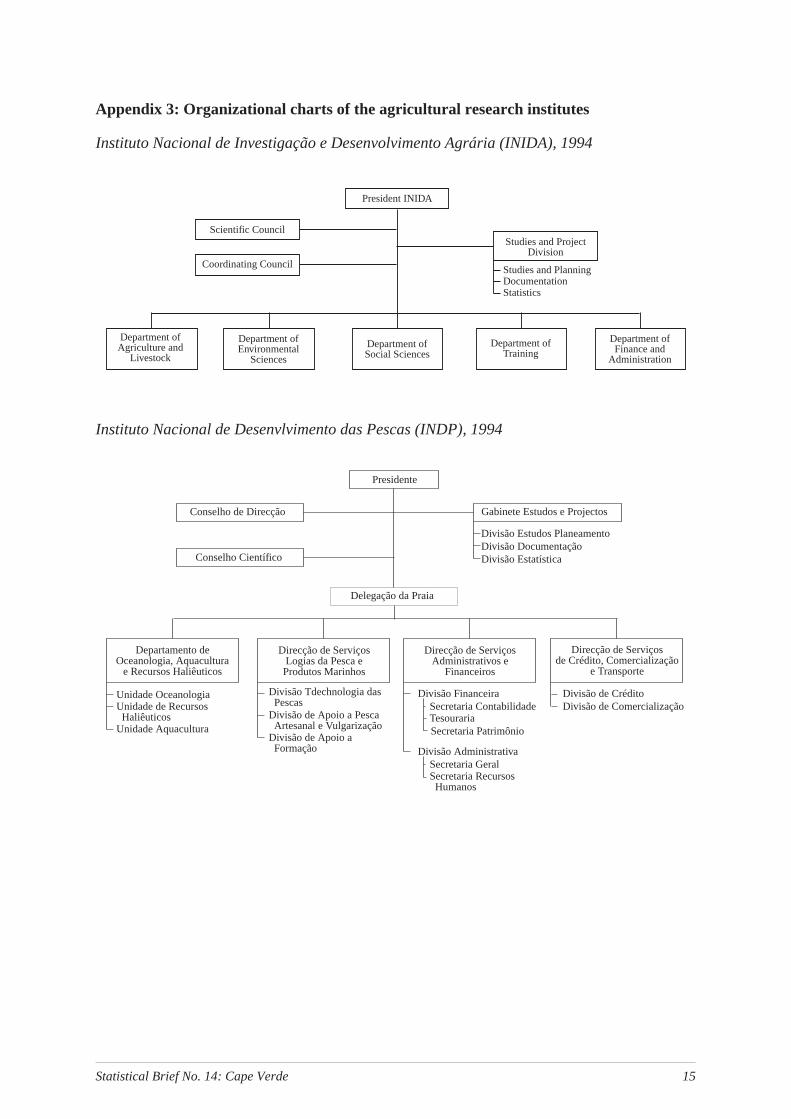
Appendix 3: Organizational charts of the agricultural research institutes
Instituto Nacional de Investigação e Desenvolvimento Agrária (INIDA), 1994
Instituto Nacional de Desenvlvimento das Pescas (INDP), 1994
Statistical Brief No. 14: Cape Verde 15
Department ofAgriculture and
Livestock
Department ofTraining
Department ofSocial Sciences
Department ofEnvironmental
Sciences
Department ofFinance and
Administration
President INIDA
Coordinating Council
Scientific CouncilStudies and Project
Division
Studies and PlanningDocumentationStatistics
Delegação da Praia
Conselho de Direcção
Conselho Científico
Presidente
Divisão DocumentaçãoDivisão Estudos Planeamento
Divisão Estatística
Gabinete Estudos e Projectos
Direcção de ServiçosLogias da Pesca eProdutos Marinhos
Departamento deOceanologia, Aquacultura
e Recursos Haliêuticos
Direcção de ServiçosAdministrativos e
Financeiros
Direcção de Serviçosde Crédito, Comercialização
e Transporte
Unidade OceanologiaUnidade de RecursosHaliêuticos
Unidade Aquacultura
Divisão de ComercializaçãoDivisão de CréditoDivisão Financeira
Secretaria ContabilidadeTesourariaSecretaria Patrimônio
Divisão AdministrativaSecretaria GeralSecretaria RecursosHumanos
Divisão de Apoio aFormação
Divisão de Apoio a PescaArtesanal e Vulgarização
Divisão Tdechnologia dasPescas
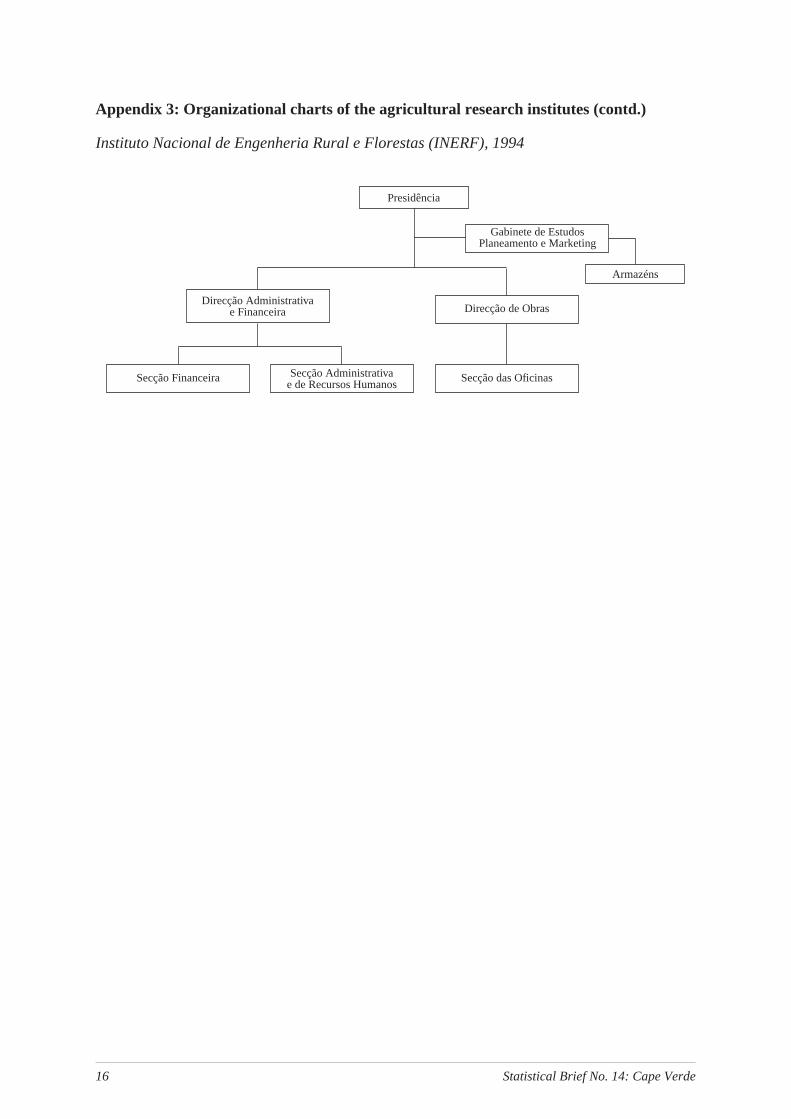
Appendix 3: Organizational charts of the agricultural research institutes (contd.)
Instituto Nacional de Engenheria Rural e Florestas (INERF), 1994
16 Statistical Brief No. 14: Cape Verde
Secção Administrativae de Recursos Humanos
Direcção Administrativae Financeira
Secção Financeira Secção das Oficinas
Gabinete de EstudosPlaneamento e Marketing
Armazéns
Presidência
Direcção de Obras
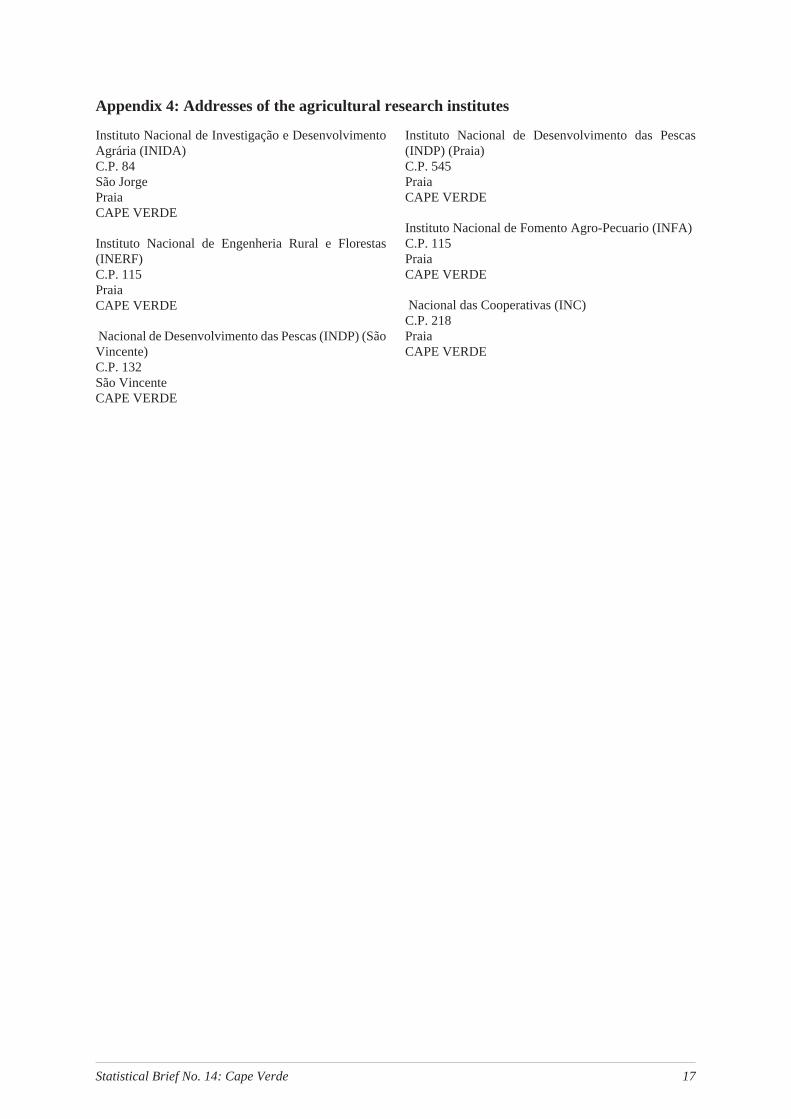
Appendix 4: Addresses of the agricultural research institutes
Instituto Nacional de Investigação e DesenvolvimentoAgrária (INIDA)C.P. 84São JorgePraiaCAPE VERDE
Instituto Nacional de Engenheria Rural e Florestas(INERF)C.P. 115PraiaCAPE VERDE
Nacional de Desenvolvimento das Pescas (INDP) (SãoVincente)C.P. 132São VincenteCAPE VERDE
Instituto Nacional de Desenvolvimento das Pescas(INDP) (Praia)C.P. 545PraiaCAPE VERDE
Instituto Nacional de Fomento Agro-Pecuario (INFA)C.P. 115PraiaCAPE VERDE
Nacional das Cooperativas (INC)C.P. 218PraiaCAPE VERDE
Statistical Brief No. 14: Cape Verde 17

18 Statistical Brief No. 14: Cape Verde
App
endi
x5:
Res
earc
her
and
rese
arch
expe
nditu
reto
tals
,197
8-91
Tot
alN
umbe
rof
FT
ER
esea
rche
rs
Cat
egor
yN
ame
inst
itute
1978
1979
1980
1981
1982
1983
1984
1985
1986
1987
1988
1989
1990
1991
1992
Gov
ernm
ent:
INID
A20
21.5
2318
2627
3126
28
CD
P*
——
——
4—
INIP
——
——
——
——
——
6
INE
RF
——
——
——
——
——
——
——
Tot
al:
36
Sou
rces
:99
999
999
999
999
999
9;12
1499
9
Not
e:Ita
liciz
edfig
ures
repr
esen
tdat
ath
atar
ein
terp
olat
ed.
*C
DP
was
mer
ged
into
INID
Ain
1992
.
Tot
alR
esea
rch
Exp
endi
ture
sC
urre
ncy:
mill
ion
Cap
eV
erde
anE
scud
os(C
VE
)
Cat
egor
yN
ame
inst
itute
1978
1979
1980
1981
1982
1983
1984
1985
1986
1987
1988
1989
1990
1991
1992
Gov
ernm
ent:
INID
A11
1.33
213
2.36
090
.632
148.
364
110.
853
126.
681
180.
211
CD
P*
——
——
—
INIP
——
——
——
——
——
INE
RF
——
——
——
——
——
——
——
Tot
al(c
urre
ntLC
U)
111.
332
132.
360
90.6
3214
8.36
411
0.85
312
6.68
118
0.21
1
GD
Pde
flato
r(1
985=
100)
52.5
756
.11
61.6
268
.94
79.5
187
.14
96.0
110
0.00
116.
4412
4.78
133.
6314
4.86
155.
3916
9.82
182.
47
Tot
al(c
onst
antm
alot
i)11
1.33
211
3.67
272
.633
111.
023
76.5
2781
.526
106.
117
Tot
al(c
onst
ant1
985
PP
Pdo
llars
)4.
876
4.97
93.
181
4.86
33.
352
3.57
14.
648
Sou
rces
:99
999
999
999
999
999
999
9
*C
DP
was
mer
ged
into
INID
Ain
1992
.
Statistical Brief No. 14: Cape Verde 19
App
endi
x6:
Res
earc
hst
affd
evel
opm
entb
yin
stitu
te,1
978-
91
Inst
ituto
Nac
iona
lde
Inve
stig
acao
Agr
aria
(IN
IA)
1978
1979
1980
1981
1982
1983
1984
1985
1986
1987
1988
1989
1990
1991
1992
Nat
iona
ls
PhD
10.
50
00
00
12
MS
c10
17.0
1813
2021
2418
18
BS
c6
00
01
00
00
Sub
tota
l17
17.5
1813
2121
2419
20
Exp
atria
tes
34.
05
55
67
78
Tot
al20
21.5
2318
2627
3126
28
Sou
rces
:46
999
999
999
999
999
999
999
Not
e:Ita
liciz
edfig
ures
repr
esen
tdat
ath
atar
eei
ther
cons
truc
ted
orin
terp
olat
ed.
Inst
ituto
Nac
iona
lde
Inve
stig
acao
Pes
ceria
(IN
IP)
1978
1979
1980
1981
1982
1983
1984
1985
1986
1987
1988
1989
1990
1991
1992
Nat
iona
ls
PhD
MS
c
BS
c
Sub
tota
l
Exp
atria
tes
Tot
al—
——
——
——
——
—6
Sou
rces
:12
14
Not
e:IN
IPis
esta
blis
hed
in19
85,b
utbe
cam
eop
erat
iona
lin
1988
.
Cen
tro
deD
esen
volv
imen
toP
ecua
rio(C
DP
)
1978
1979
1980
1981
1982
1983
1984
1985
1986
1987
1988
1989
1990
1991
1992
Nat
iona
ls
PhD
MS
c
BS
c
Sub
tota
l
Exp
atria
tes
Tot
al—
——
—4
—
Sou
rces
:12
14
Not
e:C
DP
was
mer
ged
into
INID
Ain
1992
.

Other statistical briefs published in this series are:
1. Statistical Brief on the National Agricultural Research System of Rwanda, September 1993, by J.Roseboom and P.G. Pardey.
2.* Statistical Brief on the National Agricultural Research System of Niger, September 1993, by V. Mazzucatoand S. Ly.
3. Statistical Brief on the National Agricultural Research System of Malawi, September 1993, by J. Roseboomand P.G. Pardey.
4. Statistical Brief on the National Agricultural Research System of Botswana, September 1993, by J.Roseboom and P.G. Pardey.
5. Statistical Brief on the National Agricultural Research System of Kenya, November 1993, by J. Roseboomand P.G. Pardey.
6. Statistical Brief on the National Agricultural Research System of Colombia, December 1993, by C.A.Falconi and P.G. Pardey.
7. Statistical Brief on the National Agricultural Research System of Ethiopia, April 1994, by J. Roseboom, N.Beintema, and P.G. Pardey.
8. Statistical Brief on the National Agricultural Research System of Ghana, April 1994, by J. Roseboom andP.G. Pardey.
9.* Statistical Brief on the National Agricultural Research System of Burkina Faso, April 1994, by V.Mazzucato.
10.* Statistical Brief on the National Agricultural Research System of Senegal, April 1994, by V. Mazzucato andM.E.H. Ly.
11.* Statistical Brief on the National Agricultural Research System of Mali, April 1994, by V. Mazzucato.
12.* Statistical Brief on the National Agricultural Research System of Madagascar, June 1994, by J. Roseboomand P.G. Pardey.
13. Statistical Brief on the National Agricultural Research System of Namibia, September 1994, by N.M.Beintema, P.G. Pardey, and J. Roseboom.
14. Statistical Brief on the National Agricultural Research System of Cape Verde, December 1994, by N.M.Beintema, P.G. Pardey, and J. Roseboom.
15. Statistical Brief on the National Agricultural Research System of Nigeria, December 1994, by J. Roseboom,N.M. Beintema, P.G. Pardey, and E.O. Oyedipe.
16.* Statistical Brief on the National Agricultural Research System of Côte d’Ivoire, December 1994, by J.Roseboom and P.G. Pardey.
17. Statistical Brief on the National Agricultural Research System of Mauritius, January 1995, by N.M.Beintema, P.G. Pardey, and J. Roseboom.
18. Statistical Brief on the National Agricultural Research System of Lesotho, January 1995, by N.M.Beintema, P.G. Pardey, and J. Roseboom.
19. Statistical Brief on the National Agricultural Research System of Swaziland, February 1995, by N.M.Beintema, P.G. Pardey, and J. Roseboom.
20. Statistical Brief on the National Agricultural Research System of Zimbabwe, March 1995, by J. Roseboom,P.G. Pardey, N.M. Beintema, and G.D. Mudimu.
21. Statistical Brief on the National Agricultural Research System of Zambia, August 1995, by J. Roseboomand P.G. Pardey.

22. Statistical Brief on the National Agricultural Research System of Sudan, August 1995, by N.M Beintema,P.G. Pardey, and J. Roseboom.
23. Statistical Brief on the National Agricultural Research System of South Africa, September 1995, by J.Roseboom, P.G. Pardey, H. Satorius von Bach, and J. van Zyl.
24. Statistical Brief on the National Agricultural Research System of Togo, May 1996, by N.M. Beintema, P.G.Pardey, and J. Roseboom.
* Also available in French.