Embed Size (px)
Citation preview

www.rsc.org/crystengcomm
CrystEngComm
PAPERJonas Nyman and Graeme M. DayStatic and lattice vibrational energy differences between polymorphs
Volume 17 Number 28 28 July 2015 Pages 5119–5330
CrystEngComm
Ope
n A
cces
s A
rtic
le. P
ublis
hed
on 2
3 M
arch
201
5. D
ownl
oade
d on
3/2
2/20
22 7
:08:
18 A
M.
Thi
s ar
ticle
is li
cens
ed u
nder
a C
reat
ive
Com
mon
s A
ttrib
utio
n 3.
0 U
npor
ted
Lic
ence
.
PAPER View Article OnlineView Journal | View Issue
5154 | CrystEngComm, 2015, 17, 5154–5165 This journal is © The R
School of Chemistry, University of Southampton, Southampton, UK.
E-mail: [email protected]; Tel: +44 (0)2380599174
† Electronic supplementary information (ESI) available: List of includedpolymorphs, a description of co-prime splitting for phonon k-point sampling,additional vibrational energy convergence results, force field parameters andenergy distributions split by hydrogen bonding. See DOI: 10.1039/c5ce00045a
Cite this: CrystEngComm, 2015, 17,
5154
Received 8th January 2015,Accepted 23rd March 2015
DOI: 10.1039/c5ce00045a
www.rsc.org/crystengcomm
Static and lattice vibrational energy differencesbetween polymorphs†
Jonas Nyman and Graeme M. Day*
A computational study of 1061 experimentally determined crystal structures of 508 polymorphic organic
molecules has been performed with state-of-the-art lattice energy minimisation methods, using a hybrid
method that combines density functional theory intramolecular energies with an anisotropic atom–atom
intermolecular model. Rigid molecule lattice dynamical calculations have also been performed to estimate
the vibrational contributions to lattice free energies. Distributions of the differences in lattice energy, free
energy, zero point energy, entropy and heat capacity between polymorphs are presented. Polymorphic
lattice energy differences are typically very small: over half of polymorph pairs are separated by less than
2 kJ mol−1 and lattice energy differences exceed 7.2 kJ mol−1 in only 5% of cases. Unsurprisingly, vibrational
contributions to polymorph free energy differences at ambient conditions are dominated by entropy
differences. The distribution of vibrational energy differences is narrower than lattice energy differences,
rarely exceeding 2 kJ mol−1. However, these relatively small vibrational free energy contributions are large
enough to cause a re-ranking of polymorph stability below, or at, room temperature in 9% of the poly-
morph pairs.
1 Introduction
Polymorphism, the possibility of a compound to exist in atleast two different crystalline phases,1 has important implica-tions for the development of pharmaceuticals, organic semi-conductors,2 explosives and any other material where solidstate properties must be controlled.3 Unexpected polymor-phism can have far-reaching economic and medical,4,5 as wellas legal6 consequences. For these reasons, there is a strongmotivation to develop our fundamental understanding ofpolymorphism, of property differences between polymorphsand, ultimately, the ability to predict possible polymorphs apriori.
The relative free energy determines which polymorphshould be favourable under given thermodynamic conditions.However, crystallisation does not always lead to the most sta-ble structure, with kinetic factors sometimes leading to analternative crystal packing. How large a lattice energy penaltycan be overcome by such kinetic factors? It is important tounderstand the energy differences that can exist betweenobservable polymorphs. This question is particularly relevant
in computational attempts to predict possible polymorphs ofa given molecule. The most commonly adopted approach topredicting crystal structures involves a search for the lowestenergy crystal packing possibilities, followed by an assess-ment of which low energy computer-generated structuresmight be observed.7,8 Such methods usually lead to manypossible structures and it is necessary to focus one's atten-tion on those potential polymorphs that lie in a limitedenergy range from the lowest energy possibility.
Polymorph energy differences are often said to be lessthan 10 kJ mol−1.3 A rule of thumb can be based on experi-mental determinations of polymorph relative energies, forexample from sublimation enthalpies,9 melting data,10 differ-ential scanning calorimetry,11 relative solubilities12 or solu-tion microcalorimetry.13 However, experimental collection ofa large quantity of high quality polymorph energy differencesis challenging. An alternative approach to understandingpolymorph energy differences is through computationalmodelling.
In computational studies of molecular crystals, the freeenergy is commonly approximated with the static latticeenergy, calculated either with force field or electronic struc-ture methods, such as dispersion-corrected periodic DFT14,15
or fragment-based approaches.16 While high quality latticeenergies can be achieved, this ignores the energetic contribu-tions related to the vibration of molecules about their equilib-rium positions. Omitting the vibrational contribution to thefree energy is convenient, since it simplifies the calculation,
oyal Society of Chemistry 2015

CrystEngComm Paper
Ope
n A
cces
s A
rtic
le. P
ublis
hed
on 2
3 M
arch
201
5. D
ownl
oade
d on
3/2
2/20
22 7
:08:
18 A
M.
Thi
s ar
ticle
is li
cens
ed u
nder
a C
reat
ive
Com
mon
s A
ttrib
utio
n 3.
0 U
npor
ted
Lic
ence
.View Article Online
and tempting from the computational cost point of view.This is sometimes justified by a claim that the difference invibrational energy between polymorphs is so small that itnever causes a re-ranking of the relative stability. This wasone of the conclusions of Gavezzotti and Filippini's landmark1995 study of polymorph energy differences.17 The conclu-sion stands in sharp contradiction to the many experimen-tally known temperature-dependent polymorphic transitionsand other computational studies that have demonstrated theimportance of vibrational zero-point energy and entropy dif-ferences between crystal structures.18 There is a need toreaddress the issue using up-to-date computational methods.
In this study, we present lattice energy and lattice dynami-cal studies of thermodynamic properties of a set of 1061experimentally determined crystal structures of 508 polymor-phic organic molecules, using state-of-the-art methods for lat-tice energy evaluation. This is the largest study to date ofenergetic differences between polymorphs.
2 Methods2.1 Selection of polymorph pairs
Crystal structures were obtained from the Cambridge Struc-tural Database (CSD), version 5.35 (Nov. 2013). Referencecode families of polymorphs in van de Streek's “best hydro-gens list”19,20 containing only H/D, C, N, O, F, S, and Cl wereselected, the elements for which the most reliable atom–atompotentials exist. Multicomponent structures and radicals wereremoved.
As our lattice dynamical treatment currently only includesrigid molecule motions, we assume that differences in intra-molecular vibrations between polymorphs are negligible. Thisapproximation may lead to errors when there are significantmolecular geometry differences between polymorphs, such asin conformational polymorphism. Therefore, we used theroot-mean-square deviation (RMSD) of atomic coordinates formolecules in different polymorphs (calculated using TORMAT,21
excluding hydrogen atom positions) to exclude structureswith large intramolecular differences. Cruz-Cabeza and Bern-stein22 showed that polymorphs tend to have very similarmolecular conformations, and that an RMSD of atomic coor-dinates of up to 0.225–0.3 Å usually corresponds to slightadjustments of the same molecular conformer. We observeessentially the same distribution as Cruz-Cabeza and Bern-stein22 (see Fig. S12 in ESI†) and set our limit to 0.25 Å, toexclude structure pairs where molecular geometry differencesexceeded this value.
The symmetries of structures with non-integer Z′ weremodified to include whole molecules in the asymmetric unit.Structures with more than 65 atoms in the asymmetric unitwere excluded to limit the computational cost of the flexiblemolecule energy minimisation. Missing hydrogen atoms wereadded based on conventional geometric criteria wheneverthis could be done unambiguously and deuterium atomswere substituted by hydrogen in deuterated structures. Struc-tures with disorder or incorrectly placed hydrogen atoms
This journal is © The Royal Society of Chemistry 2015
were excluded. A small number of structures had to beexcluded because of limitations in the energy-minimisationmethod applied here, as described below.
Lattice dynamics calculations require that the Hessian ispositive definite, i.e. that the crystal structure is a true poten-tial energy minimum. For a few structures, this was not thecase and the crystal is thus unstable with respect to symme-try breaking. For these structures, we removed all crystallo-graphic symmetry and performed the lattice dynamics calcu-lations on the P1 unit cell. If the structure was still unstable,it was discarded.
The final structure set (see list in ESI†) consisted of 1061crystal structures in 508 polymorphic clusters forming 466polymorph pairs, 39 triplets and 3 quadruplets, yielding 601pairwise comparisons of polymorph energies. The structureswere analysed for the presence of hydrogen bonds with theprogram PLATON.23 654 crystal structures in 310 clusters arefound to contain hydrogen bonds and 507 structures in 198clusters do not form hydrogen bonds. Structures are referredto by their CSD reference codes throughout. Our set of struc-tures is three times larger than that used in the largest previ-ous study17 of polymorph energetics that we are aware of.
2.2 Lattice energy minimisation
Lattice energies were calculated from a hybrid model, com-bining a DFT model for the intramolecular energy with anatom–atom model of intermolecular interactions:
Elatt = EDFTintra + Eatom−atominter . (1)
Intramolecular energies and molecular geometries werecalculated at the B3LYP/6-311GIJd,p) level of theory.
The intermolecular interaction energy between moleculesM and N was modelled with an anisotropic model potentialof the form:
E A B C Er rMNi k
ik ik ikintermolecular elec= ( ) 6
,exp
(2)
where i, k are atoms of type ι and κ belonging to molecules Mand N, respectively, separated by the distance rik. The first twoterms model the repulsive and attractive non-electrostaticintermolecular interactions, with parameters Aικ, Bικ and Cικ
determined through empirical parameterisation. The finalterm, describing electrostatic interactions, was calculated fromatom-centered multipoles up to rank 4 (hexadecapole) on allatoms,24,25 obtained from a distributed multipole analysis26 oftheB3LYP/6-311GIJd,p) charge density usingGDMA.27 This electro-static model accurately models the effects of non-sphericalfeatures of electron densities, such as lone pairs and π-electrondensity, and the resulting directionality of intermolecular inter-actions such as hydrogen bonding and arene–arene interac-tions. Charge–charge, charge–dipole and dipole–dipole interac-tions were calculated using Ewald summation, while repulsion–dispersion interactions and all higher multipole–multipoleinteractions were calculated to a cutoff distance of 15 Å.
CrystEngComm, 2015, 17, 5154–5165 | 5155

CrystEngCommPaper
Ope
n A
cces
s A
rtic
le. P
ublis
hed
on 2
3 M
arch
201
5. D
ownl
oade
d on
3/2
2/20
22 7
:08:
18 A
M.
Thi
s ar
ticle
is li
cens
ed u
nder
a C
reat
ive
Com
mon
s A
ttrib
utio
n 3.
0 U
npor
ted
Lic
ence
.View Article Online
A recently revised28,29 version of the Williams99 exp-6potential30 was used. The re-parametrisation was performedto optimise the performance of the potential for use withatomic multipole electrostatics. Parameters for sulfur weretaken from Abraha and Williams,31 using conventional com-bining rules for S⋯X interactions. All halogen atoms weretreated as having an anisotropic repulsion, as described pre-viously.25,32 The revised Williams99 parameters, and thosefor F and Cl are provided in the supplementary information.The Williams99 potential requires a foreshortening of allX–H bonds by 0.1 Å.
All crystal structures were lattice energy-minimisedthrough the CRYSTALOPTIMIZER program,33,34 which mini-mises the sum of the intra- and intermolecular energies withrespect to selected intramolecular degrees of freedom, as wellas crystal packing degrees of freedom (molecular orientation,rotation and unit cell parameters). CRYSTALOPTIMIZERperforms flexible-molecule crystal structure optimisation byiteratively computing the molecular geometry and energy at theDFT level of theory with GAUSSIAN 09 (ref. 35) underthe constraints of the crystal packing forces calculated fromthe intermolecular potential, using the crystal structuremodelling program DMACRYS25 for intermolecular energycalculations.
This lattice energy minimisation method includes thestrain on the molecules resulting from the crystal packingforces on a set of intramolecular degrees of freedom, usuallychosen as flexible torsions and bond angles. These degrees offreedom are optimised in response to intermolecular interac-tions. The computational cost increases with the number offlexible degrees of freedom. To process the large number ofcrystal structures, we implemented an algorithm in Python toautomatically select the flexible degrees of freedom that weconsidered most important for accurately modelling theimpact of crystal packing on molecular geometry:
• All covalent bond lengths are optimised without consid-ering packing forces.;
• To accurately model hydrogen bond geometries, bondangles and dihedrals containing a polar hydrogen atom(−OH, −NH, −SH) are considered flexible and optimisedunder the influence of packing forces.;
• All exocyclic bonds are considered rotatable. Dihedralangles around these bonds are optimised under the influenceof crystal packing forces.;
• All dihedrals and angles in rings of 3-coordinated car-bon atoms (e.g. phenyl rings) are treated as unaffected bypacking forces.;
• All dihedrals and angles, except those with polar H, infive- or six-membered heterorings of nitrogen and 3-coordi-nated carbons are optimised without considering packingforces.;
• Any remaining dihedrals (e.g. in heterorings with S or O)are optimised subject to packing forces.
Since GAUSSIAN requires bond angles to be between 0° and180° and to prevent angles containing an sp1-hybridized car-bon (i.e. CC and CN triple bonds) from exceeding 180°, such
5156 | CrystEngComm, 2015, 17, 5154–5165
angles were constrained to 179.99°. These rules are adequatefor practically all molecules, but fail for GLYCIN, XELLEFand BEWYUY. Glycine (GLYCIN) crystallizes in zwitterionicform. During energy minimisation with our method, one pro-ton moves from the amino group to the carboxyl group.BEWYUY and XELLEF contain triple bonds that are sensitiveto packing forces, so our constraint on near-linear angles isinappropriate. In this study we have ignored the PV contribu-tion to the (Gibbs) free energy, resulting in errors for high-pressure polymorphs with significant differences in density.Two polymorph pairs (FIGYID, ACRLAC) were identifiedwhere the PV-term is not negligible. These five polymorphfamilies have therefore been excluded from the currentstudy.
2.3 Free energy calculations
All vibrational contributions to crystal free energies are calcu-lated from harmonic phonon frequencies calculated at theoptimised crystal structure geometries. Lattice dynamics the-ory36,37 and its adaptation to the dynamics of rigid molecularcrystals38–40 has been described in detail elsewhere. Rigidmolecule lattice dynamics are implemented in the DMACRYSsoftware for computating phonons using anisotropic atom–
atom potentials.41,42
Harmonic phonons can be considered as non-interactingquantum harmonic oscillators with angular frequencies ωi.The resulting partition function is
Zk T
Ti
i
ivib
B
B
=2
1,
,
,
,k
k
k
exp
exp
�
�
k
(3)
where kB is Boltzmann's constant and ℏ is the reduced Planckconstant. The product is over all vibrational modes, i, and allpoints in reciprocal space, k. A crystal with Z rigid moleculesin the unit cell has 6Z vibrational modes at each k-point. Oursampling of reciprocal space is described below.
The vibrational contribution to the free energy Fvib is then
Fvib(T) = − kBT ln Zvib, (4)
which can be calculated directly from the phonon spectrumas
F T TTi
ii
ivib B
B
( ) = 12
1 .,
,,
,
kk
k
k
�
�
k
kln exp (5)
The first term is the vibrational zero point energy, ZPE, whilethe second term is the thermal contribution to the freeenergy. The Helmholtz free energy A is obtained as
A(T) = Elatt + Fvib(T), (6)
and the entropy S is obtained from the derivative of the freeenergy with respect to temperature:
This journal is © The Royal Society of Chemistry 2015

Fig. 1 Chemical diagrams of selected molecules: a) theophylline (CSDrefcode: BAPLOT); b) maleic hydrazide (MALEHY); c) 3,4-cyclobutylfuran(XULDUD); d)meso-1,2-diacetoxy-1,2-bisIJ9-anthryl)ethane (JARXUV); e)3,5-diphenyl-4-amino-1,2,4-triazole (UKANOJ); f) dimethyl-4,4′-IJ1,3,4-oxadiazole-2,5-diyl)diphenylenedicarboxylate (BEBMAX) and g) 2-amino-5-nitropyrimidine (PUPBAD).
CrystEngComm Paper
Ope
n A
cces
s A
rtic
le. P
ublis
hed
on 2
3 M
arch
201
5. D
ownl
oade
d on
3/2
2/20
22 7
:08:
18 A
M.
Thi
s ar
ticle
is li
cens
ed u
nder
a C
reat
ive
Com
mon
s A
ttrib
utio
n 3.
0 U
npor
ted
Lic
ence
.View Article Online
S TT
T
i
i
ii
( ) = 1
1
,
,
,,
kkBBk
k
kk
ln exp
exp
�
�
�
�
i
i
T
T
,
,1
k
k
k
k
B
B
exp
(7)
The heat capacity is calculated as:
C T kk T
k T
k Ti
i
i
i
v BB
B
B
( ) =,
,2
,
,k
k
k
k
��
�
exp
exp
12 (8)
The accuracy of calculated vibrational energy contribu-tions depends on how well the calculations reproduce thetrue vibrational frequencies, and on the sampling of recipro-cal space used in calculating the partition function (eqn (3)).Phonon calculations using the form of anisotropic atom–
atom potentials employed here have previously been shownto reproduce observed frequencies from terahertz spectro-scopy with good accuracy,43,44 so that errors due to inaccura-cies of the model potential should be small. The latticedynamics implementation in DMACRYS only provides pho-nons calculated at the Brillouin zone centre (k = 0). Non-zerok-vectors were sampled by generating supercells of the origi-nal unit cell; the vibrational modes of a (N, M, P) supercellinclude N × M × P distinct k-points of the original cell. Toensure that our calculated energies are converged withrespect to sampling of k-points, it is important to sample aswidely as possible between k = 0 and the edge of the firstBrillouin zone. However, to obtain k-points close to 0 usingthe supercell method can require very large supercells andprohibitively long computational times. To keep computa-tional costs manageable, we sampled k-points using combi-nations of “linear” supercells, each expanded along a singlelattice vector. Phonon frequencies from a series of supercellsare then combined. For cubic, tetragonal and orthorhombicunit cells, the linear supercell expansion leads to k-pointsampling along the reciprocal unit cell axes a*, b*, c*. Inlower symmetry crystal systems, the sampling is not necessar-ily along the reciprocal lattice vectors, but should adequatelysample the dependence of phonon frequency on orientationin reciprocal space.
In testing the convergence of calculated thermodynamicproperties with respect to k-point sampling, we set targetk-point distances along each reciprocal space direction(length in reciprocal space per k-point). A particular targetlength defined a number of k-points in that direction and,thus, the length of the supercell. Elongated supercells weresplit into several smaller supercells that sample approxi-mately the same number of unique k-points (see ESI† for adescription), providing a nearly equivalent k-point samplingat a reduced computational cost. The individual supercells ineach direction are chosen to have mutually co-prime supercell
This journal is © The Royal Society of Chemistry 2015
expansion coefficients, ensuring that each supercell samples aunique set of k-points (apart from k = 0, whose duplicates wereremoved prior to computing thermodynamic properties).
Ambient conditions are most relevant for understandingthe energetic aspects of polymorphism, so all thermodynamicproperties reported here are calculated at T = 300 K. So asnot to exclude weakly bound crystal structures, we did notattempt to excude structures with melting points below300 K.
3 Results and discussion3.1 Free energy convergence with phonon sampling
The convergence of Helmholtz energy, entropy, zero pointenergy and heat capacity with respect to k-point samplingwas studied to decide on a sampling density that gives suffi-ciently small errors in calculated thermodynamic quantities,while maintaning the computational efficiency required toevaluate properties of all 1061 crystal structures. In his inves-tigation of vibrational energy contributions in crystal struc-ture prediction, van Eijck18 found that 50 randomly chosenk-points provided converged thermodynamic properties.However, the number of k-points necessary for convergenceis not the same for different crystal structures, but dependson the size and contents of the unit cell. Therefore, insteadof targetting a set number of k-points, we studied conver-gence with respect to the distance (in reciprocal space)between sampled k-points. We believe that this provides auniform treatment of crystal structures.
Convergence of thermodynamic properties was investi-gated for a set of four polymorph pairs of theophylline (CSDrefcode family BAPLOT), two polymorph pairs of maleichydrazide (MALEHY) and the pair of 3,4-cyclobutylfuran(XULDUD) polymorphs (Fig. 1), chosen to represent crystalstructures with varying types and strengths of intermolecularinteractions. The structures for theophylline polymorphs VIand VII were taken from Eddleston et al.45 and Eddlestonet al.46 The crystal structures were geometry optimised, asdescribed above, before the lattice dynamics calculation wereperformed for a series of k-point sampling densities.
CrystEngComm, 2015, 17, 5154–5165 | 5157

CrystEngCommPaper
Ope
n A
cces
s A
rtic
le. P
ublis
hed
on 2
3 M
arch
201
5. D
ownl
oade
d on
3/2
2/20
22 7
:08:
18 A
M.
Thi
s ar
ticle
is li
cens
ed u
nder
a C
reat
ive
Com
mon
s A
ttrib
utio
n 3.
0 U
npor
ted
Lic
ence
.View Article Online
Fig. 2 shows the convergence of the difference in heatcapacity and entropy for the 7 polymorph pairs. The error ismeasured relative to the best estimate of ΔS and ΔCv calcu-lated at a very dense k-point sampling of 0.08 Å−1.
At the largest k-point distance, only k = 0 is sampled,clearly giving unacceptable results and errors in relativeentropies exceeding 10 J mol−1 K−1 (corresponding to errorsof 2–3 kJ mol−1 in ΔA). We find that it is necessary to sampleseveral, but not very many, k-vectors to achieve sufficientlyconverged thermodynamic properties. Heat capacity differ-ences converge relatively easily (Fig. 2a), while entropy differ-ences converge more slowly (Fig. 2b).
Based on these, and additional convergence testsdescribed elsewhere,47 we have chosen a target k-point dis-tance of 0.12 Å−1 for the polymorph pair calculations, corre-sponding to 15 k-vectors on average per structure, though
5158 | CrystEngComm, 2015, 17, 5154–5165
Fig. 2 Convergence of a) relative heat capacities and b) relativeentropies with respect to the k-point sampling for a set of polymorphsof theophylline (indicated by Roman numerals), maleic hydrazide and3,4-cyclobutylfuran. The x-axis indicates the target k-point samplingdistance (smaller values indicating a denser sampling). Errors in relativevalues are calculated relative to the densest k-point sampling (0.08 Å−1).
with a large variance. With this sampling, we estimate thatthe errors caused by the finite k-point sampling should usu-ally be less than 1 J mol−1 K−1 in ΔS and 1 kJ mol−1 for the dif-ference in total vibrational energy between polymorphs.
3.2 Overall energetic contributions
We first inspect the distribution of lattice energy differencesbetween polymorphs (Fig. 3a). These are the total differencesin the sum of intermolecular and intramolecular energies,calculated for the static, lattice energy minimised structures.Our results confirm the validity of the rule-of-thumb that
This journal is © The Royal Society of Chemistry 2015
Fig. 3 Distributions of the absolute value of calculated differences ina) lattice energies, b) vibrational energies and c) Helmholtz freeenergies between polymorphs. Vibrational energies and free energiesare calculated at a temperature of 300 K. One data point (thepolymorph pair UKANOJ/01), at ΔElatt = 18.5 kJ mol−1 and ΔA = 18.2 kJmol−1 is off the scale of plots (a) and (c).

Fig. 4 Differences in lattice energy, Elatt, and total vibrationalcontributions to the free energy, Fvib, between polymorphs. The orderof polymorphs is defined so that ΔElatt is positive in all cases. ΔFvib iscalculated at T = 300 K. The shading indicates areas where ΔElatt andΔFvib are the same sign (red), ΔElatt and ΔFvib are of opposite sign(yellow and green) and where ΔFvib causes a re-ordering of polymorphstability at 300 K (green). Green and red data points denote structureswith and without hydrogen bonds, respectively.
CrystEngComm Paper
Ope
n A
cces
s A
rtic
le. P
ublis
hed
on 2
3 M
arch
201
5. D
ownl
oade
d on
3/2
2/20
22 7
:08:
18 A
M.
Thi
s ar
ticle
is li
cens
ed u
nder
a C
reat
ive
Com
mon
s A
ttrib
utio
n 3.
0 U
npor
ted
Lic
ence
.View Article Online
polymorph lattice energy differences are less than 10 kJ mol−1
(ref. 3); only 1.5% of polymorph pairs included in this studyexceed 10 kJ mol−1 in relative lattice energy. Indeed, most lat-tice energy differences are much smaller: over half (52.7%) ofpolymorph pairs are separated by less than 2 kJ mol−1 and95% by less than 7.2 kJ mol−1. Measured in percent, the lat-tice energy difference is less than 8% in all but a few cases(see Fig. S1 in ESI†).
Lattice energy differences are generally dominated by dif-ferences in intermolecular interactions, with 68.5% of poly-morph pairs differing in intramolecular energy by less than 1kJ mol−1 (see Fig. S12 in the ESI†). This is, in part, due to ourselection of polymorphs with small intramolecular geometrydifferences. The range in intramolecular energies that wefind is in broad agreement with our recent study of confor-mational energies in molecular crystals.48 In rare cases, intra-molecular energy differences reach 15–20 kJ mol−1, where ahigh energy conformation is found in one polymorph. Thelargest intramolecular energy differences that we find areassociated with changes in hydrogen atom positions that leadto a switch between inter- and intramolecular hydrogenbonding. This type of conformational polymorphism is a par-ticularly difficult challenge for computational methods.49 Inall cases of large intramolecular energy differences, the intra-molecular penalty is compensated by improved inter-molecular interactions in the polymorph containing thehigher energy molecular conformation.
Differences in the total vibrational contribution to freeenergy at 300 K are generally smaller in magnitude (Fig. 3b).|ΔFvib| is calculated to be less than 1 kJ mol−1 in more than70% of polymorph pairs and is greater than 2 kJ mol−1 infewer than 6% of cases. Due to the small magnitude of ΔFvibbetween polymorphs, and recalling that ΔA = ΔElatt + ΔFvib,the overall distribution of free energy differences (Fig. 3c)closely resembles the distribution of lattice energy differ-ences: 56.6% of pairs are separated by less than 2 kJ mol−1 incalculated free energy, 95% are below 6.4 kJ mol−1 and thefree energy difference of only 0.5% of polymorph pairsexceeds 10 kJ mol−1.
Despite the small contributions of Fvib to polymorph freeenergy differences, these results should not be interpreted asdemonstrating the unimportance of lattice vibrational contri-butions to polymorph relative stabilities. Fig. 4 shows the lat-tice energy difference and ΔFvib data together for all poly-morph pairs, and demonstrates that there is only a weakcorrelation between the two quantities.
As a consequence, there are cases where Fvib reinforces thestatic lattice energy difference (the shaded red region inFig. 4), as well as cases where ΔFvib and ΔElatt have oppositesign (the yellow and green shaded regions in Fig. 4). The lat-ter case, where ΔFvib counteracts ΔElatt, is more common:dynamical energy contributions (Fvib) reduce the energy dif-ference between polymorphs in 69% of pairs included in thisstudy. The free energy curves of these pairs will cross at sometemperature, leading to an enantiotropic phase transition ifthe crossing temperature falls below their melting point. The
This journal is © The Royal Society of Chemistry 2015
shaded green area in Fig. 4 highlights those polymorph pairswhere ΔFvib is greater than, and of opposite sign, to ΔElatt at300 K, leading to a change in order of stability of the poly-morph pair; this is the case for 9% of polymorph pairs.
3.3 Contributions to ΔFvib
The total vibrational contribution to the free energy differ-ence between polymorphs is a sum of the zero point energy,thermal contribution to the internal energy and entropiccontribution:
ΔFvib = ΔZPE +R T0ΔCv(T)dT − TΔS. (9)
Vibrational zero point energy is a minor contribution tothe relative stability of polymorphs (Fig. 5a). ΔZPE is lessthan 0.33 kJ mol−1 in 95% of polymorph pairs and the largestcalculated difference is just over 0.7 kJ mol−1.
Molar heat capacities do not vary greatly from theirexpected equipartition value. Since our lattice dynamicaltreatment excludes intramolecular vibrations, each moleculehas six vibrational degree of freedom (3 translational and 3rotational) and the calculated Cv ≈ 6R (Fig. 6). This is theexpected result at room temperature, since the entire phonondensity of states for almost all crystal structures falls belowkBT (208.5 cm−1 at 300 K), so that there is significant thermalpopulation of energy levels for all vibrational modes. As aconsequence, heat capacity differences between polymorphsare very small (Fig. 5b): in 95% of polymorph pairs, Cv differsby less than 0.46 J mol−1 K−1.
Entropy differences are, at room temperature, an order ofmagnitude larger than the thermal contribution to internalenergy (Fig. 5c) and entropy is by far the most important
CrystEngComm, 2015, 17, 5154–5165 | 5159

Fig. 5 Distributions of the differences in vibrational a) zero pointenergy, b) heat capacity and c) entropy between polymorphs. Heatcapacities and entropies are calculated at 300 K. One data point (thepolymorph pair BEBMAX/01), at ΔS = 20.0 J mol−1 K−1 is off the scale ofplot (c). This value is discussed in the text.
Fig. 6 Distribution of heat capacities calculated at 300 K for all 1061crystal structures. Only intermolecular vibrational mode contributionsare included.
CrystEngCommPaper
Ope
n A
cces
s A
rtic
le. P
ublis
hed
on 2
3 M
arch
201
5. D
ownl
oade
d on
3/2
2/20
22 7
:08:
18 A
M.
Thi
s ar
ticle
is li
cens
ed u
nder
a C
reat
ive
Com
mon
s A
ttrib
utio
n 3.
0 U
npor
ted
Lic
ence
.View Article Online
vibrational contribution to polymorph free energy differ-ences. As with all of our observed distributions, entropy dif-ferences are often small: 50.7% of calculated ΔS are below 2 Jmol−1 K−1, corresponding to only 0.6 kJ mol−1 at 300 K. How-ever, ΔS is greater than 5.4 J mol−1 K−1 in 10% of polymorphpairs and exceeds 6.8 J mol−1 K−1 in 5% of pairs, correspond-ing to a 2 kJ mol−1 contribution to the room temperaturefree energy difference. These largest entropy differences areimportant when compared to the static lattice energy differ-ences, which are less than 2 kJ mol−1 in over half the poly-morph pairs. Vibrational effects are most important in thecases where large entropy differences are coupled with smalllattice energy differences.
5160 | CrystEngComm, 2015, 17, 5154–5165
Two caveats to these results are that i) vibrational energycontributions have been calculated in the rigid moleculeapproximation, and ii) non-vibrational contributions to theentropy have not been included. While molecular flexibilityand intramolecular energy differences are fully accounted forduring geometry optimisation and in our lattice energy calcu-lations, the rigid molecule lattice dynamical treatment meansthat intramolecular vibrational frequencies are ignored. Thisapproximation will affect the absolute thermodynamic quan-tities; for example, heat capacities (Fig. 6) will be significantlyunderestimated for molecules where intramolecular vibra-tions are near or below kBT. However, the focus here is on dif-ferences in thermodynamic quantities between polymorphsand we expect that intramolecular vibrational energy differ-ences will only be important in specific cases, such as confor-mational polymorphism. For this reason, inclusion of intra-molecular vibrations using the hybrid energy model (eqn (1))will be a focus of future work. In terms of non-vibrationalentropy contributions, disorder is expected to be the othermain source of entropy differences between polymorphs.Greater static or dynamic disorder in one polymorph thananother can easily lead to entropy differences that match orexceed the vibrational entropy differences.50–52 These contri-butions must be considered when disorder is present in oneor more polymorphs.
3.4 Physical origins of entropy differences
The thermodynamic properties described in this section arefunctions of the phonon density of states, and differences inentropy, heat capacity and zero point energy arise from varia-tions in the distribution of lattice vibrational frequenciesbetween polymorphs. Calculated phonon frequencies fall inthe range between 4 and 220 cm−1 – a wider frequency bandthan was observed by Gavezzotti and Filippini17 – and thedistribution of frequencies in this range can vary significantlybetween polymorphs. As an example, Fig. 7a shows the vibra-tional frequency distributions in theophylline forms I and II.Form II is favoured by lattice energy and is known to be thethermodynamically more stable of forms I and II at low tempera-tures.53 However, form I displays a lower frequency distribution
This journal is © The Royal Society of Chemistry 2015

Fig. 7 The phonon density of states for a) theophylline polymorphs Iand II and b) the two monoclinic polymorphs of maleic hydrazide. Thetarget k-point sampling is 0.12 Å−1 in all cases. The densities of stateshave been normalized to 1.
CrystEngComm Paper
Ope
n A
cces
s A
rtic
le. P
ublis
hed
on 2
3 M
arch
201
5. D
ownl
oade
d on
3/2
2/20
22 7
:08:
18 A
M.
Thi
s ar
ticle
is li
cens
ed u
nder
a C
reat
ive
Com
mon
s A
ttrib
utio
n 3.
0 U
npor
ted
Lic
ence
.View Article Online
than form II. This leads to a relatively large difference inentropy (ΔS = 6.5 J mol−1 K−1) favouring form I and anenantiotropic phase transition between these structures,which is known to occur at high temperatures.53 By contrast,many pairs of polymorphs have very similar distributions ofvibrational frequencies, leading to smaller differences inentropy: for example, Fig. 7b shows the density of states of
This journal is © The Royal Society of Chemistry 2015
the two monoclinic polymorphs of maleic hydrazide, whosevibrational entropies differ by only 0.84 J mol−1 K−1 (polymorphMH3,54MALEHY12, having the slightly higher entropy).
A pertinent question is what causes these differences invibrational frequencies. In the examples quoted above, thetheophylline polymorphs I and II differ in which atoms areinvolved in hydrogen bonding, while maleic hydrazide formsthe same hydrogen bonding in both polymorphs. Differencesin strong intermolecular interactions undoubtedly lead to dif-ferent vibrational spectra and, sometimes, differences inthermodynamic properties. However, a detailed analysis ofinteractions in 1061 crystal structures is not possible.Instead, we ask if a coarser description of structural differ-ences is useful.
Our results demonstrate a weak (R2 = 0.09), but statisti-cally significant, correlation between lattice energy and den-sity differences between polymorphs (Fig. 8a). The denserpolymorph tends to have a lower (i.e. more stable) latticeenergy. Structures with lower density are often assumed tovibrate with lower frequencies, due to molecules having morefree space to move, and hence might be expected to havehigher entropy. There is indeed such a trend in our findings(Fig. 8b). As with lattice energy, the correlation is extremelyweak (R2 = 0.06), but statistically significant. A lower densitypolymorph tends to have more vibrational entropy. Both cor-relations represent trends across a large set of polymorphpairs and are not predictive for individual cases. In terms offree energy, the trends in lattice energy and vibrationalentropy compensate each other, contributing to the findingthat Fvib usually lowers polymorph energy differences. How-ever, the scatter in Fig. 8 shows that other factors, such asdetailed structural features and specific intermolecular inter-actions, often dominate the bulk trend. Nevertheless, entropycan be expected to contribute a stabilising effect for poorlypacked crystal structures, such as clathrates and inclusioncompounds.
Strong directional interactions, and hydrogen bonds inparticular, might interfere with the close-packing of crystalsand cause differences in density and entropy between poly-morphs. We have therefore examined if there are any differ-ences in the distributions of ΔFvib and ΔS between poly-morphs for molecules with and without hydrogen bonds(green and red data points, respectively, in Fig. 4, 8, 9 andadditional figures in the ESI†). We find no evidence for a dif-ference in distribution of thermodynamic property differ-ences between polymorphs based on the presence or absence ofhydrogen bonding.
3.5 Outliers and particular observations
The largest lattice and free energy difference (ΔElatt = 18.5, ΔA =18.2 kJ mol−1) is between the polymorphs of 3,5-diphenyl-4-amino-1,2,4-triazole (UKANOJ/01, Fig. 1e). The reason is thedramatically different hydrogen bonding motifs in these struc-tures. The more stable UKANOJ01 has a stable 3-dimensionalnetwork of strong N–H⋯N hydrogen bonds, while UKANOJ
CrystEngComm, 2015, 17, 5154–5165 | 5161

Fig. 8 Differences in a) lattice energy and b) entropy vs. densitydifferences between polymorphs. Polymorphs in each pair are orderedsuch that the density difference is positive. Green and red data pointsdenote structures with and without hydrogen bonding. The correlationin both cases is statistically significant to p < 10−9.
CrystEngCommPaper
Ope
n A
cces
s A
rtic
le. P
ublis
hed
on 2
3 M
arch
201
5. D
ownl
oade
d on
3/2
2/20
22 7
:08:
18 A
M.
Thi
s ar
ticle
is li
cens
ed u
nder
a C
reat
ive
Com
mon
s A
ttrib
utio
n 3.
0 U
npor
ted
Lic
ence
.View Article Online
forms an unfavourable structure with unusually long hydro-gen bonds.
We also calculate a large difference in lattice energy ΔElatt =14.5 kJ mol−1 for the polymorph pair JARXUV/01 (Fig. 1d).This is one of the largest molecules in our set, so the latticeenergies are large in magnitude. While the percentage latticeenergy difference (8%) for this pair is also one of the largestin our set, the value is less exceptionally large. In discussingpolymorphs of molecules of different size, percentage latticeenergy differences may be more meaningful than absolutedifferences. Also, for this pair, the vibrational energy stabilisesthe higher energy polymorph (JARXUV01) by 1.55 kJ mol−1,so the free energy difference is less extreme than the latticeenergy difference.
For the polymorph pair BEBMAX/01 (Fig. 1f), we calculateone polymorph (BEBMAX) to have 20 Jmol−1 K−1 higher entropy
5162 | CrystEngComm, 2015, 17, 5154–5165
than the other at 300 K. BEBMAX has very anisotropic unit celldimensions and turns out to be particularly sensitive to thephonon k-point sampling. ΔS is still large (9.14 J mol−1 K−1),but less extreme with a finer 0.08 Å−1 sampling.
3,4-Cyclobutylfuran (XULDUD, Fig. 1c) was a target in thefirst blind test of crystal structure predictions.55 It was laterdiscovered that XULDUD was highly unstable and a dis-appearing polymorph. Our calculations show that the XULDUDstructure is located at a saddle point on the potential energysurface and symmetry breaking results in a stable Z′ = 2structure. The lowering in energy is small and the observedstructure is probably a thermal average over the symmetry-broken minima. A similar phenomenon was found for only ahandful of crystal structures.
The polymorphs of 2-amino-5-nitropyrimidine (PUPBAD/01/02, Fig. 1g), have attracted some interest before. Anattempt to calculate their relative stability and to rationalizetheir polymorphic behaviour was reported by Aakeröy et al.56
They concluded that the orthorhombic form III (PUPBAD)has the lowest lattice energy, but quantification of energy dif-ferences was limited by difficulties in treating molecular flexi-bility with their computational methods. Thermal (DSC) stud-ies were also inconclusive. Indeed, by lattice energy, we findthat form III (PUPBAD) is much more stable than forms I(PUPBAD01, ΔElatt = 6.7 kJ mol−1) and II (PUPBAD02, ΔElatt =7.4 kJ mol−1). However, neglecting vibrational effects in thesepolymorphs is misleading. The entropy differences are excep-tionally large (ΔS = 12 J mol−1 K−1 and 14 J mol−1 K−1 respec-tively) so that by 330 K, all three have essentially the samefree energy. This helps explain why the three polymorphscrystallise concomitantly.56
3.6 Implications for crystal structure prediction
The results of this study should be valuable for discussionand analysis of polymorphism in general. An understandingof the expected energy differences between polymorphs formsa foundation for examinations of the influence of specificstructural features and particular interactions on polymorphrelative stabilities.
One area where an understanding of polymorph energiesis crucial is the ab initio prediction of crystal structures,which is usually performed by ranking computer-generatedcrystal structures by their calculated lattice energies.7,8,57 Thefact that lattice energy differences tend to be so small demon-strates the challenge involved in correctly ranking the ener-gies of predicted structures. The differences in calculatedenergies between observed and unobserved predicted crystalstructures are typically as small as the polymorph energy dif-ferences seen here. Furthermore, given that observed poly-morphs can differ by up to 10 kJ mol−1 in lattice energy, allpredicted crystal structures within this energy range from themost stable structure can be seen as potentially observablepolymorphs. Such an energy range frequently includes largenumbers of putative crystal structures.58 In fact, our distribu-tion of polymorph lattice energy differences closely matchesthe relative lattice energies of observed crystal structures in
This journal is © The Royal Society of Chemistry 2015
CrystEngComm Paper
Ope
n A
cces
s A
rtic
le. P
ublis
hed
on 2
3 M
arch
201
5. D
ownl
oade
d on
3/2
2/20
22 7
:08:
18 A
M.
Thi
s ar
ticle
is li
cens
ed u
nder
a C
reat
ive
Com
mon
s A
ttrib
utio
n 3.
0 U
npor
ted
Lic
ence
.View Article Online
crystal structure prediction studies of small organic mole-cules.59 The reasons why predicted polymorphs outnumberobserved polymorphs have recently been discussed by Price.60
A further observation relates to the use of lattice energyversus free energy in predicting relative stabilities of predictedpolymorphs. Free energies should be used to assess the truethermodynamic stabilities of structures, but are often approxi-mated by calculated lattice energies, due in large part to theadded complexity and computational expense of free energycalculations. However, the small magnitude of lattice energydifferences that we find between known polymorphs high-lights the fact that it takes very little vibrational energy tocause a re-ranking of polymorph stability. While a small num-ber of studies have shown promising results from the inclu-sion of dynamical effects in crystal structure prediction, eitherthrough a lattice dynamics18,61–63 or molecular dynamics64–66
approach, lattice energy-based predictions are still the norm.Our results show why lattice energies have achieved good
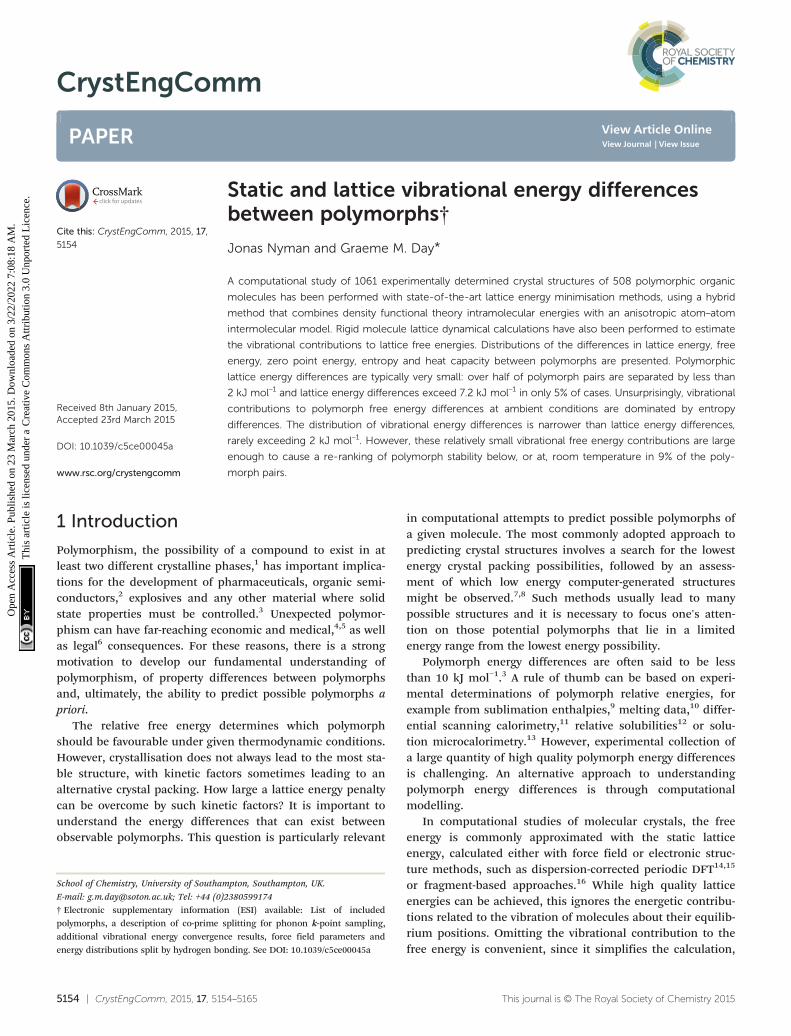
success, particularly as the quality of lattice energy calcula-tions has improved.14,16,67,68 The correlation between ΔA andΔElatt is strong (R2 = 0.85, see Fig. 9), demonstrating that lat-tice energy is the dominant contribution to free energy differ-ences. However, the slope of the regression line is 0.86, not1, reflecting our finding that ΔElatt and ΔFvib are of oppositesign in the majority of cases; vibrational contributions ingeneral decrease the energy differences between polymorphs.Furthermore, some pairs are re-ranked by the vibrationalenergy, which contradicts Gavezzotti and Filippini's conclu-sion that free energy differences always have the same signas enthalpy differences.17 Differences in our conclusions maybe due to their simpler force field model, lack of intramolec-ular energy in their assessment of lattice energies, as well asour different Brillouin zone sampling methods.
The green triangle in Fig. 9 marks the area where the vibra-tional contribution causes a discordant ranking of polymorph
This journal is © The Royal Society of Chemistry 2015
Fig. 9 The correlation between ΔElatt and ΔA between polymorphs.Each polymorph pair is ordered such that the lattice energy differenceis positive. The green area highlights those structures where re-ranking occurs between lattice energy and free energy at 300 K. Greenand red data points denote structures with and without hydrogenbonds, respectively.
stability relative to lattice energy; this area covers 9% of thepolymorph pairs. This fraction is large enough to justify thecomputational effort of free energy calculations, since thisrate of mis-ranking over an entire landscape of predicted crys-tal structures can have a significant influence on the out-comes of a prediction.
4 Conclusions
Lattice energy minimisation and rigid-molecule harmonic lat-tice dynamics have been applied to understand thermody-namic property differences for a large set of experimentallydetermined, non-disordered, packing polymorphs of organicmolecules. Our principle results are those summarised inFig. 3 and 4, showing the distribution of static and vibra-tional energy differences between polymorphs. While ourstudy is restricted to single-component crystal structures ofmolecules containing the elements C, N, O, H, F, Cl and S,given the large size of the structure set (1061 crystal struc-tures in 508 polymorph families), and quality of the energymodel, we believe that these faithfully reflect true energy dif-ferences and, thus, are of great value in discussing andunderstanding polymorphism.
Unsurprisingly, the lattice energy differences betweenpolymorphs are typically very small and are less than 7.2 kJmol−1 in 95% of polymorph pairs. Entropies dominate thevibrational contribution to relative free energies and, while thesecontributions to relative free energies are typically small (|ΔFvib|< 2 kJ mol−1 in most cases), they can be large enough to signifi-cantly affect the calculated relative stability of polymorphs.
ΔFvib and ΔElatt are of opposite sign in 69% of the poly-morph pairs, so that polymorph free energies usually con-verge with increasing temperature and will eventually cross.By T = 300 K, we find that vibrational contributions swap thestability order of 9% of polymorph pairs.
Correlations of energy and entropy differences with densityare weak, and there is no evidence that polymorphs of hydro-gen bonding and non-hydrogen bonding molecules show dif-ferent trends in thermodynamic differences. Therefore, it isdifficult to predict relative stability or thermodynamic behav-iour based on these coarse descriptions of structure.
Based on the evidence presented here, computationalstudies of polymorph stability, including crystal structure pre-diction, should not be restricted to static lattice energy calcu-lations. The influence of lattice vibrations is important injudging the true stability difference between polymorphs anda necessary consideration for the anticipation of temperature-driven phase transitions. Since the errors introduced byrestricting lattice dynamics to a single k-point are large, theenergy methods that are developed for use in the context ofcrystal structure prediction should be sufficiently efficient toallow adequate sampling of phonons without an unaccept-ably large computational expense. Currently, only atom–atompotentials meet these criteria and we believe that the contin-ued development of accurate atom–atom models for suchstudies is necessary.
CrystEngComm, 2015, 17, 5154–5165 | 5163

CrystEngCommPaper
Ope
n A
cces
s A
rtic
le. P
ublis
hed
on 2
3 M
arch
201
5. D
ownl
oade
d on
3/2
2/20
22 7
:08:
18 A
M.
Thi
s ar
ticle
is li
cens
ed u
nder
a C
reat
ive
Com
mon
s A
ttrib
utio
n 3.
0 U
npor
ted
Lic
ence
.View Article Online
Acknowledgements
We thank Dr Manolis Vasileiadis for support and problemsolving our use of the CrystalOptimizer program. Theresearch leading to these results has received funding fromthe European Research Council under the European Union'sSeventh Framework Programme (FP/2007-2013)/ERC GrantAgreement no. 307358 IJERC-stG-2012-ANGLE). The authorsacknowledge the use of the IRIDIS High Performance Com-puting Facility at the University of Southampton.
References
1 J. Haleblian and W. McCrone, J. Pharm. Sci., 1969, 58,
911–929.2 T. Siegrist, C. Besnard, S. Haas, M. Schiltz, P. Pattison, D.
Chernyshov, B. Batlogg and C. Kloc, 2079–2082, Adv. Mater.,2007, 19.3 J. Bernstein, Polymorphism in Molecular Crystals, Oxford
University Press, 2002.4 S. R. Chemburkar, J. Bauer, K. Deming, H. Spiwek, K. Patel,
J. Morris, R. Henry, S. Spanton, W. Dziki, W. Porter, J. Quick,P. Bauer, J. Donaubauer, B. A. Narayanan, M. Soldani, D. Rileyand K. McFarland, Org. Process Res. Dev., 2000, 4, 413–417.5 J. Bauer, S. Spanton, R. Henry, J. Quick, W. Dziki, W. Porter, J.
Quick, P. Bauer, J. Donaubauer, B. A. Narayanan, M. Soldani,D. Riley and K. McFarland, Pharm. Res., 2001, 18, 859–866.6 W. Cabri, P. Ghetti, G. Pozzi and M. Alpegiani, Org. Process
Res. Dev., 2007, 11, 64–72.7 G. M. Day, Crystallogr. Rev., 2011, 17, 3–52.
8 S. L. Price, Chem. Soc. Rev., 2014, 43, 2098–2111. 9 J. S. Chickos and W. E. Acree, J. Phys. Chem. Ref. Data,2002, 31, 537–698.10 L. Yu, J. Pharm. Sci., 1995, 84, 966–974.
11 L. Yu, G. A. Stephenson, C. A. Mitchell, C. A. Bunnell, S. V.Snorek, J. J. Bowyer, T. B. Borchardt, J. G. Stowell and S. R.Byrn, J. Am. Chem. Soc., 2000, 122, 585–591.
12 C.-H. Gu andD. J.W. Grant, J. Pharm. Sci., 2001, 90, 1277–1287.
13 J. K. Guillory and D.M. Erb, Pharm. Manuf., 1985, 2(9), 28–33. 14 M. A. Neumann, F. J. Leusen and J. Kendrick, Angew. Chem.,Int. Ed., 2008, 47, 2427–2430.15 A. Otero-de-la-Roza and E. R. Johnson, J. Chem. Phys.,
2012, 137, 054103.16 G. J. O. Beran and K. Nanda, J. Phys. Chem. Lett., 2010, 1,
3480–3487.17 A. Gavezzotti and G. Filippini, J. Am. Chem. Soc., 1995, 117,
12299–12305.18 B. P. van Eijck, J. Comput. Chem., 2001, 22, 816–826.
19 J. van de Streek and S. Motherwell, Acta Crystallogr., Sect. B:Struct. Sci., 2005, 61, 504–510.20 J. van de Streek, Acta Crystallogr., Sect. B: Struct. Sci.,
2006, 62, 567–579.21 Z. F. Weng, W. S. Motherwell and J. M. Cole, J. Appl.
Crystallogr., 2008, 41, 955–957.22 A. J. Cruz-Cabeza and J. Bernstein, Chem. Rev., 2013, 114,
2170–2191.
5164 | CrystEngComm, 2015, 17, 5154–5165
23 A. L. Spek, J. Appl. Crystallogr., 2003, 36, 7–13.
24 A. J. Stone and S. L. Price, J. Phys. Chem., 1988, 92,3325–3335.25 S. L. Price, M. Leslie, G. W. A. Welch, M. Habgood, L. S.
Price, P. G. Karamertzanis and G. M. Day, Phys. Chem. Chem.Phys., 2010, 12, 8478–8490.
26 A. Stone and M. Alderton, Mol. Phys., 2002, 100, 221–233.
27 A. J. Stone, Distributed Multipole Analysis of Gaussianwavefunctions, GMDA version 2.2.02.28 H. P. Thompson, E. O. Pyzer-Knapp and G. M. Day, 2015,
Manuscript in preparation.29 E. O. Pyzer-Knapp, Ph.D. thesis, University of Cambridge,
2014.30 D. E. Williams, J. Comput. Chem., 2001, 22, 1154–1166.
31 A. Abraha and D. E. Williams, Inorg. Chem., 1999, 38,4224–4228.32 G. M. Day and S. L. Price, J. Am. Chem. Soc., 2003, 125,
16434–16443.33 A. Kazantsev, P. Karamertzanis, C. Pantelides and C.
Adjiman, CrystalOptimizer: An Efficient Algorithm for LatticeEnergy Minimization of Organic Crystals Using Isolated-Molecule Quantum Mechanical Calculations, 2010.
34 A. V. Kazantsev, P. G. Karamertzanis, C. S. Adjiman and C. C.
Pantelides, J. Chem. Theory Comput., 2011, 7, 1998–2016.35 M. J. Frisch, G. W. Trucks, H. B. Schlegel, G. E. Scuseria,
M. A. Robb, J. R. Cheeseman, G. Scalmani, V. Barone, B.Mennucci, G. A. Petersson, H. Nakatsuji, M. Caricato, X. Li,H. P. Hratchian, A. F. Izmaylov, J. Bloino, G. Zheng, J. L.Sonnenberg, M. Hada, M. Ehara, K. Toyota, R. Fukuda, J.Hasegawa, M. Ishida, T. Nakajima, Y. Honda, O. Kitao, H.Nakai, T. Vreven, J. A. Montgomery, Jr., J. E. Peralta, F.Ogliaro, M. Bearpark, J. J. Heyd, E. Brothers, K. N. Kudin,V. N. Staroverov, R. Kobayashi, J. Normand, K. Raghavachari,A. Rendell, J. C. Burant, S. S. Iyengar, J. Tomasi, M. Cossi, N.Rega, J. M. Millam, M. Klene, J. E. Knox, J. B. Cross, V.Bakken, C. Adamo, J. Jaramillo, R. Gomperts, R. E.Stratmann, O. Yazyev, A. J. Austin, R. Cammi, C. Pomelli,J. W. Ochterski, R. L. Martin, K. Morokuma, V. G.Zakrzewski, G. A. Voth, P. Salvador, J. J. Dannenberg, S.Dapprich, A. D. Daniels, O. Farkas, J. B. Foresman, J. V.Ortiz, J. Cioslowski and D. J. Fox, Gaussian 09 Revision A.02,2009, Gaussian Inc. Wallingford CT, 2009.36 B. Fultz, Prog. Mater. Sci., 2010, 55, 247–352.
37 M. Born and K. Huang, Dynamical theory of crystal lattices,Clarendon Press Oxford, vol. 188, 1954.38 S. Califano, Lattice dynamics and intermolecular forces,
Academic Press, vol. 55, 1975.39 N. Neto, R. Righini, S. Califano and S. Walmsley, Chem.
Phys., 1978, 29, 167–179.40 S. Califano, V. Schettino and N. Neto, Lattice dynamics of
molecular crystals, Springer-Verlag Berlin, vol. 26, 1981.41 G. M. Day, S. L. Price and M. Leslie, J. Phys. Chem. B,
2003, 107, 10919–10933.42 G. M. Day, Ph.D. thesis, University College London, 2003.
43 G. M. Day, J. A. Zeitler, W. Jones, T. Rades and P. F. Taday,J. Phys. Chem. B, 2006, 110, 447–456.
This journal is © The Royal Society of Chemistry 2015

CrystEngComm Paper
Ope
n A
cces
s A
rtic
le. P
ublis
hed
on 2
3 M
arch
201
5. D
ownl
oade
d on
3/2
2/20
22 7
:08:
18 A
M.
Thi
s ar
ticle
is li
cens
ed u
nder
a C
reat
ive
Com
mon
s A
ttrib
utio
n 3.
0 U
npor
ted
Lic
ence
.View Article Online
44 R. Li, J. A. Zeitler, D. Tomerini, E. P. J. Parrott, L. F. Gladden
and G. M. Day, Phys. Chem. Chem. Phys., 2010, 12,5329–5340.45 M. D. Eddleston, K. E. Hejczyk, E. G. Bithell, G. M. Day and
W. Jones, Chem. – Eur. J., 2013, 19, 7874–7882.46 M. D. Eddleston, K. E. Hejczyk, A. M. C. Cassidy, G. M. Day,
H. P. G. Thompson and W. Jones, Manuscript inpreparation.47 J. Nyman, In Silico Predictions of Porous Molecular Crystals
and Clathrates, 2014, M. Phil thesis, University ofSouthampton.48 H. P. Thompson and G. M. Day, Chem. Sci., 2014, 5,
3173–3182.49 P. G. Karamertzanis, G. M. Day, G. W. A. Welch, J. Kendrick,
F. J. J. Leusen, M. A. Neumann and S. L. Price, J. Phys. Chem.B, 2008, 128, 244708.50 B. P. van Eijck, Phys. Chem. Chem. Phys., 2002, 4, 4789–4794.
51 M. Habgood, R. Grau-Crespo and S. L. Price, Phys. Chem.Chem. Phys., 2011, 13, 9590–9600.52 A. J. Cruz-Cabeza, G. M. Day and W. Jones, Phys. Chem.
Chem. Phys., 2011, 13, 12808–12816.53 B. Legendre and S. L. Randzio, Int. J. Pharm., 2007, 343,
41–47.54 A. Katrusiak, Acta Crystallogr., Sect. B: Struct. Sci., 2001, 57,
697–704.55 J. P. M. Lommerse, W. D. S. Motherwell, H. L. Ammon, J. D.
Dunitz, A. Gavezzotti, D. W. M. Hofmann, F. J. J. Leusen,W. T. M. Mooij, S. L. Price, B. Schweizer, M. U. Schmidt,B. P. van Eijck, P. Verwer and D. E. Williams, ActaCrystallogr., Sect. B: Struct. Sci., 2000, 56, 697–714.
56 C. B. Aakeröy, M. Nieuwenhuyzen and S. L. Price, J. Am.
Chem. Soc., 1998, 120, 8986–8993.57 D. A. Bardwell, C. S. Adjiman, Y. A. Arnautova, E.
Bartashevich, S. X. M. Boerrigter, D. E. Braun, A. J. Cruz-Cabeza, G. M. Day, R. G. Della Valle, G. R. Desiraju, B. P. vanEijck, J. C. Facelli, M. B. Ferraro, D. Grillo, M. Habgood,This journal is © The Royal Society of Chemistry 2015
D. W. M. Hofmann, F. Hofmann, K. V. J. Jose, P. G.Karamertzanis, A. V. Kazantsev, J. Kendrick, L. N. Kuleshova,F. J. J. Leusen, A. V. Maleev, A. J. Misquitta, S. Mohamed,R. J. Needs, M. A. Neumann, D. Nikylov, A. M. Orendt, R.Pal, C. C. Pantelides, C. J. Pickard, L. S. Price, S. L. Price,H. A. Scheraga, J. van de Streek, T. S. Thakur, S. Tiwari, E.Venuti and I. K. Zhitkov, Acta Crystallogr., Sect. B: Struct.Sci., 2011, 67, 535–551.
58 G. M. Day, J. Chisholm, N. Shan, W. D. S. Motherwell and
W. Jones, Cryst. Growth Des., 2004, 4, 1327–1340.59 G. M. Day, W. D. S. Motherwell and W. Jones, Cryst. Growth
Des., 2005, 5, 1023–1033.60 S. L. Price, Acta Crystallogr., Sect. B: Struct. Sci., Cryst. Eng.
Mater., 2013, 69, 313–328.61 A. T. Anghel, G. M. Day and S. L. Price, CrystEngComm,
2002, 4, 348–355.62 G. M. Day, T. G. Cooper, A. J. Cruz-Cabeza, K. E. Hejczyk,
H. L. Ammon, S. X. M. Boerrigter, J. S. Tan, R. G. Della Valle,E. Venuti, J. Jose, S. R. Gadre, G. R. Desiraju, T. S. Thakur,B. P. van Eijck, J. C. Facelli, V. E. Bazterra, M. B. Ferraro,D. W. M. Hofmann, M. A. Neumann, F. J. J. Leusen, J.Kendrick, S. L. Price, A. J. Misquitta, P. G. Karamertzanis,G. W. A. Welch, H. A. Scheraga, Y. A. Arnautova, M. U.Schmidt, J. van de Streek, A. K. Wolf and B. Schweizer, ActaCrystallogr., Sect. B: Struct. Sci., 2009, 65, 107–125.63 A. J. Cruz-Cabeza, G. M. Day and W. Jones, Chem. – Eur. J.,
2008, 14, 8830–8836.64 A. Gavezzotti, J. Am. Chem. Soc., 2000, 122, 10724–10725.
65 P. Raiteri, R. Martonák and M. Parrinello, Angew. Chem., Int.Ed., 2005, 44, 3769–3773.66 P. G. Karamertzanis, P. Raiteri, M. Parrinello, M. Leslie and
S. L. Price, J. Phys. Chem. B, 2008, 112, 4298–4308.67 P. J. Bygrave, N. L. Allan and F. R. Manby, J. Phys. Chem.,
2012, 137, 164102.68 J. Yang, W. Hu, D. Usvyat, D. Matthews, M. Schütz and
G. K.-L. Chan, Science, 2014, 345, 640–643.
CrystEngComm, 2015, 17, 5154–5165 | 5165

![Vibrational spectroscopy - start [CTCC wiki]wiki.ctcc.no/lib/exe/fetch.php?media=public:teaching:vib... · Vibrational spectroscopy Kenneth Ruud ... Some notable differences ... The](https://img.dokumen.tips/doc/110x75/5b0add5f7f8b9adc138ccaac/vibrational-spectroscopy-start-ctcc-wikiwikictccnolibexefetchphpmediapublicteachingvibvibrational.jpg)