Embed Size (px)
Citation preview

Stated Preference Modeling of the Demand for Ohio River
Shipments
By
Nino Sitchinava & Wesley Wilson
University of Oregon
&
Mark Burton
University of Tennessee
Introduction
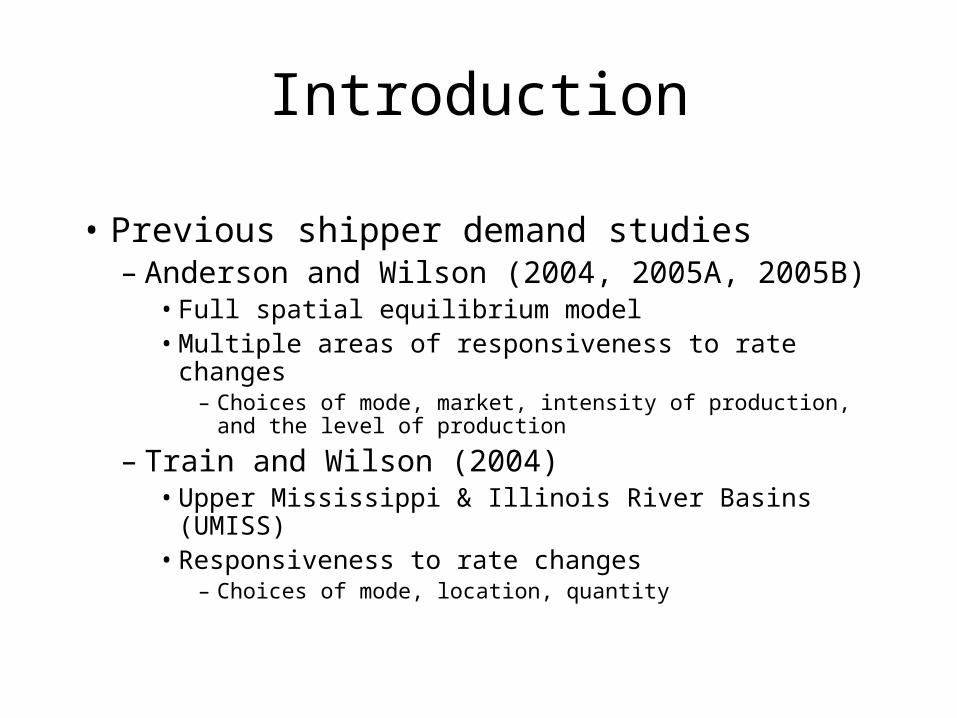
• Previous shipper demand studies– Anderson and Wilson (2004, 2005A, 2005B)
• Full spatial equilibrium model• Multiple areas of responsiveness to rate changes
– Choices of mode, market, intensity of production, and the level of production
– Train and Wilson (2004)• Upper Mississippi & Illinois River Basins (UMISS)• Responsiveness to rate changes
– Choices of mode, location, quantity
Objective
• UMISS parallel examination of Ohio River
• One source of responsiveness – production decisions
• Stated preference modeling
• Empirical estimates of elasticities
Outline
• Ohio River Resources
• Survey and data description
• Conceptual framework
• Econometric methodology
• Estimation Results– For transportation rate increases– For transit times increases

Ohio River Resources
• ORB covers nine states
• Barge routes span 12 other states
Survey and Data Description
• Center for Business and Economic Research (CBER) telephone survey– 972 shippers contacted, 191 interview, 179 used
• Survey Instrument– Revealed and stated preference data– Mode/location vs. production choices

Survey and Data Description (cont.)• 46 barge shippers
– Representative of population (table)
• Location of shippers by state– 98% of states from ORB (table)
• Last shipment characteristics (table)
• Availability of loading equipment– 43% of truck equipment alone– 47% in combination w/ barge and rail equipment (table)
• Availability of alternatives– 70% have no options (table)
• Percentage of adjustment (table)
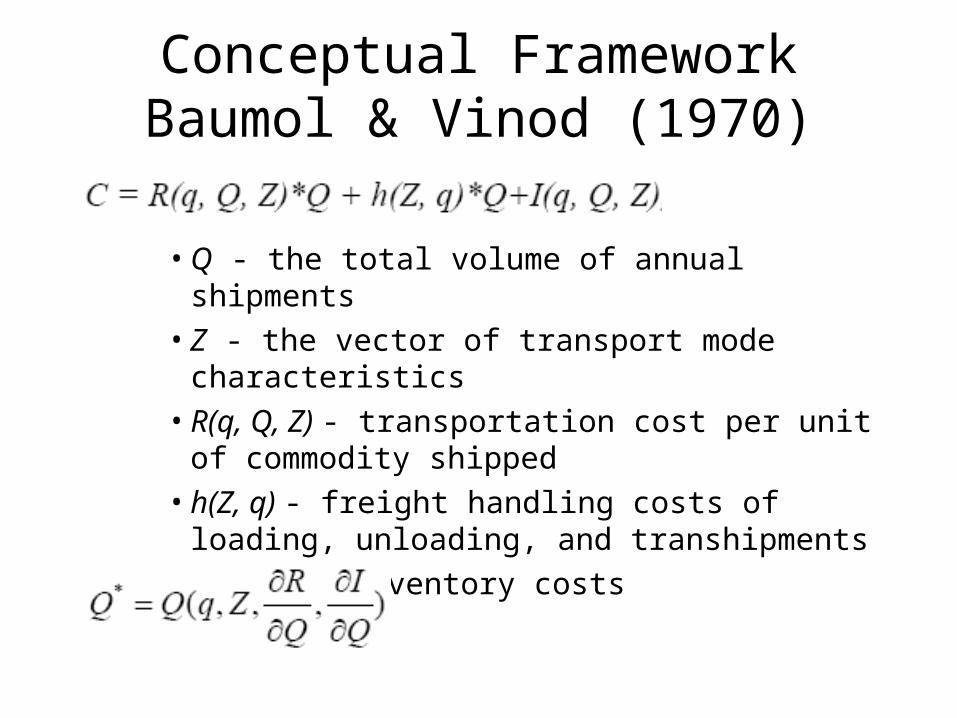
Conceptual FrameworkBaumol & Vinod (1970)
• Q - the total volume of annual shipments
• Z - the vector of transport mode characteristics
• R(q, Q, Z) - transportation cost per unit of commodity shipped
• h(Z, q) - freight handling costs of loading, unloading, and transhipments
• I(q, Q, Z) - inventory costs

Conceptual Framework (cont.)
• Cobb-Douglas functional form
&
– - all non-shipment characteristics related effects – - a set of shipper and shipment characteristics – - transportation rates – - elasticities with respect to x and r
• Change in shipment volumes and rates
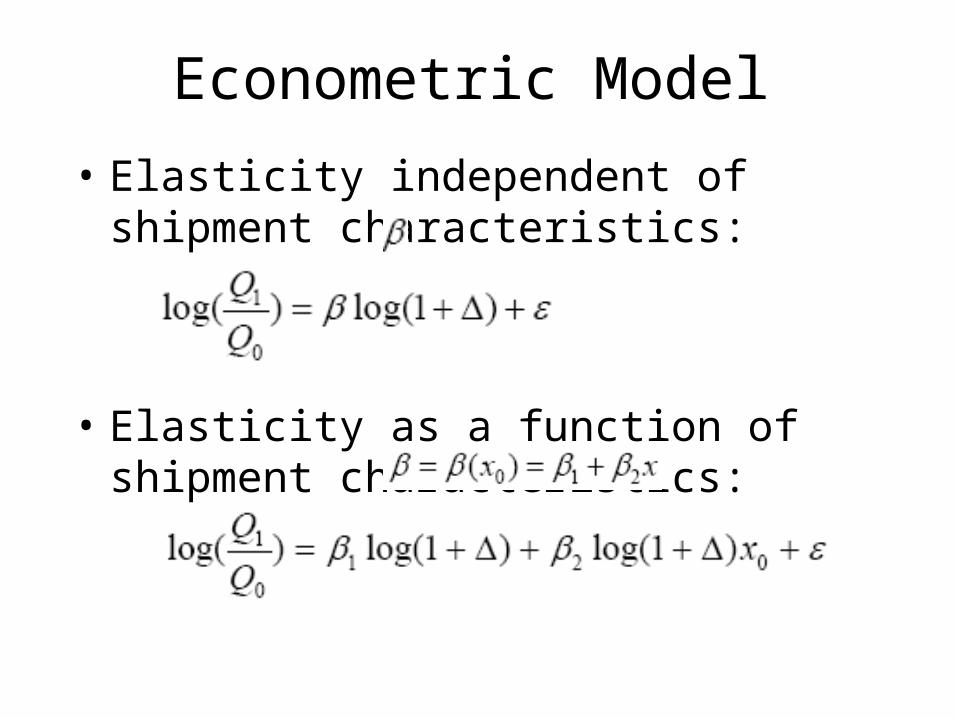
Econometric Model
• Elasticity independent of shipment characteristics:
• Elasticity as a function of shipment characteristics:
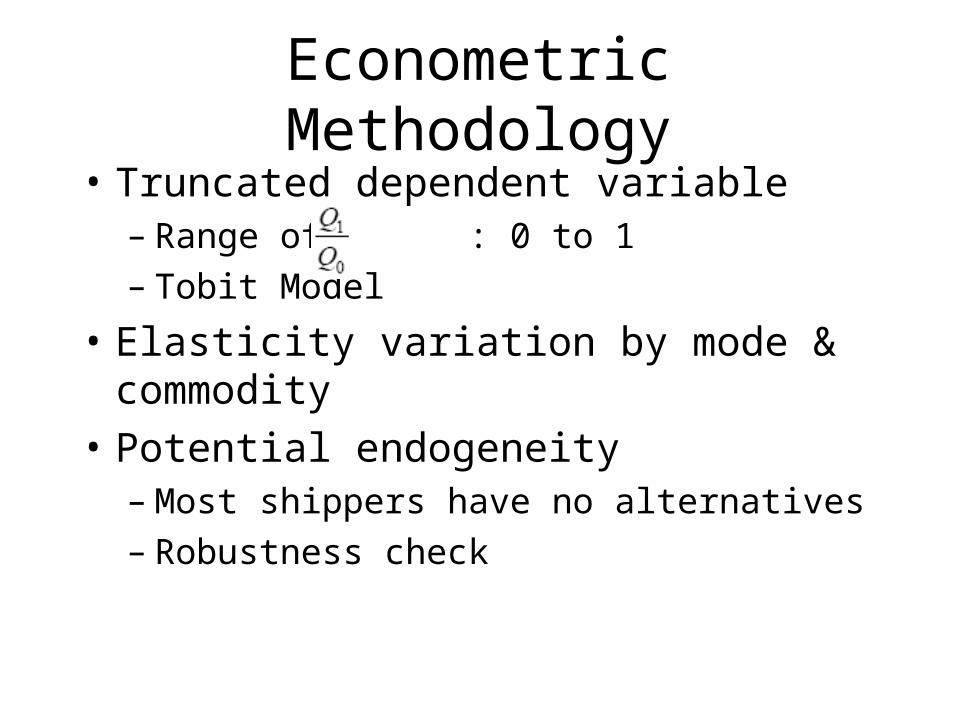
Econometric Methodology
• Truncated dependent variable– Range of : 0 to 1– Tobit Model
• Elasticity variation by mode & commodity
• Potential endogeneity– Most shippers have no alternatives– Robustness check
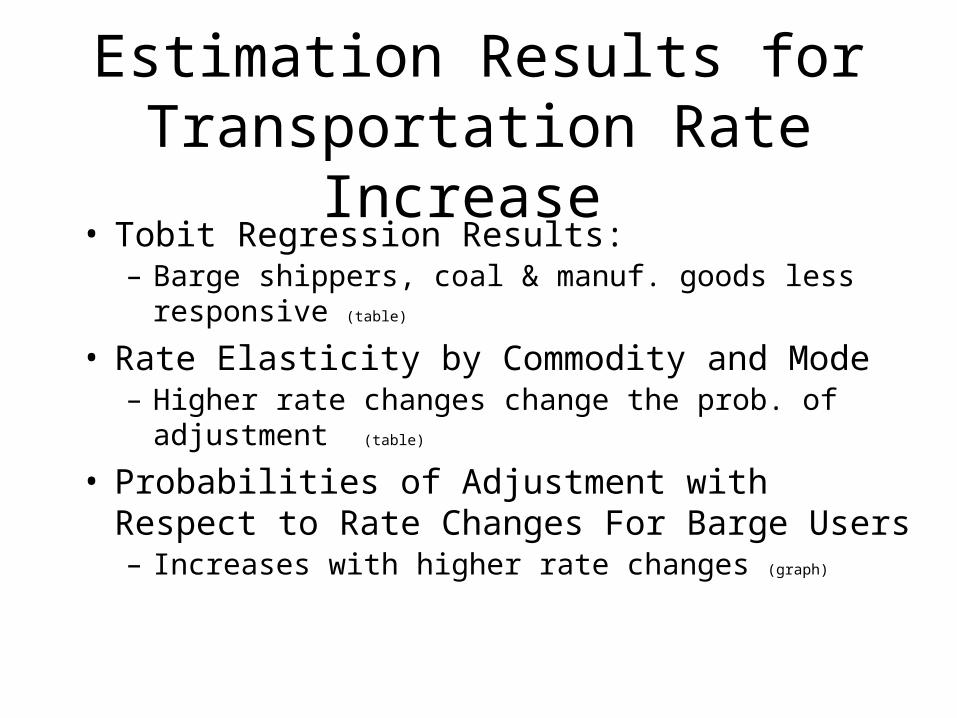
Estimation Results for Transportation Rate Increase
• Tobit Regression Results: – Barge shippers, coal & manuf. goods less responsive (table)
• Rate Elasticity by Commodity and Mode– Higher rate changes change the prob. of adjustment (table)
• Probabilities of Adjustment with Respect to Rate Changes For Barge Users– Increases with higher rate changes (graph)
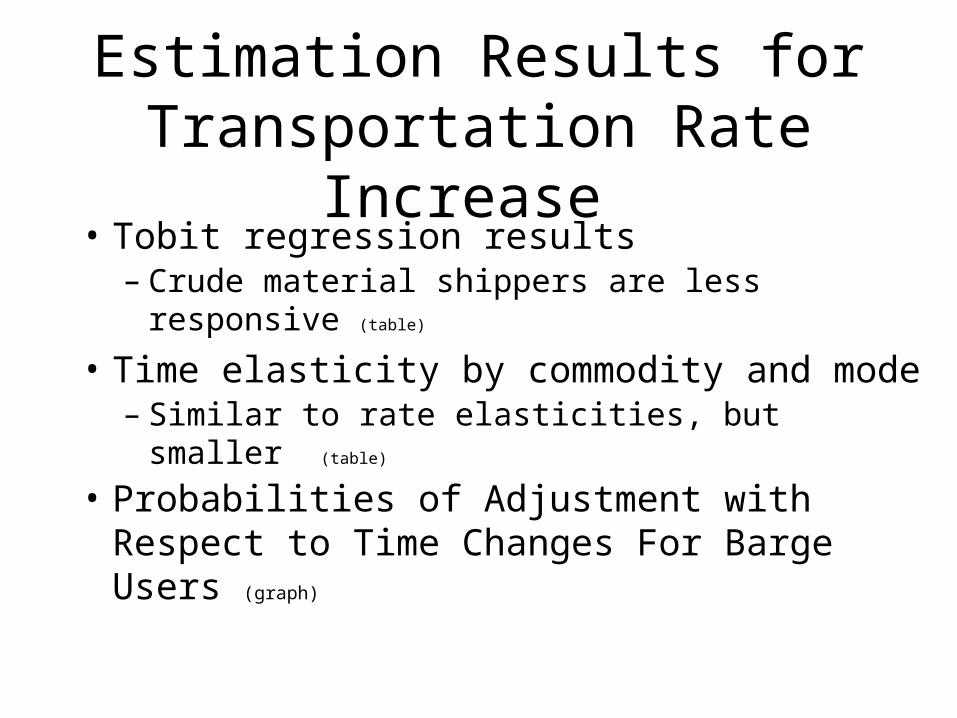
Estimation Results for Transportation Rate Increase
• Tobit regression results– Crude material shippers are less responsive (table)
• Time elasticity by commodity and mode– Similar to rate elasticities, but smaller (table)
• Probabilities of Adjustment with Respect to Time Changes For Barge Users (graph)
Summary
• Stated preference approach
• Estimated responsiveness of production decisions to changes in rates and times
• Tremendous differences across commodities and shipper characteristics