Embed Size (px)
DESCRIPTION
The City is the Home of Prosperity. It is the place where human beings find satisfaction of basic needs and access to essential public goods. The city is also where ambitions, aspirations and other material and immaterial aspects of life are realized, providing contentment and happiness. It is a locus at which e prospects of prosperity and individual and collective well-being can be increased.What this new edition of State of the World’s Cities shows is that prosperity for all has been compromised by a narrow focus on economic growth. UN-Habitat suggests a fresh approach to prosperity beyond the solely economic emphasis, including other vital dimensions such as quality of life, adequate infrastructures, equity and environmental sustainability. The Report proposes a new tool – the City Prosperity Index – together with a conceptual matrix, the Wheel of Prosperity, both of which are meant to assist decision makers to design clear policy interventions.The Report advocates for the need of cities to enhance the public realm, expand public goods and consolidate rights to the ‘commons’ for all as a way to expand prosperity. This comes in response to the observed trend of enclosing or restricting these goods and commons in enclaves of prosperity, or depleting them through unsustainable use.
Citation preview
STATE OF THE WORLD’S CITIES
2012/2013Prosperity of Cities
World Urban Forum Edition
EQUITY AND SOCIAL INCLUSIONEN
VIRO
NM
ENTA
L SUSTAINABILITY
PRODUCTIVITYQU
ALIT
Y OF
LIF
E
INFRASTRUCTURE
STATE OF THEWORLD’S CITIES
2012/2013
Prosperity of Cities
PROSPERITY
STATE OF THE WORLD’S CITIES 2012/2013 Prosperity of Cities
The City is the Home of Prosperity. It is the place where human beings find satisfaction of basic needs and access to essential public goods. The city is also where ambitions, aspirations and other material
and immaterial aspects of life are realized, providing contentment and happiness. It is a locus at which e prospects of prosperity and individual and collective well-being can be increased.
However, when prosperity is restricted to some groups, when it is used to pursue specific interests, or when it is a justification for financial gains for the few to the detriment of the majority, the city becomes
the arena where the right to shared prosperity is claimed and fought for. As people in the latter part of 2011 gathered in Cairo’s Tahrir Square, in Madrid’s Puerta del Sol, in front of London’s St Paul’s
cathedral, or in New York’s Zuccotti Park, they were not only demanding more equality and inclusion; they were also expressing the need for prosperity to be shared across all segments of society.
What this new edition of State of the World’s Cities shows is that prosperity for all has been compromised by a narrow focus on economic growth. UN-Habitat suggests a fresh approach to
prosperity beyond the solely economic emphasis, including other vital dimensions such as quality of life, adequate infrastructures, equity and environmental sustainability. The Report proposes a new
tool – the City Prosperity Index – together with a conceptual matrix, the Wheel of Prosperity, both of which are meant to assist decision makers to design clear policy interventions.
The Report advocates for the need of cities to enhance the public realm, expand public goods and consolidate rights to the ‘commons’ for all as a way to expand prosperity. This comes in response to the observed trend of enclosing or restricting these goods and commons in enclaves of prosperity, or
depleting them through unsustainable use.
The Report maps out major policy steps to promote a new type of city – the city of the 21st century – that is a ‘good’, people-centred city. One that is capable of integrating the tangible and more intangible aspects of prosperity, and in the process shedding off the inefficient, unsustainable forms and functionalities of the city of the previous century. By doing this, UN-Habitat plays a pivotal role in ensuring that urban planning,
legal, regulatory and institutional frameworks become instruments of prosperity and well-being.
United Nations Human Settlements
Programme (UN-HABITAT)
P.O. Box 30030, Nairobi, Kenya
Tel: +254 20 7621 234
Fax: +254 20 7624 266/7
The City is the Home of Prosperity. It is the place where human beings find satisfaction of basic needs and access to essential public goods. The city is also where ambitions, aspirations and other material
and immaterial aspects of life are realized, providing contentment and happiness. It is a locus at which e prospects of prosperity and individual and collective well-being can be increased.
However, when prosperity is restricted to some groups, when it is used to pursue specific interests, or when it is a justification for financial gains for the few to the detriment of the majority, the city becomes
the arena where the right to shared prosperity is claimed and fought for. As people in the latter part of 2011 gathered in Cairo’s Tahrir Square, in Madrid’s Puerta del Sol, in front of London’s St Paul’s
cathedral, or in New York’s Zuccotti Park, they were not only demanding more equality and inclusion; they were also expressing the need for prosperity to be shared across all segments of society.
What this new edition of State of the World’s Cities shows is that prosperity for all has been compromised by a narrow focus on economic growth. UN-Habitat suggests a fresh approach to
prosperity beyond the solely economic emphasis, including other vital dimensions such as quality of life, adequate infrastructures, equity and environmental sustainability. The Report proposes a new
tool – the City Prosperity Index – together with a conceptual matrix, the Wheel of Prosperity, both of which are meant to assist decision makers to design clear policy interventions.
The Report advocates for the need of cities to enhance the public realm, expand public goods and consolidate rights to the ‘commons’ for all as a way to expand prosperity. This comes in response to the observed trend of enclosing or restricting these goods and commons in enclaves of prosperity, or
depleting them through unsustainable use.
The Report maps out major policy steps to promote a new type of city – the city of the 21st century – that is a ‘good’, people-centred city. One that is capable of integrating the tangible and more intangible aspects of prosperity, and in the process shedding off the inefficient, unsustainable forms and functionalities of the city of the previous century. By doing this, UN-Habitat plays a pivotal role in ensuring that urban planning,
legal, regulatory and institutional frameworks become instruments of prosperity and well-being.
STATE OF THE WORLD’S CITIES
2012/2013
Prosperity of Cities
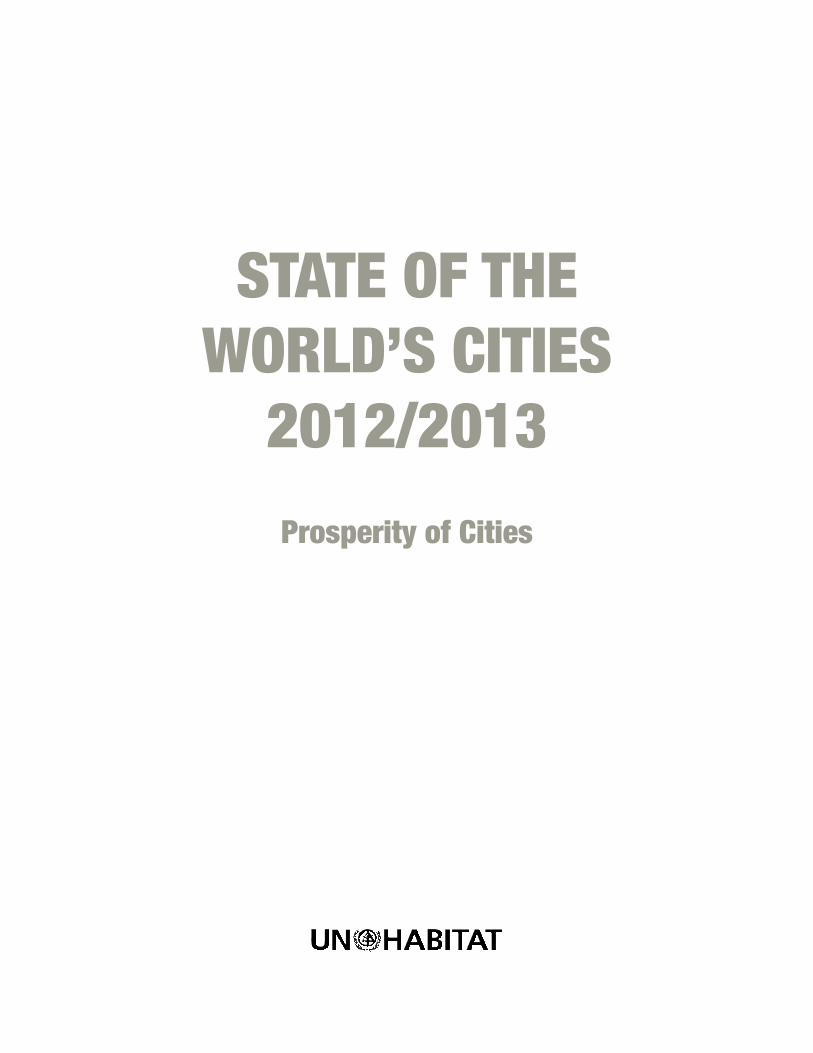
Copyright © United Nations Human Settlements Programme, 2012.
All rights reserved
United Nations Human Settlements Programme (UN-HABITAT) P.O. Box 30030, Nairobi, Kenya Tel: +254 20 7621 234 Fax: +254 20 7624 266/7 Website: www.unhabitat.org
DISCLAIMERThis is a World Urban Forum edition of the State of the World’s Cities Report 2012/2013: Prosperity of Cities. The final edition will include the foreword by the Secretary General of the United Nations, maps, bibliography, index and all illustrative text boxes.
The designations employed and the presentation of the material in this report do not imply the expression of any opinion whatsoever on the part of the Secretariat of the United Nations concerning the legal status of any country, territory, city or area, or of its authorities, or concerning delimitation of its frontiers or boundaries, or regarding its economic system or degree of development. The analysis, conclusions and recommendations of this reports do not necessarily reflect the views of the United Nations Human Settlements Programme or its Governing Council.
The Report is produced with official data provided by governments and additional information gathered by the Global Urban Observatory. Cities and countries are invited to update data relevant to them. It is important to acknowledge that data varies according to definition and sources. While UN-HABITAT checks data provided to the fullest extent possible, the responsibility for the accuracy of the information lies with the original providers of the data. Information contained in this Report is provided without warranty of any kind, either express or implied, including, without limitation, warranties of merchantability, fitness for a particular purpose and noninfringement. UN-HABITAT specifically does not make any warranties or representations as to the accuracy or completeness of any such data. Under no circumstances shall UN-HABITAT be liable for any loss, damage, liability or expense incurred or suffered that is claimed to have resulted from the use of this Report, including, without limitation, any fault, error, omission with respect thereto. The use of this Report is at the User’s sole risk. Under no circumstances, including, but not limited to negligence, shall UN-HABITAT or its affiliates be liable for any direct, indirect, incidental, special or consequential damages, even if UN-HABITAT has been advised of the possibility of such damages.
Design and layout by Bounford.com, Cambridge, UK. Printed and bound in Malta by Progress Press Ltd.
The paper used for this book is FSC-certified. FSC (the Forest Stewardship Council) is an international network to promote responsible management of the world’s forests.
Front cover picturesEquity and Social Inclusion: © Meunierd/Shutterstock.comQuality of Life: © 2012 Peter Herbert/fotoLIBRA.comInfrastructure: © Paul Smith/Panos PicturesProductivity: © Atul Loke/Panos PicturesEnvironmental Sustainability: © Anne-Britt Svinnset/Shutterstock.com
Back cover picture © Claudio Zaccherini/Shutterstock.com
Part One picturesPage 8: © Ragma Images/Shutterstock.com Page 10: © Denis Mironov/Shutterstock.comPage 25: © Christian Als/Panos Pictures
Part Two picturesPage 34: © Joyfull/Shutterstock.com Page 36: © Claudio Zaccherini/Shutterstock.comPage 48: © Philip Lange/Shutterstock.comPage 59: © Philip Lange/Shutterstock.comPage 68: © Clive Shirley/Panos PicturesPage 78: © Edwina Sassoon/fotoLIBRA.com
Part Three picturesPage 88: © Steve Forrest/Panos Pictures Page 90: © Denis Mironov/Shutterstock.comPage 103: © Chris Stowers/Panos Pictures
iii
ContentsForeword iv
Introduction v
Acknowledgements vi
Part One: Prosperity and Urban Trends 8Conceptualizing Urban Prosperity 10
Urban and Regional Trends 25
Urban Change in Developed Countries 25
Urban Change in Developing Countries 28
Part Two: Prosperity of Cities 34Productivity and the Prosperity of Cities 36
Urban Infrastructure: Bedrock of Prosperity 48
Quality of Life and Urban Prosperity 59
Equity and the Prosperity Of Cities 68
Environmental Sustainability and the Prosperity of Cities 78
Part Three: Policies for Prosperous Cities 88From Comparative Advantage to Urban Prosperity 90
Policy-Related Factors Underlying the Prosperity of Cities 92
Innovating to Support the Transition to the City of the 21st Century 103
Urban Prosperity Through Planning and Design 108
Empowering Laws and Institutions for Urban Prosperity 114
Statistical Annex 122
iv
This is a time of crises. This is also a time for solutions. Indeed, the world is currently engulfed in waves of financial, economic, environmental, social and political crises. Amidst the turmoil, however, we are also witnessing valiant and creative attempts at
different levels and by different actors to seek for solutions. The State of the World’s Cities Report 2012 presents,
with compelling evidence, some of the underlying factors behind these crises that have strongly impacted on cities. It shows that a lopsided focus on purely financial prosperity has led to growing inequalities between rich and poor, generated serious distortions in the form and functionality of cities, also causing serious damage to the environment – not to mention the unleashing of precarious financial systems that could not be sustained in the long run.
The Report proposes a fresh approach to prosperity, one that is holistic and integrated and which is essential for the promotion of a collective well-being and fulfilment of all. This new approach does not only respond to the crises by providing safeguards against new risks, but it also helps cities to steer the world towards economically, socially, politically and environmentally prosperous urban futures. In order to measure present and future progress of cities towards the prosperity path, the Report introduces a new tool – the City Prosperity Index – together with a conceptual matrix, the Wheel of Prosperity, both of which are meant to assist decision makers to design clear policy interventions.
To varying degrees of intensity, cities have been hit by different crises. However, this Report tells us that cities can also be a remedy to the regional and global crises. When supported by different tiers of government, and in the quest to generate holistic prosperity, cities can become flexible and creative platforms to address these crises in a pragmatic and efficient manner. Prosperity, in this sense, can be seen as a Pharmakon – both a cause of the problem and a remedy. As per this ancient Greek construct, when used properly, it can help decision-makers to steer cities towards well-balanced and harmonious development.
In this Report, UN-Habitat advocates for a new type of city – the city of the 21st century – that is a ‘good’, people-centred city, one that is capable of integrating the tangible and more intangible aspects of prosperity, and in the process shedding off the inefficient, unsustainable forms and functionalities of the city of the previous century. By doing this, UN-Habitat plays a pivotal role in ensuring that urban planning, legal, regulatory and institutional frameworks become an instrument of prosperity and well-being.
This is a time of solutions to the numerous challenges that confront today’s cities. If we are to take measures that will make a difference to the lives of the billions of people in the world’s cities, and to future generations, we need sound and solid knowledge and information. This Report provides some of these crucial ingredients. I am confident that it will serve as a useful tool in the necessary redefinition of the urban policy agenda at local, national and regional levels. I do believe also that it will provide valuable insights in the search for urban prosperity and related policy changes in the years ahead.
The Report is a bridge between research and policy, with inputs from more than 50 cities, individual scientists and institutions, particularly the Directorate-General for Regional Policy from the European Commission, and other partner institutions around the world that participated actively in the preparation of this study. I would like to thank them for their immense contribution. I would also like to thank the Government of Norway for its financial support.
The partnerships that have evolved during the preparation of this report are part and parcel of, as well as critically essential in, creating the building blocks of a more sustainable prosperity, one that is shared by all. UN-Habitat is determined to sustain and consolidate such partnerships as we collectively chart a better future.
Joan Clos Under-Secretary-General,
United Nations Executive Director, UN-Habitat
Foreword
v
As the world moves into the urban age, the dynamism and intense vitality of cities become even more prominent. A fresh future is taking shape, with urban areas around the world becoming not just the dominant form of habitat for humankind, but also the engine-rooms of human development as a whole.
This ongoing evolution can be seen as yet another assertion, albeit on a larger scale, of the time-honoured role of cities as centres of prosperity. In the 21st as in much earlier centuries, people congregate in cities to realize aspirations and dreams, fulfil needs and turn ideas into realities.
Prosperity in this broader, organic sense transcends narrow economic success to encompass a socially broad-based, balanced and resilient type of development that combines tangible and more intangible aspects. Taken in this multi-dimensional sense, urban prosperity tightens the links between individuals and society with their everyday environment, i.e., the city itself. Amidst multiple challenges facing cities today, a focus on poverty reduction and/or responses to the economic crisis is gradually shifting to a broader and more general understanding of the need to harness the transformative dynamics and potentials which, to varying degrees, characterize any city anywhere in the world.
How to rekindle momentum, optimize regenerating potential, enhance strategic position in the international business sphere, polishing both image and appeal – in other words, how to foster prosperity – has become the main thrust behind urban development. In this endeavour, every city will inevitably find itself on its own specific and unique historic course. Still, a common set of conditions can be found prevailing in all cities, which enable human beings to flourish, feel fulfilled and healthy, and where business can thrive, develop and generate more wealth. These conditions mark out the city as the privileged locus of prosperity, where advancement and progress come to materialize.
This Report focuses on the notion of prosperity and its realisation in urban areas. More specifically, this Report advocates a shift in attention around the world in favour of a more robust notion of development – one that looks beyond the narrow domain of economic growth that has dominated ill-balanced policy agendas over the last decades.
The gist of this Report is the need for transformative change towards people-centred, sustainable urban development, and this is what a revised notion of prosperity can provide. This focus on prosperity comes as institutional and policy backgrounds are in a state of flux around the
world. Prosperity may appear to be a misplaced concern in the midst of multiple crises –financial, economic, environmental, social or political – that afflict the world today. It may appear as a luxury in the current economic predicament. However, what this Report shows with compelling evidence is that the current understanding of prosperity needs to be revised, and with it the policies and actions deployed by public authorities. UN-Habitat suggests a fresh approach to prosperity, one that reaches beyond the sole economic dimension to take in other vital dimensions such as quality of life, infrastructures, equity and environmental sustainability. The Report introduces a new statistical instrument, the City Prosperity Index, measuring the prosperity factors at work in an individual city, together with a general matrix, the Wheel of Urban Prosperity, which suggests areas for policy intervention.
As the privileged locus of prosperity, the city remains best placed to deal pragmatically with some of the new, post-crisis challenges. With adequate backing from higher tiers of government, the city appears as a flexible, operational, creative platform for the development of collaborative agendas and strategies for local responses to the global crisis.
Cities can offer remedies to the worldwide crises – if only we put them in better positions to respond to the challenges of our age, optimizing resources and harnessing the potentialities of the future. This is the ‘good’, people-centred city, one that is capable of integrating the tangible and more intangible aspects of prosperity- in the process shedding the inefficient, unsustainable forms and functionalities of the previous century or so – the city of the 21st century.
This Report comes at a transitional juncture in the international agenda: in the wake of the ‘Rio + 20’ conference on the environment and development, and ahead of a fresh, updated Habitat Agenda due in 2016 (Habitat III). Against this background, this UN-Habitat Report calls on countries and cities to engage with a fresher notion of prosperity in their respective agendas. Prosperity involves a degree of confidence in the foreseeable future. As the world recovers from one of its worst-ever economic crises and a variety of interrelated predicaments, we must find a new sense of balance and safeguard against risks of further turmoil. With dominant roles in economic, political and social life cities remain critical to setting our nations on a more inclusive, productive, creative and sustainable course.
Introduction
vi
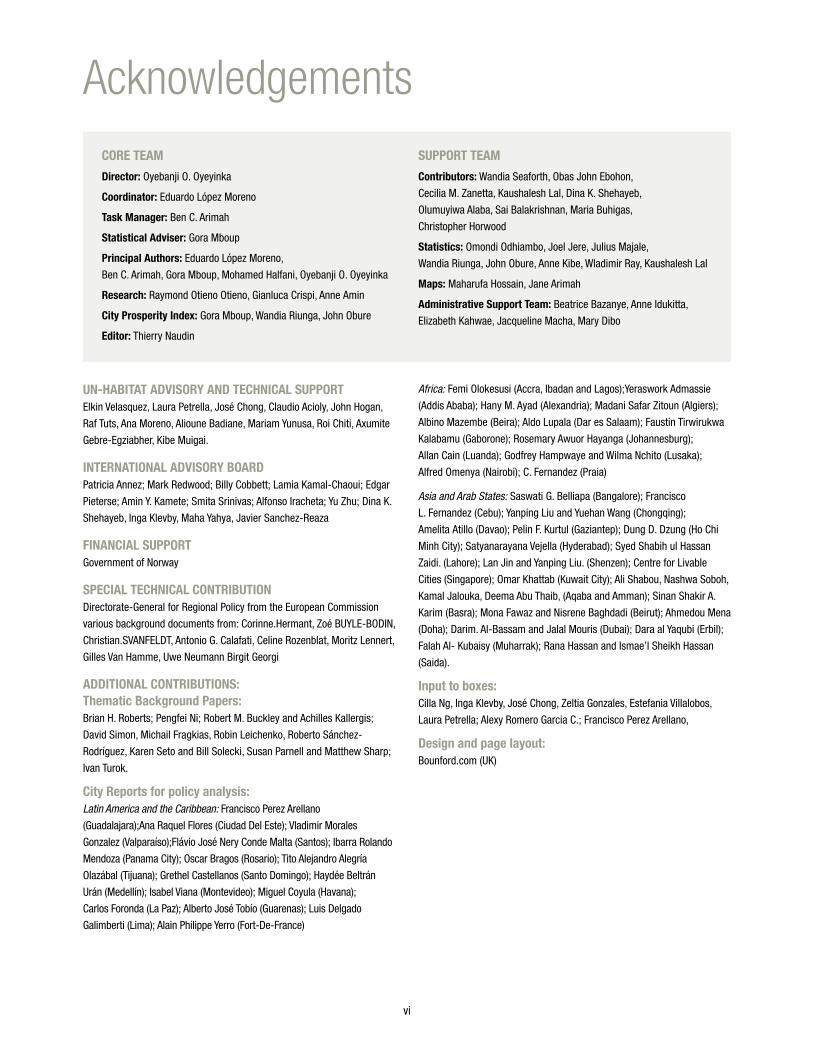
UN-HABITAT ADvISORy AND TECHNICAL SUPPORTElkin Velasquez, Laura Petrella, José Chong, Claudio Acioly, John Hogan,
Raf Tuts, Ana Moreno, Alioune Badiane, Mariam Yunusa, Roi Chiti, Axumite
Gebre-Egziabher, Kibe Muigai.
INTERNATIONAL ADvISORy BOARDPatricia Annez; Mark Redwood; Billy Cobbett; Lamia Kamal-Chaoui; Edgar
Pieterse; Amin Y. Kamete; Smita Srinivas; Alfonso Iracheta; Yu Zhu; Dina K.
Shehayeb, Inga Klevby, Maha Yahya, Javier Sanchez-Reaza
FINANCIAL SUPPORTGovernment of Norway
SPECIAL TECHNICAL CONTRIBUTION Directorate-General for Regional Policy from the European Commission
various background documents from: Corinne.Hermant, Zoé BUYLE-BODIN,
Christian.SVANFELDT, Antonio G. Calafati, Celine Rozenblat, Moritz Lennert,
Gilles Van Hamme, Uwe Neumann Birgit Georgi
ADDITIONAL CONTRIBUTIONS:Thematic Background Papers:Brian H. Roberts; Pengfei Ni; Robert M. Buckley and Achilles Kallergis;
David Simon, Michail Fragkias, Robin Leichenko, Roberto Sánchez-
Rodríguez, Karen Seto and Bill Solecki, Susan Parnell and Matthew Sharp;
Ivan Turok.
City Reports for policy analysis:Latin America and the Caribbean: Francisco Perez Arellano
(Guadalajara);Ana Raquel Flores (Ciudad Del Este); Vladimir Morales
Gonzalez (Valparaíso);Flávio José Nery Conde Malta (Santos); Ibarra Rolando
Mendoza (Panama City); Oscar Bragos (Rosario); Tito Alejandro Alegría
Olazábal (Tijuana); Grethel Castellanos (Santo Domingo); Haydée Beltrán
Urán (Medellín); Isabel Viana (Montevideo); Miguel Coyula (Havana);
Carlos Foronda (La Paz); Alberto José Tobío (Guarenas); Luis Delgado
Galimberti (Lima); Alain Philippe Yerro (Fort-De-France)
Africa: Femi Olokesusi (Accra, Ibadan and Lagos);Yeraswork Admassie
(Addis Ababa); Hany M. Ayad (Alexandria); Madani Safar Zitoun (Algiers);
Albino Mazembe (Beira); Aldo Lupala (Dar es Salaam); Faustin Tirwirukwa
Kalabamu (Gaborone); Rosemary Awuor Hayanga (Johannesburg);
Allan Cain (Luanda); Godfrey Hampwaye and Wilma Nchito (Lusaka);
Alfred Omenya (Nairobi); C. Fernandez (Praia)
Asia and Arab States: Saswati G. Belliapa (Bangalore); Francisco
L. Fernandez (Cebu); Yanping Liu and Yuehan Wang (Chongqing);
Amelita Atillo (Davao); Pelin F. Kurtul (Gaziantep); Dung D. Dzung (Ho Chi
Minh City); Satyanarayana Vejella (Hyderabad); Syed Shabih ul Hassan
Zaidi. (Lahore); Lan Jin and Yanping Liu. (Shenzen); Centre for Livable
Cities (Singapore); Omar Khattab (Kuwait City); Ali Shabou, Nashwa Soboh,
Kamal Jalouka, Deema Abu Thaib, (Aqaba and Amman); Sinan Shakir A.
Karim (Basra); Mona Fawaz and Nisrene Baghdadi (Beirut); Ahmedou Mena
(Doha); Darim. Al-Bassam and Jalal Mouris (Dubai); Dara al Yaqubi (Erbil);
Falah Al- Kubaisy (Muharrak); Rana Hassan and Ismae’l Sheikh Hassan
(Saida).
Input to boxes: Cilla Ng, Inga Klevby, José Chong, Zeltia Gonzales, Estefania Villalobos,
Laura Petrella; Alexy Romero Garcia C.; Francisco Perez Arellano,
Design and page layout: Bounford.com (UK)
AcknowledgementsCORE TEAM
Director: Oyebanji O. Oyeyinka
Coordinator: Eduardo López Moreno
Task Manager: Ben C. Arimah
Statistical Adviser: Gora Mboup
Principal Authors: Eduardo López Moreno,
Ben C. Arimah, Gora Mboup, Mohamed Halfani, Oyebanji O. Oyeyinka
Research: Raymond Otieno Otieno, Gianluca Crispi, Anne Amin
City Prosperity Index: Gora Mboup, Wandia Riunga, John Obure
Editor: Thierry Naudin
SUPPORT TEAM
Contributors: Wandia Seaforth, Obas John Ebohon,
Cecilia M. Zanetta, Kaushalesh Lal, Dina K. Shehayeb,
Olumuyiwa Alaba, Sai Balakrishnan, Maria Buhigas,
Christopher Horwood
Statistics: Omondi Odhiambo, Joel Jere, Julius Majale,
Wandia Riunga, John Obure, Anne Kibe, Wladimir Ray, Kaushalesh Lal
Maps: Maharufa Hossain, Jane Arimah
Administrative Support Team: Beatrice Bazanye, Anne Idukitta,
Elizabeth Kahwae, Jacqueline Macha, Mary Dibo

Prosperity and Urban Trends
Part One
10
Conceptualizing Urban Prosperity
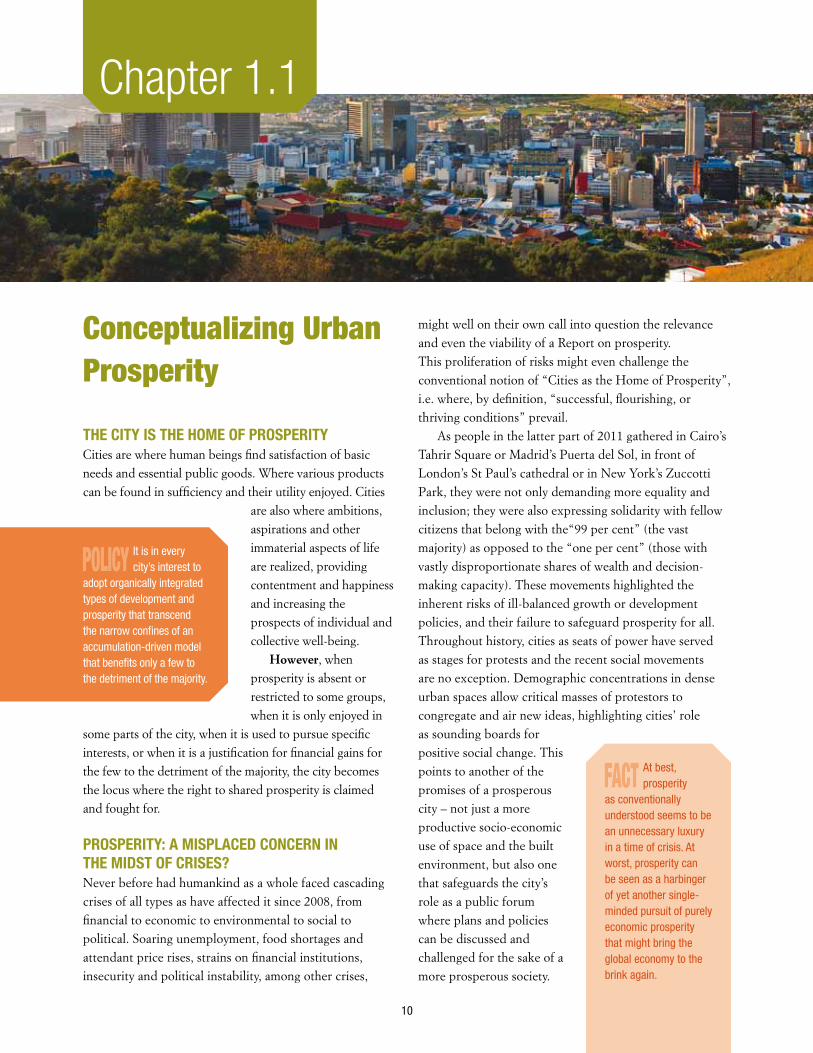
THE CITy IS THE HOME OF PROSPERITyCities are where human beings find satisfaction of basic needs and essential public goods. Where various products can be found in sufficiency and their utility enjoyed. Cities
are also where ambitions, aspirations and other immaterial aspects of life are realized, providing contentment and happiness and increasing the prospects of individual and collective well-being.
However, when prosperity is absent or restricted to some groups, when it is only enjoyed in
some parts of the city, when it is used to pursue specific interests, or when it is a justification for financial gains for the few to the detriment of the majority, the city becomes the locus where the right to shared prosperity is claimed and fought for.
PROSPERITy: A MISPLACED CONCERN IN THE MIDST OF CRISES?Never before had humankind as a whole faced cascading crises of all types as have affected it since 2008, from financial to economic to environmental to social to political. Soaring unemployment, food shortages and attendant price rises, strains on financial institutions, insecurity and political instability, among other crises,
might well on their own call into question the relevance and even the viability of a Report on prosperity. This proliferation of risks might even challenge the conventional notion of “Cities as the Home of Prosperity”, i.e. where, by definition, “successful, flourishing, or thriving conditions” prevail.
As people in the latter part of 2011 gathered in Cairo’s Tahrir Square or Madrid’s Puerta del Sol, in front of London’s St Paul’s cathedral or in New York’s Zuccotti Park, they were not only demanding more equality and inclusion; they were also expressing solidarity with fellow citizens that belong with the“99 per cent” (the vast majority) as opposed to the “one per cent” (those with vastly disproportionate shares of wealth and decision-making capacity). These movements highlighted the inherent risks of ill-balanced growth or development policies, and their failure to safeguard prosperity for all. Throughout history, cities as seats of power have served as stages for protests and the recent social movements are no exception. Demographic concentrations in dense urban spaces allow critical masses of protestors to congregate and air new ideas, highlighting cities’ role as sounding boards for positive social change. This points to another of the promises of a prosperous city – not just a more productive socio-economic use of space and the built environment, but also one that safeguards the city’s role as a public forum where plans and policies can be discussed and challenged for the sake of a more prosperous society.
Chapter 1.1
POLICy It is in every city’s interest to
adopt organically integrated types of development and prosperity that transcend the narrow confines of an accumulation-driven model that benefits only a few to the detriment of the majority.
FACT At best, prosperity
as conventionally understood seems to be an unnecessary luxury in a time of crisis. At worst, prosperity can be seen as a harbinger of yet another single-minded pursuit of purely economic prosperity that might bring the global economy to the brink again.
Conceptualizing Urban Prosperity
11
CITIES: REMEDy TO THE GLOBAL CRISESIf anything, the recent crises have demonstrated that cities around the world are, to varying degrees of intensity, exposed at least as much to the destructive as to the more beneficial effects of international markets, including social and political repercussions. In this sense, these crises did more than expose systemic market failures: they also highlighted major imbalances at the core of economic policy-making.2
When responding to such crises, national macroeconomic policies definitely have a major role to play through countercyclical public expenditure, strengthening bank supervision and financial regulations, introducing progressive income taxation, and reinforcing worldwide financial governance mechanisms, among other solutions.
However, responses to global crises must also allow for a vigorous role for cities. So far, cities have been perceived as the ‘engines’ of national economies and there is no reason to depart from that view. Indeed, urban authorities find themselves, at least notionally, in a position to boost production in the real sector of the economy at local level,
with attendant employment and income generation. If urban responses to economic crises are to be effective on a local scale with positive regional or national repercussions (‘multiplier effects’), then efficient, multi-way institutional, policy and budget linkages are required between all relevant
Crises, Cities and Prosperity
The financial crisis: Borrowing, borrowing, borrowingProminent scholars such as Joseph Stiglitz ascribe the 2008 financial crisis to rising income inequalities in countries around the world. In the face of stagnating real earnings, those households in the lower- and middle-income brackets were forced into more and more borrowing in order to maintain or improve living standards. With financiers experimenting with risky schemes at the other end of the credit chain, this situation led to a spate of defaults and, ultimately, the financial crash of 2008. The double irony of this crisis is that it originated in the efforts of a supposedly sophisticated financial system to give low-income categories a much-desired access to housing finance – and a foothold in prosperity.
The democratic crisis: “We are the 99 per cent!”The recent crisis is more than just an economic one. More fundamentally, it has exposed a number of risks to social justice, fairness, participation and, ultimately, democracy. Systematic decision-making in favour of those better-off is, in itself, a form of democratic deficit, and one that has led to popular movements like New York’s Occupy Wall Street. The movement “calls for a society organized around the needs, desires, dreams, of the 99 per cent, not the one per cent.” The other major uprisings of 2011 – the Arab Spring in North Africa and the Middle East, and Spain’s own Indignados – were also motivated by similar demands for better and deeper democracy as essential for overall prosperity.
These protests highlighted the fact that economic growth was a necessary condition for prosperity, though insufficient on its own: social and political inclusion is vital for prosperity.
The environmental crisis: The convergence of climate change and urbanisationThe current pattern of urbanization both in developed and developing countries converges on one and the same model: low density-based suburbanisation. Land speculation is associated with indiscriminate conversion of rural land to urban uses in the peripheries; this phenomenon combines with a growing reliance on individual motor vehicles and new-fangled middle-class lifestyles to expand urban areas way beyond formal city boundaries. A variety of economic agents can typically be found behind this trend, including real estate developers, home- and road-builders, national and international chain stores, among others, more often than not with support from banks and finance houses. Wasteful expansion of cities in endless peripheries is a major factor behind climate change. Beyond the physical threats from climate change, some cities stand to face an array of additional risks related to the provision of basic services and public goods (water supply, physical infrastructure, transport, energy, etc.), affecting industrial production, local economies, assets and livelihoods. Climate change may have ripple effects across many sectors of urban life, affecting the potential for prosperity of the more vulnerable populations: women, youth, children and ethnic minorities.1
Box 1.1.1
FACT Cities are a remedy to the global crises. They provide ready, flexible and creative platforms that can mitigate
the effects of regional and global crises in a pragmatic, balanced and efficient way. Cities can act as the fora where the linkages, trust, respect and inclusiveness that are part of any remedy to the crisis can be built. Acting locally in different areas and spaces, urban responses to the crisis can be structured and included in national agendas for more efficiency, with better chances of flexible responses and more beneficial effects. Although not immune to divisive partisanship and ideologies that can paralyze decision-making, cities find themselves in more privileged positions than national governments to negotiate and agree on responses with local stakeholders. They can forge new partnerships and local social pacts which, in turn, can strengthen national governments in the face of global challenges.
State of the World’s Cities 2012/2013
12
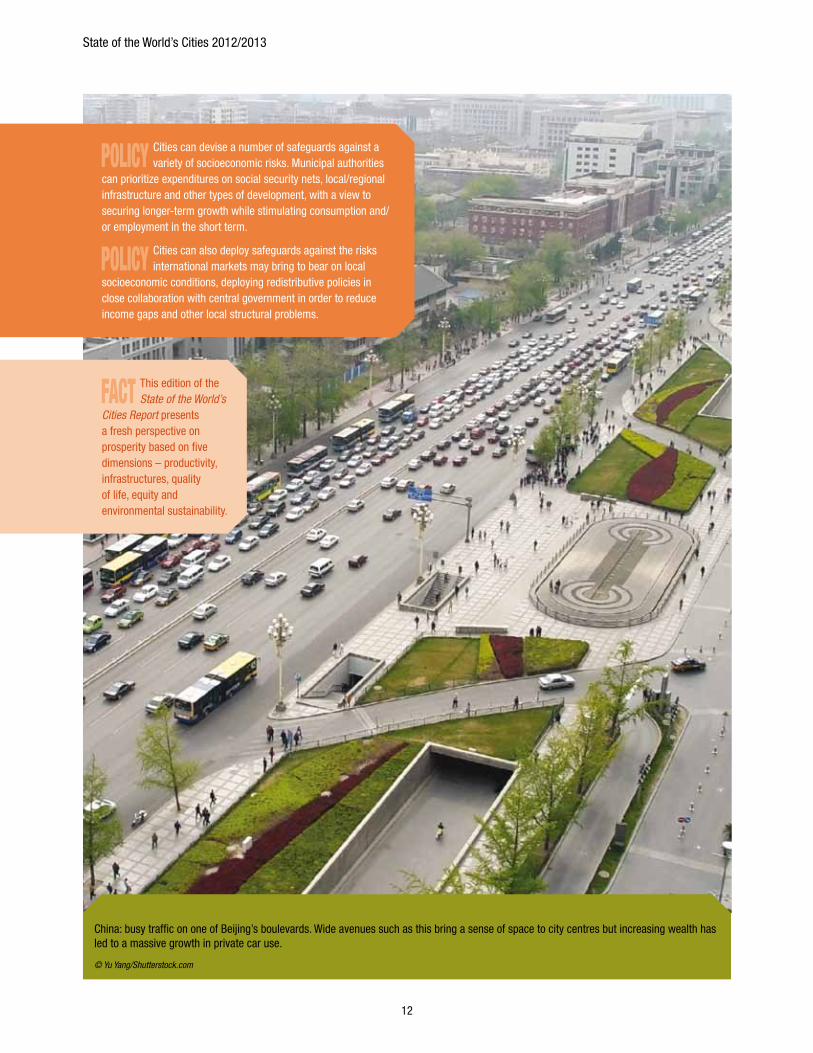
POLICy Cities can devise a number of safeguards against a variety of socioeconomic risks. Municipal authorities
can prioritize expenditures on social security nets, local/regional infrastructure and other types of development, with a view to securing longer-term growth while stimulating consumption and/or employment in the short term.
POLICy Cities can also deploy safeguards against the risks international markets may bring to bear on local
socioeconomic conditions, deploying redistributive policies in close collaboration with central government in order to reduce income gaps and other local structural problems.
FACT This edition of the State of the World’s
Cities Report presents a fresh perspective on prosperity based on five dimensions – productivity, infrastructures, quality of life, equity and environmental sustainability.
China: busy traffic on one of Beijing’s boulevards. Wide avenues such as this bring a sense of space to city centres but increasing wealth has led to a massive growth in private car use.
© Yu Yang/Shutterstock.com

Conceptualizing Urban Prosperity
13
tiers of government. In this respect, proper alignment of central and local government expenditures at city level can facilitate transfers and their effective use by urban authorities.
RE-THINkING URBAN PROSPERITyA poverty-stricken plumber in Hyderabad (India), a factory worker in Bogotá (Colombia), a middle manager in Madrid (Spain), a businessman in Fortaleza (Brazil), a car mechanic in Nairobi (Kenya) − all five will have aspirations to prosperous lives. However, prosperity means different things to different people around the world. Whatever the individual perception, regardless of culture and civilization, prosperity refers to a sense of general and individual socioeconomic security for the immediate and foreseeable future, which comes with the fulfilment of other, non-material needs and aspirations.
Yet, the prevailing view continues to confine prosperity to the realm of economics; a limiting view that shuts out other dimensions that are integral to human well-being and necessary for individual and collective fulfilment. If anything, the 2008 financial crisis has amplified the need to include other, non-economic dimensions in the understanding and measurement of prosperity.
This Report introduces a new gauge for the degree of prosperity in the cities of the world. Known as the City Prosperity Index and developed by UN-Habitat, this new instrument combines the five dimensions of prosperity as understood in this Report and as subsumed in measurable indicators. The index pinpoints strengths and weaknesses, in the process suggesting where policy action can address imbalances.
Re-thinking prosperity in those terms requires a shift away from the current dominant perspective, which is outdated and unsustainable on many grounds with its combination of cheap fossil fuel, heavy dependence on the motor car, highly segmented urban forms, socially and economically segregated spaces, endless urban peripheries that consume land, resources and in many cases natural protected areas – and all largely steered by private, not public interest.
CONCEPTUALIzING PROSPERITy: THE UN-HABITAT APPROACHProsperity implies success, wealth, thriving conditions, and wellbeing as well as opportunity. In any urban setting, a key question will arise: What are the essential conditions and elements that are required for a city to thrive, or for an urban area to be described as prosperous, or for the
wellbeing of the population? Put differently, what are the manifestations or outcomes of a prosperous city? In general terms, a prosperous city offers a profusion of public goods and develops policies and actions for a sustainable use and equitable access to ‘commons’.3 More specifically, several elements which come to mind guide what constitutes the UN-Habitat conceptualization of Prosperity.
First, a prosperous city contributes to economic growth through productivity, generating the income and employment that afford adequate living standards for the whole population.
Second, a prosperous city deploys the infrastructure, physical assets and amenities – adequate water, sanitation, power supply, road network, information and communications technology etc. – required to sustain both the population and the economy.
Third, prosperous cities provide the social services – education, health, recreation, safety and security etc. – required for improved living standards, enabling the population to maximize individual potential and lead fulfilling lives.
Fourth, a city is only prosperous to the extent that poverty and inequalities are minimal. No city can claim to be prosperous when large segments of the population live in abject poverty and deprivation.
POLICy A fresh approach
to prosperity is needed, not just to respond to the effects of the crisis and safeguard against new risks, but also to steer the world towards economically, socially, politically and environmentally prosperous urban futures.
POLICy Shared urban prosperity puts people first, values the tangible and intangible aspects of development,
promotes inclusive economic growth, protects human rights, ensures enabling equitable development, cares for the natural environment, reduces disaster risks and vulnerabilities for the poor and builds resilience to adverse forces of nature. This new city – the city of the 21st century –creates harmony between the five dimensions of prosperity and enhances the prospects for a better future.
POLICy The ‘good’, people-centred city of the 21st century stimulates local job creation, promotes social
diversity, maintains a sustainable environment and recognises the importance of public spaces. In short, this is a city that comes with a change of pace, profile and urban functions and provides the social, political and economic conditions of prosperity – a city that is all-encompassing and accessible to everyone.
State of the World’s Cities 2012/2013
14
This involves reducing the incidence of slums and new forms of poverty. Prosperous cities are equitable and socially inclusive. The benefits and opportunities that come with a prosperous city are equitably (re)distributed. A prosperous city ensures gender equality, protects the rights of minority and vulnerable groups, and ensures civic participation by all in the social, political and cultural spheres.
Fifth, the creation and (re)distribution of the benefits of prosperity do not destroy or degrade the environment, instead the city’s natural assets are preserved for the sake of sustainable urbanization.
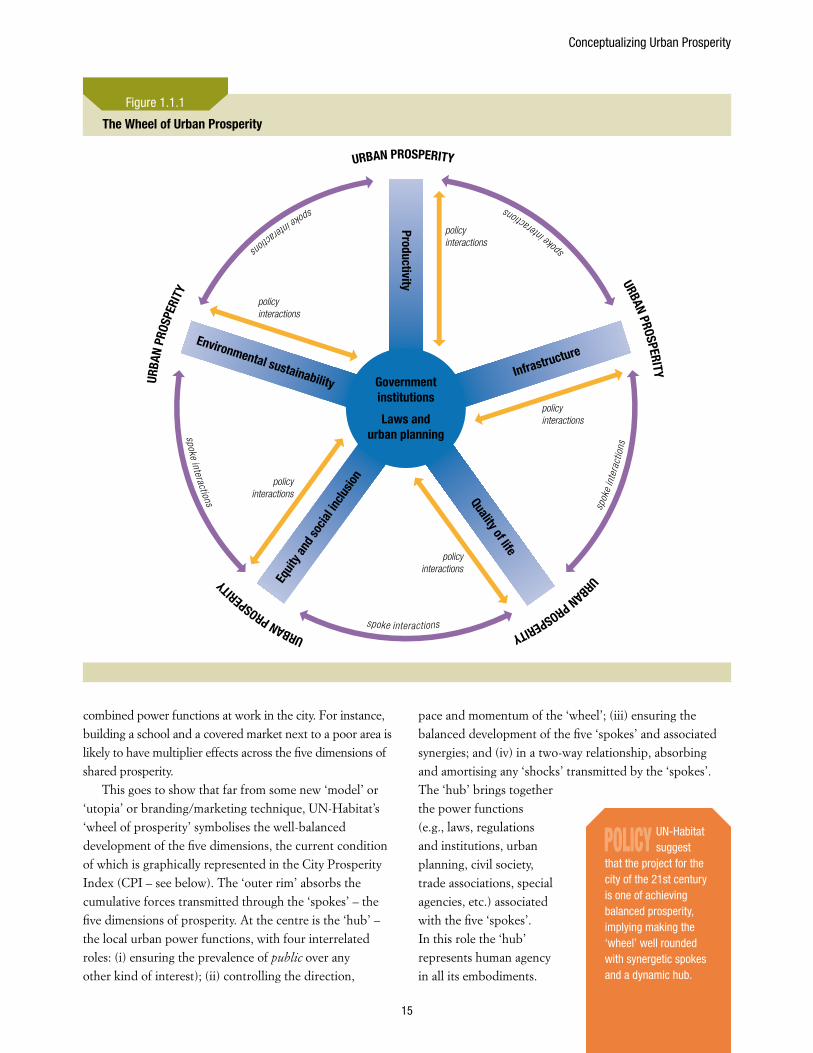
THE ‘WHEEL OF URBAN PROSPERITy’Prosperity, as defined by UN-Habitat, is a social construct that materializes in the realm of human actions. It builds deliberately and conscientiously on the objective conditions prevailing in a city at any time, wherever located and however large or small. It is a broader, wide-ranging notion that has to do with well-balanced, harmonious development in an environment of fairness and justice.
As described above, prosperity takes in all urban functions as subsumed in five main categories. Since shared, balanced development is a crucial feature of prosperity, none of the dimensions must prevail over the others and all must be kept roughly ‘equal’ – for the sake of a smooth ‘ride’ on the path of prosperity. In practice, of course, it is a rare city where the five dimensions will be found equal at any point in time, and this is where policy interventions will be called for, as suggested graphically by the profile of the city’s specific ‘city prosperity index’. For instance,
infrastructure may be well-advanced, but inaccessible to large portion of the population, therefore compromising the notion of equity. In other, frequent situations, a city may be economically efficient, enhancing job opportunities, but the natural environment is neglected.
Since socioeconomic conditions keep changing on a local and a broader scale, they will have an effect on one or more of the five dimensions of prosperity, and it will be for policy interventions to restore the balance. In this endeavour, urban authorities will find that the various interlinkages and interdependencies between the five dimensions can also be of a positive nature. For instance, provision of water and sanitation in informal settlements will improve both equity and quality of life, and even the environment. This points to the ‘natural’ or ‘spontaneous’ interdependencies between the five dimensions along the outer rim of the wheel. These can also be strengthened with a multiplier effect through deliberate, well-targeted interventions through the ‘hub’ of the wheel, i.e., the
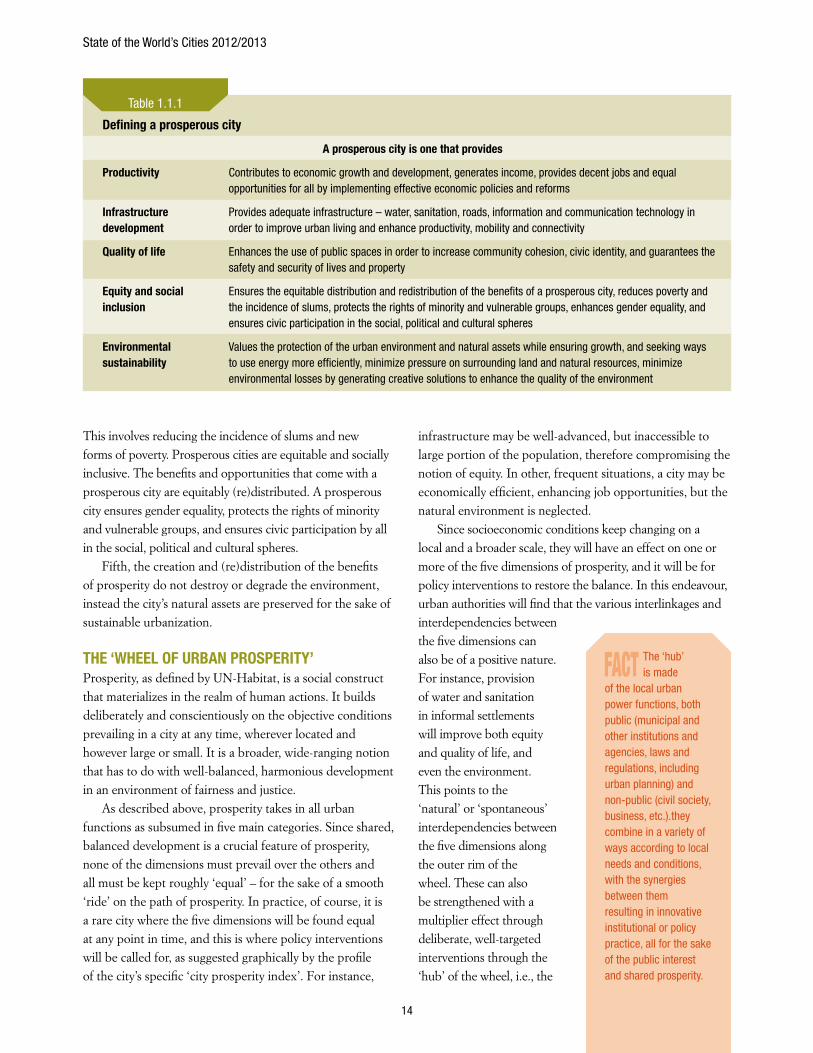
Defining a prosperous city
A prosperous city is one that provides
Productivity Contributes to economic growth and development, generates income, provides decent jobs and equal opportunities for all by implementing effective economic policies and reforms
Infrastructure development
Provides adequate infrastructure – water, sanitation, roads, information and communication technology in order to improve urban living and enhance productivity, mobility and connectivity
Quality of life Enhances the use of public spaces in order to increase community cohesion, civic identity, and guarantees the safety and security of lives and property
Equity and social inclusion
Ensures the equitable distribution and redistribution of the benefits of a prosperous city, reduces poverty and the incidence of slums, protects the rights of minority and vulnerable groups, enhances gender equality, and ensures civic participation in the social, political and cultural spheres
Environmental sustainability
Values the protection of the urban environment and natural assets while ensuring growth, and seeking ways to use energy more efficiently, minimize pressure on surrounding land and natural resources, minimize environmental losses by generating creative solutions to enhance the quality of the environment
Table 1.1.1
FACT The ‘hub’ is made
of the local urban power functions, both public (municipal and other institutions and agencies, laws and regulations, including urban planning) and non-public (civil society, business, etc.).they combine in a variety of ways according to local needs and conditions, with the synergies between them resulting in innovative institutional or policy practice, all for the sake of the public interest and shared prosperity.
Conceptualizing Urban Prosperity
15
combined power functions at work in the city. For instance, building a school and a covered market next to a poor area is likely to have multiplier effects across the five dimensions of shared prosperity.
This goes to show that far from some new ‘model’ or ‘utopia’ or branding/marketing technique, UN-Habitat’s ‘wheel of prosperity’ symbolises the well-balanced development of the five dimensions, the current condition of which is graphically represented in the City Prosperity Index (CPI – see below). The ‘outer rim’ absorbs the cumulative forces transmitted through the ‘spokes’ – the five dimensions of prosperity. At the centre is the ‘hub’ – the local urban power functions, with four interrelated roles: (i) ensuring the prevalence of public over any other kind of interest); (ii) controlling the direction,
pace and momentum of the ‘wheel’; (iii) ensuring the balanced development of the five ‘spokes’ and associated synergies; and (iv) in a two-way relationship, absorbing and amortising any ‘shocks’ transmitted by the ‘spokes’. The ‘hub’ brings together the power functions (e.g., laws, regulations and institutions, urban planning, civil society, trade associations, special agencies, etc.) associated with the five ‘spokes’. In this role the ‘hub’ represents human agency in all its embodiments.
The Wheel of Urban Prosperity
URBAN PROSPERITYUR
BAN
PROS
PERI
TY
URBAN PROSPERITYURBAN PROSPERITY
URBAN PROSPERITY
Governmentinstitutions
Laws andurban planning
policyinteractions
policyinteractions
policyinteractions
policyinteractions
policyinteractions
Productivity
InfrastructureEnvironmental sustainability
Equi
ty an
d so
cial in
clusio
nQuality of life
spoke interactions
spok
e in
tera
ctio
ns
spok
e interactionsspoke interactions
spoke interactions
Figure 1.1.1
POLICy UN-Habitat suggest
that the project for the city of the 21st century is one of achieving balanced prosperity, implying making the ‘wheel’ well rounded with synergetic spokes and a dynamic hub.
State of the World’s Cities 2012/2013
16
It holds the five ‘spokes’ together and endeavours to maintain their balance and symmetry.
MEASURING PROSPERITy: ATTEMPTS, FAILURES AND PROGRESS Prosperity remains one of humankind’s most enduring pursuits across time and space. But it is only in the past few decades that decision-makers, academics, practitioners and populations have started to measure this important dimension of human development. This has been a journey of learning, trial and error. The adage “what gets measured,
gets done” has injected a sense of urgency in the pursuit not just of prosperity per se, but also of an operational definition complete with specific indicators.
More than 70 years ago in 1937, the Nobel-winning metric of gross domestic product (GDP) was purported to be the ‘mother of all statistics’, capturing the notion of prosperity through total production of goods and services. Although GDP spread rapidly and was widely accepted for decades, it is becoming more and more apparent that this aggregate is too narrow to provide the accurate measure of a society’s overall well-being today. In 1972, the king of Bhutan declared he was interested in measuring ‘Gross National Happiness’ (GNH). In 1990, US economist Mahbub ul-Haq convinced future Nobel laureate Amartya Sen to create “an index as vulgar as GDP but more relevant to our own lives.”4 In 2006, China developed its own “Green GDP Index”, which seriously challenged the validity of the standard aggregate, once environmental aspects were factored in.5 In 2009, Joseph Stiglitz called for
an end to “GDP fetishism” and, one year later, the British government announced that it would, for the first time, survey happiness in addition to purely economic measures.6
Prosperity is a more complex notion, one that cannot be captured through straightforward indices that measure how much money people earn or how many cars they own. A ‘prosperous’ life includes other non-material, non-tangible dimensions, like having a voice in shaping the future of one’s city, having meaningful relationships, belonging to supportive communities, and having the resources and capabilities to transform your dreams into concrete realities.
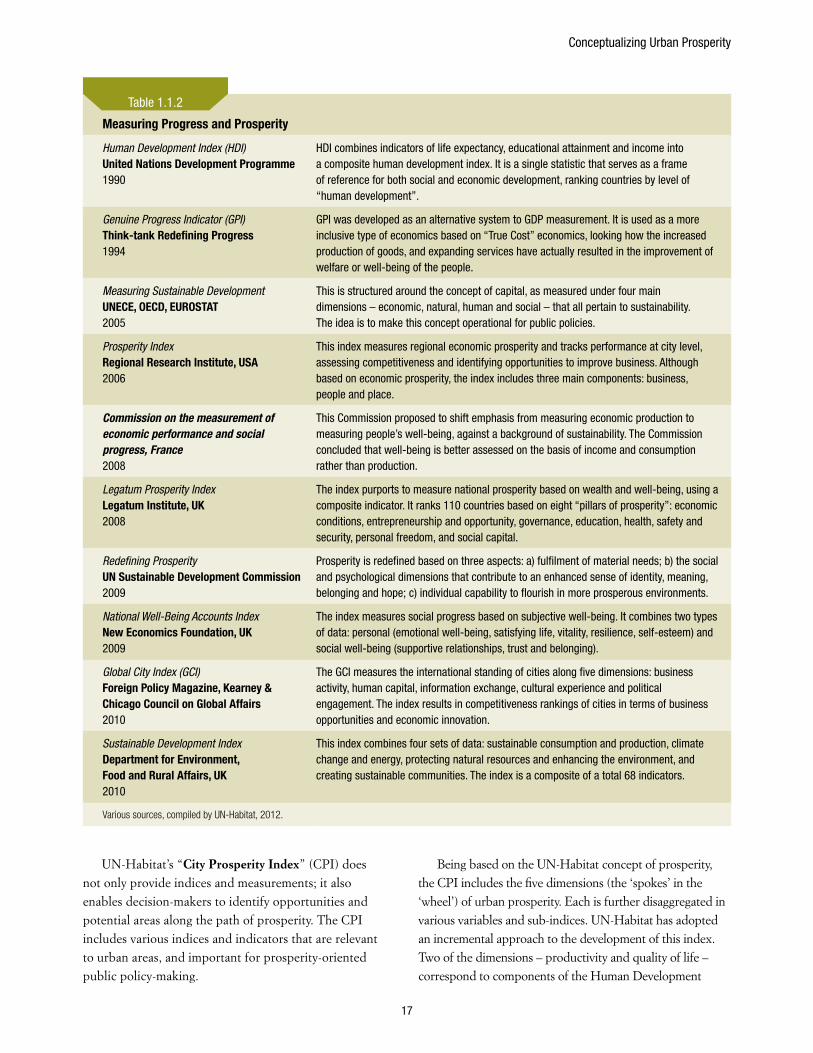
Recent efforts have attempted to include these other dimensions of prosperity for a more accurate representation of societal progress. Table 1.1.2 presents a summary of these methods and approaches.
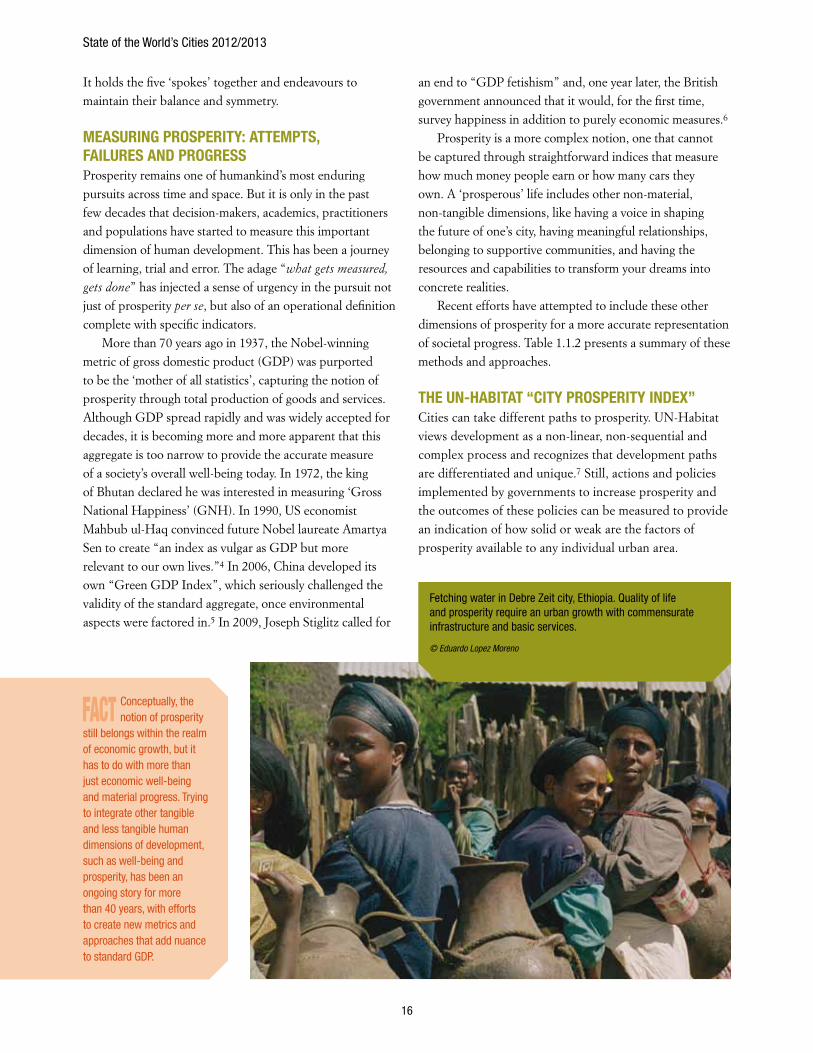
THE UN-HABITAT “CITy PROSPERITy INDEx”Cities can take different paths to prosperity. UN-Habitat views development as a non-linear, non-sequential and complex process and recognizes that development paths are differentiated and unique.7 Still, actions and policies implemented by governments to increase prosperity and the outcomes of these policies can be measured to provide an indication of how solid or weak are the factors of prosperity available to any individual urban area.
FACT Conceptually, the notion of prosperity
still belongs within the realm of economic growth, but it has to do with more than just economic well-being and material progress. Trying to integrate other tangible and less tangible human dimensions of development, such as well-being and prosperity, has been an ongoing story for more than 40 years, with efforts to create new metrics and approaches that add nuance to standard GDP.
Fetching water in Debre Zeit city, Ethiopia. Quality of life and prosperity require an urban growth with commensurate infrastructure and basic services.
© Eduardo Lopez Moreno
Conceptualizing Urban Prosperity
17
UN-Habitat’s “City Prosperity Index” (CPI) does not only provide indices and measurements; it also enables decision-makers to identify opportunities and potential areas along the path of prosperity. The CPI includes various indices and indicators that are relevant to urban areas, and important for prosperity-oriented public policy-making.
Being based on the UN-Habitat concept of prosperity, the CPI includes the five dimensions (the ‘spokes’ in the ‘wheel’) of urban prosperity. Each is further disaggregated in various variables and sub-indices. UN-Habitat has adopted an incremental approach to the development of this index. Two of the dimensions – productivity and quality of life – correspond to components of the Human Development
Measuring Progress and Prosperity
Human Development Index (HDI) United Nations Development Programme 1990
HDI combines indicators of life expectancy, educational attainment and income into a composite human development index. It is a single statistic that serves as a frame of reference for both social and economic development, ranking countries by level of “human development”.
Genuine Progress Indicator (GPI) Think-tank Redefining Progress 1994
GPI was developed as an alternative system to GDP measurement. It is used as a more inclusive type of economics based on “True Cost” economics, looking how the increased production of goods, and expanding services have actually resulted in the improvement of welfare or well-being of the people.
Measuring Sustainable Development UNECE, OECD, EUROSTAT 2005
This is structured around the concept of capital, as measured under four main dimensions – economic, natural, human and social – that all pertain to sustainability. The idea is to make this concept operational for public policies.
Prosperity Index Regional Research Institute, USA 2006
This index measures regional economic prosperity and tracks performance at city level, assessing competitiveness and identifying opportunities to improve business. Although based on economic prosperity, the index includes three main components: business, people and place.
Commission on the measurement of economic performance and social progress, France 2008
This Commission proposed to shift emphasis from measuring economic production to measuring people’s well-being, against a background of sustainability. The Commission concluded that well-being is better assessed on the basis of income and consumption rather than production.
Legatum Prosperity Index Legatum Institute, Uk 2008
The index purports to measure national prosperity based on wealth and well-being, using a composite indicator. It ranks 110 countries based on eight “pillars of prosperity”: economic conditions, entrepreneurship and opportunity, governance, education, health, safety and security, personal freedom, and social capital.
Redefining Prosperity UN Sustainable Development Commission 2009
Prosperity is redefined based on three aspects: a) fulfilment of material needs; b) the social and psychological dimensions that contribute to an enhanced sense of identity, meaning, belonging and hope; c) individual capability to flourish in more prosperous environments.
National Well-Being Accounts Index New Economics Foundation, Uk 2009
The index measures social progress based on subjective well-being. It combines two types of data: personal (emotional well-being, satisfying life, vitality, resilience, self-esteem) and social well-being (supportive relationships, trust and belonging).
Global City Index (GCI) Foreign Policy Magazine, kearney & Chicago Council on Global Affairs2010
The GCI measures the international standing of cities along five dimensions: business activity, human capital, information exchange, cultural experience and political engagement. The index results in competitiveness rankings of cities in terms of business opportunities and economic innovation.
Sustainable Development Index Department for Environment, Food and Rural Affairs, Uk 2010
This index combines four sets of data: sustainable consumption and production, climate change and energy, protecting natural resources and enhancing the environment, and creating sustainable communities. The index is a composite of a total 68 indicators.
Various sources, compiled by UN-Habitat, 2012.
Table 1.1.2
State of the World’s Cities 2012/2013
18
Index (HDI), and have been used to compute the “City Human Development Index” (CHDI). The three other dimensions – infrastructure, environmental sustainability and equity – are made of various key indicators as indicated in Table 1.1.3. Although more refinement is still needed in
terms of what indicators are included in the index and with which respective weightings, those that have been selected offer the possibility of disaggregating the different dimensions of prosperity, in the process identifying policy intervention areas.8
Although in many cases the prosperity of a city will go hand in hand with that of the country, significant variations in CPI measures
can be found in cities in the same country, and this goes to show that national aggregates do not necessarily reflect what happens in different regions or cities. Most existing prosperity indices provide estimations for countries only (see Table 1.1.2). By comparison, the UN-Habitat City Prosperity Index is unique in the world for two reasons: (i) it focuses on individual cities, as opposed to countries, and (ii) it is concerned with prosperity as measured across five dimensions, of which the local economy is only one, as opposed to the sole business environment. The resulting CPI values can be regrouped in six distinct brackets that range from cities with ‘very solid’ prosperity factors to those where those factors are found to be ‘very weak’.9
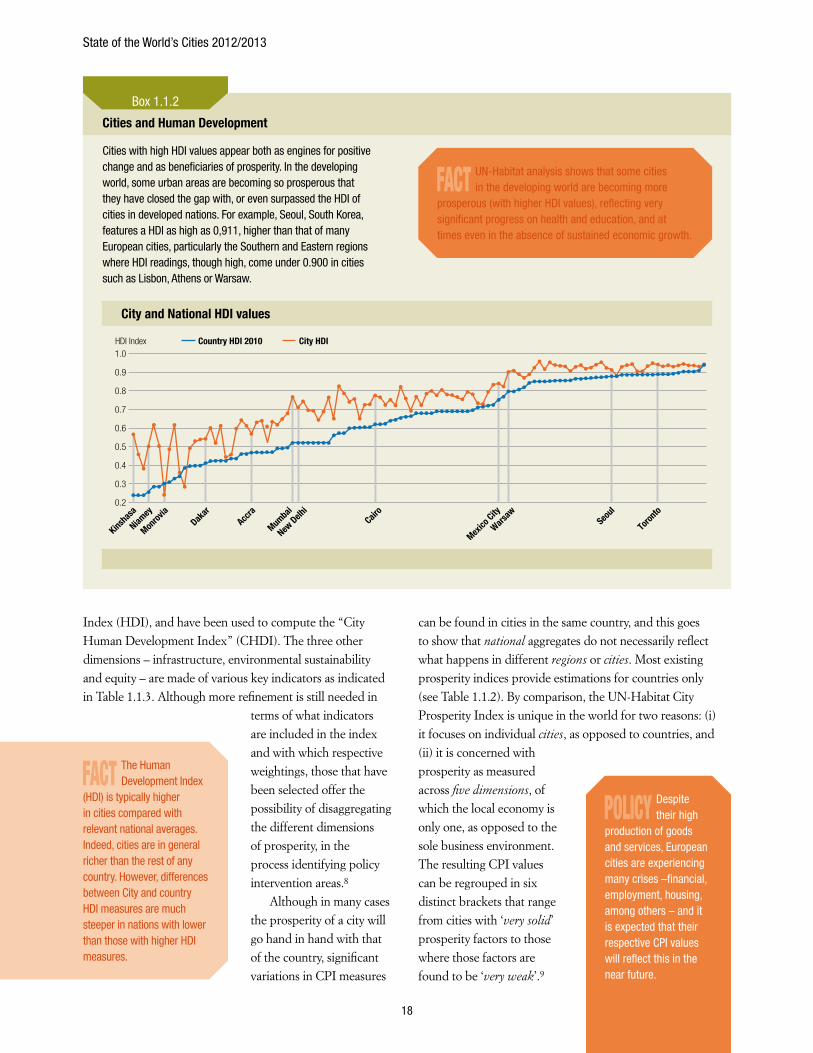
Cities and Human Development
Cities with high HDI values appear both as engines for positive change and as beneficiaries of prosperity. In the developing world, some urban areas are becoming so prosperous that they have closed the gap with, or even surpassed the HDI of cities in developed nations. For example, Seoul, South Korea, features a HDI as high as 0,911, higher than that of many European cities, particularly the Southern and Eastern regions where HDI readings, though high, come under 0.900 in cities such as Lisbon, Athens or Warsaw.
Box 1.1.2
FACT The Human Development Index
(HDI) is typically higher in cities compared with relevant national averages. Indeed, cities are in general richer than the rest of any country. However, differences between City and country HDI measures are much steeper in nations with lower than those with higher HDI measures.
FACT UN-Habitat analysis shows that some cities in the developing world are becoming more
prosperous (with higher HDI values), reflecting very significant progress on health and education, and at times even in the absence of sustained economic growth.
City and National HDI values
City HDICountry HDI 2010HDI Index
Kinsha
sa
Niamey
Monrov
iaDak
arAcc
ra
Mumba
i
New Delh
iCair
o
Mexico
City
Warsaw
Toron
toSeo
ul
1.0
0.9
0.8
0.7
0.6
0.5
0.4
0.3
0.2
POLICy Despite their high
production of goods and services, European cities are experiencing many crises –financial, employment, housing, among others – and it is expected that their respective CPI values will reflect this in the near future.
Conceptualizing Urban Prosperity
19
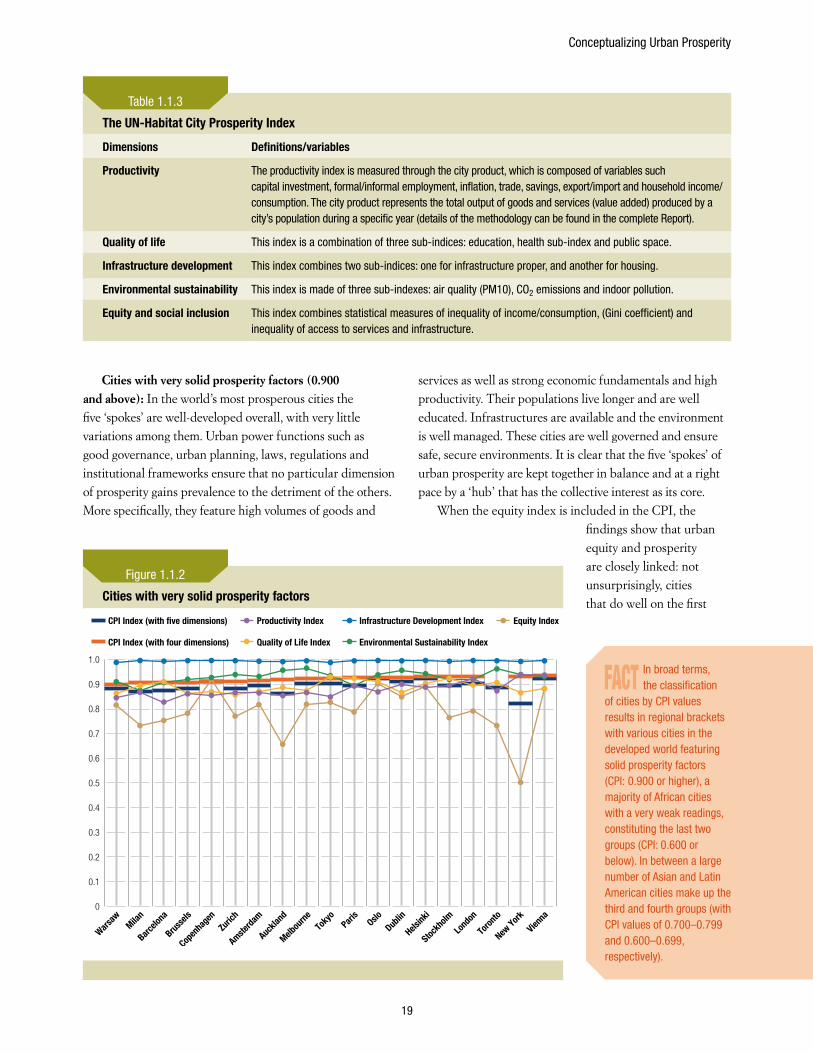
Cities with very solid prosperity factors (0.900 and above): In the world’s most prosperous cities the five ‘spokes’ are well-developed overall, with very little variations among them. Urban power functions such as good governance, urban planning, laws, regulations and institutional frameworks ensure that no particular dimension of prosperity gains prevalence to the detriment of the others. More specifically, they feature high volumes of goods and
services as well as strong economic fundamentals and high productivity. Their populations live longer and are well educated. Infrastructures are available and the environment is well managed. These cities are well governed and ensure safe, secure environments. It is clear that the five ‘spokes’ of urban prosperity are kept together in balance and at a right pace by a ‘hub’ that has the collective interest as its core.
When the equity index is included in the CPI, the findings show that urban equity and prosperity are closely linked: not unsurprisingly, cities that do well on the first
The UN-Habitat City Prosperity Index
Dimensions Definitions/variables
Productivity The productivity index is measured through the city product, which is composed of variables such capital investment, formal/informal employment, inflation, trade, savings, export/import and household income/consumption. The city product represents the total output of goods and services (value added) produced by a city’s population during a specific year (details of the methodology can be found in the complete Report).
Quality of life This index is a combination of three sub-indices: education, health sub-index and public space.
Infrastructure development This index combines two sub-indices: one for infrastructure proper, and another for housing.
Environmental sustainability This index is made of three sub-indexes: air quality (PM10), CO2 emissions and indoor pollution.
Equity and social inclusion This index combines statistical measures of inequality of income/consumption, (Gini coefficient) and inequality of access to services and infrastructure.
Table 1.1.3
FACT In broad terms, the classification
of cities by CPI values results in regional brackets with various cities in the developed world featuring solid prosperity factors (CPI: 0.900 or higher), a majority of African cities with a very weak readings, constituting the last two groups (CPI: 0.600 or below). In between a large number of Asian and Latin American cities make up the third and fourth groups (with CPI values of 0.700–0.799 and 0.600–0.699, respectively).
Cities with very solid prosperity factors
Productivity Index
Quality of Life Index
Infrastructure Development Index
Environmental Sustainability IndexCPI Index (with four dimensions)
Equity IndexCPI Index (with �ve dimensions)
Warsaw
Milan
Barcelo
na
Brusse
ls
Copen
hage
nZu
rich
Amsterda
m
Auckla
nd
Melbou
rneTo
kyo
Paris
OsloDub
lin
Helsink
i
Stockh
olm
Lond
on
Toron
to
New York
Vienna
1.0
0.9
0.8
0.7
0.6
0.5
0.4
0.3
0.2
0.1
0
Figure 1.1.2
State of the World’s Cities 2012/2013
20
four dimensions of prosperity (with very solid prosperity factors) seem to be more equitable. In most cities of this group, inequality is relatively low, as reflected in low Gini coefficients (typically below 0.4, the exception being New York where inequality is significantly steeper (0.5)). When the equity dimension is taken into consideration, the CPI remains high for all cities (i.e., above 0.800), but only half remain with ‘very solid’ prosperity factors (i.e., CPI above 0.900).
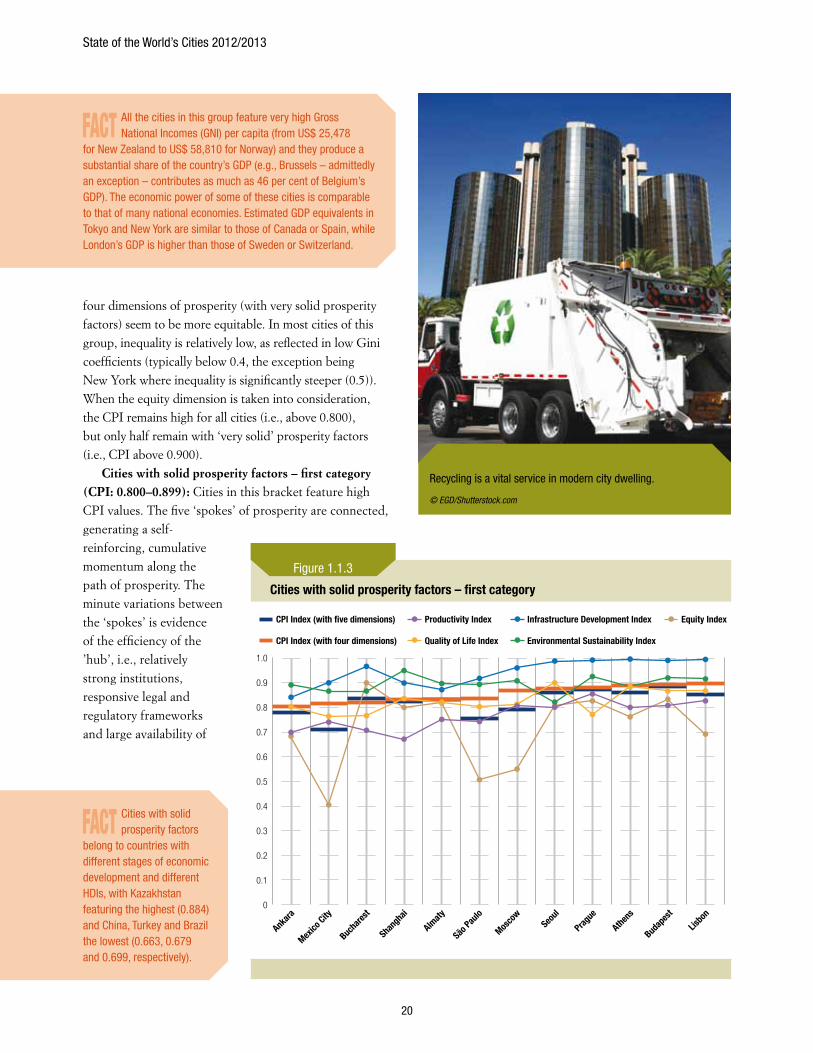
Cities with solid prosperity factors – first category (CPI: 0.800–0.899): Cities in this bracket feature high CPI values. The five ‘spokes’ of prosperity are connected, generating a self-reinforcing, cumulative momentum along the path of prosperity. The minute variations between the ‘spokes’ is evidence of the efficiency of the ’hub’, i.e., relatively strong institutions, responsive legal and regulatory frameworks and large availability of
FACT All the cities in this group feature very high Gross National Incomes (GNI) per capita (from US$ 25,478
for New Zealand to US$ 58,810 for Norway) and they produce a substantial share of the country’s GDP (e.g., Brussels – admittedly an exception – contributes as much as 46 per cent of Belgium’s GDP). The economic power of some of these cities is comparable to that of many national economies. Estimated GDP equivalents in Tokyo and New York are similar to those of Canada or Spain, while London’s GDP is higher than those of Sweden or Switzerland.
Cities with solid prosperity factors – first category
Productivity Index
Quality of Life Index
Infrastructure Development Index
Environmental Sustainability IndexCPI Index (with four dimensions)
Equity IndexCPI Index (with �ve dimensions)
Ankara
Mexico
City
Bucha
rest
Shang
hai
Almaty
São Pau
lo
Mosco
wSeo
ul
Prague
Athens
Budap
est
Lisbo
n
1.0
0.9
0.8
0.7
0.6
0.5
0.4
0.3
0.2
0.1
0
Figure 1.1.3
FACT Cities with solid prosperity factors
belong to countries with different stages of economic development and different HDIs, with Kazakhstan featuring the highest (0.884) and China, Turkey and Brazil the lowest (0.663, 0.679 and 0.699, respectively).
Recycling is a vital service in modern city dwelling.
© EGD/Shutterstock.com
Conceptualizing Urban Prosperity
21
public goods. Cities in Southern and Eastern Europe such as Lisbon, Athens, Warsaw, Budapest, Prague, Bucharest and Moscow feature in this bracket, along with others in Latin America and Asia: São Paulo, Mexico City, Almaty (Kazakhstan), Shanghai, Seoul and Ankara.
However, it is important to note that high inequalities in Moscow, Mexico City and São Paulo interfere with their
performance in terms of prosperity. When the equity index is included in the CPI, both cities score below 0.800. This suggests that, although prosperity factors remain on the whole solid, they are somewhat weaker. While inequality is historically entrenched in most Latin American cities, it is a recent phenomenon in Russia, in the extended aftermath of economic liberalization.
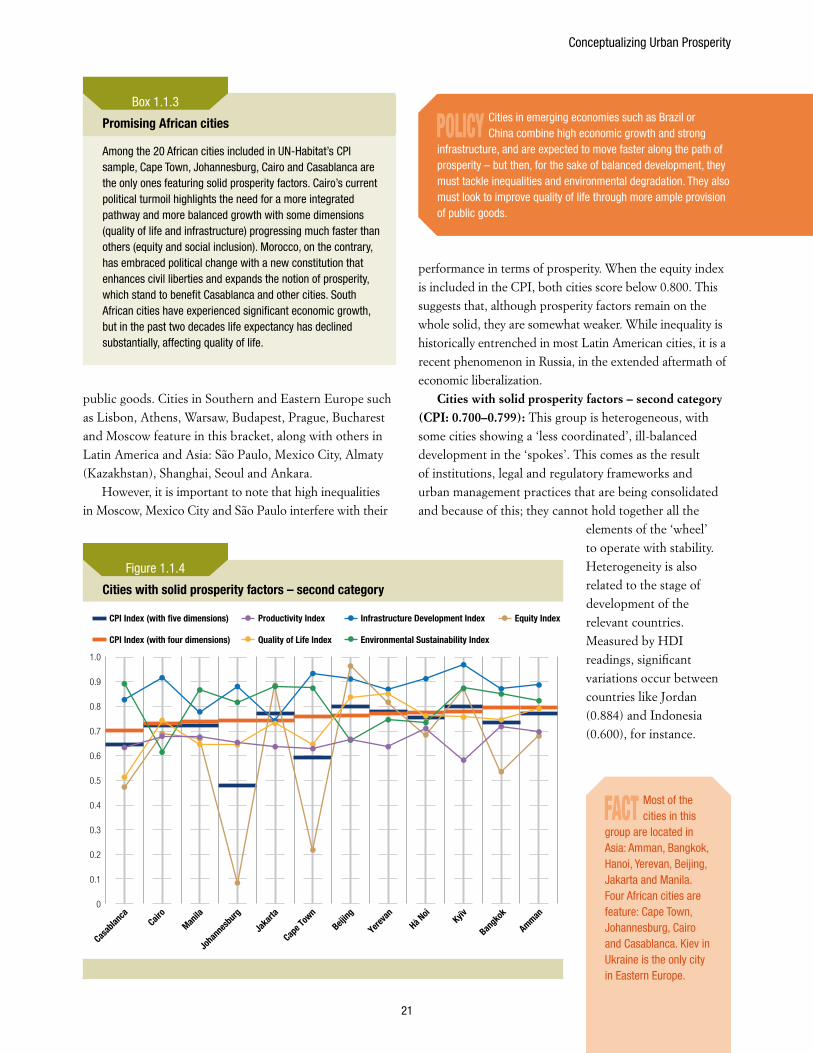
Cities with solid prosperity factors – second category (CPI: 0.700–0.799): This group is heterogeneous, with some cities showing a ‘less coordinated’, ill-balanced development in the ‘spokes’. This comes as the result of institutions, legal and regulatory frameworks and urban management practices that are being consolidated and because of this; they cannot hold together all the
elements of the ‘wheel’ to operate with stability. Heterogeneity is also related to the stage of development of the relevant countries. Measured by HDI readings, significant variations occur between countries like Jordan (0.884) and Indonesia (0.600), for instance.
Cities with solid prosperity factors – second category
Productivity Index
Quality of Life Index
Infrastructure Development Index
Environmental Sustainability IndexCPI Index (with four dimensions)
Equity IndexCPI Index (with �ve dimensions)
Casab
lanca
Cairo
Manila
Joha
nnes
burg
Jaka
rta
Cape T
own
Beijing
Yereva
nHà N
oiKyïv
Bangk
ok
Amman
1.0
0.9
0.8
0.7
0.6
0.5
0.4
0.3
0.2
0.1
0
Figure 1.1.4
POLICy Cities in emerging economies such as Brazil or China combine high economic growth and strong
infrastructure, and are expected to move faster along the path of prosperity – but then, for the sake of balanced development, they must tackle inequalities and environmental degradation. They also must look to improve quality of life through more ample provision of public goods.
FACT Most of the cities in this
group are located in Asia: Amman, Bangkok, Hanoi, Yerevan, Beijing, Jakarta and Manila. Four African cities are feature: Cape Town, Johannesburg, Cairo and Casablanca. Kiev in Ukraine is the only city in Eastern Europe.
Promising African cities
Among the 20 African cities included in UN-Habitat’s CPI sample, Cape Town, Johannesburg, Cairo and Casablanca are the only ones featuring solid prosperity factors. Cairo’s current political turmoil highlights the need for a more integrated pathway and more balanced growth with some dimensions (quality of life and infrastructure) progressing much faster than others (equity and social inclusion). Morocco, on the contrary, has embraced political change with a new constitution that enhances civil liberties and expands the notion of prosperity, which stand to benefit Casablanca and other cities. South African cities have experienced significant economic growth, but in the past two decades life expectancy has declined substantially, affecting quality of life.
Box 1.1.3
State of the World’s Cities 2012/2013
22
Interestingly, the capital cities of these two countries do not feature such extreme variations in their respective HDIs (0.810 for Amman and 0.755 for Jakarta).
However, it is important to note that inequality is inconsistent with prosperity as understood in this Report. When the equity index is included in the CPI, Cape Town and Johannesburg (which both feature very high Gini coefficients), drop from the bracket of cities with ‘solid’ prosperity factors and join the group with ‘weak’ or even ‘very weak’ prosperity factors, with CPI values of 0.590 and 0.479 respectively.
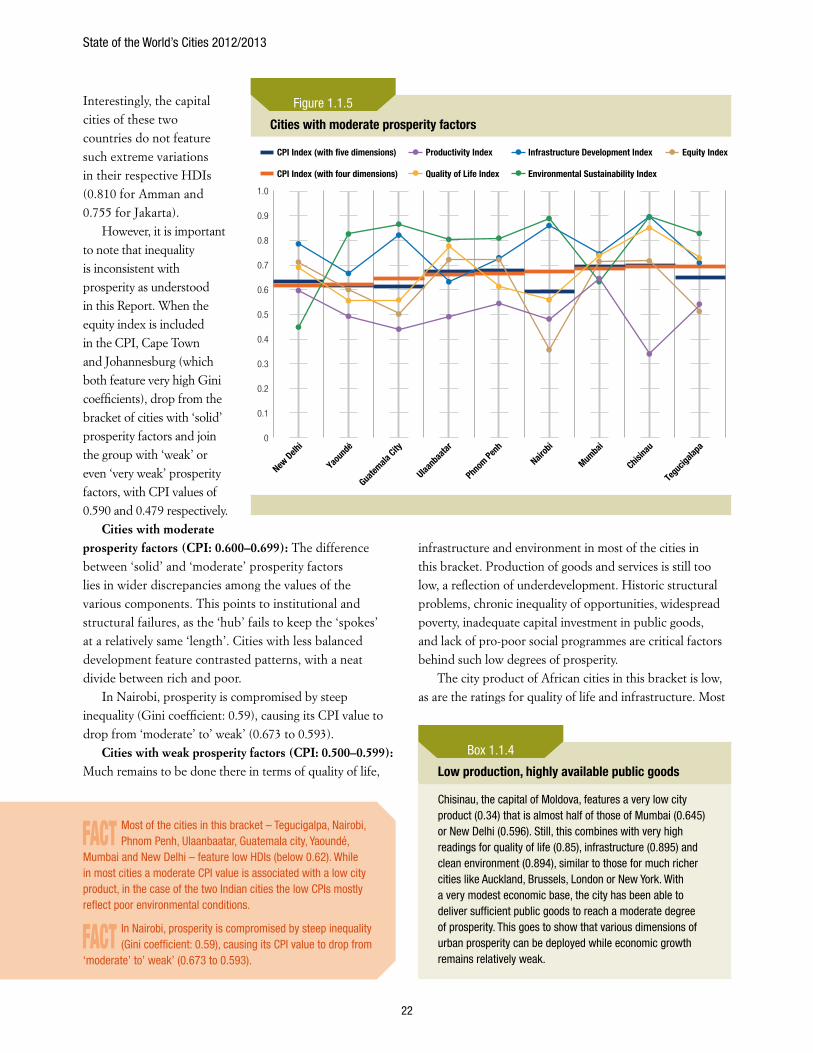
Cities with moderate prosperity factors (CPI: 0.600–0.699): The difference between ‘solid’ and ‘moderate’ prosperity factors lies in wider discrepancies among the values of the various components. This points to institutional and structural failures, as the ‘hub’ fails to keep the ‘spokes’ at a relatively same ‘length’. Cities with less balanced development feature contrasted patterns, with a neat divide between rich and poor.
In Nairobi, prosperity is compromised by steep inequality (Gini coefficient: 0.59), causing its CPI value to drop from ‘moderate’ to’ weak’ (0.673 to 0.593).
Cities with weak prosperity factors (CPI: 0.500–0.599): Much remains to be done there in terms of quality of life,
infrastructure and environment in most of the cities in this bracket. Production of goods and services is still too low, a reflection of underdevelopment. Historic structural problems, chronic inequality of opportunities, widespread poverty, inadequate capital investment in public goods, and lack of pro-poor social programmes are critical factors behind such low degrees of prosperity.
The city product of African cities in this bracket is low, as are the ratings for quality of life and infrastructure. Most
Cities with moderate prosperity factors
Productivity Index
Quality of Life Index
Infrastructure Development Index
Environmental Sustainability IndexCPI Index (with four dimensions)
Equity IndexCPI Index (with �ve dimensions)
New Delh
i
Yaoun
dé
Guatem
ala City
Ulaanb
aatar
Phnom
Penh
Nairob
i
Mumba
i
Chisina
u
Tegu
cigala
pa
1.0
0.9
0.8
0.7
0.6
0.5
0.4
0.3
0.2
0.1
0
Figure 1.1.5
Low production, highly available public goods
Chisinau, the capital of Moldova, features a very low city product (0.34) that is almost half of those of Mumbai (0.645) or New Delhi (0.596). Still, this combines with very high readings for quality of life (0.85), infrastructure (0.895) and clean environment (0.894), similar to those for much richer cities like Auckland, Brussels, London or New York. With a very modest economic base, the city has been able to deliver sufficient public goods to reach a moderate degree of prosperity. This goes to show that various dimensions of urban prosperity can be deployed while economic growth remains relatively weak.
Box 1.1.4
FACT Most of the cities in this bracket – Tegucigalpa, Nairobi, Phnom Penh, Ulaanbaatar, Guatemala city, Yaoundé,
Mumbai and New Delhi – feature low HDIs (below 0.62). While in most cities a moderate CPI value is associated with a low city product, in the case of the two Indian cities the low CPIs mostly reflect poor environmental conditions.
FACT In Nairobi, prosperity is compromised by steep inequality (Gini coefficient: 0.59), causing its CPI value to drop from
‘moderate’ to’ weak’ (0.673 to 0.593).
Conceptualizing Urban Prosperity
23
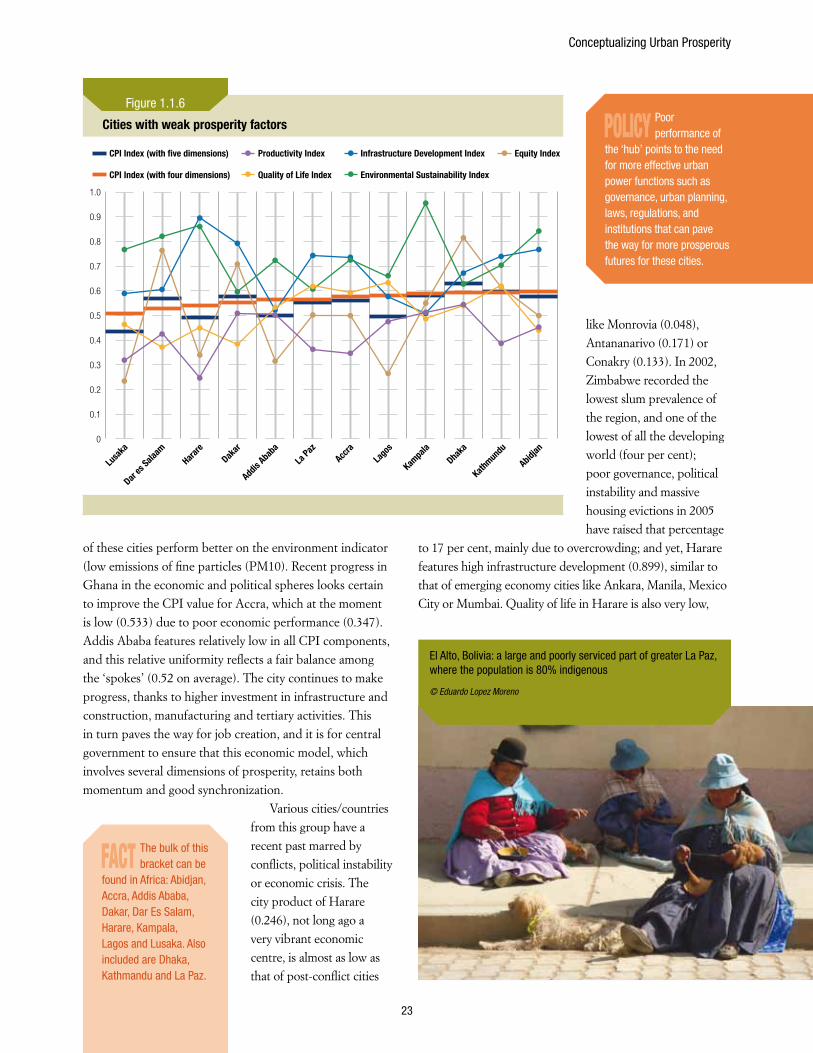
of these cities perform better on the environment indicator (low emissions of fine particles (PM10). Recent progress in Ghana in the economic and political spheres looks certain to improve the CPI value for Accra, which at the moment is low (0.533) due to poor economic performance (0.347). Addis Ababa features relatively low in all CPI components, and this relative uniformity reflects a fair balance among the ‘spokes’ (0.52 on average). The city continues to make progress, thanks to higher investment in infrastructure and construction, manufacturing and tertiary activities. This in turn paves the way for job creation, and it is for central government to ensure that this economic model, which involves several dimensions of prosperity, retains both momentum and good synchronization.
Various cities/countries from this group have a recent past marred by conflicts, political instability or economic crisis. The city product of Harare (0.246), not long ago a very vibrant economic centre, is almost as low as that of post-conflict cities
like Monrovia (0.048), Antananarivo (0.171) or Conakry (0.133). In 2002, Zimbabwe recorded the lowest slum prevalence of the region, and one of the lowest of all the developing world (four per cent); poor governance, political instability and massive housing evictions in 2005 have raised that percentage
to 17 per cent, mainly due to overcrowding; and yet, Harare features high infrastructure development (0.899), similar to that of emerging economy cities like Ankara, Manila, Mexico City or Mumbai. Quality of life in Harare is also very low,
Cities with weak prosperity factors
Productivity Index
Quality of Life Index
Infrastructure Development Index
Environmental Sustainability IndexCPI Index (with four dimensions)
Equity IndexCPI Index (with �ve dimensions)
Lusa
ka
Dar es
Salaam
Harare
Dakar
Addis
Ababa
La Paz
Accra
Lago
s
Kampa
laDha
ka
Kathmun
du
Abidjan
1.0
0.9
0.8
0.7
0.6
0.5
0.4
0.3
0.2
0.1
0
Figure 1.1.6
POLICy Poor performance of
the ‘hub’ points to the need for more effective urban power functions such as governance, urban planning, laws, regulations, and institutions that can pave the way for more prosperous futures for these cities.
FACT The bulk of this bracket can be
found in Africa: Abidjan, Accra, Addis Ababa, Dakar, Dar Es Salam, Harare, Kampala, Lagos and Lusaka. Also included are Dhaka, Kathmandu and La Paz.
El Alto, Bolivia: a large and poorly serviced part of greater La Paz, where the population is 80% indigenous
© Eduardo Lopez Moreno
State of the World’s Cities 2012/2013
24
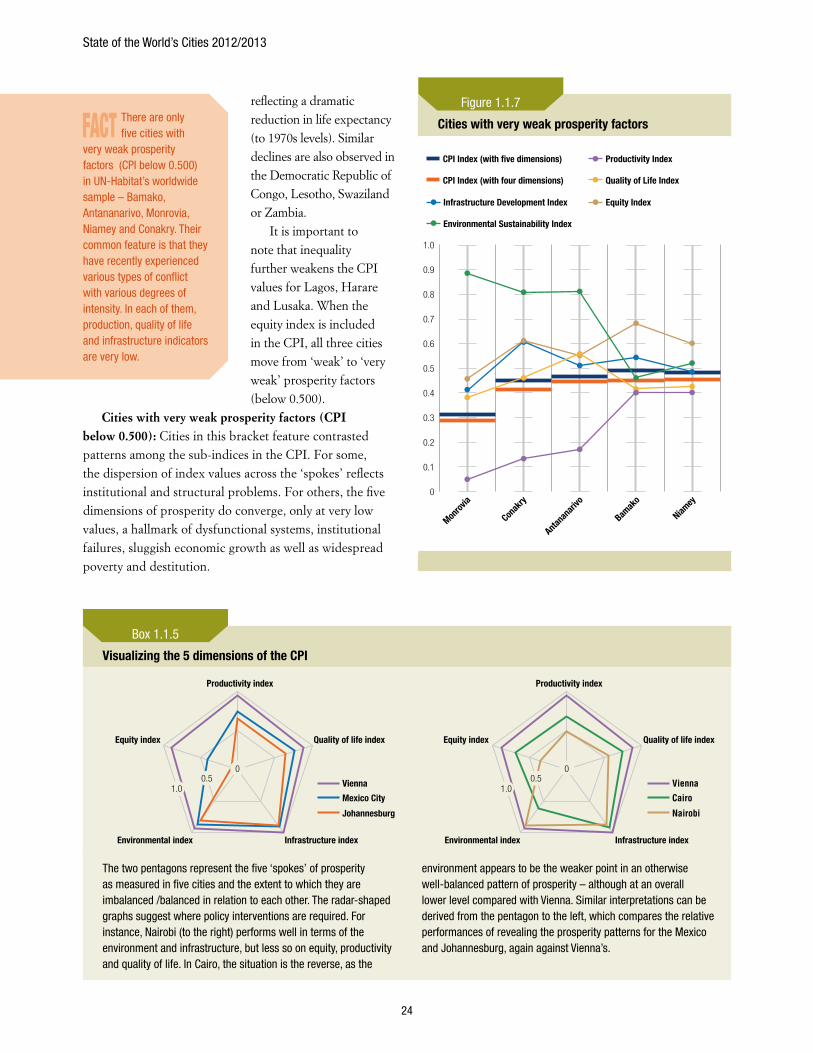
reflecting a dramatic reduction in life expectancy (to 1970s levels). Similar declines are also observed in the Democratic Republic of Congo, Lesotho, Swaziland or Zambia.
It is important to note that inequality further weakens the CPI values for Lagos, Harare and Lusaka. When the equity index is included in the CPI, all three cities move from ‘weak’ to ‘very weak’ prosperity factors (below 0.500).
Cities with very weak prosperity factors (CPI below 0.500): Cities in this bracket feature contrasted patterns among the sub-indices in the CPI. For some, the dispersion of index values across the ‘spokes’ reflects institutional and structural problems. For others, the five dimensions of prosperity do converge, only at very low values, a hallmark of dysfunctional systems, institutional failures, sluggish economic growth as well as widespread poverty and destitution.
Cities with very weak prosperity factors
Productivity Index
Quality of Life Index
Infrastructure Development Index
Environmental Sustainability Index
CPI Index (with four dimensions)
Equity Index
CPI Index (with �ve dimensions)
Monrov
ia
Conak
ry
Antana
nariv
o
Bamak
o
Niamey
1.0
0.9
0.8
0.7
0.6
0.5
0.4
0.3
0.2
0.1
0
Figure 1.1.7
visualizing the 5 dimensions of the CPI
Equity index Quality of life index
Productivity index
Infrastructure indexEnvironmental index
Vienna
Mexico City
Johannesburg
00.5
1.0
Equity index Quality of life index
Productivity index
Infrastructure indexEnvironmental index
00.5
1.0 Vienna
Cairo
Nairobi
The two pentagons represent the five ‘spokes’ of prosperity as measured in five cities and the extent to which they are imbalanced /balanced in relation to each other. The radar-shaped graphs suggest where policy interventions are required. For instance, Nairobi (to the right) performs well in terms of the environment and infrastructure, but less so on equity, productivity and quality of life. In Cairo, the situation is the reverse, as the
environment appears to be the weaker point in an otherwise well-balanced pattern of prosperity – although at an overall lower level compared with Vienna. Similar interpretations can be derived from the pentagon to the left, which compares the relative performances of revealing the prosperity patterns for the Mexico and Johannesburg, again against Vienna’s.
Box 1.1.5
FACT There are only five cities with
very weak prosperity factors (CPI below 0.500) in UN-Habitat’s worldwide sample – Bamako, Antananarivo, Monrovia, Niamey and Conakry. Their common feature is that they have recently experienced various types of conflict with various degrees of intensity. In each of them, production, quality of life and infrastructure indicators are very low.
25
Urban and Regional Trends
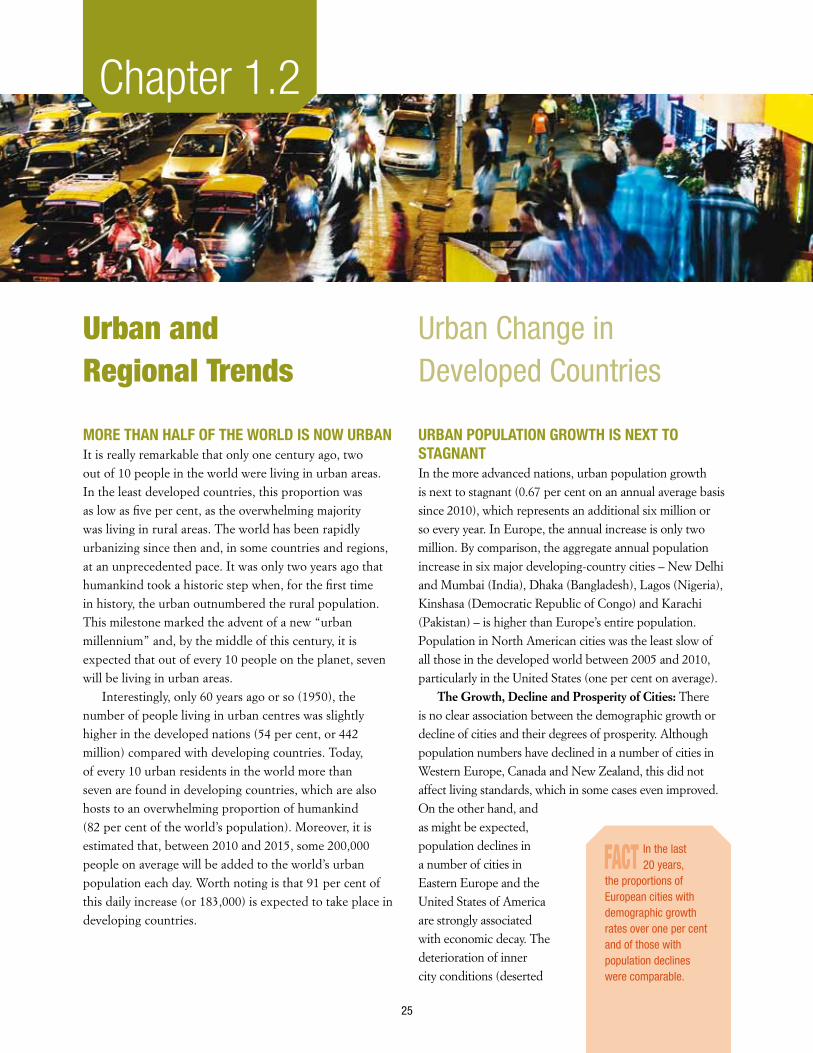
MORE THAN HALF OF THE WORLD IS NOW URBANIt is really remarkable that only one century ago, two out of 10 people in the world were living in urban areas. In the least developed countries, this proportion was as low as five per cent, as the overwhelming majority was living in rural areas. The world has been rapidly urbanizing since then and, in some countries and regions, at an unprecedented pace. It was only two years ago that humankind took a historic step when, for the first time in history, the urban outnumbered the rural population. This milestone marked the advent of a new “urban millennium” and, by the middle of this century, it is expected that out of every 10 people on the planet, seven will be living in urban areas.
Interestingly, only 60 years ago or so (1950), the number of people living in urban centres was slightly higher in the developed nations (54 per cent, or 442 million) compared with developing countries. Today, of every 10 urban residents in the world more than seven are found in developing countries, which are also hosts to an overwhelming proportion of humankind (82 per cent of the world’s population). Moreover, it is estimated that, between 2010 and 2015, some 200,000 people on average will be added to the world’s urban population each day. Worth noting is that 91 per cent of this daily increase (or 183,000) is expected to take place in developing countries.
Urban Change in Developed Countries
URBAN POPULATION GROWTH IS NExT TO STAGNANT In the more advanced nations, urban population growth is next to stagnant (0.67 per cent on an annual average basis since 2010), which represents an additional six million or so every year. In Europe, the annual increase is only two million. By comparison, the aggregate annual population increase in six major developing-country cities – New Delhi and Mumbai (India), Dhaka (Bangladesh), Lagos (Nigeria), Kinshasa (Democratic Republic of Congo) and Karachi (Pakistan) – is higher than Europe’s entire population. Population in North American cities was the least slow of all those in the developed world between 2005 and 2010, particularly in the United States (one per cent on average).
The Growth, Decline and Prosperity of Cities: There is no clear association between the demographic growth or decline of cities and their degrees of prosperity. Although population numbers have declined in a number of cities in Western Europe, Canada and New Zealand, this did not affect living standards, which in some cases even improved. On the other hand, and as might be expected, population declines in a number of cities in Eastern Europe and the United States of America are strongly associated with economic decay. The deterioration of inner city conditions (deserted
Chapter 1.2
FACT In the last 20 years,
the proportions of European cities with demographic growth rates over one per cent and of those with population declines were comparable.
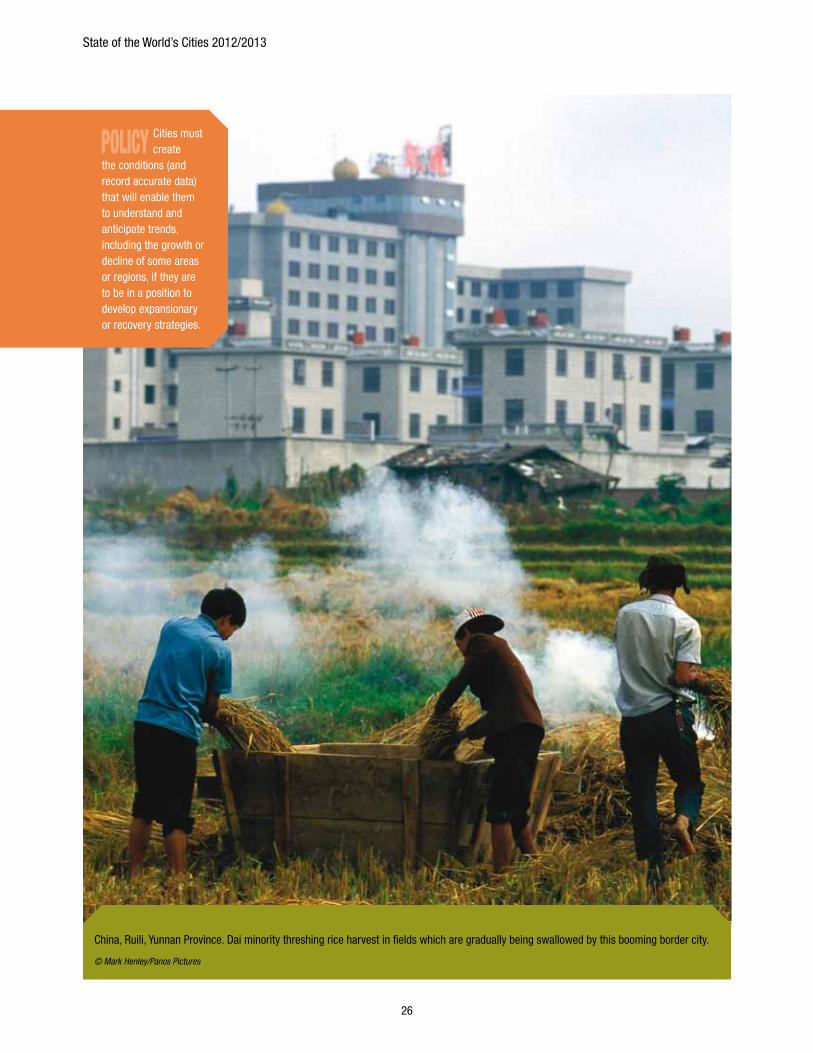
State of the World’s Cities 2012/2013
26
China, Ruili, Yunnan Province. Dai minority threshing rice harvest in fields which are gradually being swallowed by this booming border city.
© Mark Henley/Panos Pictures
POLICy Cities must create
the conditions (and record accurate data) that will enable them to understand and anticipate trends, including the growth or decline of some areas or regions, if they are to be in a position to develop expansionary or recovery strategies.
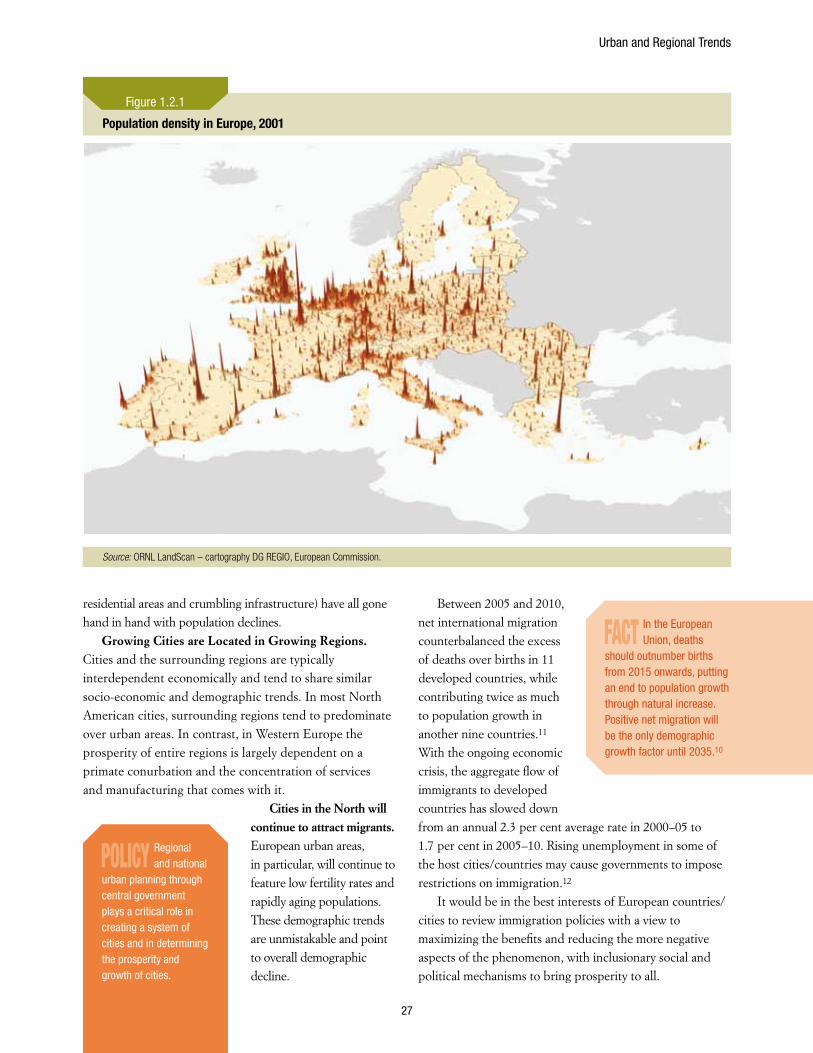
Urban and Regional Trends
27
residential areas and crumbling infrastructure) have all gone hand in hand with population declines.
Growing Cities are Located in Growing Regions. Cities and the surrounding regions are typically interdependent economically and tend to share similar socio-economic and demographic trends. In most North American cities, surrounding regions tend to predominate over urban areas. In contrast, in Western Europe the prosperity of entire regions is largely dependent on a primate conurbation and the concentration of services and manufacturing that comes with it.
Cities in the North will continue to attract migrants. European urban areas, in particular, will continue to feature low fertility rates and rapidly aging populations. These demographic trends are unmistakable and point to overall demographic decline.
Between 2005 and 2010, net international migration counterbalanced the excess of deaths over births in 11 developed countries, while contributing twice as much to population growth in another nine countries.11 With the ongoing economic crisis, the aggregate flow of immigrants to developed countries has slowed down from an annual 2.3 per cent average rate in 2000–05 to 1.7 per cent in 2005–10. Rising unemployment in some of the host cities/countries may cause governments to impose restrictions on immigration.12
It would be in the best interests of European countries/cities to review immigration policies with a view to maximizing the benefits and reducing the more negative aspects of the phenomenon, with inclusionary social and political mechanisms to bring prosperity to all.
Population density in Europe, 2001
Source: ORNL LandScan – cartography DG REGIO, European Commission.
Figure 1.2.1
FACT In the European Union, deaths
should outnumber births from 2015 onwards, putting an end to population growth through natural increase. Positive net migration will be the only demographic growth factor until 2035.10
POLICy Regional and national
urban planning through central government plays a critical role in creating a system of cities and in determining the prosperity and growth of cities.
State of the World’s Cities 2012/2013
28
Urban Change in Developing Countries
DIvERGENT URBAN GROWTH PATTERNS In the last decade, the urban population in the developing world grew an average 1.2 million people per week, or slightly less than one full year’s demographic growth in Europe’s urban areas. Asia dominated the picture, adding 0.88 million new urban dwellers every week. Africa was the second largest contributor with an additional 0.23 million per week, dwarfing Latin America and the Caribbean’s 0.15 million weekly increment.
Africa: The urban population is set to outstrip Europe’s: In what promises to be one of the more remarkable forthcoming developments in the overall pattern of urbanization in Africa, the region’s population is poised to outgrow both Europe’s and Latin America’s, which was the first region to become predominantly urban in the developing world. In 2025, the aggregate urban population of Africa, Europe, Latin America and the
Caribbean is expected to reach 642 million, 566 million and 560 million, respectively. In an apparent paradox, by that same year 2025 Africa will still be the least urbanized region in the world (45 per cent of the population).
Asia: Moving into the “Urban Century”: Half of the world’s urban population now lives in Asia. This region has accounted for about 65 per cent of the demographic expansion of all urban areas across the world since the beginning of the 21st Century. Undoubtedly, this is the “Asian Urban Century”.13 Large population concentrations in mega-cities are to remain a prominent feature in urban Asia (today, seven out of the 10 most populous cities of the world are in this region). In the recent past, Delhi and Shanghai have joined the league of ‘meta-cities’, those massive conurbations of more than 20 million people. It is expected that by 2020, another three Asian cities – Beijing, Dhaka and Mumbai – will have reached the 20 million mark.
Latin America and the Caribbean: Inter-city migration predominates: This is the most urbanized region in the world (80 per cent of the total population, compared with Europe’s 73 per cent).The urban transition in this region was achieved in the early 1960s, or about 16 years before Western Asia (the second sub-region in the developing world to become predominantly urban), and 30 and 45 years respectively before Southern and North Africa (or, on current trends, some 70 years before the whole of Africa).
CONvERGENT URBAN GROWTH PATTERNS Cities are expanding in a discontinuous, scattered and low-density form that is not sustainable: A defining feature of cities in the developing world is an outward expansion far beyond formal administrative boundaries, largely propelled by the use of the automobile and land speculation. A large number of cities – whether in Angola, Egypt, Brazil, China, or almost any other country – feature very land-consuming suburban sprawling patterns that often extend even to farther peripheries. A study on 120 cities shows that urban land cover grew,
FACT Urbanization in Africa has not yet brought the economic development and degree of prosperity that might have
been expected. Inadequate education and physical infrastructure, combined with poor governance, have constrained the efficient use of productive resources, and the industrial development that might have come with it. At the same time, the ongoing urban economic momentum in Africa is a result of a number of the typical factors of prosperity at work in other regions of the world, such as economies of agglomeration, location advantages, and diversification of the economic base, albeit all in nascent form. POLICy African
cities must connect to regional and global business networks, enhance quality of life, improve basic infrastructure and communication networks, address public transport deficiencies and environmental conditions, and respond to inequality and poverty issues, if they are to turn into real engines of national growth and prosperity.
FACT Asia is also confronted by the same urban paradox as Africa. Despite high concentrations of population in large
cities, the continent ranks among the least-urbanized regions in the world (45 per cent urban). The tipping point for ‘urban Asia’ is expected to happen earlier though (around 2020s).
POLICy The economic success of many countries/cities goes hand in hand with urbanization. Cities must give
more attention to rising inequalities and the worrying trend of environmental degradation.
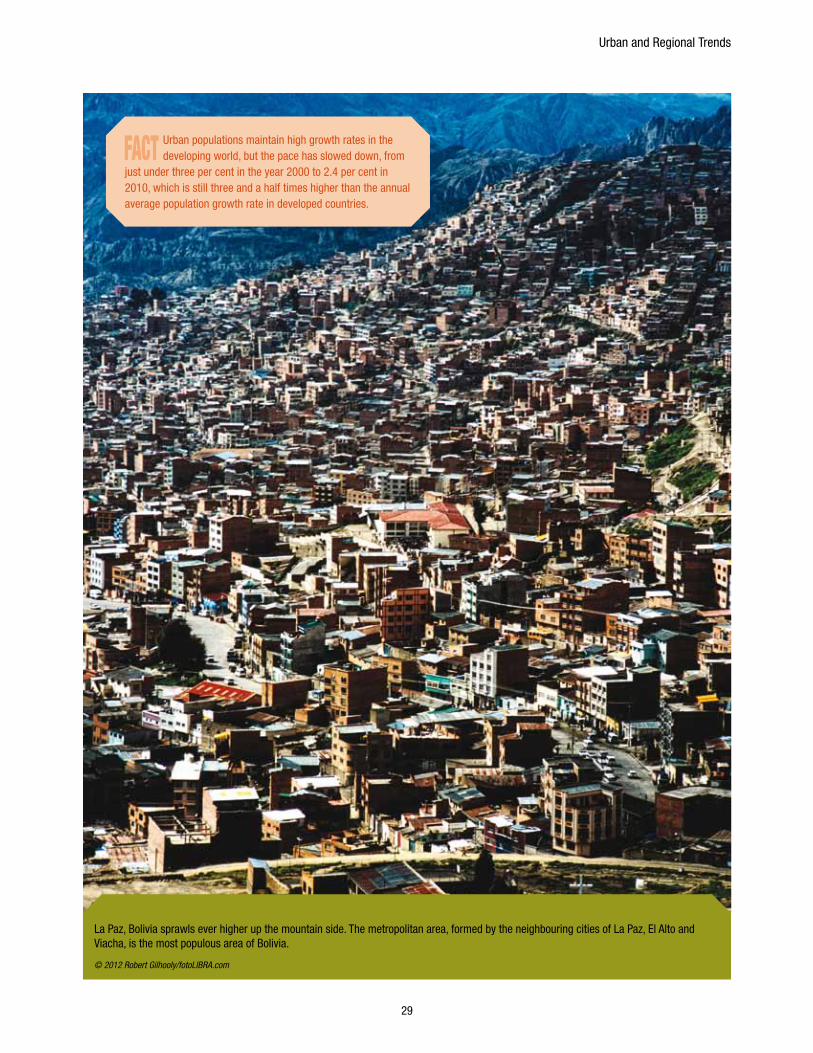
Urban and Regional Trends
29
La Paz, Bolivia sprawls ever higher up the mountain side. The metropolitan area, formed by the neighbouring cities of La Paz, El Alto and Viacha, is the most populous area of Bolivia.
© 2012 Robert Gilhooly/fotoLIBRA.com
FACT Urban populations maintain high growth rates in the developing world, but the pace has slowed down, from
just under three per cent in the year 2000 to 2.4 per cent in 2010, which is still three and a half times higher than the annual average population growth rate in developed countries.
State of the World’s Cities 2012/2013
30
on average, more than double the growth of the urban population. Similar urban trends can be observed in other parts of the world. For instance, in Mexico, the urban
physical expansion of all urban areas over the last 30 years was estimated to be at around 7.4 per cent on an annual average basis, outstripping population growth by a multiple of nearly four.14
Cities are becoming endless expanses, with high degrees of fragmentation of the urban fabric that result in vast interstitial open spaces. At the periphery, residential neighbourhoods are characterized by low-density developments which, along with under-used spaces and fragmented built-up areas in the intermediate city-rings, are contributing to dramatic reductions in residential densities.
NOvEL URBAN/REGIONAL CONFIGURATIONS AND PROSPERITyCities large or small have increasingly come to merge together to form new spatial configurations that typically take three principal forms: mega-regions, urban corridors and city-regions. Each on its own spatial scale, these three forms seem to act as nodes where global and regional flows of people, capital, goods and information combine and commingle, resulting in faster growth, both demographic and economic, than that of the countries
Novel configurations: A typology
Mega-regions surpass mega- and meta-cities by population and economic output, combining large markets, skilled labour and innovation and amalgamating several cities within the orbit of the overall region. Example: Japan’s Tokyo-Nagoya-Osaka-Kyoto-Kobe region, with a population close to 60 million.
Urban corridors, a number of urban centres of various sizes are connected along transportation routes in linear development axes that are often linked to a number of mega-cities, encompassing hinterlands. New developments in some fringe areas experience the fastest growth rates and the most rapid urban transformation. Example: in Malaysia, the Kuala Lumpur-Klang corridor along the Klang Valley.
City-regions take on a larger scale than large cities, expanding beyond formal administrative boundaries to engulf smaller ones as well as semi-urban and rural hinterlands, and even merge with other intermediate cities, creating large conurbations that eventually form city-regions.
Examples: São Paulo, Brazil; Cape Town, South Africa; Bangkok, Thailand.
Box 1.2.1
FACT Latin America and the Caribbean will be nearly 87 per cent urban in 2050, by which time the annual average pace
of growth in the urban population is expected to slow down to 0.3 per cent. Some cities already see their populations shrinking. Latin America and the Caribbean stands out as the only region where migration between urban areas is a significant determinant of urban population growth, accounting for nearly 50 per cent and due to several factors, chief among them the pursuit of prosperity.
FACT Most urban plans and regulatory regimes in the developing world have been incapable of preventing the conversion
of rural land to urban use in city peripheries. as a result, the reclassification of settlements from ‘rural’ to ‘urban’ has become the second most significant determinant of urban population growth and expansion in the developing world today.
POLICy Latin American cities must become more productive and generate local jobs, improve transport
infrastructure and living conditions, short of which they will face prospects of population decline due to higher mobility from city to city. They must reduce entrenched inequalities while improving quality of life and environmental protection. More prosperous cities must articulate better their strategic advantages with national economic policies and enhance their creative capital to increase prosperity prospects.
POLICy Even though the region is more urbanized than Europe, GDP per capita (PPP) was nearly three times lower
than the European Union’s in 2010. The main reasons include chronic inequalities and mass poverty, insufficient infrastructure, poor public services, inadequate connectivity, poor governance and fragile institutions.
POLICy Against this background, cities must accommodate demographic and spatial expansions, with a
concomitant development of well-devised urban structures that would reduce transport and service delivery costs, optimize land use and support the deployment and/or protection of open spaces.
POLICy Better connectivity, mobility and accessibility and well-planned integration of land-use, density and transport
have the potential to reduce energy consumption drastically, making cities more sustainable.
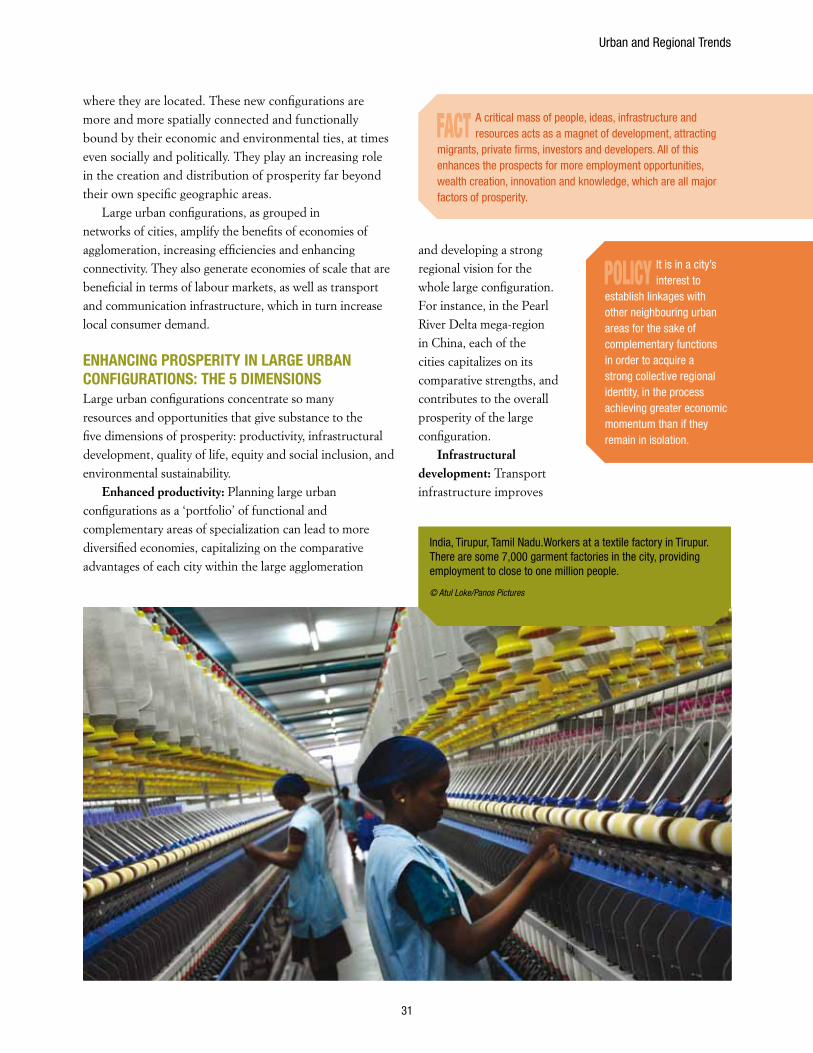
Urban and Regional Trends
31
where they are located. These new configurations are more and more spatially connected and functionally bound by their economic and environmental ties, at times even socially and politically. They play an increasing role in the creation and distribution of prosperity far beyond their own specific geographic areas.
Large urban configurations, as grouped in networks of cities, amplify the benefits of economies of agglomeration, increasing efficiencies and enhancing connectivity. They also generate economies of scale that are beneficial in terms of labour markets, as well as transport and communication infrastructure, which in turn increase local consumer demand.
ENHANCING PROSPERITy IN LARGE URBAN CONFIGURATIONS: THE 5 DIMENSIONSLarge urban configurations concentrate so many resources and opportunities that give substance to the five dimensions of prosperity: productivity, infrastructural development, quality of life, equity and social inclusion, and environmental sustainability.
Enhanced productivity: Planning large urban configurations as a ‘portfolio’ of functional and complementary areas of specialization can lead to more diversified economies, capitalizing on the comparative advantages of each city within the large agglomeration
and developing a strong regional vision for the whole large configuration. For instance, in the Pearl River Delta mega-region in China, each of the cities capitalizes on its comparative strengths, and contributes to the overall prosperity of the large configuration.
Infrastructural development: Transport infrastructure improves
FACT A critical mass of people, ideas, infrastructure and resources acts as a magnet of development, attracting
migrants, private firms, investors and developers. All of this enhances the prospects for more employment opportunities, wealth creation, innovation and knowledge, which are all major factors of prosperity.
POLICy It is in a city’s interest to
establish linkages with other neighbouring urban areas for the sake of complementary functions in order to acquire a strong collective regional identity, in the process achieving greater economic momentum than if they remain in isolation.
India, Tirupur, Tamil Nadu.Workers at a textile factory in Tirupur. There are some 7,000 garment factories in the city, providing employment to close to one million people.
© Atul Loke/Panos Pictures
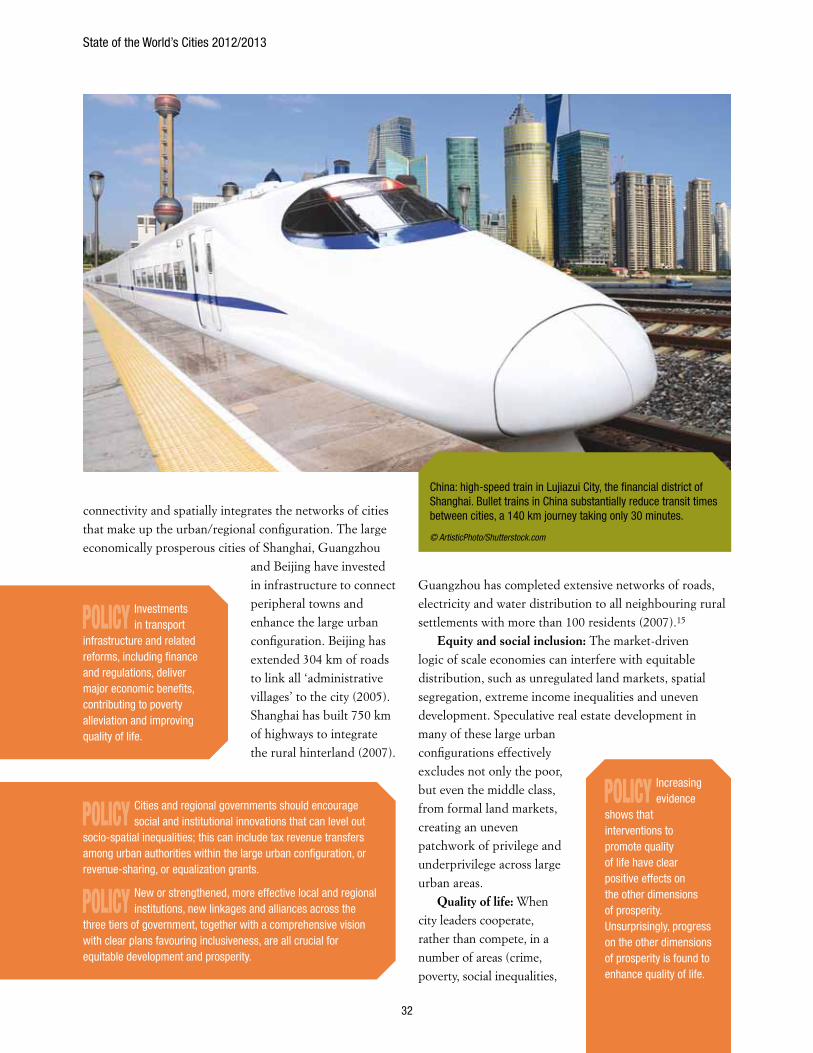
State of the World’s Cities 2012/2013
32
connectivity and spatially integrates the networks of cities that make up the urban/regional configuration. The large economically prosperous cities of Shanghai, Guangzhou
and Beijing have invested in infrastructure to connect peripheral towns and enhance the large urban configuration. Beijing has extended 304 km of roads to link all ‘administrative villages’ to the city (2005). Shanghai has built 750 km of highways to integrate the rural hinterland (2007).
Guangzhou has completed extensive networks of roads, electricity and water distribution to all neighbouring rural settlements with more than 100 residents (2007).15
Equity and social inclusion: The market-driven logic of scale economies can interfere with equitable distribution, such as unregulated land markets, spatial segregation, extreme income inequalities and uneven development. Speculative real estate development in many of these large urban configurations effectively excludes not only the poor, but even the middle class, from formal land markets, creating an uneven patchwork of privilege and underprivilege across large urban areas.
Quality of life: When city leaders cooperate, rather than compete, in a number of areas (crime, poverty, social inequalities,
POLICy Increasing evidence
shows that interventions to promote quality of life have clear positive effects on the other dimensions of prosperity. Unsurprisingly, progress on the other dimensions of prosperity is found to enhance quality of life.
China: high-speed train in Lujiazui City, the financial district of Shanghai. Bullet trains in China substantially reduce transit times between cities, a 140 km journey taking only 30 minutes.
© ArtisticPhoto/Shutterstock.com
POLICy Investments in transport
infrastructure and related reforms, including finance and regulations, deliver major economic benefits, contributing to poverty alleviation and improving quality of life.
POLICy Cities and regional governments should encourage social and institutional innovations that can level out
socio-spatial inequalities; this can include tax revenue transfers among urban authorities within the large urban configuration, or revenue-sharing, or equalization grants.
POLICy New or strengthened, more effective local and regional institutions, new linkages and alliances across the
three tiers of government, together with a comprehensive vision with clear plans favouring inclusiveness, are all crucial for equitable development and prosperity.
Urban and Regional Trends
33
transport systems, infrastructure) a more effective type of regional governance emerges that has direct implications on the quality of life both inside and outside the large urban configuration.
Environmental sustainability: Environmental challenges transcend political/administrative boundaries. Yet, local authorities may find themselves with little power or resources to counter negative impacts of growth on the environment, particularly in the face of negative externalities generated by neighbouring cities.
LARGE URBAN CONFIGURATIONS FACE SPECIFIC RISkSLarge urban configurations come with a number of well-identified, specific risks: poor urban/regional planning, lack of coordination and deficient coping strategies in the face of social and fiscal disparities. Although these affect the whole population, the bulk of the risks fall disproportionately on the poor.
Economic forces and spontaneous growth in the large urban configurations tend to sharpen spatial and social disparities, which are further compounded by inefficient use of land and other resources. Close links with world financial
markets and the impacts of global and regional economic crises shape ‘uneven geographies of development’.
Endnotes
1 UN-Habitat (2011) Cities and Climate Change: Global Report on Human Settlements 2011, Earthscan, London
2 United Nations (2010) World Economic and Social Survey 2010: Retooling Global Development, United Nation (DESA),New York, http://www.un.org/esa/policy/wess/wess2010files/wess2010.pdf
3 Historically, water, biodiversity, knowledge and some other shared resources, including roads, sidewalks, highways and other public infrastructure have been considered as ‘commons’. ‘Commons’ are also intangible aspects such as clean environmental conditions, identity, cultural and symbolic spaces. More recently, from an institutional governance perspective, ‘commons’ are institutional arrangements such as ‘spaces’ for negotiation and participation, cultural norms and legal and statutory provisions.
4 Dickinson, E. (2011) ‘GDP: A Brief History’, Foreign Policy, January/February 2011, http://www.foreignpolicy.com/articles/2011/01/02/gdp_a_brief_history.
5 The outcome of China’s “green GDP” index was that if air pollution, water shortages, desertification, and depletion of fish stocks and wildlife were factored into its GDP calculation, the 2004 GDP would have been 511 billion yuan (US$ 66 billion), or three per cent lower (SEPA and NBS, 2006).
6 Dickinson, 2011.
7 Oyelaran-Oyeyinka, B. and P.G. Sampath (2010) Latecomer Development: Innovation and Knowledge for Economic Growth, Routledge, London and New York.
8 Further compounding the problem of data dearth is the fact that most of the existing information was not collected in a uniform way to allow for comparisons of cities across countries and regions.
9 This classification has used data from multiple sources for the various components of the UN-Habitat City Prosperity Index, and this calls for a word of caution when interpreting some of these variations.
10 Eurostat (2008) ‘Ageing characterizes the demographic perspectives of the European societies’, Eurostat - Statistics in focus, 72/2008, Author: Konstantinos Giannakouris. European Commission, Brussels.
11 United Nations (2010) World population policies 2009, United Nations, Department of Economic and Social Affairs, Population Division, New York, http://www.un.org/esa/population/publications/wpp2009/Publication_complete.pdf
12 Ibid.
13 Mohan, R. (2006) Asia’s Urban Century: Emerging Trends, Key note address delivered at the Conference of Land and Policies and Urban Development, Lincoln Institute of Land Policy, Cambridge, Massachusetts, June 5, http://www.bis.org/review/r060705e.pdf.
14 ONU-HABITAT and SEDESOL (2011), El Estado de las Ciudades de México, ONU-HABITAT (Oficina Regional para América Latina y el Caribe), Rio de Janeiro,
15 World Bank (2009) World Development Report 2009: Reshaping Economic Geography, World Bank, Washington.
POLICy Should they fail to address those detrimental side effects, large urban configurations may find it
increasingly difficult to attract investment, labour and skills, in the process compromising future prosperity.
POLICy Looking beyond their own local interests and cooperating with the other jurisdictions involved,
local authorities can improve competitive advantage while also preserving the environment.
POLICy Working together, cities in a large urban configuration are in better positions effectively to protect,
manage, and plan for physical environments that span multiple jurisdictions.
POLICy The economic surpluses that large urban agglomerations derive from productivity gains can
be channeled towards the protection of natural resources in the region, with the costs of maintaining these indivisible public goods equitably shared among the population.
Part Two
Prosperity of Cities
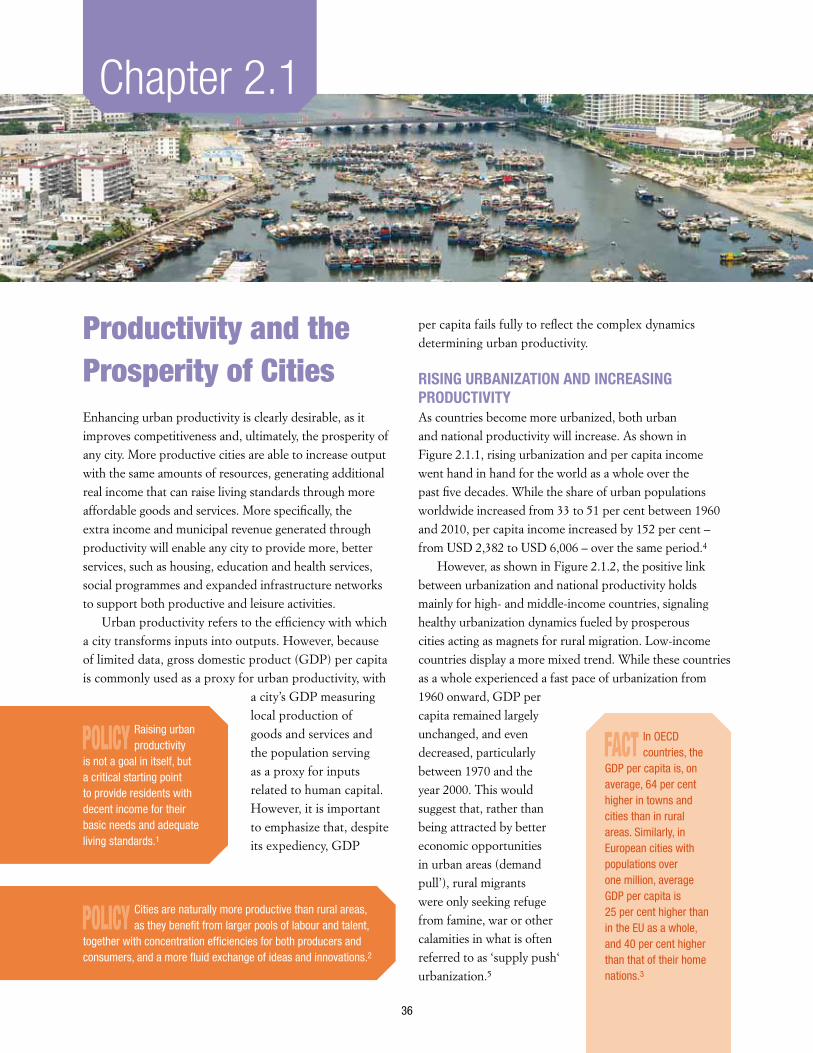
36
Productivity and the Prosperity of CitiesEnhancing urban productivity is clearly desirable, as it improves competitiveness and, ultimately, the prosperity of any city. More productive cities are able to increase output with the same amounts of resources, generating additional real income that can raise living standards through more affordable goods and services. More specifically, the extra income and municipal revenue generated through productivity will enable any city to provide more, better services, such as housing, education and health services, social programmes and expanded infrastructure networks to support both productive and leisure activities.
Urban productivity refers to the efficiency with which a city transforms inputs into outputs. However, because of limited data, gross domestic product (GDP) per capita is commonly used as a proxy for urban productivity, with
a city’s GDP measuring local production of goods and services and the population serving as a proxy for inputs related to human capital. However, it is important to emphasize that, despite its expediency, GDP
per capita fails fully to reflect the complex dynamics determining urban productivity.
RISING URBANIzATION AND INCREASING PRODUCTIvITyAs countries become more urbanized, both urban and national productivity will increase. As shown in Figure 2.1.1, rising urbanization and per capita income went hand in hand for the world as a whole over the past five decades. While the share of urban populations worldwide increased from 33 to 51 per cent between 1960 and 2010, per capita income increased by 152 per cent – from USD 2,382 to USD 6,006 – over the same period.4
However, as shown in Figure 2.1.2, the positive link between urbanization and national productivity holds mainly for high- and middle-income countries, signaling healthy urbanization dynamics fueled by prosperous cities acting as magnets for rural migration. Low-income countries display a more mixed trend. While these countries as a whole experienced a fast pace of urbanization from 1960 onward, GDP per capita remained largely unchanged, and even decreased, particularly between 1970 and the year 2000. This would suggest that, rather than being attracted by better economic opportunities in urban areas (demand pull’), rural migrants were only seeking refuge from famine, war or other calamities in what is often referred to as ‘supply push‘ urbanization.5
Chapter 2.1
POLICy Raising urban productivity
is not a goal in itself, but a critical starting point to provide residents with decent income for their basic needs and adequate living standards.1
POLICy Cities are naturally more productive than rural areas, as they benefit from larger pools of labour and talent,
together with concentration efficiencies for both producers and consumers, and a more fluid exchange of ideas and innovations.2
FACT In OECD countries, the
GDP per capita is, on average, 64 per cent higher in towns and cities than in rural areas. Similarly, in European cities with populations over one million, average GDP per capita is 25 per cent higher than in the EU as a whole, and 40 per cent higher than that of their home nations.3
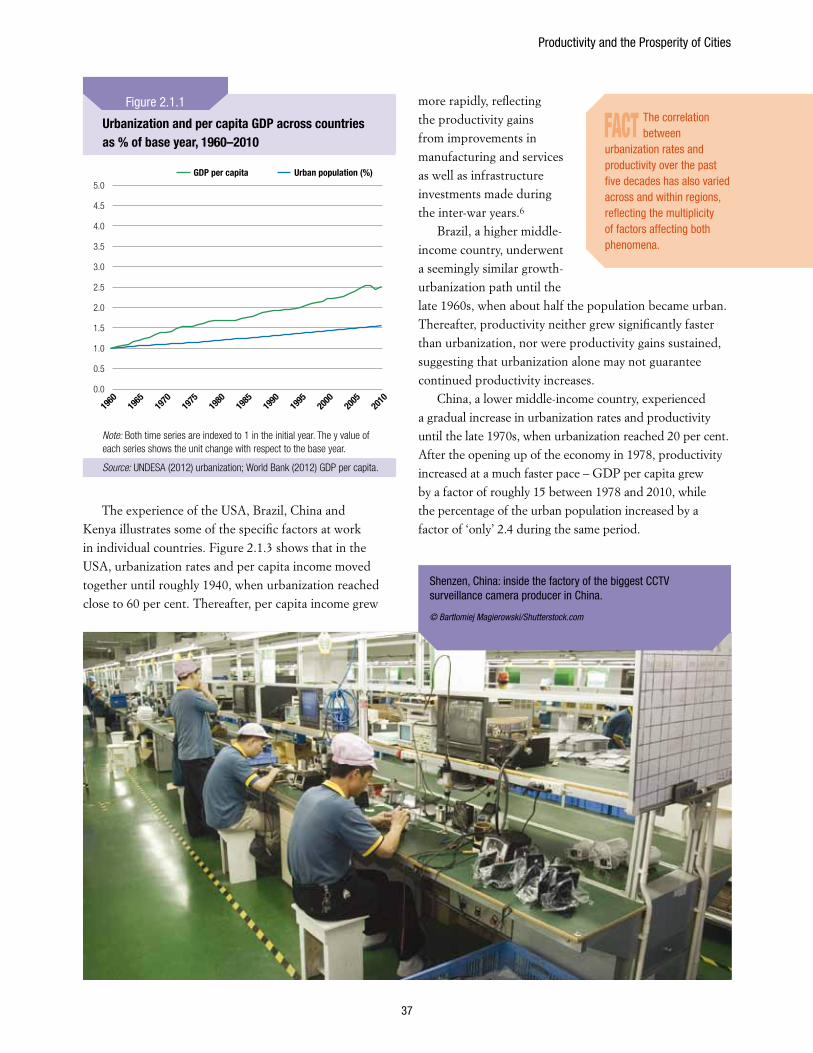
Productivity and the Prosperity of Cities
37
The experience of the USA, Brazil, China and Kenya illustrates some of the specific factors at work in individual countries. Figure 2.1.3 shows that in the USA, urbanization rates and per capita income moved together until roughly 1940, when urbanization reached close to 60 per cent. Thereafter, per capita income grew
more rapidly, reflecting the productivity gains from improvements in manufacturing and services as well as infrastructure investments made during the inter-war years.6
Brazil, a higher middle-income country, underwent a seemingly similar growth-urbanization path until the late 1960s, when about half the population became urban. Thereafter, productivity neither grew significantly faster than urbanization, nor were productivity gains sustained, suggesting that urbanization alone may not guarantee continued productivity increases.
China, a lower middle-income country, experienced a gradual increase in urbanization rates and productivity until the late 1970s, when urbanization reached 20 per cent. After the opening up of the economy in 1978, productivity increased at a much faster pace – GDP per capita grew by a factor of roughly 15 between 1978 and 2010, while the percentage of the urban population increased by a factor of ‘only’ 2.4 during the same period.
Urbanization and per capita GDP across countries as % of base year, 1960–2010
Urban population (%)GDP per capita
1960
1965
1970
1975
1980
1985
1990
1995
2000
2005
2010
5.0
4.5
4.0
3.5
3.0
2.5
2.0
1.5
1.0
0.5
0.0
Note: Both time series are indexed to 1 in the initial year. The y value of each series shows the unit change with respect to the base year.
Source: UNDESA (2012) urbanization; World Bank (2012) GDP per capita.
Figure 2.1.1
FACT The correlation between
urbanization rates and productivity over the past five decades has also varied across and within regions, reflecting the multiplicity of factors affecting both phenomena.
Shenzen, China: inside the factory of the biggest CCTV surveillance camera producer in China.
© Bartlomiej Magierowski/Shutterstock.com
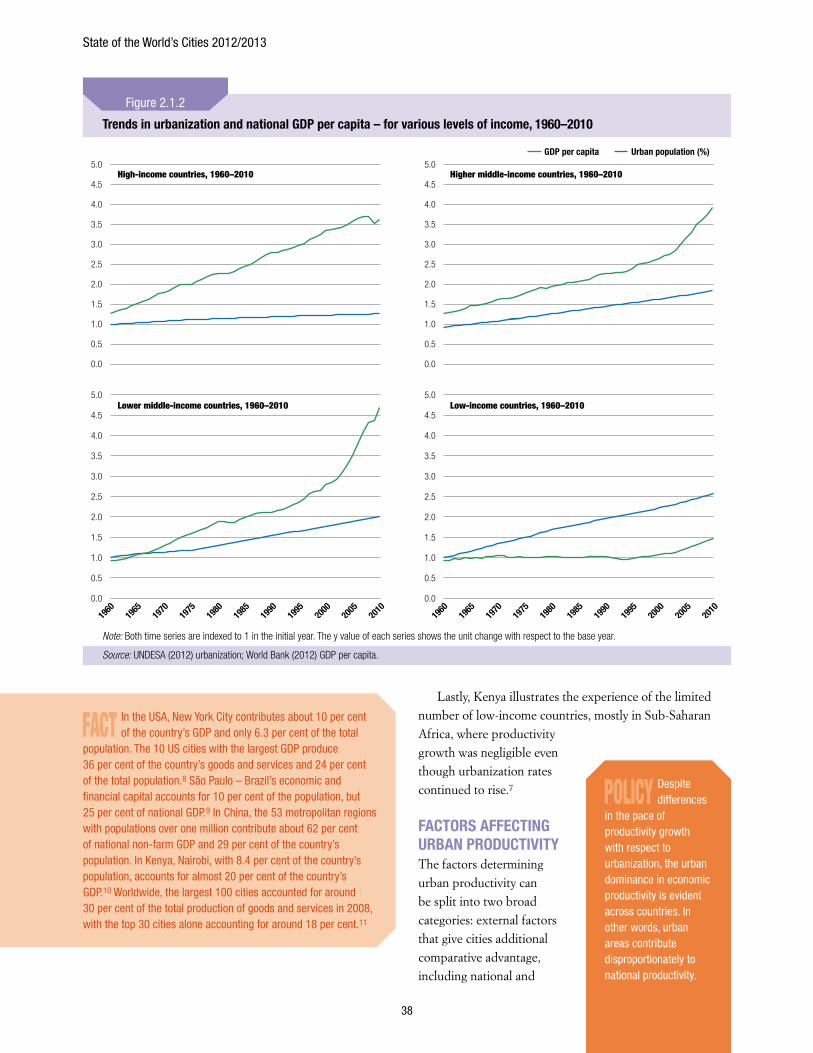
State of the World’s Cities 2012/2013
38
Lastly, Kenya illustrates the experience of the limited number of low-income countries, mostly in Sub-Saharan Africa, where productivity growth was negligible even though urbanization rates continued to rise.7
FACTORS AFFECTING URBAN PRODUCTIvITyThe factors determining urban productivity can be split into two broad categories: external factors that give cities additional comparative advantage, including national and
Trends in urbanization and national GDP per capita – for various levels of income, 1960–2010
Urban population (%)GDP per capita
High-income countries, 1960–2010 Higher middle-income countries, 1960–2010
Lower middle-income countries, 1960–2010 Low-income countries, 1960–2010
5.0
4.5
4.0
3.5
3.0
2.5
2.0
1.5
1.0
0.5
0.0
1960
1965
1970
1975
1980
1985
1990
1995
2000
2005
2010
5.0
4.5
4.0
3.5
3.0
2.5
2.0
1.5
1.0
0.5
0.0
5.0
4.5
4.0
3.5
3.0
2.5
2.0
1.5
1.0
0.5
0.0
1960
1965
1970
1975
1980
1985
1990
1995
2000
2005
2010
5.0
4.5
4.0
3.5
3.0
2.5
2.0
1.5
1.0
0.5
0.0
Note: Both time series are indexed to 1 in the initial year. The y value of each series shows the unit change with respect to the base year.
Source: UNDESA (2012) urbanization; World Bank (2012) GDP per capita.
Figure 2.1.2
FACT In the USA, New York City contributes about 10 per cent of the country’s GDP and only 6.3 per cent of the total
population. The 10 US cities with the largest GDP produce 36 per cent of the country’s goods and services and 24 per cent of the total population.8 São Paulo – Brazil’s economic and financial capital accounts for 10 per cent of the population, but 25 per cent of national GDP.9 In China, the 53 metropolitan regions with populations over one million contribute about 62 per cent of national non-farm GDP and 29 per cent of the country’s population. In Kenya, Nairobi, with 8.4 per cent of the country’s population, accounts for almost 20 per cent of the country’s GDP.10 Worldwide, the largest 100 cities accounted for around 30 per cent of the total production of goods and services in 2008, with the top 30 cities alone accounting for around 18 per cent.11
POLICy Despite differences
in the pace of productivity growth with respect to urbanization, the urban dominance in economic productivity is evident across countries. In other words, urban areas contribute disproportionately to national productivity.
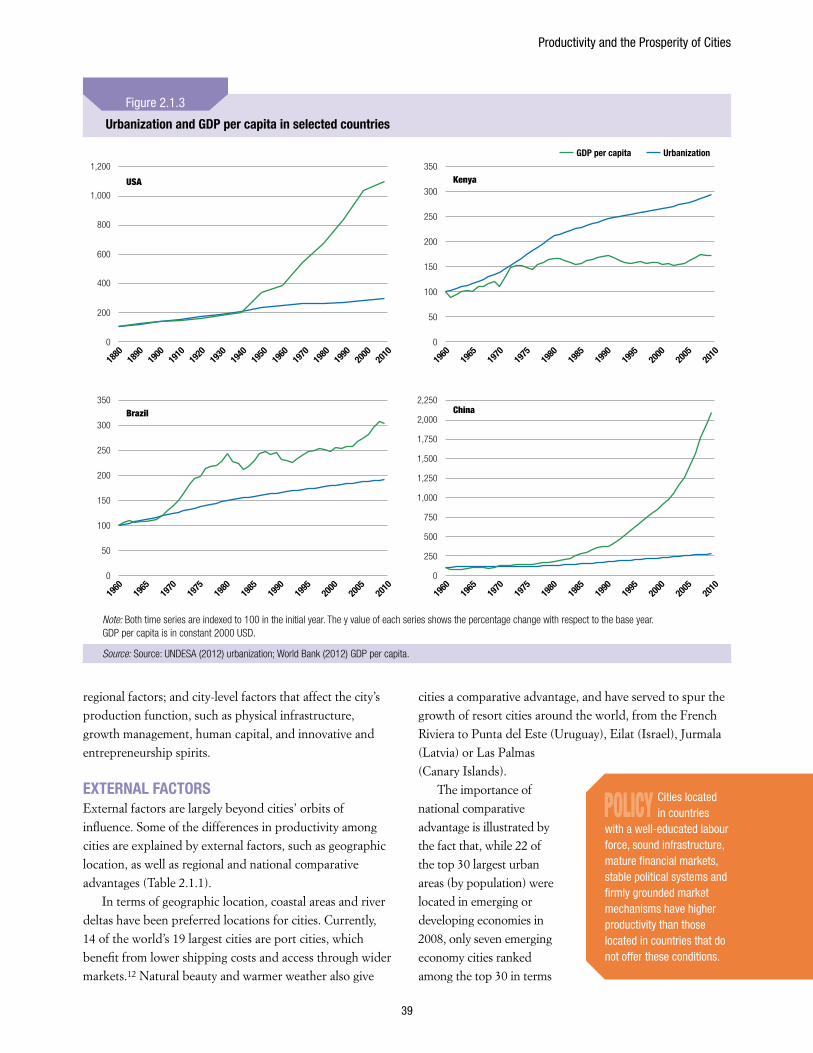
Productivity and the Prosperity of Cities
39
regional factors; and city-level factors that affect the city’s production function, such as physical infrastructure, growth management, human capital, and innovative and entrepreneurship spirits.
ExTERNAL FACTORS External factors are largely beyond cities’ orbits of influence. Some of the differences in productivity among cities are explained by external factors, such as geographic location, as well as regional and national comparative advantages (Table 2.1.1).
In terms of geographic location, coastal areas and river deltas have been preferred locations for cities. Currently, 14 of the world’s 19 largest cities are port cities, which benefit from lower shipping costs and access through wider markets.12 Natural beauty and warmer weather also give
cities a comparative advantage, and have served to spur the growth of resort cities around the world, from the French Riviera to Punta del Este (Uruguay), Eilat (Israel), Jurmala (Latvia) or Las Palmas (Canary Islands).
The importance of national comparative advantage is illustrated by the fact that, while 22 of the top 30 largest urban areas (by population) were located in emerging or developing economies in 2008, only seven emerging economy cities ranked among the top 30 in terms
Urbanization and GDP per capita in selected countries
UrbanizationGDP per capita
Brazil350
300
250
200
150
100
50
0
1960
1965
1970
1975
1980
1985
1990
1995
2000
2005
2010
1960
1965
1970
1975
1980
1985
1990
1995
2000
2005
2010
1960
1965
1970
1975
1980
1985
1990
1995
2000
2005
2010
USA
1,200
1,000
800
600
400
200
0
1880
1890
1900
1910
1920
1930
1940
1950
1960
1970
1980
1990
2000
2010
China2,250
2,000
1,000
1,250
1,500
1,750
750
500
250
0
Kenya350
300
250
200
100
150
50
0
Note: Both time series are indexed to 100 in the initial year. The y value of each series shows the percentage change with respect to the base year. GDP per capita is in constant 2000 USD.
Source: Source: UNDESA (2012) urbanization; World Bank (2012) GDP per capita.
Figure 2.1.3
POLICy Cities located in countries
with a well-educated labour force, sound infrastructure, mature financial markets, stable political systems and firmly grounded market mechanisms have higher productivity than those located in countries that do not offer these conditions.
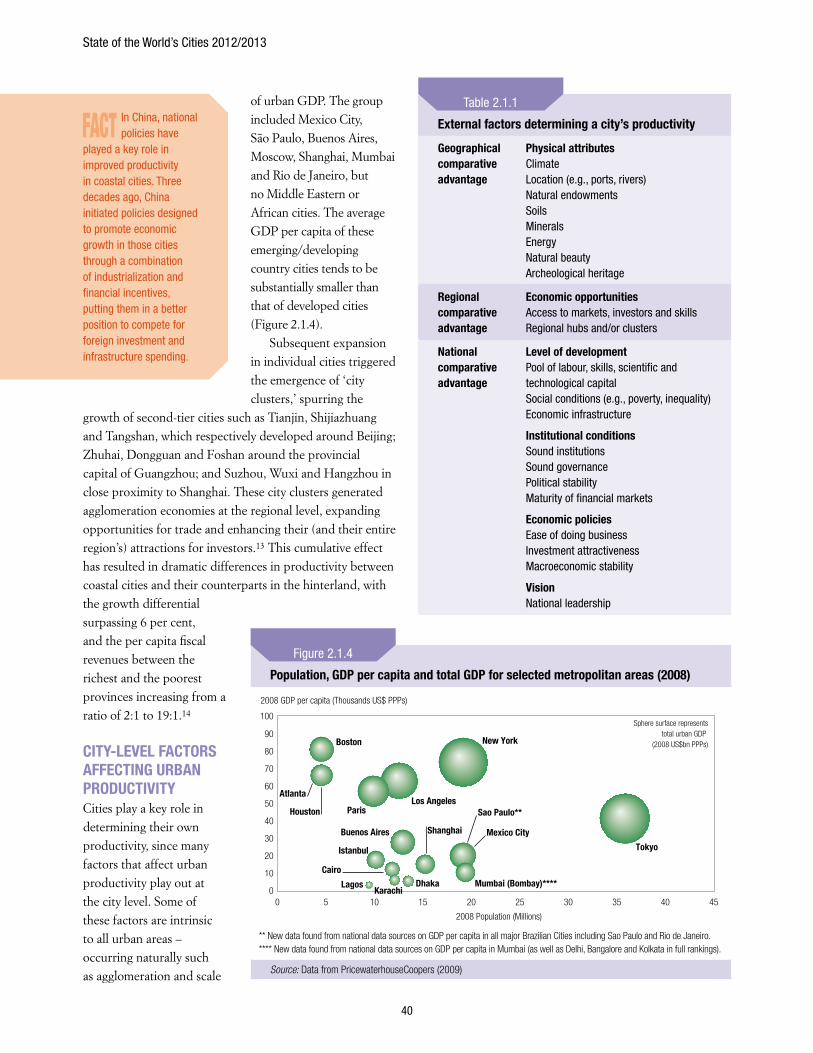
State of the World’s Cities 2012/2013
40
of urban GDP. The group included Mexico City, São Paulo, Buenos Aires, Moscow, Shanghai, Mumbai and Rio de Janeiro, but no Middle Eastern or African cities. The average GDP per capita of these emerging/developing country cities tends to be substantially smaller than that of developed cities (Figure 2.1.4).
Subsequent expansion in individual cities triggered the emergence of ‘city clusters,’ spurring the
growth of second-tier cities such as Tianjin, Shijiazhuang and Tangshan, which respectively developed around Beijing; Zhuhai, Dongguan and Foshan around the provincial capital of Guangzhou; and Suzhou, Wuxi and Hangzhou in close proximity to Shanghai. These city clusters generated agglomeration economies at the regional level, expanding opportunities for trade and enhancing their (and their entire region’s) attractions for investors.13 This cumulative effect has resulted in dramatic differences in productivity between coastal cities and their counterparts in the hinterland, with the growth differential surpassing 6 per cent, and the per capita fiscal revenues between the richest and the poorest provinces increasing from a ratio of 2:1 to 19:1.14
CITy-LEvEL FACTORS AFFECTING URBAN PRODUCTIvITy Cities play a key role in determining their own productivity, since many factors that affect urban productivity play out at the city level. Some of these factors are intrinsic to all urban areas – occurring naturally such as agglomeration and scale
Population, GDP per capita and total GDP for selected metropolitan areas (2008)
2008 Population (Millions)
2008 GDP per capita (Thousands US$ PPPs)
100
90
80
70
60
50
4540353025
40
20
30
15
20
10
10
50
0
Sao Paulo**
Mexico City
Dhaka Mumbai (Bombay)****
ShanghaiBuenos Aires
Istanbul
LagosKarachi
Cairo
New York
Sphere surface representstotal urban GDP
(2008 US$bn PPPs)Boston
Atlanta
Houston ParisLos Angeles
Tokyo
** New data found from national data sources on GDP per capita in all major Brazilian Cities including Sao Paulo and Rio de Janeiro. **** New data found from national data sources on GDP per capita in Mumbai (as well as Delhi, Bangalore and Kolkata in full rankings).
Source: Data from PricewaterhouseCoopers (2009)
Figure 2.1.4
FACT In China, national policies have
played a key role in improved productivity in coastal cities. Three decades ago, China initiated policies designed to promote economic growth in those cities through a combination of industrialization and financial incentives, putting them in a better position to compete for foreign investment and infrastructure spending.
External factors determining a city’s productivity
Geographical comparative advantage
Physical attributesClimateLocation (e.g., ports, rivers)Natural endowmentsSoilsMineralsEnergyNatural beautyArcheological heritage
Regional comparative advantage
Economic opportunitiesAccess to markets, investors and skillsRegional hubs and/or clusters
National comparative advantage
Level of development Pool of labour, skills, scientific and technological capitalSocial conditions (e.g., poverty, inequality) Economic infrastructure
Institutional conditionsSound institutionsSound governancePolitical stabilityMaturity of financial markets
Economic policiesEase of doing businessInvestment attractivenessMacroeconomic stability
visionNational leadership
Table 2.1.1
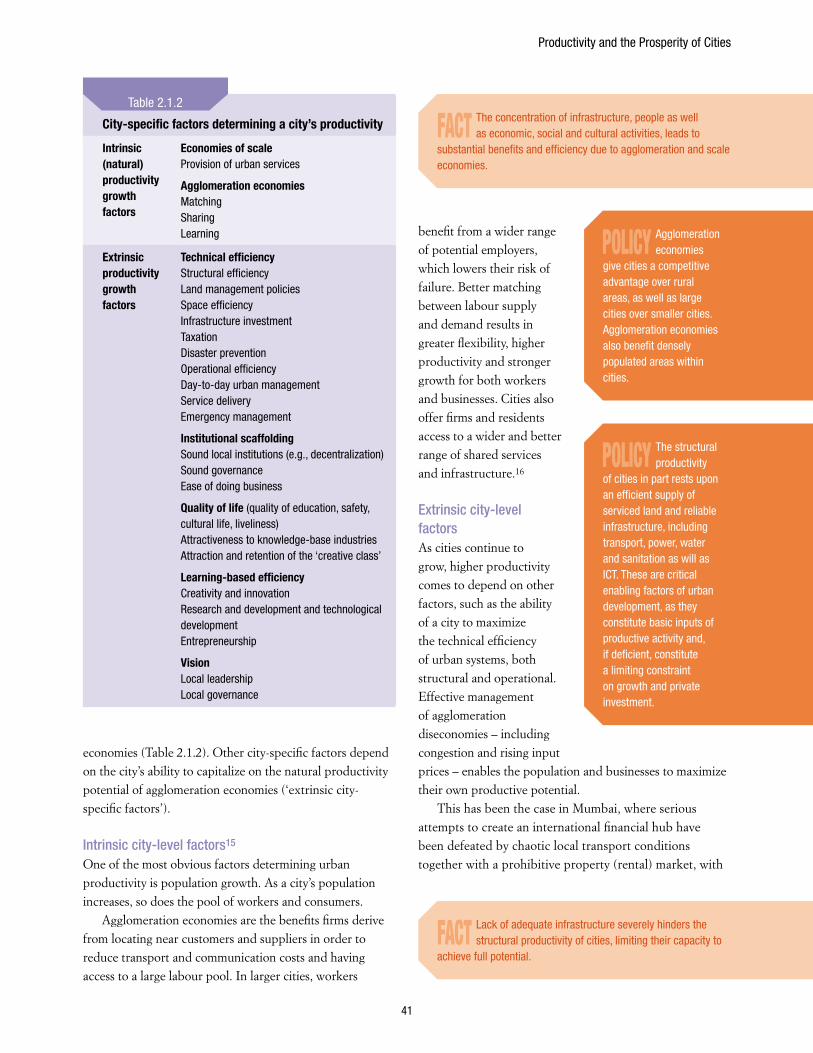
Productivity and the Prosperity of Cities
41
economies (Table 2.1.2). Other city-specific factors depend on the city’s ability to capitalize on the natural productivity potential of agglomeration economies (‘extrinsic city-specific factors’).
Intrinsic city-level factors15
One of the most obvious factors determining urban productivity is population growth. As a city’s population increases, so does the pool of workers and consumers.
Agglomeration economies are the benefits firms derive from locating near customers and suppliers in order to reduce transport and communication costs and having access to a large labour pool. In larger cities, workers
benefit from a wider range of potential employers, which lowers their risk of failure. Better matching between labour supply and demand results in greater flexibility, higher productivity and stronger growth for both workers and businesses. Cities also offer firms and residents access to a wider and better range of shared services and infrastructure.16
Extrinsic city-level factors As cities continue to grow, higher productivity comes to depend on other factors, such as the ability of a city to maximize the technical efficiency of urban systems, both structural and operational. Effective management of agglomeration diseconomies – including congestion and rising input prices – enables the population and businesses to maximize their own productive potential.
This has been the case in Mumbai, where serious attempts to create an international financial hub have been defeated by chaotic local transport conditions together with a prohibitive property (rental) market, with
City-specific factors determining a city’s productivity
Intrinsic (natural) productivity growth factors
Economies of scaleProvision of urban services
Agglomeration economiesMatchingSharingLearning
Extrinsic productivity growth factors
Technical efficiencyStructural efficiencyLand management policiesSpace efficiencyInfrastructure investmentTaxationDisaster preventionOperational efficiencyDay-to-day urban managementService deliveryEmergency management
Institutional scaffoldingSound local institutions (e.g., decentralization)Sound governanceEase of doing business
Quality of life (quality of education, safety, cultural life, liveliness)Attractiveness to knowledge-base industries Attraction and retention of the ‘creative class’
Learning-based efficiencyCreativity and innovationResearch and development and technological developmentEntrepreneurship
visionLocal leadershipLocal governance
Table 2.1.2
FACT The concentration of infrastructure, people as well as economic, social and cultural activities, leads to
substantial benefits and efficiency due to agglomeration and scale economies.
FACT Lack of adequate infrastructure severely hinders the structural productivity of cities, limiting their capacity to
achieve full potential.
POLICy Agglomeration economies
give cities a competitive advantage over rural areas, as well as large cities over smaller cities. Agglomeration economies also benefit densely populated areas within cities.
POLICy The structural productivity
of cities in part rests upon an efficient supply of serviced land and reliable infrastructure, including transport, power, water and sanitation as will as ICT. These are critical enabling factors of urban development, as they constitute basic inputs of productive activity and, if deficient, constitute a limiting constraint on growth and private investment.
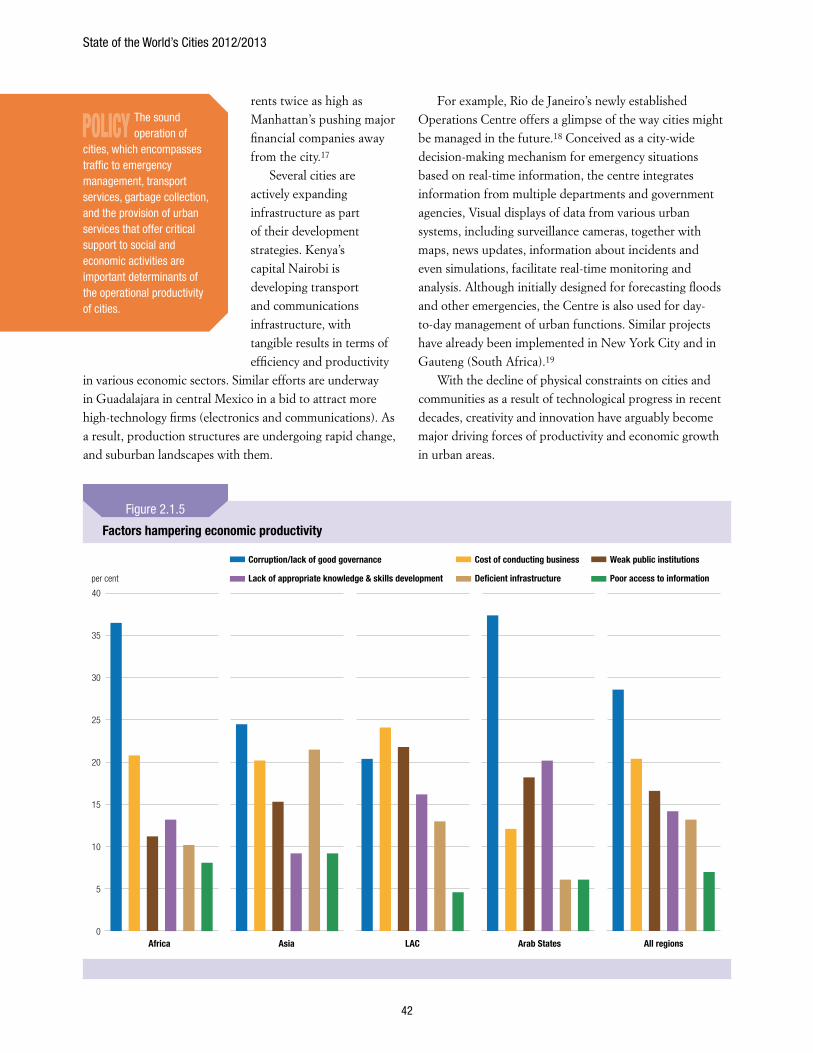
State of the World’s Cities 2012/2013
42
rents twice as high as Manhattan’s pushing major financial companies away from the city.17
Several cities are actively expanding infrastructure as part of their development strategies. Kenya’s capital Nairobi is developing transport and communications infrastructure, with tangible results in terms of efficiency and productivity
in various economic sectors. Similar efforts are underway in Guadalajara in central Mexico in a bid to attract more high-technology firms (electronics and communications). As a result, production structures are undergoing rapid change, and suburban landscapes with them.
For example, Rio de Janeiro’s newly established Operations Centre offers a glimpse of the way cities might be managed in the future.18 Conceived as a city-wide decision-making mechanism for emergency situations based on real-time information, the centre integrates information from multiple departments and government agencies, Visual displays of data from various urban systems, including surveillance cameras, together with maps, news updates, information about incidents and even simulations, facilitate real-time monitoring and analysis. Although initially designed for forecasting floods and other emergencies, the Centre is also used for day-to-day management of urban functions. Similar projects have already been implemented in New York City and in Gauteng (South Africa).19
With the decline of physical constraints on cities and communities as a result of technological progress in recent decades, creativity and innovation have arguably become major driving forces of productivity and economic growth in urban areas.
Factors hampering economic productivity
40
35
15
5
25
30
20
10
0
Corruption/lack of good governance
Lack of appropriate knowledge & skills development
Cost of conducting business
De�cient infrastructure
Weak public institutions
Poor access to informationper cent
Africa Asia LAC Arab States All regions
Figure 2.1.5
POLICy The sound operation of
cities, which encompasses traffic to emergency management, transport services, garbage collection, and the provision of urban services that offer critical support to social and economic activities are important determinants of the operational productivity of cities.
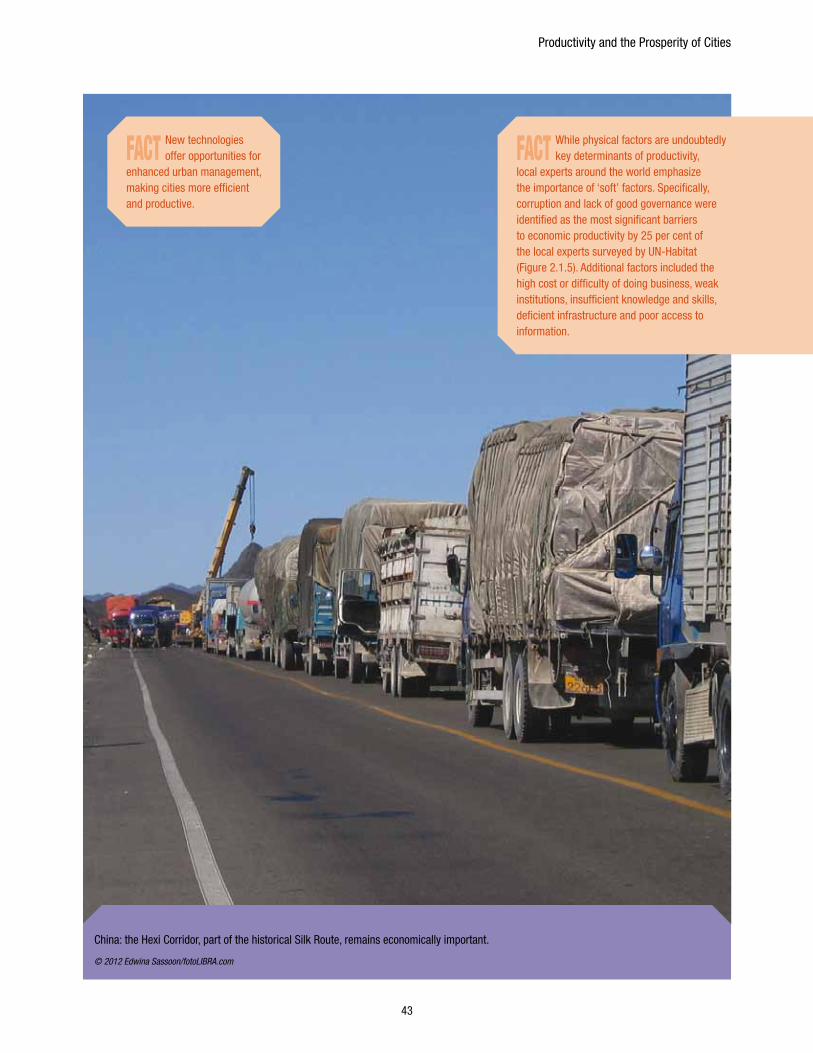
Productivity and the Prosperity of Cities
43
China: the Hexi Corridor, part of the historical Silk Route, remains economically important.
© 2012 Edwina Sassoon/fotoLIBRA.com
FACT New technologies offer opportunities for
enhanced urban management, making cities more efficient and productive.
FACT While physical factors are undoubtedly key determinants of productivity,
local experts around the world emphasize the importance of ‘soft’ factors. Specifically, corruption and lack of good governance were identified as the most significant barriers to economic productivity by 25 per cent of the local experts surveyed by UN-Habitat (Figure 2.1.5). Additional factors included the high cost or difficulty of doing business, weak institutions, insufficient knowledge and skills, deficient infrastructure and poor access to information.
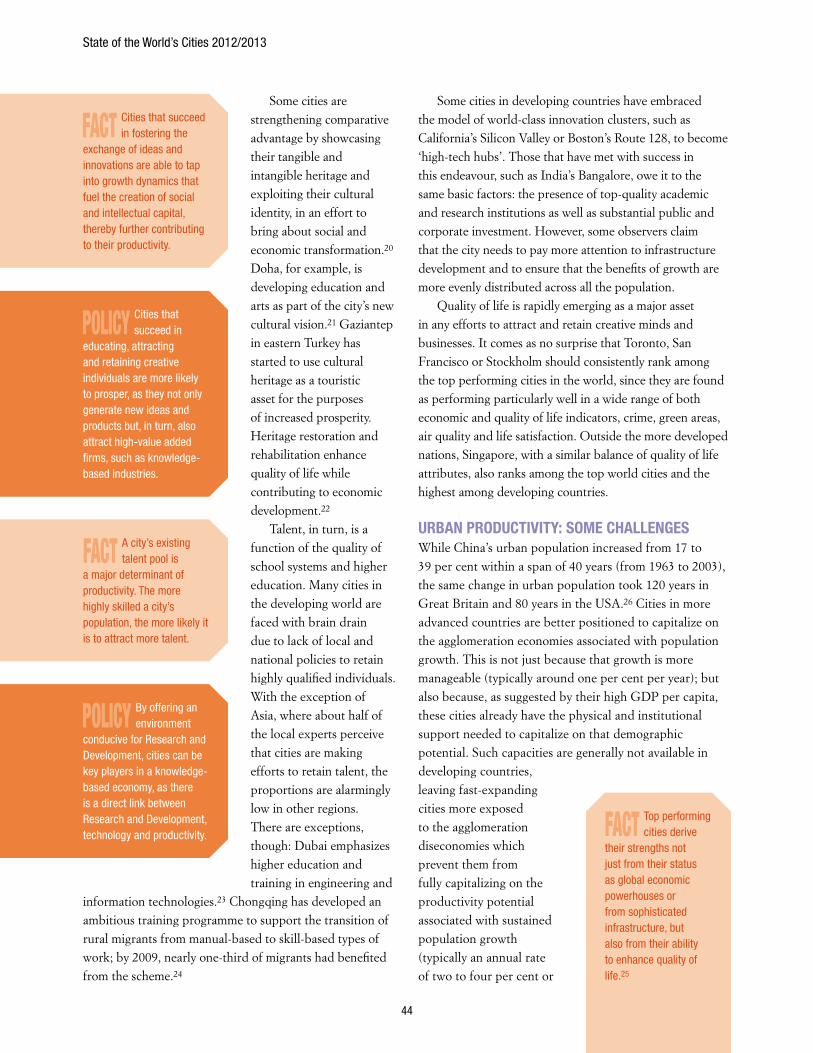
State of the World’s Cities 2012/2013
44
Some cities are strengthening comparative advantage by showcasing their tangible and intangible heritage and exploiting their cultural identity, in an effort to bring about social and economic transformation.20 Doha, for example, is developing education and arts as part of the city’s new cultural vision.21 Gaziantep in eastern Turkey has started to use cultural heritage as a touristic asset for the purposes of increased prosperity. Heritage restoration and rehabilitation enhance quality of life while contributing to economic development.22
Talent, in turn, is a function of the quality of school systems and higher education. Many cities in the developing world are faced with brain drain due to lack of local and national policies to retain highly qualified individuals. With the exception of Asia, where about half of the local experts perceive that cities are making efforts to retain talent, the proportions are alarmingly low in other regions. There are exceptions, though: Dubai emphasizes higher education and training in engineering and
information technologies.23 Chongqing has developed an ambitious training programme to support the transition of rural migrants from manual-based to skill-based types of work; by 2009, nearly one-third of migrants had benefited from the scheme.24
Some cities in developing countries have embraced the model of world-class innovation clusters, such as California’s Silicon Valley or Boston’s Route 128, to become ‘high-tech hubs’. Those that have met with success in this endeavour, such as India’s Bangalore, owe it to the same basic factors: the presence of top-quality academic and research institutions as well as substantial public and corporate investment. However, some observers claim that the city needs to pay more attention to infrastructure development and to ensure that the benefits of growth are more evenly distributed across all the population.
Quality of life is rapidly emerging as a major asset in any efforts to attract and retain creative minds and businesses. It comes as no surprise that Toronto, San Francisco or Stockholm should consistently rank among the top performing cities in the world, since they are found as performing particularly well in a wide range of both economic and quality of life indicators, crime, green areas, air quality and life satisfaction. Outside the more developed nations, Singapore, with a similar balance of quality of life attributes, also ranks among the top world cities and the highest among developing countries.
URBAN PRODUCTIvITy: SOME CHALLENGESWhile China’s urban population increased from 17 to 39 per cent within a span of 40 years (from 1963 to 2003), the same change in urban population took 120 years in Great Britain and 80 years in the USA.26 Cities in more advanced countries are better positioned to capitalize on the agglomeration economies associated with population growth. This is not just because that growth is more manageable (typically around one per cent per year); but also because, as suggested by their high GDP per capita, these cities already have the physical and institutional support needed to capitalize on that demographic potential. Such capacities are generally not available in developing countries, leaving fast-expanding cities more exposed to the agglomeration diseconomies which prevent them from fully capitalizing on the productivity potential associated with sustained population growth (typically an annual rate of two to four per cent or
FACT Cities that succeed in fostering the
exchange of ideas and innovations are able to tap into growth dynamics that fuel the creation of social and intellectual capital, thereby further contributing to their productivity.
FACT A city’s existing talent pool is
a major determinant of productivity. The more highly skilled a city’s population, the more likely it is to attract more talent.
FACT Top performing cities derive
their strengths not just from their status as global economic powerhouses or from sophisticated infrastructure, but also from their ability to enhance quality of life.25
POLICy Cities that succeed in
educating, attracting and retaining creative individuals are more likely to prosper, as they not only generate new ideas and products but, in turn, also attract high-value added firms, such as knowledge-based industries.
POLICy By offering an environment
conducive for Research and Development, cities can be key players in a knowledge-based economy, as there is a direct link between Research and Development, technology and productivity.
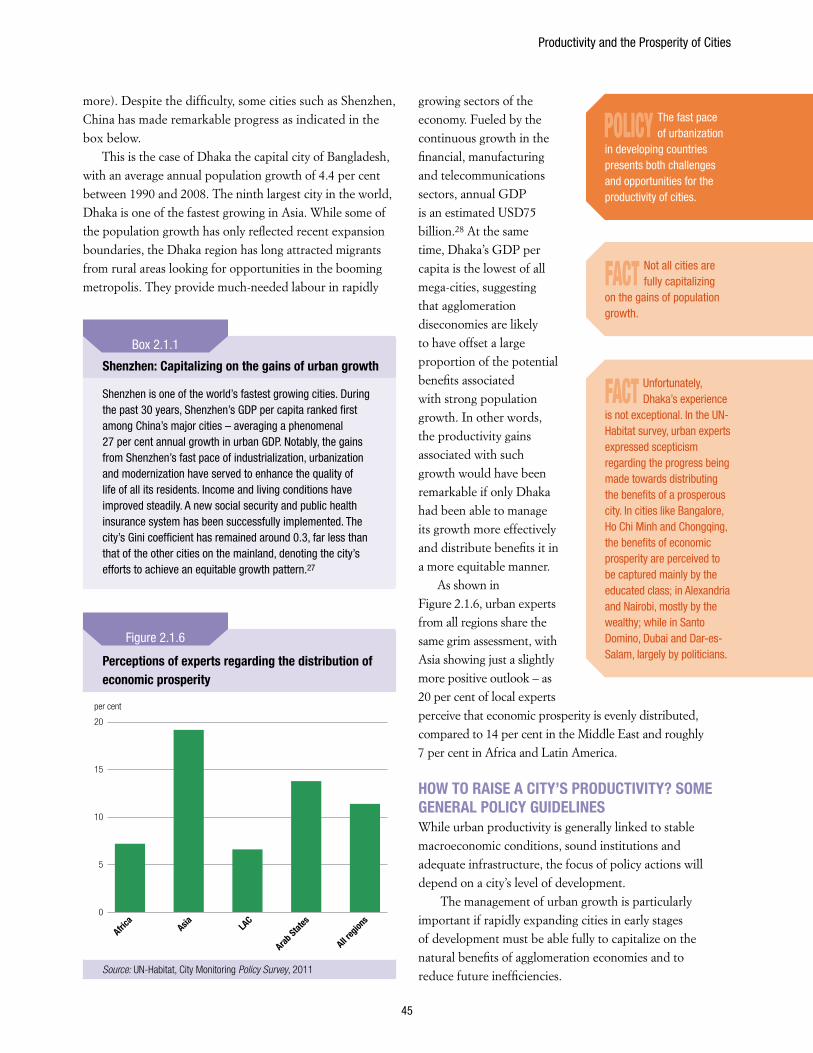
Productivity and the Prosperity of Cities
45
more). Despite the difficulty, some cities such as Shenzhen, China has made remarkable progress as indicated in the box below.
This is the case of Dhaka the capital city of Bangladesh, with an average annual population growth of 4.4 per cent between 1990 and 2008. The ninth largest city in the world, Dhaka is one of the fastest growing in Asia. While some of the population growth has only reflected recent expansion boundaries, the Dhaka region has long attracted migrants from rural areas looking for opportunities in the booming metropolis. They provide much-needed labour in rapidly
growing sectors of the economy. Fueled by the continuous growth in the financial, manufacturing and telecommunications sectors, annual GDP is an estimated USD75 billion.28 At the same time, Dhaka’s GDP per capita is the lowest of all mega-cities, suggesting that agglomeration diseconomies are likely to have offset a large proportion of the potential benefits associated with strong population growth. In other words, the productivity gains associated with such growth would have been remarkable if only Dhaka had been able to manage its growth more effectively and distribute benefits it in a more equitable manner.
As shown in Figure 2.1.6, urban experts from all regions share the same grim assessment, with Asia showing just a slightly more positive outlook – as 20 per cent of local experts perceive that economic prosperity is evenly distributed, compared to 14 per cent in the Middle East and roughly 7 per cent in Africa and Latin America.
HOW TO RAISE A CITy’S PRODUCTIvITy? SOME GENERAL POLICy GUIDELINESWhile urban productivity is generally linked to stable macroeconomic conditions, sound institutions and adequate infrastructure, the focus of policy actions will depend on a city’s level of development.
The management of urban growth is particularly important if rapidly expanding cities in early stages of development must be able fully to capitalize on the natural benefits of agglomeration economies and to reduce future inefficiencies.
FACT Not all cities are fully capitalizing
on the gains of population growth.
FACT Unfortunately, Dhaka’s experience
is not exceptional. In the UN-Habitat survey, urban experts expressed scepticism regarding the progress being made towards distributing the benefits of a prosperous city. In cities like Bangalore, Ho Chi Minh and Chongqing, the benefits of economic prosperity are perceived to be captured mainly by the educated class; in Alexandria and Nairobi, mostly by the wealthy; while in Santo Domino, Dubai and Dar-es-Salam, largely by politicians.
Shenzhen: Capitalizing on the gains of urban growth
Shenzhen is one of the world’s fastest growing cities. During the past 30 years, Shenzhen’s GDP per capita ranked first among China’s major cities – averaging a phenomenal 27 per cent annual growth in urban GDP. Notably, the gains from Shenzhen’s fast pace of industrialization, urbanization and modernization have served to enhance the quality of life of all its residents. Income and living conditions have improved steadily. A new social security and public health insurance system has been successfully implemented. The city’s Gini coefficient has remained around 0.3, far less than that of the other cities on the mainland, denoting the city’s efforts to achieve an equitable growth pattern.27
Box 2.1.1
POLICy The fast pace of urbanization
in developing countries presents both challenges and opportunities for the productivity of cities.
Perceptions of experts regarding the distribution of economic prosperity
per cent
Africa Asia LA
C
Arab Stat
es
All reg
ions
20
10
15
5
0
Source: UN-Habitat, City Monitoring Policy Survey, 2011
Figure 2.1.6
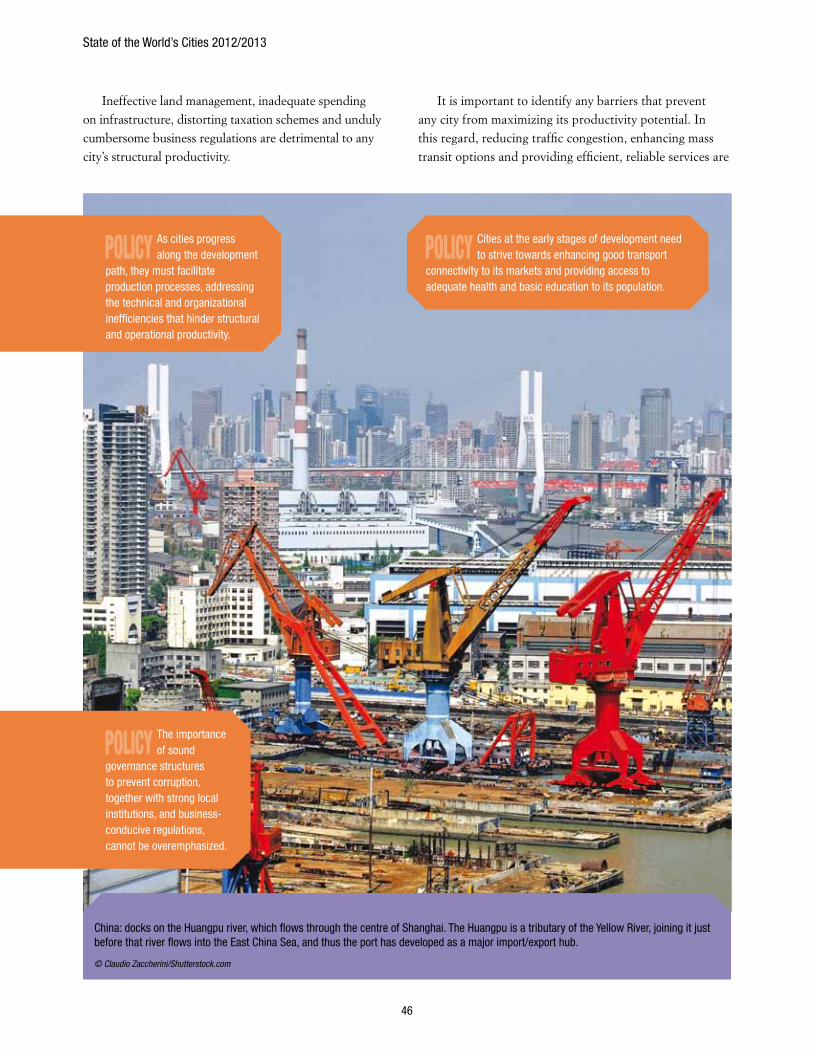
State of the World’s Cities 2012/2013
46
Ineffective land management, inadequate spending on infrastructure, distorting taxation schemes and unduly cumbersome business regulations are detrimental to any city’s structural productivity.
It is important to identify any barriers that prevent any city from maximizing its productivity potential. In this regard, reducing traffic congestion, enhancing mass transit options and providing efficient, reliable services are
POLICy Cities at the early stages of development need to strive towards enhancing good transport
connectivity to its markets and providing access to adequate health and basic education to its population.
POLICy As cities progress along the development
path, they must facilitate production processes, addressing the technical and organizational inefficiencies that hinder structural and operational productivity.
POLICy The importance of sound
governance structures to prevent corruption, together with strong local institutions, and business-conducive regulations, cannot be overemphasized.
China: docks on the Huangpu river, which flows through the centre of Shanghai. The Huangpu is a tributary of the Yellow River, joining it just before that river flows into the East China Sea, and thus the port has developed as a major import/export hub.
© Claudio Zaccherini/Shutterstock.com
Productivity and the Prosperity of Cities
47
major determinants in any city’s operational productivity. In addition, cities at intermediate levels of development should also enhance their technological capacities with a sharper focus on higher education and training as well as ICT infrastructure.
While the factors at work are less easy to grasp than in the case of technical efficiency, experience from around the world points to the importance of supporting research and development in quality higher education and research institutions with both public and corporate investment.
Promoting an entrepreneurial spirit, particularly among youth, is a desirable strategy for any city, regardless of development level or economic strength. Similarly, far from a desirable though ultimately dispensable aspiration, enhancing overall quality of life should be considered as essential to any economic development strategy if a city is to attract creative people and businesses.
Leadership will always be always a critical factor, be it collective, as exercised through sound governance systems, or individual, i.e. relying on a particularly inspiring
politician or local figure. It takes leadership to change the prevailing urban paradigm and develop the transformative vision that will not just boost productivity of a city, or region, or even country, but also broadly distribute the associated benefits for the sake of shared prosperity.
Endnotes
1 Bodin-Buyle Z., and C. Hermant-De Callataÿ (2011), Urban Prosperity and Quality of Life in European cities – Beyond GDP, Background paper prepared for “State of the World’s Cities Report 2012/2013” as part of EU /UN-Habitat collaboration.
2 UN-Habitat (2010), State of the World’s Cities 2010/2011 : Cities for All: Bridging the Urban Divide.,Earthscan,London
3 European Commission (2009) Promoting Sustainable Urban Development in Europe: Achievements and Opportunities. European Commission , Brussels
4 World Bank (2012) World Bank Data: World Development Indicators & Global Development Finance, Online database last updated July 9 2012, http://data.worldbank.org
5 Buckley, R. and A. Kallergis (2011) The Wealth of Cities and Equitable Growth, background paper for ‘State of the World Cities Report 2012/13’
6 Buckley, R. and A. Kallergis (2011) op. cit.
7 Buckley, R. and A. Kallergis (2011) op. cit.
8 PricewaterhouseCoopers (2009) ‘Global city GDP rankings 2008-2025’ PricewaterhouseCoopers UK Economic Outlook, November 2009, London. http://www.ukmediacentre.pwc.com/Media-Library/Global-city-GDP-rankings-2008-2025-61a.aspx
9 Cities Alliance (2006) Guide to City Development Strategies: Improving Urban Performance, Cities Alliance, Washington, D.C. http://www.citiesalliance.org/ca/sites/citiesalliance.org/files/CA_Docs/resources/cds/cds-guidelines/role_of_cities.pdf
10 Kenya’s 2008 GDP (PPP current International), total population, population in the largest city: World Development Indicators (2012); Nairobi’s 2008 GDP (PPP): PricewaterhouseCoopers (2009).
11 PricewaterhouseCoopers (2009) op. cit.
12 UN-Habitat (2008) State of the World’s Cities Report 2008/09: Harmonious Cities. UN-Habitat, Nairobi.
13 ActiveUKChina (2012) Business and economic distributions and clusters, http://www.activeukchina.com/business-environment/business-and-economic-distributions-and-clusters/
14 UN-Habitat (2008) op. cit.
15 This section draws heavily from Turok, I. (2011) Urban Employment and the Prosperity of Cities. Background paper prepared for “State of the World’s Cities Report 2012/2013”
16 As noted by Turok, see Jacobs,J. (1969) The Economy of Cities, London, Jonathan Cape; Jacobs, J. (1984) Cities and the Wealth of Nations, New York, Random House; Porter, M. (1998) ‘Clusters and the new economics of competitiveness’, Harvard Business Review, December, pp.77-90.
17 Bloomberg Business Week, April 23, 2011 as quoted by Buckley, R. and A. Kallergis (2011) op. cit.
18 Rio’s Operation Centre builds upon advanced technologies created by IBM Research labs around the world.
19 Astroman (2011) City Government and IBM Close Partnership to Make Rio de Janeiro a Smarter City, January 3, http://www.astroman.com.pl/index.php?mod=magazine&a=read&id=871
20 Spirou, C. (2011) Urban Tourism and Urban Change: Cities in a Global Economy, New York, Routledge,
21 Mena, A. (2011) City Report on Doha. Unpublished UN-Habitat background study for “State of the World’s Cities Report 2012/2013”
22 Kurtul,P. F. (2011) City Report on Gaziantep. Unpublished UN-Habitat background study for “State of the World’s Cities Report 2012/2013”
23 Al-Bassam, D. and J. Mouris (2011) City Report on Dubai. Unpublished UN-Habitat background study for “State of the World’s Cities Report 2012/2013”
24 Liu, Y. and Y. Wang (2011) City Report on Chongqing. Unpublished UN-Habitat background study for “State of the World’s Cities Report 2012/2013”
25 PricewaterhouseCoopers (2010) Cities of opportunities. PricewaterhouseCoopers/ The Partnership for New York City, Inc. http://www.pwc.com/us/en/cities-of-opportunity/2011/pdfdownload.jhtml
26 China’s urban growth rates: UNDESA (WUP): US’ and Great Britain’s urban growth rates: Buckley, R. and A. Kallergis (2011) op. cit.
27 J Jin, L. and Y. Liu (2011) City Report on Shenzhen. Unpublished UN-Habitat background study for “State of the World’s Cities Report 2012/2013”.
28 PricewaterhouseCoopers (2009) op. cit.
POLICy To be able to sustain higher
wages and the associated standards of living, more advanced cities need to tap into innovation-driven productivity gains by supporting businesses’ ability to compete based on more sophisticated and innovative production processes and products.
POLICy To enhance productivity, cities at all stages of development must seek support from a wide range
of stakeholders, including various public authorities, other urban areas in the same region, and major economic actors, and set in motion the process of desirable change.
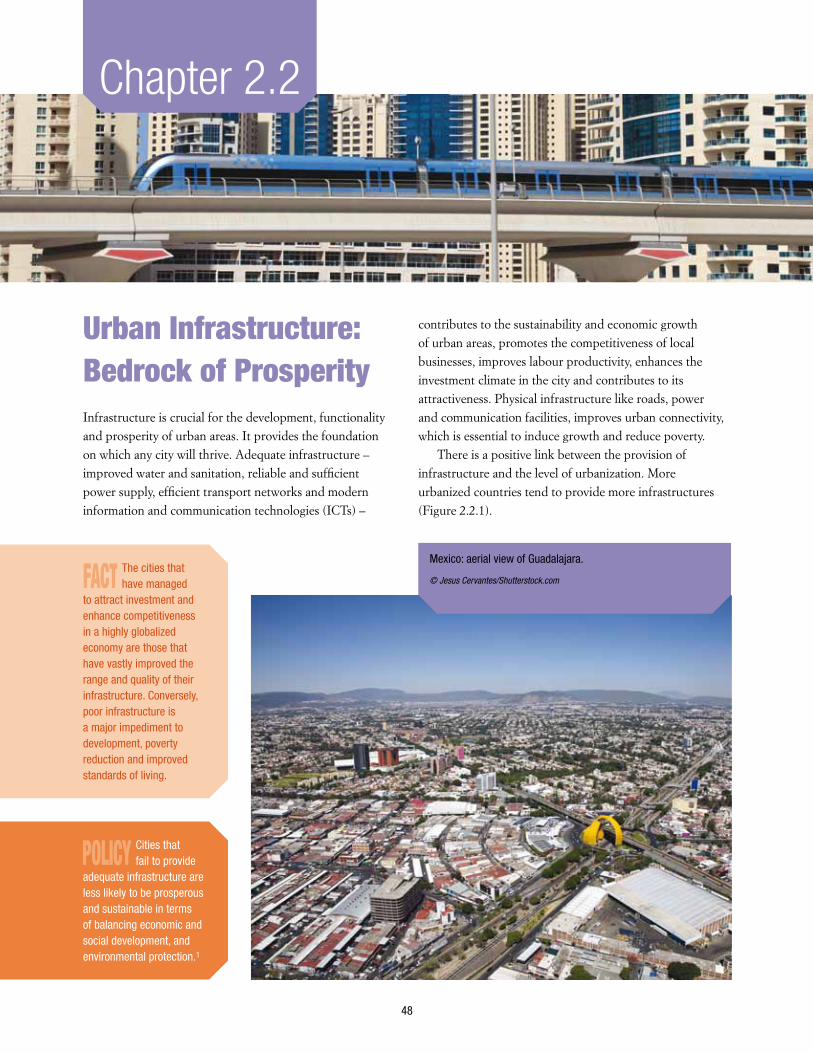
48
Chapter 2.2
Urban Infrastructure: Bedrock of ProsperityInfrastructure is crucial for the development, functionality and prosperity of urban areas. It provides the foundation on which any city will thrive. Adequate infrastructure – improved water and sanitation, reliable and sufficient power supply, efficient transport networks and modern information and communication technologies (ICTs) –
contributes to the sustainability and economic growth of urban areas, promotes the competitiveness of local businesses, improves labour productivity, enhances the investment climate in the city and contributes to its attractiveness. Physical infrastructure like roads, power and communication facilities, improves urban connectivity, which is essential to induce growth and reduce poverty.
There is a positive link between the provision of infrastructure and the level of urbanization. More urbanized countries tend to provide more infrastructures (Figure 2.2.1).
POLICy Cities that fail to provide
adequate infrastructure are less likely to be prosperous and sustainable in terms of balancing economic and social development, and environmental protection.1
FACT The cities that have managed
to attract investment and enhance competitiveness in a highly globalized economy are those that have vastly improved the range and quality of their infrastructure. Conversely, poor infrastructure is a major impediment to development, poverty reduction and improved standards of living.
Mexico: aerial view of Guadalajara.
© Jesus Cervantes/Shutterstock.com
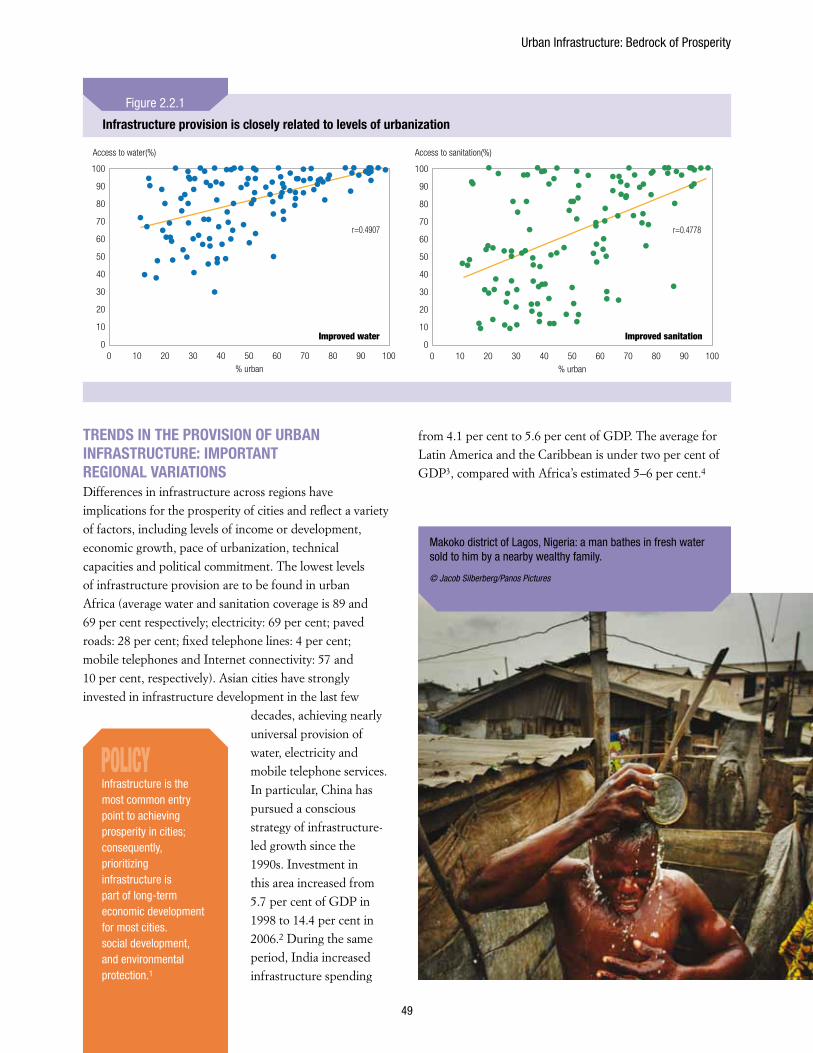
Urban Infrastructure: Bedrock of Prosperity
49
TRENDS IN THE PROvISION OF URBAN INFRASTRUCTURE: IMPORTANT REGIONAL vARIATIONSDifferences in infrastructure across regions have implications for the prosperity of cities and reflect a variety of factors, including levels of income or development, economic growth, pace of urbanization, technical capacities and political commitment. The lowest levels of infrastructure provision are to be found in urban Africa (average water and sanitation coverage is 89 and 69 per cent respectively; electricity: 69 per cent; paved roads: 28 per cent; fixed telephone lines: 4 per cent; mobile telephones and Internet connectivity: 57 and 10 per cent, respectively). Asian cities have strongly invested in infrastructure development in the last few
decades, achieving nearly universal provision of water, electricity and mobile telephone services. In particular, China has pursued a conscious strategy of infrastructure-led growth since the 1990s. Investment in this area increased from 5.7 per cent of GDP in 1998 to 14.4 per cent in 2006.2 During the same period, India increased infrastructure spending
from 4.1 per cent to 5.6 per cent of GDP. The average for Latin America and the Caribbean is under two per cent of GDP3, compared with Africa’s estimated 5–6 per cent.4
POLICy Infrastructure is the most common entry point to achieving prosperity in cities; consequently, prioritizing infrastructure is part of long-term economic development for most cities.social development, and environmental protection.1
Infrastructure provision is closely related to levels of urbanization
% urban % urban
Access to water(%) Access to sanitation(%)
Improved water Improved sanitation
100
r=0.4907 r=0.4778
90
80
70
60
50
1009080706050
40
40
30
30
20
20
10
100
0 1009080706050403020100
100
90
80
70
60
50
40
30
20
10
0
Figure 2.2.1
Makoko district of Lagos, Nigeria: a man bathes in fresh water sold to him by a nearby wealthy family.
© Jacob Silberberg/Panos Pictures
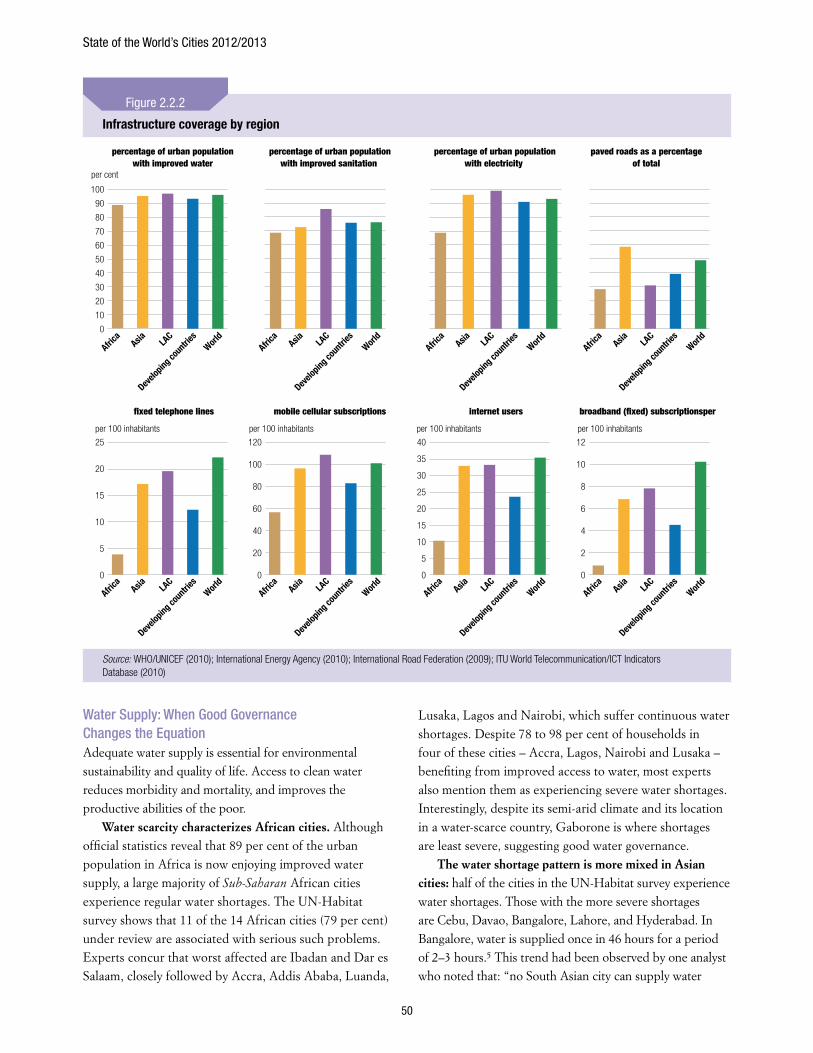
State of the World’s Cities 2012/2013
50
Water Supply: When Good Governance Changes the Equation Adequate water supply is essential for environmental sustainability and quality of life. Access to clean water reduces morbidity and mortality, and improves the productive abilities of the poor.
Water scarcity characterizes African cities. Although official statistics reveal that 89 per cent of the urban population in Africa is now enjoying improved water supply, a large majority of Sub-Saharan African cities experience regular water shortages. The UN-Habitat survey shows that 11 of the 14 African cities (79 per cent) under review are associated with serious such problems. Experts concur that worst affected are Ibadan and Dar es Salaam, closely followed by Accra, Addis Ababa, Luanda,
Lusaka, Lagos and Nairobi, which suffer continuous water shortages. Despite 78 to 98 per cent of households in four of these cities – Accra, Lagos, Nairobi and Lusaka –benefiting from improved access to water, most experts also mention them as experiencing severe water shortages. Interestingly, despite its semi-arid climate and its location in a water-scarce country, Gaborone is where shortages are least severe, suggesting good water governance.
The water shortage pattern is more mixed in Asian cities: half of the cities in the UN-Habitat survey experience water shortages. Those with the more severe shortages are Cebu, Davao, Bangalore, Lahore, and Hyderabad. In Bangalore, water is supplied once in 46 hours for a period of 2–3 hours.5 This trend had been observed by one analyst who noted that: “no South Asian city can supply water
Infrastructure coverage by region
25
5
15
20
10
5
15
10
0
100
per cent
per 100 inhabitants per 100 inhabitants per 100 inhabitants per 100 inhabitants
90
80
70
60
50
40
30
20
10
0
120
100
80
60
40
20
0
40
35
30
25
20
0
12
10
8
6
4
2
0
�xed telephone lines mobile cellular subscriptions internet users broadband (�xed) subscriptionsper
Africa Asia LA
C
Develo
ping c
ountr
iesWorl
dAfri
ca Asia LAC
Develo
ping c
ountr
iesWorl
dAfri
ca Asia LAC
Develo
ping c
ountr
iesWorl
dAfri
ca Asia LAC
Develo
ping c
ountr
iesWorl
d
Africa Asia LA
C
Develo
ping c
ountr
iesWorl
dAfri
ca Asia LAC
Develo
ping c
ountr
iesWorl
dAfri
ca Asia LAC
Develo
ping c
ountr
iesWorl
dAfri
ca Asia LAC
Develo
ping c
ountr
iesWorl
d
percentage of urban population with improved water
percentage of urban population with improved sanitation
percentage of urban population with electricity
paved roads as a percentage of total
Source: WHO/UNICEF (2010); International Energy Agency (2010); International Road Federation (2009); ITU World Telecommunication/ICT Indicators Database (2010)
Figure 2.2.2
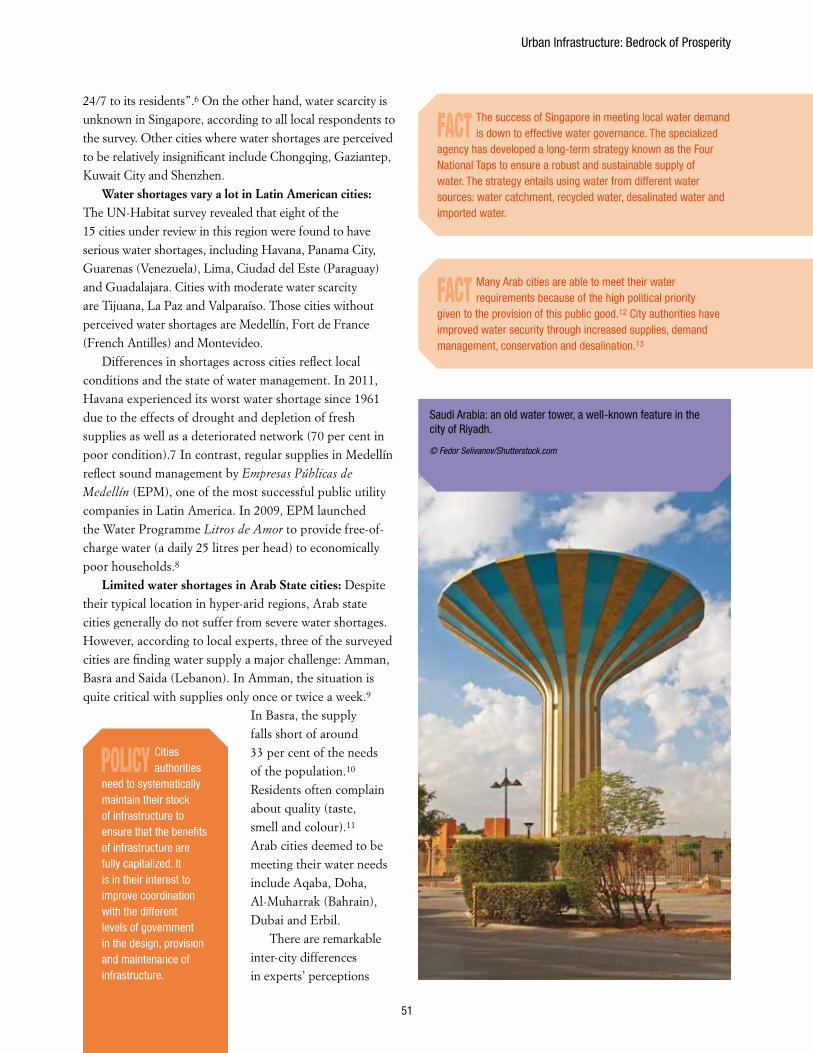
Urban Infrastructure: Bedrock of Prosperity
51
24/7 to its residents”.6 On the other hand, water scarcity is unknown in Singapore, according to all local respondents to the survey. Other cities where water shortages are perceived to be relatively insignificant include Chongqing, Gaziantep, Kuwait City and Shenzhen.
Water shortages vary a lot in Latin American cities: The UN-Habitat survey revealed that eight of the 15 cities under review in this region were found to have serious water shortages, including Havana, Panama City, Guarenas (Venezuela), Lima, Ciudad del Este (Paraguay) and Guadalajara. Cities with moderate water scarcity are Tijuana, La Paz and Valparaíso. Those cities without perceived water shortages are Medellín, Fort de France (French Antilles) and Montevideo.
Differences in shortages across cities reflect local conditions and the state of water management. In 2011, Havana experienced its worst water shortage since 1961 due to the effects of drought and depletion of fresh supplies as well as a deteriorated network (70 per cent in poor condition).7 In contrast, regular supplies in Medellín reflect sound management by Empresas Públicas de
Medellín (EPM), one of the most successful public utility companies in Latin America. In 2009, EPM launched the Water Programme Litros de Amor to provide free-of-charge water (a daily 25 litres per head) to economically poor households.8
Limited water shortages in Arab State cities: Despite their typical location in hyper-arid regions, Arab state cities generally do not suffer from severe water shortages. However, according to local experts, three of the surveyed cities are finding water supply a major challenge: Amman, Basra and Saida (Lebanon). In Amman, the situation is quite critical with supplies only once or twice a week.9
In Basra, the supply falls short of around 33 per cent of the needs of the population.10 Residents often complain about quality (taste, smell and colour).11 Arab cities deemed to be meeting their water needs include Aqaba, Doha, Al-Muharrak (Bahrain), Dubai and Erbil.
There are remarkable inter-city differences in experts’ perceptions
FACT The success of Singapore in meeting local water demand is down to effective water governance. The specialized
agency has developed a long-term strategy known as the Four National Taps to ensure a robust and sustainable supply of water. The strategy entails using water from different water sources: water catchment, recycled water, desalinated water and imported water.
FACT Many Arab cities are able to meet their water requirements because of the high political priority
given to the provision of this public good.12 City authorities have improved water security through increased supplies, demand management, conservation and desalination.13
POLICy Cities authorities
need to systematically maintain their stock of infrastructure to ensure that the benefits of infrastructure are fully capitalized. It is in their interest to improve coordination with the different levels of government in the design, provision and maintenance of infrastructure.
Saudi Arabia: an old water tower, a well-known feature in the city of Riyadh.
© Fedor Selivanov/Shutterstock.com
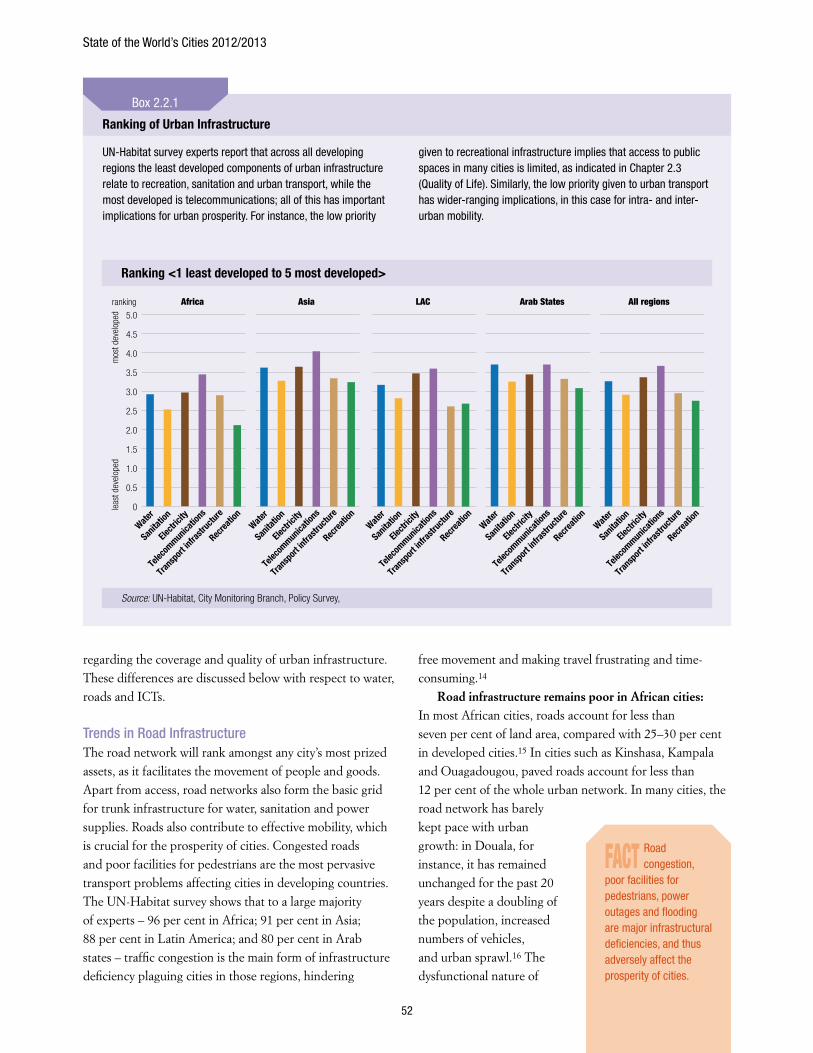
State of the World’s Cities 2012/2013
52
regarding the coverage and quality of urban infrastructure. These differences are discussed below with respect to water, roads and ICTs.
Trends in Road InfrastructureThe road network will rank amongst any city’s most prized assets, as it facilitates the movement of people and goods. Apart from access, road networks also form the basic grid for trunk infrastructure for water, sanitation and power supplies. Roads also contribute to effective mobility, which is crucial for the prosperity of cities. Congested roads and poor facilities for pedestrians are the most pervasive transport problems affecting cities in developing countries. The UN-Habitat survey shows that to a large majority of experts – 96 per cent in Africa; 91 per cent in Asia; 88 per cent in Latin America; and 80 per cent in Arab states – traffic congestion is the main form of infrastructure deficiency plaguing cities in those regions, hindering
free movement and making travel frustrating and time-consuming.14
Road infrastructure remains poor in African cities: In most African cities, roads account for less than seven per cent of land area, compared with 25–30 per cent in developed cities.15 In cities such as Kinshasa, Kampala and Ouagadougou, paved roads account for less than 12 per cent of the whole urban network. In many cities, the road network has barely kept pace with urban growth: in Douala, for instance, it has remained unchanged for the past 20 years despite a doubling of the population, increased numbers of vehicles, and urban sprawl.16 The dysfunctional nature of
Ranking of Urban Infrastructure
UN-Habitat survey experts report that across all developing regions the least developed components of urban infrastructure relate to recreation, sanitation and urban transport, while the most developed is telecommunications; all of this has important implications for urban prosperity. For instance, the low priority
given to recreational infrastructure implies that access to public spaces in many cities is limited, as indicated in Chapter 2.3 (Quality of Life). Similarly, the low priority given to urban transport has wider-ranging implications, in this case for intra- and inter-urban mobility.
Box 2.2.1
Ranking <1 least developed to 5 most developed>
4.5
5.0
4.0
3.5
1.5
0.5
2.5
3.0
2.0
1.0
0leas
t dev
elop
ed
ranking
mos
t dev
elop
ed
Trans
port
infras
tructu
re
Water
Electr
icity
Sanita
tion
Telec
ommun
icatio
ns
Recrea
tion
Trans
port
infras
tructu
re
Water
Electr
icity
Sanita
tion
Telec
ommun
icatio
ns
Recrea
tion
Trans
port
infras
tructu
re
Water
Electr
icity
Sanita
tion
Telec
ommun
icatio
ns
Recrea
tion
Trans
port
infras
tructu
re
Water
Electr
icity
Sanita
tion
Telec
ommun
icatio
ns
Recrea
tion
Trans
port
infras
tructu
re
Water
Electr
icity
Sanita
tion
Telec
ommun
icatio
ns
Recrea
tion
Africa Asia LAC Arab States All regions
Source: UN-Habitat, City Monitoring Branch, Policy Survey,
FACT Road congestion,
poor facilities for pedestrians, power outages and flooding are major infrastructural deficiencies, and thus adversely affect the prosperity of cities.
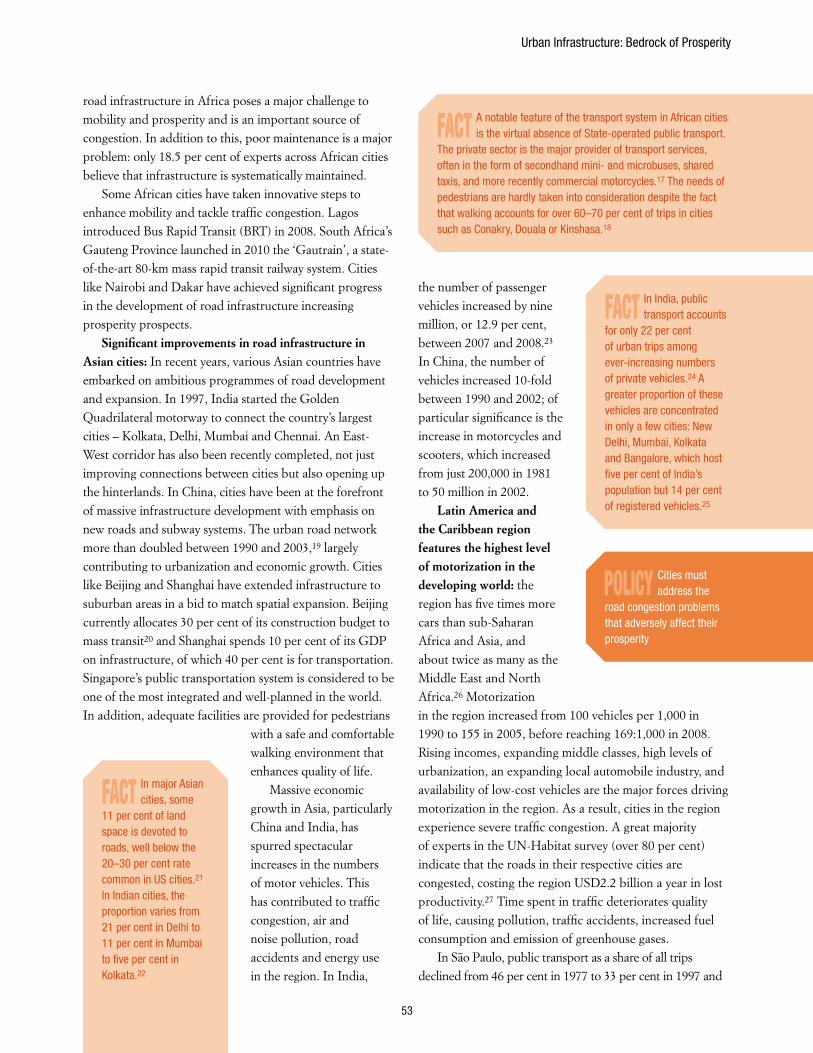
Urban Infrastructure: Bedrock of Prosperity
53
road infrastructure in Africa poses a major challenge to mobility and prosperity and is an important source of congestion. In addition to this, poor maintenance is a major problem: only 18.5 per cent of experts across African cities believe that infrastructure is systematically maintained.
Some African cities have taken innovative steps to enhance mobility and tackle traffic congestion. Lagos introduced Bus Rapid Transit (BRT) in 2008. South Africa’s Gauteng Province launched in 2010 the ‘Gautrain’, a state-of-the-art 80-km mass rapid transit railway system. Cities like Nairobi and Dakar have achieved significant progress in the development of road infrastructure increasing prosperity prospects.
Significant improvements in road infrastructure in Asian cities: In recent years, various Asian countries have embarked on ambitious programmes of road development and expansion. In 1997, India started the Golden Quadrilateral motorway to connect the country’s largest cities – Kolkata, Delhi, Mumbai and Chennai. An East-West corridor has also been recently completed, not just improving connections between cities but also opening up the hinterlands. In China, cities have been at the forefront of massive infrastructure development with emphasis on new roads and subway systems. The urban road network more than doubled between 1990 and 2003,19 largely contributing to urbanization and economic growth. Cities like Beijing and Shanghai have extended infrastructure to suburban areas in a bid to match spatial expansion. Beijing currently allocates 30 per cent of its construction budget to mass transit20 and Shanghai spends 10 per cent of its GDP on infrastructure, of which 40 per cent is for transportation. Singapore’s public transportation system is considered to be one of the most integrated and well-planned in the world. In addition, adequate facilities are provided for pedestrians
with a safe and comfortable walking environment that enhances quality of life.
Massive economic growth in Asia, particularly China and India, has spurred spectacular increases in the numbers of motor vehicles. This has contributed to traffic congestion, air and noise pollution, road accidents and energy use in the region. In India,
the number of passenger vehicles increased by nine million, or 12.9 per cent, between 2007 and 2008.23 In China, the number of vehicles increased 10-fold between 1990 and 2002; of particular significance is the increase in motorcycles and scooters, which increased from just 200,000 in 1981 to 50 million in 2002.
Latin America and the Caribbean region features the highest level of motorization in the developing world: the region has five times more cars than sub-Saharan Africa and Asia, and about twice as many as the Middle East and North Africa.26 Motorization in the region increased from 100 vehicles per 1,000 in 1990 to 155 in 2005, before reaching 169:1,000 in 2008. Rising incomes, expanding middle classes, high levels of urbanization, an expanding local automobile industry, and availability of low-cost vehicles are the major forces driving motorization in the region. As a result, cities in the region experience severe traffic congestion. A great majority of experts in the UN-Habitat survey (over 80 per cent) indicate that the roads in their respective cities are congested, costing the region USD2.2 billion a year in lost productivity.27 Time spent in traffic deteriorates quality of life, causing pollution, traffic accidents, increased fuel consumption and emission of greenhouse gases.
In São Paulo, public transport as a share of all trips declined from 46 per cent in 1977 to 33 per cent in 1997 and
FACT In major Asian cities, some
11 per cent of land space is devoted to roads, well below the 20–30 per cent rate common in US cities.21 In Indian cities, the proportion varies from 21 per cent in Delhi to 11 per cent in Mumbai to five per cent in Kolkata.22
FACT A notable feature of the transport system in African cities is the virtual absence of State-operated public transport.
The private sector is the major provider of transport services, often in the form of secondhand mini- and microbuses, shared taxis, and more recently commercial motorcycles.17 The needs of pedestrians are hardly taken into consideration despite the fact that walking accounts for over 60–70 per cent of trips in cities such as Conakry, Douala or Kinshasa.18
FACT In India, public transport accounts
for only 22 per cent of urban trips among ever-increasing numbers of private vehicles.24 A greater proportion of these vehicles are concentrated in only a few cities: New Delhi, Mumbai, Kolkata and Bangalore, which host five per cent of India’s population but 14 per cent of registered vehicles.25
POLICy Cities must address the
road congestion problems that adversely affect their prosperity
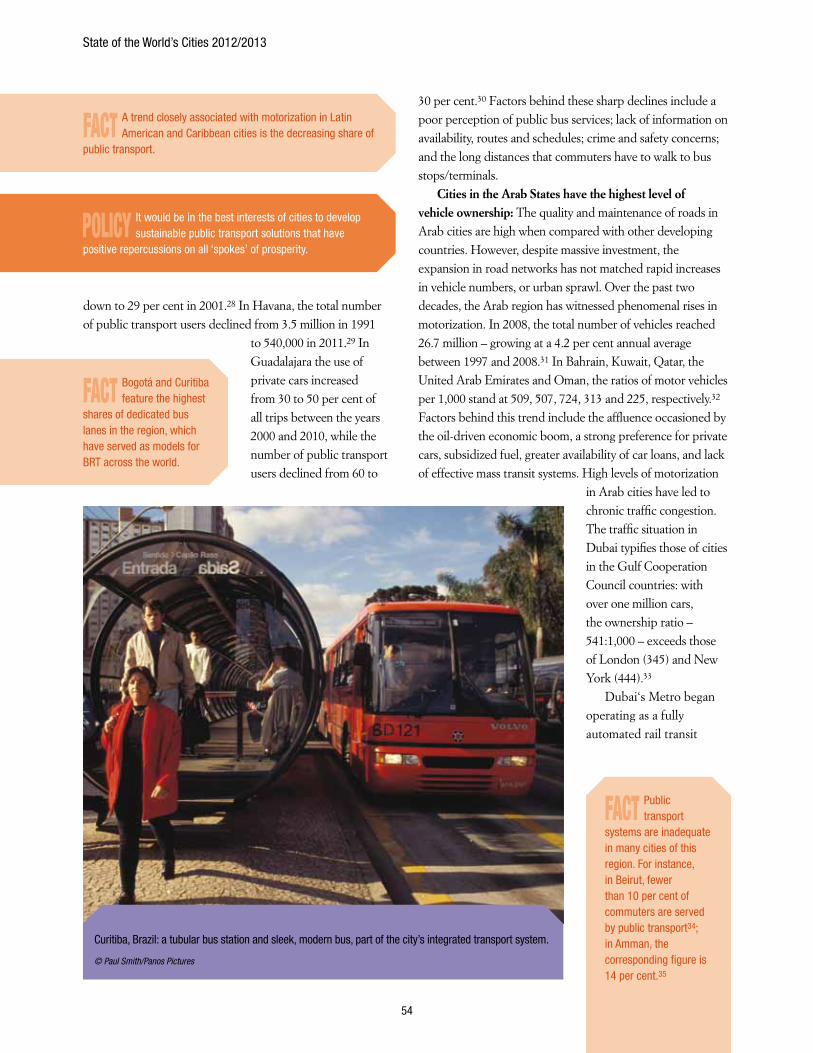
State of the World’s Cities 2012/2013
54
down to 29 per cent in 2001.28 In Havana, the total number of public transport users declined from 3.5 million in 1991
to 540,000 in 2011.29 In Guadalajara the use of private cars increased from 30 to 50 per cent of all trips between the years 2000 and 2010, while the number of public transport users declined from 60 to
30 per cent.30 Factors behind these sharp declines include a poor perception of public bus services; lack of information on availability, routes and schedules; crime and safety concerns; and the long distances that commuters have to walk to bus stops/terminals.
Cities in the Arab States have the highest level of vehicle ownership: The quality and maintenance of roads in Arab cities are high when compared with other developing countries. However, despite massive investment, the expansion in road networks has not matched rapid increases in vehicle numbers, or urban sprawl. Over the past two decades, the Arab region has witnessed phenomenal rises in motorization. In 2008, the total number of vehicles reached 26.7 million – growing at a 4.2 per cent annual average between 1997 and 2008.31 In Bahrain, Kuwait, Qatar, the United Arab Emirates and Oman, the ratios of motor vehicles per 1,000 stand at 509, 507, 724, 313 and 225, respectively.32 Factors behind this trend include the affluence occasioned by the oil-driven economic boom, a strong preference for private cars, subsidized fuel, greater availability of car loans, and lack of effective mass transit systems. High levels of motorization
in Arab cities have led to chronic traffic congestion. The traffic situation in Dubai typifies those of cities in the Gulf Cooperation Council countries: with over one million cars, the ownership ratio – 541:1,000 – exceeds those of London (345) and New York (444).33
Dubai‘s Metro began operating as a fully automated rail transit
FACT A trend closely associated with motorization in Latin American and Caribbean cities is the decreasing share of
public transport.
FACT Bogotá and Curitiba feature the highest
shares of dedicated bus lanes in the region, which have served as models for BRT across the world.
FACT Public transport
systems are inadequate in many cities of this region. For instance, in Beirut, fewer than 10 per cent of commuters are served by public transport34; in Amman, the corresponding figure is 14 per cent.35
POLICy It would be in the best interests of cities to develop sustainable public transport solutions that have
positive repercussions on all ‘spokes’ of prosperity.
Curitiba, Brazil: a tubular bus station and sleek, modern bus, part of the city’s integrated transport system.
© Paul Smith/Panos Pictures
Urban Infrastructure: Bedrock of Prosperity
55
system in 2009, and when fully operational in 2012 is expected to reduce car use by 30 per cent.36 In 2010, the Greater Amman Municipality launched a USD175 million
BRT project along three busy corridors totaling 32km; when completed in 2012, the system will have a transport capacity of 6,000 passengers per hour.37
Information and communication technologies (ICTs) and the Prosperity of Cities
Over the past decade, worldwide expansion in ICTs has been nothing short of phenomenal. In the sole mobile telephony area, for instance, the total number of subscriptions increased from 962 million in 2001 to six billion in 2011 – resulting in a worldwide ratio of 867:1,000.38 It is worth noting that developing countries account for over 75 per cent of global mobile cellular subscriptions. No other component of infrastructure has witnessed such spectacular growth. Advances in ICTs and liberalization of telecommunications markets have led to wealth creation and economic growth, with cities the major beneficiaries. ICTs play a major role in any city’s competitiveness, productivity and prosperity as they facilitate innovation, efficiency and effective service delivery. An overwhelming majority of surveyed experts – 85 per cent in Africa; 96 per cent in Asia; 86 per cent in Latin America and the Caribbean; and 90 per cent in Arab States –rank telecommunications infrastructure as ‘highly developed’ or ‘developed’ in their cities.
ICTs in African cities: Mobile telephones have leapfrogged landlines in Africa when compared with developed regions that invested in landlines before moving to mobile networks.40 At least 90 per cent of households in Abuja, Accra, Dakar, Lagos, Luanda and Nairobi own mobile telephones; even where ownership of mobile telephones appears to be low, it hardly falls below 50 percent. The use of mobile telephones surpasses fixed lines in virtually all cities. In Kinshasa, there are 119 times as many households owning mobile telephones as fixed lines. In Lagos, Harare, Kampala and Mombasa, households are 12 times more likely to own mobile telephones than landlines. Apart from facilitating connectivity and communication, the cell-phone industry also serves as a catalyst for growth, contributing an
estimated average USD56 billion or 3.5 per cent of GDP, to the regional economy every year,41 as well as employment for over five million Africans.
ICTs in Asian cities: Mobile telephony has also expanded dramatically in this region. India’s four major cities – Delhi, Mumbai, Kolkata and Chennai – feature mobile telephone connection rates of 138 per cent, 112 per cent, 102 per cent and 143 per cent respectively.42 In Singapore, telecommunications infrastructure is highly developed. In 2010, the household fixed-line penetration rate was 103 per cent, and the mobile population penetration rate was 144 per cent, with 82 per cent of households having access to Internet.43 ICTs are major contributors to economic growth in Asia accounting for USD485 billion, or 2.7 per cent of GDP; they also provide 11.4 million jobs – for each job created by a mobile operator, eight additional ones are generated.44 The major role played by the mobile telephone sector has seen it act as a buffer against economic recession in the region.
ICTs in Latin American cities: The ownership of mobile telephones is fairly widespread. Urban areas in Brazil, Chile, Panama, and Paraguay feature the highest connection rates, with at least 80 per cent of households owning mobile telephones.45 In major Mexican cities, ownership varies between 66 and 84 per cent of the population. Compared with Africa and Asia, fixed lines are more developed in Latin American cities. For instance, between 41 per cent and 68 per cent of households in Mexico’s major cities have fixed lines. The mobile telephone industry contributes significantly to the region’s economy: 1.7 per cent of regional GDP46 (or USD82 billion) in 2010. Increases in mobile telephone connectivity have also been found to boost GDP per capita.
ICTs in Arab States cities: Urban ownership of mobile telephones in Arab States, especially Gulf Cooperation Council countries, is widespread. Penetration rates in Doha, Dubai, Amman, Kuwait, Muscat and Riyadh are in excess 100 per cent (Dubai’s penetration rate is the highest in the world with over 200 mobile telephones per 100 residents). The UAE and other Gulf Cooperation Council countries have invested in ITC-dedicated parks as a boost to socioeconomic growth and diversification away from an oil-dependent to a knowledge-based economy. The ICT sector plays a significant role in the region’s economy. In the case of the UAE, the sector contributed 5.3 per cent to GDP in 2010, up from 4.1 per cent in 2007, and currently employs over 11,500.47
Box 2.2.2
FACT In Africa, the total number of mobile telephone connections has grown an average 30 per cent
per annum since 2001, and by 2011 over 60 per cent of the population was connected. In Asia-Pacific, the number of mobile connections increased from 824 million in 2005 to three billion in 2011– making the region the largest mobile telephone market in the world. Remarkable growth rates have also been recorded in the Middle East, where the number of mobile connections increased from 177 million in 2007 to 334 million in 2011.39
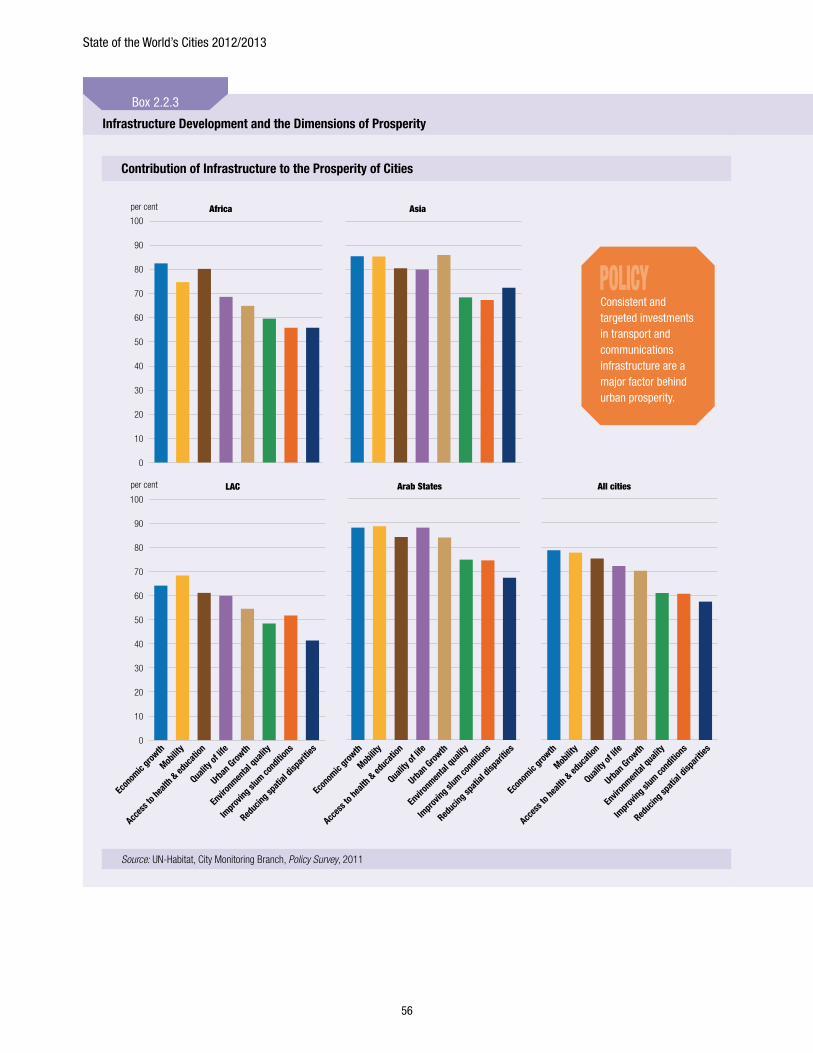
State of the World’s Cities 2012/2013
56
Infrastructure Development and the Dimensions of Prosperity
It is possible to identify the specific contributions adequate infrastructure can make to the prosperity of cities, but it must be remembered that they are interrelated and interact with one another in a variety of ways. As perceived by experts participating in the UN-Habitat survey, these contributions are the following (by order of decreasing importance): economic growth; facilitating mobility; improving access to health and education; improving quality of life; steering spatial expansion; environmental quality; improving slum conditions and reducing poverty; and reducing spatial disparities. These eight types of contribution are presented in the charts for the four regions under review.
Economic Growth: Infrastructure plays a crucial role in supporting economic growth, and it is worth noting that the reverse causal relationship also holds – that is, infrastructure benefits from economic growth. Infrastructure contributes to growth through enhanced productivity of the factors of production. Indeed between 1990 and 2005, improved infrastructure contributed one per cent to per capita economic growth in Africa, and 1.2 per cent in Asia.48 In Africa, the greatest impact has been attributed to telecommunications and, to a lesser extent, roads.
Facilitating Mobility: Seamless movement within and between cities thanks to efficient mass transit systems is essential to the proper functionality and prosperity of cities. Cities that have deployed sustainable transport policies to enhance mobility have reaped huge advantages that positively impact on the other ‘spokes’ of prosperity. In Bogotá and Curitiba, for instance, BRT makes both cities more livable in very tangible ways, including reducing traffic congestion, decreasing travel times and costs, reducing energy consumption and improving environmental quality.
Access to health and education: Infrastructure facilitates access to health and education, which are essential components of human development and feature prominently among Millennium Development Goals. Healthy children learn better and healthy adults work better – both being major assets to the city. Education is crucial to empowerment, reducing poverty and enhancing productivity. Cities with a healthier, better-educated workforce are more likely to be productive and competitive.
Improving quality of life: Infrastructure can improve quality of life in a variety of ways, including: enhancing safety and security, especially for youth and women; and expanding the provision of public goods to enhance the city’s appeal.
Steering spatial expansion: Infrastructure can steer the spatial expansion of a city, facilitating more compact urban development and integrating different land uses. This urban form is deemed to be efficient, inclusive and sustainable in four different ways: (1) the costs of infrastructure are cheaper; (2) access to services and facilities is improved; (3) the livelihoods of the urban poor are enhanced; and (4) social segregation is reduced. Environmental quality: Many developing country cities are characterized by inadequate water supply and squalid conditions in terms of sanitation. These two components of infrastructure are vital to improved environmental conditions in cities, as they facilitate a clean and pollution-free environment. On top of this, flood-control infrastructure safeguards urban areas against erosion, flooding, landslides and disasters. Improving slum conditions and reducing poverty: Infrastructure can contribute to the prosperity of cities through improved slum conditions and reducing poverty. Providing adequate infrastructure for roads, water, sanitation and electricity can reduce the health burden faced by slum dwellers, delivering major benefits in terms of environmental quality.
Reducing spatial disparities: Infrastructure can reduce spatial disparities, particularly in uncontrolled and un-serviced peri-urban areas, connecting them to consolidated parts of the city.
Box 2.2.3
Contribution of Infrastructure to the Prosperity of Cities
90
100
80
70
30
10
50
60
40
20
0
Econ
omic
growth
90
100
per cent
per cent
80
70
30
10
0
50
60
40
20
Arab States All cities
Africa
LAC
Asia
Mobilit
y
Acces
s to h
ealth
& educ
ation
Quality
of lif
e
Urban G
rowth
Envir
onmen
tal qu
ality
Impro
ving s
lum co
nditio
ns
Reduc
ing sp
atial
dispa
rities
Econ
omic
growth
Mobilit
y
Acces
s to h
ealth
& educ
ation
Quality
of lif
e
Urban G
rowth
Envir
onmen
tal qu
ality
Impro
ving s
lum co
nditio
ns
Reduc
ing sp
atial
dispa
rities
Econ
omic
growth
Mobilit
y
Acces
s to h
ealth
& educ
ation
Quality
of lif
e
Urban G
rowth
Envir
onmen
tal qu
ality
Impro
ving s
lum co
nditio
ns
Reduc
ing sp
atial
dispa
rities
Source: UN-Habitat, City Monitoring Branch, Policy Survey, 2011
POLICy Consistent and targeted investments in transport and communications infrastructure are a major factor behind urban prosperity.
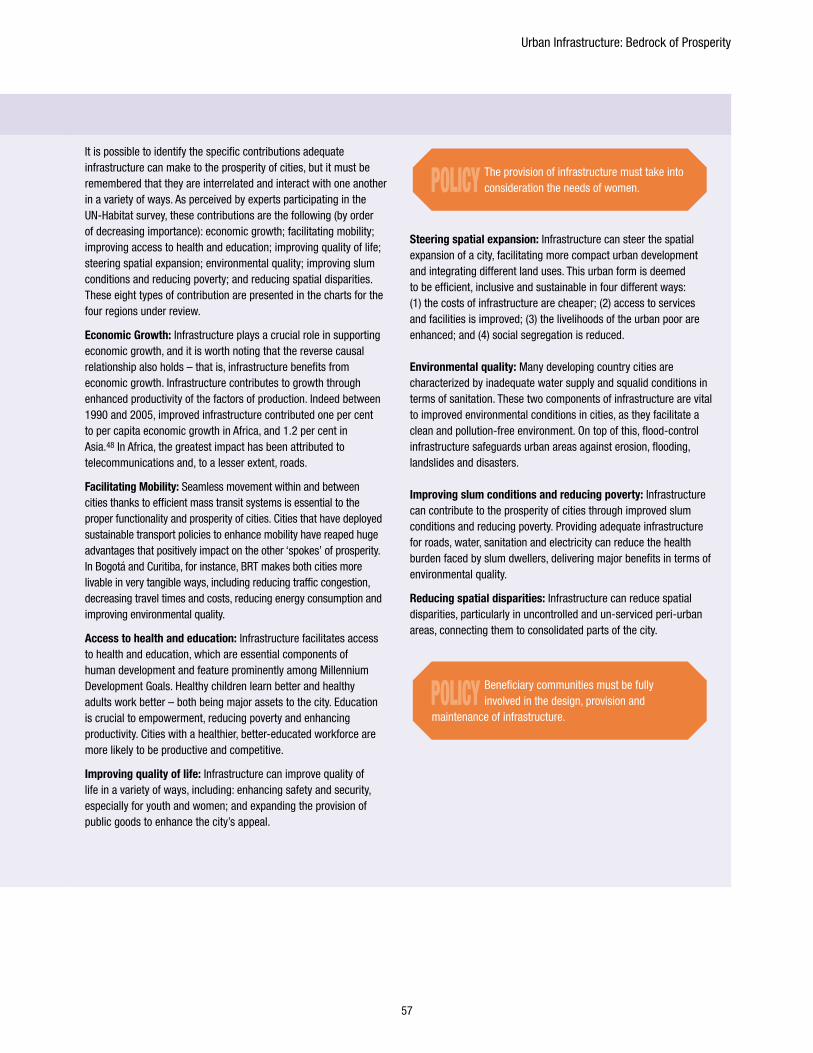
Urban Infrastructure: Bedrock of Prosperity
57
Infrastructure Development and the Dimensions of Prosperity
It is possible to identify the specific contributions adequate infrastructure can make to the prosperity of cities, but it must be remembered that they are interrelated and interact with one another in a variety of ways. As perceived by experts participating in the UN-Habitat survey, these contributions are the following (by order of decreasing importance): economic growth; facilitating mobility; improving access to health and education; improving quality of life; steering spatial expansion; environmental quality; improving slum conditions and reducing poverty; and reducing spatial disparities. These eight types of contribution are presented in the charts for the four regions under review.
Economic Growth: Infrastructure plays a crucial role in supporting economic growth, and it is worth noting that the reverse causal relationship also holds – that is, infrastructure benefits from economic growth. Infrastructure contributes to growth through enhanced productivity of the factors of production. Indeed between 1990 and 2005, improved infrastructure contributed one per cent to per capita economic growth in Africa, and 1.2 per cent in Asia.48 In Africa, the greatest impact has been attributed to telecommunications and, to a lesser extent, roads.
Facilitating Mobility: Seamless movement within and between cities thanks to efficient mass transit systems is essential to the proper functionality and prosperity of cities. Cities that have deployed sustainable transport policies to enhance mobility have reaped huge advantages that positively impact on the other ‘spokes’ of prosperity. In Bogotá and Curitiba, for instance, BRT makes both cities more livable in very tangible ways, including reducing traffic congestion, decreasing travel times and costs, reducing energy consumption and improving environmental quality.
Access to health and education: Infrastructure facilitates access to health and education, which are essential components of human development and feature prominently among Millennium Development Goals. Healthy children learn better and healthy adults work better – both being major assets to the city. Education is crucial to empowerment, reducing poverty and enhancing productivity. Cities with a healthier, better-educated workforce are more likely to be productive and competitive.
Improving quality of life: Infrastructure can improve quality of life in a variety of ways, including: enhancing safety and security, especially for youth and women; and expanding the provision of public goods to enhance the city’s appeal.
Steering spatial expansion: Infrastructure can steer the spatial expansion of a city, facilitating more compact urban development and integrating different land uses. This urban form is deemed to be efficient, inclusive and sustainable in four different ways: (1) the costs of infrastructure are cheaper; (2) access to services and facilities is improved; (3) the livelihoods of the urban poor are enhanced; and (4) social segregation is reduced. Environmental quality: Many developing country cities are characterized by inadequate water supply and squalid conditions in terms of sanitation. These two components of infrastructure are vital to improved environmental conditions in cities, as they facilitate a clean and pollution-free environment. On top of this, flood-control infrastructure safeguards urban areas against erosion, flooding, landslides and disasters. Improving slum conditions and reducing poverty: Infrastructure can contribute to the prosperity of cities through improved slum conditions and reducing poverty. Providing adequate infrastructure for roads, water, sanitation and electricity can reduce the health burden faced by slum dwellers, delivering major benefits in terms of environmental quality.
Reducing spatial disparities: Infrastructure can reduce spatial disparities, particularly in uncontrolled and un-serviced peri-urban areas, connecting them to consolidated parts of the city.
POLICy The provision of infrastructure must take into consideration the needs of women.
POLICy Beneficiary communities must be fully involved in the design, provision and
maintenance of infrastructure.
State of the World’s Cities 2012/2013
58
Endnotes
1 Choguill, C. (1996) “Ten steps to sustainable infrastructure”, Habitat International, Vol. 20(3), pp. 389-4044; Teriman, S., T. Yigitcanlar, and S. Mayere (2010) ‘Sustainable urban infrastructure development in south east Asia : evidence from Hong Kong, Kuala Lumpur and Singapore’ in Yigitcanlar, T. (ed.) Sustainable Urban and Regional Infrastructure Development : Technologies, Applications and Management, IGI Global, Hershey, Pennsylvania
2 Lall, R., R. Anand and A. Rastogi (2010) ‘Developing physical Infrastructure: A comparative perspective on the experience of China and India’, in Gerhaeusser K., Iwasaki, Y. and V. B. Tulasidhar, (eds) Resurging Asian Giants’ Asian Development Bank, Manila, pp.57-114.
3 Fay, M. and M. Morrison (2005) Infrastructure in Latin America and the Caribbean: Recent Developments and Key Challenges, World Bank, Washington,DC.
4 Foster, V., and C. Briceno-Garmendia (2010) Africa’s Infrastructure: A Time for Transformation, World Bank, Washington, DC.
5 Belliapa, S.G. (2011) City Report on Bangalore. Unpublished UN-Habitat background study for “State of the World’s Cities Report 2012/13”
6 Harris, C (2008) “India Leads Developing Nations in Private Sector Investment”, Gridlines, No.3, March 2008, http://www.pppinindia.com/pdf/gridlines.pdf
7 Latin American Herald Tribune (2011) ‘Cuban Capital Faces Worst Water Shortage in 50 Years’, Latin American Herald Tribune, http://laht.com/article.asp?ArticleId=391553&CategoryId=14510
8 López , M (2011) Water Distribution as an Indicator of Social Inequality: The Case of Medellín, Colombia, http://www.centrodametropole.org.br/static/uploads/marcela_l.pdf
9 Shabou, A., N. Soboh, K. Jalouka, and D. A. Thaib (2011) City Report on Amman. Unpublished UN-Habitat background study for “State of the World’s Cities Report 2012/2013”
10 Karim, S. S.A. (2011) City Report on Basra. Unpublished UN-Habitat background study for “State of the World’s Cities Report 2012/2013”
11 Takechi, A (2010) Basrah Water Supply from viewpoint of Its Water Sources, http://www.waterforum.jp/jpn/iraq/doc/expert_meeting/session/4_2.pdf
12 Although the region is the least provided in the world, with just 1.4 per cent of the planet renewable freshwater. {Roudi-Fahimi, F., L. Creel and R. M. De Souza (2002) Finding the Balance: Population and Water Scarcity in the Middle East and North Africa, MENA Policy Brief, Population Reference Bureau, Washington, DC}
13 The Arab State’s Region is host to 65 of the world’s 100 largest desalination plants. {Pacific Institute (2011) The World’s Water Volume 7: The Biennial Report on Freshwater Resources, Table 21, http://www.worldwater.org/data.html}
14 The economic costs of traffic congestion are staggering: in the US in 2010 it was put at $101 billion in terms of lost productivity and wasted fuel, or $713 per commuter per year; in Mauritius, traffic congestion in cities costs the economy 1.3 per cent of GDP. {African Economic Outlook (2011) Mauritius: Overview, http://www.africaneconomicoutlook.org/en/countries/southern-africa/mauritius/}
15 Kumar , A., and F. Barrett (2008) Stuck in Traffic: Urban Transport in Africa, World Bank, Washington, DC
16 Kumar,A. (2011) Understanding the Emerging Role Of Motorcycles in African Cities: A Political Economy Perspective, Sub-Saharan Africa Transport Policy Program Discussion Paper No. 13, World Bank, http://siteresources.worldbank.org/EXTAFRSUBSAHTRA/Resources/1513929-1262811948762/DP13-Role-Motorcycles.pdf
17 In 2007, Lagos had over 100,000 minibuses and 200,000 commercial motorcycles directly employing 500,000 people. Kumar (2011)
18 Kumar and Barrett (2008), op. cit.
19 The network increased from 95,000 to 208,000 km from 1990 to 2003. Pucher et al (2007)
20 McKinsey Global Institute (2009) Preparing for China’s Urban Billion, McKinsey and Company.
21 World Bank (2002) Cities on the Move: A World Bank Urban Transport Strategy Review, World Bank, Washington, DC.
22 Pucher, J., Z. Peng, N. Mittal, Y. Zhu,and N. Korattyswaroopam (2007) ‘Urban transport trends and policies in China and India: Impacts of rapid Economic growth’, Transport Reviews, Vol. 27 (4), pp. 379–410
23 Uddin, A. (2009) ‘Traffic Congestion in Indian Cities: Challenges of a Rising Power’, paper presented at the conference Kyoto of the Cities, Naples, March 26-28, 2009, http://www.visionwebsite.eu/UserFiles/File/filedascaricare/Scientifci%20Partners,Papers(Kyoto)/Draft_koc_Azeem%20Uddin.pdf
24 HPEC (2011) Report on Indian Urban Infrastructure and Services,National Institute of Urban Affairs, New Delhi
25 Uddin, A (2009) op.cit.
26 Estimated from World Bank (2011)
27 Canassa, H. (2008) ‘São Paulo Traffic Jams Mean Lost Business, Stress, Helicopters’, Bloomberg, July 14, http://www.bloomberg.com/apps/news?pid=newsarchive&sid=aAwzOeXmIxgk
28 Vicentini, V. L.(2010) ‘Lessons from urban transport in Latin America and the Caribbean’, presentation at the 2010 ADB Transport Forum, May 25-27, Manila; Luoma, J., M. Sivak and S. Zielinski (2010) The Future of Personal Transportation in Megacities of the World, Transportation Research Institute, University of Michigan, Ann Arbor
29 Coyula, M. (2011) City Report on Havana. Unpublished UN-Habitat background study for “State of the World’s Cities Report 2012/2013”
30 Perez, F. (2011) City Report on Guadajara. Unpublished UN-Habitat background study for “State of the World’s Cities Report 2012/2013”.
31 ESCWA (2009) Transport for Sustainable Development in the Arab Region: Measures, Progress Achieved, Challenges and Policy Framework, United Nations, New York, http://www.uncclearn.org/sites/www.uncclearn.org/files/unescwa14.pdf
32 World Bank (2011) World Development Indicators, World Bank, Washington, DC.
33 Shariff, O. (2007) ‘Dubai Traffic Woes Inflict Losses of Dh4.6b a Year’, Gulf News, December 13, http://gulfnews.com/business/shipping/dubai-traffic-woes-inflict-losses-of-dh4-6b-a-year-1.75892; Raouf, M. A. (2009)’Towards sustainable transportation’, Gulf News, September 18, http://gulfnews.com/opinions/columnists/towards-sustainable-transportation-1.539872
34 Kollock, P. (2010) ‘Still Sitting in Beirut Traffic’, NOW Lebanon, May 5 http://www.nowlebanon.com/NewsArchiveDetails.aspx?ID=166121
35 Shabou, A., N. Soboh, K. Jalouka, and D. A. Thaib (2011) op. cit.
36 Raouf, M. A. (2009) op. cit.
37 Al-Rawashdeh, A. (2011) “New bus system aims to reduce Amman’s traffic congestion”, Al-Shorfa.com, January 26, http://al-shorfa.com/en_GB/articles/meii/features/main/2011/01/26/feature-02
38 International Telecommunication Union (2010) World Telecommunication/ICT Indicators Database, http://www.itu.int/ITU-D/ict/statistics/
39 GSM Association (2011a) Asia Pacific Mobile Observatory 2011, GSMA, London
40 Aker, J. C. and I. M. Mbiti, (2010) ‘Mobile telephones and economic development in Africa’, Journal of Economic Perspectives, Vol. 24(3), pp. 207-232
41 GSM Association (2011b) Africa Mobile Observatory 2011, GSMA, London
42 Philip, J. T. (2009) ‘Average Urban Teledensity Crosses 100% Mark’, The Economic Times, December 12, http://articles.economictimes.indiatimes.com/2009-12-12/news/28416388_1_cent-mark-mobile-connections-teledensity
43 Centre for Livable Cities (2011) City Report on Singapore. Unpublished UN-Habitat background study for “State of the World’s Cities Report 2012/2013”
44 GSM Association (2011a) op. cit.
45 Fernández-Ardèvol, M. (2010) ‘Household access to mobile telephony in Latin America’, in Sevensson, J. and G. Wicander, (eds.): Proceedings of the 2nd International Conference on M4D,Mobile Communication Technology for Development, 10-11 November, Kampala, Uganda, pp. 60-69.
46 GSM Association (2011c) Latin American Mobile Observatory 2011, GSMA London
47 Telecommunications and Regulatory Authority (2011) UAE Telecommunications Sector Developments and Indicators, 2007 –2010.
48 Calderón, C (2008) “Infrastructure and growth in Africa”, Policy Research Working Paper 4914, World Bank, Washington, DC
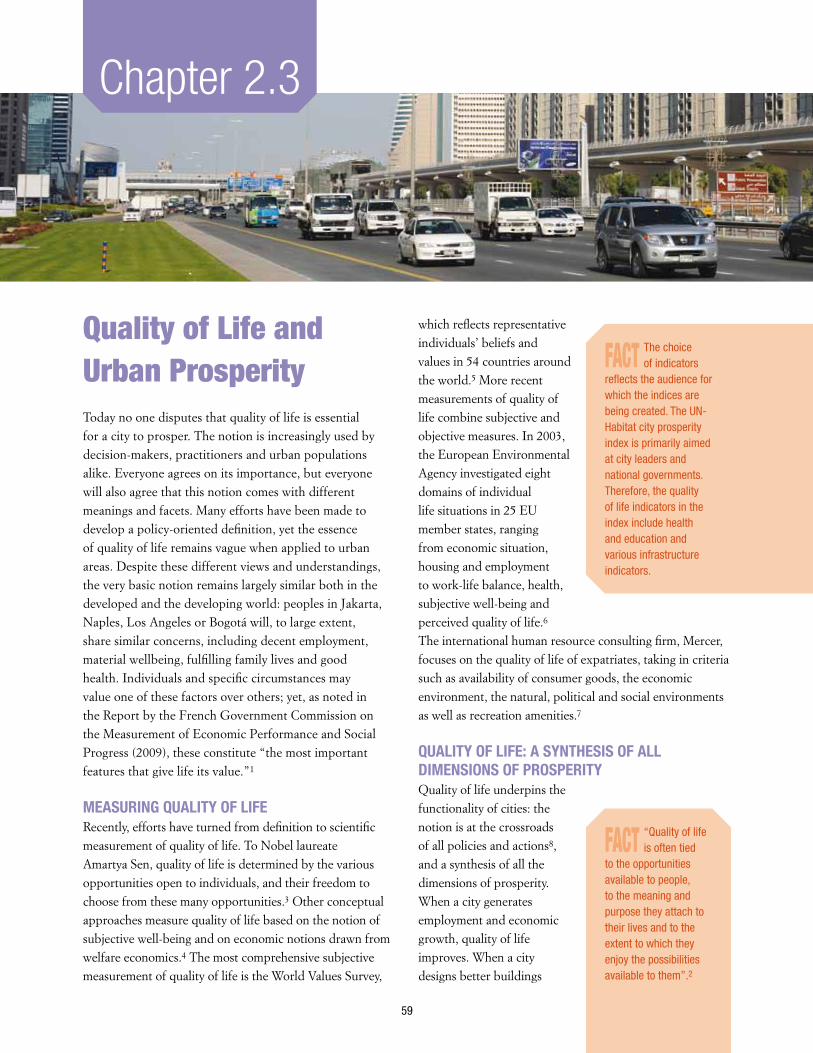
59
Quality of Life and Urban Prosperity Today no one disputes that quality of life is essential for a city to prosper. The notion is increasingly used by decision-makers, practitioners and urban populations alike. Everyone agrees on its importance, but everyone will also agree that this notion comes with different meanings and facets. Many efforts have been made to develop a policy-oriented definition, yet the essence of quality of life remains vague when applied to urban areas. Despite these different views and understandings, the very basic notion remains largely similar both in the developed and the developing world: peoples in Jakarta, Naples, Los Angeles or Bogotá will, to large extent, share similar concerns, including decent employment, material wellbeing, fulfilling family lives and good health. Individuals and specific circumstances may value one of these factors over others; yet, as noted in the Report by the French Government Commission on the Measurement of Economic Performance and Social Progress (2009), these constitute “the most important features that give life its value.”1
MEASURING QUALITy OF LIFERecently, efforts have turned from definition to scientific measurement of quality of life. To Nobel laureate Amartya Sen, quality of life is determined by the various opportunities open to individuals, and their freedom to choose from these many opportunities.3 Other conceptual approaches measure quality of life based on the notion of subjective well-being and on economic notions drawn from welfare economics.4 The most comprehensive subjective measurement of quality of life is the World Values Survey,
which reflects representative individuals’ beliefs and values in 54 countries around the world.5 More recent measurements of quality of life combine subjective and objective measures. In 2003, the European Environmental Agency investigated eight domains of individual life situations in 25 EU member states, ranging from economic situation, housing and employment to work-life balance, health, subjective well-being and perceived quality of life.6 The international human resource consulting firm, Mercer, focuses on the quality of life of expatriates, taking in criteria such as availability of consumer goods, the economic environment, the natural, political and social environments as well as recreation amenities.7
QUALITy OF LIFE: A SyNTHESIS OF ALL DIMENSIONS OF PROSPERITyQuality of life underpins the functionality of cities: the notion is at the crossroads of all policies and actions8, and a synthesis of all the dimensions of prosperity. When a city generates employment and economic growth, quality of life improves. When a city designs better buildings
Chapter 2.3
FACT “Quality of life is often tied
to the opportunities available to people, to the meaning and purpose they attach to their lives and to the extent to which they enjoy the possibilities available to them”.2
FACT The choice of indicators
reflects the audience for which the indices are being created. The UN-Habitat city prosperity index is primarily aimed at city leaders and national governments. Therefore, the quality of life indicators in the index include health and education and various infrastructure indicators.
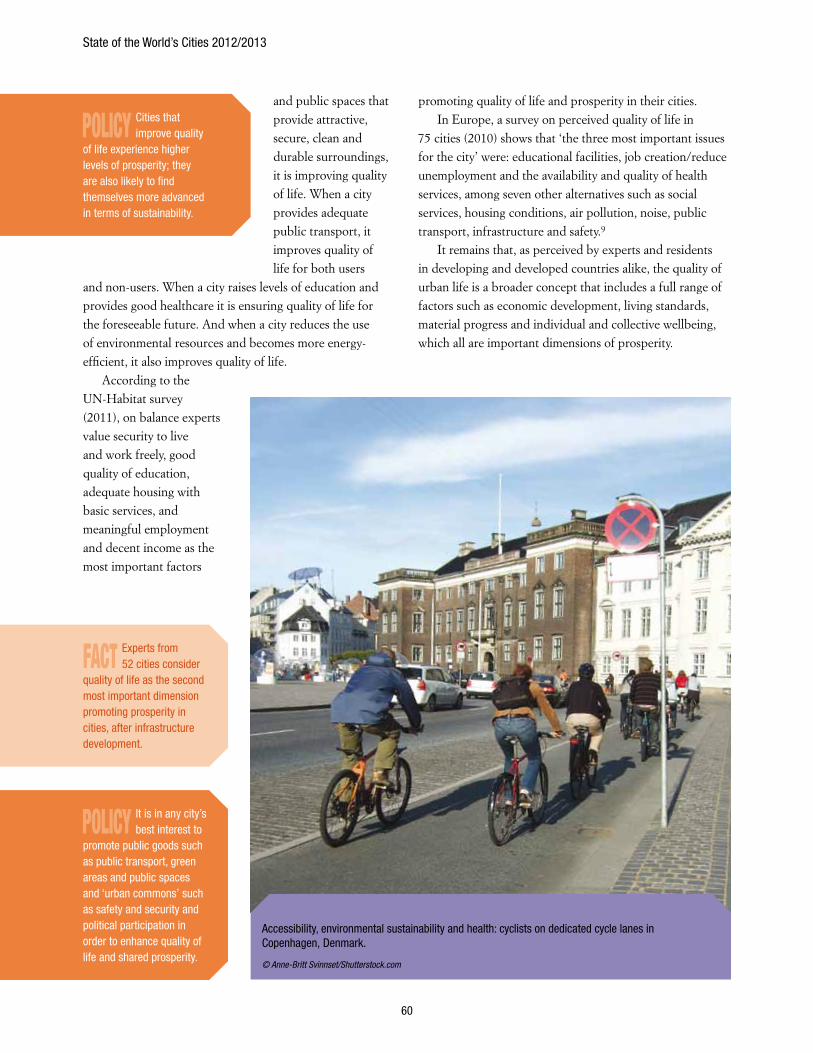
State of the World’s Cities 2012/2013
60
and public spaces that provide attractive, secure, clean and durable surroundings, it is improving quality of life. When a city provides adequate public transport, it improves quality of life for both users
and non-users. When a city raises levels of education and provides good healthcare it is ensuring quality of life for the foreseeable future. And when a city reduces the use of environmental resources and becomes more energy-efficient, it also improves quality of life.
According to the UN-Habitat survey (2011), on balance experts value security to live and work freely, good quality of education, adequate housing with basic services, and meaningful employment and decent income as the most important factors
promoting quality of life and prosperity in their cities. In Europe, a survey on perceived quality of life in
75 cities (2010) shows that ‘the three most important issues for the city’ were: educational facilities, job creation/reduce unemployment and the availability and quality of health services, among seven other alternatives such as social services, housing conditions, air pollution, noise, public transport, infrastructure and safety.9
It remains that, as perceived by experts and residents in developing and developed countries alike, the quality of urban life is a broader concept that includes a full range of factors such as economic development, living standards, material progress and individual and collective wellbeing, which all are important dimensions of prosperity.
Accessibility, environmental sustainability and health: cyclists on dedicated cycle lanes in Copenhagen, Denmark.
© Anne-Britt Svinnset/Shutterstock.com
FACT Experts from 52 cities consider
quality of life as the second most important dimension promoting prosperity in cities, after infrastructure development.
POLICy Cities that improve quality
of life experience higher levels of prosperity; they are also likely to find themselves more advanced in terms of sustainability.
POLICy It is in any city’s best interest to
promote public goods such as public transport, green areas and public spaces and ‘urban commons’ such as safety and security and political participation in order to enhance quality of life and shared prosperity.
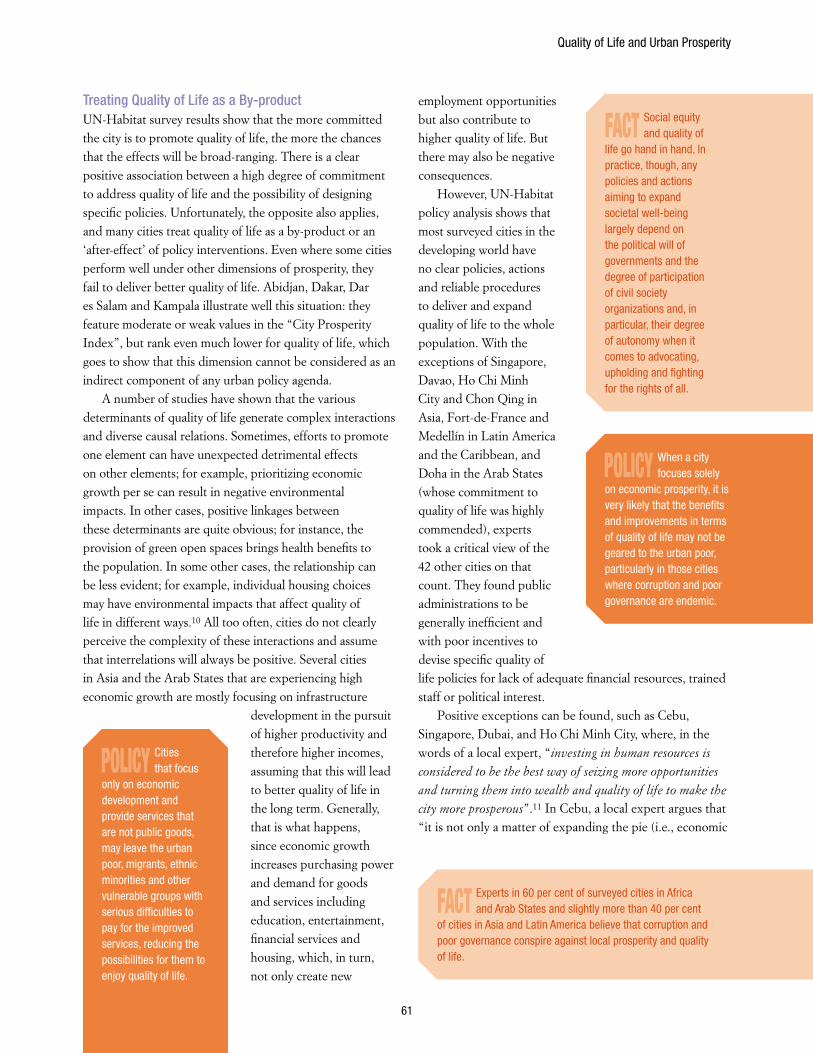
Quality of Life and Urban Prosperity
61
Treating Quality of Life as a By-productUN-Habitat survey results show that the more committed the city is to promote quality of life, the more the chances that the effects will be broad-ranging. There is a clear positive association between a high degree of commitment to address quality of life and the possibility of designing specific policies. Unfortunately, the opposite also applies, and many cities treat quality of life as a by-product or an ‘after-effect’ of policy interventions. Even where some cities perform well under other dimensions of prosperity, they fail to deliver better quality of life. Abidjan, Dakar, Dar es Salam and Kampala illustrate well this situation: they feature moderate or weak values in the “City Prosperity Index”, but rank even much lower for quality of life, which goes to show that this dimension cannot be considered as an indirect component of any urban policy agenda.
A number of studies have shown that the various determinants of quality of life generate complex interactions and diverse causal relations. Sometimes, efforts to promote one element can have unexpected detrimental effects on other elements; for example, prioritizing economic growth per se can result in negative environmental impacts. In other cases, positive linkages between these determinants are quite obvious; for instance, the provision of green open spaces brings health benefits to the population. In some other cases, the relationship can be less evident; for example, individual housing choices may have environmental impacts that affect quality of life in different ways.10 All too often, cities do not clearly perceive the complexity of these interactions and assume that interrelations will always be positive. Several cities in Asia and the Arab States that are experiencing high economic growth are mostly focusing on infrastructure
development in the pursuit of higher productivity and therefore higher incomes, assuming that this will lead to better quality of life in the long term. Generally, that is what happens, since economic growth increases purchasing power and demand for goods and services including education, entertainment, financial services and housing, which, in turn, not only create new
employment opportunities but also contribute to higher quality of life. But there may also be negative consequences.
However, UN-Habitat policy analysis shows that most surveyed cities in the developing world have no clear policies, actions and reliable procedures to deliver and expand quality of life to the whole population. With the exceptions of Singapore, Davao, Ho Chi Minh City and Chon Qing in Asia, Fort-de-France and Medellín in Latin America and the Caribbean, and Doha in the Arab States (whose commitment to quality of life was highly commended), experts took a critical view of the 42 other cities on that count. They found public administrations to be generally inefficient and with poor incentives to devise specific quality of life policies for lack of adequate financial resources, trained staff or political interest.
Positive exceptions can be found, such as Cebu, Singapore, Dubai, and Ho Chi Minh City, where, in the words of a local expert, “investing in human resources is
considered to be the best way of seizing more opportunities
and turning them into wealth and quality of life to make the
city more prosperous”.11 In Cebu, a local expert argues that “it is not only a matter of expanding the pie (i.e., economic
POLICy Cities that focus
only on economic development and provide services that are not public goods, may leave the urban poor, migrants, ethnic minorities and other vulnerable groups with serious difficulties to pay for the improved services, reducing the possibilities for them to enjoy quality of life.
FACT Social equity and quality of
life go hand in hand. In practice, though, any policies and actions aiming to expand societal well-being largely depend on the political will of governments and the degree of participation of civil society organizations and, in particular, their degree of autonomy when it comes to advocating, upholding and fighting for the rights of all.
FACT Experts in 60 per cent of surveyed cities in Africa and Arab States and slightly more than 40 per cent
of cities in Asia and Latin America believe that corruption and poor governance conspire against local prosperity and quality of life.
POLICy When a city focuses solely
on economic prosperity, it is very likely that the benefits and improvements in terms of quality of life may not be geared to the urban poor, particularly in those cities where corruption and poor governance are endemic.
State of the World’s Cities 2012/2013
62
development), but dividing the pie and ensuring that the poor benefit, too (i.e., equity and quality of life)”.12 Dubai, as other cities in the Arab Gulf, recognizes quality of life as
a key competitive advantage that contributes to promoting city productivity, attracting and retaining highly qualified individuals and prestigious firms and investors. Priority is given to those most easily perceived elements of quality of life such as parks, clean sidewalks, leisure, art and culture amenities as well as hospitals. Although not generalized to all the population, the pursuit of prosperity through quality of life is an interesting connection and entry point to development.
Quality of Life – the ‘Spokes’ and the ‘Hub’ of the Wheel of Urban Prosperity
Quality of life and productivity Productivity and quality of life are increasingly associated. Skilled workers and talented people will flock to, and concentrate in, liveable cities with high quality of life, and firms will follow suit. Consulting firms rank cities based on their ‘good living’ factors to make informed locational decisions. High human capital, which is a main ingredient of quality of life, attracts firms that cluster in cities to take advantage of common labour pools. Well-planned and designed urban environments, with pedestrian-friendly areas, bicycle paths, mix-land uses and sufficient public goods, attract people and businesses which, in turn, contribute to finance further social amenities and public goods. More and more city leaders are investing in education and the provision of ‘commons’ and public goods as part of a quality of life. Inversely, cities that do not invest in quality of life tend to feature poor public health, low education, limited mobility, and marginalization of the urban poor, all resulting in low productivity.
Quality of life and infrastructure development The prosperity of a city largely depends on infrastructure. Physical facilities like transportation, power and communications contribute to economic development, industrialization, trade and mobility of labour. Water supply, sanitation and sewerage, together with education and health facilities, have a direct impact on quality of life. All of these types of infrastructure connect people to people, goods to markets, workers to jobs, families to services, and the poor in rural areas to urban centres − a connectivity process that is essential to induce economic growth, reduce poverty and increase general well-being. More and more cities today are launching into ambitious initiatives to expand/improve infrastructure to sustain economic growth, prepare for population decline, address climate change issues and/or reduce slum incidence. Conversely, under-developed infrastructure makes life more difficult and more costly: poor facilities discourage industrial development, trade and investment and reduce competitiveness, besides generating air pollution, wasted time, fuel and safety costs, noise and more greenhouse gas emissions.
Quality of life and equityQuality of life and equity are constitutive of progress and development. No city can claim to be prosperous when large segments of its population are excluded or live in abject poverty, or when large sections of the population are deprived of basic goods or services while other sections live in affluence. Cities that look to more equity in the distribution of resources and opportunities, in law enforcement, in the rules and relationships that govern institutions and in access to public goods will be those where shared prosperity and quality of life are improved. More equitable cities enhance the prospects for people to take part in democratic processes and participate in a more decisive manner in cultural and political life. The benefits of social participation and political voice extend to other domains such as health, employment and the urban environment.
Quality of Life and Environmental SustainabilityEnvironmental conditions have an immediate impact on the quality of people’s lives. They affect human health both directly (air, water pollution, noise) and indirectly (climate change, biodiversity). Well-managed urban commons and public goods can improve environmental conditions and quality of life. Conversely, the pursuit of short-term quality of life objectives can be detrimental to the more long-term sustainability objectives that collectively affect the lives of the whole population. Indeed, individual short-term aspirations to quality of life, such as affordable, low-density housing, can act as major factors behind urban sprawl, which in turn is detrimental to the natural environment through higher use of land, energy and water, along with greenhouse gas emissions.
Quality of life and the ‘hub’ of the wheel of prosperityEffective institutions, more appropriate laws and regulations, proper urban planning and new value systems are essential power functions and can make sure that policies, actions and solutions involving any of the ‘spokes’ of prosperity can have positive effects on the others.
Sources: Glaeser, E. and Berry, C. (2005); Gidwani, V. and Baviskar, A. (2011); European Environment Agency (2009); Stiglitz Joseph, Sen Amartya, Fitoussi Jean-Paul (2009); UN-Habitat (2008/9); Jones, Harry (2009); Lalnunmawia H, (2010); AusAid (2009).
Box 2.3.1
POLICy Cities that are committed to quality of life are almost always committed to enhanced productivity and equity,
emphasizing the strong relation between these dimensions.
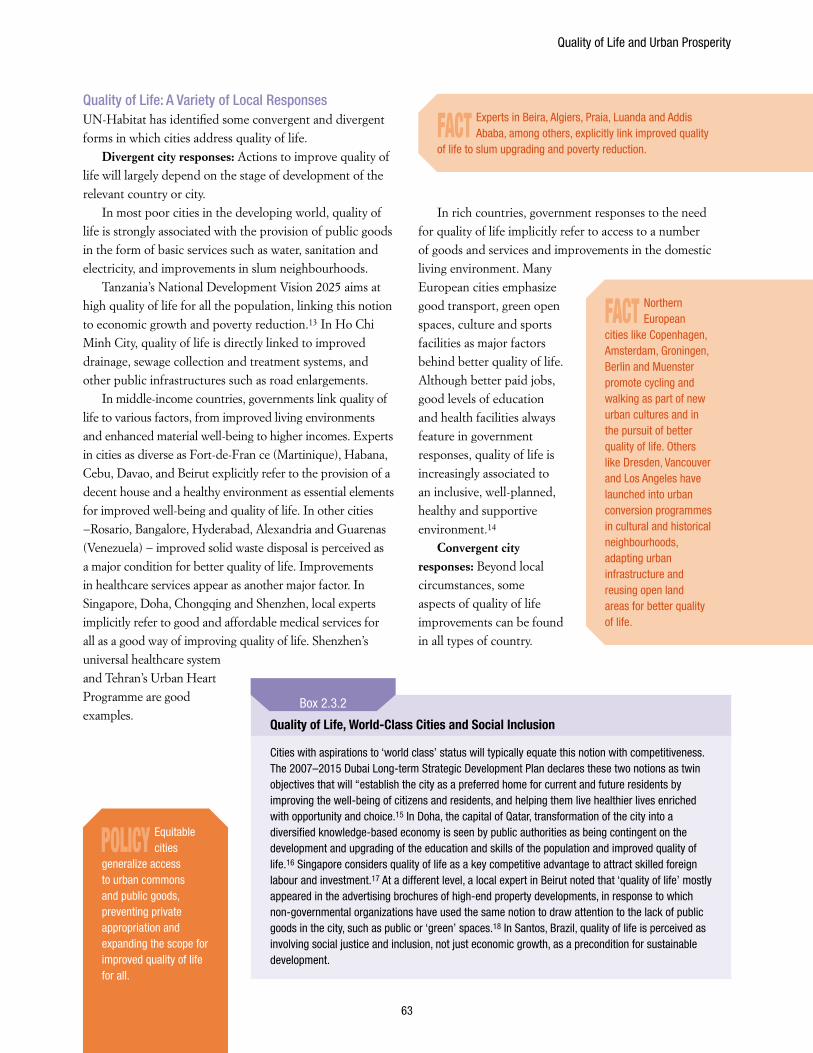
Quality of Life and Urban Prosperity
63
Quality of Life: A Variety of Local Responses UN-Habitat has identified some convergent and divergent forms in which cities address quality of life.
Divergent city responses: Actions to improve quality of life will largely depend on the stage of development of the relevant country or city.
In most poor cities in the developing world, quality of life is strongly associated with the provision of public goods in the form of basic services such as water, sanitation and electricity, and improvements in slum neighbourhoods.
Tanzania’s National Development Vision 2025 aims at high quality of life for all the population, linking this notion to economic growth and poverty reduction.13 In Ho Chi Minh City, quality of life is directly linked to improved drainage, sewage collection and treatment systems, and other public infrastructures such as road enlargements.
In middle-income countries, governments link quality of life to various factors, from improved living environments and enhanced material well-being to higher incomes. Experts in cities as diverse as Fort-de-Fran ce (Martinique), Habana, Cebu, Davao, and Beirut explicitly refer to the provision of a decent house and a healthy environment as essential elements for improved well-being and quality of life. In other cities −Rosario, Bangalore, Hyderabad, Alexandria and Guarenas (Venezuela) − improved solid waste disposal is perceived as a major condition for better quality of life. Improvements in healthcare services appear as another major factor. In Singapore, Doha, Chongqing and Shenzhen, local experts implicitly refer to good and affordable medical services for all as a good way of improving quality of life. Shenzhen’s universal healthcare system and Tehran’s Urban Heart Programme are good examples.
In rich countries, government responses to the need for quality of life implicitly refer to access to a number of goods and services and improvements in the domestic living environment. Many European cities emphasize good transport, green open spaces, culture and sports facilities as major factors behind better quality of life. Although better paid jobs, good levels of education and health facilities always feature in government responses, quality of life is increasingly associated to an inclusive, well-planned, healthy and supportive environment.14
Convergent city responses: Beyond local circumstances, some aspects of quality of life improvements can be found in all types of country.
Quality of Life, World-Class Cities and Social Inclusion
Cities with aspirations to ‘world class’ status will typically equate this notion with competitiveness. The 2007–2015 Dubai Long-term Strategic Development Plan declares these two notions as twin objectives that will “establish the city as a preferred home for current and future residents by improving the well-being of citizens and residents, and helping them live healthier lives enriched with opportunity and choice.15 In Doha, the capital of Qatar, transformation of the city into a diversified knowledge-based economy is seen by public authorities as being contingent on the development and upgrading of the education and skills of the population and improved quality of life.16 Singapore considers quality of life as a key competitive advantage to attract skilled foreign labour and investment.17 At a different level, a local expert in Beirut noted that ‘quality of life’ mostly appeared in the advertising brochures of high-end property developments, in response to which non-governmental organizations have used the same notion to draw attention to the lack of public goods in the city, such as public or ‘green’ spaces.18 In Santos, Brazil, quality of life is perceived as involving social justice and inclusion, not just economic growth, as a precondition for sustainable development.
Box 2.3.2
FACT Experts in Beira, Algiers, Praia, Luanda and Addis Ababa, among others, explicitly link improved quality
of life to slum upgrading and poverty reduction.
FACT Northern European
cities like Copenhagen, Amsterdam, Groningen, Berlin and Muenster promote cycling and walking as part of new urban cultures and in the pursuit of better quality of life. Others like Dresden, Vancouver and Los Angeles have launched into urban conversion programmes in cultural and historical neighbourhoods, adapting urban infrastructure and reusing open land areas for better quality of life.
POLICy Equitable cities
generalize access to urban commons and public goods, preventing private appropriation and expanding the scope for improved quality of life for all.
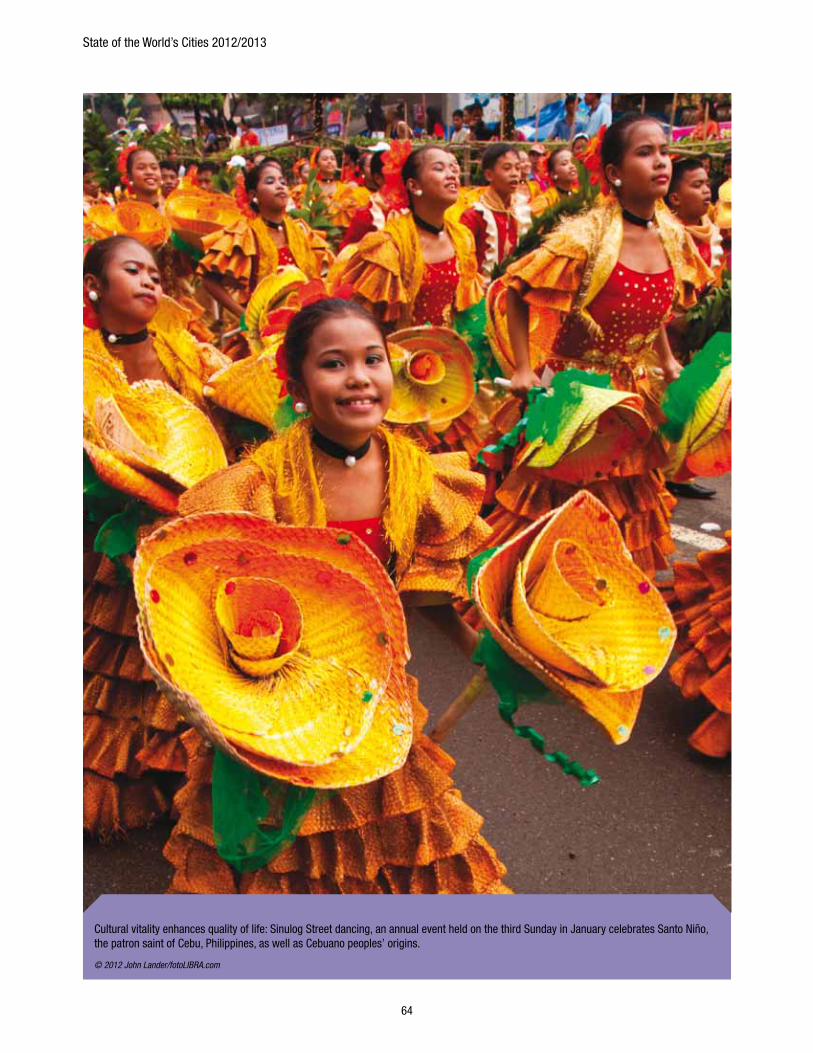
State of the World’s Cities 2012/2013
64
Cultural vitality enhances quality of life: Sinulog Street dancing, an annual event held on the third Sunday in January celebrates Santo Niño, the patron saint of Cebu, Philippines, as well as Cebuano peoples’ origins.
© 2012 John Lander/fotoLIBRA.com
Quality of Life and Urban Prosperity
65
UN-Habitat has identified various areas of intervention which governments with different political orientations and levels of development still consider as priority interventions: safety and security, efficient public transport, public spaces, healthcare and adequate housing, appear to be among the most important.
Public Safety and Quality of Life: A safe and secure life for all is an integral component of a prosperous city. As an expert in Nairobi states, “quality of life only makes sense when there is adequate security”.19 Experts in 52 cities in the developing world agreed that this is the most important factor contributing to a sense of empowerment and a feeling that one is part of a prosperous city. In Lima, for instance, a survey on quality of life conducted by a citizens’ observatory found that 73 per cent of the population considers urban insecurity as the main problem that conspires against quality of life and prosperity.20
A survey on “urban lifestyles” conducted in 2010 by Veolia Observatory in seven cities in both developing and developed nations found that in three of these cities (Chicago, London and São Paulo) insecurity appears as the most important problem, and in another (Paris) it features as the third most important.21
By itself, security may not bring prosperity to any city, but its absence is fatal. Economic inequity and/or instability nurtures high perceptions of crime and violence in various cities around the world, and inadequate urban planning law enforcement drives many high- and middle-class residents into gated communities and other guarded urban and suburban enclaves22, creating pockets of prosperity. This type of privilege remains unaffordable to those on low incomes, whose safety is often more at risk. Personal safety is seriously detrimental to freedom, mobility, productivity and public interactions, all of which are crucial to ensuring a high quality of life.
Crime and violence can hinder, and sometimes, paralyze regional and national economies. High rates of violence and insecurity in Kingston (Jamaica) and Nairobi (Kenya) have stultified the otherwise thriving tourist sectors in
these countries.23 Even though urban
insecurity is to large extent the result of extreme inequalities, it can also generate further social and spatial disparities that restrain access to employment, resources
and opportunities. Moreover, unsafe cities and perceptions of insecurity also lead to more fragmented, sprawled and car-dependent urban environments. The fear of crime and violence not only increases reliance on private automobiles through the proliferation of low-density, peri-urban gated communities, it also deters the public from using public transport.
Extensive provision of public goods such as parks, schools, basic services, sports facilities and community centres, particularly in more violent neighbourhoods, together with strong participation from local communities, has enabled Medellín to enhance safety through social cohesion.
Reviving the public space: In a large number of cities, provision, preservation and improvement of public spaces remains a neglected agenda. According to a local expert in Panama City, “in practice, the concept of public space does not exist”.24 In Cebu, an expert mentions that “public parks, playground areas and recreational facilities are grossly inadequate”.25 Another in Al-Muharrak (Bahrain) states that “the city has been losing green areas and today the proportion of gardens is small”.26 As many other public goods, ‘green’ and open areas tend to be enclosed, restricted, or depleted by unsustainable use. In Amman, city authorities have been converting public areas and parks into developments. In India, confessional groups erect temples in public parks; in Bangladesh developers construct housing in open public areas; in Nairobi, private interests occupy riparian lands.27
FACT In 19 cities out of the 52 surveyed by UN-Habitat, an overwhelming majority of experts (more than 80 per cent)
rated security to work and live freely as a major contributor to prosperity. In cities like Praia, Cebu, Algiers, Chongqing, Singapore, La Paz and Amman, nearly all experts rated security as ‘contributing’ or ‘highly contributing’ to prosperity.
POLICy Effective public
safety is a fundamental ‘common good’ that enhances quality of life for all, and is a major foundation of urban prosperity.
FACT Nearly one-third of local experts in
Latin America, 25 per cent in African cities and more than 10 per cent in Asia and the Arab States said lack of public security was not properly addressed in their respective cities.
FACT Many public spaces are residual urban
areas that are exposed to speculation for private profit. In other cities, public spaces remain concentrated in the affluent areas.
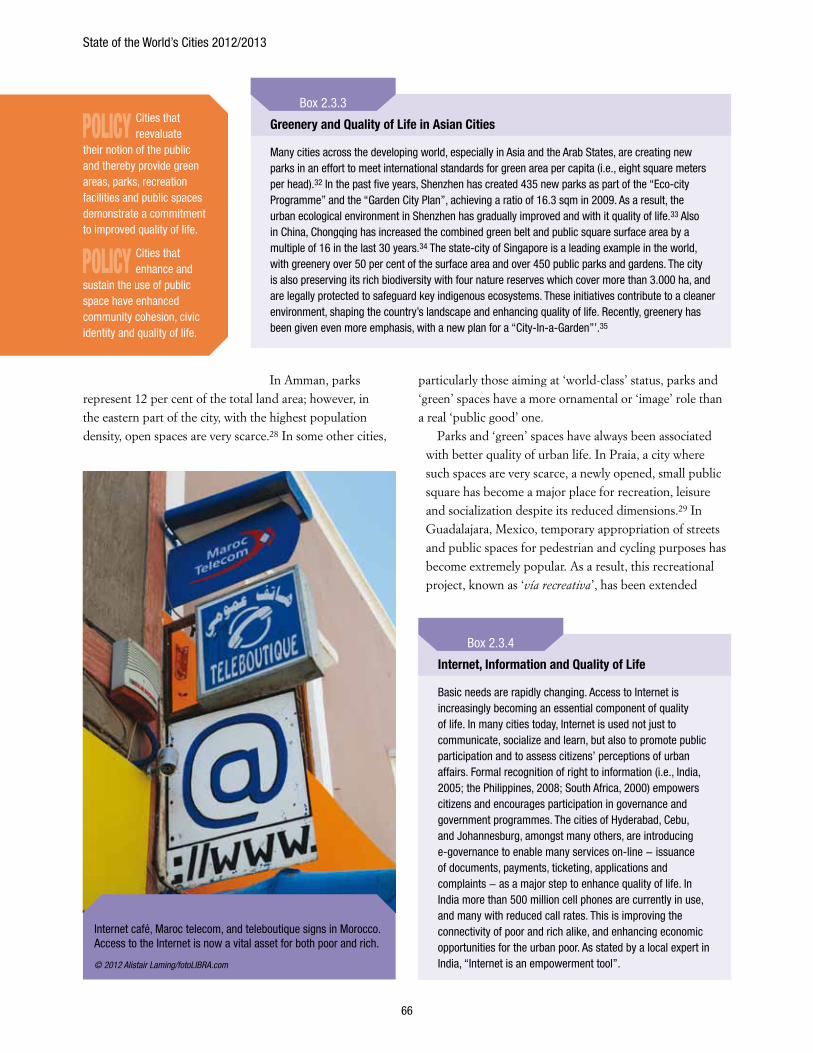
State of the World’s Cities 2012/2013
66
In Amman, parks represent 12 per cent of the total land area; however, in the eastern part of the city, with the highest population density, open spaces are very scarce.28 In some other cities,
particularly those aiming at ‘world-class’ status, parks and ‘green’ spaces have a more ornamental or ‘image’ role than a real ‘public good’ one.
Parks and ‘green’ spaces have always been associated with better quality of urban life. In Praia, a city where such spaces are very scarce, a newly opened, small public square has become a major place for recreation, leisure and socialization despite its reduced dimensions.29 In Guadalajara, Mexico, temporary appropriation of streets and public spaces for pedestrian and cycling purposes has become extremely popular. As a result, this recreational project, known as ‘vía recreativa’, has been extended
Internet, Information and Quality of Life
Basic needs are rapidly changing. Access to Internet is increasingly becoming an essential component of quality of life. In many cities today, Internet is used not just to communicate, socialize and learn, but also to promote public participation and to assess citizens’ perceptions of urban affairs. Formal recognition of right to information (i.e., India, 2005; the Philippines, 2008; South Africa, 2000) empowers citizens and encourages participation in governance and government programmes. The cities of Hyderabad, Cebu, and Johannesburg, amongst many others, are introducing e-governance to enable many services on-line − issuance of documents, payments, ticketing, applications and complaints − as a major step to enhance quality of life. In India more than 500 million cell phones are currently in use, and many with reduced call rates. This is improving the connectivity of poor and rich alike, and enhancing economic opportunities for the urban poor. As stated by a local expert in India, “Internet is an empowerment tool”.
Box 2.3.4
Greenery and Quality of Life in Asian Cities
Many cities across the developing world, especially in Asia and the Arab States, are creating new parks in an effort to meet international standards for green area per capita (i.e., eight square meters per head).32 In the past five years, Shenzhen has created 435 new parks as part of the “Eco-city Programme” and the “Garden City Plan”, achieving a ratio of 16.3 sqm in 2009. As a result, the urban ecological environment in Shenzhen has gradually improved and with it quality of life.33 Also in China, Chongqing has increased the combined green belt and public square surface area by a multiple of 16 in the last 30 years.34 The state-city of Singapore is a leading example in the world, with greenery over 50 per cent of the surface area and over 450 public parks and gardens. The city is also preserving its rich biodiversity with four nature reserves which cover more than 3.000 ha, and are legally protected to safeguard key indigenous ecosystems. These initiatives contribute to a cleaner environment, shaping the country’s landscape and enhancing quality of life. Recently, greenery has been given even more emphasis, with a new plan for a “City-In-a-Garden”’.35
Box 2.3.3
POLICy Cities that reevaluate
their notion of the public and thereby provide green areas, parks, recreation facilities and public spaces demonstrate a commitment to improved quality of life.
POLICy Cities that enhance and
sustain the use of public space have enhanced community cohesion, civic identity and quality of life.
Internet café, Maroc telecom, and teleboutique signs in Morocco. Access to the Internet is now a vital asset for both poor and rich.
© 2012 Alistair Laming/fotoLIBRA.com
Quality of Life and Urban Prosperity
67
from 3.4 km to over 25 km and across four municipal jurisdictions. At national level, the Mexican government has launched an ambitious programme to recover public spaces in a bid to improve quality of life and enhance public security, particularly in marginalized neighbourhoods in various cities.30 In Cuba, as part of a ‘non-discriminatory enjoyment of public spaces’ policy, several cultural programmes have been made free or affordable for all, with plazas, avenues and even vacant lots featuring various events that enhance quality of life.31
In Europe, public greens which take the form of corner lots, small community parks, street greens, linear parks,
and river banks as well as large city parks, are designed for specific types of activity. The liveliness and continuous use of public space as a public good leads, in turn, to urban environments that are well-maintained and safe, making the city an attractive place to live and work in.36
Endnotes
1 Stiglitz, J.E., A. Sen, and J-P. Fitoussi (2009) Report by the Commission on the Measurement of Economic Performance and Social Progress, The Commission, Paris, http://www.stiglitz-sen-fitoussi.fr/en/index.htm
2 Stiglitz, J.E., A. Sen, and J-P. Fitoussi (2009) op. cit.
3 Andrulis ,D.P., H.M. Reid, L. M. Duchon (2004), Quality of Life in the Nation’s 100 Largest Cities and Their Suburbs: New and Continuing Challenges for Improving Health and Well-Being, The Social and Health Landscape of Urban and Suburban America Report Series, USA.
4 Stiglitz, J.E., A. Sen, and J-P. Fitoussi (2009) op. cit.
5 www.worldvaluessurvey.org
6 European Environment Agency (2009), Ensuring quality of life in Europe’s cities and towns: Tackling the environmental challenges driven by European and global change, EEA Report 5/2009,Office for Official Publications of the European Communities, Luxembourg
7 http://www.mercer.com/articles/quality-of-living-survey-report-2011; Also targeting business, the Economist Intelligence Unit designed a Quality of Life Index using nine factors: material well-being, health, political stability and security, family life, community life, gender equality, political freedom, climate and geography, and job security, Refer to http://www.economist.com/media/pdf/QUALITY_OF_LIFE.pdf
8 European Environment Agency (2009) op. cit.
9 Bodin-Buyle Z., and C. Hermant-De Callataÿ (2011), Urban Prosperity and Quality of Life in European cities – Beyond GDP, European Union, Brussels, prepared for UN-Habitat as part of EU – UN-Habitat collaboration.
10 European Environment Agency (2009) op. cit.
11 Dzung, D. D. (2011) City Report on Ho Chi Minh City, Unpublished UN-Habitat background study for “State of the World’s Cities Report 2012/2013”
12 Fernandez, F.L. (2011) City Report on Cebu, Unpublished UN-Habitat background study for “State of the World’s Cities Report 2012/2013”
13 Lupala, A. (2011) City Report on Dar es Salaam, Unpublished UN-Habitat background study for “State of the World’s Cities Report 2012/2013”
14 European Environment Agency (2009) op. cit.
15 Al-Bassam, D. and J. Mouris (2011) City Report on Dubai, Unpublished UN-Habitat background study for “State of the World’s Cities Report 2012/2013”
16 Mena, A. (2011) City Report on Doha, Unpublished UN-Habitat background study for “State of the World’s Cities Report 2012/2013”
17 Centre for Livable Cities (2011) City Report on Singapore, Unpublished UN-Habitat background study for “State of the World’s Cities Report 2012/2013”
18 Fawaz, M. and N. Baghdadi (2011) City Report on Beirut, Unpublished UN-Habitat background study for “State of the World’s Cities Report 2012/2013”
19 Omenya, A. (2011) City Report on Nairobi, Unpublished UN-Habitat background study for “State of the World’s Cities Report 2012/2013”
20 Lima Como Vamos (2010) Lima Según sus Ciudadanos, Observatorio Ciudadano, Informe de Percepción sobre la Calidad de Vida, Lima.
21 Veolia Environment (2010), Villes à Vivre 2010, Observatoire Veolia de Modes de Vie Urbains, Paris.
22 Davis, D. (2007) “Urban Violence, Quality of Life, and the Future of Latin American Cities,” in Allison M. Garland,A.M, M. Massoumi and B. A. Ruble (Eds) Global Urban Poverty: Setting the Agenda. Woodrow Wilson International Center for Scholars, Comparative Urban Studies Project, Washington D.C, pp. 57-87.
23 UN-Habitat (2007) Enhancing urban safety and security: Global report on human settlements 2007, Earthscan, London
24 Mendoza, I. R. (2011) City Report on Panama City, Unpublished UN-Habitat background study for “State of the World’s Cities Report 2012/2013”
25 Fernandez, F.L. (2011) op. cit.
26 Al- Kubaisy, F. (2011) City Report on Al-Muharrak, Unpublished UN-Habitat background study for “State of the World’s Cities Report 2012/2013”
27 UN-Habitat (2010), Bridging the Urban Divide, State of the World’s Cities Report 2010/2011, Earthscan, London
28 Shabou, A., N. Soboh, K. Jalouka, and D. A. Thaib (2011) City Report on Amman, Unpublished UN-Habitat background study for “State of the World’s Cities Report 2012/2013”
29 Fernandez, C. (2011) City Report on Cape Verde, Unpublished UN-Habitat background study for “State of the World’s Cities Report 2012/2013”
30 SEDESOL (2007). Guia de Diseno del Espacio Publico Seguro, Incluente y Sustentable. Secretaria de Desarrollo Social, México
31 Coyula, M. (2011) City Report on Havana, Unpublished UN-Habitat background study for “State of the World’s Cities Report 2012/2013”
32 The agreed international ratio is 8 square meters per capita. For instance, Lima, the capital of Peru, has around 3 square meters, the Mexican border city of Tijuana has around one or two, and Al-Muharrak in Bahrain has less than 1 square meters.
33 Jin, L. and Y. Liu (2011) City Report on Shenzhen, Unpublished UN-Habitat background study for “State of the World’s Cities Report 2012/2013”
34 Liu, Y. and Y. Wang (2011) City Report on Chongqing, Unpublished UN-Habitat background study for “State of the World’s Cities Report 2012/2013”
35 Centre for Livable Cities (2011) op. cit.
36 Shehayeb, D. (2008) ‘Safety and Security in Public Space’ in International Report on Crime Prevention and Community Safety: Trends and Perspectives, ICPC, Montreal, pp. 107-112
37 Castellanos, G. (2011) City Report on Santo Domingo, Unpublished UN-Habitat background study for “State of the World’s Cities Report 2012/2013”
POLICy “Having access to
public spaces does not only improve quality of life, it is a first step to civic empowerment on the way to further institutional and political spaces”.37
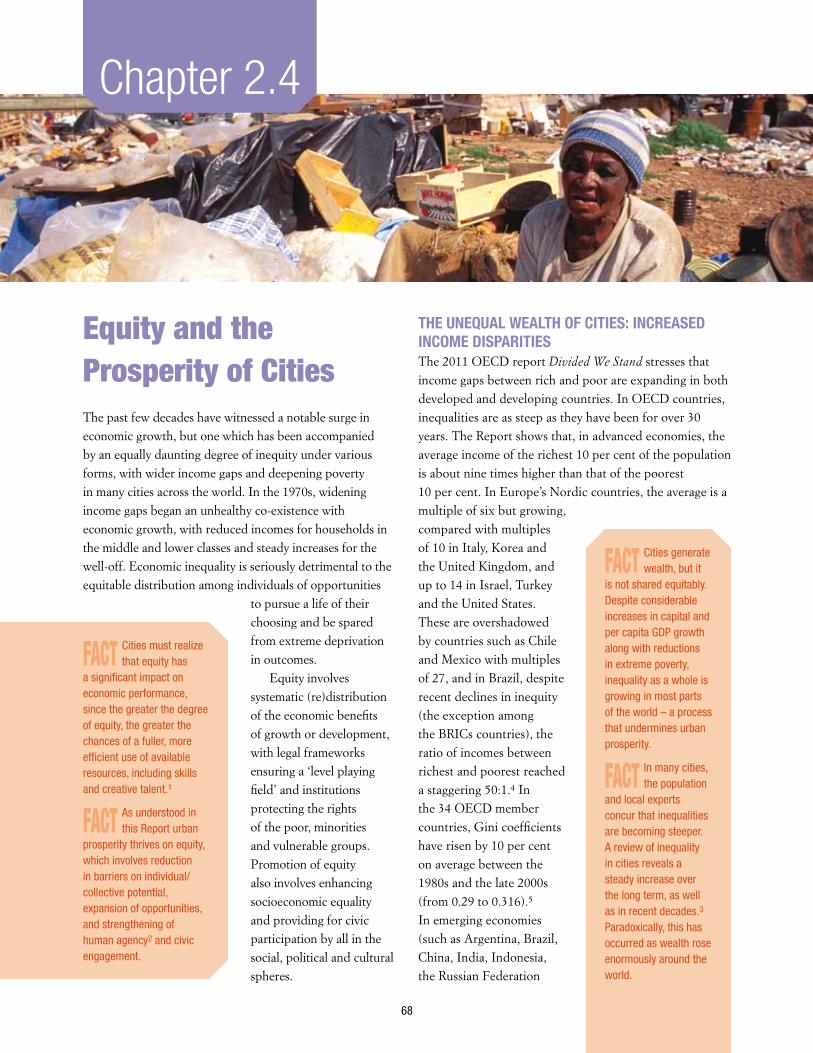
68
Equity and the Prosperity of CitiesThe past few decades have witnessed a notable surge in economic growth, but one which has been accompanied by an equally daunting degree of inequity under various forms, with wider income gaps and deepening poverty in many cities across the world. In the 1970s, widening income gaps began an unhealthy co-existence with economic growth, with reduced incomes for households in the middle and lower classes and steady increases for the well-off. Economic inequality is seriously detrimental to the equitable distribution among individuals of opportunities
to pursue a life of their choosing and be spared from extreme deprivation in outcomes.
Equity involves systematic (re)distribution of the economic benefits of growth or development, with legal frameworks ensuring a ‘level playing field’ and institutions protecting the rights of the poor, minorities and vulnerable groups. Promotion of equity also involves enhancing socioeconomic equality and providing for civic participation by all in the social, political and cultural spheres.
THE UNEQUAL WEALTH OF CITIES: INCREASED INCOME DISPARITIES The 2011 OECD report Divided We Stand stresses that income gaps between rich and poor are expanding in both developed and developing countries. In OECD countries, inequalities are as steep as they have been for over 30 years. The Report shows that, in advanced economies, the average income of the richest 10 per cent of the population is about nine times higher than that of the poorest 10 per cent. In Europe’s Nordic countries, the average is a multiple of six but growing, compared with multiples of 10 in Italy, Korea and the United Kingdom, and up to 14 in Israel, Turkey and the United States. These are overshadowed by countries such as Chile and Mexico with multiples of 27, and in Brazil, despite recent declines in inequity (the exception among the BRICs countries), the ratio of incomes between richest and poorest reached a staggering 50:1.4 In the 34 OECD member countries, Gini coefficients have risen by 10 per cent on average between the 1980s and the late 2000s (from 0.29 to 0.316).5 In emerging economies (such as Argentina, Brazil, China, India, Indonesia, the Russian Federation
Chapter 2.4
FACT Cities must realize that equity has
a significant impact on economic performance, since the greater the degree of equity, the greater the chances of a fuller, more efficient use of available resources, including skills and creative talent.1
FACT As understood in this Report urban
prosperity thrives on equity, which involves reduction in barriers on individual/collective potential, expansion of opportunities, and strengthening of human agency2 and civic engagement.
FACT Cities generate wealth, but it
is not shared equitably. Despite considerable increases in capital and per capita GDP growth along with reductions in extreme poverty, inequality as a whole is growing in most parts of the world – a process that undermines urban prosperity.
FACT In many cities, the population
and local experts concur that inequalities are becoming steeper. A review of inequality in cities reveals a steady increase over the long term, as well as in recent decades.3 Paradoxically, this has occurred as wealth rose enormously around the world.
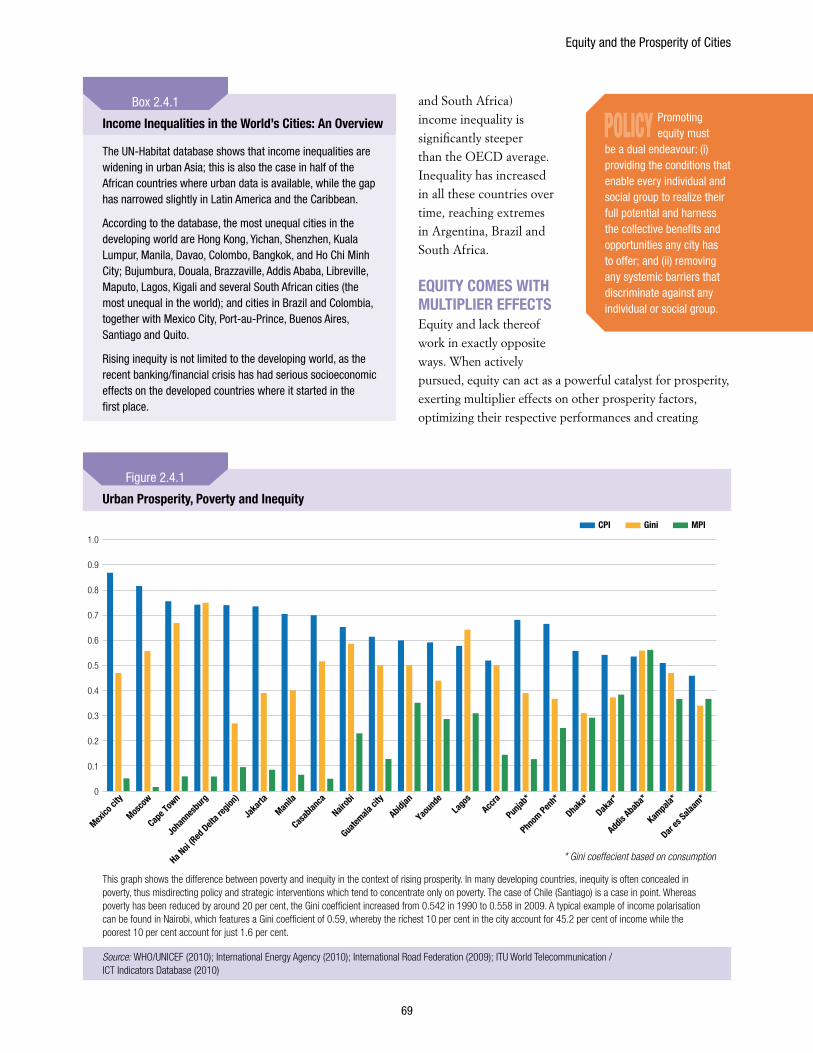
Equity and the Prosperity of Cities
69
and South Africa) income inequality is significantly steeper than the OECD average. Inequality has increased in all these countries over time, reaching extremes in Argentina, Brazil and South Africa.
EQUITy COMES WITH MULTIPLIER EFFECTSEquity and lack thereof work in exactly opposite ways. When actively pursued, equity can act as a powerful catalyst for prosperity, exerting multiplier effects on other prosperity factors, optimizing their respective performances and creating
Income Inequalities in the World’s Cities: An Overview
The UN-Habitat database shows that income inequalities are widening in urban Asia; this is also the case in half of the African countries where urban data is available, while the gap has narrowed slightly in Latin America and the Caribbean.
According to the database, the most unequal cities in the developing world are Hong Kong, Yichan, Shenzhen, Kuala Lumpur, Manila, Davao, Colombo, Bangkok, and Ho Chi Minh City; Bujumbura, Douala, Brazzaville, Addis Ababa, Libreville, Maputo, Lagos, Kigali and several South African cities (the most unequal in the world); and cities in Brazil and Colombia, together with Mexico City, Port-au-Prince, Buenos Aires, Santiago and Quito.
Rising inequity is not limited to the developing world, as the recent banking/financial crisis has had serious socioeconomic effects on the developed countries where it started in the first place.
Box 2.4.1
Urban Prosperity, Poverty and Inequity
1.0
0.9
0.5
0.7
0.8
0.6
0.4
0.3
0.2
0.1
0
CPI Gini MPI
Mosco
w
Mexico
city
Cape T
own
Joha
nnes
burg
Jaka
rta
Ha Noi
(Red
Delta r
egion
)
Manila
Casab
lanca
Nairob
i
Guatem
ala ci
ty
Abidjan
Yaoun
deLa
gos
Accra
Punjab
*
Phnom
Penh*
Dhaka
*
Dakar*
Addis
Ababa
*
Kampa
la*
Dar es
Salaam
*
This graph shows the difference between poverty and inequity in the context of rising prosperity. In many developing countries, inequity is often concealed in poverty, thus misdirecting policy and strategic interventions which tend to concentrate only on poverty. The case of Chile (Santiago) is a case in point. Whereas poverty has been reduced by around 20 per cent, the Gini coefficient increased from 0.542 in 1990 to 0.558 in 2009. A typical example of income polarisation can be found in Nairobi, which features a Gini coefficient of 0.59, whereby the richest 10 per cent in the city account for 45.2 per cent of income while the poorest 10 per cent account for just 1.6 per cent.
Source: WHO/UNICEF (2010); International Energy Agency (2010); International Road Federation (2009); ITU World Telecommunication / ICT Indicators Database (2010)
Figure 2.4.1
POLICy Promoting equity must
be a dual endeavour: (i) providing the conditions that enable every individual and social group to realize their full potential and harness the collective benefits and opportunities any city has to offer; and (ii) removing any systemic barriers that discriminate against any individual or social group.
* Gini coeffecient based on consumption
State of the World’s Cities 2012/2013
70
linkages among them. Its absence will will have the reverse effect, compounding any existing biases, or dysfunctions already hindering prosperity.
Undoubtedly, some cities have demonstrated a capacity to stimulate growth and prosperity even in the absence of equity. However,
as has become amply evident in the past three decades, such prosperity, coupled with uneven distribution, remains narrowly confined and is unsustainable. Conversely, cities that have built equity into their local development strategies are better placed for enhanced prosperity.
Equity reduces alienation and exclusion, paving the way for empowerment and engagement of all social groups, and for the realization of the full potential of the entire population. Indeed, cities that have removed impediments to the full engagement of women, youths and even the
elderly have invariably enhanced overall prosperity. Equity is not simply a normative concern, related to
issues of fairness and justice, important as these may be. It is a material factor which directly impinges on the process of social and material sustenance. In fact, through removal of ‘unfreedoms’, and with the attendant broadening of choices and opportunities, equity enhances the city’s transformative capacity while also promoting identity and agency among the population.
The social process that comes with the opportunities made available to all through public goods like quality education and skills, enables the population to remain engaged and to stake a claim on the city. In this respect, the way a city shapes, and is in turn shaped by, its population, will largely depend on whether urban systems provide all residents with equal opportunities for development and the ability to exert agency.
Inequity is inefficient from an economic perspective. As stressed by Sen, “the primitiveness of social developments (such as widespread illiteracy, malnutrition, lack of health facilities and medical networks) is a barrier to the full realisation of the benefits of participatory growth and
POLICy When equity is embedded
in urban development strategies, efficiency is enhanced, asset utilization becomes optimal, productivity improves, social cohesion is strengthened, and both sustainability and resilience are enhanced.
Spatial divisions exacerbate inequality
Spatial inequalities are not only a forerunner of social and economic divisions; these in turn cause further inequalities and different forms of exclusion and marginalization. In Jordan’s capital, for instance, 97 per cent of households in Western Amman have computers while in Eastern Amman the proportion is no more than eight per cent. Not surprisingly, in Western Amman more than 50 per cent of males and 20 per cent of females earn more than USD1,400 monthly, compared with only two per cent for males and less than one per cent for females in Eastern Amman.7
The urban divide appears to widen with higher degrees of economic prosperity; at least this is the perception of populations and local experts. In Bangalore, where specialisation in computer technologies has brought a fair amount of economic prosperity, a local expert remarked that “while quality of life is comfortable for ‘elite Bangalore’, it is not so for the ‘other Bangalore’ which comprises the majority of the population”.8 In São Paulo, even as municipal authorities strive to integrate favelas, informal settlements and rehabilitated urban neighbourhoods into a more inclusive city, wealthy Paulistanos resist the process and gravitate to more exclusive enclaves. The result is what has been dubbed a ‘city of walls’ where any visible prosperity appears to be largely monopolised by the wealthy. In Lusaka, a local expert reports
that ”increasing degrees of exclusion are reappearing in the city, especially with the new infrastructure under development. Segregation along racial lines is re-emerging.”9 In Dubai, as in some other Gulf cities, the gap between nationals and non-nationals (access to schooling, public hospitals, health insurance, adequate and affordable housing, labour grievances and rights) is unequal in the extreme.
Research shows that when combined, the physical and social divisions between rich and poor neighbourhoods can generate further exclusion and marginalization, especially when the poor are confined to farther neighbourhoods with inadequate accessibility. The underprivileged people living in these ‘lost’ areas suffer from a triple jeopardy: long distances, high transport costs and excessive commuting times. This turns into a genuine “spatial poverty trap” that conspires against shared prosperity through restrictions on jobs, compounding gender differences, limiting social interactions and reducing social capital, increasing the likelihood of crime and violence, with worsening living standards as a result.10 The spatial inequalities so visible in so many cities are also the outcome of broader and deeply entrenched processes of unplanned urban development, poor governance and institutionalized exclusion and marginalisation of specific groups.
Box 2.4.2
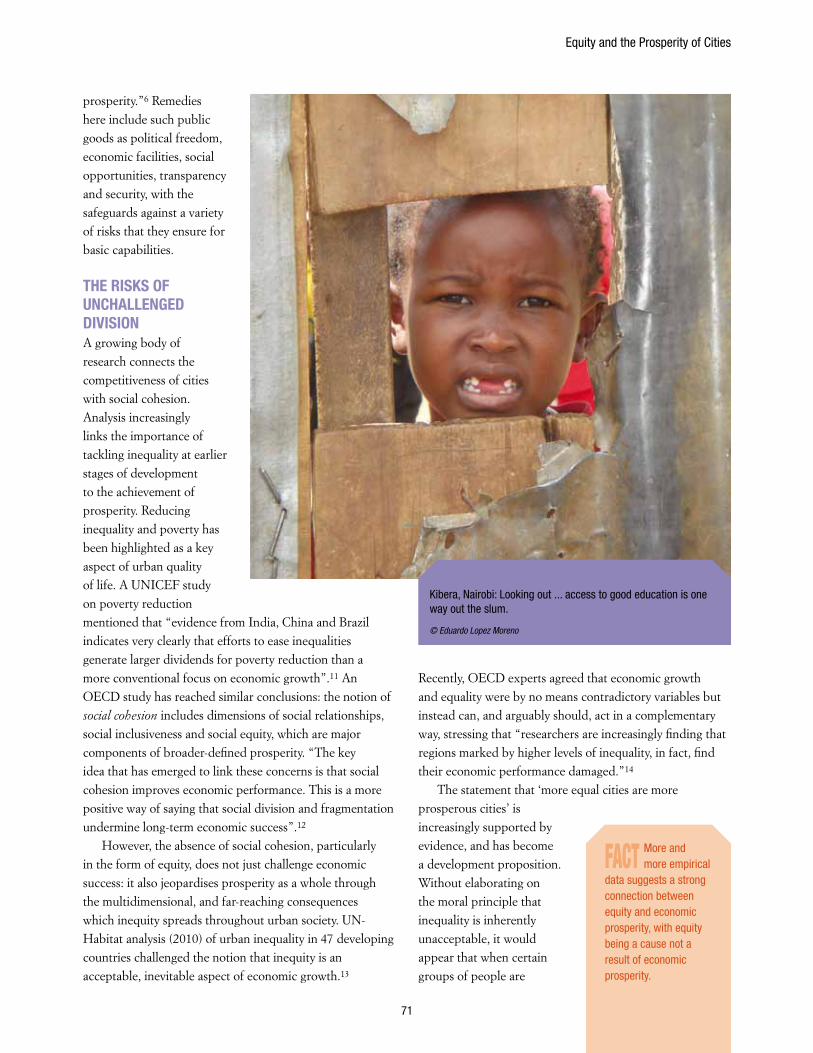
Equity and the Prosperity of Cities
71
prosperity.”6 Remedies here include such public goods as political freedom, economic facilities, social opportunities, transparency and security, with the safeguards against a variety of risks that they ensure for basic capabilities.
THE RISkS OF UNCHALLENGED DIvISIONA growing body of research connects the competitiveness of cities with social cohesion. Analysis increasingly links the importance of tackling inequality at earlier stages of development to the achievement of prosperity. Reducing inequality and poverty has been highlighted as a key aspect of urban quality of life. A UNICEF study on poverty reduction mentioned that “evidence from India, China and Brazil indicates very clearly that efforts to ease inequalities generate larger dividends for poverty reduction than a more conventional focus on economic growth”.11 An OECD study has reached similar conclusions: the notion of social cohesion includes dimensions of social relationships, social inclusiveness and social equity, which are major components of broader-defined prosperity. “The key idea that has emerged to link these concerns is that social cohesion improves economic performance. This is a more positive way of saying that social division and fragmentation undermine long-term economic success”.12
However, the absence of social cohesion, particularly in the form of equity, does not just challenge economic success: it also jeopardises prosperity as a whole through the multidimensional, and far-reaching consequences which inequity spreads throughout urban society. UN-Habitat analysis (2010) of urban inequality in 47 developing countries challenged the notion that inequity is an acceptable, inevitable aspect of economic growth.13
Recently, OECD experts agreed that economic growth and equality were by no means contradictory variables but instead can, and arguably should, act in a complementary way, stressing that “researchers are increasingly finding that regions marked by higher levels of inequality, in fact, find their economic performance damaged.”14
The statement that ‘more equal cities are more prosperous cities’ is increasingly supported by evidence, and has become a development proposition. Without elaborating on the moral principle that inequality is inherently unacceptable, it would appear that when certain groups of people are
Kibera, Nairobi: Looking out ... access to good education is one way out the slum.
© Eduardo Lopez Moreno
FACT More and more empirical
data suggests a strong connection between equity and economic prosperity, with equity being a cause not a result of economic prosperity.
State of the World’s Cities 2012/2013
72
repeatedly and disproportionately refrained from taking their fair, full share of the multidimensional benefits of the ‘urban advantage’, the above statement comes with two interconnected corollaries. First, inequality can be linked to poor economic productivity, and experience shows that more sustainable urban economies are frequently associated with lower inequality. Second, persistent, ever-higher inequality carries direct risks. Stark disparities within cities have proven to be social detonators, as recent revolutions in the Arab world and social unrest in some cities in the developed world have recently demonstrated.
Take a city anywhere in the world that can boast sustained economic growth thanks to high productivity, adequate infrastructure, a high quality of life and environmental preservation: the more this prosperity is inequitably distributed, the more precarious it is bound to be. All five ‘spokes’ in the ‘prosperity wheel’ must be developed in a well-balanced way for a smoother ride on the path of sustainable, shared prosperity.
The recent society-wide upheavals in Tunisia, Libya and Egypt did not occur against a background of extreme poverty or deprivation. In all three countries, national poverty reduction programmes had gained considerable traction. Slum improvement or eradication had been achieved or was on-going. Large infrastructure projects with adequate transport networks had been deployed or were underway and, in terms of education and health, achievements were approaching or surpassing national Millennium Development Goals. Still, Egypt, Libya and Tunisia were shown to have feet of clay. The sobering
message from the Arab Spring, though still in a state of flux, is that leaders and societies ignore inequality at their own peril.
A recent report on the East African Community has highlighted a number of remarkable achievements in terms of economic growth over the past decade, propelled by massive
increases in trade based on new, all-weather roads and uptake of mobile telephone technology. Still, the actual number of East Africans living below the poverty line has increased from 44 million to 53 million, and income inequality indicators, as measured by Gini coefficients, have also worsened in most countries.15 As a regional expert put it, ”The reason for this is that inequality is both deepening and widening. Fewer people are enjoying the benefits of economic growth.”16
Inequality and criminality appear to be part and parcel of the same equation. This is all the more so when lack of opportunities and rising unemployment are added to the balance. Perceptions of rising criminality, and the fears thereof, may be strong in cities characterised by high inequity, and even stronger than actual numbers actually state. In one poll, comparing perceptions and expert opinion in São Paulo and London, criminality emerged as a major concern in both cities, even though actual numbers in São Paulo were a multiple of London’s.17 In the same survey, residents of cities as diverse as Mumbai, Chicago, Cairo, London, Paris, Beijing and São Paulo overwhelmingly agreed (89 per cent) that “a non-dangerous city” was their prime criterion for the ‘good urban life’, a notion that has much to do with prosperity.
LINkING EQUITy TO PROSPERITy“Inequalities are increasing day after day”, according to a local expert in Hyderabad. This comment echoes findings from the United Nations General Assembly 2011 Report on Progress towards Millennium Development Goals (MDGs), which stressed that “despite advances towards achieving the MDGs, insufficient emphasis in the MDG agenda had been given to the issue of inequity which is increasing within and between countries.”18 Even in those countries that have made progress towards the MDGs, inequalities have grown. Therefore, as suggested by the UN General Assembly, equity must be mainstreamed in the development agenda, based on more inclusive growth.
Evidence showing that equity is a critical dimension of prosperity runs against the conventional development approaches that prevailed before the 2008–09 global financial crisis. A particular case in point is the ‘Washington Consensus’, which reinforced the notion that
POLICy If left unaddressed, socioeconomic fragmentation can jeopardise urban prosperity and pose major risks to
nationwide political stability.
POLICy When prosperity remains an
elusive proposition for a majority of the population, the prospects of social unrest or full-blown conflicts increase, since the majority’s claims are nothing but demands for effective human dignity.
POLICy Cities must pay more
attention to inequity as a critical factor affecting prosperity. Deliberate and conscious policies now need to emphasise the importance of equity in urban decision-making.
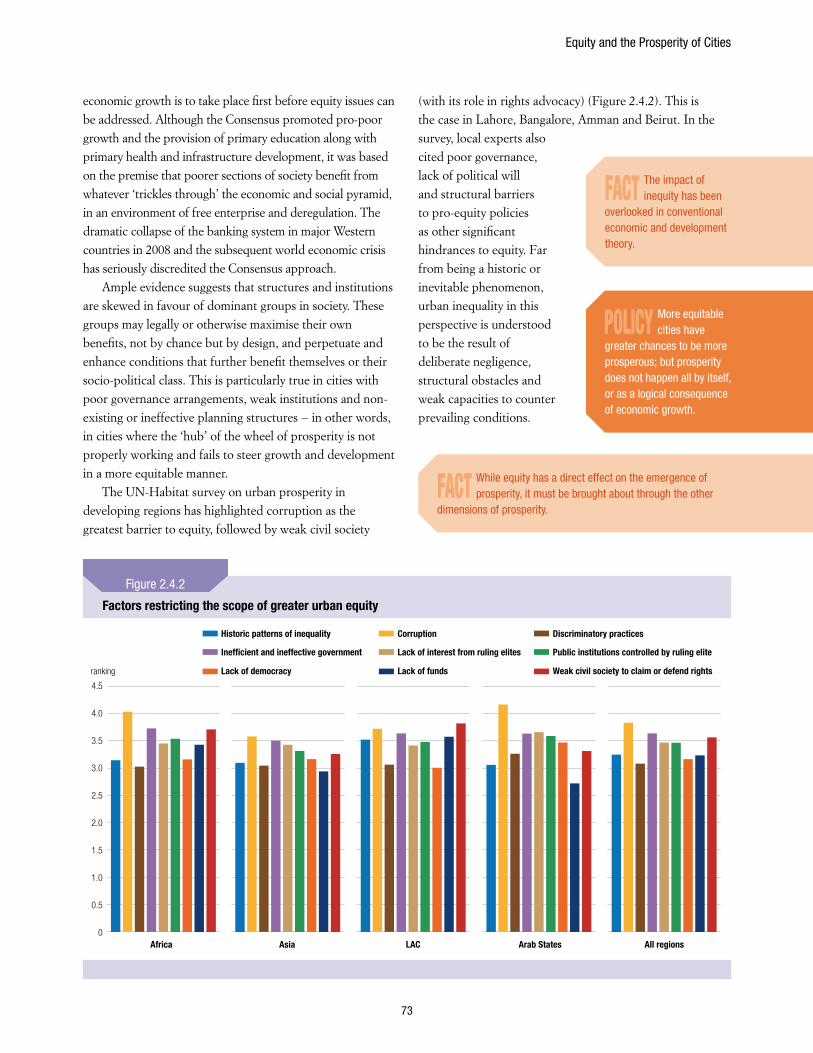
Equity and the Prosperity of Cities
73
economic growth is to take place first before equity issues can be addressed. Although the Consensus promoted pro-poor growth and the provision of primary education along with primary health and infrastructure development, it was based on the premise that poorer sections of society benefit from whatever ‘trickles through’ the economic and social pyramid, in an environment of free enterprise and deregulation. The dramatic collapse of the banking system in major Western countries in 2008 and the subsequent world economic crisis has seriously discredited the Consensus approach.
Ample evidence suggests that structures and institutions are skewed in favour of dominant groups in society. These groups may legally or otherwise maximise their own benefits, not by chance but by design, and perpetuate and enhance conditions that further benefit themselves or their socio-political class. This is particularly true in cities with poor governance arrangements, weak institutions and non-existing or ineffective planning structures − in other words, in cities where the ‘hub’ of the wheel of prosperity is not properly working and fails to steer growth and development in a more equitable manner.
The UN-Habitat survey on urban prosperity in developing regions has highlighted corruption as the greatest barrier to equity, followed by weak civil society
(with its role in rights advocacy) (Figure 2.4.2). This is the case in Lahore, Bangalore, Amman and Beirut. In the survey, local experts also cited poor governance, lack of political will and structural barriers to pro-equity policies as other significant hindrances to equity. Far from being a historic or inevitable phenomenon, urban inequality in this perspective is understood to be the result of deliberate negligence, structural obstacles and weak capacities to counter prevailing conditions.
Factors restricting the scope of greater urban equity
4.5
3.5
4.0
1.5
0.5
2.5
3.0
2.0
1.0
0
Inef�cient and ineffective government
Lack of democracy
Lack of interest from ruling elites
Lack of funds
Public institutions controlled by ruling elite
Weak civil society to claim or defend rights
Historic patterns of inequality Corruption Discriminatory practices
Africa Asia LAC Arab States All regions
ranking
Figure 2.4.2
FACT The impact of inequity has been
overlooked in conventional economic and development theory.
FACT While equity has a direct effect on the emergence of prosperity, it must be brought about through the other
dimensions of prosperity.
POLICy More equitable cities have
greater chances to be more prosperous; but prosperity does not happen all by itself, or as a logical consequence of economic growth.
State of the World’s Cities 2012/2013
74
FOSTERING SOCIAL INCLUSION Unequal income and unequal opportunities are the two main underlying factors of urban inequity. They derive from biases in distribution at national level as well as dysfunctions at the local urban level. In this sense, inequity reveals a differentiation in the manner in which resources are allocated and facilities and services accessed. The main driver of inequity often tends to be differential access to employment as well as to public goods and services. Inequity in this respect reflects biases in the economic realm which effectively concentrate a disproportionate share of resources, services and opportunities in the hands of certain groups or individuals. A common response is the consolidation of redistributive programmes, mainly in the area of social welfare. In developing countries, this has been complemented with the design of local economic development initiatives as well as poverty alleviation measures. However, it has become increasingly evident that beyond dysfunctions in the distributive systems, in both developed and developing countries, some systemic barriers sustain outright discrimination and alienation.
Transcending poverty and deprivation, social inclusion as both a process and an outcome entails the removal of barriers to access to goods, services and opportunities as well as improved wellbeing and self-fulfilment. This goes to show that social inclusion is not just reactive;
rather, it recognizes the importance of differences and diversity, and harnesses the commonality of lived and shared experiences to achieve positive societal ends.
To a substantial degree, the urban protest movements that were referred to earlier in this Report have been about social inclusion (Chapter 1, Part 1). The rallying cry, “We are the 99 per cent”, is more of a reaction to exclusion and alienation than a protest against poverty or deprivation. Whereas equity in its primarily economic dimension is driven by
‘macro’ and national policies, most interventions in favour of social inclusion take place at the local level. Therefore, urban authorities have a major role to play when it comes to making shared prosperity a reality within their jurisdictions.
In European cities an abundance of initiatives have been introduced to promote social inclusion, and their benefits seem to have registered in the UN-Habitat “City Prosperity Index”. For example, the ‘Cities Against Social Exclusion’ (CASE) programme illustrates the concerted efforts at local and regional levels to share experiences and improve local action among a network of European cities.
Typical interventions, such as in Stockholm, include removal of barriers to full engagement of women, youths, the homeless, the elderly and the disabled. In Vienna, an elaborate action plan involves systems for non-discrimination at all levels, improved political and social participation of all minority groups including migrants, and measurable monitoring of social diversity and integration. As Vienna’s mayor once put it, “Social cohesion and a climate of respect are particularly important at a time when we all face new challenges. Good neighbourly relations cannot be enacted by law. The people who live in Vienna need to come to an understanding and formulate mutually acceptable solutions.”19
Similar noteworthy experiences are emerging in developing countries where Medellín, Dar es Salaam and Kigali, for instance, have found effective ways of enhancing prosperity based on relatively lower productivity, infrastructural development and quality of life. Medellín has resorted to civic architecture and public spaces to further inclusiveness and the empowerment of otherwise marginalized social groups. These groups benefit from expanded public facilities as infrastructure reaches out to them, improving not just their sense of wellbeing but also their capacity fully to engage with the urban fabric. In Dar es Salaam, a conscientious plan for socially mixed neighbourhoods has brought more inclusion both in space and in social relations. In Kigali, innovative measures aim to consolidate reconciliation and integration as part of the post-genocide reconstruction process.
POLICy Cities willing to embrace shared
prosperity must also look beyond equity to ensure the promotion of social inclusion as a whole.
POLICy At the city level, social
inclusion provides an environment where individuals feel they belong to the larger whole, have access to ‘commons’ and are free fully to engage in collective affairs. Social inclusion involves a broad set of variables as it hinges upon the socio-political relationship.
FACT Equity is also about social and
political relations among urban populations as well as among government institutions and individuals and social groups. It is the relational dimension which underlies the degree to which a city operates and sustains as a collective entity.
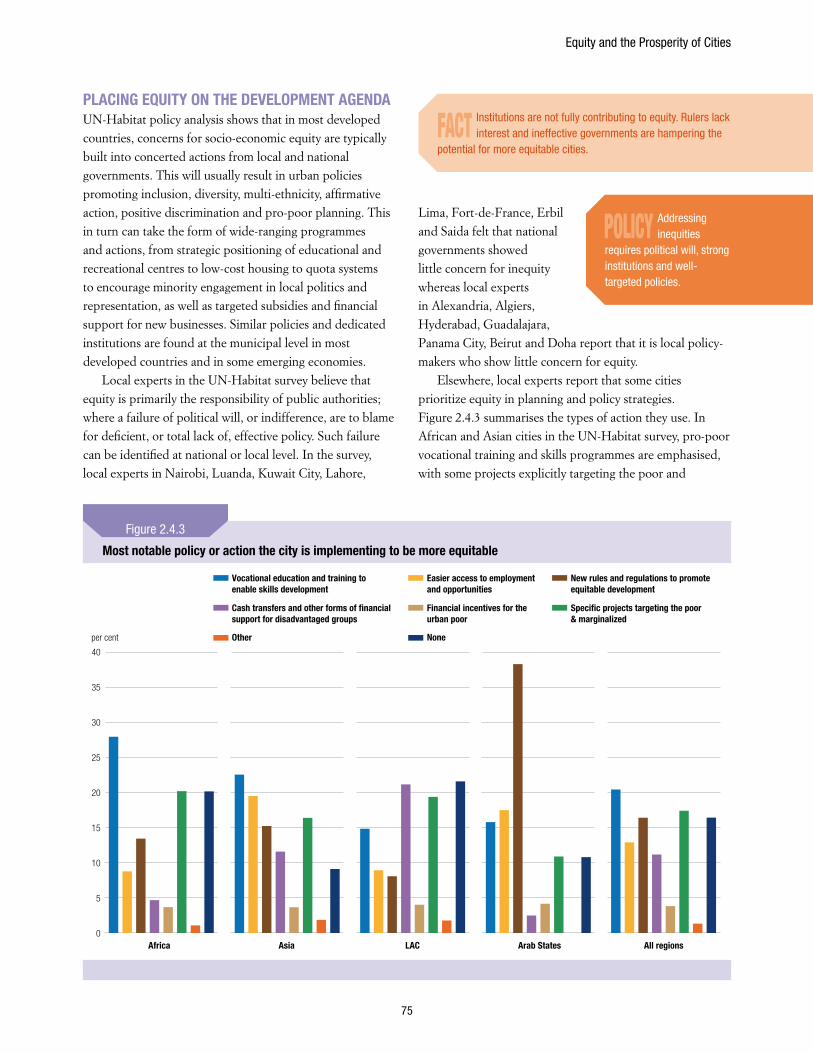
Equity and the Prosperity of Cities
75
PLACING EQUITy ON THE DEvELOPMENT AGENDA UN-Habitat policy analysis shows that in most developed countries, concerns for socio-economic equity are typically built into concerted actions from local and national governments. This will usually result in urban policies promoting inclusion, diversity, multi-ethnicity, affirmative action, positive discrimination and pro-poor planning. This in turn can take the form of wide-ranging programmes and actions, from strategic positioning of educational and recreational centres to low-cost housing to quota systems to encourage minority engagement in local politics and representation, as well as targeted subsidies and financial support for new businesses. Similar policies and dedicated institutions are found at the municipal level in most developed countries and in some emerging economies.
Local experts in the UN-Habitat survey believe that equity is primarily the responsibility of public authorities; where a failure of political will, or indifference, are to blame for deficient, or total lack of, effective policy. Such failure can be identified at national or local level. In the survey, local experts in Nairobi, Luanda, Kuwait City, Lahore,
Lima, Fort-de-France, Erbil and Saida felt that national governments showed little concern for inequity whereas local experts in Alexandria, Algiers, Hyderabad, Guadalajara, Panama City, Beirut and Doha report that it is local policy-makers who show little concern for equity.
Elsewhere, local experts report that some cities prioritize equity in planning and policy strategies. Figure 2.4.3 summarises the types of action they use. In African and Asian cities in the UN-Habitat survey, pro-poor vocational training and skills programmes are emphasised, with some projects explicitly targeting the poor and
Most notable policy or action the city is implementing to be more equitable
40
35
15
5
25
30
20
10
0
Cash transfers and other forms of �nancial support for disadvantaged groups
Other
Financial incentives for the urban poor
None
Speci�c projects targeting the poor & marginalized
Vocational education and training to enable skills development
Easier access to employment and opportunities
New rules and regulations to promote equitable development
Africa Asia LAC Arab States All regions
per cent
Figure 2.4.3
FACT Institutions are not fully contributing to equity. Rulers lack interest and ineffective governments are hampering the
potential for more equitable cities.
POLICy Addressing inequities
requires political will, strong institutions and well-targeted policies.
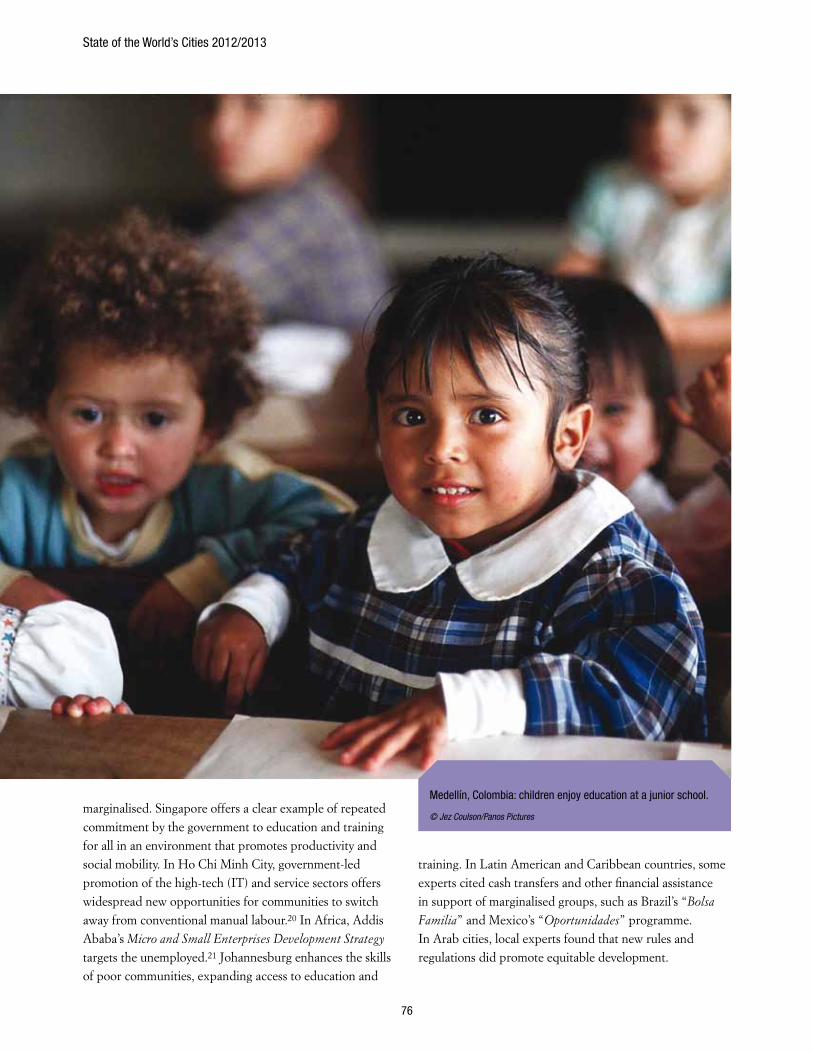
State of the World’s Cities 2012/2013
76
marginalised. Singapore offers a clear example of repeated commitment by the government to education and training for all in an environment that promotes productivity and social mobility. In Ho Chi Minh City, government-led promotion of the high-tech (IT) and service sectors offers widespread new opportunities for communities to switch away from conventional manual labour.20 In Africa, Addis Ababa’s Micro and Small Enterprises Development Strategy targets the unemployed.21 Johannesburg enhances the skills of poor communities, expanding access to education and
training. In Latin American and Caribbean countries, some experts cited cash transfers and other financial assistance in support of marginalised groups, such as Brazil’s “Bolsa
Familia” and Mexico’s “Oportunidades” programme. In Arab cities, local experts found that new rules and regulations did promote equitable development.
Medellín, Colombia: children enjoy education at a junior school.
© Jez Coulson/Panos Pictures
Equity and the Prosperity of Cities
77
Endnotes
1 World Bank (2006) World Development Report 2006 - Equity and Development, Oxford University Press ,Oxford
2 Gewirth, A. (1996), The Community of Rights, Chicago: University of Chicago Press
3 UN-Habitat (2010) State of the World’s Cities Report 2010/2011: Bridging the Urban Divide, Earthscan, London
4 OECD (2011) Divided We Stand: Why Inequality Keeps Rising, OECD Publishing, Paris, pp.22
5 Ibid.
6 Sen, A. (1999) Development as Freedom, Oxford University Press, Oxford
7 Shabou, A., N. Soboh, K. Jalouka, and D. A. Thaib (2011) City Report on Amman, Unpublished UN-Habitat background study for “State of the World’s Cities Report 2012/2013”
8 Belliapa, S.G. (2011) City Report on Bangalore, Unpublished UN-Habitat background study for “State of the World’s Cities Report 2012/2013”
9 Hampwaye, G. and W. Nchito (2011) City Report on Lusaka, Unpublished UN-Habitat background study for “State of the World’s Cities Report 2012/2013”
10 UN-Habitat (2010) Op. Cit
11 UNICEF(2010) Understanding Urban Inequalities in Bangladesh: A prerequisite for achieving Vision 2021, UNICEF Bangladesh, Dhaka
12 Turok, I (2006) ‘The Connection between Social Cohesion and City Competitiveness’, in OECD Territorial Reviews Competitive Cities in the Global Economy, OECD publishing, Paris.
13 UN-Habitat (2010) Op. Cit; UN-Habitat (2008) State of the World’s Cities Report 2008/2009: Harmonious cities, Earthscan, London
14 OECD (2006) OECD Territorial Reviews Competitive Cities in the Global Economy, OECD publishing, Paris.
15 Society for International Development (SID) ( 2012) The State of East Africa Report 2012: Deepening Integration, Intensifying Challenges, http://www.sidint.net/docs/SoEAR2012_final.pdf
16 SID Programme director Aidan Eyakuze [Mungai, C. (2012) ‘East Africa region’s economy expands amid deepening levels of poverty and malnutrition’ in The East African, April 7, http://www.theeastafrican.co.ke/news/A+richer+East+African+Community+with+more+poor+people/-/2558/1381658/-/v2nkg7/-/index.html]
17 Urban Age (2009) Cities and Social Equity: Inequality, Territory and Urban Form, Summary report, http://downloads0.cloud.lsecities.net/downloads/2009/09/SouthAmericaReport/CSE_Summary_Report.pdf
18 United Nations General Assembly (2011) Accelerating progress towards the Millennium Development Goals: options for sustained and inclusive growth and issues for advancing the United Nations development agenda beyond 2015, Annual report of the Secretary-General (A/66/126) ,July 2011
19 Vienna City Administration (n.d) Vienna Charter. Shaping the Future Together, http://www.wien.gv.at/english/living-working/vienna-charter.html
20 Dzung, D. D. (2011) City Report on Ho Chi Minh City, Unpublished UN-Habitat background study for “State of the World’s Cities Report 2012/2013”
21 Admassie, Y. (2011) City Report on Addis Ababa, Unpublished UN-Habitat background study for “State of the World’s Cities Report 2012/2013”
22 UNDP (2009) Arab Human Development Report: Challenges to Human Security in the Arab Countries , UNDP , New York,,p. 113-114.
Making Progress on the Equity Agenda
Today, some cities and national governments in the developing world are beginning to prioritize equity through concerted actions. They understand that working together maximizes their possibilities to make positive changes in the living conditions of the urban poor. They also understand that equity is a fundamental aspect of prosperity. Their interventions are closely linked to pro-poor programmes such as, in Alexandria, the Social Fund for Development, which focuses on small- and medium-size businesses; in Gaziantep, the Social Solidarity Fund whose cash transfers are conditional on children being sent to school; in Lahore, the Benazir Income Support Programme; in Shenzhen, social equity policies have brought large numbers of migrant workers and vulnerable groups into the city’s social housing and welfare system; in Ho Chi Minh City, the ‘Doimoi’ reform process has reduced inequalities in Vietnam’s capital.
Cities are also allocating funds and introducing local programmes to promote equity. Some of these interventions are becoming best practices and good examples that are inspiring other cities, and sometimes national governments. Authorities in Chongqing have made social equity a primary goal. Priority public rental housing programmes have improved conditions and rural migrant workers’ rights are better protected. In Beirut, vulnerable groups are targeted for special social support as part of a scheme that has significantly reduced homelessness and the number of people (10 per cent in 2009) below the National Poverty line22). Faced with very steep income inequality (with Gini coefficients as high as 0.75 in 2005), Johannesburg is responding with pro-poor policies including ‘Cash Social Grants’. Singapore integrates equity in national development policies and urban planning. According to a local expert, ‘There is room for upward social mobility among the poor and lower-middle class people through adequate opportunities for all in education and the job market’.
Box 2.4.3
POLICy There is no substitute
for government leadership to address issues of equity, with civil society in advocacy, support and complementary roles.
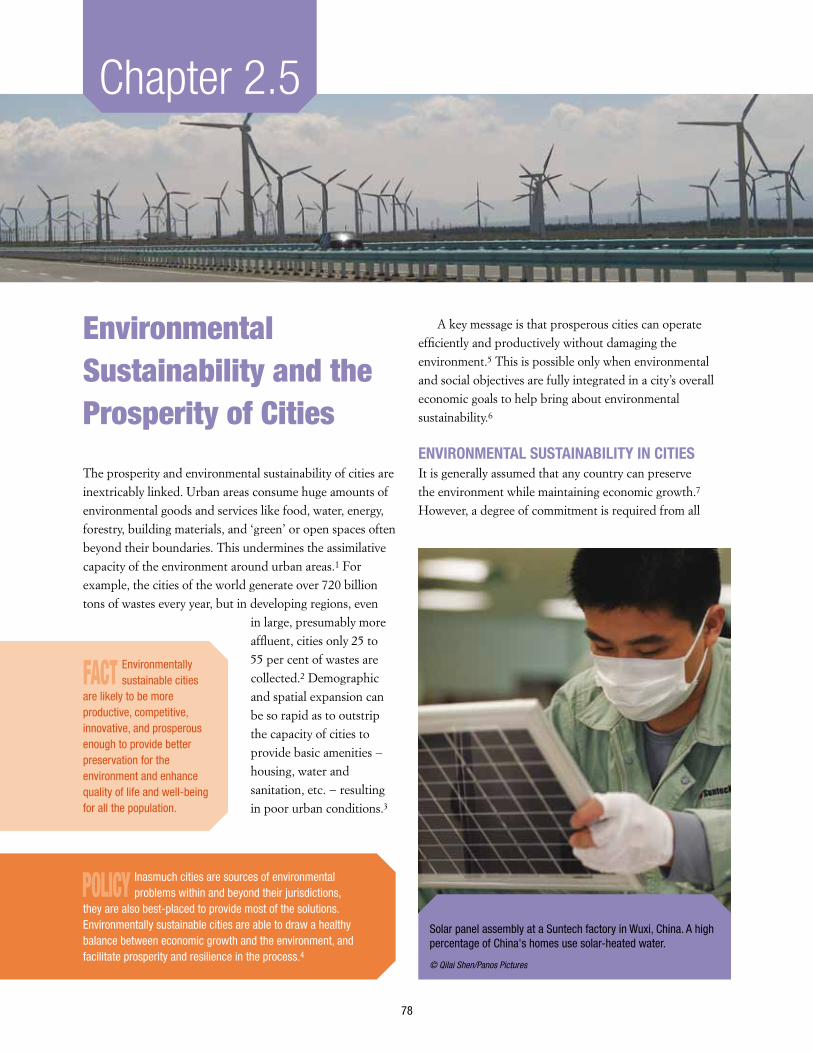
78
Environmental Sustainability and the Prosperity of Cities
The prosperity and environmental sustainability of cities are inextricably linked. Urban areas consume huge amounts of environmental goods and services like food, water, energy, forestry, building materials, and ‘green’ or open spaces often beyond their boundaries. This undermines the assimilative capacity of the environment around urban areas.1 For example, the cities of the world generate over 720 billion tons of wastes every year, but in developing regions, even
in large, presumably more affluent, cities only 25 to 55 per cent of wastes are collected.2 Demographic and spatial expansion can be so rapid as to outstrip the capacity of cities to provide basic amenities − housing, water and sanitation, etc. − resulting in poor urban conditions.3
A key message is that prosperous cities can operate efficiently and productively without damaging the environment.5 This is possible only when environmental and social objectives are fully integrated in a city’s overall economic goals to help bring about environmental sustainability.6
ENvIRONMENTAL SUSTAINABILITy IN CITIES It is generally assumed that any country can preserve the environment while maintaining economic growth.7 However, a degree of commitment is required from all
Chapter 2.5
POLICy Inasmuch cities are sources of environmental problems within and beyond their jurisdictions,
they are also best-placed to provide most of the solutions. Environmentally sustainable cities are able to draw a healthy balance between economic growth and the environment, and facilitate prosperity and resilience in the process.4
FACT Environmentally sustainable cities
are likely to be more productive, competitive, innovative, and prosperous enough to provide better preservation for the environment and enhance quality of life and well-being for all the population.
Solar panel assembly at a Suntech factory in Wuxi, China. A high percentage of China's homes use solar-heated water.
© Qilai Shen/Panos Pictures
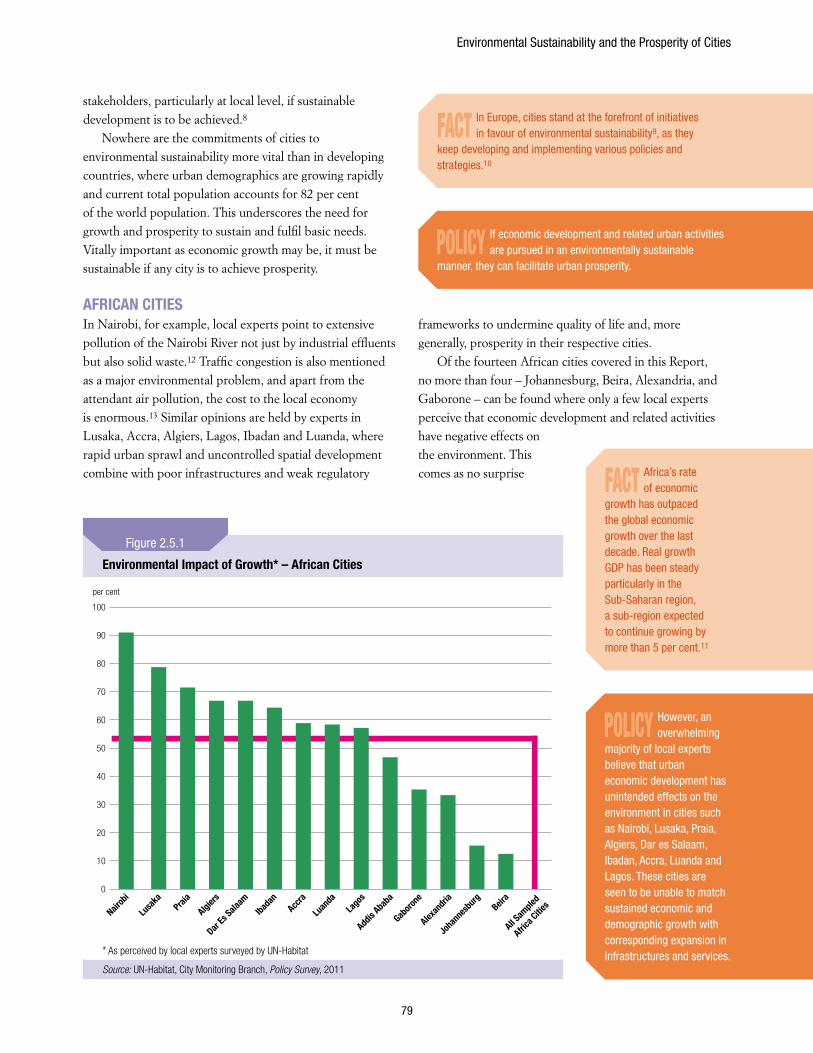
Environmental Sustainability and the Prosperity of Cities
79
stakeholders, particularly at local level, if sustainable development is to be achieved.8
Nowhere are the commitments of cities to environmental sustainability more vital than in developing countries, where urban demographics are growing rapidly and current total population accounts for 82 per cent of the world population. This underscores the need for growth and prosperity to sustain and fulfil basic needs. Vitally important as economic growth may be, it must be sustainable if any city is to achieve prosperity.
AFRICAN CITIESIn Nairobi, for example, local experts point to extensive pollution of the Nairobi River not just by industrial effluents but also solid waste.12 Traffic congestion is also mentioned as a major environmental problem, and apart from the attendant air pollution, the cost to the local economy is enormous.13 Similar opinions are held by experts in Lusaka, Accra, Algiers, Lagos, Ibadan and Luanda, where rapid urban sprawl and uncontrolled spatial development combine with poor infrastructures and weak regulatory
frameworks to undermine quality of life and, more generally, prosperity in their respective cities.
Of the fourteen African cities covered in this Report, no more than four – Johannesburg, Beira, Alexandria, and Gaborone – can be found where only a few local experts perceive that economic development and related activities have negative effects on the environment. This comes as no surprise
FACT In Europe, cities stand at the forefront of initiatives in favour of environmental sustainability9, as they
keep developing and implementing various policies and strategies.10
FACT Africa’s rate of economic
growth has outpaced the global economic growth over the last decade. Real growth GDP has been steady particularly in the Sub-Saharan region, a sub-region expected to continue growing by more than 5 per cent.11
POLICy If economic development and related urban activities are pursued in an environmentally sustainable
manner, they can facilitate urban prosperity.
Environmental Impact of Growth* – African Cities
per cent
Nairob
i
Lusa
kaPrai
a
Algiers
Dar Es
Salaam
Ibada
nAcc
ra
Luan
daLa
gos
Addis
Ababa
Gaboro
ne
Alexan
dria
Beira
Joha
nnes
burg
All Sam
pled
Africa
Cities
100
90
80
70
60
50
40
30
20
10
0
* As perceived by local experts surveyed by UN-Habitat
Source: UN-Habitat, City Monitoring Branch, Policy Survey, 2011
Figure 2.5.1
POLICy However, an overwhelming
majority of local experts believe that urban economic development has unintended effects on the environment in cities such as Nairobi, Lusaka, Praia, Algiers, Dar es Salaam, Ibadan, Accra, Luanda and Lagos. These cities are seen to be unable to match sustained economic and demographic growth with corresponding expansion in infrastructures and services.
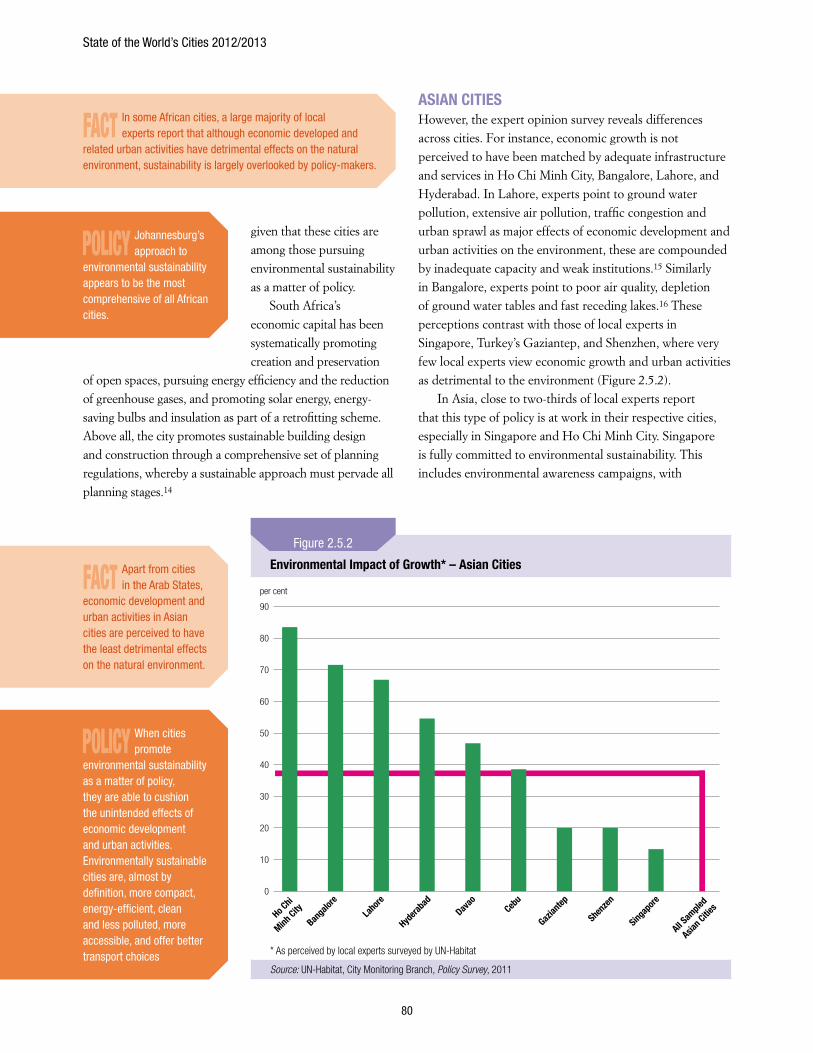
State of the World’s Cities 2012/2013
80
given that these cities are among those pursuing environmental sustainability as a matter of policy.
South Africa’s economic capital has been systematically promoting creation and preservation
of open spaces, pursuing energy efficiency and the reduction of greenhouse gases, and promoting solar energy, energy-saving bulbs and insulation as part of a retrofitting scheme. Above all, the city promotes sustainable building design and construction through a comprehensive set of planning regulations, whereby a sustainable approach must pervade all planning stages.14
ASIAN CITIESHowever, the expert opinion survey reveals differences across cities. For instance, economic growth is not perceived to have been matched by adequate infrastructure and services in Ho Chi Minh City, Bangalore, Lahore, and Hyderabad. In Lahore, experts point to ground water pollution, extensive air pollution, traffic congestion and urban sprawl as major effects of economic development and urban activities on the environment, these are compounded by inadequate capacity and weak institutions.15 Similarly in Bangalore, experts point to poor air quality, depletion of ground water tables and fast receding lakes.16 These perceptions contrast with those of local experts in Singapore, Turkey’s Gaziantep, and Shenzhen, where very few local experts view economic growth and urban activities as detrimental to the environment (Figure 2.5.2).
In Asia, close to two-thirds of local experts report that this type of policy is at work in their respective cities, especially in Singapore and Ho Chi Minh City. Singapore is fully committed to environmental sustainability. This includes environmental awareness campaigns, with
Environmental Impact of Growth* – Asian Cities
per cent
Ho Chi
Minh City
Banga
lore
Laho
re
Hydera
bad
Davao
Cebu
Gazian
tep
Shenz
en
Singap
ore
All Sam
pled
Asian C
ities
90
80
70
60
50
40
30
20
10
0
* As perceived by local experts surveyed by UN-Habitat
Source: UN-Habitat, City Monitoring Branch, Policy Survey, 2011
Figure 2.5.2
POLICy Johannesburg’s approach to
environmental sustainability appears to be the most comprehensive of all African cities.
POLICy When cities promote
environmental sustainability as a matter of policy, they are able to cushion the unintended effects of economic development and urban activities. Environmentally sustainable cities are, almost by definition, more compact, energy-efficient, clean and less polluted, more accessible, and offer better transport choices
FACT In some African cities, a large majority of local experts report that although economic developed and
related urban activities have detrimental effects on the natural environment, sustainability is largely overlooked by policy-makers.
FACT Apart from cities in the Arab States,
economic development and urban activities in Asian cities are perceived to have the least detrimental effects on the natural environment.
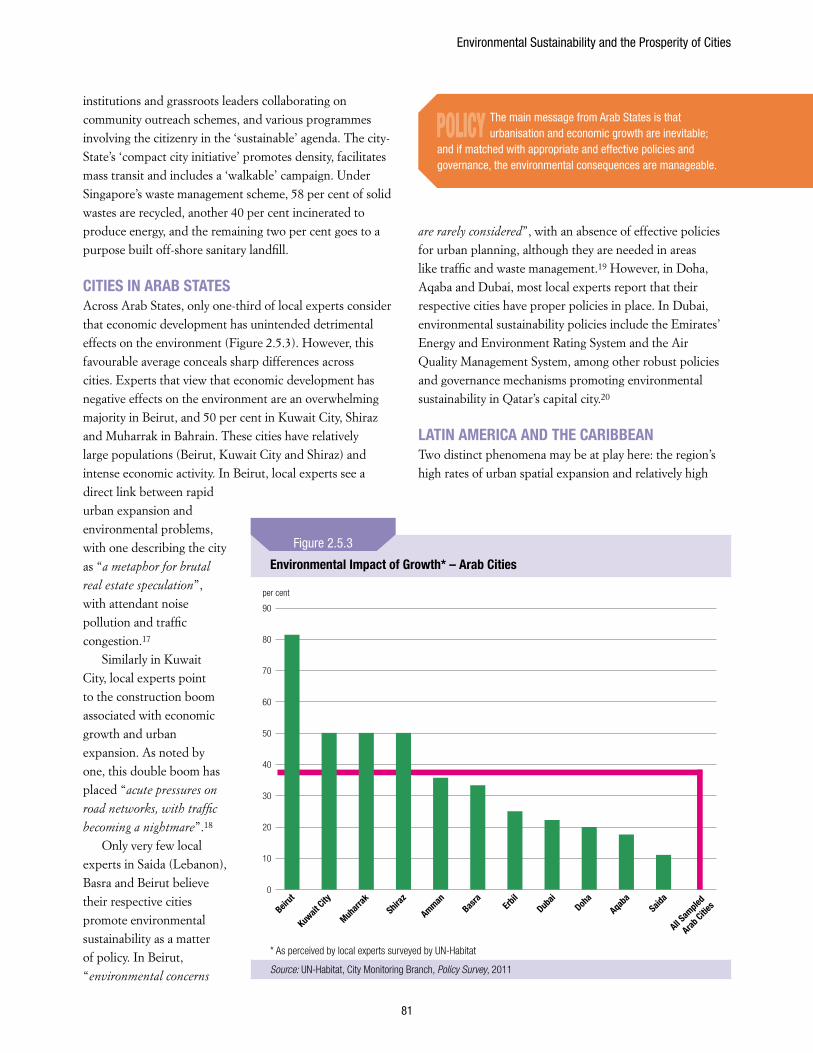
Environmental Sustainability and the Prosperity of Cities
81
institutions and grassroots leaders collaborating on community outreach schemes, and various programmes involving the citizenry in the ‘sustainable’ agenda. The city-State’s ‘compact city initiative’ promotes density, facilitates mass transit and includes a ‘walkable’ campaign. Under Singapore’s waste management scheme, 58 per cent of solid wastes are recycled, another 40 per cent incinerated to produce energy, and the remaining two per cent goes to a purpose built off-shore sanitary landfill.
CITIES IN ARAB STATES Across Arab States, only one-third of local experts consider that economic development has unintended detrimental effects on the environment (Figure 2.5.3). However, this favourable average conceals sharp differences across cities. Experts that view that economic development has negative effects on the environment are an overwhelming majority in Beirut, and 50 per cent in Kuwait City, Shiraz and Muharrak in Bahrain. These cities have relatively large populations (Beirut, Kuwait City and Shiraz) and intense economic activity. In Beirut, local experts see a direct link between rapid urban expansion and environmental problems, with one describing the city as “a metaphor for brutal
real estate speculation”, with attendant noise pollution and traffic congestion.17
Similarly in Kuwait City, local experts point to the construction boom associated with economic growth and urban expansion. As noted by one, this double boom has placed “acute pressures on
road networks, with traffic
becoming a nightmare”.18 Only very few local
experts in Saida (Lebanon), Basra and Beirut believe their respective cities promote environmental sustainability as a matter of policy. In Beirut, “environmental concerns
are rarely considered”, with an absence of effective policies for urban planning, although they are needed in areas like traffic and waste management.19 However, in Doha, Aqaba and Dubai, most local experts report that their respective cities have proper policies in place. In Dubai, environmental sustainability policies include the Emirates’ Energy and Environment Rating System and the Air Quality Management System, among other robust policies and governance mechanisms promoting environmental sustainability in Qatar’s capital city.20
LATIN AMERICA AND THE CARIBBEANTwo distinct phenomena may be at play here: the region’s high rates of urban spatial expansion and relatively high
Environmental Impact of Growth* – Arab Cities
per cent
Beirut
Kuwait
City
Muharr
akShir
az
AmmanBas
raErb
ilDub
aiDoh
aAqa
baSaid
a
All Sam
pled
Arab Citie
s
90
80
70
60
50
40
30
20
10
0
* As perceived by local experts surveyed by UN-Habitat
Source: UN-Habitat, City Monitoring Branch, Policy Survey, 2011
Figure 2.5.3
POLICy The main message from Arab States is that urbanisation and economic growth are inevitable;
and if matched with appropriate and effective policies and governance, the environmental consequences are manageable.
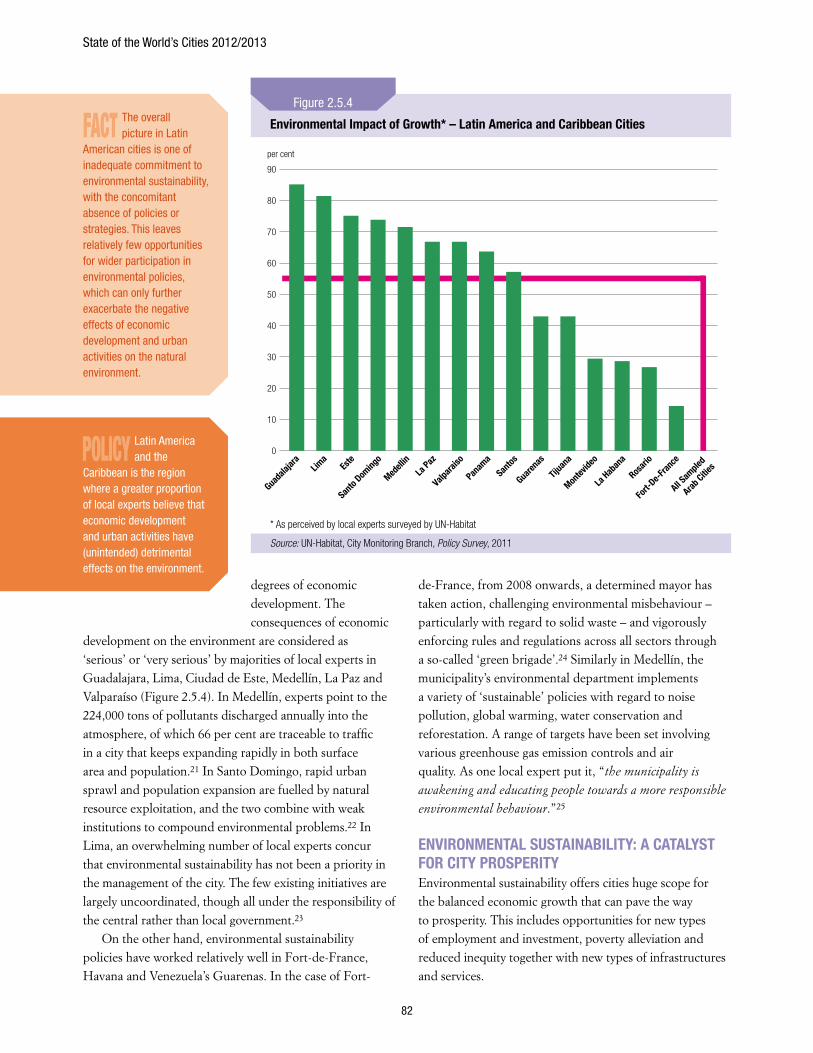
State of the World’s Cities 2012/2013
82
degrees of economic development. The consequences of economic
development on the environment are considered as ‘serious’ or ‘very serious’ by majorities of local experts in Guadalajara, Lima, Ciudad de Este, Medellín, La Paz and Valparaíso (Figure 2.5.4). In Medellín, experts point to the 224,000 tons of pollutants discharged annually into the atmosphere, of which 66 per cent are traceable to traffic in a city that keeps expanding rapidly in both surface area and population.21 In Santo Domingo, rapid urban sprawl and population expansion are fuelled by natural resource exploitation, and the two combine with weak institutions to compound environmental problems.22 In Lima, an overwhelming number of local experts concur that environmental sustainability has not been a priority in the management of the city. The few existing initiatives are largely uncoordinated, though all under the responsibility of the central rather than local government.23
On the other hand, environmental sustainability policies have worked relatively well in Fort-de-France, Havana and Venezuela’s Guarenas. In the case of Fort-
de-France, from 2008 onwards, a determined mayor has taken action, challenging environmental misbehaviour – particularly with regard to solid waste – and vigorously enforcing rules and regulations across all sectors through a so-called ‘green brigade’.24 Similarly in Medellín, the municipality’s environmental department implements a variety of ‘sustainable’ policies with regard to noise pollution, global warming, water conservation and reforestation. A range of targets have been set involving various greenhouse gas emission controls and air quality. As one local expert put it, “the municipality is
awakening and educating people towards a more responsible
environmental behaviour.”25
ENvIRONMENTAL SUSTAINABILITy: A CATALyST FOR CITy PROSPERITyEnvironmental sustainability offers cities huge scope for the balanced economic growth that can pave the way to prosperity. This includes opportunities for new types of employment and investment, poverty alleviation and reduced inequity together with new types of infrastructures and services.
Environmental Impact of Growth* – Latin America and Caribbean Cities
per cent
Guada
lajara Lim
aEs
te
Santo
Doming
o
Medell
in
La Paz
Valpara
iso
Panam
a
Santos
Guaren
as
Tijua
na
Montev
ideo
La Hab
ana
Rosari
o
Fort-
De-Fran
ce
All Sam
pled
Arab Citie
s
90
80
70
60
50
40
30
20
10
0
* As perceived by local experts surveyed by UN-Habitat
Source: UN-Habitat, City Monitoring Branch, Policy Survey, 2011
Figure 2.5.4
FACT The overall picture in Latin
American cities is one of inadequate commitment to environmental sustainability, with the concomitant absence of policies or strategies. This leaves relatively few opportunities for wider participation in environmental policies, which can only further exacerbate the negative effects of economic development and urban activities on the natural environment.
POLICy Latin America and the
Caribbean is the region where a greater proportion of local experts believe that economic development and urban activities have (unintended) detrimental effects on the environment.
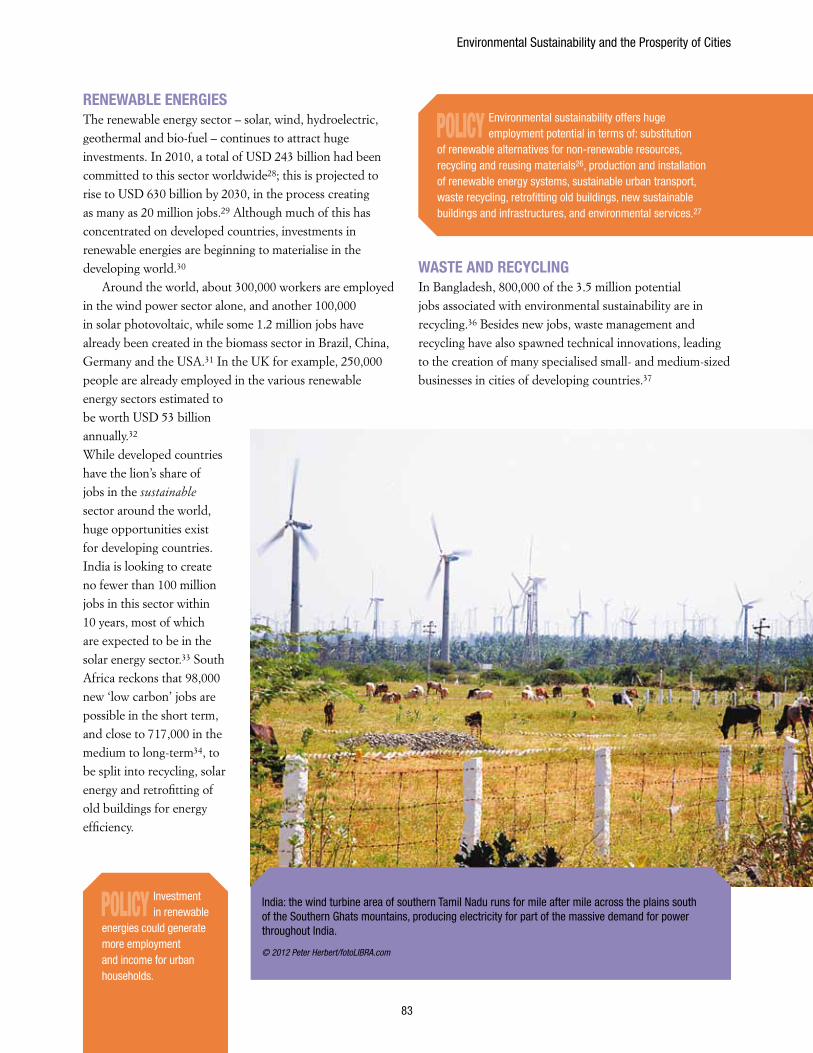
Environmental Sustainability and the Prosperity of Cities
83
RENEWABLE ENERGIESThe renewable energy sector – solar, wind, hydroelectric, geothermal and bio-fuel – continues to attract huge investments. In 2010, a total of USD 243 billion had been committed to this sector worldwide28; this is projected to rise to USD 630 billion by 2030, in the process creating as many as 20 million jobs.29 Although much of this has concentrated on developed countries, investments in renewable energies are beginning to materialise in the developing world.30
Around the world, about 300,000 workers are employed in the wind power sector alone, and another 100,000 in solar photovoltaic, while some 1.2 million jobs have already been created in the biomass sector in Brazil, China, Germany and the USA.31 In the UK for example, 250,000 people are already employed in the various renewable energy sectors estimated to be worth USD 53 billion annually.32
While developed countries have the lion’s share of jobs in the sustainable sector around the world, huge opportunities exist for developing countries. India is looking to create no fewer than 100 million jobs in this sector within 10 years, most of which are expected to be in the solar energy sector.33 South Africa reckons that 98,000 new ‘low carbon’ jobs are possible in the short term, and close to 717,000 in the medium to long-term34, to be split into recycling, solar energy and retrofitting of old buildings for energy efficiency.
WASTE AND RECyCLINGIn Bangladesh, 800,000 of the 3.5 million potential jobs associated with environmental sustainability are in recycling.36 Besides new jobs, waste management and recycling have also spawned technical innovations, leading to the creation of many specialised small- and medium-sized businesses in cities of developing countries.37
POLICy Environmental sustainability offers huge employment potential in terms of: substitution
of renewable alternatives for non-renewable resources, recycling and reusing materials26, production and installation of renewable energy systems, sustainable urban transport, waste recycling, retrofitting old buildings, new sustainable buildings and infrastructures, and environmental services.27
India: the wind turbine area of southern Tamil Nadu runs for mile after mile across the plains south of the Southern Ghats mountains, producing electricity for part of the massive demand for power throughout India.
© 2012 Peter Herbert/fotoLIBRA.com
POLICy Investment in renewable
energies could generate more employment and income for urban households.
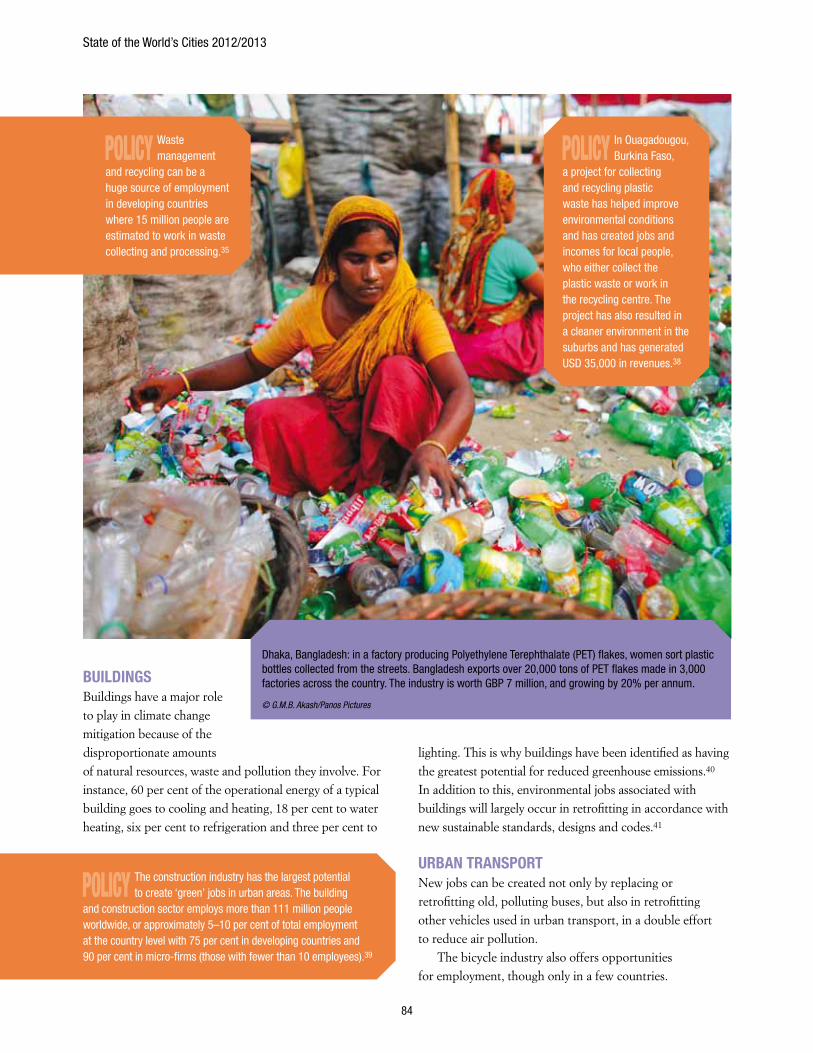
State of the World’s Cities 2012/2013
84
BUILDINGSBuildings have a major role to play in climate change mitigation because of the disproportionate amounts of natural resources, waste and pollution they involve. For instance, 60 per cent of the operational energy of a typical building goes to cooling and heating, 18 per cent to water heating, six per cent to refrigeration and three per cent to
lighting. This is why buildings have been identified as having the greatest potential for reduced greenhouse emissions.40 In addition to this, environmental jobs associated with buildings will largely occur in retrofitting in accordance with new sustainable standards, designs and codes.41
URBAN TRANSPORTNew jobs can be created not only by replacing or retrofitting old, polluting buses, but also in retrofitting other vehicles used in urban transport, in a double effort to reduce air pollution.
The bicycle industry also offers opportunities for employment, though only in a few countries.
Dhaka, Bangladesh: in a factory producing Polyethylene Terephthalate (PET) flakes, women sort plastic bottles collected from the streets. Bangladesh exports over 20,000 tons of PET flakes made in 3,000 factories across the country. The industry is worth GBP 7 million, and growing by 20% per annum.
© G.M.B. Akash/Panos Pictures
POLICy Waste management
and recycling can be a huge source of employment in developing countries where 15 million people are estimated to work in waste collecting and processing.35
POLICy In Ouagadougou, Burkina Faso,
a project for collecting and recycling plastic waste has helped improve environmental conditions and has created jobs and incomes for local people, who either collect the plastic waste or work in the recycling centre. The project has also resulted in a cleaner environment in the suburbs and has generated USD 35,000 in revenues.38
POLICy The construction industry has the largest potential to create ‘green’ jobs in urban areas. The building
and construction sector employs more than 111 million people worldwide, or approximately 5–10 per cent of total employment at the country level with 75 per cent in developing countries and 90 per cent in micro-firms (those with fewer than 10 employees).39
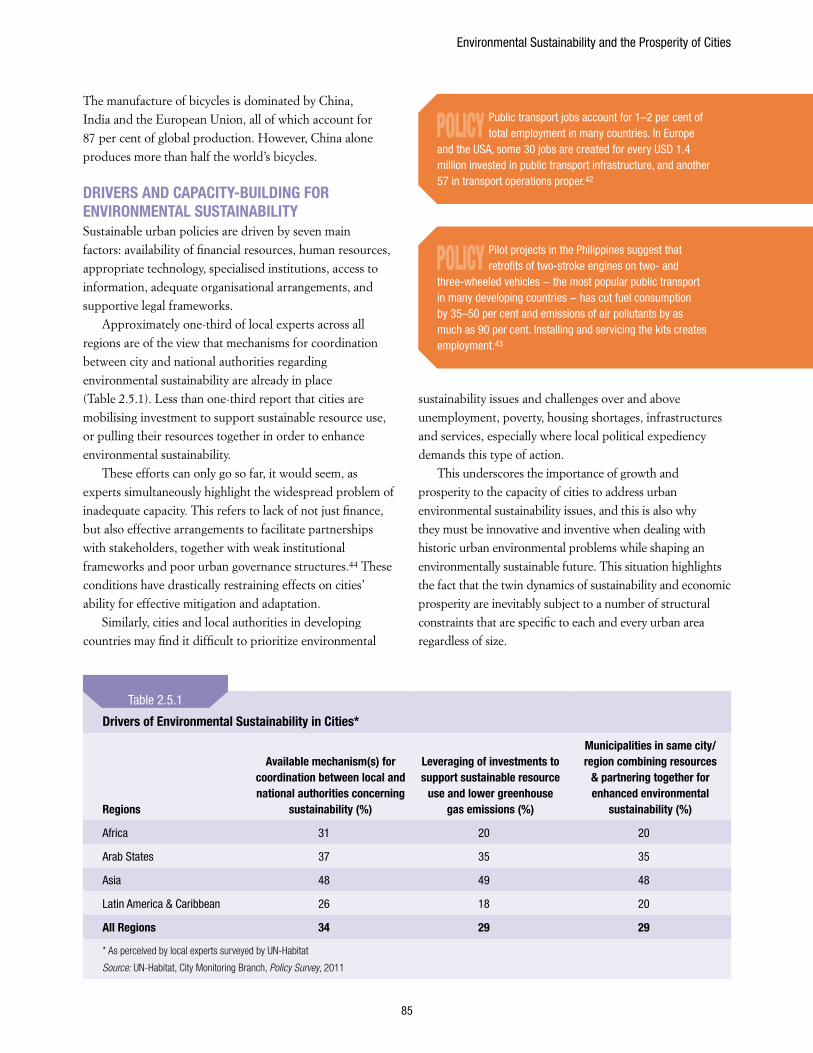
Environmental Sustainability and the Prosperity of Cities
85
The manufacture of bicycles is dominated by China, India and the European Union, all of which account for 87 per cent of global production. However, China alone produces more than half the world’s bicycles.
DRIvERS AND CAPACITy-BUILDING FOR ENvIRONMENTAL SUSTAINABILITySustainable urban policies are driven by seven main factors: availability of financial resources, human resources, appropriate technology, specialised institutions, access to information, adequate organisational arrangements, and supportive legal frameworks.
Approximately one-third of local experts across all regions are of the view that mechanisms for coordination between city and national authorities regarding environmental sustainability are already in place (Table 2.5.1). Less than one-third report that cities are mobilising investment to support sustainable resource use, or pulling their resources together in order to enhance environmental sustainability.
These efforts can only go so far, it would seem, as experts simultaneously highlight the widespread problem of inadequate capacity. This refers to lack of not just finance, but also effective arrangements to facilitate partnerships with stakeholders, together with weak institutional frameworks and poor urban governance structures.44 These conditions have drastically restraining effects on cities’ ability for effective mitigation and adaptation.
Similarly, cities and local authorities in developing countries may find it difficult to prioritize environmental
sustainability issues and challenges over and above unemployment, poverty, housing shortages, infrastructures and services, especially where local political expediency demands this type of action.
This underscores the importance of growth and prosperity to the capacity of cities to address urban environmental sustainability issues, and this is also why they must be innovative and inventive when dealing with historic urban environmental problems while shaping an environmentally sustainable future. This situation highlights the fact that the twin dynamics of sustainability and economic prosperity are inevitably subject to a number of structural constraints that are specific to each and every urban area regardless of size.
POLICy Pilot projects in the Philippines suggest that retrofits of two-stroke engines on two- and
three-wheeled vehicles − the most popular public transport in many developing countries − has cut fuel consumption by 35–50 per cent and emissions of air pollutants by as much as 90 per cent. Installing and servicing the kits creates employment.43
POLICy Public transport jobs account for 1–2 per cent of total employment in many countries. In Europe
and the USA, some 30 jobs are created for every USD 1.4 million invested in public transport infrastructure, and another 57 in transport operations proper.42
Drivers of Environmental Sustainability in Cities*
Regions
Available mechanism(s) for coordination between local and national authorities concerning
sustainability (%)
Leveraging of investments to support sustainable resource
use and lower greenhouse gas emissions (%)
Municipalities in same city/region combining resources
& partnering together for enhanced environmental
sustainability (%)
Africa 31 20 20
Arab States 37 35 35
Asia 48 49 48
Latin America & Caribbean 26 18 20
All Regions 34 29 29
* As perceived by local experts surveyed by UN-Habitat
Source: UN-Habitat, City Monitoring Branch, Policy Survey, 2011
Table 2.5.1
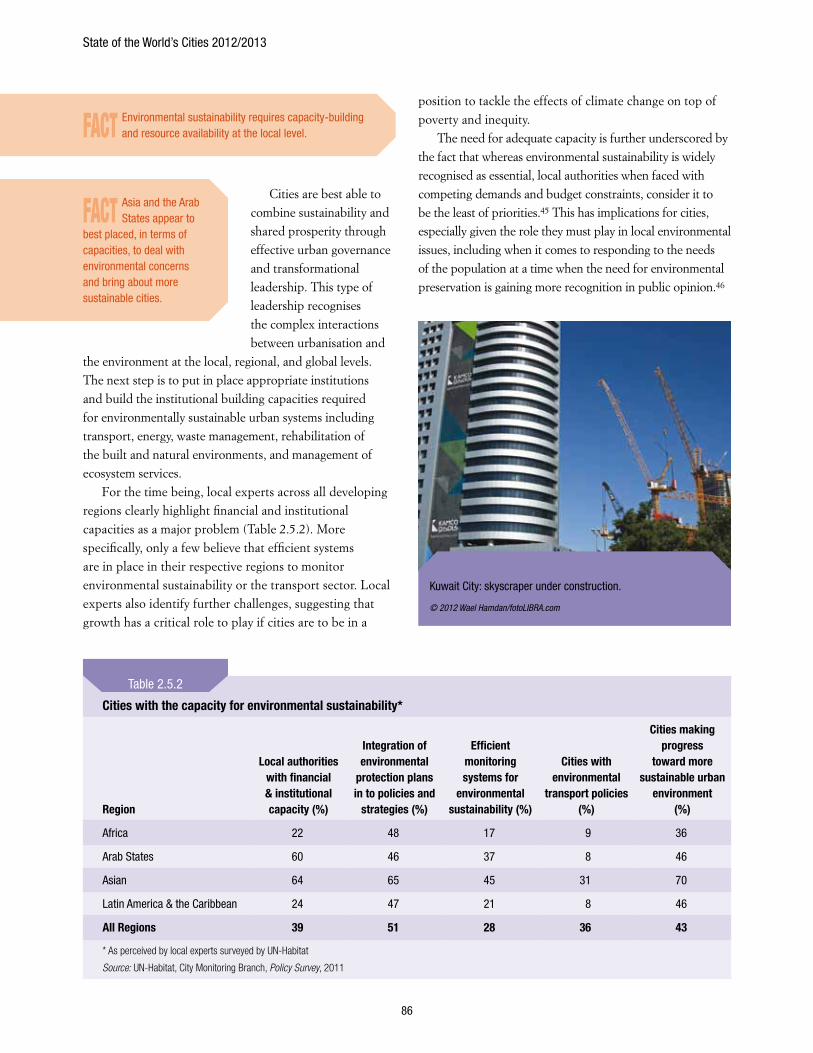
State of the World’s Cities 2012/2013
86
Cities are best able to combine sustainability and shared prosperity through effective urban governance and transformational leadership. This type of leadership recognises the complex interactions between urbanisation and
the environment at the local, regional, and global levels. The next step is to put in place appropriate institutions and build the institutional building capacities required for environmentally sustainable urban systems including transport, energy, waste management, rehabilitation of the built and natural environments, and management of ecosystem services.
For the time being, local experts across all developing regions clearly highlight financial and institutional capacities as a major problem (Table 2.5.2). More specifically, only a few believe that efficient systems are in place in their respective regions to monitor environmental sustainability or the transport sector. Local experts also identify further challenges, suggesting that growth has a critical role to play if cities are to be in a
position to tackle the effects of climate change on top of poverty and inequity.
The need for adequate capacity is further underscored by the fact that whereas environmental sustainability is widely recognised as essential, local authorities when faced with competing demands and budget constraints, consider it to be the least of priorities.45 This has implications for cities, especially given the role they must play in local environmental issues, including when it comes to responding to the needs of the population at a time when the need for environmental preservation is gaining more recognition in public opinion.46
Cities with the capacity for environmental sustainability*
Region
Local authorities with financial & institutional capacity (%)
Integration of environmental
protection plans in to policies and
strategies (%)
Efficient monitoring systems for
environmental sustainability (%)
Cities with environmental
transport policies (%)
Cities making progress
toward more sustainable urban
environment(%)
Africa 22 48 17 9 36
Arab States 60 46 37 8 46
Asian 64 65 45 31 70
Latin America & the Caribbean 24 47 21 8 46
All Regions 39 51 28 36 43
* As perceived by local experts surveyed by UN-Habitat
Source: UN-Habitat, City Monitoring Branch, Policy Survey, 2011
Table 2.5.2
FACT Environmental sustainability requires capacity-building and resource availability at the local level.
FACT Asia and the Arab States appear to
best placed, in terms of capacities, to deal with environmental concerns and bring about more sustainable cities.
Kuwait City: skyscraper under construction.
© 2012 Wael Hamdan/fotoLIBRA.com
Environmental Sustainability and the Prosperity of Cities
87
Nevertheless, cities need not wait until full capacity is built before adopting and implementing adequate environmental policies and strategies: indeed, in many cases cities have managed to enhance overall quality of life despite modest financial and institutional capacities.
Endnotes
1 Mitlin, D., and S. Satterthwaite (1996) Sustainable Development and Cities. In Pugh, C. (ed.) Sustainability, the Environment and Urbanisation, Earthscan, London
2 UNEP (1996) Taking Action: Environmental Guide for You and Your Community, UNEP, Nairobi, http://www.nyo.unep.org/action/08f.htm
3 UN-Habitat (2003) The Challenge of Slums: Global Report on Human Settlements 2003, Earthscan, London
4 UN-Habitat (2011a). Cities and Climate Change: Policy Directions, Abridged edition, Earthscan, London.
5 Cities Alliance, ICLEI and UNEP (2007) Liveable Cities: The Benefits of Urban Environmental Planning. A Cities Alliance Study on Good Practices and Useful Tools, Cities Alliance, Washington DC.
6 Pacione, M. (2003) ‘Urban Environmental Quality and Human Wellbeing; A Social Geographical Perspective’, Landscape and Urban Planning, vol.65, pp.19-30
7 WCED (World Commission on Environment and Development) (1987) Our Common Future, Oxford University Press, Oxford
8 United Nations (1992) Agenda 21: Programme of Action for Sustainable Development, United Nations, New York
9 Portney, K. E. and J.M. Berry (2011) Civil Society and Sustainable Cities. Paper prepared for the Princeton Conference on Environmental Politics: Research Frontiers in Comparative and International Environmental Politics, Niehaus Center for Globalization and Governance, Princeton University, December 2-3, 2011
10 Lafferty, W.M and Eckerberg, K. (1998) From the Earth Summit to Local Agenda 21: Working Towards Sustainable Development, Earthscan, London.
11 Africa Economic Outlook (2012) Macroeconomic Prospects, http://www.africaneconomicoutlook.org/en/outlook/forecast/
12 Omenya, A. (2011) City Report on Nairobi, Unpublished UN-Habitat background study for “State of the World’s Cities Report 2012/2013”
13 Ibid.
14 Awuor-Hayanga, R. (2011) City Report on Johannesburg, Unpublished UN-Habitat background study for “State of the World’s Cities Report 2012/2013”
15 Zaidi, S.S.H. (2011) City Report on Lahore, Unpublished UN-Habitat background study for “State of the World’s Cities Report 2012/2013”
16 Belliapa, S.G. (2011) City Report on Bangalore, Unpublished UN-Habitat background study for “State of the World’s Cities Report 2012/2013”
17 Fawaz, M. and N. Baghdadi (2011) City Report on Beirut. Unpublished UN-Habitat background study for “State of the World’s Cities Report 2012/2013”
18 Khattab, O. (2011) City Report on Kuwait City, Unpublished UN-Habitat background study for “State of the World’s Cities Report 2012/2013”
19 Ibid.
20 Al-Bassam, D. and J. Mouris (2011) City Report on Dubai, Unpublished UN-Habitat background study for “State of the World’s Cities Report 2012/2013”
21 Urán, H. B. (2011) City Report on Medellín, Unpublished UN-Habitat background study for “State of the World’s Cities Report 2012/2013”
22 Castellanos, G. (2011) City Report on Santo Domingo, Unpublished UN-Habitat background study for “State of the World’s Cities Report 2012/2013”
23 Galimberti, L. D. (2011) City Report on Lima, Unpublished UN-Habitat background study for “State of the World’s Cities Report 2012/2013”
24 Yerro, A. P. (2011) City Report on Fort-De-France, Unpublished UN-Habitat background study for “State of the World’s Cities Report 2012/2013”
25 Urán, H. B. (2011) op. cit.
26 UNEP (2008) UNEP Background Paper on Green Jobs, UNEP, Nairobi
27 Simon, D., M. Fragkias, R.Leichenko , R. Sánchez-Rodríguez, K. Seto and B.Solecki (2011) The Green Economy and the Prosperity of Cities, background paper for ‘State of the World Cities Report 2012/13’
28 UNEP (2011) Renewable energy: Investing in energy and resource efficiency http://www.unep.org/greeneconomy/Portals/88/documents/ger/GER_6_RenewableEnergy.pdf
29 UNEP (2009) Global Green New Deal, UNEP Policy Brief, http://www.unep.org/pdf/A_Global_Green_New_Deal_Policy_Brief.pdf
30 Martinot, E. , A. Chaurey , D. Lew, J. R. Moreira, and N. Wamukonya (2002) ‘Renewable Energy Markets in Developing Countries’, Annual Review of Energy and Environment, vol. 27, pp. 309-348.
31 UNEP, ILO ,IOE and ITUC (2008) Green Jobs: Towards Decent Work in a Sustainable, Low-Carbon World, UNEP, Nairobi
32 Peacock, L (2011) ‘Future of jobs: Green industry to create thousands of roles’, The Telegraph, September 15, http://www.telegraph.co.uk/finance/jobs/8765695/Future-of-jobs-Green-industry-to-create-thousands-of-roles.html
33 Shukla, A. (2012) ‘India to create 100 million green jobs’, One World South Asia, February 13, http://southasia.oneworld.net/todaysheadlines/india-to-create-100-million-green-jobs/?searchterm=100%20million%20green%20jobs
34 Maia, J., T. Giordano,N. Kelder, G. Bardien, M. Bodibe, P. Du Plooy, X. Jafta, D. Jarvis, E. Kruger-Cloete, G. Kuhn, R. Lepelle, L. Makaulule. K. Mosoma, S. Neoh, N. Netshitomboni, T. Ngozo, and J. Swanepoel, (2011) Green Jobs: An Estimate Of The Direct Employment Potential Of A Greening South African Economy. IDC/DBSA, Trade and Industrial Policy strategies
35 UNEP, ILO, IOE and ITUC (2008) op. cit.
36 HK (2010) Estimating green jobs in Bangladesh: A GHK report for the ILO, http://www.ilo.org/wcmsp5/groups/public/---ed_emp/---emp_ent/documents/publication/wcms_159433.pdf
37 Simon, D., M. Fragkias, R.Leichenko, R. Sánchez-Rodríguez, K. Seto and B.Solecki (2011) op.cit.
38 ILO (2007) Green jobs initiative in Burkina Faso: From waste to wages, http://www.ilo.org/global/about-the-ilo/press-and-media-centre/insight/WCMS_084547/lang--en/index.htm
39 Simon, D., M. Fragkias, R.Leichenko, R. Sánchez-Rodríguez, K. Seto and B.Solecki (2011) op.cit.
40 Ibid.
41 Renner, M., S. Sweeney and J. Kubit (2008) ‘Green Jobs: Working for People and the Environment’, WorldWatch Report 177, Worldwatch Institute , Washington, DC
42 UNEP, ILO, IOE and ITUC (2008) op. cit.
43 UNEP, ILO, IOE and ITUC (2008) op. cit.
44 UN-Habitat (2011b) Cities and Climate Change: Global Report on Human Settlements 2011, Earthscan, London
45 Hess, D. and L. Winner (2006) Enhancing Justice and Sustainability at Local Level: Affordable Policies for Urban Governments, http://www.davidjhess.org/PolicyPaper.pdf
46 UNCED (1992) Capacity Building: Agenda 21’s definition (Chapter 37), United Nations, New York.
POLICy Cities must build those financial and other institutions required to achieve environmental sustainability without
which economic growth will fall short of ensuring shared prosperity.
Part Three
Policies for Prosperous Cities

90
Chapter 3.1
From Comparative Advantage to Urban Prosperity
Geography has always played an important role in the evolution of cities. Historically, coastal cities and cities in river deltas have been preferred locations – at present, 14 of the world’s 19 largest cities are port cities. However, with advances in transport and communication technologies and also with increasing specialization, other locational factors, beyond positions along waterways, have accelerated the growth and development of cities. Even when located in the hinterland, cities located close to other major urban centres or to important urban agglomerations have significantly gained from their position and demonstrated relatively higher levels of development. Indeed, new configurations such as mega-regions and urban corridors generate regional economies and trigger the evolution of new patterns of economic activity which contribute to prosperity. Similarly, cities which lie in the vicinity of markets and infrastructure,
or close to transnational borders, have also exhibited a tendency to grow and prosper much faster.1
The increasing number of large and dynamic cities which are not sea or river ports confirms that much as geographic location is an important correlate of a city’s prosperity, it does not explain everything.
Many cities derive their prosperity from their capacity to harness other advantages, particularly through repositioning themselves in the national, regional or global context. Common among all of them has been their capacity to change and adjust to new circumstances and to build upon their own history and identity. Such cities have been able to envision a new future and to use their different forms of capital and assets. Critical also has been the ability of these cities to build social and political consensus. In essence, many cities today are able to deploy the capacity of human agency and to steer growth in the new direction of choice.
Indeed, the prosperity of any city is no accident. It is the result of innovation, sustained vision and good governance. It is also a result of proper laws, regulations and institutions, as well as reinvigorated planning and adequate policies. Effective use of these instruments and processes has enabled many cities around the world to optimize their comparative advantages and to set themselves along the path of prosperity. They have used a range of avenues and capitalized on different sets of ‘spokes’ in their drive to shared and sustainable growth and wellbeing.
Some cities are enhancing prosperity though strategic thinking and conscious planning policies. This is the case with Dubai in the Persian Gulf, which took advantage of its privileged geographic location to become the largest re-exporting centre in the Middle East, and today is emerging as a cosmopolitan centre. Other cities are devising long-term visions with well-defined
POLICy It is time for governments
to recognize the existence of a wide scope for human intervention that can enable cities to enhance their potential as engines of today’s and tomorrow’s prosperity, both locally and nationally.
FACT Geography alone cannot
determine which city will grow and which will decline. Other factors such as government policies, corporate strategies, human capital, major political forces and decisions, investments in strategic sectors, all have an influence on the fate of cities.
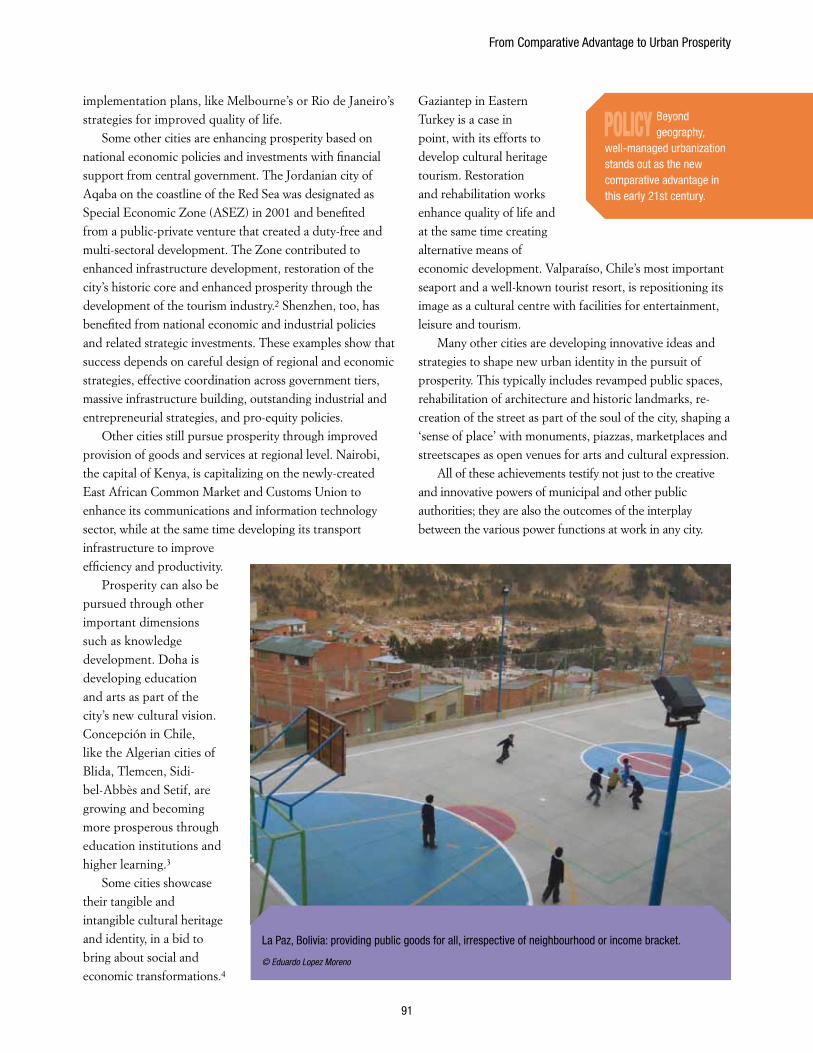
From Comparative Advantage to Urban Prosperity
91
implementation plans, like Melbourne’s or Rio de Janeiro’s strategies for improved quality of life.
Some other cities are enhancing prosperity based on national economic policies and investments with financial support from central government. The Jordanian city of Aqaba on the coastline of the Red Sea was designated as Special Economic Zone (ASEZ) in 2001 and benefited from a public-private venture that created a duty-free and multi-sectoral development. The Zone contributed to enhanced infrastructure development, restoration of the city’s historic core and enhanced prosperity through the development of the tourism industry.2 Shenzhen, too, has benefited from national economic and industrial policies and related strategic investments. These examples show that success depends on careful design of regional and economic strategies, effective coordination across government tiers, massive infrastructure building, outstanding industrial and entrepreneurial strategies, and pro-equity policies.
Other cities still pursue prosperity through improved provision of goods and services at regional level. Nairobi, the capital of Kenya, is capitalizing on the newly-created East African Common Market and Customs Union to enhance its communications and information technology sector, while at the same time developing its transport infrastructure to improve efficiency and productivity.
Prosperity can also be pursued through other important dimensions such as knowledge development. Doha is developing education and arts as part of the city’s new cultural vision. Concepción in Chile, like the Algerian cities of Blida, Tlemcen, Sidi-bel-Abbès and Setif, are growing and becoming more prosperous through education institutions and higher learning.3
Some cities showcase their tangible and intangible cultural heritage and identity, in a bid to bring about social and economic transformations.4
Gaziantep in Eastern Turkey is a case in point, with its efforts to develop cultural heritage tourism. Restoration and rehabilitation works enhance quality of life and at the same time creating alternative means of economic development. Valparaíso, Chile’s most important seaport and a well-known tourist resort, is repositioning its image as a cultural centre with facilities for entertainment, leisure and tourism.
Many other cities are developing innovative ideas and strategies to shape new urban identity in the pursuit of prosperity. This typically includes revamped public spaces, rehabilitation of architecture and historic landmarks, re-creation of the street as part of the soul of the city, shaping a ‘sense of place’ with monuments, piazzas, marketplaces and streetscapes as open venues for arts and cultural expression.
All of these achievements testify not just to the creative and innovative powers of municipal and other public authorities; they are also the outcomes of the interplay between the various power functions at work in any city.
POLICy Beyond geography,
well-managed urbanization stands out as the new comparative advantage in this early 21st century.
La Paz, Bolivia: providing public goods for all, irrespective of neighbourhood or income bracket.
© Eduardo Lopez Moreno
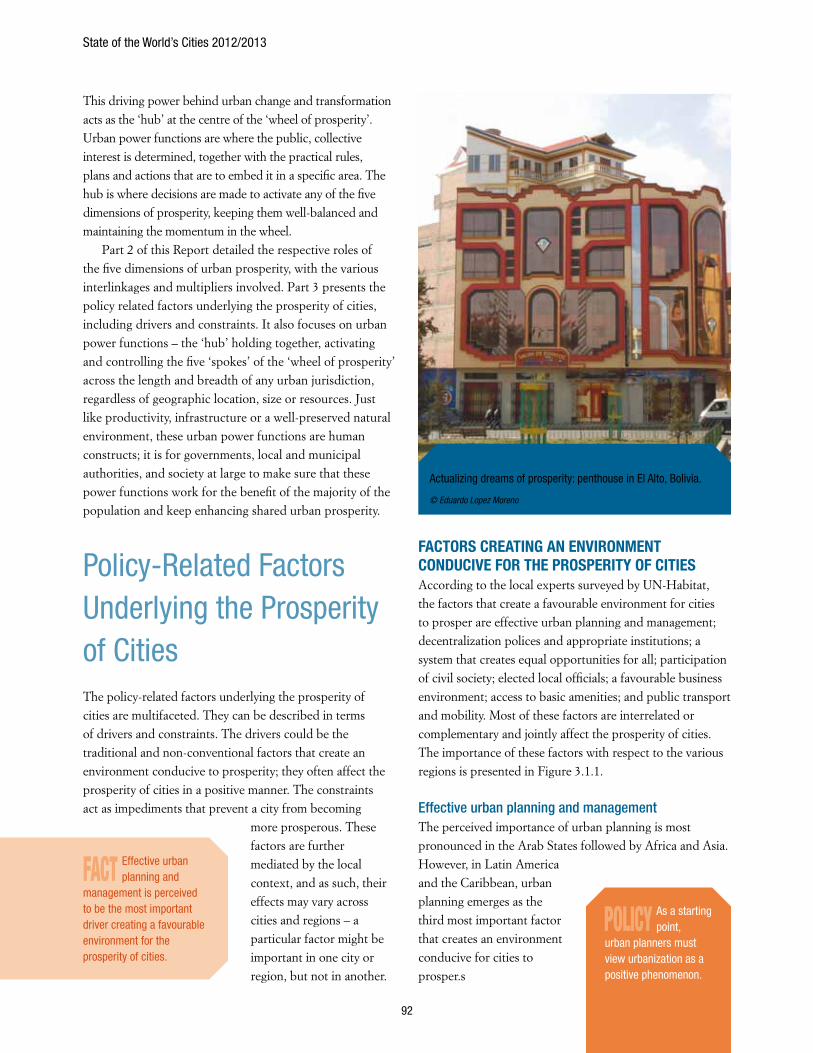
State of the World’s Cities 2012/2013
92
This driving power behind urban change and transformation acts as the ‘hub’ at the centre of the ‘wheel of prosperity’. Urban power functions are where the public, collective interest is determined, together with the practical rules, plans and actions that are to embed it in a specific area. The hub is where decisions are made to activate any of the five dimensions of prosperity, keeping them well-balanced and maintaining the momentum in the wheel.
Part 2 of this Report detailed the respective roles of the five dimensions of urban prosperity, with the various interlinkages and multipliers involved. Part 3 presents the policy related factors underlying the prosperity of cities, including drivers and constraints. It also focuses on urban power functions – the ‘hub’ holding together, activating and controlling the five ‘spokes’ of the ‘wheel of prosperity’ across the length and breadth of any urban jurisdiction, regardless of geographic location, size or resources. Just like productivity, infrastructure or a well-preserved natural environment, these urban power functions are human constructs; it is for governments, local and municipal authorities, and society at large to make sure that these power functions work for the benefit of the majority of the population and keep enhancing shared urban prosperity.
Policy-Related Factors Underlying the Prosperity of CitiesThe policy-related factors underlying the prosperity of cities are multifaceted. They can be described in terms of drivers and constraints. The drivers could be the traditional and non-conventional factors that create an environment conducive to prosperity; they often affect the prosperity of cities in a positive manner. The constraints act as impediments that prevent a city from becoming
more prosperous. These factors are further mediated by the local context, and as such, their effects may vary across cities and regions – a particular factor might be important in one city or region, but not in another.
FACTORS CREATING AN ENvIRONMENT CONDUCIvE FOR THE PROSPERITy OF CITIESAccording to the local experts surveyed by UN-Habitat, the factors that create a favourable environment for cities to prosper are effective urban planning and management; decentralization polices and appropriate institutions; a system that creates equal opportunities for all; participation of civil society; elected local officials; a favourable business environment; access to basic amenities; and public transport and mobility. Most of these factors are interrelated or complementary and jointly affect the prosperity of cities. The importance of these factors with respect to the various regions is presented in Figure 3.1.1.
Effective urban planning and managementThe perceived importance of urban planning is most pronounced in the Arab States followed by Africa and Asia. However, in Latin America and the Caribbean, urban planning emerges as the third most important factor that creates an environment conducive for cities to prosper.s
Actualizing dreams of prosperity: penthouse in El Alto, Bolivia.
© Eduardo Lopez Moreno
FACT Effective urban planning and
management is perceived to be the most important driver creating a favourable environment for the prosperity of cities.
POLICy As a starting point,
urban planners must view urbanization as a positive phenomenon.
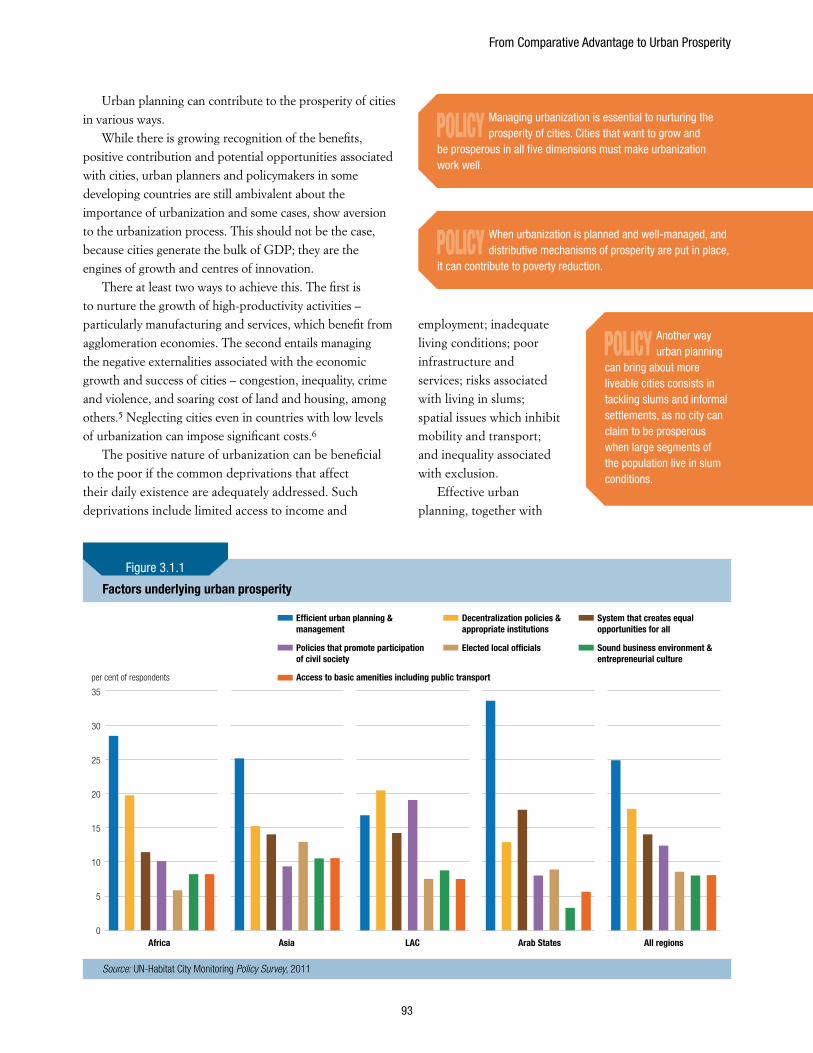
From Comparative Advantage to Urban Prosperity
93
Urban planning can contribute to the prosperity of cities in various ways.
While there is growing recognition of the benefits, positive contribution and potential opportunities associated with cities, urban planners and policymakers in some developing countries are still ambivalent about the importance of urbanization and some cases, show aversion to the urbanization process. This should not be the case, because cities generate the bulk of GDP; they are the engines of growth and centres of innovation.
There at least two ways to achieve this. The first is to nurture the growth of high-productivity activities – particularly manufacturing and services, which benefit from agglomeration economies. The second entails managing the negative externalities associated with the economic growth and success of cities – congestion, inequality, crime and violence, and soaring cost of land and housing, among others.5 Neglecting cities even in countries with low levels of urbanization can impose significant costs.6
The positive nature of urbanization can be beneficial to the poor if the common deprivations that affect their daily existence are adequately addressed. Such deprivations include limited access to income and
employment; inadequate living conditions; poor infrastructure and services; risks associated with living in slums; spatial issues which inhibit mobility and transport; and inequality associated with exclusion.
Effective urban planning, together with
Factors underlying urban prosperity
35
15
5
25
30
20
10
0
Policies that promote participation of civil society
Access to basic amenities including public transport
Elected local of�cials Sound business environment & entrepreneurial culture
Ef�cient urban planning & management
Decentralization policies & appropriate institutions
System that creates equal opportunities for all
Africa Asia LAC Arab States All regions
per cent of respondents
Source: UN-Habitat City Monitoring Policy Survey, 2011
Figure 3.1.1
POLICy Managing urbanization is essential to nurturing the prosperity of cities. Cities that want to grow and
be prosperous in all five dimensions must make urbanization work well.
POLICy When urbanization is planned and well-managed, and distributive mechanisms of prosperity are put in place,
it can contribute to poverty reduction.
POLICy Another way urban planning
can bring about more liveable cities consists in tackling slums and informal settlements, as no city can claim to be prosperous when large segments of the population live in slum conditions.
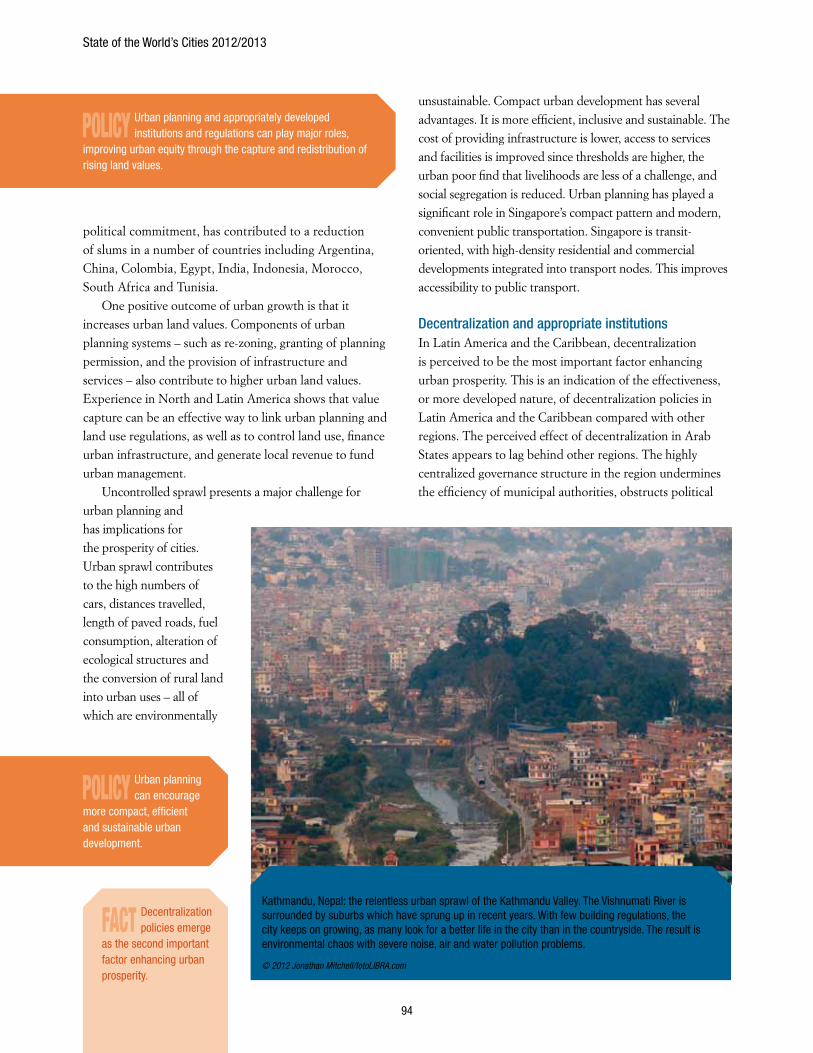
State of the World’s Cities 2012/2013
94
political commitment, has contributed to a reduction of slums in a number of countries including Argentina, China, Colombia, Egypt, India, Indonesia, Morocco, South Africa and Tunisia.
One positive outcome of urban growth is that it increases urban land values. Components of urban planning systems – such as re-zoning, granting of planning permission, and the provision of infrastructure and services – also contribute to higher urban land values. Experience in North and Latin America shows that value capture can be an effective way to link urban planning and land use regulations, as well as to control land use, finance urban infrastructure, and generate local revenue to fund urban management.
Uncontrolled sprawl presents a major challenge for urban planning and has implications for the prosperity of cities. Urban sprawl contributes to the high numbers of cars, distances travelled, length of paved roads, fuel consumption, alteration of ecological structures and the conversion of rural land into urban uses – all of which are environmentally
unsustainable. Compact urban development has several advantages. It is more efficient, inclusive and sustainable. The cost of providing infrastructure is lower, access to services and facilities is improved since thresholds are higher, the urban poor find that livelihoods are less of a challenge, and social segregation is reduced. Urban planning has played a significant role in Singapore’s compact pattern and modern, convenient public transportation. Singapore is transit-oriented, with high-density residential and commercial developments integrated into transport nodes. This improves accessibility to public transport.
Decentralization and appropriate institutionsIn Latin America and the Caribbean, decentralization is perceived to be the most important factor enhancing urban prosperity. This is an indication of the effectiveness, or more developed nature, of decentralization policies in Latin America and the Caribbean compared with other regions. The perceived effect of decentralization in Arab States appears to lag behind other regions. The highly centralized governance structure in the region undermines the efficiency of municipal authorities, obstructs political
POLICy Urban planning and appropriately developed institutions and regulations can play major roles,
improving urban equity through the capture and redistribution of rising land values.
POLICy Urban planning can encourage
more compact, efficient and sustainable urban development.
Kathmandu, Nepal: the relentless urban sprawl of the Kathmandu Valley. The Vishnumati River is surrounded by suburbs which have sprung up in recent years. With few building regulations, the city keeps on growing, as many look for a better life in the city than in the countryside. The result is environmental chaos with severe noise, air and water pollution problems.
© 2012 Jonathan Mitchell/fotoLIBRA.com
FACT Decentralization policies emerge
as the second important factor enhancing urban prosperity.
From Comparative Advantage to Urban Prosperity
95
participation and erodes the relationships between the citizenry and the level of government closest to them.7
Box 3.1 highlights how decentralization can play a key role in the prosperity of cities.
While the responsibilities of municipal governments have increased following reforms in recent years, many have no access to the financial resources needed to undertake these functions. This naturally creates a mismatch between responsibilities and financial resources, and is a major reason why decentralization has been less than successful in certain countries.
National reforms relating to various aspects of decentralization – revenue allocation, community participation, local elections, local planning, pro-urban development strategies – all provide the enabling environment for cities to prosper.
System that creates equal opportunitiesThe importance of this factor is most pronounced in Arabs States compared with other regions. This is because Arab States are one of the most egalitarian in terms of income distribution in the developing world. This is reflected in an overall (low) Gini coefficient of 0.36, which has been declining over time.9 The low degree of inequality in the region has been attributed to a strong, cohesive social system, and the fact that redistribution constitutes a policy priority in Islamic economies.10
A system that creates equal opportunities for all can use redistributive policies that give priority to low-income groups and areas. In Venezuela, the government has used redistributive policies to bring significant improvements to the living standards of the urban poor through massive investment in health and education.11 With the provision of over 8,000 clinics in the barrios, people are able to access health services 24 hours a day at no cost. Similarly, illiteracy has been eliminated, pupils are no longer restricted to elementary school, and those with the required academic qualifications can attend university.
Another form of redistribution policy involves conditional cash transfers. These enhance the human capital of beneficiaries through transfers which are made
Decentralization and the prosperity of cities
A major benefit of decentralization as it relates to the prosperity of cities is that delivery of essential services such as water, sanitation and waste management, health and education can be carried out more effectively. Decentralization can make for better service delivery by providing greater opportunities for community-based groups to lobby for improved services. Proximity to physical demand for a service encourages effectiveness and promotes a more rational use of resources, while also allowing for closer monitoring by the beneficiary population of projects intended to serve them.
The devolution of authority can foster community participation, too. Decentralization can lead to an institutional framework through which various political, religious, social, ethnic groups and multi-levels including towns and cities, can participate in making decisions that will affect them.
Decentralized decision-making can provide a better framework for poverty reduction, so long as it is accompanied by fiscal devolution of powers to municipal authorities.
Decentralization can accelerate economic development through active engagement of regional and municipal government units and local enterprises in economic activities. The transfer of authority and resources to local units of government and administration to design and implement programmes provides more opportunities for local citizens to play a more direct role in the development process. As catalysts for development and local change agents, they can make decisions about location of services and determine priorities.
Source: UN-Habitat (2012) Decentralization in Iraq: Challenges and Solutions for Federal and Local Governments, Nairobi: UN-Habitat
Box 3.1.1
POLICy For decentralization to strengthen urban authorities’ commitment to urban prosperity, it must be backed by
fiscal devolution.
POLICy For a city to be truly prosperous, it must deploy systems that will ensure equal opportunities for all,
especially the more vulnerable – the poor, women, children, the elderly, youth and the disabled. A prosperous city is one where the aspirations of all segments of the population are realized. Highly unequal cities are a ticking time bomb waiting to explode.
POLICy Decentralization works well
when backed by strong commitment and support from central government.8
FACT A system that guarantees equal
opportunities for all is the third important factor underlying the prosperity of cities. The more egalitarian a city, the more prosperous it becomes.
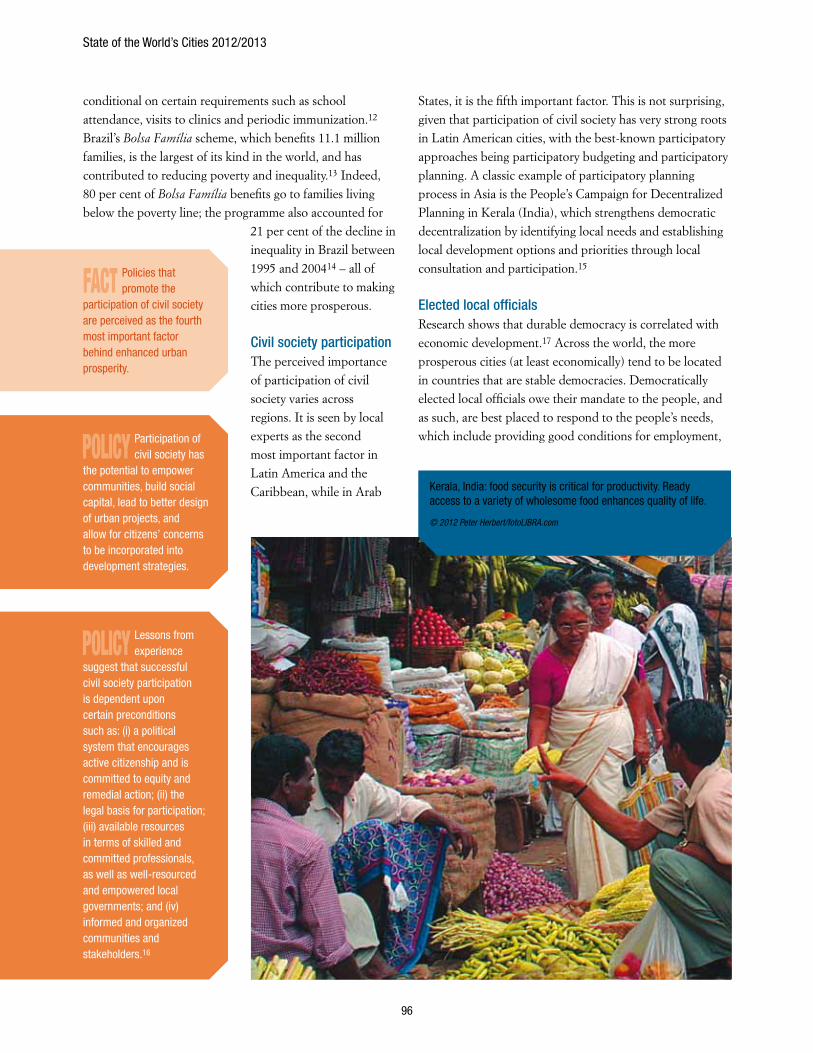
State of the World’s Cities 2012/2013
96
conditional on certain requirements such as school attendance, visits to clinics and periodic immunization.12 Brazil’s Bolsa Família scheme, which benefits 11.1 million families, is the largest of its kind in the world, and has contributed to reducing poverty and inequality.13 Indeed, 80 per cent of Bolsa Família benefits go to families living below the poverty line; the programme also accounted for
21 per cent of the decline in inequality in Brazil between 1995 and 200414 – all of which contribute to making cities more prosperous.
Civil society participation The perceived importance of participation of civil society varies across regions. It is seen by local experts as the second most important factor in Latin America and the Caribbean, while in Arab
States, it is the fifth important factor. This is not surprising, given that participation of civil society has very strong roots in Latin American cities, with the best-known participatory approaches being participatory budgeting and participatory planning. A classic example of participatory planning process in Asia is the People’s Campaign for Decentralized Planning in Kerala (India), which strengthens democratic decentralization by identifying local needs and establishing local development options and priorities through local consultation and participation.15
Elected local officialsResearch shows that durable democracy is correlated with economic development.17 Across the world, the more prosperous cities (at least economically) tend to be located in countries that are stable democracies. Democratically elected local officials owe their mandate to the people, and as such, are best placed to respond to the people’s needs, which include providing good conditions for employment, POLICy Participation of
civil society has the potential to empower communities, build social capital, lead to better design of urban projects, and allow for citizens’ concerns to be incorporated into development strategies.
POLICy Lessons from experience
suggest that successful civil society participation is dependent upon certain preconditions such as: (i) a political system that encourages active citizenship and is committed to equity and remedial action; (ii) the legal basis for participation; (iii) available resources in terms of skilled and committed professionals, as well as well-resourced and empowered local governments; and (iv) informed and organized communities and stakeholders.16
FACT Policies that promote the
participation of civil society are perceived as the fourth most important factor behind enhanced urban prosperity.
Kerala, India: food security is critical for productivity. Ready access to a variety of wholesome food enhances quality of life.
© 2012 Peter Herbert/fotoLIBRA.com
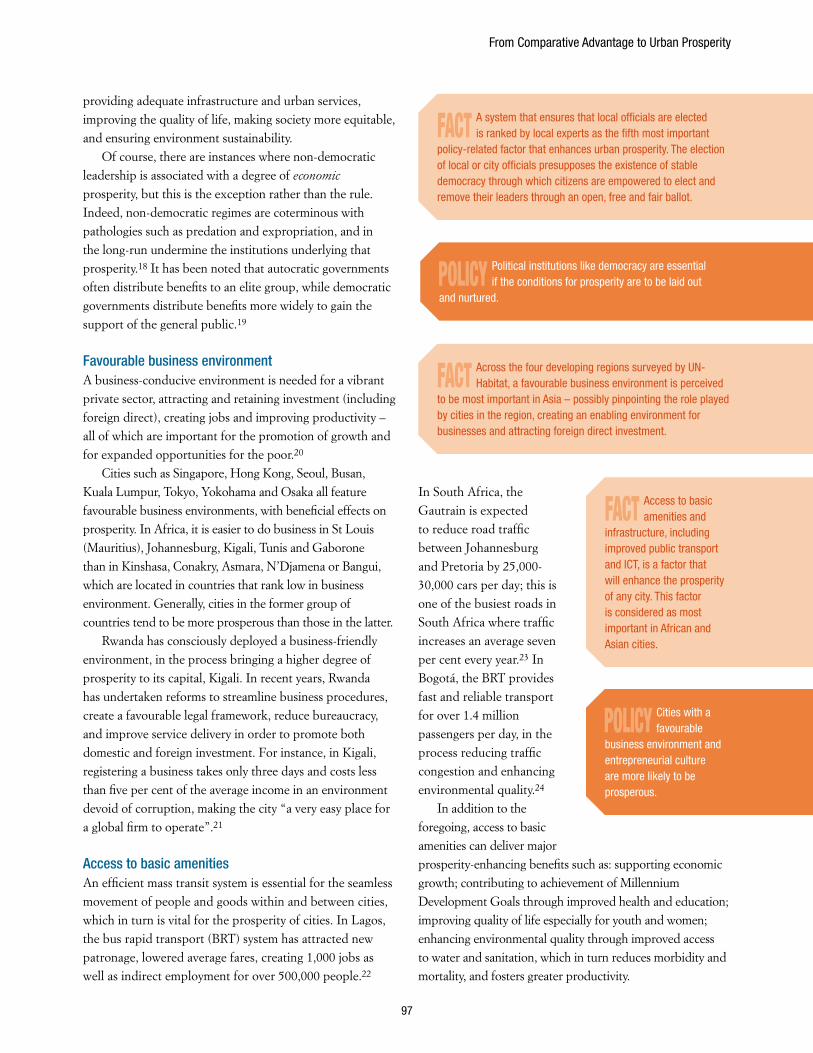
From Comparative Advantage to Urban Prosperity
97
providing adequate infrastructure and urban services, improving the quality of life, making society more equitable, and ensuring environment sustainability.
Of course, there are instances where non-democratic leadership is associated with a degree of economic prosperity, but this is the exception rather than the rule. Indeed, non-democratic regimes are coterminous with pathologies such as predation and expropriation, and in the long-run undermine the institutions underlying that prosperity.18 It has been noted that autocratic governments often distribute benefits to an elite group, while democratic governments distribute benefits more widely to gain the support of the general public.19
Favourable business environmentA business-conducive environment is needed for a vibrant private sector, attracting and retaining investment (including foreign direct), creating jobs and improving productivity – all of which are important for the promotion of growth and for expanded opportunities for the poor.20
Cities such as Singapore, Hong Kong, Seoul, Busan, Kuala Lumpur, Tokyo, Yokohama and Osaka all feature favourable business environments, with beneficial effects on prosperity. In Africa, it is easier to do business in St Louis (Mauritius), Johannesburg, Kigali, Tunis and Gaborone than in Kinshasa, Conakry, Asmara, N’Djamena or Bangui, which are located in countries that rank low in business environment. Generally, cities in the former group of countries tend to be more prosperous than those in the latter.
Rwanda has consciously deployed a business-friendly environment, in the process bringing a higher degree of prosperity to its capital, Kigali. In recent years, Rwanda has undertaken reforms to streamline business procedures, create a favourable legal framework, reduce bureaucracy, and improve service delivery in order to promote both domestic and foreign investment. For instance, in Kigali, registering a business takes only three days and costs less than five per cent of the average income in an environment devoid of corruption, making the city “a very easy place for a global firm to operate”.21
Access to basic amenitiesAn efficient mass transit system is essential for the seamless movement of people and goods within and between cities, which in turn is vital for the prosperity of cities. In Lagos, the bus rapid transport (BRT) system has attracted new patronage, lowered average fares, creating 1,000 jobs as well as indirect employment for over 500,000 people.22
In South Africa, the Gautrain is expected to reduce road traffic between Johannesburg and Pretoria by 25,000-30,000 cars per day; this is one of the busiest roads in South Africa where traffic increases an average seven per cent every year.23 In Bogotá, the BRT provides fast and reliable transport for over 1.4 million passengers per day, in the process reducing traffic congestion and enhancing environmental quality.24
In addition to the foregoing, access to basic amenities can deliver major prosperity-enhancing benefits such as: supporting economic growth; contributing to achievement of Millennium Development Goals through improved health and education; improving quality of life especially for youth and women; enhancing environmental quality through improved access to water and sanitation, which in turn reduces morbidity and mortality, and fosters greater productivity.
POLICy Cities with a favourable
business environment and entrepreneurial culture are more likely to be prosperous.
POLICy Political institutions like democracy are essential if the conditions for prosperity are to be laid out
and nurtured.
FACT A system that ensures that local officials are elected is ranked by local experts as the fifth most important
policy-related factor that enhances urban prosperity. The election of local or city officials presupposes the existence of stable democracy through which citizens are empowered to elect and remove their leaders through an open, free and fair ballot.
FACT Across the four developing regions surveyed by UN-Habitat, a favourable business environment is perceived
to be most important in Asia – possibly pinpointing the role played by cities in the region, creating an enabling environment for businesses and attracting foreign direct investment.
FACT Access to basic amenities and
infrastructure, including improved public transport and ICT, is a factor that will enhance the prosperity of any city. This factor is considered as most important in African and Asian cities.
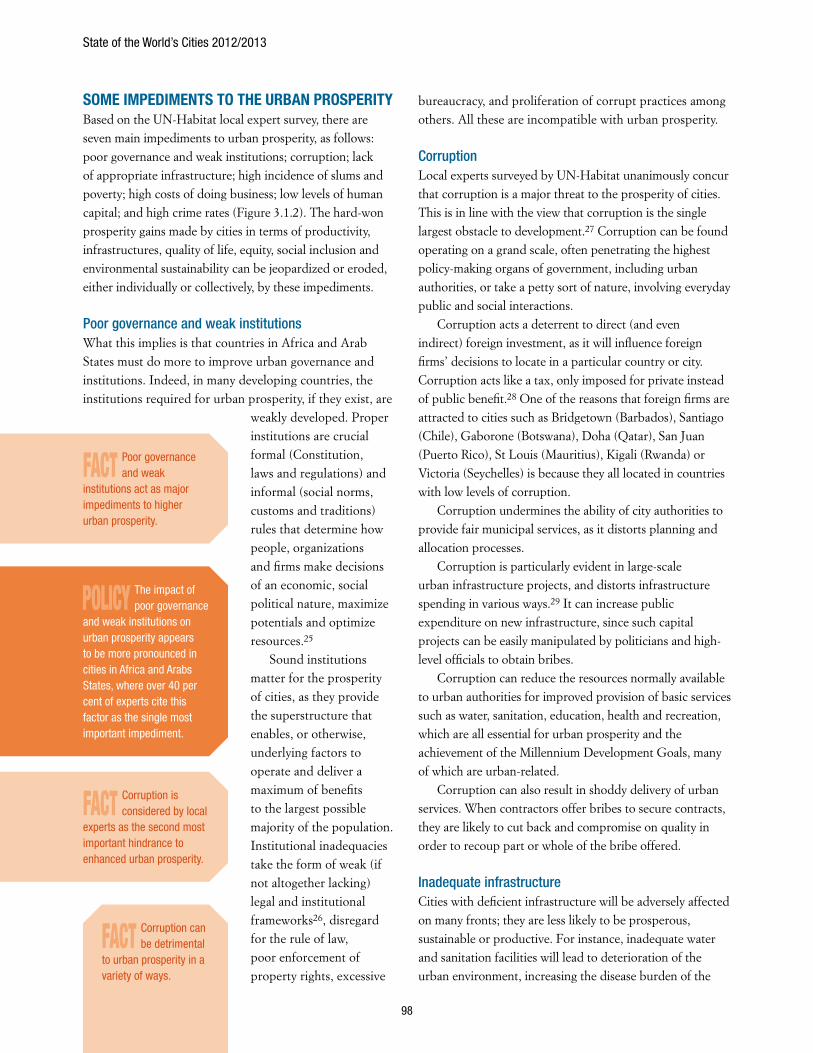
State of the World’s Cities 2012/2013
98
SOME IMPEDIMENTS TO THE URBAN PROSPERITy Based on the UN-Habitat local expert survey, there are seven main impediments to urban prosperity, as follows: poor governance and weak institutions; corruption; lack of appropriate infrastructure; high incidence of slums and poverty; high costs of doing business; low levels of human capital; and high crime rates (Figure 3.1.2). The hard-won prosperity gains made by cities in terms of productivity, infrastructures, quality of life, equity, social inclusion and environmental sustainability can be jeopardized or eroded, either individually or collectively, by these impediments.
Poor governance and weak institutionsWhat this implies is that countries in Africa and Arab States must do more to improve urban governance and institutions. Indeed, in many developing countries, the institutions required for urban prosperity, if they exist, are
weakly developed. Proper institutions are crucial formal (Constitution, laws and regulations) and informal (social norms, customs and traditions) rules that determine how people, organizations and firms make decisions of an economic, social political nature, maximize potentials and optimize resources.25
Sound institutions matter for the prosperity of cities, as they provide the superstructure that enables, or otherwise, underlying factors to operate and deliver a maximum of benefits to the largest possible majority of the population. Institutional inadequacies take the form of weak (if not altogether lacking) legal and institutional frameworks26, disregard for the rule of law, poor enforcement of property rights, excessive
bureaucracy, and proliferation of corrupt practices among others. All these are incompatible with urban prosperity.
CorruptionLocal experts surveyed by UN-Habitat unanimously concur that corruption is a major threat to the prosperity of cities. This is in line with the view that corruption is the single largest obstacle to development.27 Corruption can be found operating on a grand scale, often penetrating the highest policy-making organs of government, including urban authorities, or take a petty sort of nature, involving everyday public and social interactions.
Corruption acts a deterrent to direct (and even indirect) foreign investment, as it will influence foreign firms’ decisions to locate in a particular country or city. Corruption acts like a tax, only imposed for private instead of public benefit.28 One of the reasons that foreign firms are attracted to cities such as Bridgetown (Barbados), Santiago (Chile), Gaborone (Botswana), Doha (Qatar), San Juan (Puerto Rico), St Louis (Mauritius), Kigali (Rwanda) or Victoria (Seychelles) is because they all located in countries with low levels of corruption.
Corruption undermines the ability of city authorities to provide fair municipal services, as it distorts planning and allocation processes.
Corruption is particularly evident in large-scale urban infrastructure projects, and distorts infrastructure spending in various ways.29 It can increase public expenditure on new infrastructure, since such capital projects can be easily manipulated by politicians and high-level officials to obtain bribes.
Corruption can reduce the resources normally available to urban authorities for improved provision of basic services such as water, sanitation, education, health and recreation, which are all essential for urban prosperity and the achievement of the Millennium Development Goals, many of which are urban-related.
Corruption can also result in shoddy delivery of urban services. When contractors offer bribes to secure contracts, they are likely to cut back and compromise on quality in order to recoup part or whole of the bribe offered.
Inadequate infrastructureCities with deficient infrastructure will be adversely affected on many fronts; they are less likely to be prosperous, sustainable or productive. For instance, inadequate water and sanitation facilities will lead to deterioration of the urban environment, increasing the disease burden of the
FACT Poor governance and weak
institutions act as major impediments to higher urban prosperity.
FACT Corruption is considered by local
experts as the second most important hindrance to enhanced urban prosperity.
POLICy The impact of poor governance
and weak institutions on urban prosperity appears to be more pronounced in cities in Africa and Arabs States, where over 40 per cent of experts cite this factor as the single most important impediment.
FACT Corruption can be detrimental
to urban prosperity in a variety of ways.
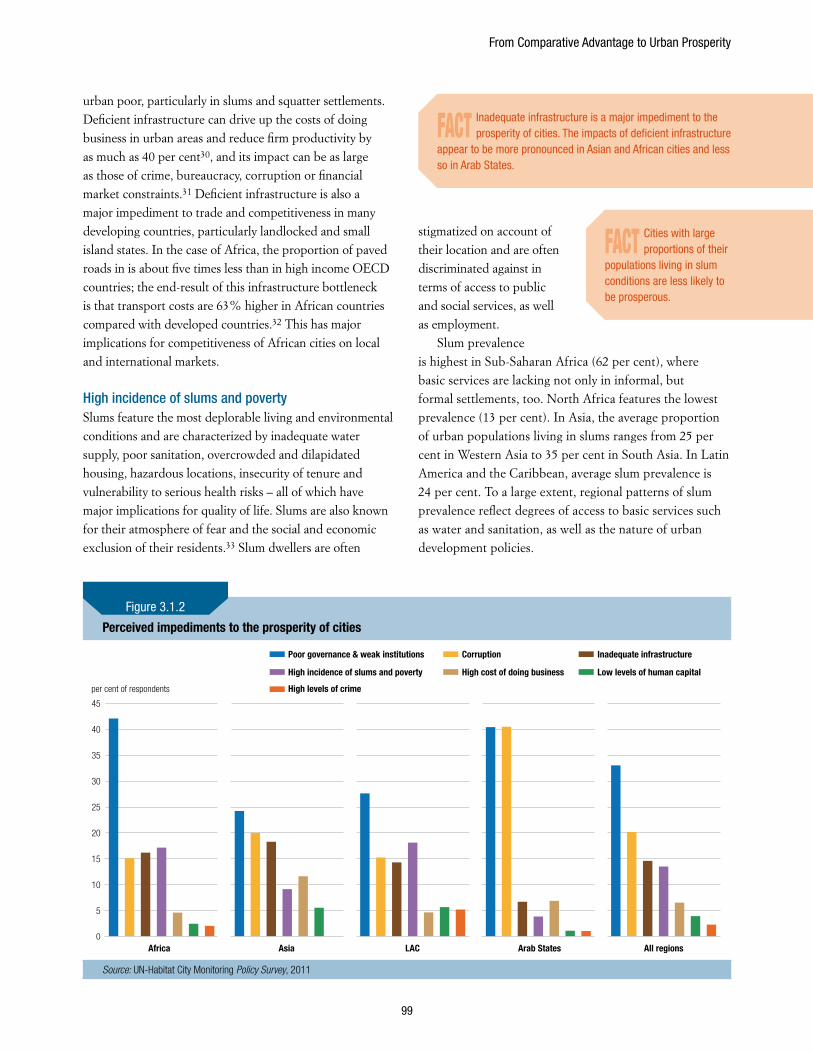
From Comparative Advantage to Urban Prosperity
99
urban poor, particularly in slums and squatter settlements. Deficient infrastructure can drive up the costs of doing business in urban areas and reduce firm productivity by as much as 40 per cent30, and its impact can be as large as those of crime, bureaucracy, corruption or financial market constraints.31 Deficient infrastructure is also a major impediment to trade and competitiveness in many developing countries, particularly landlocked and small island states. In the case of Africa, the proportion of paved roads in is about five times less than in high income OECD countries; the end-result of this infrastructure bottleneck is that transport costs are 63% higher in African countries compared with developed countries.32 This has major implications for competitiveness of African cities on local and international markets.
High incidence of slums and povertySlums feature the most deplorable living and environmental conditions and are characterized by inadequate water supply, poor sanitation, overcrowded and dilapidated housing, hazardous locations, insecurity of tenure and vulnerability to serious health risks – all of which have major implications for quality of life. Slums are also known for their atmosphere of fear and the social and economic exclusion of their residents.33 Slum dwellers are often
stigmatized on account of their location and are often discriminated against in terms of access to public and social services, as well as employment.
Slum prevalence is highest in Sub-Saharan Africa (62 per cent), where basic services are lacking not only in informal, but formal settlements, too. North Africa features the lowest prevalence (13 per cent). In Asia, the average proportion of urban populations living in slums ranges from 25 per cent in Western Asia to 35 per cent in South Asia. In Latin America and the Caribbean, average slum prevalence is 24 per cent. To a large extent, regional patterns of slum prevalence reflect degrees of access to basic services such as water and sanitation, as well as the nature of urban development policies.
Perceived impediments to the prosperity of cities
45
40
15
5
25
35
30
20
10
0
High incidence of slums and poverty
High levels of crime
High cost of doing business Low levels of human capital
Poor governance & weak institutions Corruption Inadequate infrastructure
Africa Asia LAC Arab States All regions
per cent of respondents
Source: UN-Habitat City Monitoring Policy Survey, 2011
Figure 3.1.2
FACT Inadequate infrastructure is a major impediment to the prosperity of cities. The impacts of deficient infrastructure
appear to be more pronounced in Asian and African cities and less so in Arab States.
FACT Cities with large proportions of their
populations living in slum conditions are less likely to be prosperous.
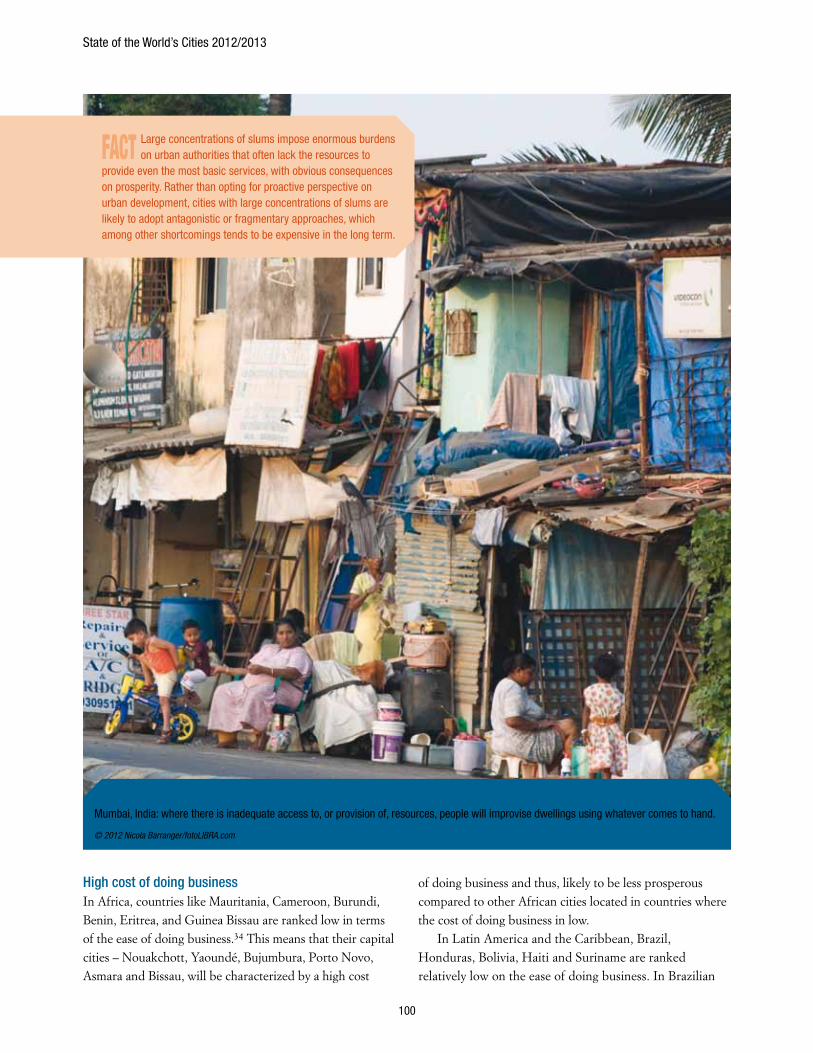
State of the World’s Cities 2012/2013
100
High cost of doing businessIn Africa, countries like Mauritania, Cameroon, Burundi, Benin, Eritrea, and Guinea Bissau are ranked low in terms of the ease of doing business.34 This means that their capital cities – Nouakchott, Yaoundé, Bujumbura, Porto Novo, Asmara and Bissau, will be characterized by a high cost
of doing business and thus, likely to be less prosperous compared to other African cities located in countries where the cost of doing business in low.
In Latin America and the Caribbean, Brazil, Honduras, Bolivia, Haiti and Suriname are ranked relatively low on the ease of doing business. In Brazilian
Mumbai, India: where there is inadequate access to, or provision of, resources, people will improvise dwellings using whatever comes to hand.
© 2012 Nicola Barranger/fotoLIBRA.com
FACT Large concentrations of slums impose enormous burdens on urban authorities that often lack the resources to
provide even the most basic services, with obvious consequences on prosperity. Rather than opting for proactive perspective on urban development, cities with large concentrations of slums are likely to adopt antagonistic or fragmentary approaches, which among other shortcomings tends to be expensive in the long term.
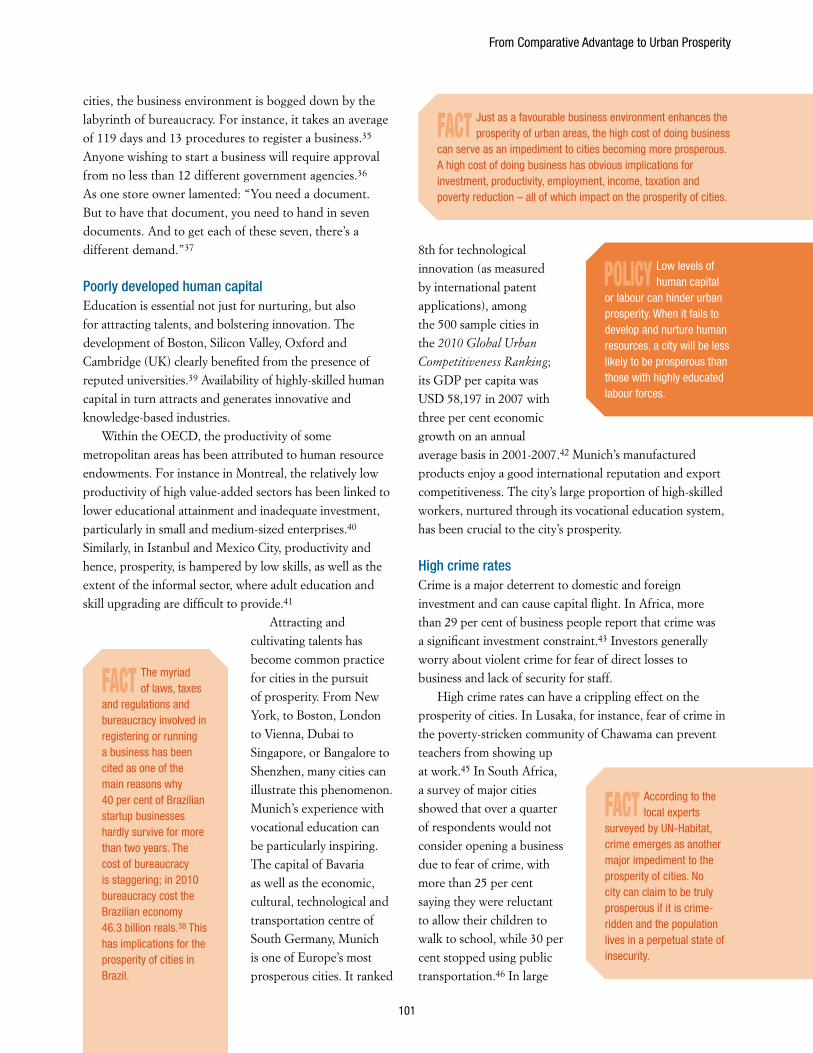
From Comparative Advantage to Urban Prosperity
101
cities, the business environment is bogged down by the labyrinth of bureaucracy. For instance, it takes an average of 119 days and 13 procedures to register a business.35 Anyone wishing to start a business will require approval from no less than 12 different government agencies.36 As one store owner lamented: “You need a document. But to have that document, you need to hand in seven documents. And to get each of these seven, there’s a different demand.”37
Poorly developed human capitalEducation is essential not just for nurturing, but also for attracting talents, and bolstering innovation. The development of Boston, Silicon Valley, Oxford and Cambridge (UK) clearly benefited from the presence of reputed universities.39 Availability of highly-skilled human capital in turn attracts and generates innovative and knowledge-based industries.
Within the OECD, the productivity of some metropolitan areas has been attributed to human resource endowments. For instance in Montreal, the relatively low productivity of high value-added sectors has been linked to lower educational attainment and inadequate investment, particularly in small and medium-sized enterprises.40 Similarly, in Istanbul and Mexico City, productivity and hence, prosperity, is hampered by low skills, as well as the extent of the informal sector, where adult education and skill upgrading are difficult to provide.41
Attracting and cultivating talents has become common practice for cities in the pursuit of prosperity. From New York, to Boston, London to Vienna, Dubai to Singapore, or Bangalore to Shenzhen, many cities can illustrate this phenomenon. Munich’s experience with vocational education can be particularly inspiring. The capital of Bavaria as well as the economic, cultural, technological and transportation centre of South Germany, Munich is one of Europe’s most prosperous cities. It ranked
8th for technological innovation (as measured by international patent applications), among the 500 sample cities in the 2010 Global Urban
Competitiveness Ranking; its GDP per capita was USD 58,197 in 2007 with three per cent economic growth on an annual average basis in 2001-2007.42 Munich’s manufactured products enjoy a good international reputation and export competitiveness. The city’s large proportion of high-skilled workers, nurtured through its vocational education system, has been crucial to the city’s prosperity.
High crime ratesCrime is a major deterrent to domestic and foreign investment and can cause capital flight. In Africa, more than 29 per cent of business people report that crime was a significant investment constraint.43 Investors generally worry about violent crime for fear of direct losses to business and lack of security for staff.
High crime rates can have a crippling effect on the prosperity of cities. In Lusaka, for instance, fear of crime in the poverty-stricken community of Chawama can prevent teachers from showing up at work.45 In South Africa, a survey of major cities showed that over a quarter of respondents would not consider opening a business due to fear of crime, with more than 25 per cent saying they were reluctant to allow their children to walk to school, while 30 per cent stopped using public transportation.46 In large
FACT Just as a favourable business environment enhances the prosperity of urban areas, the high cost of doing business
can serve as an impediment to cities becoming more prosperous. A high cost of doing business has obvious implications for investment, productivity, employment, income, taxation and poverty reduction – all of which impact on the prosperity of cities.
FACT The myriad of laws, taxes
and regulations and bureaucracy involved in registering or running a business has been cited as one of the main reasons why 40 per cent of Brazilian startup businesses hardly survive for more than two years. The cost of bureaucracy is staggering; in 2010 bureaucracy cost the Brazilian economy 46.3 billion reals.38 This has implications for the prosperity of cities in Brazil.
POLICy Low levels of human capital
or labour can hinder urban prosperity. When it fails to develop and nurture human resources, a city will be less likely to be prosperous than those with highly educated labour forces.
FACT According to the local experts
surveyed by UN-Habitat, crime emerges as another major impediment to the prosperity of cities. No city can claim to be truly prosperous if it is crime-ridden and the population lives in a perpetual state of insecurity.
State of the World’s Cities 2012/2013
102
Latin America cities, high numbers of murders deter people from working evenings and at night.47
All these factors have implications for local economies, quality of life and the attractiveness of public spaces, on top of lost opportunities for socioeconomic advancement that are so crucial for the prosperity of cities.
Endnotes
1 UN-Habitat (2008) State of the World’s Cities Report 2008/09: Harmonious Cities, Earthscan, London.
2 Shabou, A., N. Soboh, K. Jalouka, and D. A. Thaib (2011) City Report on Aqaba, Unpublished UN-Habitat background study for “State of the World’s Cities Report 2012/2013”
3 UN-Habitat (2008) op.cit.
4 Costas, S. (2011) Urban Tourism and Urban Change: Cities in a Global Economy, New York, Routledge
5 Spence, M (2008) “Preface”, in Urbanization and Growth, Spence M. , P.C. Annez., and R. Buckley (eds.), Commission on Growth and Development, World Bank, Washington DC.
6 Annez, P.C. and R. Buckley (2008) “Urbanization and growth: Setting the context”, in Urbanization and Growth, Spence M. , P.C. Annez., and R. Buckley (eds.), Commission on Growth and Development, World Bank, Washington DC.
7 UN-Habitat (2012) The State of Arab Cities 2012: Challenges of Urban Transition, UN-Habitat, Nairobi.
8 UN-Habitat (2006) State of the World’s Cities 2006/07, Earthscan, London.
9 UN-Habitat (2004) State of the World’s Cities 2004/05, Earthscan, London.
10 Ibid.
11 Scipes, K. (2006) ‘Venezuela and South Africa: Redistributive policies vs. neo-liberal economic policies’, Third World Traveler, http://www.thirdworldtraveler.com/Venezuela_page/Venez_SAfrica_EconPolicies.html
12 Hailu, D. and F. V. Soares(2008) ‘Cash transfers in Africa and Latin America: An overview”, Poverty in Focus, Number 15, International Policy Centre for Inclusive Growth, Brasilia, pp: 3-5.
13 Britto, T (2008) ‘Brazil’s Bolsa Família: Understanding its origins and challenges’, Poverty in Focus, Number 15, International Policy Centre for Inclusive Growth, Brasilia, pp: 6-7.
14 Soares, F. V., S. Soares, M .Medeiros, , and R. G. Osório, (2006) ‘Cash transfer programmes in Brazil: Impacts on inequality and poverty‘ , International Policy Centre for Inclusive Growth working Paper, Number 21, International Poverty Centre Brasilia
15 UN-Habitat (2009) Planning Sustainable Cities: Global Report on Human Settlements 2009. Earthscan, London
16 UN-Habitat(2009) op. cit.
17 Sharma, S. (2005) ‘Democracy, good governance, and economic development’, Taiwan Journal of Democracy, vol 3 (1), pp: 29-62.
18 Sharma, S. (2005) op. cit.
19 Holcombe, R. G. (2012) ‘Democracy and Prosperity,’ in Young, B. C. (ed.) Institutional Economics and National Competitiveness, Routledge, London
20 World Bank and International Finance Corporation (2011) Doing Business 2012: Doing Business in a More Transparent World, World Bank.Washington DC
21 The Economist (2012) ‘Business in Rwanda: Africa’s Singapore?’, The Economist, February 25, http://www.economist.com/node/21548263
22 World Bank (2009) Getting people and traffic moving again in Lagos, http://web.worldbank.org/WBSITE/EXTERNAL/EXTABOUTUS/IDA/0,,contentMDK:22229765~menuPK:4754051~pagePK:51236175~piPK:437394~theSitePK:73154,00.html
23 BBC (2011) ‘South Africa Gautrain opens Johannesburg-Pretoria route’, BBC News, August 2, http://www.bbc.co.uk/news/world-africa-14371113
24 Hidalgo, D.(2008) ‘Why is TransMilenio still so special?’, The City Fix, August 5, http://thecityfix.com/blog/why-is-transmilenio-still-so-special/
25 Sharma, S. (2005) op. cit.
26 Oyeyinka, B. O. (2012) ‘Institutional capacity and policy for latecomer technology development’, International Journal of Technological Learning, Innovation and Development, Vol. 5, (1/2), pp. 85-110.
27 UN-Habitat (2007) Enhancing Urban Safety and Security: Global Report on Human Settlements 2007,Earthscan, London
28 Dong, B and Torgler, (2010) The Consequences of Corruption: Evidence from China, Center for in Economics, Management and the Arts Working Paper No. 2010-06, http://www.crema-research.ch/papers/2010-06.pdf
29 Arimah, B. C. (2005) ‘What drives infrastructure spending in cities of developing countries?’, Urban Studies, Vol 42 (8), pp. 1345-1368
30 Escribano, A. ,J.L. Guasch, and J. Pena (2008) ‘Impact of Infrastructure Constraints on Firm Productivity in Africa, Africa Infrastructure Diagnostic Study Working Paper 9, World Bank, Washington, DC.
31 Foster, V., and C. Briceno-Garmendia (2010) Africa’s Infrastructure: A Time for Transformation, World Bank, Washington, DC.
32 African Economic Outlook (2012) Progress in Infrastructure Developments, http://www.africaneconomicoutlook.org/en/outlook/trade_policies/progress-in-infrastructure-developments/
33 Bloom, D. E., D. Canning, and G. Fink (2008) ‘Urbanization and the wealth of nations’, Science, Vol. 319, pp. 772 - 775.
34 World Bank and International Finance Corporation (2011) op. cit.
35 Ibid.
36 Gomes, L . (2012) ‘Brazil’s labyrinth of bureaucracy’, BBC News, May 16, http://www.bbc.co.uk/news/business-18020623
37 Ibid.
38 Gomes (2012) op.cit.
39 Pengfei, Ni (2011) Driving factors of Prosperity: An Empirical Analysis Global Cities, background paper for ‘State of the World Cities Report 2012/13’
40 OECD (2006) Competitive Cities in the Global Economy, OECD, Paris
41 Ibid.
42 Pengfei, Ni (2011) op. cit.
43 UNODC (2005) Crime and Development in Africa, http://www.unodc.org/pdf/African_report.pdf
44 Moser, C. , A.Winton, and A.Moser (2005) ‘Violence, Fear among the Urban Poor in Latin America’ In The Urban Poor in Latin America, Fay, M (ed.) World Bank, Washington, DC.
45 Moser, C. O. N. and J. Holland (1997) ‘Confronting crisis in Chawama, Lusaka Zambia’, Household Responses to Poverty and Vulnerability, Vol 4, Urban Programme Management Policy Paper 24, World Bank, Washington, DC.
46 UNODC (2005) op.cit.
47 Hamermesh, D. S. (1998) Crime and the Timing of Work, National Bureau of Economic Research Working Paper 6613,NBER, Boston
FACT In Latin America, the financial burden of violent crime is equivalent to 25 per cent of GDP in Colombia and
El Salvador; 12 per cent in Mexico and Venezuela; 11 per cent in Brazil; and five per cent in Peru.44 In Jamaica, crime has a pernicious effect on national tourism and is often cited as a major reason for the country’s weak economy.
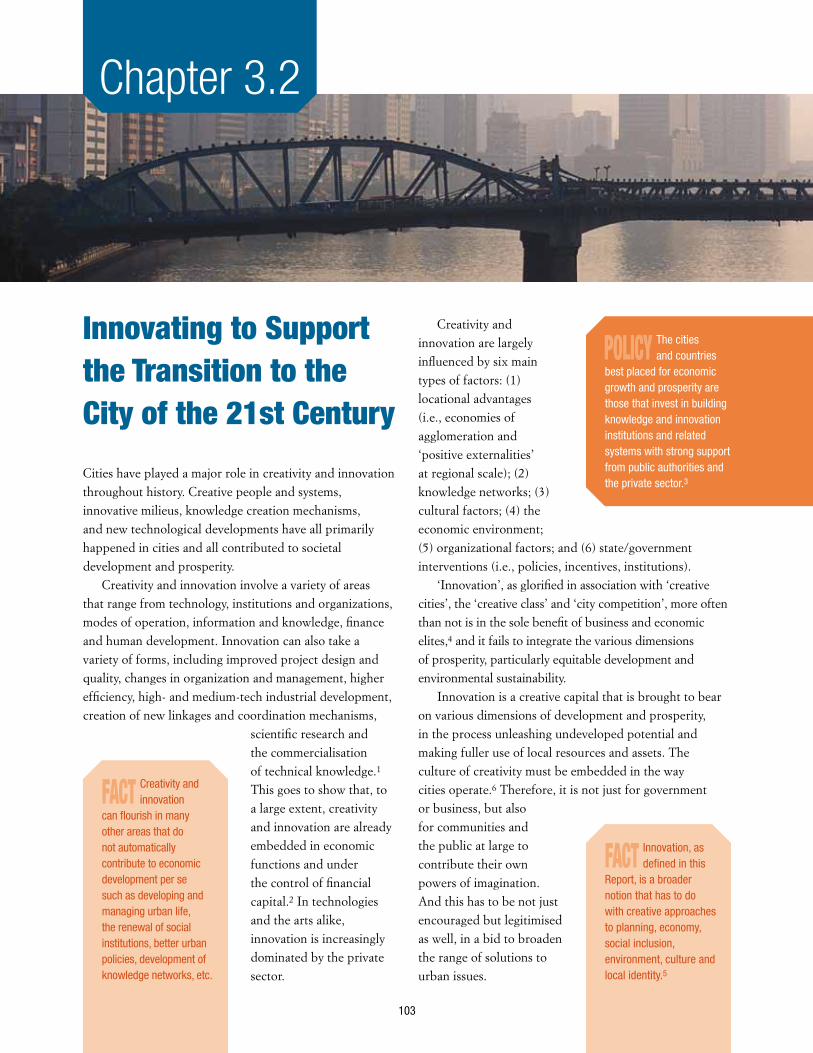
103
Innovating to Support the Transition to the City of the 21st Century
Cities have played a major role in creativity and innovation throughout history. Creative people and systems, innovative milieus, knowledge creation mechanisms, and new technological developments have all primarily happened in cities and all contributed to societal development and prosperity.
Creativity and innovation involve a variety of areas that range from technology, institutions and organizations, modes of operation, information and knowledge, finance and human development. Innovation can also take a variety of forms, including improved project design and quality, changes in organization and management, higher efficiency, high- and medium-tech industrial development, creation of new linkages and coordination mechanisms,
scientific research and the commercialisation of technical knowledge.1 This goes to show that, to a large extent, creativity and innovation are already embedded in economic functions and under the control of financial capital.2 In technologies and the arts alike, innovation is increasingly dominated by the private sector.
Creativity and innovation are largely influenced by six main types of factors: (1) locational advantages (i.e., economies of agglomeration and ‘positive externalities’ at regional scale); (2) knowledge networks; (3) cultural factors; (4) the economic environment; (5) organizational factors; and (6) state/government interventions (i.e., policies, incentives, institutions).
‘Innovation’, as glorified in association with ‘creative cities’, the ‘creative class’ and ‘city competition’, more often than not is in the sole benefit of business and economic elites,4 and it fails to integrate the various dimensions of prosperity, particularly equitable development and environmental sustainability.
Innovation is a creative capital that is brought to bear on various dimensions of development and prosperity, in the process unleashing undeveloped potential and making fuller use of local resources and assets. The culture of creativity must be embedded in the way cities operate.6 Therefore, it is not just for government or business, but also for communities and the public at large to contribute their own powers of imagination. And this has to be not just encouraged but legitimised as well, in a bid to broaden the range of solutions to urban issues.
Chapter 3.2
FACT Creativity and innovation
can flourish in many other areas that do not automatically contribute to economic development per se such as developing and managing urban life, the renewal of social institutions, better urban policies, development of knowledge networks, etc.
FACT Innovation, as defined in this
Report, is a broader notion that has to do with creative approaches to planning, economy, social inclusion, environment, culture and local identity.5
POLICy The cities and countries
best placed for economic growth and prosperity are those that invest in building knowledge and innovation institutions and related systems with strong support from public authorities and the private sector.3
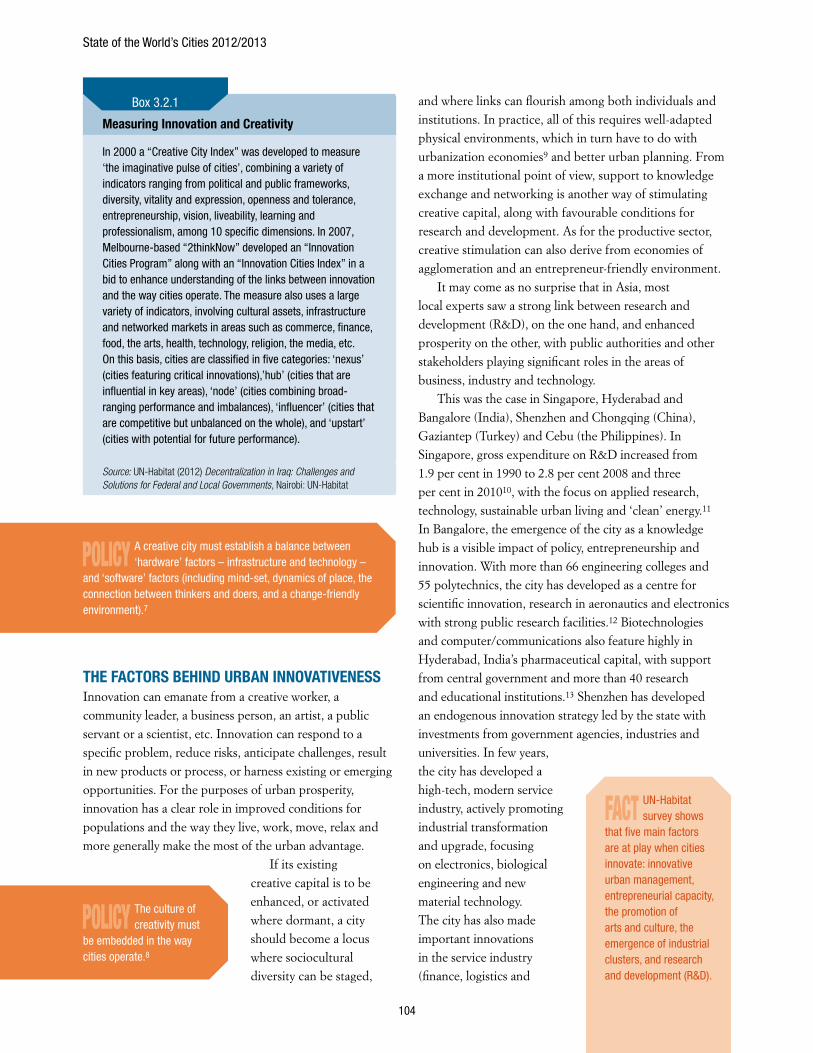
State of the World’s Cities 2012/2013
104
THE FACTORS BEHIND URBAN INNOvATIvENESS Innovation can emanate from a creative worker, a community leader, a business person, an artist, a public servant or a scientist, etc. Innovation can respond to a specific problem, reduce risks, anticipate challenges, result in new products or process, or harness existing or emerging opportunities. For the purposes of urban prosperity, innovation has a clear role in improved conditions for populations and the way they live, work, move, relax and more generally make the most of the urban advantage.
If its existing creative capital is to be enhanced, or activated where dormant, a city should become a locus where sociocultural diversity can be staged,
and where links can flourish among both individuals and institutions. In practice, all of this requires well-adapted physical environments, which in turn have to do with urbanization economies9 and better urban planning. From a more institutional point of view, support to knowledge exchange and networking is another way of stimulating creative capital, along with favourable conditions for research and development. As for the productive sector, creative stimulation can also derive from economies of agglomeration and an entrepreneur-friendly environment.
It may come as no surprise that in Asia, most local experts saw a strong link between research and development (R&D), on the one hand, and enhanced prosperity on the other, with public authorities and other stakeholders playing significant roles in the areas of business, industry and technology.
This was the case in Singapore, Hyderabad and Bangalore (India), Shenzhen and Chongqing (China), Gaziantep (Turkey) and Cebu (the Philippines). In Singapore, gross expenditure on R&D increased from 1.9 per cent in 1990 to 2.8 per cent 2008 and three per cent in 201010, with the focus on applied research, technology, sustainable urban living and ‘clean’ energy.11 In Bangalore, the emergence of the city as a knowledge hub is a visible impact of policy, entrepreneurship and innovation. With more than 66 engineering colleges and 55 polytechnics, the city has developed as a centre for scientific innovation, research in aeronautics and electronics with strong public research facilities.12 Biotechnologies and computer/communications also feature highly in Hyderabad, India’s pharmaceutical capital, with support from central government and more than 40 research and educational institutions.13 Shenzhen has developed an endogenous innovation strategy led by the state with investments from government agencies, industries and universities. In few years, the city has developed a high-tech, modern service industry, actively promoting industrial transformation and upgrade, focusing on electronics, biological engineering and new material technology. The city has also made important innovations in the service industry (finance, logistics and
Measuring Innovation and Creativity
In 2000 a “Creative City Index” was developed to measure ‘the imaginative pulse of cities’, combining a variety of indicators ranging from political and public frameworks, diversity, vitality and expression, openness and tolerance, entrepreneurship, vision, liveability, learning and professionalism, among 10 specific dimensions. In 2007, Melbourne-based “2thinkNow” developed an “Innovation Cities Program” along with an “Innovation Cities Index” in a bid to enhance understanding of the links between innovation and the way cities operate. The measure also uses a large variety of indicators, involving cultural assets, infrastructure and networked markets in areas such as commerce, finance, food, the arts, health, technology, religion, the media, etc. On this basis, cities are classified in five categories: ‘nexus’ (cities featuring critical innovations),’hub’ (cities that are influential in key areas), ‘node’ (cities combining broad-ranging performance and imbalances), ‘influencer’ (cities that are competitive but unbalanced on the whole), and ‘upstart’ (cities with potential for future performance).
Source: UN-Habitat (2012) Decentralization in Iraq: Challenges and Solutions for Federal and Local Governments, Nairobi: UN-Habitat
Box 3.2.1
POLICy A creative city must establish a balance between ‘hardware’ factors – infrastructure and technology –
and ‘software’ factors (including mind-set, dynamics of place, the connection between thinkers and doers, and a change-friendly environment).7
POLICy The culture of creativity must
be embedded in the way cities operate.8
FACT UN-Habitat survey shows
that five main factors are at play when cities innovate: innovative urban management, entrepreneurial capacity, the promotion of arts and culture, the emergence of industrial clusters, and research and development (R&D).
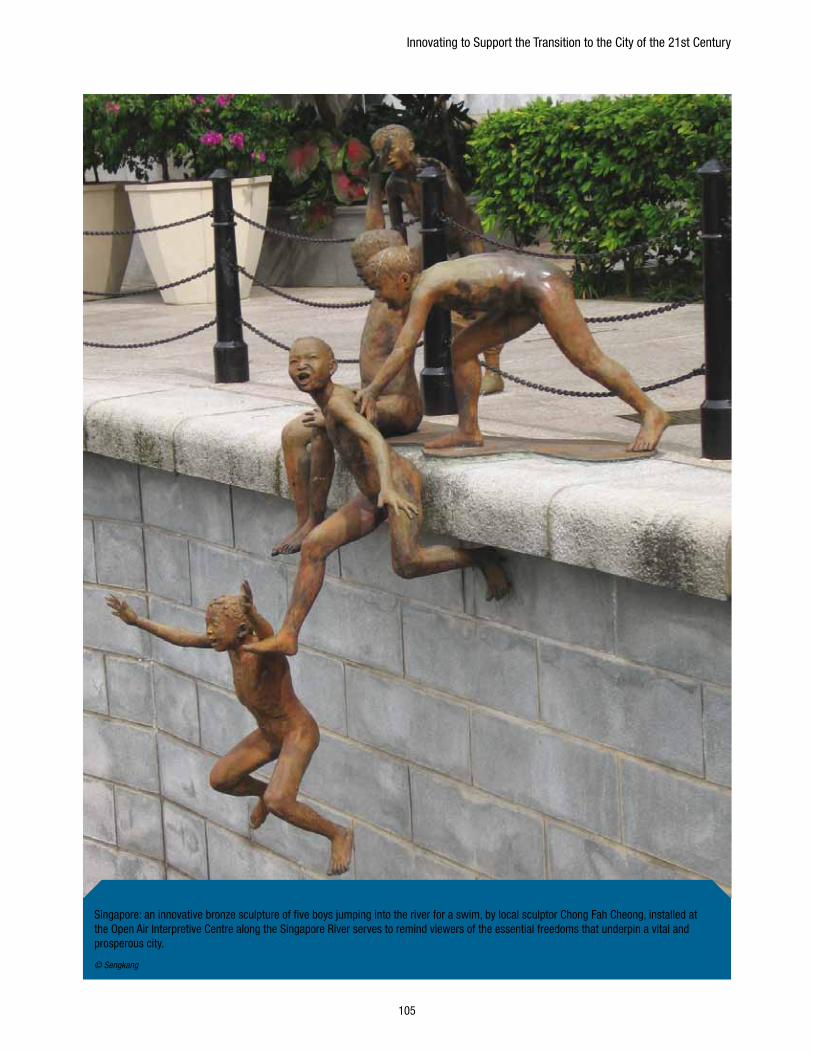
Innovating to Support the Transition to the City of the 21st Century
105
Singapore: an innovative bronze sculpture of five boys jumping into the river for a swim, by local sculptor Chong Fah Cheong, installed at the Open Air Interpretive Centre along the Singapore River serves to remind viewers of the essential freedoms that underpin a vital and prosperous city.
© Sengkang
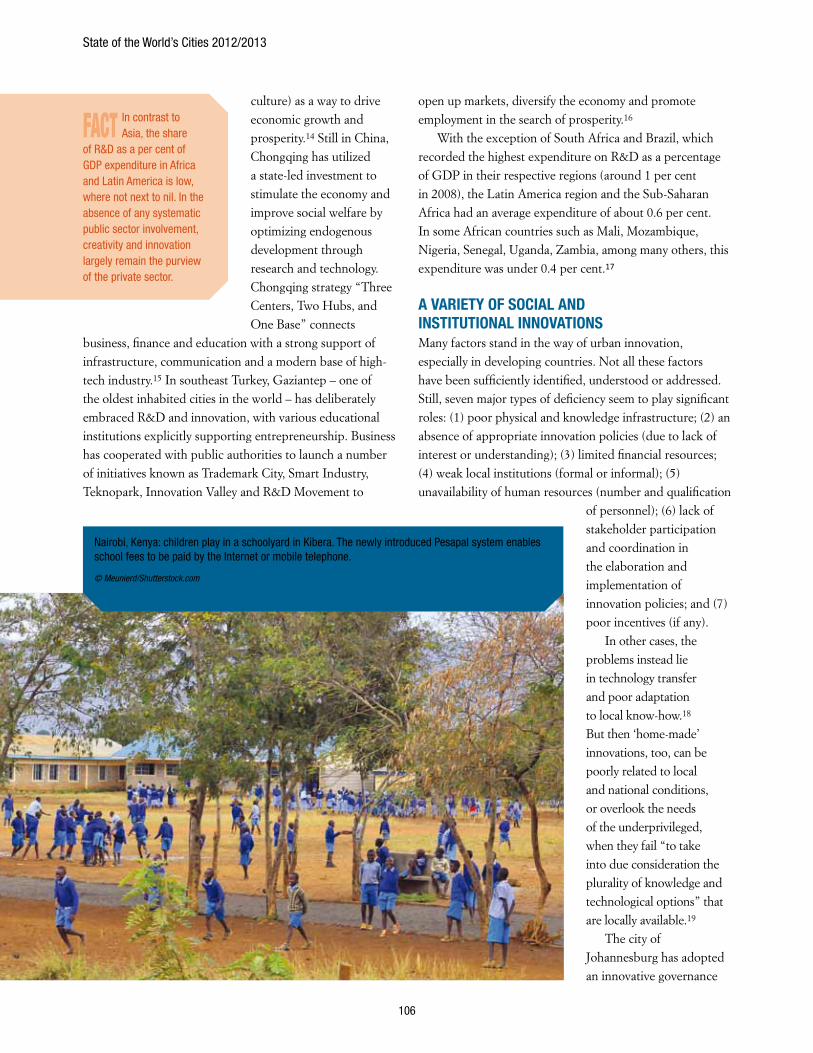
State of the World’s Cities 2012/2013
106
culture) as a way to drive economic growth and prosperity.14 Still in China, Chongqing has utilized a state-led investment to stimulate the economy and improve social welfare by optimizing endogenous development through research and technology. Chongqing strategy “Three Centers, Two Hubs, and One Base” connects
business, finance and education with a strong support of infrastructure, communication and a modern base of high-tech industry.15 In southeast Turkey, Gaziantep – one of the oldest inhabited cities in the world – has deliberately embraced R&D and innovation, with various educational institutions explicitly supporting entrepreneurship. Business has cooperated with public authorities to launch a number of initiatives known as Trademark City, Smart Industry, Teknopark, Innovation Valley and R&D Movement to
open up markets, diversify the economy and promote employment in the search of prosperity.16
With the exception of South Africa and Brazil, which recorded the highest expenditure on R&D as a percentage of GDP in their respective regions (around 1 per cent in 2008), the Latin America region and the Sub-Saharan Africa had an average expenditure of about 0.6 per cent. In some African countries such as Mali, Mozambique, Nigeria, Senegal, Uganda, Zambia, among many others, this expenditure was under 0.4 per cent.17
A vARIETy OF SOCIAL AND INSTITUTIONAL INNOvATIONS Many factors stand in the way of urban innovation, especially in developing countries. Not all these factors have been sufficiently identified, understood or addressed. Still, seven major types of deficiency seem to play significant roles: (1) poor physical and knowledge infrastructure; (2) an absence of appropriate innovation policies (due to lack of interest or understanding); (3) limited financial resources; (4) weak local institutions (formal or informal); (5) unavailability of human resources (number and qualification
of personnel); (6) lack of stakeholder participation and coordination in the elaboration and implementation of innovation policies; and (7) poor incentives (if any).
In other cases, the problems instead lie in technology transfer and poor adaptation to local know-how.18 But then ‘home-made’ innovations, too, can be poorly related to local and national conditions, or overlook the needs of the underprivileged, when they fail “to take into due consideration the plurality of knowledge and technological options” that are locally available.19
The city of Johannesburg has adopted an innovative governance
FACT In contrast to Asia, the share
of R&D as a per cent of GDP expenditure in Africa and Latin America is low, where not next to nil. In the absence of any systematic public sector involvement, creativity and innovation largely remain the purview of the private sector.
Nairobi, Kenya: children play in a schoolyard in Kibera. The newly introduced Pesapal system enables school fees to be paid by the Internet or mobile telephone.
© Meunierd/Shutterstock.com
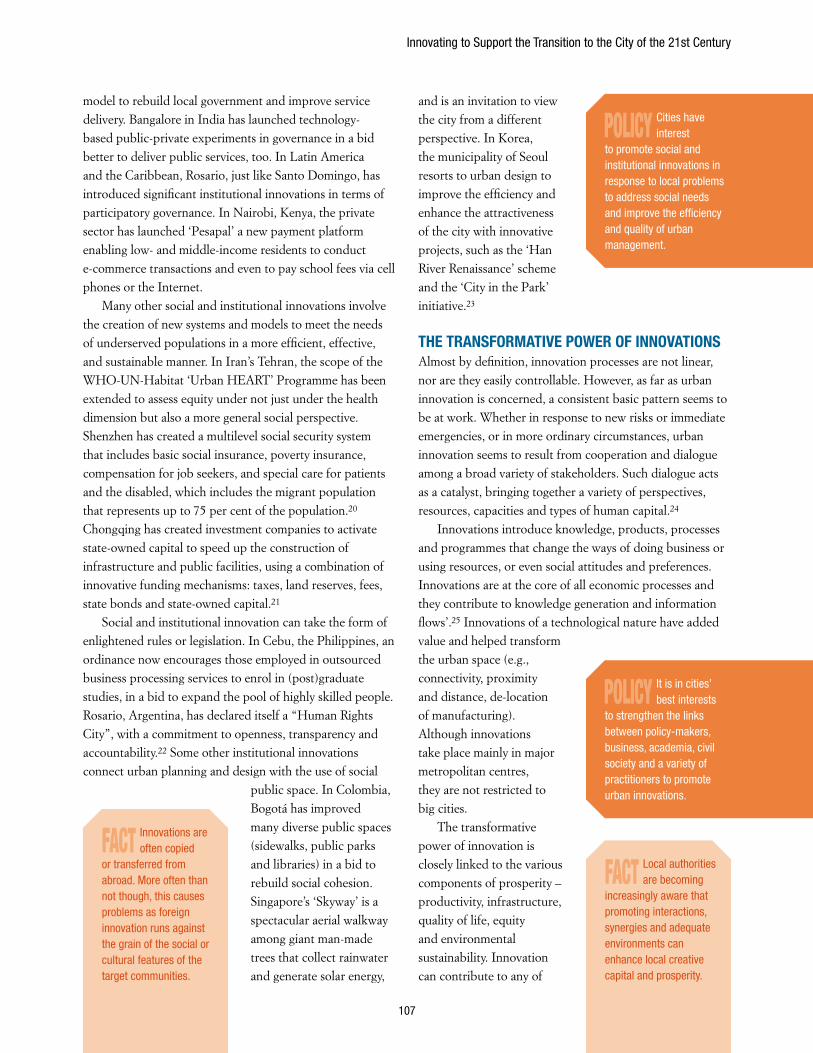
Innovating to Support the Transition to the City of the 21st Century
107
model to rebuild local government and improve service delivery. Bangalore in India has launched technology-based public-private experiments in governance in a bid better to deliver public services, too. In Latin America and the Caribbean, Rosario, just like Santo Domingo, has introduced significant institutional innovations in terms of participatory governance. In Nairobi, Kenya, the private sector has launched ‘Pesapal’ a new payment platform enabling low- and middle-income residents to conduct e-commerce transactions and even to pay school fees via cell phones or the Internet.
Many other social and institutional innovations involve the creation of new systems and models to meet the needs of underserved populations in a more efficient, effective, and sustainable manner. In Iran’s Tehran, the scope of the WHO-UN-Habitat ‘Urban HEART’ Programme has been extended to assess equity under not just under the health dimension but also a more general social perspective. Shenzhen has created a multilevel social security system that includes basic social insurance, poverty insurance, compensation for job seekers, and special care for patients and the disabled, which includes the migrant population that represents up to 75 per cent of the population.20 Chongqing has created investment companies to activate state-owned capital to speed up the construction of infrastructure and public facilities, using a combination of innovative funding mechanisms: taxes, land reserves, fees, state bonds and state-owned capital.21
Social and institutional innovation can take the form of enlightened rules or legislation. In Cebu, the Philippines, an ordinance now encourages those employed in outsourced business processing services to enrol in (post)graduate studies, in a bid to expand the pool of highly skilled people. Rosario, Argentina, has declared itself a “Human Rights City”, with a commitment to openness, transparency and accountability.22 Some other institutional innovations connect urban planning and design with the use of social
public space. In Colombia, Bogotá has improved many diverse public spaces (sidewalks, public parks and libraries) in a bid to rebuild social cohesion. Singapore’s ‘Skyway’ is a spectacular aerial walkway among giant man-made trees that collect rainwater and generate solar energy,
and is an invitation to view the city from a different perspective. In Korea, the municipality of Seoul resorts to urban design to improve the efficiency and enhance the attractiveness of the city with innovative projects, such as the ‘Han River Renaissance’ scheme and the ‘City in the Park’ initiative.23
THE TRANSFORMATIvE POWER OF INNOvATIONSAlmost by definition, innovation processes are not linear, nor are they easily controllable. However, as far as urban innovation is concerned, a consistent basic pattern seems to be at work. Whether in response to new risks or immediate emergencies, or in more ordinary circumstances, urban innovation seems to result from cooperation and dialogue among a broad variety of stakeholders. Such dialogue acts as a catalyst, bringing together a variety of perspectives, resources, capacities and types of human capital.24
Innovations introduce knowledge, products, processes and programmes that change the ways of doing business or using resources, or even social attitudes and preferences. Innovations are at the core of all economic processes and they contribute to knowledge generation and information flows’.25 Innovations of a technological nature have added value and helped transform the urban space (e.g., connectivity, proximity and distance, de-location of manufacturing). Although innovations take place mainly in major metropolitan centres, they are not restricted to big cities.
The transformative power of innovation is closely linked to the various components of prosperity –productivity, infrastructure, quality of life, equity and environmental sustainability. Innovation can contribute to any of
FACT Innovations are often copied
or transferred from abroad. More often than not though, this causes problems as foreign innovation runs against the grain of the social or cultural features of the target communities.
FACT Local authorities are becoming
increasingly aware that promoting interactions, synergies and adequate environments can enhance local creative capital and prosperity.
POLICy Cities have interest
to promote social and institutional innovations in response to local problems to address social needs and improve the efficiency and quality of urban management.
POLICy It is in cities’ best interests
to strengthen the links between policy-makers, business, academia, civil society and a variety of practitioners to promote urban innovations.
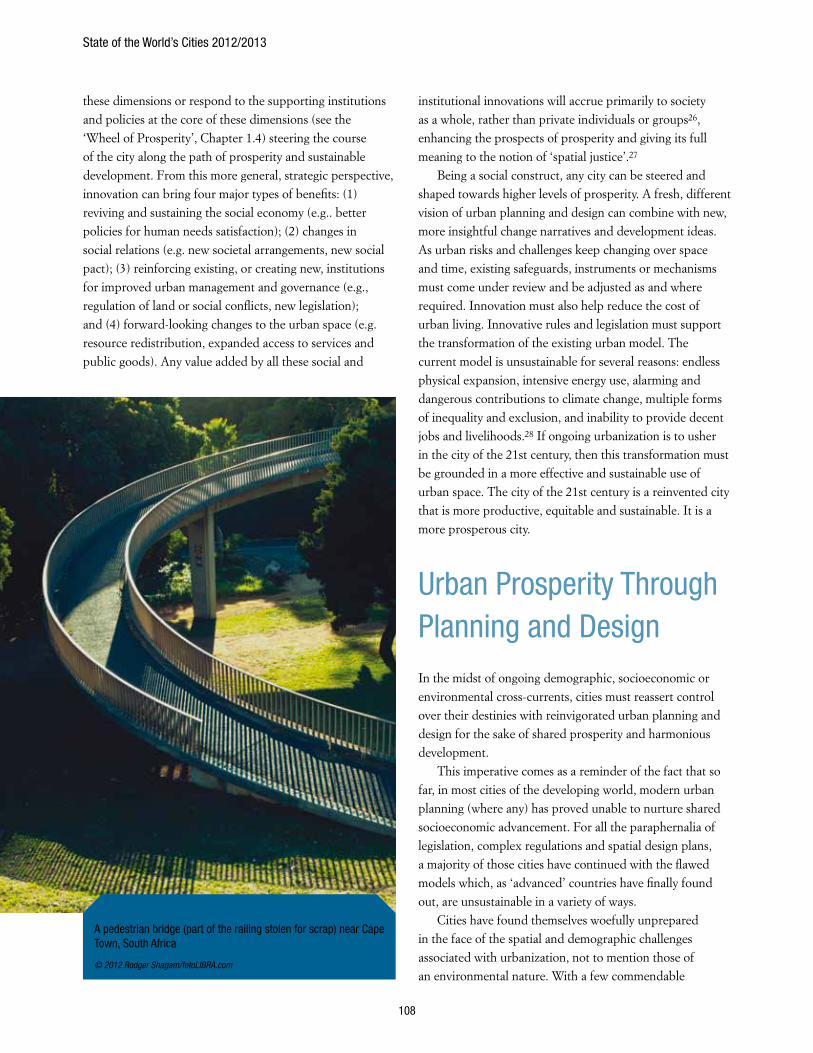
State of the World’s Cities 2012/2013
108
these dimensions or respond to the supporting institutions and policies at the core of these dimensions (see the ‘Wheel of Prosperity’, Chapter 1.4) steering the course of the city along the path of prosperity and sustainable development. From this more general, strategic perspective, innovation can bring four major types of benefits: (1) reviving and sustaining the social economy (e.g.. better policies for human needs satisfaction); (2) changes in social relations (e.g. new societal arrangements, new social pact); (3) reinforcing existing, or creating new, institutions for improved urban management and governance (e.g., regulation of land or social conflicts, new legislation); and (4) forward-looking changes to the urban space (e.g. resource redistribution, expanded access to services and public goods). Any value added by all these social and
institutional innovations will accrue primarily to society as a whole, rather than private individuals or groups26, enhancing the prospects of prosperity and giving its full meaning to the notion of ‘spatial justice’.27
Being a social construct, any city can be steered and shaped towards higher levels of prosperity. A fresh, different vision of urban planning and design can combine with new, more insightful change narratives and development ideas. As urban risks and challenges keep changing over space and time, existing safeguards, instruments or mechanisms must come under review and be adjusted as and where required. Innovation must also help reduce the cost of urban living. Innovative rules and legislation must support the transformation of the existing urban model. The current model is unsustainable for several reasons: endless physical expansion, intensive energy use, alarming and dangerous contributions to climate change, multiple forms of inequality and exclusion, and inability to provide decent jobs and livelihoods.28 If ongoing urbanization is to usher in the city of the 21st century, then this transformation must be grounded in a more effective and sustainable use of urban space. The city of the 21st century is a reinvented city that is more productive, equitable and sustainable. It is a more prosperous city.
Urban Prosperity Through Planning and DesignIn the midst of ongoing demographic, socioeconomic or environmental cross-currents, cities must reassert control over their destinies with reinvigorated urban planning and design for the sake of shared prosperity and harmonious development.
This imperative comes as a reminder of the fact that so far, in most cities of the developing world, modern urban planning (where any) has proved unable to nurture shared socioeconomic advancement. For all the paraphernalia of legislation, complex regulations and spatial design plans, a majority of those cities have continued with the flawed models which, as ‘advanced’ countries have finally found out, are unsustainable in a variety of ways.
Cities have found themselves woefully unprepared in the face of the spatial and demographic challenges associated with urbanization, not to mention those of an environmental nature. With a few commendable
A pedestrian bridge (part of the railing stolen for scrap) near Cape Town, South Africa
© 2012 Rodger Shagam/fotoLIBRA.com
Innovating to Support the Transition to the City of the 21st Century
109
exceptions, modern urban planning has failed to integrate the urban poor in the socioeconomic fabric of the city. As an expert in Bangalore put it, “The poor have survived
despite master planning.”30 Understood primarily as a technical tool, planning has been unable to address the power relations that have been at work to the detriment of the great majorities of urban populations. Planning has also proved unable to prevent environmental degradation or the formation of slums, and is notable for serious shortcomings in terms of transport and urban mobility.
Conceived as a comprehensive, long-term strategy, a master plan – the quintessence of modern planning – typically represents an ideal end-state for a particular city with serious gaps between the initial vision and actual results. This has ensued in what a scholar in 1996 called “the dark side of planning”31, something an expert in Montevideo has referred to as “urban plans that are at odds
with the notion of prosperity.”32
The shortcomings of modern urban planning have triggered significant reform since the 1980s and 1990s, in an effort to move away from comprehensive plans, top-down decision-making and wide-ranging regulation.33 A more flexible approach was adopted to improve conditions in cities, through ‘strategic planning’ and other methods that are more pragmatic, incremental and typically focused on ‘getting things done’. However, too many ‘strategic urban plans’ have effectively imposed an entrepreneurial view of the city, promoting mostly economic prosperity and often turning into marketing gimmicks in all but name, complete with oversized architectural designs and mega-developments. In emerging or developing countries, these initiatives typically favour the gentrification of entire areas and, at times, massive displacement in order to make room for highways, skyscrapers, luxury compounds, shopping malls, etc., at the expense of the habitat and livelihoods of the poor.34
UN-Habitat policy analysis in 50 cities in Asia, Africa, Latin America and the Arab States (2011) shows that up
to 80 per cent of local experts believe that the benefits of economic prosperity mainly serve the interests of the wealthy and politicians (a view shared by up to 90 per cent of African experts). Through political influence, bribery and corruption, these powerful interest groups
manage to distort urban plans, dodge spatial or legal rules, reduce the production of public goods and manipulate the power of eminent domain; in the process they capture unfair shares of a city’s potential, resources and prosperity to the detriment of large, poor majorities of urban populations.
The New Urbanism Movement of the early 1980s broke with conventional master-planning and introduced a number of welcome innovations: liveable, pedestrian-friendly cities, dense neighbourhoods with mixes of housing and job-creating commercial and business sites, together with mixed land uses having a diversity of buildings in terms of style, size, price and function – all of this with a strong focus on local communities.35 For all these fresh efforts, though, a conventional approach to urban development has remained dominant to this day. In developing and emerging countries alike, cities are still hostages to a mix of homogeneous forms or functions on the one hand, and spatial /social segregation on the other hand. Urban areas continue to expand across endless peripheries, with serious, pervasive problems of traffic congestion, enhancing the dependence on motor vehicles and intensive use of expensive fossil fuels. This dominant type of city is detrimental to the built heritage and the environment, including surrounding agricultural land, as well as biodiversity. This is the pattern which UN-Habitat refers to as the “Global Standard Urbanization Model of the 20th Century” (GS20C),36 which privileges individualism, consumerism, new (artificial) values and lifestyles, excessive mobility and privatization of the public space.
FACT From Asia to Africa to Latin America, ‘master’, ‘blueprint’ and layout plans have had similar,
harmful consequences in countless numbers of cities: spatial segregation, social exclusion, excessive mobility needs and consumption of energy, together with poor regard for the potential economies of scale and agglomeration that any city can offer.29
FACT Today, the GS20C
model appears to be predominant across the world, being largely driven by land speculation and real estate interests that build cities according to financial and economic parameters often radically at odds with shared prosperity.37
FACT Whatever the planning
approach, powerful political and economic interests keep interfering with the design and implementation of strategic plans and the pursuit of urban prosperity for all.
State of the World’s Cities 2012/2013
110
RE-POSITIONING URBAN PLANNING AT THE HUB OF THE WHEEL OF PROSPERITy “The city has many scars to treat and many wounds to cure;
urban planning is powerless to do that”38, claims an expert in Santo Domingo (Dominican Republic). Still, in the 50 cities surveyed by UN-Habitat in 2011, efficient urban planning and urban management are perceived as the most important
conditions for shared prosperity.39
For any revival or reinvigoration of urban planning to take place in the pursuit of shared prosperity, four conditions must be met: (i) restoration of public confidence; (ii) repositioning of urban planning in decision-
making; (iii) deployment of the fullness of its functions across the five dimensions of shared prosperity; and (iv) support for these functions with adequate financing.
Restoration of confidence: Public confidence must be restored in the capacity of urban planning (alongside other urban power functions) to represent the interests of all the population – including the poor, women, children, youth, elderly or disabled people, immigrants and ethnic minorities – so that the public, collective interest prevails at all times and across the whole jurisdiction over any other, and more particularly the vested or special interests of the rich and powerful.
Repositioning: If it is to play this stronger role to the full, urban planning must be re-positioned. No longer a mere technical functionality, urban planning must sit at the core of urban power. Urban planning can only be as good as the values it represents and the governance mechanisms that frame it.
Streetwise versus Petrol-Powered Prosperity
In Peru’s capital Lima, it has taken ‘only’ an open-air public staircase all the way downhill to the city centre to change the name of an informal settlement from fearful ‘Quick Sands’ to ‘The Belt of Hope’. This goes to show the regenerating power of planning for urban public spaces and their decisive role in shared prosperity – well away from the constraints of the outdated automobile-based model of urban development.
Indeed, public spaces, as symbolized by ‘the street’, can make significant contributions to socioeconomic prosperity, if only they are adequately configured. The street acts as the interface between public and private spaces, with retail businesses and jobs dependent on the quality of the pedestrian environment. In British towns, customers were found to spend nearly twice as much when walking instead of driving. In Mexico, research has shown that ‘walkability’ improves home and land values.
Public spaces provide the physical support for urban infrastructure. However, particularly in the developing world, streets are designed mainly for motorized traffic, overlooking the human dimension and only adding to congestion with more or wider streets. The resulting huge imbalance in transport options damages other aspects of urban functionality. A number of cities have sought to counter this trend in a variety of ways. As early as 1962 motor vehicles were banned from Copenhagen’s main street and bicycle commuting was facilitated. In Melbourne, improved sidewalks, new pedestrian streets, squares and urban design have together increased pedestrian traffic by 39 per cent in daytime and 100 per cent at night. Combined with other modes of popular transport like biking and walking, Bus Rapid Transport (BRT) has spread from Curitiba (Colombia) to Jakarta, Bogotá, Guatemala City, Guangzhou, Istanbul, Mexico City, Brisbane and Los Angeles, among others.
Upgraded and better designed public spaces have the potential to improve overall quality of life. In Cape Town under the Dignified Places Programme, more than 40 projects have brought dignity, beauty and better functionality to various areas, in the process demonstrating that after decades of repression it was once again possible to meet and talk in a shared space.
Box 3.2.2
POLICy If urban planning is to be in a
better position to address the shortcomings of the GS20C model, both theory and practice must come under serious review to ‘rescue’ the discipline from its role as a mere technical tool, restoring it to its rightful position in the public sphere.
POLICy As a decision-making tool
urban planning must better defend the ‘public’ against the menace of ever-expanding ‘private’ interests and its consequences: shrinking public spaces and reduced provision of public goods, which affect more collective, intangible dimensions like quality of life, social interaction, cultural identity and social values.
FACT Very often planning has
failed to represent correctly collective values and agreements, instead of contributing to the perpetuation of the urban divide with daunting, outdated, irrelevant requirements.
Innovating to Support the Transition to the City of the 21st Century
111
Working on the five ‘spokes’: Interdependencies and interactions among the five ‘spokes’ in the ‘wheel of urban prosperity’ (productivity, infrastructure, quality of life, equity and environmental sustainability) can be deliberately enhanced (as opposed to being allowed to occur all by themselves) through the strategies and interventions that are part and parcel of urban planning. More specifically, it is in the power of a well-planned decision or well-calibrated choice in one dimension of prosperity − for example, the design of a street supporting multimodal transport as part of the infrastructure development of the city − not just to make that particular part of the urban space more accessible or pedestrian-friendly, but in the process also to improve productivity (shops, street-trading, etc.), quality of life and social inclusion (see Box 3.2.1.).
Financial support: For urban planning to work more efficiently as an urban power function, it must be reinforced from a financial and legal point of view. Cities need more permanent funding mechanisms to support the provision of public goods and the design and implementation of sustainable technical solutions if their performance and functionality are to be improved.
Few cities or countries are in a proper legal position to do that, and where they are, they find themselves faced with systematic interference by special interest groups or political expediency.40 Here again, the public interest must prevail, and governments must look to improve and enforce the mechanisms that enable local authorities to capture urban land and site values, in the process generating the revenues needed to extend prosperity to the poorest areas.41
ExPANDING PROSPERITy: CHANGING CITy LANDSCAPESIn many cities, urban planning has been instrumentalised by the real estate business. Cities that respond to the interests of the better-off or only focus on strategic economic interventions in specific spaces tend to create enclaves of
prosperity for a select few. Urban planning can be so unrealistic or over-ambitious as to overlook the need to steer and control spatial expansion, with large parts of the city ignoring existing plans or regulations. “The city falls
out of the map, making
it irrelevant”, deplores
an expert in Panama City.42 Either by action or omission, this type of urban planning contributes to the production of spatial inequities, rather than better shared prosperity.
This reinvigorated notion of urban planning comes with a new value system that relies on effective institutions, well-adapted laws and regulations, sustainable urban solutions and active civic involvement in public affairs. This type of planning signals a paradigm shift towards a new urban pattern − the city of the 21st century: a city that can better respond to the challenges of our age, optimizing resources to harness the potentialities of the future; a people-centred city, one that is capable of transcending the inefficient, unsustainable GS20C model, in the process integrating and nurturing the five dimensions of urban prosperity as defined in this Report.
However, if urban planning is to be reinvigorated, it must shift away from the ‘spoke’ of productivity, where it has been predominantly operating these past several decades, to the centre of the ‘wheel’, right in the ‘hub’: indeed this is where, as an urban power function, planning will be in a better position to make its beneficial influence felt across all the ‘spokes’, increasing the scope of shared prosperity across the whole of the city. This will, of course, involve political choices and commitments, which must be turned into tools, regulations and sustainable technical solutions, which will be all the better accepted by society at large as they are seen to embed shared prosperity across the whole urban space.
POLICy Land legislation and planning
must combine to put municipal authorities in a better position to extract land values and related capital gains, with the additional revenue available for the funding of infrastructure extensions and other projects.
POLICy The 21st century is in a
position to ensure equitable development, preserve the natural environment, promote inexpensive energy sources, provide necessary infrastructures and ensure inclusive economic growth. The city of the 21st century builds the conditions of prosperity for all.
POLICy Restoring urban planning at the central point of the ‘wheel’, where a solid and efficient institutional ‘hub’
holds together, controls and activates the five ‘spokes’ , can only enhance the conditions for sustained, shared prosperity.
POLICy UN-Habitat calls for
a fresh, different type of urban planning and design – one that has the power to transform city landscapes and expand existing enclaves of prosperity to the entire city.
State of the World’s Cities 2012/2013
112
FACILITATING ACCESS TO ‘COMMONS’, PROvIDING PUBLIC GOODS, IMPLEMENTING SUSTAINABLE SOLUTIONS Facilitating Access to ‘Commons’: A prosperous city facilitates equitable access to the ‘commons’. These include water, air, biodiversity, knowledge and other shared resources, including public infrastructure, together with more intangible forms like a better environment, sense of identity and cultural and symbolic spaces that in principle belong to everyone.
Cities with islands of prosperity tend to enclose the ‘commons’, restrict their use to a selected few, or deplete them through unsustainable use.
Prosperous cities require ‘commons resource pools’, which can take the form of institutional arrangements where conflicts are solved through negotiation, and consensus is built for decision-making. ‘Commons’ also include any legal or statutory provisions facilitating community participation in planning decisions, available quality information, transparency as well as cultural norms and social compacts.
Some public goods, such as community civic centres, will often be found to function as ‘space commons’, facilitating the integration of marginal and voiceless groups, in the process promoting pluralism and diversity, which are inseparable from shared prosperity.
Providing public goods43: A prosperous city makes a profusion of public goods available to all: efficient public
transport, educational opportunities, healthcare, quality public spaces such as libraries, recreation areas, parks and open spaces, etc. A substantial part of urban well-being is derived from access to and consumption of these public goods, which in principle must be ‘non-excludable’ (everyone can enjoy their benefits) and ‘non-rivalry’ (individual consumption of the good does not decrease the amount available for consumption by others).44
Enclaves of prosperity ‘fence in’ or restrict the availability of public goods,
concentrating public investment in selected areas only, limiting access and privatizing control over a number of such goods.
The provision of public goods contributes to economic advancement with environmental preservation and quality of life, which, incidentally, are fundamental ‘smart growth’ concerns, too.45 Bogotá has transformed its own landscape with a variety of public goods such as multi-modal transport, social infrastructure and quality public spaces that have contributed to sharing more of the benefits of prosperity with poor and middle-income neighbourhoods. Still in Colombia, Medellín has resorted to bold civic architecture, public spaces and other public goods in a bid to enhance collective prosperity. Involvement of urban planning with education, culture, infrastructure, safety and community development has enabled the municipality to connect poor barrios (which, according to the head of municipal planning, “always had lots of energy,
but were disconnected from the city”) with more affluent neighbourhoods, in the process planting the seeds of mutual trust and expanding shared prosperity.46
Acting from the ‘hub’ of the ‘wheel for prosperity’, urban planning can identify strategies and plan for optimal production of public goods, in the process contributing to social capital, enhancing sense of place, safety and security, integrating social groups (e.g., youth), and increasing the economic value of the areas where these goods are provided. This strategy can generate widespread benefits to all urban residents, expanding prosperity across different areas. Such prosperity in turn can be leveraged for maintenance and further enhancement of public goods.
Implementing Sustainable Solutions: Prosperous cities must plan and implement a variety of technical solutions to improve the functionality of the city and achieve a sustainable urban form. Although solutions can vary according to local conditions, UN-Habitat has identified a number of key interventions in various areas to assist the transition away from the current “Global Standard Urbanization Model of the 20th Century” (GS20C), which is unsustainable on many accounts, to the city of the 21st century.
POLICy UN-Habitat’s reinvigorated
notion of urban planning involves sustainable use and equitable access to the ‘commons’ through appropriate policies and schemes.
FACT In general, the production AND
enjoyment of public goods rely on a set of ‘commons’ such as better connectivity, public security and safety, predictability, property rights under their various forms, street nomenclature, etc.
POLICy A reinvigorated
notion of urban planning would give any city tighter public control over the use of land, change the form and function of cities based on sustainable development principles, as well as expand the provision of, and access to, public goods.
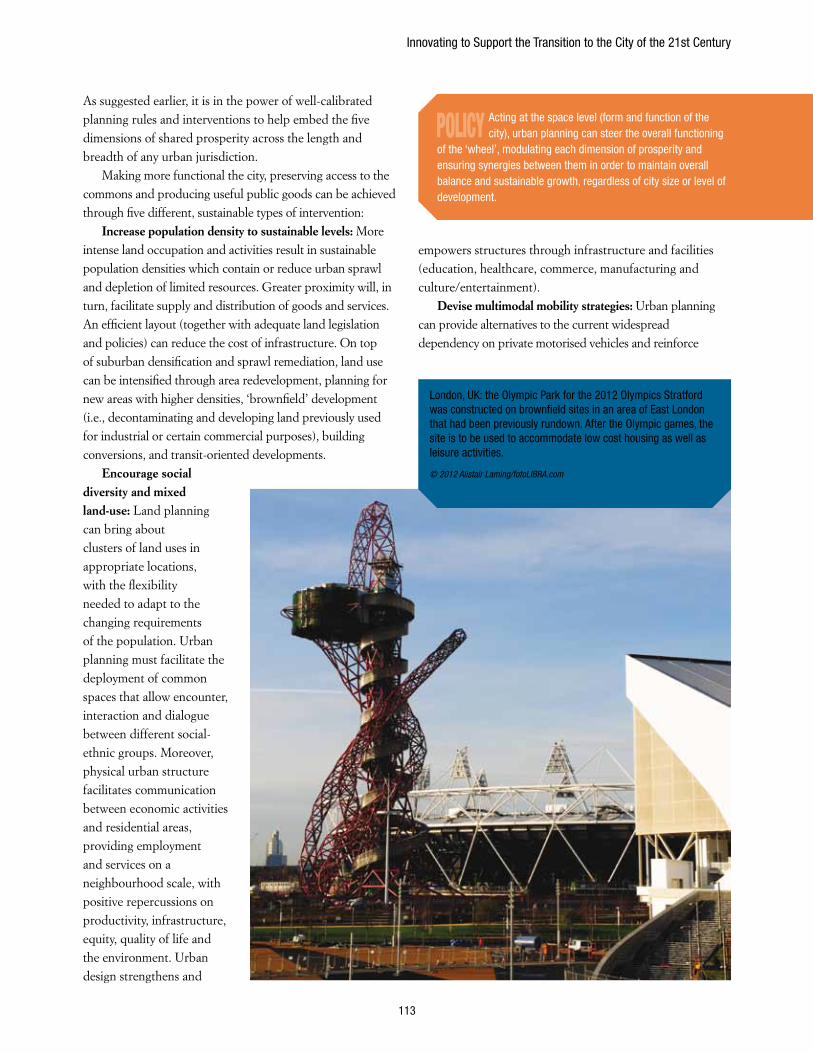
Innovating to Support the Transition to the City of the 21st Century
113
As suggested earlier, it is in the power of well-calibrated planning rules and interventions to help embed the five dimensions of shared prosperity across the length and breadth of any urban jurisdiction.
Making more functional the city, preserving access to the commons and producing useful public goods can be achieved through five different, sustainable types of intervention:
Increase population density to sustainable levels: More intense land occupation and activities result in sustainable population densities which contain or reduce urban sprawl and depletion of limited resources. Greater proximity will, in turn, facilitate supply and distribution of goods and services. An efficient layout (together with adequate land legislation and policies) can reduce the cost of infrastructure. On top of suburban densification and sprawl remediation, land use can be intensified through area redevelopment, planning for new areas with higher densities, ‘brownfield’ development (i.e., decontaminating and developing land previously used for industrial or certain commercial purposes), building conversions, and transit-oriented developments.
Encourage social diversity and mixed land-use: Land planning can bring about clusters of land uses in appropriate locations, with the flexibility needed to adapt to the changing requirements of the population. Urban planning must facilitate the deployment of common spaces that allow encounter, interaction and dialogue between different social-ethnic groups. Moreover, physical urban structure facilitates communication between economic activities and residential areas, providing employment and services on a neighbourhood scale, with positive repercussions on productivity, infrastructure, equity, quality of life and the environment. Urban design strengthens and
empowers structures through infrastructure and facilities (education, healthcare, commerce, manufacturing and culture/entertainment).
Devise multimodal mobility strategies: Urban planning can provide alternatives to the current widespread dependency on private motorised vehicles and reinforce
POLICy Acting at the space level (form and function of the city), urban planning can steer the overall functioning
of the ‘wheel’, modulating each dimension of prosperity and ensuring synergies between them in order to maintain overall balance and sustainable growth, regardless of city size or level of development.
London, UK: the Olympic Park for the 2012 Olympics Stratford was constructed on brownfield sites in an area of East London that had been previously rundown. After the Olympic games, the site is to be used to accommodate low cost housing as well as leisure activities.
© 2012 Alistair Laming/fotoLIBRA.com
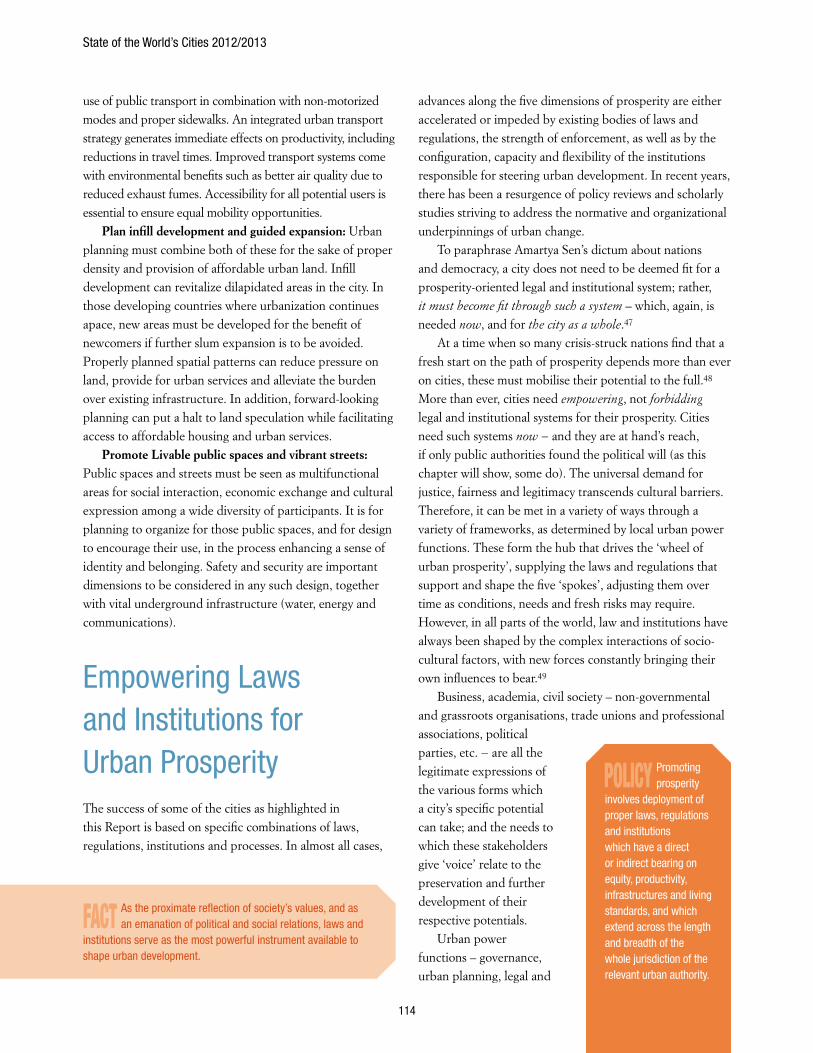
State of the World’s Cities 2012/2013
114
use of public transport in combination with non-motorized modes and proper sidewalks. An integrated urban transport strategy generates immediate effects on productivity, including reductions in travel times. Improved transport systems come with environmental benefits such as better air quality due to reduced exhaust fumes. Accessibility for all potential users is essential to ensure equal mobility opportunities.
Plan infill development and guided expansion: Urban planning must combine both of these for the sake of proper density and provision of affordable urban land. Infill development can revitalize dilapidated areas in the city. In those developing countries where urbanization continues apace, new areas must be developed for the benefit of newcomers if further slum expansion is to be avoided. Properly planned spatial patterns can reduce pressure on land, provide for urban services and alleviate the burden over existing infrastructure. In addition, forward-looking planning can put a halt to land speculation while facilitating access to affordable housing and urban services.
Promote Livable public spaces and vibrant streets: Public spaces and streets must be seen as multifunctional areas for social interaction, economic exchange and cultural expression among a wide diversity of participants. It is for planning to organize for those public spaces, and for design to encourage their use, in the process enhancing a sense of identity and belonging. Safety and security are important dimensions to be considered in any such design, together with vital underground infrastructure (water, energy and communications).
Empowering Laws and Institutions for Urban ProsperityThe success of some of the cities as highlighted in this Report is based on specific combinations of laws, regulations, institutions and processes. In almost all cases,
advances along the five dimensions of prosperity are either accelerated or impeded by existing bodies of laws and regulations, the strength of enforcement, as well as by the configuration, capacity and flexibility of the institutions responsible for steering urban development. In recent years, there has been a resurgence of policy reviews and scholarly studies striving to address the normative and organizational underpinnings of urban change.
To paraphrase Amartya Sen’s dictum about nations and democracy, a city does not need to be deemed fit for a prosperity-oriented legal and institutional system; rather, it must become fit through such a system – which, again, is needed now, and for the city as a whole.47
At a time when so many crisis-struck nations find that a fresh start on the path of prosperity depends more than ever on cities, these must mobilise their potential to the full.48 More than ever, cities need empowering, not forbidding legal and institutional systems for their prosperity. Cities need such systems now − and they are at hand’s reach, if only public authorities found the political will (as this chapter will show, some do). The universal demand for justice, fairness and legitimacy transcends cultural barriers. Therefore, it can be met in a variety of ways through a variety of frameworks, as determined by local urban power functions. These form the hub that drives the ‘wheel of urban prosperity’, supplying the laws and regulations that support and shape the five ‘spokes’, adjusting them over time as conditions, needs and fresh risks may require. However, in all parts of the world, law and institutions have always been shaped by the complex interactions of socio-cultural factors, with new forces constantly bringing their own influences to bear.49
Business, academia, civil society – non-governmental and grassroots organisations, trade unions and professional associations, political parties, etc. − are all the legitimate expressions of the various forms which a city’s specific potential can take; and the needs to which these stakeholders give ‘voice’ relate to the preservation and further development of their respective potentials.
Urban power functions – governance, urban planning, legal and
FACT As the proximate reflection of society’s values, and as an emanation of political and social relations, laws and
institutions serve as the most powerful instrument available to shape urban development.
POLICy Promoting prosperity
involves deployment of proper laws, regulations and institutions which have a direct or indirect bearing on equity, productivity, infrastructures and living standards, and which extend across the length and breadth of the whole jurisdiction of the relevant urban authority.
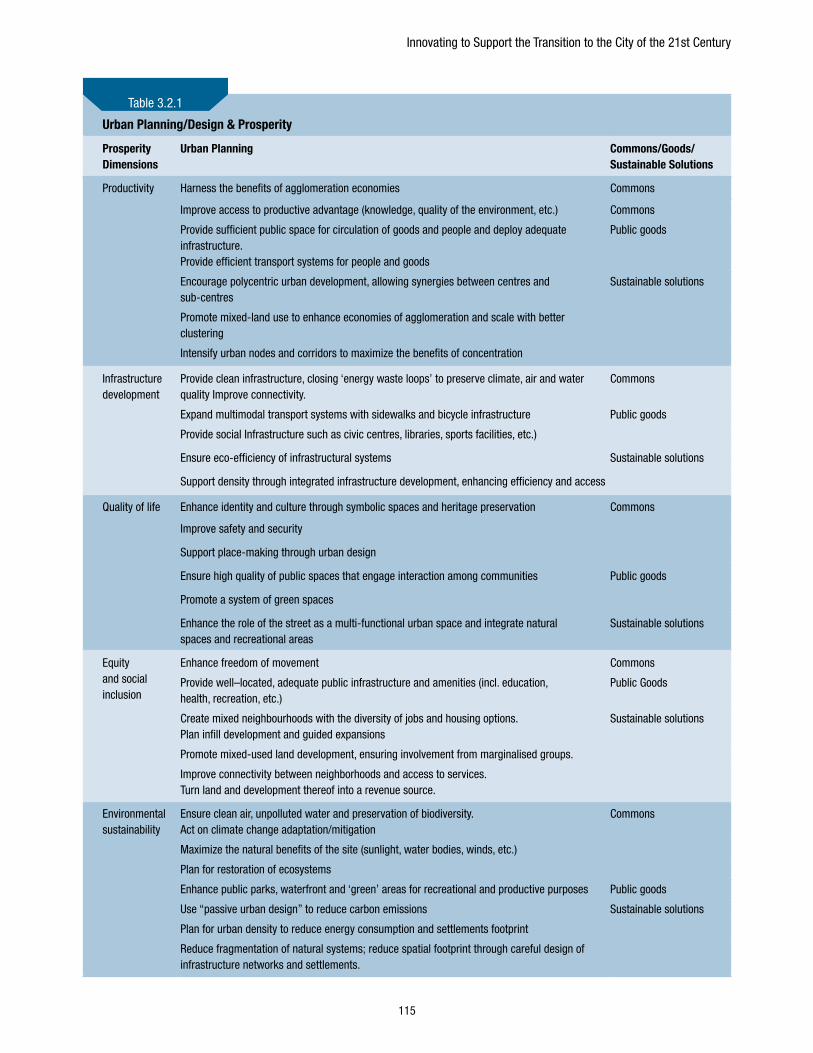
Innovating to Support the Transition to the City of the 21st Century
115
Urban Planning/Design & Prosperity
Prosperity Dimensions
Urban Planning Commons/Goods/Sustainable Solutions
Productivity Harness the benefits of agglomeration economies Commons
Improve access to productive advantage (knowledge, quality of the environment, etc.) Commons
Provide sufficient public space for circulation of goods and people and deploy adequate infrastructure.Provide efficient transport systems for people and goods
Public goods
Encourage polycentric urban development, allowing synergies between centres and sub-centres
Sustainable solutions
Promote mixed-land use to enhance economies of agglomeration and scale with better clustering
Intensify urban nodes and corridors to maximize the benefits of concentration
Infrastructure development
Provide clean infrastructure, closing ‘energy waste loops’ to preserve climate, air and water quality Improve connectivity.
Commons
Expand multimodal transport systems with sidewalks and bicycle infrastructure Public goods
Provide social Infrastructure such as civic centres, libraries, sports facilities, etc.)
Ensure eco-efficiency of infrastructural systems Sustainable solutions
Support density through integrated infrastructure development, enhancing efficiency and access
Quality of life Enhance identity and culture through symbolic spaces and heritage preservation Commons
Improve safety and security
Support place-making through urban design
Ensure high quality of public spaces that engage interaction among communities Public goods
Promote a system of green spaces
Enhance the role of the street as a multi-functional urban space and integrate natural spaces and recreational areas
Sustainable solutions
Equity and social inclusion
Enhance freedom of movement Commons
Provide well–located, adequate public infrastructure and amenities (incl. education, health, recreation, etc.)
Public Goods
Create mixed neighbourhoods with the diversity of jobs and housing options.Plan infill development and guided expansions
Sustainable solutions
Promote mixed-used land development, ensuring involvement from marginalised groups.
Improve connectivity between neighborhoods and access to services.Turn land and development thereof into a revenue source.
Environmental sustainability
Ensure clean air, unpolluted water and preservation of biodiversity. Act on climate change adaptation/mitigation
Commons
Maximize the natural benefits of the site (sunlight, water bodies, winds, etc.)
Plan for restoration of ecosystems
Enhance public parks, waterfront and ‘green’ areas for recreational and productive purposes Public goods
Use “passive urban design” to reduce carbon emissions Sustainable solutions
Plan for urban density to reduce energy consumption and settlements footprint
Reduce fragmentation of natural systems; reduce spatial footprint through careful design of infrastructure networks and settlements.
Table 3.2.1
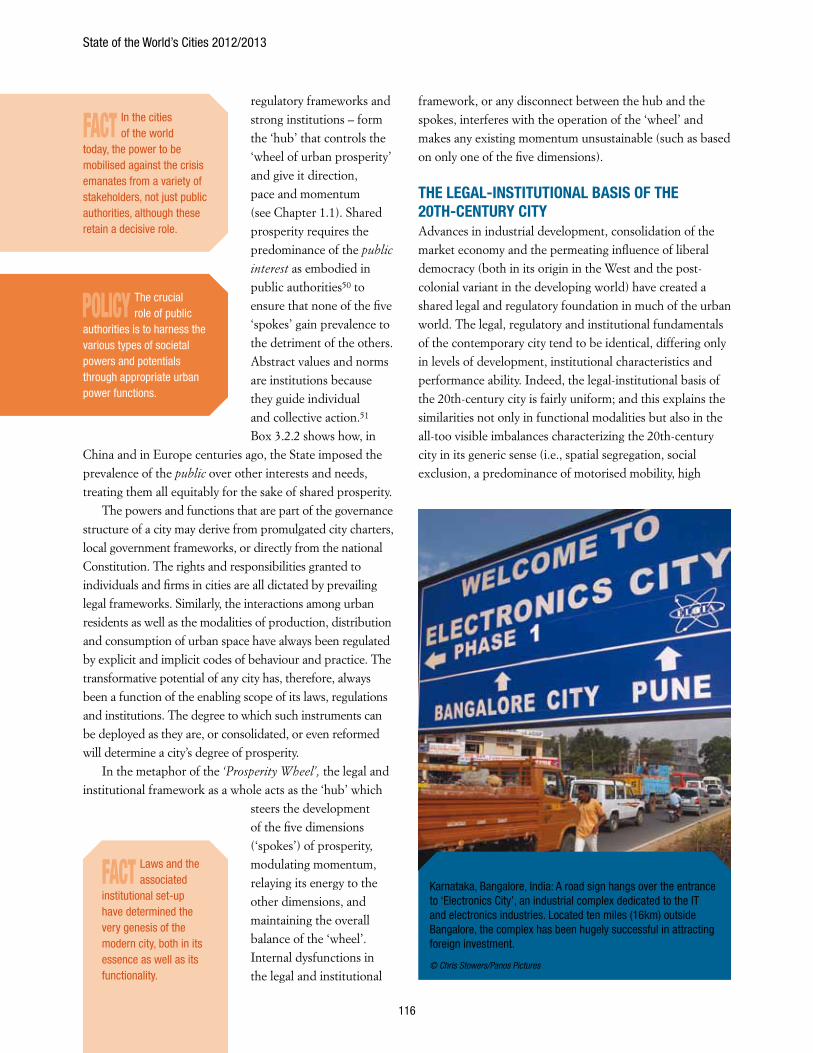
State of the World’s Cities 2012/2013
116
regulatory frameworks and strong institutions – form the ‘hub’ that controls the ‘wheel of urban prosperity’ and give it direction, pace and momentum (see Chapter 1.1). Shared prosperity requires the predominance of the public
interest as embodied in public authorities50 to ensure that none of the five ‘spokes’ gain prevalence to the detriment of the others. Abstract values and norms are institutions because they guide individual and collective action.51 Box 3.2.2 shows how, in
China and in Europe centuries ago, the State imposed the prevalence of the public over other interests and needs, treating them all equitably for the sake of shared prosperity.
The powers and functions that are part of the governance structure of a city may derive from promulgated city charters, local government frameworks, or directly from the national Constitution. The rights and responsibilities granted to individuals and firms in cities are all dictated by prevailing legal frameworks. Similarly, the interactions among urban residents as well as the modalities of production, distribution and consumption of urban space have always been regulated by explicit and implicit codes of behaviour and practice. The transformative potential of any city has, therefore, always been a function of the enabling scope of its laws, regulations and institutions. The degree to which such instruments can be deployed as they are, or consolidated, or even reformed will determine a city’s degree of prosperity.
In the metaphor of the ‘Prosperity Wheel’, the legal and institutional framework as a whole acts as the ‘hub’ which
steers the development of the five dimensions (‘spokes’) of prosperity, modulating momentum, relaying its energy to the other dimensions, and maintaining the overall balance of the ‘wheel’. Internal dysfunctions in the legal and institutional
framework, or any disconnect between the hub and the spokes, interferes with the operation of the ‘wheel’ and makes any existing momentum unsustainable (such as based on only one of the five dimensions).
THE LEGAL-INSTITUTIONAL BASIS OF THE 20TH-CENTURy CITyAdvances in industrial development, consolidation of the market economy and the permeating influence of liberal democracy (both in its origin in the West and the post-colonial variant in the developing world) have created a shared legal and regulatory foundation in much of the urban world. The legal, regulatory and institutional fundamentals of the contemporary city tend to be identical, differing only in levels of development, institutional characteristics and performance ability. Indeed, the legal-institutional basis of the 20th-century city is fairly uniform; and this explains the similarities not only in functional modalities but also in the all-too visible imbalances characterizing the 20th-century city in its generic sense (i.e., spatial segregation, social exclusion, a predominance of motorised mobility, high
FACT In the cities of the world
today, the power to be mobilised against the crisis emanates from a variety of stakeholders, not just public authorities, although these retain a decisive role.
FACT Laws and the associated
institutional set-up have determined the very genesis of the modern city, both in its essence as well as its functionality.
POLICy The crucial role of public
authorities is to harness the various types of societal powers and potentials through appropriate urban power functions.
Karnataka, Bangalore, India: A road sign hangs over the entrance to ‘Electronics City’, an industrial complex dedicated to the IT and electronics industries. Located ten miles (16km) outside Bangalore, the complex has been hugely successful in attracting foreign investment.
© Chris Stowers/Panos Pictures
Innovating to Support the Transition to the City of the 21st Century
117
energy consumption and poor regard for the potential for agglomeration economies.
TOWARDS A NEW LEGAL-URBAN ORDER FOR HOLISTIC PROSPERITyDuring the last two decades, the pitfalls of the conventional urban development model have become more glaring. As shown in the previous section (Urban Prosperity through
Planning and Design) the potential of cities has not been fully harnessed, a more common trend has developed where urban development tends to be spatially fragmented and the benefits of prosperity remains socially segmented.
In contrast, over the past two decades some Brazilian cities have taken to re-examining the prevailing urban legal order, with bold practical schemes inspired by a set of alternative, radical urban doctrines and jurisprudence which depart from the classical liberal legalism exalting individualism and private property. After a long period
of consultations and negotiations, a nationwide City Statute was adopted in 2001 enshrining a Right
to the City. The Statute makes an important contribution to urban law, facilitating shared prosperity, particularly in the context of a
developing country. The Statute also “broke with the long-standing tradition of civil law and set the basis of a new legal-political paradigm for urban land use and development control.”53 A prominent scholar highlights four dimensions of Brazil’s 2001 City Statute: “A conceptual one, providing elements for the interpretation of the constitutional principle of the social functions of urban property and of the city; the regulation of new instruments for the construction of a different urban order by the municipalities; the indication of processes for the democratic management of cities; and the identification of legal instruments for the comprehensive regularisation of informal settlements in private and public urban areas.”54 This new urban legal order has had highly visible effects. As a nation and at macro-economic level, Brazil is among a handful of countries in the world that has been able to achieve remarkable growth rates for much of the early years of this century, despite the global economic turbulence. More significantly, Brazilian cities have been able to expand the middle class segments of their populations and to improve economic and living conditions for substantial numbers of poor residents. Although still very high, cities are reducing income inequalities, as measured by the Gini coefficient, which decreased from 0.606 in 1990 to 0.569 in 2009.55
REvITALIzED ‘RIGHTS TO THE COMMONS’ AND ExPANSION OF THE PUBLIC REALM‘Commons’ reinforce the social function of property and that of the city as a whole, while recognizing the dynamism of private assets. Laws, regulations and institutions as factors of restraint, opportunity and action, act as the levers that can optimize the social function of property and balance it out with private rights and assets. It must be stressed here that this social function is not about ownership rights or their transactional implications. Rather, it is essentially
FACT those few cities featuring
balanced and sustainable prosperity have effectively deployed adequate laws, regulations and institutions in support of their transformation.
Individual versus collective interests
The legal foundation of the 20th-century city lies in the ancient tenets of Roman Law and the Napoleonic Code, together with the subsequent elaboration into modern civil and common law. The gist of this legal corpus is the pre-eminence of the individual, who is considered as possessed of inherent rights as represented in the 18th century French Revolution’s Declaration of the Rights of Man and the Citizen. Within this individualistic legal tradition, property rights reign supreme, with the emphasis on the rights of owners to the detriment of their social implications and other, broader, collective interests, including duties and responsibilities. With particular regard to urban settings, ‘land and property are conceived largely as commodities whose economic value is determined by the owners’ interests.’52 In this system, the role of the State at all levels is relegated to harmonizing and mediating these interests, and to oversee those assets and facilities that require collective use.
Box 3.2.3
FACT Although the 20th-century city tends to exhibit fair degrees of vibrancy and dynamism, whatever attendant
prosperity it experiences is often skewed and unsustainable – and therefore ridden with perennial crises.
POLICy Shared urban prosperity
is about enhancing the public realm, equitable sharing of public goods and consolidating rights to the commons for all.
State of the World’s Cities 2012/2013
118
about user rights for enhanced human value.
The ‘Right to the Commons’ is an ancient concept in legal jurisprudence originating in feudal England, where it referred to the extension of user rights for all on a manor’s grazing land. Lately, the notion has resurfaced in urban settings (including public goods, societal institutional arrangements, public culture, and heritage sites), where it is perceived as an effective way of countering not just rampant enclosures and appropriations, but also the rise of duality under the form of inequity and segregation.
In this respect, cities such as Helsinki, Toronto and Barcelona, which achieve high rankings on the UN-Habitat City Prosperity Index (CPI), feature more extensive public realms than Monrovia, Nairobi or Dakar, or similar cities with low CPI readings.
Legal and regulatory instruments exert a major bearing on the origination and preservation of the commons, and also in ensuring indiscriminate access. Statutes, ordinances and regulations are the bases for the guidelines and standards regulating spatial layouts and construction designs. The same applies to institutional
relationships, functional allocations and authority designation, besides resource distribution. The legal framework in turn enables civic organisations and community activities. Equally significant is the overall manner in which legal-regulatory and institutional frameworks delineate the public and private spheres and guide the interaction between
and within them in the everyday workings of the city. One component of the commons that lately has
attracted a lot of attention is the management of public spaces.56 In Panama City, one of the local experts surveyed by UN-Habitat put it as follows: “The more degraded public space, the more degraded the citizen, because public space is not only about quality of life but also the expression of citizenship”.57 Another local expert, in Santo Domingo, underscored the same point perhaps more incisively: “Citizens need to gain positive empowerment, to defend space enclaves where public life is still alive and where laws and norms for doing so are available.”58
REvISITING URBAN CODES FOR SHARED PROSPERITyRules and regulations constitute a key instrument in urban management and development. That is why appropriate institutions are required to ensure implementation and enforcement as well as awareness building and mobilization. Rules and regulations have significant roles to play, as they generally steer and circumscribe planning and construction. One author has even gone so far as to ascribe the ‘shaping and misshaping of American cities’ to poor planning regulations.59 Indeed, zoning regulations, building codes, utility standards, deed restrictions and the many other instruments that shape the urban built environment, will determine not only the pattern, use and form of spaces and structures, but will also strongly influence the quality of life in cities.
The review of regulatory frameworks is of particular importance for those cities in the developing world that have long operated with externally derived standards and codes, who, must also tend to effective implementation and enforcement capacities. Revisiting the codes developed for formerly colonial or apartheid cities like Nairobi, Dar es Salaam or Johannesburg in a bid to achieve an inclusive urban form is a challenging endeavour. This calls not only major for institutional restructuring, but also a revision of zoning and
POLICy As cities work on the five
dimensions of prosperity, there also occurs a progressive expansion in the size of the commons. More amenities are brought into collective use and more access is provided, enabling larger numbers of urban residents to use and enjoy shared spaces, services and facilities.
FACT The capacity for a city to maintain
extensive and quality shared spaces and facilities provides a good indication of its degree of prosperity.
FACT In this era of enclosures,
privatization and even invasion of the traditional urban commons (including beaches, river banks, forests, school yards and even pavements), the size and quality of a city’s overall public space acts as a good indicator of shared prosperity.
POLICy Laws, rules and
institutions must be kept alert, not inert, to current and evolving needs and risks if a city’s whole human potential is to be harnessed, not repressed – empowering the whole population with “basic capabilities” or “generic conditions of agency” at the service of today’s and tomorrow’s prosperity.
Innovating to Support the Transition to the City of the 21st Century
119
building codes to support urban reforms, not to mention squatter regulation and slum upgrading. On top of that, cities today must provide accommodative measures, allowing for progressive construction, smaller plot sizes and multiple variants of land tenure. Similarly, utility standards must be adjusted, and new development financing channels devised, in the face of inequity and exclusion.
INSTITUTIONAL TRANSFORMATIONSome of the real-life experiences outlined in this chapter suggest that when it comes to structuring the urban power functions that form the hub of the ‘prosperity wheel’, it is for every city to make its own choices. Indeed, many choices have already been made; but common to all is the adaptation and consolidation of key institutions which harness the energy and engagement of all stakeholders in a city. Major stakeholders, such as business, professionals, civic organisations, besides neighbourhood associations, must be provided with an institutional avenue for effective engagement with urban prosperity – how it is generated and how it is shared. Such engagement transcends the traditional participatory practices of forums and consultative
mechanisms; it turns socioeconomic conditions into levers of enhanced prosperity, with every household and business considered as an asset to be safeguarded, optimized and promoted – empowered – for the benefit of all
An exemplary case of institutional innovation for shared prosperity is that of Medellín. During the past decade, the Colombian city’s prosperity has experienced major turnaround, as it endeavoured to overcome the combined challenges of poverty, inequality, exclusion and informality, besides rampant violence, through a whole new social
Law, institutions and the public interest
Urban space is shaped by laws, rules and institutions (or lack thereof) in response to the needs and requirements of varying numbers of stakeholders. In this sense, the prosperity of a city is also a legal and institutional construct, and the past has some lessons for early 21st century central and municipal governments. Major legal systems around the world have long recognised that far from being just an abstract norm, law and institutions have the capacity to shape up a variety of interests across ethnic, cultural and other divides. They do so within the spatial confines of their jurisdictions, and with a long-term view.61
This is the background against which the state has historically emerged as the apex body of an interdependent network of powerful repositories of different kinds of power – legal, religious, bureaucratic, economic, etc.62 In this role, the state has gradually built a monopoly over universality. This went hand in hand with the constitution of bureaucratic functions independent of particular interests – family, religion, the economy – with agents that were mandated to embody the public interest. Along with this came the constitution of a new, “public” kind of resources that embodied universality, or at any rate a degree of universality that was superior to that of previously existing resources. This public realm gradually stood out against particular interests, and also against private appropriation of public functions through patronage or nepotism.
As the state evolved into “the geometric focal point of all perspectives” and a principle of public order, it established a unified space – imposing spatial over social, genealogical or other types of proximity. In the process, public authority has gained more recognition from the various segments of society, which further consolidates both its privileged position and its efficiency. As a result, the notion of “public interest” can pave the way for consensus and mobilization; at any rate, it sheds light on reality and becomes a shared evaluation criterion.
Historically, in China as in Europe, the city has served as the privileged locus of the emergence of the state and the public interest as we know them today. In 11th century Western Europe63, it fell to municipal authorities to control violence as well as economic and political relations. Although the poor were effectively left out of some functions, they were equal members of the assemblies in charge of endorsing municipal officials and laws (including those on economic activities). Moreover, purchase, sale and mortgaging of land and buildings were open to all. At the time, the protections and safeguards provided by cities also aimed at preserving their prosperity from heavy-handed monarchs or emperors.
Box 3.2.4
FACT As some cities have found out, shared prosperity involves a serious review of regulatory frameworks.
POLICy As some cities have come to realise, shared and integrated prosperity is a socio-political project,
involving a commitment by all stakeholders and entailing a re-examination of laws, regulations, and the corresponding institutional framework.
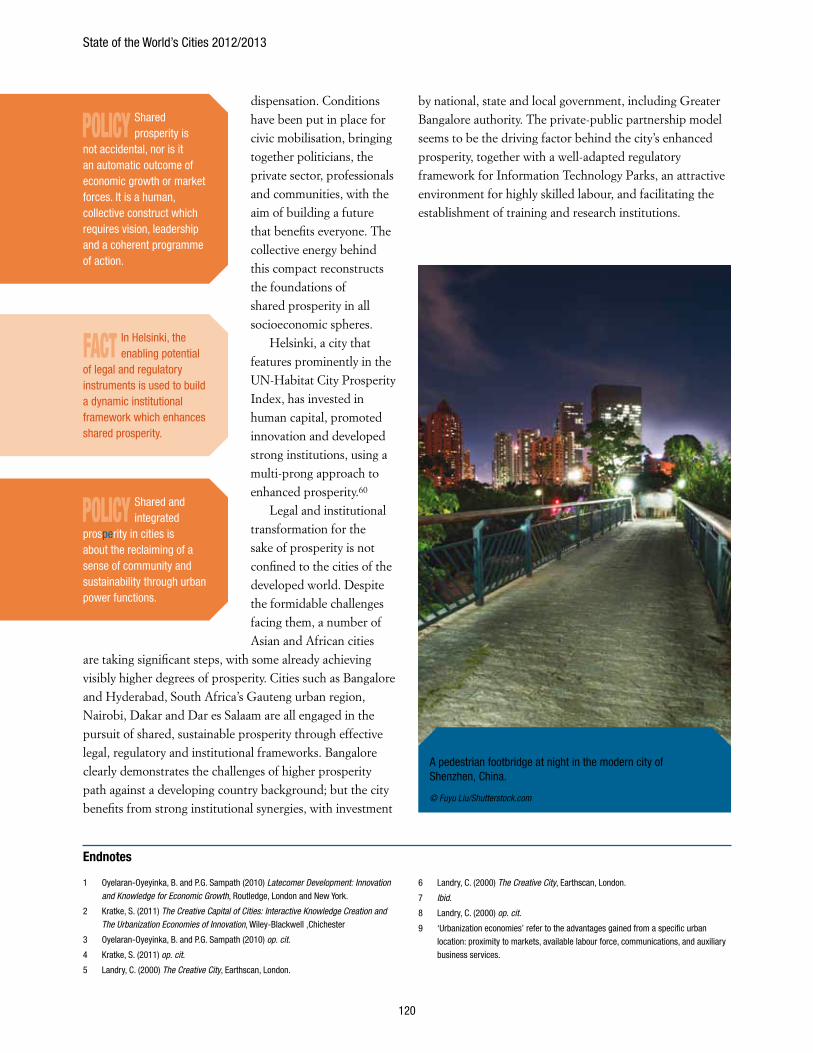
State of the World’s Cities 2012/2013
120
Endnotes
1 Oyelaran-Oyeyinka, B. and P.G. Sampath (2010) Latecomer Development: Innovation and Knowledge for Economic Growth, Routledge, London and New York.
2 Kratke, S. (2011) The Creative Capital of Cities: Interactive Knowledge Creation and The Urbanization Economies of Innovation, Wiley-Blackwell ,Chichester
3 Oyelaran-Oyeyinka, B. and P.G. Sampath (2010) op. cit.
4 Kratke, S. (2011) op. cit.
5 Landry, C. (2000) The Creative City, Earthscan, London.
6 Landry, C. (2000) The Creative City, Earthscan, London.
7 Ibid.
8 Landry, C. (2000) op. cit.
9 ‘Urbanization economies’ refer to the advantages gained from a specific urban location: proximity to markets, available labour force, communications, and auxiliary business services.
dispensation. Conditions have been put in place for civic mobilisation, bringing together politicians, the private sector, professionals and communities, with the aim of building a future that benefits everyone. The collective energy behind this compact reconstructs the foundations of shared prosperity in all socioeconomic spheres.
Helsinki, a city that features prominently in the UN-Habitat City Prosperity Index, has invested in human capital, promoted innovation and developed strong institutions, using a multi-prong approach to enhanced prosperity.60
Legal and institutional transformation for the sake of prosperity is not confined to the cities of the developed world. Despite the formidable challenges facing them, a number of Asian and African cities
are taking significant steps, with some already achieving visibly higher degrees of prosperity. Cities such as Bangalore and Hyderabad, South Africa’s Gauteng urban region, Nairobi, Dakar and Dar es Salaam are all engaged in the pursuit of shared, sustainable prosperity through effective legal, regulatory and institutional frameworks. Bangalore clearly demonstrates the challenges of higher prosperity path against a developing country background; but the city benefits from strong institutional synergies, with investment
by national, state and local government, including Greater Bangalore authority. The private-public partnership model seems to be the driving factor behind the city’s enhanced prosperity, together with a well-adapted regulatory framework for Information Technology Parks, an attractive environment for highly skilled labour, and facilitating the establishment of training and research institutions.
POLICy Shared prosperity is
not accidental, nor is it an automatic outcome of economic growth or market forces. It is a human, collective construct which requires vision, leadership and a coherent programme of action.
POLICy Shared and integrated
prosperity in cities is about the reclaiming of a sense of community and sustainability through urban power functions.
A pedestrian footbridge at night in the modern city of Shenzhen, China.
© Fuyu Liu/Shutterstock.com
FACT In Helsinki, the enabling potential
of legal and regulatory instruments is used to build a dynamic institutional framework which enhances shared prosperity.
Innovating to Support the Transition to the City of the 21st Century
121
10 Government of Singapore (2010) Singapore Budget 2010 - Towards an Advanced Economy: Superior Skills, Quality Jobs, Higher Incomes, http://www.mof.gov.sg/budget_2010/speech_toc/pd.html.
11 Centre for Livable Cities (2011) City Report on Singapore, Unpublished UN-Habitat background study for “State of the World’s Cities Report 2012/2013”
12 Belliapa, S.G. (2011) City Report on Bangalore, Unpublished UN-Habitat background study for “State of the World’s Cities Report 2012/2013”
13 Vejella, S. (2011) City Report on Hyderabad, Unpublished UN-Habitat background study for “State of the World’s Cities Report 2012/2013”
14 Jin, L. and Y. Liu (2011) City Report on Shenzhen, Unpublished UN-Habitat background study for “State of the World’s Cities Report 2012/2013”
15 The city’s GDP rose from 136.024 billion Yuan in 1997 to 789.424 billion Yuan in 2010. Even during the serious financial crisis of 2008 and 2009, Chongqing maintained a high growth rate of GDP of 14% [ Liu, Y. and Y. Wang (2011) City Report on Chongqing, Unpublished UN-Habitat background study for “State of the World’s Cities Report 2012/2013”]
16 Kurtul,P. F. (2011) City Report on Gaziantep, Unpublished UN-Habitat background study for “State of the World’s Cities Report 2012/2013”
17 World Bank (2012) World Bank Data:World Development Indicators & Global Development Finance, Online database last updated July 9 2012, http://data.worldbank.org
18 SET-DEV (2011) Technological Responsibility:Guidelines for a shared governance of the processes of socialisation of scientific research and innovation, within an interconnected world, http://www.set-dev.eu/images/pdf/setdev-pg2110728?e6227e3a1ee01ab67932453dd186b586=fe92758461b428418da8873e8a9fc566
19 Ibid.
20 Jin, L. and Y. Liu (2011) op. cit.
21 In ten years of reform and development, the total assets of state-owned enterprises increased from 160 billion Yuan to one trillion Yuan, nearly seven-fold increase [Liu, Y. and Y. Wang (2011) op. cit.]
22 UN-Habitat (2010) State of the World’s Cities 2010/2011 : Cities for All: Bridging the Urban Divide, Earthscan, London
23 UN-Habitat (2010) ‘Scaling New Heights: New Ideas in Urban Planning’, Urban World, Vol. 1, Issue, 4, October. Nairobi.
24 James, P.A., K. Deiglmeier and D. T. Miller (2008) ‘Rediscovering Social Innovations’, Stanford Social Innovation Review, http://www.ssireview.org/articles/entry/rediscovering_social_innovation/
25 Castells, M. (1996) The Information Age: Economy, Society and Culture – Volume 1 – The Rise of the Network Society, Blackwell, Oxford
26 James, P.A., K. Deiglmeier and D. T. Miller (2008) op. cit.
27 Soja, E. W. (2010), Seeking Spatial Justice, University of Minnesota Press, Minneapolis
28 Cohen, M.(2012), Reinventing the Future: Designing Urban 3.0, unpublished proposal for UN-Habitat Habitat 3 Summit.
29 Clos, J. (2012) Urbanization Challenges of the 21st Century, Unpublished document, UN-Habitat, Nairobi
30 Belliapa, S.G. (2011) City Report on Bangalore. Unpublished UN-Habitat background study for “State of the World’s Cities Report 2012/2013”
31 Flyvbjerg, B. (1996) ‘The Dark Side of Planning: Rationality and Realrationalität,’ in Seymour, M., Mazza ,L., and R. Burchell (eds.), Explorations in Planning Theory , Center for Urban Policy Research Press, New Brunswick, NJ. pp. 383-394.
32 Viana, I. (2011) City Report on Montevideo, Unpublished UN-Habitat background study for “State of the World’s Cities Report 2012/2013”
33 López, E. M. (2011), New Urban Planning: Going Back to Basics, Unpublished document, UN-Habitat, Nairobi
34 Kothari, M. and S. Chaudhry (2009), Taking the right to the city forward: Obstacles and promise, background paper for ‘State of the World Cities Report 2010/11’
35 Briney, A. (2009) New Urbanism is Taking Planning to a New Level, http://geography.about.com/od/urbaneconomicgeography/a/newurbanism.htm
36 Clos, J. (2012) op.cit. This ‘global standardization process’ is also referred by professionals like David Mangin (Mangin, D. (2004) La Ville franchisée: Formes et structures de la ville contemporaine, Editions de la Villette, Paris
37 Buhigas, M. (2012), Efficient Urban Planning and Management, background paper for ‘State of the World Cities Report 2012/13’
38 Castellanos, G. (2011) City Report on Santo Domingo. Unpublished UN-Habitat background study for “State of the World’s Cities Report 2012/2013”
39 A highest percentage of respondents in all regions found that planning and management is the most important factor, while the majority of respondents in LAC opined that decentralization of policies and appropriate laws and regulation plays a more important role.
40 ONU-HÁBITAT (2012) El estado de las ciudades de América Latina y el Caribe 2012, ONU-HÁBITAT ,Rio de Janeiro (to be published)
41 Earth Right Institute (2011), Land Rights and Land Value Capture, http://www.earthrights.net/docs/long_form_brochure_lrlvc.html; UN-Habitat (2008), Municipal financing and urban development, UN-Habitat , Nairobi
42 Mendoza, I. R. (2011) City Report on Panama City, Unpublished UN-Habitat background study for “State of the World’s Cities Report 2012/2013”
43 The notion of fixed social capital, which encompasses all assets of society that are not mobile (or soft) but are solid and owned by the public is equivalent to the ‘public goods’ mentioned in this chapter.
44 UNIDO (2008) Public Goods for Economic Development, UNIDO, Vienna, http://www.unido.org/fileadmin/user_media/Publications/documents/Public%20goods%20for%20economic%20development_sale.pdf
45 The CLEAR Network (2006), Urban Planning and Smart Growth, http://www.clear.london.ca/Urban_Planning.html
46 Kimmelman, M. (2012), ‘A City Rises, Along With Its Hopes’, New York Times, May 18, http://www.nytimes.com/2012/05/20/arts/design/fighting-crime-with-architecture-in-medellin-colombia.html?_r=1&pagewanted=all.
47 Sen, A. K., (1999) ‘Democracy as a universal Value’, Journal of Democracy , vol 10 (3), Washington, DC, pp. 3-17
48 ‘Cities have always been exposed to brutal economic pressures from overseas; the nation state has always, to a greater or smaller extent, tried to cushion these pressures.’ [Pierre, J. (2011) The Politics of Urban Governance Palgrave Macmillan, Basingstoke]
49 Menski, W. (2006) Comparative Law in a Global Context: The Legal Systems of Asia and Africa, Cambridge University Press, Cambridge
50 ‘It could well be argued that the growing significance of non-elected actors in urban politics in many countries only increases the need for political control and accountability.’ [Pierre, J. (2011) op.cit.]
51 Pierre, J. (2011) op.cit.
52 Fernandes, E. and M.M.M. Copello (2009) ‘Law and Land Policy in Latin America: Shifting Paradigms and Possibilities for Action’, Land Lines, Lincoln Institute of Land Policy, Cambridge, MA
53 Fernandes, E. (2007a)’ Implementing the urban reform agenda in Brazil’, Environment & Urbanization Vol 19(1), pp. 177–189
54 Fernandes, E. (2007b) “Constructing the `Right to the City’ in Brazil”, Social & Legal Studies, Vol. 16(2), pp. 201-219;
55 UN-Habitat database (2012).
56 See, for instance, Gehl, J. (2010) Cities for People, Island Press, Washington DC.
57 Mendoza, I. R. (2011) City Report on Panama City, Unpublished UN-Habitat background study for “State of the World’s Cities Report 2012/2013”
58 Castellanos, G. (2011) City Report on Santo Domingo, Unpublished UN-Habitat background study for “State of the World’s Cities Report 2012/2013”
59 Talen, E. (2012) City Rules: How Regulations Affect Urban Form, Island Press, Washington DC.
60 Karvinen, M. (2005) Innovation and creativity strategies in Helsinki Metropolitan Area – reinvention of regional governance, proceedings of the 41st ISoCaRP Congress 2005, Bilbao, Spain
61 Berman, Harold. J. (1983) Law and Revolution: The formation of the Western Legal Tradition, vol. 1, Cambridge, MA: Harvard University Press; Menski (2006) op.cit.
62 Bourdieu, P. (2012) Sur l’Etat – Cours au Collège de France 1989-1992, Raisons d’Agir/Seuil, Paris
63 Berman (1983) op. cit.; Sassen, S. (2006) Territory, Authority, Rights: From Medieval to Global Assemblages, Princeton University Press, Princeton
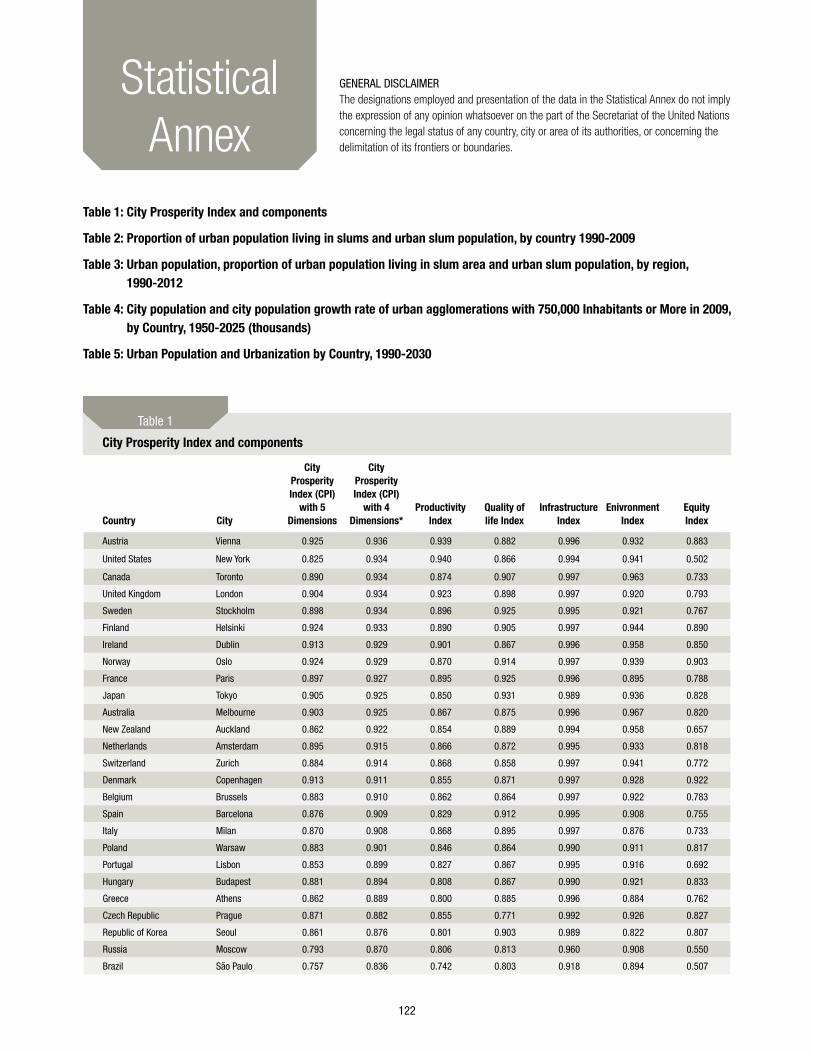
122
Statistical Annex
Country City
City Prosperity Index (CPI)
with 5 Dimensions
City Prosperity Index (CPI)
with 4 Dimensions*
Productivity Index
Quality of life Index
Infrastructure Index
Enivronment Index
Equity Index
Austria Vienna 0.925 0.936 0.939 0.882 0.996 0.932 0.883
United States New York 0.825 0.934 0.940 0.866 0.994 0.941 0.502
Canada Toronto 0.890 0.934 0.874 0.907 0.997 0.963 0.733
United Kingdom London 0.904 0.934 0.923 0.898 0.997 0.920 0.793
Sweden Stockholm 0.898 0.934 0.896 0.925 0.995 0.921 0.767
Finland Helsinki 0.924 0.933 0.890 0.905 0.997 0.944 0.890
Ireland Dublin 0.913 0.929 0.901 0.867 0.996 0.958 0.850
Norway Oslo 0.924 0.929 0.870 0.914 0.997 0.939 0.903
France Paris 0.897 0.927 0.895 0.925 0.996 0.895 0.788
Japan Tokyo 0.905 0.925 0.850 0.931 0.989 0.936 0.828
Australia Melbourne 0.903 0.925 0.867 0.875 0.996 0.967 0.820
New Zealand Auckland 0.862 0.922 0.854 0.889 0.994 0.958 0.657
Netherlands Amsterdam 0.895 0.915 0.866 0.872 0.995 0.933 0.818
Switzerland Zurich 0.884 0.914 0.868 0.858 0.997 0.941 0.772
Denmark Copenhagen 0.913 0.911 0.855 0.871 0.997 0.928 0.922
Belgium Brussels 0.883 0.910 0.862 0.864 0.997 0.922 0.783
Spain Barcelona 0.876 0.909 0.829 0.912 0.995 0.908 0.755
Italy Milan 0.870 0.908 0.868 0.895 0.997 0.876 0.733
Poland Warsaw 0.883 0.901 0.846 0.864 0.990 0.911 0.817
Portugal Lisbon 0.853 0.899 0.827 0.867 0.995 0.916 0.692
Hungary Budapest 0.881 0.894 0.808 0.867 0.990 0.921 0.833
Greece Athens 0.862 0.889 0.800 0.885 0.996 0.884 0.762
Czech Republic Prague 0.871 0.882 0.855 0.771 0.992 0.926 0.827
Republic of Korea Seoul 0.861 0.876 0.801 0.903 0.989 0.822 0.807
Russia Moscow 0.793 0.870 0.806 0.813 0.960 0.908 0.550
Brazil São Paulo 0.757 0.836 0.742 0.803 0.918 0.894 0.507
City Prosperity Index and components
Table 1
GENERAL DISCLAIMERThe designations employed and presentation of the data in the Statistical Annex do not imply the expression of any opinion whatsoever on the part of the Secretariat of the United Nations concerning the legal status of any country, city or area of its authorities, or concerning the delimitation of its frontiers or boundaries.
Table 1: City Prosperity Index and components
Table 2: Proportion of urban population living in slums and urban slum population, by country 1990-2009
Table 3: Urban population, proportion of urban population living in slum area and urban slum population, by region, 1990-2012
Table 4: City population and city population growth rate of urban agglomerations with 750,000 Inhabitants or More in 2009, by Country, 1950-2025 (thousands)
Table 5: Urban Population and Urbanization by Country, 1990-2030
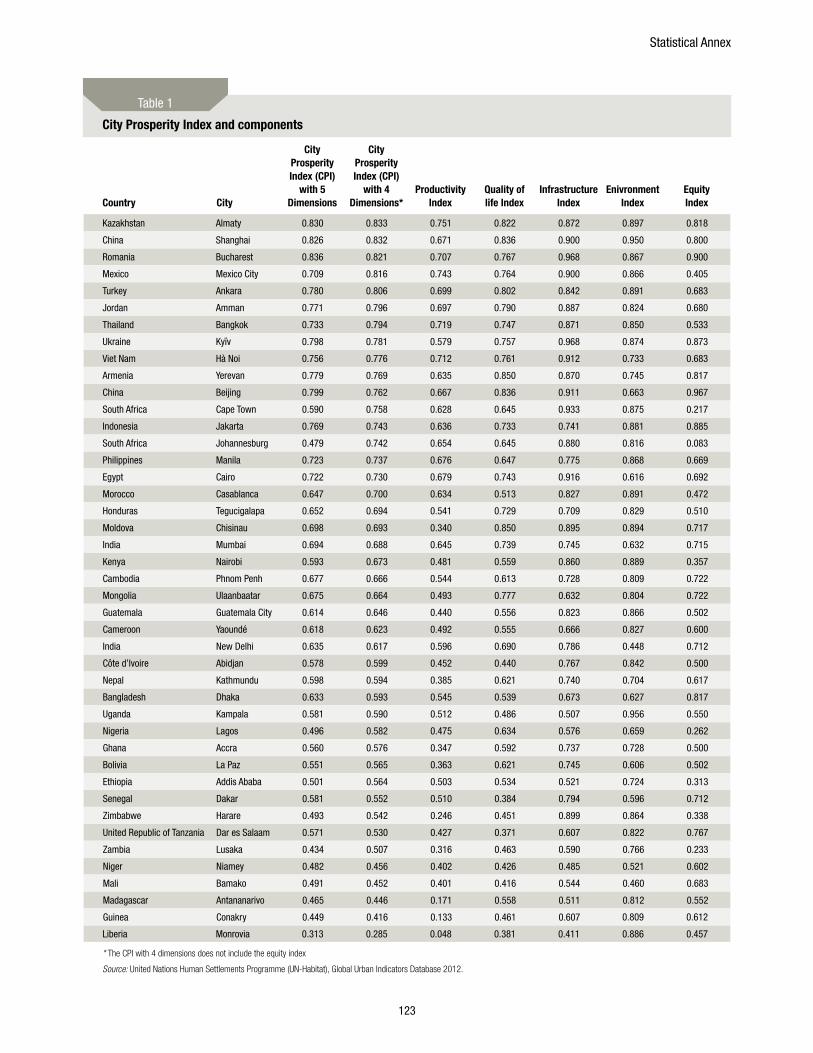
Statistical Annex
123
Country City
City Prosperity Index (CPI)
with 5 Dimensions
City Prosperity Index (CPI)
with 4 Dimensions*
Productivity Index
Quality of life Index
Infrastructure Index
Enivronment Index
Equity Index
Kazakhstan Almaty 0.830 0.833 0.751 0.822 0.872 0.897 0.818
China Shanghai 0.826 0.832 0.671 0.836 0.900 0.950 0.800
Romania Bucharest 0.836 0.821 0.707 0.767 0.968 0.867 0.900
Mexico Mexico City 0.709 0.816 0.743 0.764 0.900 0.866 0.405
Turkey Ankara 0.780 0.806 0.699 0.802 0.842 0.891 0.683
Jordan Amman 0.771 0.796 0.697 0.790 0.887 0.824 0.680
Thailand Bangkok 0.733 0.794 0.719 0.747 0.871 0.850 0.533
Ukraine Kyïv 0.798 0.781 0.579 0.757 0.968 0.874 0.873
Viet Nam Hà Noi 0.756 0.776 0.712 0.761 0.912 0.733 0.683
Armenia Yerevan 0.779 0.769 0.635 0.850 0.870 0.745 0.817
China Beijing 0.799 0.762 0.667 0.836 0.911 0.663 0.967
South Africa Cape Town 0.590 0.758 0.628 0.645 0.933 0.875 0.217
Indonesia Jakarta 0.769 0.743 0.636 0.733 0.741 0.881 0.885
South Africa Johannesburg 0.479 0.742 0.654 0.645 0.880 0.816 0.083
Philippines Manila 0.723 0.737 0.676 0.647 0.775 0.868 0.669
Egypt Cairo 0.722 0.730 0.679 0.743 0.916 0.616 0.692
Morocco Casablanca 0.647 0.700 0.634 0.513 0.827 0.891 0.472
Honduras Tegucigalapa 0.652 0.694 0.541 0.729 0.709 0.829 0.510
Moldova Chisinau 0.698 0.693 0.340 0.850 0.895 0.894 0.717
India Mumbai 0.694 0.688 0.645 0.739 0.745 0.632 0.715
Kenya Nairobi 0.593 0.673 0.481 0.559 0.860 0.889 0.357
Cambodia Phnom Penh 0.677 0.666 0.544 0.613 0.728 0.809 0.722
Mongolia Ulaanbaatar 0.675 0.664 0.493 0.777 0.632 0.804 0.722
Guatemala Guatemala City 0.614 0.646 0.440 0.556 0.823 0.866 0.502
Cameroon Yaoundé 0.618 0.623 0.492 0.555 0.666 0.827 0.600
India New Delhi 0.635 0.617 0.596 0.690 0.786 0.448 0.712
Côte d’Ivoire Abidjan 0.578 0.599 0.452 0.440 0.767 0.842 0.500
Nepal Kathmundu 0.598 0.594 0.385 0.621 0.740 0.704 0.617
Bangladesh Dhaka 0.633 0.593 0.545 0.539 0.673 0.627 0.817
Uganda Kampala 0.581 0.590 0.512 0.486 0.507 0.956 0.550
Nigeria Lagos 0.496 0.582 0.475 0.634 0.576 0.659 0.262
Ghana Accra 0.560 0.576 0.347 0.592 0.737 0.728 0.500
Bolivia La Paz 0.551 0.565 0.363 0.621 0.745 0.606 0.502
Ethiopia Addis Ababa 0.501 0.564 0.503 0.534 0.521 0.724 0.313
Senegal Dakar 0.581 0.552 0.510 0.384 0.794 0.596 0.712
Zimbabwe Harare 0.493 0.542 0.246 0.451 0.899 0.864 0.338
United Republic of Tanzania Dar es Salaam 0.571 0.530 0.427 0.371 0.607 0.822 0.767
Zambia Lusaka 0.434 0.507 0.316 0.463 0.590 0.766 0.233
Niger Niamey 0.482 0.456 0.402 0.426 0.485 0.521 0.602
Mali Bamako 0.491 0.452 0.401 0.416 0.544 0.460 0.683
Madagascar Antananarivo 0.465 0.446 0.171 0.558 0.511 0.812 0.552
Guinea Conakry 0.449 0.416 0.133 0.461 0.607 0.809 0.612
Liberia Monrovia 0.313 0.285 0.048 0.381 0.411 0.886 0.457
* The CPI with 4 dimensions does not include the equity index
Source: United Nations Human Settlements Programme (UN-Habitat), Global Urban Indicators Database 2012.
City Prosperity Index and components
Table 1
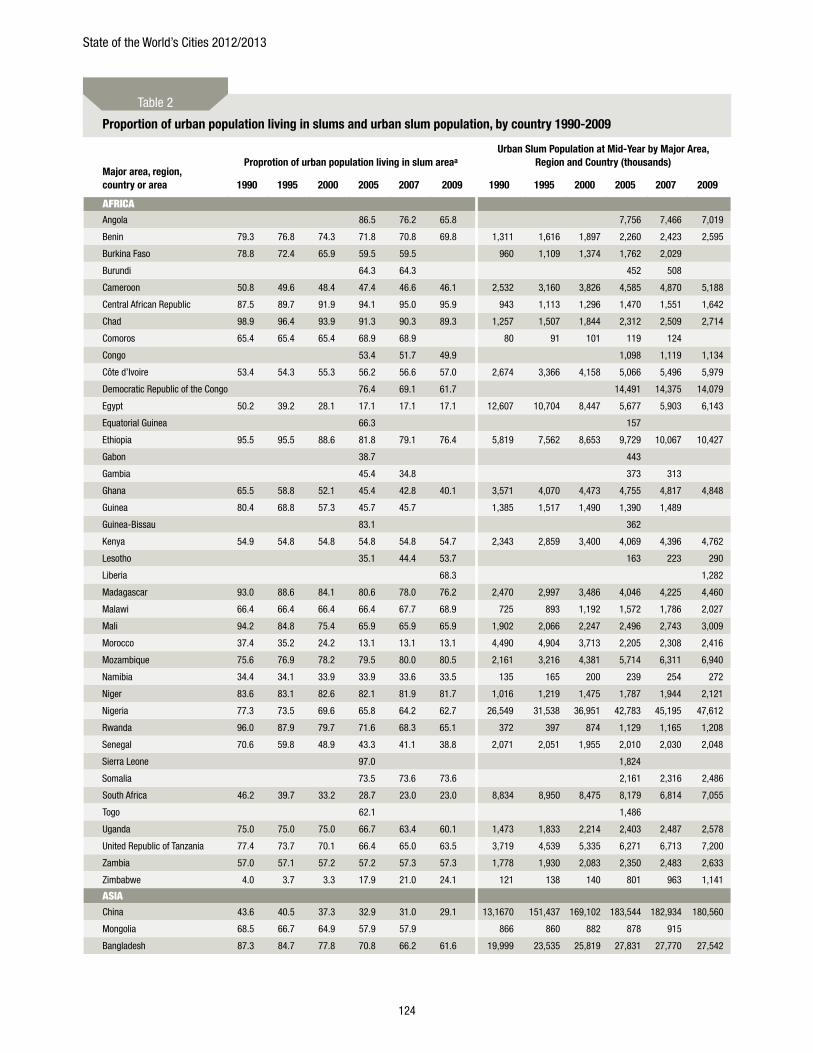
State of the World’s Cities 2012/2013
124
Major area, region, country or area
Proprotion of urban population living in slum areaaUrban Slum Population at Mid-year by Major Area,
Region and Country (thousands)
1990 1995 2000 2005 2007 2009 1990 1995 2000 2005 2007 2009
AfricA Angola 86.5 76.2 65.8 7,756 7,466 7,019
Benin 79.3 76.8 74.3 71.8 70.8 69.8 1,311 1,616 1,897 2,260 2,423 2,595
Burkina Faso 78.8 72.4 65.9 59.5 59.5 960 1,109 1,374 1,762 2,029
Burundi 64.3 64.3 452 508
Cameroon 50.8 49.6 48.4 47.4 46.6 46.1 2,532 3,160 3,826 4,585 4,870 5,188
Central African Republic 87.5 89.7 91.9 94.1 95.0 95.9 943 1,113 1,296 1,470 1,551 1,642
Chad 98.9 96.4 93.9 91.3 90.3 89.3 1,257 1,507 1,844 2,312 2,509 2,714
Comoros 65.4 65.4 65.4 68.9 68.9 80 91 101 119 124
Congo 53.4 51.7 49.9 1,098 1,119 1,134
Côte d’Ivoire 53.4 54.3 55.3 56.2 56.6 57.0 2,674 3,366 4,158 5,066 5,496 5,979
Democratic Republic of the Congo 76.4 69.1 61.7 14,491 14,375 14,079
Egypt 50.2 39.2 28.1 17.1 17.1 17.1 12,607 10,704 8,447 5,677 5,903 6,143
Equatorial Guinea 66.3 157
Ethiopia 95.5 95.5 88.6 81.8 79.1 76.4 5,819 7,562 8,653 9,729 10,067 10,427
Gabon 38.7 443
Gambia 45.4 34.8 373 313
Ghana 65.5 58.8 52.1 45.4 42.8 40.1 3,571 4,070 4,473 4,755 4,817 4,848
Guinea 80.4 68.8 57.3 45.7 45.7 1,385 1,517 1,490 1,390 1,489
Guinea-Bissau 83.1 362
Kenya 54.9 54.8 54.8 54.8 54.8 54.7 2,343 2,859 3,400 4,069 4,396 4,762
Lesotho 35.1 44.4 53.7 163 223 290
Liberia 68.3 1,282
Madagascar 93.0 88.6 84.1 80.6 78.0 76.2 2,470 2,997 3,486 4,046 4,225 4,460
Malawi 66.4 66.4 66.4 66.4 67.7 68.9 725 893 1,192 1,572 1,786 2,027
Mali 94.2 84.8 75.4 65.9 65.9 65.9 1,902 2,066 2,247 2,496 2,743 3,009
Morocco 37.4 35.2 24.2 13.1 13.1 13.1 4,490 4,904 3,713 2,205 2,308 2,416
Mozambique 75.6 76.9 78.2 79.5 80.0 80.5 2,161 3,216 4,381 5,714 6,311 6,940
Namibia 34.4 34.1 33.9 33.9 33.6 33.5 135 165 200 239 254 272
Niger 83.6 83.1 82.6 82.1 81.9 81.7 1,016 1,219 1,475 1,787 1,944 2,121
Nigeria 77.3 73.5 69.6 65.8 64.2 62.7 26,549 31,538 36,951 42,783 45,195 47,612
Rwanda 96.0 87.9 79.7 71.6 68.3 65.1 372 397 874 1,129 1,165 1,208
Senegal 70.6 59.8 48.9 43.3 41.1 38.8 2,071 2,051 1,955 2,010 2,030 2,048
Sierra Leone 97.0 1,824
Somalia 73.5 73.6 73.6 2,161 2,316 2,486
South Africa 46.2 39.7 33.2 28.7 23.0 23.0 8,834 8,950 8,475 8,179 6,814 7,055
Togo 62.1 1,486
Uganda 75.0 75.0 75.0 66.7 63.4 60.1 1,473 1,833 2,214 2,403 2,487 2,578
United Republic of Tanzania 77.4 73.7 70.1 66.4 65.0 63.5 3,719 4,539 5,335 6,271 6,713 7,200
Zambia 57.0 57.1 57.2 57.2 57.3 57.3 1,778 1,930 2,083 2,350 2,483 2,633
Zimbabwe 4.0 3.7 3.3 17.9 21.0 24.1 121 138 140 801 963 1,141
ASIAChina 43.6 40.5 37.3 32.9 31.0 29.1 13,1670 151,437 169,102 183,544 182,934 180,560
Mongolia 68.5 66.7 64.9 57.9 57.9 866 860 882 878 915
Bangladesh 87.3 84.7 77.8 70.8 66.2 61.6 19,999 23,535 25,819 27,831 27,770 27,542
Proportion of urban population living in slums and urban slum population, by country 1990-2009
Table 2
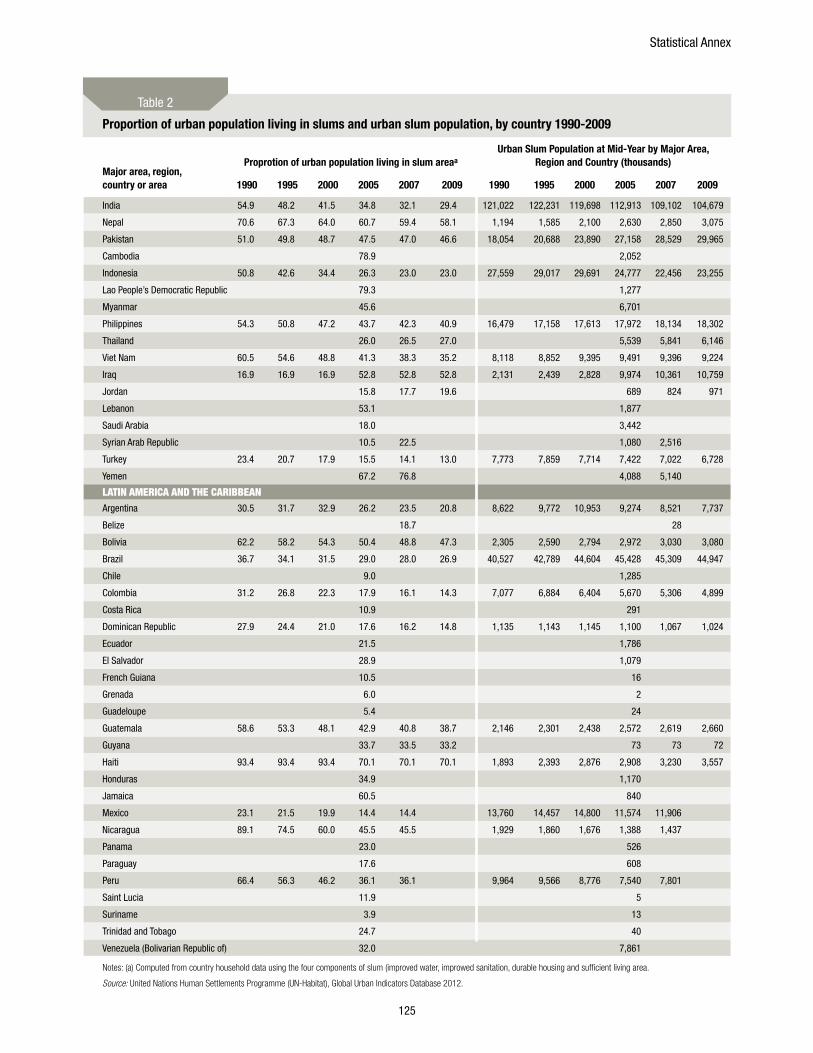
Statistical Annex
125
Major area, region, country or area
Proprotion of urban population living in slum areaaUrban Slum Population at Mid-year by Major Area,
Region and Country (thousands)
1990 1995 2000 2005 2007 2009 1990 1995 2000 2005 2007 2009
India 54.9 48.2 41.5 34.8 32.1 29.4 121,022 122,231 119,698 112,913 109,102 104,679
Nepal 70.6 67.3 64.0 60.7 59.4 58.1 1,194 1,585 2,100 2,630 2,850 3,075
Pakistan 51.0 49.8 48.7 47.5 47.0 46.6 18,054 20,688 23,890 27,158 28,529 29,965
Cambodia 78.9 2,052
Indonesia 50.8 42.6 34.4 26.3 23.0 23.0 27,559 29,017 29,691 24,777 22,456 23,255
Lao People’s Democratic Republic 79.3 1,277
Myanmar 45.6 6,701
Philippines 54.3 50.8 47.2 43.7 42.3 40.9 16,479 17,158 17,613 17,972 18,134 18,302
Thailand 26.0 26.5 27.0 5,539 5,841 6,146
Viet Nam 60.5 54.6 48.8 41.3 38.3 35.2 8,118 8,852 9,395 9,491 9,396 9,224
Iraq 16.9 16.9 16.9 52.8 52.8 52.8 2,131 2,439 2,828 9,974 10,361 10,759
Jordan 15.8 17.7 19.6 689 824 971
Lebanon 53.1 1,877
Saudi Arabia 18.0 3,442
Syrian Arab Republic 10.5 22.5 1,080 2,516
Turkey 23.4 20.7 17.9 15.5 14.1 13.0 7,773 7,859 7,714 7,422 7,022 6,728
Yemen 67.2 76.8 4,088 5,140
LATIn AmERICA AnD THE CARIBBEAn Argentina 30.5 31.7 32.9 26.2 23.5 20.8 8,622 9,772 10,953 9,274 8,521 7,737
Belize 18.7 28
Bolivia 62.2 58.2 54.3 50.4 48.8 47.3 2,305 2,590 2,794 2,972 3,030 3,080
Brazil 36.7 34.1 31.5 29.0 28.0 26.9 40,527 42,789 44,604 45,428 45,309 44,947
Chile 9.0 1,285
Colombia 31.2 26.8 22.3 17.9 16.1 14.3 7,077 6,884 6,404 5,670 5,306 4,899
Costa Rica 10.9 291
Dominican Republic 27.9 24.4 21.0 17.6 16.2 14.8 1,135 1,143 1,145 1,100 1,067 1,024
Ecuador 21.5 1,786
El Salvador 28.9 1,079
French Guiana 10.5 16
Grenada 6.0 2
Guadeloupe 5.4 24
Guatemala 58.6 53.3 48.1 42.9 40.8 38.7 2,146 2,301 2,438 2,572 2,619 2,660
Guyana 33.7 33.5 33.2 73 73 72
Haiti 93.4 93.4 93.4 70.1 70.1 70.1 1,893 2,393 2,876 2,908 3,230 3,557
Honduras 34.9 1,170
Jamaica 60.5 840
Mexico 23.1 21.5 19.9 14.4 14.4 13,760 14,457 14,800 11,574 11,906
Nicaragua 89.1 74.5 60.0 45.5 45.5 1,929 1,860 1,676 1,388 1,437
Panama 23.0 526
Paraguay 17.6 608
Peru 66.4 56.3 46.2 36.1 36.1 9,964 9,566 8,776 7,540 7,801
Saint Lucia 11.9 5
Suriname 3.9 13
Trinidad and Tobago 24.7 40
Venezuela (Bolivarian Republic of) 32.0 7,861
Notes: (a) Computed from country household data using the four components of slum (improved water, improwed sanitation, durable housing and sufficient living area.
Source: United Nations Human Settlements Programme (UN-Habitat), Global Urban Indicators Database 2012.
Proportion of urban population living in slums and urban slum population, by country 1990-2009
Table 2
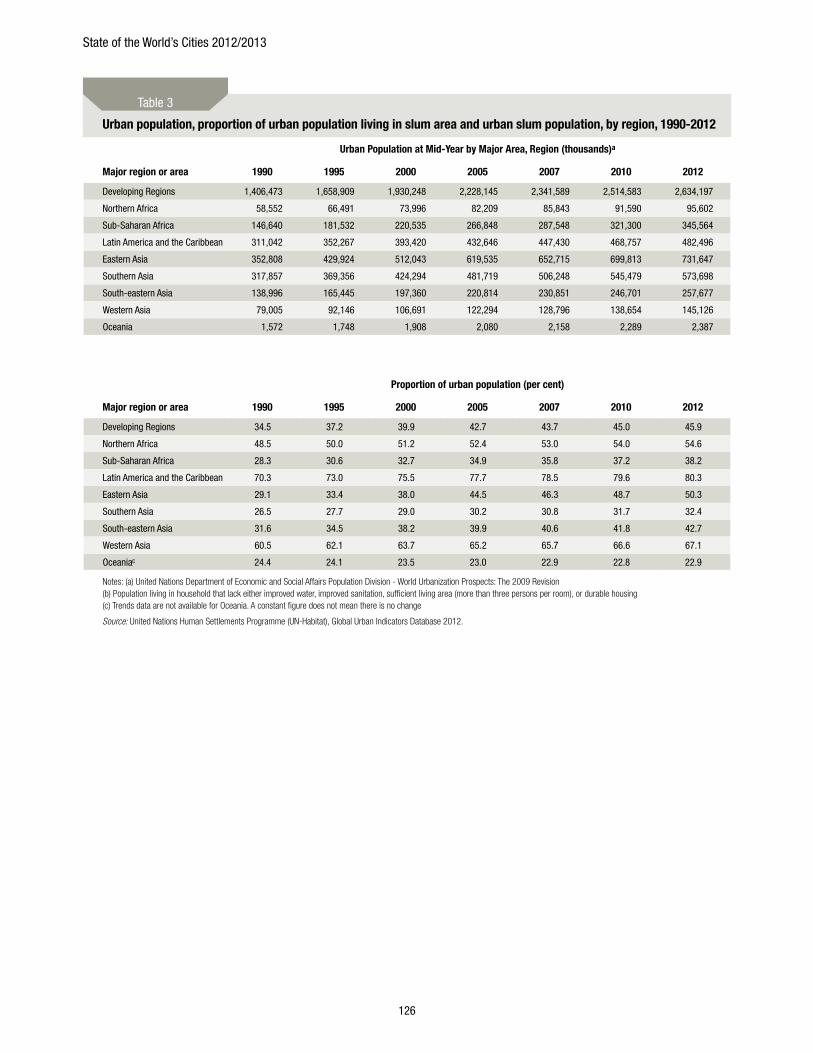
State of the World’s Cities 2012/2013
126
Urban Population at Mid-year by Major Area, Region (thousands)a
Major region or area 1990 1995 2000 2005 2007 2010 2012
Developing Regions 1,406,473 1,658,909 1,930,248 2,228,145 2,341,589 2,514,583 2,634,197
Northern Africa 58,552 66,491 73,996 82,209 85,843 91,590 95,602
Sub-Saharan Africa 146,640 181,532 220,535 266,848 287,548 321,300 345,564
Latin America and the Caribbean 311,042 352,267 393,420 432,646 447,430 468,757 482,496
Eastern Asia 352,808 429,924 512,043 619,535 652,715 699,813 731,647
Southern Asia 317,857 369,356 424,294 481,719 506,248 545,479 573,698
South-eastern Asia 138,996 165,445 197,360 220,814 230,851 246,701 257,677
Western Asia 79,005 92,146 106,691 122,294 128,796 138,654 145,126
Oceania 1,572 1,748 1,908 2,080 2,158 2,289 2,387
Proportion of urban population (per cent)
Major region or area 1990 1995 2000 2005 2007 2010 2012
Developing Regions 34.5 37.2 39.9 42.7 43.7 45.0 45.9
Northern Africa 48.5 50.0 51.2 52.4 53.0 54.0 54.6
Sub-Saharan Africa 28.3 30.6 32.7 34.9 35.8 37.2 38.2
Latin America and the Caribbean 70.3 73.0 75.5 77.7 78.5 79.6 80.3
Eastern Asia 29.1 33.4 38.0 44.5 46.3 48.7 50.3
Southern Asia 26.5 27.7 29.0 30.2 30.8 31.7 32.4
South-eastern Asia 31.6 34.5 38.2 39.9 40.6 41.8 42.7
Western Asia 60.5 62.1 63.7 65.2 65.7 66.6 67.1
Oceaniac 24.4 24.1 23.5 23.0 22.9 22.8 22.9
Notes: (a) United Nations Department of Economic and Social Affairs Population Division - World Urbanization Prospects: The 2009 Revision(b) Population living in household that lack either improved water, improved sanitation, sufficient living area (more than three persons per room), or durable housing(c) Trends data are not available for Oceania. A constant figure does not mean there is no change
Source: United Nations Human Settlements Programme (UN-Habitat), Global Urban Indicators Database 2012.
Urban population, proportion of urban population living in slum area and urban slum population, by region, 1990-2012
Table 3
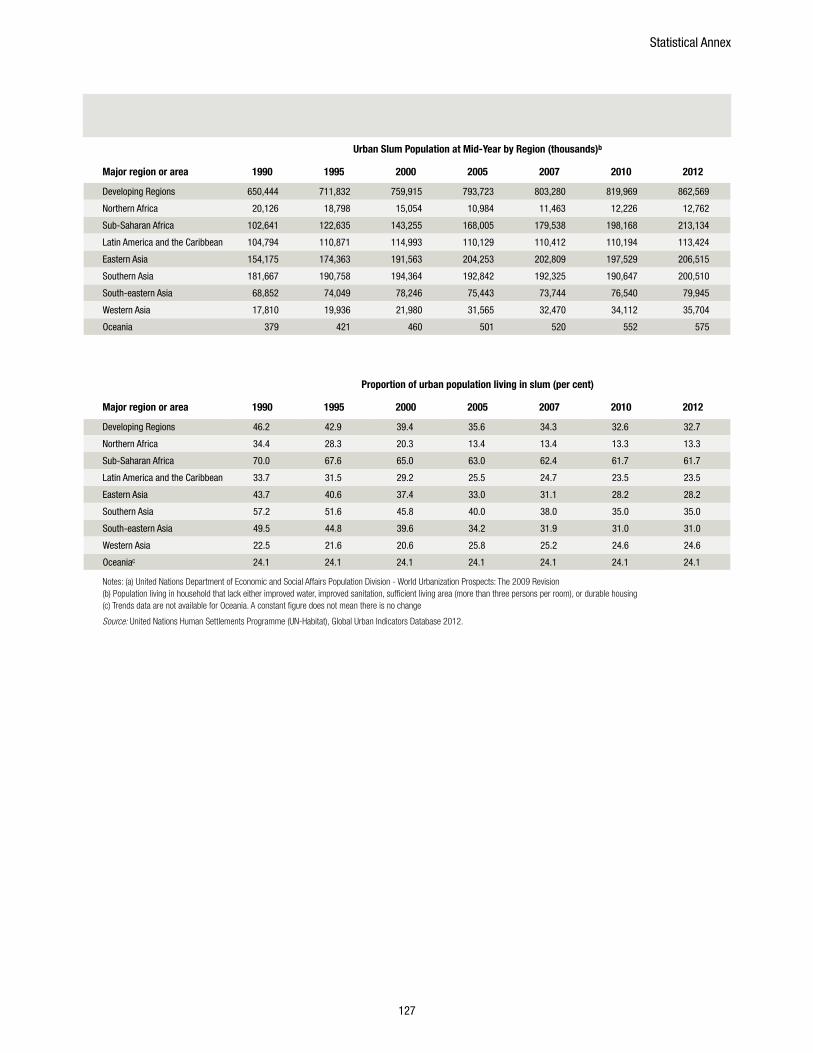
Statistical Annex
127
Urban Slum Population at Mid-year by Region (thousands)b
Major region or area 1990 1995 2000 2005 2007 2010 2012
Developing Regions 650,444 711,832 759,915 793,723 803,280 819,969 862,569
Northern Africa 20,126 18,798 15,054 10,984 11,463 12,226 12,762
Sub-Saharan Africa 102,641 122,635 143,255 168,005 179,538 198,168 213,134
Latin America and the Caribbean 104,794 110,871 114,993 110,129 110,412 110,194 113,424
Eastern Asia 154,175 174,363 191,563 204,253 202,809 197,529 206,515
Southern Asia 181,667 190,758 194,364 192,842 192,325 190,647 200,510
South-eastern Asia 68,852 74,049 78,246 75,443 73,744 76,540 79,945
Western Asia 17,810 19,936 21,980 31,565 32,470 34,112 35,704
Oceania 379 421 460 501 520 552 575
Proportion of urban population living in slum (per cent)
Major region or area 1990 1995 2000 2005 2007 2010 2012
Developing Regions 46.2 42.9 39.4 35.6 34.3 32.6 32.7
Northern Africa 34.4 28.3 20.3 13.4 13.4 13.3 13.3
Sub-Saharan Africa 70.0 67.6 65.0 63.0 62.4 61.7 61.7
Latin America and the Caribbean 33.7 31.5 29.2 25.5 24.7 23.5 23.5
Eastern Asia 43.7 40.6 37.4 33.0 31.1 28.2 28.2
Southern Asia 57.2 51.6 45.8 40.0 38.0 35.0 35.0
South-eastern Asia 49.5 44.8 39.6 34.2 31.9 31.0 31.0
Western Asia 22.5 21.6 20.6 25.8 25.2 24.6 24.6
Oceaniac 24.1 24.1 24.1 24.1 24.1 24.1 24.1
Notes: (a) United Nations Department of Economic and Social Affairs Population Division - World Urbanization Prospects: The 2009 Revision(b) Population living in household that lack either improved water, improved sanitation, sufficient living area (more than three persons per room), or durable housing(c) Trends data are not available for Oceania. A constant figure does not mean there is no change
Source: United Nations Human Settlements Programme (UN-Habitat), Global Urban Indicators Database 2012.
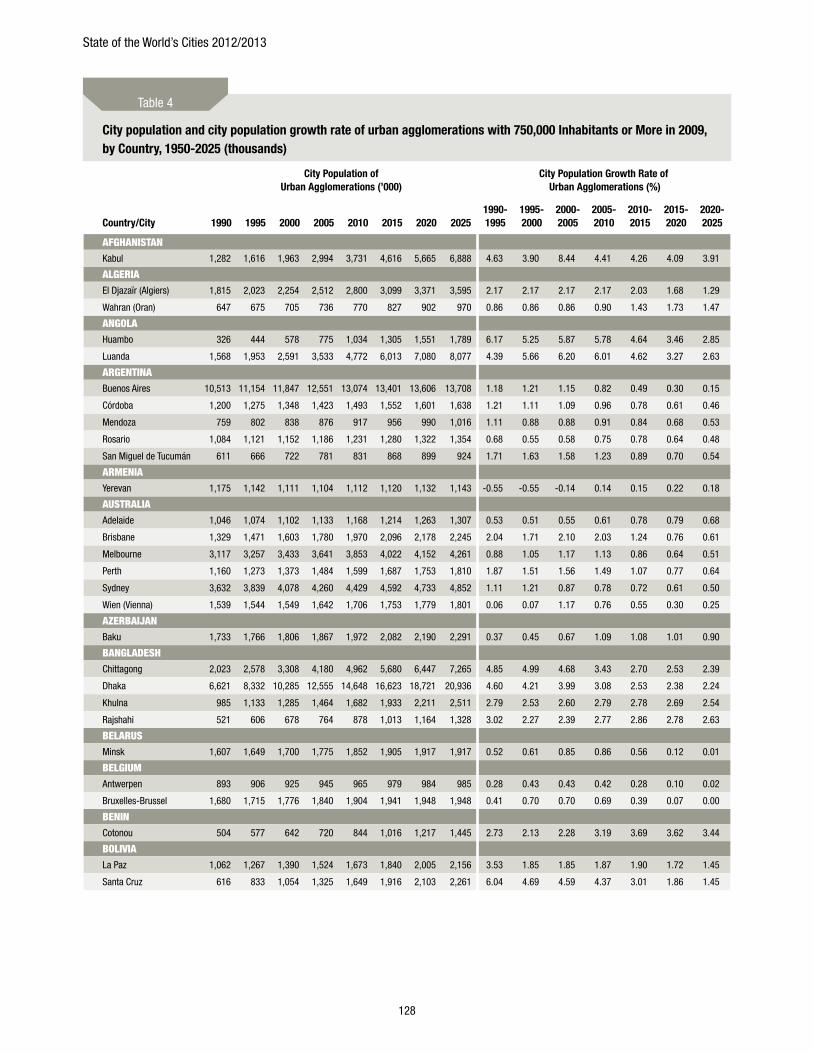
State of the World’s Cities 2012/2013
128
Country/City
City Population of Urban Agglomerations (’000)
City Population Growth Rate of Urban Agglomerations (%)
1990 1995 2000 2005 2010 2015 2020 20251990-1995
1995-2000
2000-2005
2005-2010
2010-2015
2015-2020
2020-2025
AFgHAnISTAnKabul 1,282 1,616 1,963 2,994 3,731 4,616 5,665 6,888 4.63 3.90 8.44 4.41 4.26 4.09 3.91
ALgERIAEl Djazaïr (Algiers) 1,815 2,023 2,254 2,512 2,800 3,099 3,371 3,595 2.17 2.17 2.17 2.17 2.03 1.68 1.29
Wahran (Oran) 647 675 705 736 770 827 902 970 0.86 0.86 0.86 0.90 1.43 1.73 1.47
AngOLAHuambo 326 444 578 775 1,034 1,305 1,551 1,789 6.17 5.25 5.87 5.78 4.64 3.46 2.85
Luanda 1,568 1,953 2,591 3,533 4,772 6,013 7,080 8,077 4.39 5.66 6.20 6.01 4.62 3.27 2.63
ARgEnTInABuenos Aires 10,513 11,154 11,847 12,551 13,074 13,401 13,606 13,708 1.18 1.21 1.15 0.82 0.49 0.30 0.15
Córdoba 1,200 1,275 1,348 1,423 1,493 1,552 1,601 1,638 1.21 1.11 1.09 0.96 0.78 0.61 0.46
Mendoza 759 802 838 876 917 956 990 1,016 1.11 0.88 0.88 0.91 0.84 0.68 0.53
Rosario 1,084 1,121 1,152 1,186 1,231 1,280 1,322 1,354 0.68 0.55 0.58 0.75 0.78 0.64 0.48
San Miguel de Tucumán 611 666 722 781 831 868 899 924 1.71 1.63 1.58 1.23 0.89 0.70 0.54
ARmEnIAYerevan 1,175 1,142 1,111 1,104 1,112 1,120 1,132 1,143 -0.55 -0.55 -0.14 0.14 0.15 0.22 0.18
AUSTRALIAAdelaide 1,046 1,074 1,102 1,133 1,168 1,214 1,263 1,307 0.53 0.51 0.55 0.61 0.78 0.79 0.68
Brisbane 1,329 1,471 1,603 1,780 1,970 2,096 2,178 2,245 2.04 1.71 2.10 2.03 1.24 0.76 0.61
Melbourne 3,117 3,257 3,433 3,641 3,853 4,022 4,152 4,261 0.88 1.05 1.17 1.13 0.86 0.64 0.51
Perth 1,160 1,273 1,373 1,484 1,599 1,687 1,753 1,810 1.87 1.51 1.56 1.49 1.07 0.77 0.64
Sydney 3,632 3,839 4,078 4,260 4,429 4,592 4,733 4,852 1.11 1.21 0.87 0.78 0.72 0.61 0.50
Wien (Vienna) 1,539 1,544 1,549 1,642 1,706 1,753 1,779 1,801 0.06 0.07 1.17 0.76 0.55 0.30 0.25
AzERBAIjAnBaku 1,733 1,766 1,806 1,867 1,972 2,082 2,190 2,291 0.37 0.45 0.67 1.09 1.08 1.01 0.90
BAngLADESHChittagong 2,023 2,578 3,308 4,180 4,962 5,680 6,447 7,265 4.85 4.99 4.68 3.43 2.70 2.53 2.39
Dhaka 6,621 8,332 10,285 12,555 14,648 16,623 18,721 20,936 4.60 4.21 3.99 3.08 2.53 2.38 2.24
Khulna 985 1,133 1,285 1,464 1,682 1,933 2,211 2,511 2.79 2.53 2.60 2.79 2.78 2.69 2.54
Rajshahi 521 606 678 764 878 1,013 1,164 1,328 3.02 2.27 2.39 2.77 2.86 2.78 2.63
BELARUSMinsk 1,607 1,649 1,700 1,775 1,852 1,905 1,917 1,917 0.52 0.61 0.85 0.86 0.56 0.12 0.01
BELgIUmAntwerpen 893 906 925 945 965 979 984 985 0.28 0.43 0.43 0.42 0.28 0.10 0.02
Bruxelles-Brussel 1,680 1,715 1,776 1,840 1,904 1,941 1,948 1,948 0.41 0.70 0.70 0.69 0.39 0.07 0.00
BEnInCotonou 504 577 642 720 844 1,016 1,217 1,445 2.73 2.13 2.28 3.19 3.69 3.62 3.44
BOLIvIALa Paz 1,062 1,267 1,390 1,524 1,673 1,840 2,005 2,156 3.53 1.85 1.85 1.87 1.90 1.72 1.45
Santa Cruz 616 833 1,054 1,325 1,649 1,916 2,103 2,261 6.04 4.69 4.59 4.37 3.01 1.86 1.45
City population and city population growth rate of urban agglomerations with 750,000 Inhabitants or More in 2009, by Country, 1950-2025 (thousands)
Table 4
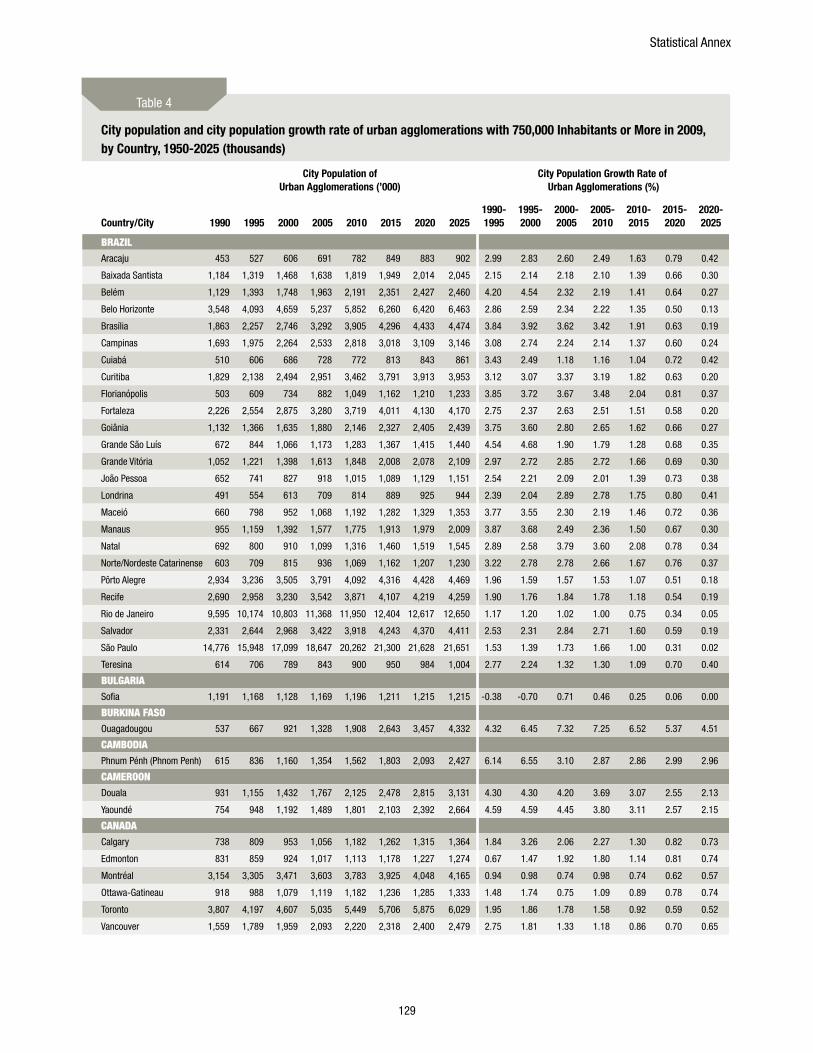
Statistical Annex
129
Country/City
City Population of Urban Agglomerations (’000)
City Population Growth Rate of Urban Agglomerations (%)
1990 1995 2000 2005 2010 2015 2020 20251990-1995
1995-2000
2000-2005
2005-2010
2010-2015
2015-2020
2020-2025
BRAzILAracaju 453 527 606 691 782 849 883 902 2.99 2.83 2.60 2.49 1.63 0.79 0.42
Baixada Santista 1,184 1,319 1,468 1,638 1,819 1,949 2,014 2,045 2.15 2.14 2.18 2.10 1.39 0.66 0.30
Belém 1,129 1,393 1,748 1,963 2,191 2,351 2,427 2,460 4.20 4.54 2.32 2.19 1.41 0.64 0.27
Belo Horizonte 3,548 4,093 4,659 5,237 5,852 6,260 6,420 6,463 2.86 2.59 2.34 2.22 1.35 0.50 0.13
Brasília 1,863 2,257 2,746 3,292 3,905 4,296 4,433 4,474 3.84 3.92 3.62 3.42 1.91 0.63 0.19
Campinas 1,693 1,975 2,264 2,533 2,818 3,018 3,109 3,146 3.08 2.74 2.24 2.14 1.37 0.60 0.24
Cuiabá 510 606 686 728 772 813 843 861 3.43 2.49 1.18 1.16 1.04 0.72 0.42
Curitiba 1,829 2,138 2,494 2,951 3,462 3,791 3,913 3,953 3.12 3.07 3.37 3.19 1.82 0.63 0.20
Florianópolis 503 609 734 882 1,049 1,162 1,210 1,233 3.85 3.72 3.67 3.48 2.04 0.81 0.37
Fortaleza 2,226 2,554 2,875 3,280 3,719 4,011 4,130 4,170 2.75 2.37 2.63 2.51 1.51 0.58 0.20
Goiânia 1,132 1,366 1,635 1,880 2,146 2,327 2,405 2,439 3.75 3.60 2.80 2.65 1.62 0.66 0.27
Grande São Luís 672 844 1,066 1,173 1,283 1,367 1,415 1,440 4.54 4.68 1.90 1.79 1.28 0.68 0.35
Grande Vitória 1,052 1,221 1,398 1,613 1,848 2,008 2,078 2,109 2.97 2.72 2.85 2.72 1.66 0.69 0.30
João Pessoa 652 741 827 918 1,015 1,089 1,129 1,151 2.54 2.21 2.09 2.01 1.39 0.73 0.38
Londrina 491 554 613 709 814 889 925 944 2.39 2.04 2.89 2.78 1.75 0.80 0.41
Maceió 660 798 952 1,068 1,192 1,282 1,329 1,353 3.77 3.55 2.30 2.19 1.46 0.72 0.36
Manaus 955 1,159 1,392 1,577 1,775 1,913 1,979 2,009 3.87 3.68 2.49 2.36 1.50 0.67 0.30
Natal 692 800 910 1,099 1,316 1,460 1,519 1,545 2.89 2.58 3.79 3.60 2.08 0.78 0.34
Norte/Nordeste Catarinense 603 709 815 936 1,069 1,162 1,207 1,230 3.22 2.78 2.78 2.66 1.67 0.76 0.37
Pôrto Alegre 2,934 3,236 3,505 3,791 4,092 4,316 4,428 4,469 1.96 1.59 1.57 1.53 1.07 0.51 0.18
Recife 2,690 2,958 3,230 3,542 3,871 4,107 4,219 4,259 1.90 1.76 1.84 1.78 1.18 0.54 0.19
Rio de Janeiro 9,595 10,174 10,803 11,368 11,950 12,404 12,617 12,650 1.17 1.20 1.02 1.00 0.75 0.34 0.05
Salvador 2,331 2,644 2,968 3,422 3,918 4,243 4,370 4,411 2.53 2.31 2.84 2.71 1.60 0.59 0.19
São Paulo 14,776 15,948 17,099 18,647 20,262 21,300 21,628 21,651 1.53 1.39 1.73 1.66 1.00 0.31 0.02
Teresina 614 706 789 843 900 950 984 1,004 2.77 2.24 1.32 1.30 1.09 0.70 0.40
BULgARIASofia 1,191 1,168 1,128 1,169 1,196 1,211 1,215 1,215 -0.38 -0.70 0.71 0.46 0.25 0.06 0.00
BURkInA FASOOuagadougou 537 667 921 1,328 1,908 2,643 3,457 4,332 4.32 6.45 7.32 7.25 6.52 5.37 4.51
CAmBODIAPhnum Pénh (Phnom Penh) 615 836 1,160 1,354 1,562 1,803 2,093 2,427 6.14 6.55 3.10 2.87 2.86 2.99 2.96
CAmEROOnDouala 931 1,155 1,432 1,767 2,125 2,478 2,815 3,131 4.30 4.30 4.20 3.69 3.07 2.55 2.13
Yaoundé 754 948 1,192 1,489 1,801 2,103 2,392 2,664 4.59 4.59 4.45 3.80 3.11 2.57 2.15
CAnADACalgary 738 809 953 1,056 1,182 1,262 1,315 1,364 1.84 3.26 2.06 2.27 1.30 0.82 0.73
Edmonton 831 859 924 1,017 1,113 1,178 1,227 1,274 0.67 1.47 1.92 1.80 1.14 0.81 0.74
Montréal 3,154 3,305 3,471 3,603 3,783 3,925 4,048 4,165 0.94 0.98 0.74 0.98 0.74 0.62 0.57
Ottawa-Gatineau 918 988 1,079 1,119 1,182 1,236 1,285 1,333 1.48 1.74 0.75 1.09 0.89 0.78 0.74
Toronto 3,807 4,197 4,607 5,035 5,449 5,706 5,875 6,029 1.95 1.86 1.78 1.58 0.92 0.59 0.52
Vancouver 1,559 1,789 1,959 2,093 2,220 2,318 2,400 2,479 2.75 1.81 1.33 1.18 0.86 0.70 0.65
City population and city population growth rate of urban agglomerations with 750,000 Inhabitants or More in 2009, by Country, 1950-2025 (thousands)
Table 4
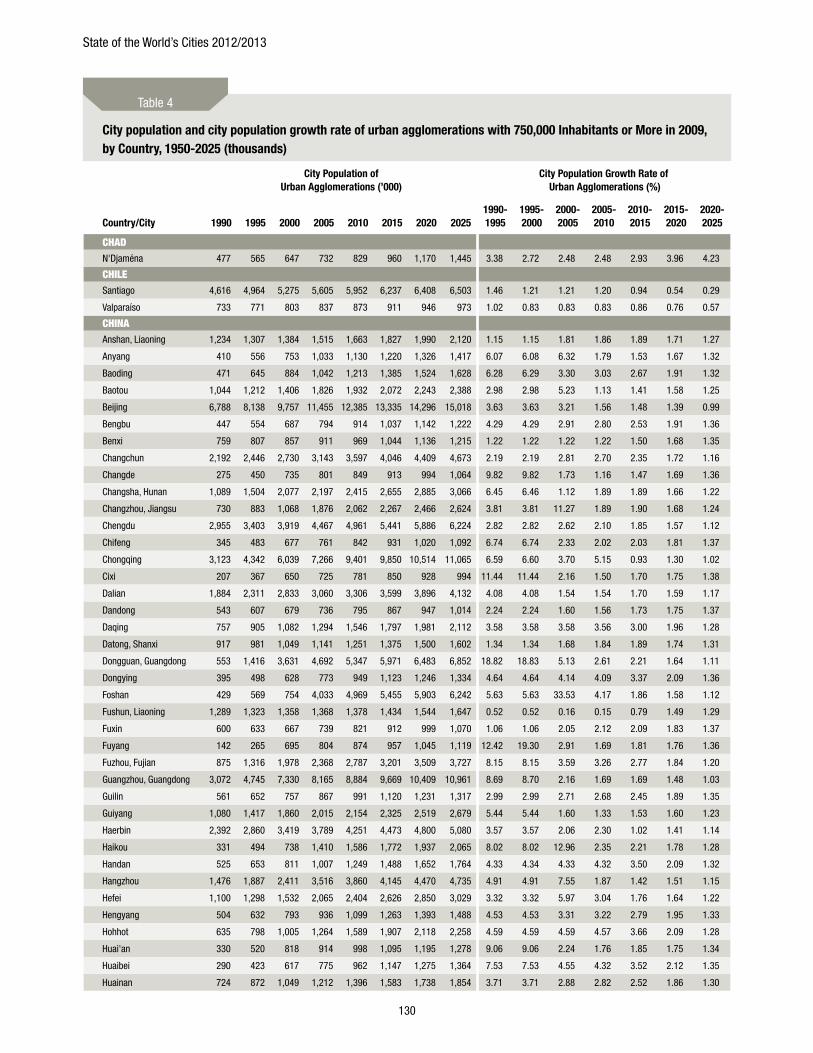
State of the World’s Cities 2012/2013
130
Country/City
City Population of Urban Agglomerations (’000)
City Population Growth Rate of Urban Agglomerations (%)
1990 1995 2000 2005 2010 2015 2020 20251990-1995
1995-2000
2000-2005
2005-2010
2010-2015
2015-2020
2020-2025
CHADN'Djaména 477 565 647 732 829 960 1,170 1,445 3.38 2.72 2.48 2.48 2.93 3.96 4.23
CHILESantiago 4,616 4,964 5,275 5,605 5,952 6,237 6,408 6,503 1.46 1.21 1.21 1.20 0.94 0.54 0.29
Valparaíso 733 771 803 837 873 911 946 973 1.02 0.83 0.83 0.83 0.86 0.76 0.57
CHInAAnshan, Liaoning 1,234 1,307 1,384 1,515 1,663 1,827 1,990 2,120 1.15 1.15 1.81 1.86 1.89 1.71 1.27
Anyang 410 556 753 1,033 1,130 1,220 1,326 1,417 6.07 6.08 6.32 1.79 1.53 1.67 1.32
Baoding 471 645 884 1,042 1,213 1,385 1,524 1,628 6.28 6.29 3.30 3.03 2.67 1.91 1.32
Baotou 1,044 1,212 1,406 1,826 1,932 2,072 2,243 2,388 2.98 2.98 5.23 1.13 1.41 1.58 1.25
Beijing 6,788 8,138 9,757 11,455 12,385 13,335 14,296 15,018 3.63 3.63 3.21 1.56 1.48 1.39 0.99
Bengbu 447 554 687 794 914 1,037 1,142 1,222 4.29 4.29 2.91 2.80 2.53 1.91 1.36
Benxi 759 807 857 911 969 1,044 1,136 1,215 1.22 1.22 1.22 1.22 1.50 1.68 1.35
Changchun 2,192 2,446 2,730 3,143 3,597 4,046 4,409 4,673 2.19 2.19 2.81 2.70 2.35 1.72 1.16
Changde 275 450 735 801 849 913 994 1,064 9.82 9.82 1.73 1.16 1.47 1.69 1.36
Changsha, Hunan 1,089 1,504 2,077 2,197 2,415 2,655 2,885 3,066 6.45 6.46 1.12 1.89 1.89 1.66 1.22
Changzhou, Jiangsu 730 883 1,068 1,876 2,062 2,267 2,466 2,624 3.81 3.81 11.27 1.89 1.90 1.68 1.24
Chengdu 2,955 3,403 3,919 4,467 4,961 5,441 5,886 6,224 2.82 2.82 2.62 2.10 1.85 1.57 1.12
Chifeng 345 483 677 761 842 931 1,020 1,092 6.74 6.74 2.33 2.02 2.03 1.81 1.37
Chongqing 3,123 4,342 6,039 7,266 9,401 9,850 10,514 11,065 6.59 6.60 3.70 5.15 0.93 1.30 1.02
Cixi 207 367 650 725 781 850 928 994 11.44 11.44 2.16 1.50 1.70 1.75 1.38
Dalian 1,884 2,311 2,833 3,060 3,306 3,599 3,896 4,132 4.08 4.08 1.54 1.54 1.70 1.59 1.17
Dandong 543 607 679 736 795 867 947 1,014 2.24 2.24 1.60 1.56 1.73 1.75 1.37
Daqing 757 905 1,082 1,294 1,546 1,797 1,981 2,112 3.58 3.58 3.58 3.56 3.00 1.96 1.28
Datong, Shanxi 917 981 1,049 1,141 1,251 1,375 1,500 1,602 1.34 1.34 1.68 1.84 1.89 1.74 1.31
Dongguan, Guangdong 553 1,416 3,631 4,692 5,347 5,971 6,483 6,852 18.82 18.83 5.13 2.61 2.21 1.64 1.11
Dongying 395 498 628 773 949 1,123 1,246 1,334 4.64 4.64 4.14 4.09 3.37 2.09 1.36
Foshan 429 569 754 4,033 4,969 5,455 5,903 6,242 5.63 5.63 33.53 4.17 1.86 1.58 1.12
Fushun, Liaoning 1,289 1,323 1,358 1,368 1,378 1,434 1,544 1,647 0.52 0.52 0.16 0.15 0.79 1.49 1.29
Fuxin 600 633 667 739 821 912 999 1,070 1.06 1.06 2.05 2.12 2.09 1.83 1.37
Fuyang 142 265 695 804 874 957 1,045 1,119 12.42 19.30 2.91 1.69 1.81 1.76 1.36
Fuzhou, Fujian 875 1,316 1,978 2,368 2,787 3,201 3,509 3,727 8.15 8.15 3.59 3.26 2.77 1.84 1.20
Guangzhou, Guangdong 3,072 4,745 7,330 8,165 8,884 9,669 10,409 10,961 8.69 8.70 2.16 1.69 1.69 1.48 1.03
Guilin 561 652 757 867 991 1,120 1,231 1,317 2.99 2.99 2.71 2.68 2.45 1.89 1.35
Guiyang 1,080 1,417 1,860 2,015 2,154 2,325 2,519 2,679 5.44 5.44 1.60 1.33 1.53 1.60 1.23
Haerbin 2,392 2,860 3,419 3,789 4,251 4,473 4,800 5,080 3.57 3.57 2.06 2.30 1.02 1.41 1.14
Haikou 331 494 738 1,410 1,586 1,772 1,937 2,065 8.02 8.02 12.96 2.35 2.21 1.78 1.28
Handan 525 653 811 1,007 1,249 1,488 1,652 1,764 4.33 4.34 4.33 4.32 3.50 2.09 1.32
Hangzhou 1,476 1,887 2,411 3,516 3,860 4,145 4,470 4,735 4.91 4.91 7.55 1.87 1.42 1.51 1.15
Hefei 1,100 1,298 1,532 2,065 2,404 2,626 2,850 3,029 3.32 3.32 5.97 3.04 1.76 1.64 1.22
Hengyang 504 632 793 936 1,099 1,263 1,393 1,488 4.53 4.53 3.31 3.22 2.79 1.95 1.33
Hohhot 635 798 1,005 1,264 1,589 1,907 2,118 2,258 4.59 4.59 4.59 4.57 3.66 2.09 1.28
Huai'an 330 520 818 914 998 1,095 1,195 1,278 9.06 9.06 2.24 1.76 1.85 1.75 1.34
Huaibei 290 423 617 775 962 1,147 1,275 1,364 7.53 7.53 4.55 4.32 3.52 2.12 1.35
Huainan 724 872 1,049 1,212 1,396 1,583 1,738 1,854 3.71 3.71 2.88 2.82 2.52 1.86 1.30
City population and city population growth rate of urban agglomerations with 750,000 Inhabitants or More in 2009, by Country, 1950-2025 (thousands)
Table 4
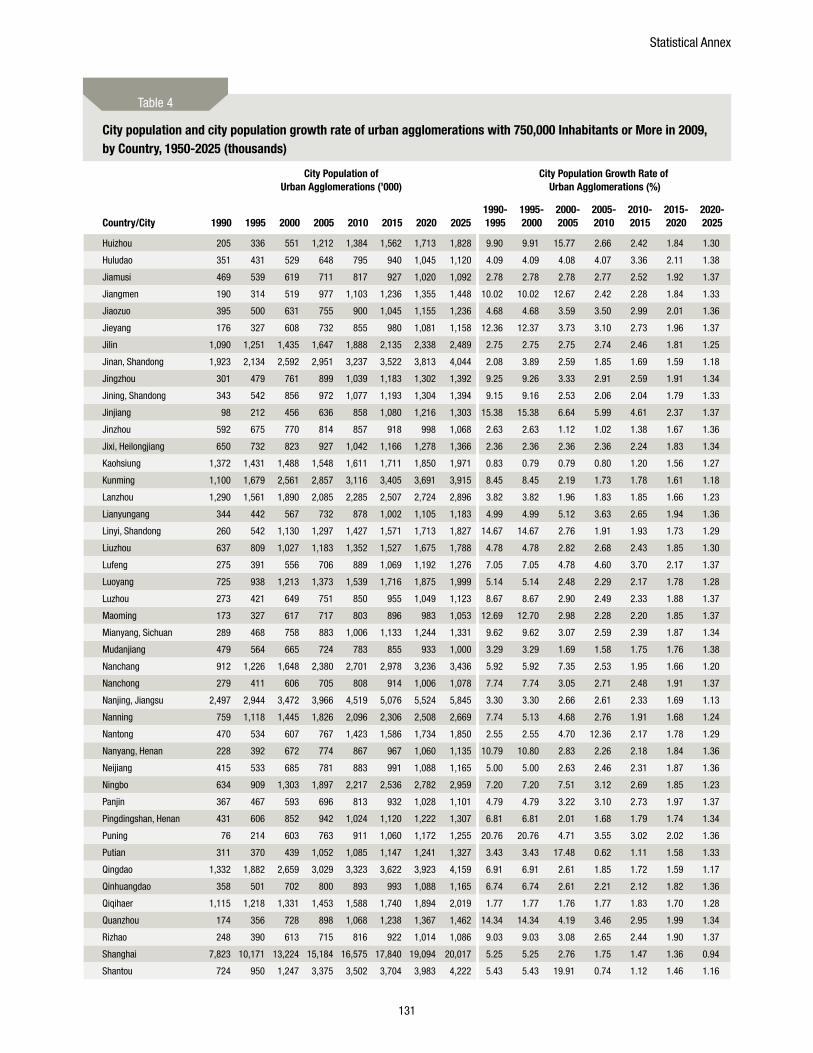
Statistical Annex
131
Country/City
City Population of Urban Agglomerations (’000)
City Population Growth Rate of Urban Agglomerations (%)
1990 1995 2000 2005 2010 2015 2020 20251990-1995
1995-2000
2000-2005
2005-2010
2010-2015
2015-2020
2020-2025
Huizhou 205 336 551 1,212 1,384 1,562 1,713 1,828 9.90 9.91 15.77 2.66 2.42 1.84 1.30
Huludao 351 431 529 648 795 940 1,045 1,120 4.09 4.09 4.08 4.07 3.36 2.11 1.38
Jiamusi 469 539 619 711 817 927 1,020 1,092 2.78 2.78 2.78 2.77 2.52 1.92 1.37
Jiangmen 190 314 519 977 1,103 1,236 1,355 1,448 10.02 10.02 12.67 2.42 2.28 1.84 1.33
Jiaozuo 395 500 631 755 900 1,045 1,155 1,236 4.68 4.68 3.59 3.50 2.99 2.01 1.36
Jieyang 176 327 608 732 855 980 1,081 1,158 12.36 12.37 3.73 3.10 2.73 1.96 1.37
Jilin 1,090 1,251 1,435 1,647 1,888 2,135 2,338 2,489 2.75 2.75 2.75 2.74 2.46 1.81 1.25
Jinan, Shandong 1,923 2,134 2,592 2,951 3,237 3,522 3,813 4,044 2.08 3.89 2.59 1.85 1.69 1.59 1.18
Jingzhou 301 479 761 899 1,039 1,183 1,302 1,392 9.25 9.26 3.33 2.91 2.59 1.91 1.34
Jining, Shandong 343 542 856 972 1,077 1,193 1,304 1,394 9.15 9.16 2.53 2.06 2.04 1.79 1.33
Jinjiang 98 212 456 636 858 1,080 1,216 1,303 15.38 15.38 6.64 5.99 4.61 2.37 1.37
Jinzhou 592 675 770 814 857 918 998 1,068 2.63 2.63 1.12 1.02 1.38 1.67 1.36
Jixi, Heilongjiang 650 732 823 927 1,042 1,166 1,278 1,366 2.36 2.36 2.36 2.36 2.24 1.83 1.34
Kaohsiung 1,372 1,431 1,488 1,548 1,611 1,711 1,850 1,971 0.83 0.79 0.79 0.80 1.20 1.56 1.27
Kunming 1,100 1,679 2,561 2,857 3,116 3,405 3,691 3,915 8.45 8.45 2.19 1.73 1.78 1.61 1.18
Lanzhou 1,290 1,561 1,890 2,085 2,285 2,507 2,724 2,896 3.82 3.82 1.96 1.83 1.85 1.66 1.23
Lianyungang 344 442 567 732 878 1,002 1,105 1,183 4.99 4.99 5.12 3.63 2.65 1.94 1.36
Linyi, Shandong 260 542 1,130 1,297 1,427 1,571 1,713 1,827 14.67 14.67 2.76 1.91 1.93 1.73 1.29
Liuzhou 637 809 1,027 1,183 1,352 1,527 1,675 1,788 4.78 4.78 2.82 2.68 2.43 1.85 1.30
Lufeng 275 391 556 706 889 1,069 1,192 1,276 7.05 7.05 4.78 4.60 3.70 2.17 1.37
Luoyang 725 938 1,213 1,373 1,539 1,716 1,875 1,999 5.14 5.14 2.48 2.29 2.17 1.78 1.28
Luzhou 273 421 649 751 850 955 1,049 1,123 8.67 8.67 2.90 2.49 2.33 1.88 1.37
Maoming 173 327 617 717 803 896 983 1,053 12.69 12.70 2.98 2.28 2.20 1.85 1.37
Mianyang, Sichuan 289 468 758 883 1,006 1,133 1,244 1,331 9.62 9.62 3.07 2.59 2.39 1.87 1.34
Mudanjiang 479 564 665 724 783 855 933 1,000 3.29 3.29 1.69 1.58 1.75 1.76 1.38
Nanchang 912 1,226 1,648 2,380 2,701 2,978 3,236 3,436 5.92 5.92 7.35 2.53 1.95 1.66 1.20
Nanchong 279 411 606 705 808 914 1,006 1,078 7.74 7.74 3.05 2.71 2.48 1.91 1.37
Nanjing, Jiangsu 2,497 2,944 3,472 3,966 4,519 5,076 5,524 5,845 3.30 3.30 2.66 2.61 2.33 1.69 1.13
Nanning 759 1,118 1,445 1,826 2,096 2,306 2,508 2,669 7.74 5.13 4.68 2.76 1.91 1.68 1.24
Nantong 470 534 607 767 1,423 1,586 1,734 1,850 2.55 2.55 4.70 12.36 2.17 1.78 1.29
Nanyang, Henan 228 392 672 774 867 967 1,060 1,135 10.79 10.80 2.83 2.26 2.18 1.84 1.36
Neijiang 415 533 685 781 883 991 1,088 1,165 5.00 5.00 2.63 2.46 2.31 1.87 1.36
Ningbo 634 909 1,303 1,897 2,217 2,536 2,782 2,959 7.20 7.20 7.51 3.12 2.69 1.85 1.23
Panjin 367 467 593 696 813 932 1,028 1,101 4.79 4.79 3.22 3.10 2.73 1.97 1.37
Pingdingshan, Henan 431 606 852 942 1,024 1,120 1,222 1,307 6.81 6.81 2.01 1.68 1.79 1.74 1.34
Puning 76 214 603 763 911 1,060 1,172 1,255 20.76 20.76 4.71 3.55 3.02 2.02 1.36
Putian 311 370 439 1,052 1,085 1,147 1,241 1,327 3.43 3.43 17.48 0.62 1.11 1.58 1.33
Qingdao 1,332 1,882 2,659 3,029 3,323 3,622 3,923 4,159 6.91 6.91 2.61 1.85 1.72 1.59 1.17
Qinhuangdao 358 501 702 800 893 993 1,088 1,165 6.74 6.74 2.61 2.21 2.12 1.82 1.36
Qiqihaer 1,115 1,218 1,331 1,453 1,588 1,740 1,894 2,019 1.77 1.77 1.76 1.77 1.83 1.70 1.28
Quanzhou 174 356 728 898 1,068 1,238 1,367 1,462 14.34 14.34 4.19 3.46 2.95 1.99 1.34
Rizhao 248 390 613 715 816 922 1,014 1,086 9.03 9.03 3.08 2.65 2.44 1.90 1.37
Shanghai 7,823 10,171 13,224 15,184 16,575 17,840 19,094 20,017 5.25 5.25 2.76 1.75 1.47 1.36 0.94
Shantou 724 950 1,247 3,375 3,502 3,704 3,983 4,222 5.43 5.43 19.91 0.74 1.12 1.46 1.16
City population and city population growth rate of urban agglomerations with 750,000 Inhabitants or More in 2009, by Country, 1950-2025 (thousands)
Table 4
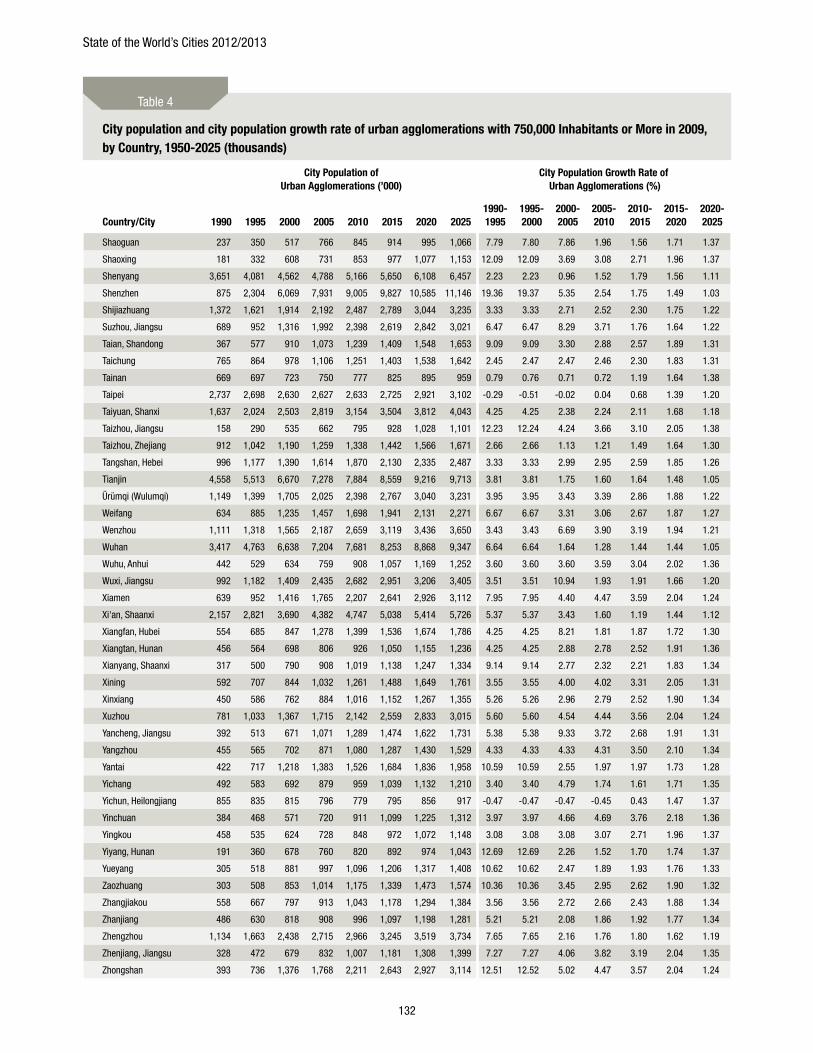
State of the World’s Cities 2012/2013
132
Country/City
City Population of Urban Agglomerations (’000)
City Population Growth Rate of Urban Agglomerations (%)
1990 1995 2000 2005 2010 2015 2020 20251990-1995
1995-2000
2000-2005
2005-2010
2010-2015
2015-2020
2020-2025
Shaoguan 237 350 517 766 845 914 995 1,066 7.79 7.80 7.86 1.96 1.56 1.71 1.37
Shaoxing 181 332 608 731 853 977 1,077 1,153 12.09 12.09 3.69 3.08 2.71 1.96 1.37
Shenyang 3,651 4,081 4,562 4,788 5,166 5,650 6,108 6,457 2.23 2.23 0.96 1.52 1.79 1.56 1.11
Shenzhen 875 2,304 6,069 7,931 9,005 9,827 10,585 11,146 19.36 19.37 5.35 2.54 1.75 1.49 1.03
Shijiazhuang 1,372 1,621 1,914 2,192 2,487 2,789 3,044 3,235 3.33 3.33 2.71 2.52 2.30 1.75 1.22
Suzhou, Jiangsu 689 952 1,316 1,992 2,398 2,619 2,842 3,021 6.47 6.47 8.29 3.71 1.76 1.64 1.22
Taian, Shandong 367 577 910 1,073 1,239 1,409 1,548 1,653 9.09 9.09 3.30 2.88 2.57 1.89 1.31
Taichung 765 864 978 1,106 1,251 1,403 1,538 1,642 2.45 2.47 2.47 2.46 2.30 1.83 1.31
Tainan 669 697 723 750 777 825 895 959 0.79 0.76 0.71 0.72 1.19 1.64 1.38
Taipei 2,737 2,698 2,630 2,627 2,633 2,725 2,921 3,102 -0.29 -0.51 -0.02 0.04 0.68 1.39 1.20
Taiyuan, Shanxi 1,637 2,024 2,503 2,819 3,154 3,504 3,812 4,043 4.25 4.25 2.38 2.24 2.11 1.68 1.18
Taizhou, Jiangsu 158 290 535 662 795 928 1,028 1,101 12.23 12.24 4.24 3.66 3.10 2.05 1.38
Taizhou, Zhejiang 912 1,042 1,190 1,259 1,338 1,442 1,566 1,671 2.66 2.66 1.13 1.21 1.49 1.64 1.30
Tangshan, Hebei 996 1,177 1,390 1,614 1,870 2,130 2,335 2,487 3.33 3.33 2.99 2.95 2.59 1.85 1.26
Tianjin 4,558 5,513 6,670 7,278 7,884 8,559 9,216 9,713 3.81 3.81 1.75 1.60 1.64 1.48 1.05
Ürümqi (Wulumqi) 1,149 1,399 1,705 2,025 2,398 2,767 3,040 3,231 3.95 3.95 3.43 3.39 2.86 1.88 1.22
Weifang 634 885 1,235 1,457 1,698 1,941 2,131 2,271 6.67 6.67 3.31 3.06 2.67 1.87 1.27
Wenzhou 1,111 1,318 1,565 2,187 2,659 3,119 3,436 3,650 3.43 3.43 6.69 3.90 3.19 1.94 1.21
Wuhan 3,417 4,763 6,638 7,204 7,681 8,253 8,868 9,347 6.64 6.64 1.64 1.28 1.44 1.44 1.05
Wuhu, Anhui 442 529 634 759 908 1,057 1,169 1,252 3.60 3.60 3.60 3.59 3.04 2.02 1.36
Wuxi, Jiangsu 992 1,182 1,409 2,435 2,682 2,951 3,206 3,405 3.51 3.51 10.94 1.93 1.91 1.66 1.20
Xiamen 639 952 1,416 1,765 2,207 2,641 2,926 3,112 7.95 7.95 4.40 4.47 3.59 2.04 1.24
Xi'an, Shaanxi 2,157 2,821 3,690 4,382 4,747 5,038 5,414 5,726 5.37 5.37 3.43 1.60 1.19 1.44 1.12
Xiangfan, Hubei 554 685 847 1,278 1,399 1,536 1,674 1,786 4.25 4.25 8.21 1.81 1.87 1.72 1.30
Xiangtan, Hunan 456 564 698 806 926 1,050 1,155 1,236 4.25 4.25 2.88 2.78 2.52 1.91 1.36
Xianyang, Shaanxi 317 500 790 908 1,019 1,138 1,247 1,334 9.14 9.14 2.77 2.32 2.21 1.83 1.34
Xining 592 707 844 1,032 1,261 1,488 1,649 1,761 3.55 3.55 4.00 4.02 3.31 2.05 1.31
Xinxiang 450 586 762 884 1,016 1,152 1,267 1,355 5.26 5.26 2.96 2.79 2.52 1.90 1.34
Xuzhou 781 1,033 1,367 1,715 2,142 2,559 2,833 3,015 5.60 5.60 4.54 4.44 3.56 2.04 1.24
Yancheng, Jiangsu 392 513 671 1,071 1,289 1,474 1,622 1,731 5.38 5.38 9.33 3.72 2.68 1.91 1.31
Yangzhou 455 565 702 871 1,080 1,287 1,430 1,529 4.33 4.33 4.33 4.31 3.50 2.10 1.34
Yantai 422 717 1,218 1,383 1,526 1,684 1,836 1,958 10.59 10.59 2.55 1.97 1.97 1.73 1.28
Yichang 492 583 692 879 959 1,039 1,132 1,210 3.40 3.40 4.79 1.74 1.61 1.71 1.35
Yichun, Heilongjiang 855 835 815 796 779 795 856 917 -0.47 -0.47 -0.47 -0.45 0.43 1.47 1.37
Yinchuan 384 468 571 720 911 1,099 1,225 1,312 3.97 3.97 4.66 4.69 3.76 2.18 1.36
Yingkou 458 535 624 728 848 972 1,072 1,148 3.08 3.08 3.08 3.07 2.71 1.96 1.37
Yiyang, Hunan 191 360 678 760 820 892 974 1,043 12.69 12.69 2.26 1.52 1.70 1.74 1.37
Yueyang 305 518 881 997 1,096 1,206 1,317 1,408 10.62 10.62 2.47 1.89 1.93 1.76 1.33
Zaozhuang 303 508 853 1,014 1,175 1,339 1,473 1,574 10.36 10.36 3.45 2.95 2.62 1.90 1.32
Zhangjiakou 558 667 797 913 1,043 1,178 1,294 1,384 3.56 3.56 2.72 2.66 2.43 1.88 1.34
Zhanjiang 486 630 818 908 996 1,097 1,198 1,281 5.21 5.21 2.08 1.86 1.92 1.77 1.34
Zhengzhou 1,134 1,663 2,438 2,715 2,966 3,245 3,519 3,734 7.65 7.65 2.16 1.76 1.80 1.62 1.19
Zhenjiang, Jiangsu 328 472 679 832 1,007 1,181 1,308 1,399 7.27 7.27 4.06 3.82 3.19 2.04 1.35
Zhongshan 393 736 1,376 1,768 2,211 2,643 2,927 3,114 12.51 12.52 5.02 4.47 3.57 2.04 1.24
City population and city population growth rate of urban agglomerations with 750,000 Inhabitants or More in 2009, by Country, 1950-2025 (thousands)
Table 4
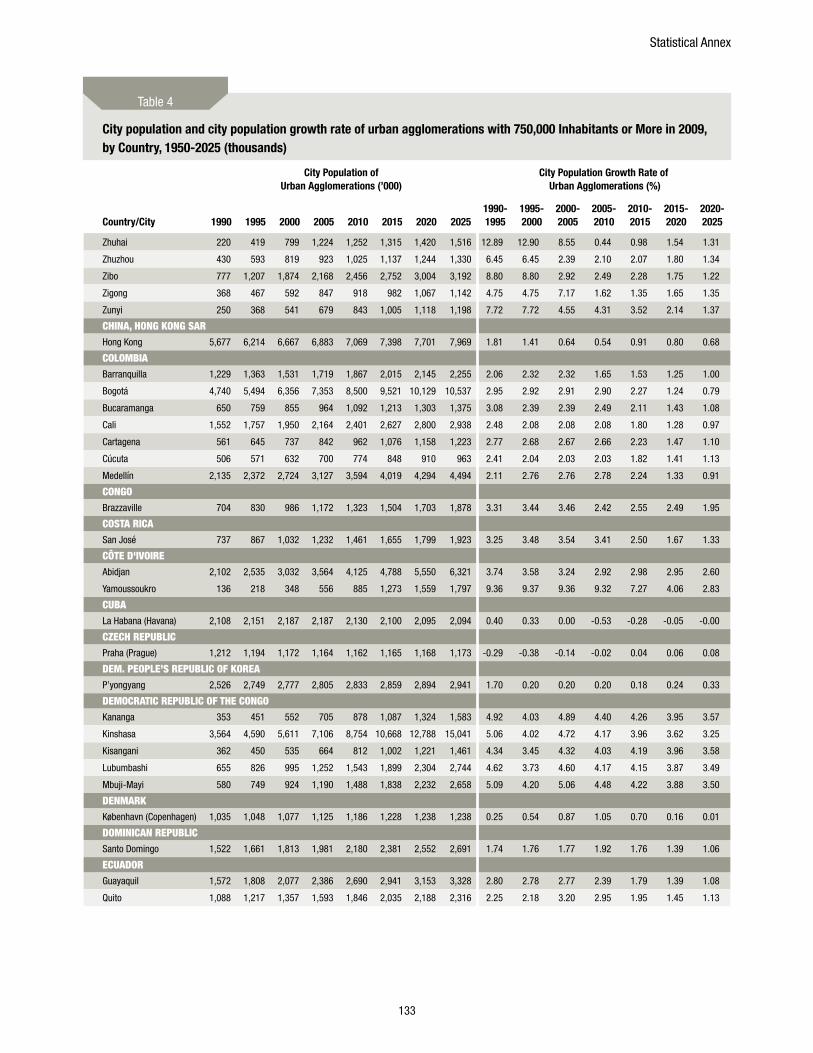
Statistical Annex
133
Country/City
City Population of Urban Agglomerations (’000)
City Population Growth Rate of Urban Agglomerations (%)
1990 1995 2000 2005 2010 2015 2020 20251990-1995
1995-2000
2000-2005
2005-2010
2010-2015
2015-2020
2020-2025
Zhuhai 220 419 799 1,224 1,252 1,315 1,420 1,516 12.89 12.90 8.55 0.44 0.98 1.54 1.31
Zhuzhou 430 593 819 923 1,025 1,137 1,244 1,330 6.45 6.45 2.39 2.10 2.07 1.80 1.34
Zibo 777 1,207 1,874 2,168 2,456 2,752 3,004 3,192 8.80 8.80 2.92 2.49 2.28 1.75 1.22
Zigong 368 467 592 847 918 982 1,067 1,142 4.75 4.75 7.17 1.62 1.35 1.65 1.35
Zunyi 250 368 541 679 843 1,005 1,118 1,198 7.72 7.72 4.55 4.31 3.52 2.14 1.37
CHInA, HOng kOng SARHong Kong 5,677 6,214 6,667 6,883 7,069 7,398 7,701 7,969 1.81 1.41 0.64 0.54 0.91 0.80 0.68
COLOmBIABarranquilla 1,229 1,363 1,531 1,719 1,867 2,015 2,145 2,255 2.06 2.32 2.32 1.65 1.53 1.25 1.00
Bogotá 4,740 5,494 6,356 7,353 8,500 9,521 10,129 10,537 2.95 2.92 2.91 2.90 2.27 1.24 0.79
Bucaramanga 650 759 855 964 1,092 1,213 1,303 1,375 3.08 2.39 2.39 2.49 2.11 1.43 1.08
Cali 1,552 1,757 1,950 2,164 2,401 2,627 2,800 2,938 2.48 2.08 2.08 2.08 1.80 1.28 0.97
Cartagena 561 645 737 842 962 1,076 1,158 1,223 2.77 2.68 2.67 2.66 2.23 1.47 1.10
Cúcuta 506 571 632 700 774 848 910 963 2.41 2.04 2.03 2.03 1.82 1.41 1.13
Medellín 2,135 2,372 2,724 3,127 3,594 4,019 4,294 4,494 2.11 2.76 2.76 2.78 2.24 1.33 0.91
COngOBrazzaville 704 830 986 1,172 1,323 1,504 1,703 1,878 3.31 3.44 3.46 2.42 2.55 2.49 1.95
COSTA RICASan José 737 867 1,032 1,232 1,461 1,655 1,799 1,923 3.25 3.48 3.54 3.41 2.50 1.67 1.33
CôTE D'IvOIREAbidjan 2,102 2,535 3,032 3,564 4,125 4,788 5,550 6,321 3.74 3.58 3.24 2.92 2.98 2.95 2.60
Yamoussoukro 136 218 348 556 885 1,273 1,559 1,797 9.36 9.37 9.36 9.32 7.27 4.06 2.83
CUBALa Habana (Havana) 2,108 2,151 2,187 2,187 2,130 2,100 2,095 2,094 0.40 0.33 0.00 -0.53 -0.28 -0.05 -0.00
CzECH REPUBLICPraha (Prague) 1,212 1,194 1,172 1,164 1,162 1,165 1,168 1,173 -0.29 -0.38 -0.14 -0.02 0.04 0.06 0.08
DEm. PEOPLE’S REPUBLIC OF kOREAP’yongyang 2,526 2,749 2,777 2,805 2,833 2,859 2,894 2,941 1.70 0.20 0.20 0.20 0.18 0.24 0.33
DEmOCRATIC REPUBLIC OF THE COngOKananga 353 451 552 705 878 1,087 1,324 1,583 4.92 4.03 4.89 4.40 4.26 3.95 3.57
Kinshasa 3,564 4,590 5,611 7,106 8,754 10,668 12,788 15,041 5.06 4.02 4.72 4.17 3.96 3.62 3.25
Kisangani 362 450 535 664 812 1,002 1,221 1,461 4.34 3.45 4.32 4.03 4.19 3.96 3.58
Lubumbashi 655 826 995 1,252 1,543 1,899 2,304 2,744 4.62 3.73 4.60 4.17 4.15 3.87 3.49
Mbuji-Mayi 580 749 924 1,190 1,488 1,838 2,232 2,658 5.09 4.20 5.06 4.48 4.22 3.88 3.50
DEnmARkKøbenhavn (Copenhagen) 1,035 1,048 1,077 1,125 1,186 1,228 1,238 1,238 0.25 0.54 0.87 1.05 0.70 0.16 0.01
DOmInICAn REPUBLICSanto Domingo 1,522 1,661 1,813 1,981 2,180 2,381 2,552 2,691 1.74 1.76 1.77 1.92 1.76 1.39 1.06
ECUADORGuayaquil 1,572 1,808 2,077 2,386 2,690 2,941 3,153 3,328 2.80 2.78 2.77 2.39 1.79 1.39 1.08
Quito 1,088 1,217 1,357 1,593 1,846 2,035 2,188 2,316 2.25 2.18 3.20 2.95 1.95 1.45 1.13
City population and city population growth rate of urban agglomerations with 750,000 Inhabitants or More in 2009, by Country, 1950-2025 (thousands)
Table 4
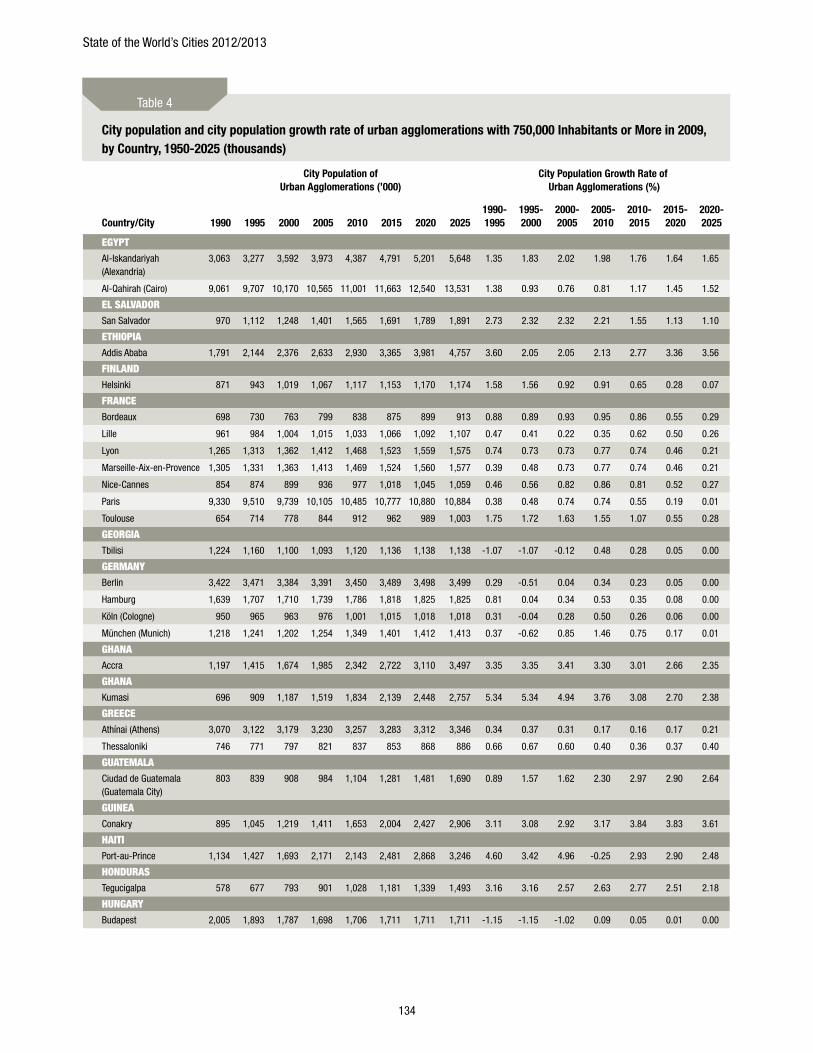
State of the World’s Cities 2012/2013
134
Country/City
City Population of Urban Agglomerations (’000)
City Population Growth Rate of Urban Agglomerations (%)
1990 1995 2000 2005 2010 2015 2020 20251990-1995
1995-2000
2000-2005
2005-2010
2010-2015
2015-2020
2020-2025
EgyPTAl-Iskandariyah (Alexandria)
3,063 3,277 3,592 3,973 4,387 4,791 5,201 5,648 1.35 1.83 2.02 1.98 1.76 1.64 1.65
Al-Qahirah (Cairo) 9,061 9,707 10,170 10,565 11,001 11,663 12,540 13,531 1.38 0.93 0.76 0.81 1.17 1.45 1.52
EL SALvADORSan Salvador 970 1,112 1,248 1,401 1,565 1,691 1,789 1,891 2.73 2.32 2.32 2.21 1.55 1.13 1.10
ETHIOPIAAddis Ababa 1,791 2,144 2,376 2,633 2,930 3,365 3,981 4,757 3.60 2.05 2.05 2.13 2.77 3.36 3.56
FInLAnDHelsinki 871 943 1,019 1,067 1,117 1,153 1,170 1,174 1.58 1.56 0.92 0.91 0.65 0.28 0.07
FRAnCEBordeaux 698 730 763 799 838 875 899 913 0.88 0.89 0.93 0.95 0.86 0.55 0.29
Lille 961 984 1,004 1,015 1,033 1,066 1,092 1,107 0.47 0.41 0.22 0.35 0.62 0.50 0.26
Lyon 1,265 1,313 1,362 1,412 1,468 1,523 1,559 1,575 0.74 0.73 0.73 0.77 0.74 0.46 0.21
Marseille-Aix-en-Provence 1,305 1,331 1,363 1,413 1,469 1,524 1,560 1,577 0.39 0.48 0.73 0.77 0.74 0.46 0.21
Nice-Cannes 854 874 899 936 977 1,018 1,045 1,059 0.46 0.56 0.82 0.86 0.81 0.52 0.27
Paris 9,330 9,510 9,739 10,105 10,485 10,777 10,880 10,884 0.38 0.48 0.74 0.74 0.55 0.19 0.01
Toulouse 654 714 778 844 912 962 989 1,003 1.75 1.72 1.63 1.55 1.07 0.55 0.28
gEORgIATbilisi 1,224 1,160 1,100 1,093 1,120 1,136 1,138 1,138 -1.07 -1.07 -0.12 0.48 0.28 0.05 0.00
gERmAnyBerlin 3,422 3,471 3,384 3,391 3,450 3,489 3,498 3,499 0.29 -0.51 0.04 0.34 0.23 0.05 0.00
Hamburg 1,639 1,707 1,710 1,739 1,786 1,818 1,825 1,825 0.81 0.04 0.34 0.53 0.35 0.08 0.00
Köln (Cologne) 950 965 963 976 1,001 1,015 1,018 1,018 0.31 -0.04 0.28 0.50 0.26 0.06 0.00
München (Munich) 1,218 1,241 1,202 1,254 1,349 1,401 1,412 1,413 0.37 -0.62 0.85 1.46 0.75 0.17 0.01
gHAnAAccra 1,197 1,415 1,674 1,985 2,342 2,722 3,110 3,497 3.35 3.35 3.41 3.30 3.01 2.66 2.35
gHAnAKumasi 696 909 1,187 1,519 1,834 2,139 2,448 2,757 5.34 5.34 4.94 3.76 3.08 2.70 2.38
gREECEAthínai (Athens) 3,070 3,122 3,179 3,230 3,257 3,283 3,312 3,346 0.34 0.37 0.31 0.17 0.16 0.17 0.21
Thessaloniki 746 771 797 821 837 853 868 886 0.66 0.67 0.60 0.40 0.36 0.37 0.40
gUATEmALACiudad de Guatemala (Guatemala City)
803 839 908 984 1,104 1,281 1,481 1,690 0.89 1.57 1.62 2.30 2.97 2.90 2.64
gUInEAConakry 895 1,045 1,219 1,411 1,653 2,004 2,427 2,906 3.11 3.08 2.92 3.17 3.84 3.83 3.61
HAITIPort-au-Prince 1,134 1,427 1,693 2,171 2,143 2,481 2,868 3,246 4.60 3.42 4.96 -0.25 2.93 2.90 2.48
HOnDURASTegucigalpa 578 677 793 901 1,028 1,181 1,339 1,493 3.16 3.16 2.57 2.63 2.77 2.51 2.18
HUngARyBudapest 2,005 1,893 1,787 1,698 1,706 1,711 1,711 1,711 -1.15 -1.15 -1.02 0.09 0.05 0.01 0.00
City population and city population growth rate of urban agglomerations with 750,000 Inhabitants or More in 2009, by Country, 1950-2025 (thousands)
Table 4
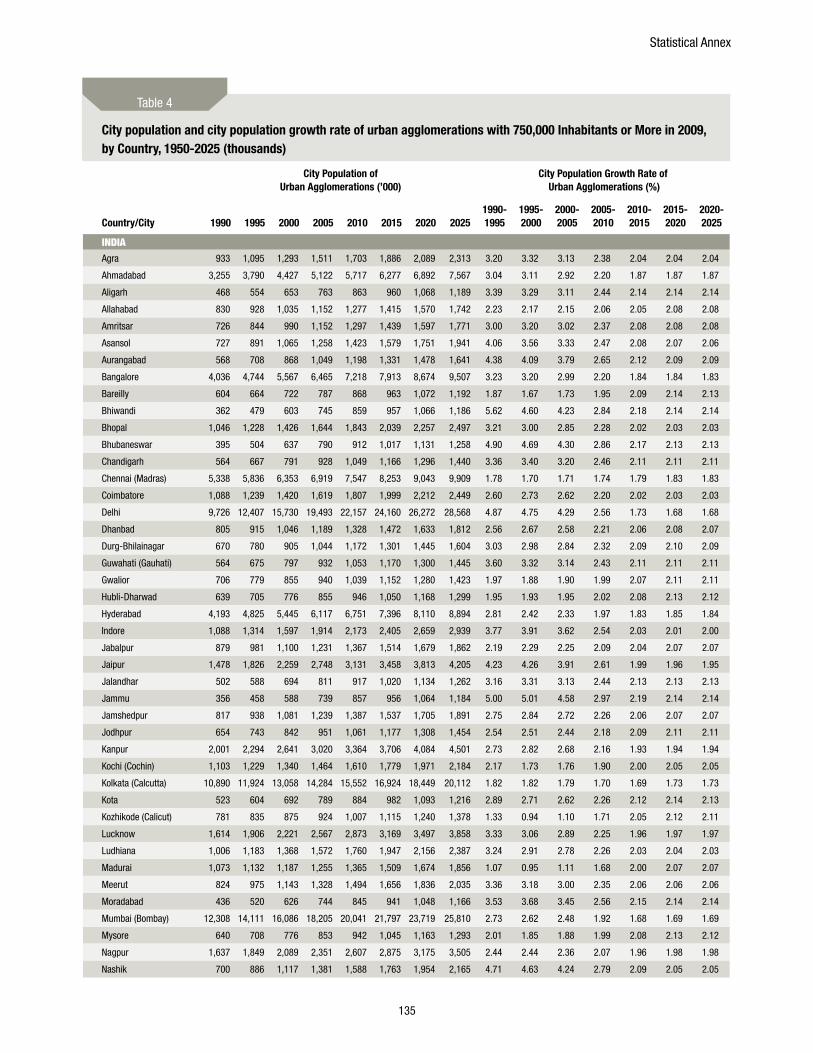
Statistical Annex
135
Country/City
City Population of Urban Agglomerations (’000)
City Population Growth Rate of Urban Agglomerations (%)
1990 1995 2000 2005 2010 2015 2020 20251990-1995
1995-2000
2000-2005
2005-2010
2010-2015
2015-2020
2020-2025
InDIAAgra 933 1,095 1,293 1,511 1,703 1,886 2,089 2,313 3.20 3.32 3.13 2.38 2.04 2.04 2.04
Ahmadabad 3,255 3,790 4,427 5,122 5,717 6,277 6,892 7,567 3.04 3.11 2.92 2.20 1.87 1.87 1.87
Aligarh 468 554 653 763 863 960 1,068 1,189 3.39 3.29 3.11 2.44 2.14 2.14 2.14
Allahabad 830 928 1,035 1,152 1,277 1,415 1,570 1,742 2.23 2.17 2.15 2.06 2.05 2.08 2.08
Amritsar 726 844 990 1,152 1,297 1,439 1,597 1,771 3.00 3.20 3.02 2.37 2.08 2.08 2.08
Asansol 727 891 1,065 1,258 1,423 1,579 1,751 1,941 4.06 3.56 3.33 2.47 2.08 2.07 2.06
Aurangabad 568 708 868 1,049 1,198 1,331 1,478 1,641 4.38 4.09 3.79 2.65 2.12 2.09 2.09
Bangalore 4,036 4,744 5,567 6,465 7,218 7,913 8,674 9,507 3.23 3.20 2.99 2.20 1.84 1.84 1.83
Bareilly 604 664 722 787 868 963 1,072 1,192 1.87 1.67 1.73 1.95 2.09 2.14 2.13
Bhiwandi 362 479 603 745 859 957 1,066 1,186 5.62 4.60 4.23 2.84 2.18 2.14 2.14
Bhopal 1,046 1,228 1,426 1,644 1,843 2,039 2,257 2,497 3.21 3.00 2.85 2.28 2.02 2.03 2.03
Bhubaneswar 395 504 637 790 912 1,017 1,131 1,258 4.90 4.69 4.30 2.86 2.17 2.13 2.13
Chandigarh 564 667 791 928 1,049 1,166 1,296 1,440 3.36 3.40 3.20 2.46 2.11 2.11 2.11
Chennai (Madras) 5,338 5,836 6,353 6,919 7,547 8,253 9,043 9,909 1.78 1.70 1.71 1.74 1.79 1.83 1.83
Coimbatore 1,088 1,239 1,420 1,619 1,807 1,999 2,212 2,449 2.60 2.73 2.62 2.20 2.02 2.03 2.03
Delhi 9,726 12,407 15,730 19,493 22,157 24,160 26,272 28,568 4.87 4.75 4.29 2.56 1.73 1.68 1.68
Dhanbad 805 915 1,046 1,189 1,328 1,472 1,633 1,812 2.56 2.67 2.58 2.21 2.06 2.08 2.07
Durg-Bhilainagar 670 780 905 1,044 1,172 1,301 1,445 1,604 3.03 2.98 2.84 2.32 2.09 2.10 2.09
Guwahati (Gauhati) 564 675 797 932 1,053 1,170 1,300 1,445 3.60 3.32 3.14 2.43 2.11 2.11 2.11
Gwalior 706 779 855 940 1,039 1,152 1,280 1,423 1.97 1.88 1.90 1.99 2.07 2.11 2.11
Hubli-Dharwad 639 705 776 855 946 1,050 1,168 1,299 1.95 1.93 1.95 2.02 2.08 2.13 2.12
Hyderabad 4,193 4,825 5,445 6,117 6,751 7,396 8,110 8,894 2.81 2.42 2.33 1.97 1.83 1.85 1.84
Indore 1,088 1,314 1,597 1,914 2,173 2,405 2,659 2,939 3.77 3.91 3.62 2.54 2.03 2.01 2.00
Jabalpur 879 981 1,100 1,231 1,367 1,514 1,679 1,862 2.19 2.29 2.25 2.09 2.04 2.07 2.07
Jaipur 1,478 1,826 2,259 2,748 3,131 3,458 3,813 4,205 4.23 4.26 3.91 2.61 1.99 1.96 1.95
Jalandhar 502 588 694 811 917 1,020 1,134 1,262 3.16 3.31 3.13 2.44 2.13 2.13 2.13
Jammu 356 458 588 739 857 956 1,064 1,184 5.00 5.01 4.58 2.97 2.19 2.14 2.14
Jamshedpur 817 938 1,081 1,239 1,387 1,537 1,705 1,891 2.75 2.84 2.72 2.26 2.06 2.07 2.07
Jodhpur 654 743 842 951 1,061 1,177 1,308 1,454 2.54 2.51 2.44 2.18 2.09 2.11 2.11
Kanpur 2,001 2,294 2,641 3,020 3,364 3,706 4,084 4,501 2.73 2.82 2.68 2.16 1.93 1.94 1.94
Kochi (Cochin) 1,103 1,229 1,340 1,464 1,610 1,779 1,971 2,184 2.17 1.73 1.76 1.90 2.00 2.05 2.05
Kolkata (Calcutta) 10,890 11,924 13,058 14,284 15,552 16,924 18,449 20,112 1.82 1.82 1.79 1.70 1.69 1.73 1.73
Kota 523 604 692 789 884 982 1,093 1,216 2.89 2.71 2.62 2.26 2.12 2.14 2.13
Kozhikode (Calicut) 781 835 875 924 1,007 1,115 1,240 1,378 1.33 0.94 1.10 1.71 2.05 2.12 2.11
Lucknow 1,614 1,906 2,221 2,567 2,873 3,169 3,497 3,858 3.33 3.06 2.89 2.25 1.96 1.97 1.97
Ludhiana 1,006 1,183 1,368 1,572 1,760 1,947 2,156 2,387 3.24 2.91 2.78 2.26 2.03 2.04 2.03
Madurai 1,073 1,132 1,187 1,255 1,365 1,509 1,674 1,856 1.07 0.95 1.11 1.68 2.00 2.07 2.07
Meerut 824 975 1,143 1,328 1,494 1,656 1,836 2,035 3.36 3.18 3.00 2.35 2.06 2.06 2.06
Moradabad 436 520 626 744 845 941 1,048 1,166 3.53 3.68 3.45 2.56 2.15 2.14 2.14
Mumbai (Bombay) 12,308 14,111 16,086 18,205 20,041 21,797 23,719 25,810 2.73 2.62 2.48 1.92 1.68 1.69 1.69
Mysore 640 708 776 853 942 1,045 1,163 1,293 2.01 1.85 1.88 1.99 2.08 2.13 2.12
Nagpur 1,637 1,849 2,089 2,351 2,607 2,875 3,175 3,505 2.44 2.44 2.36 2.07 1.96 1.98 1.98
Nashik 700 886 1,117 1,381 1,588 1,763 1,954 2,165 4.71 4.63 4.24 2.79 2.09 2.05 2.05
City population and city population growth rate of urban agglomerations with 750,000 Inhabitants or More in 2009, by Country, 1950-2025 (thousands)
Table 4
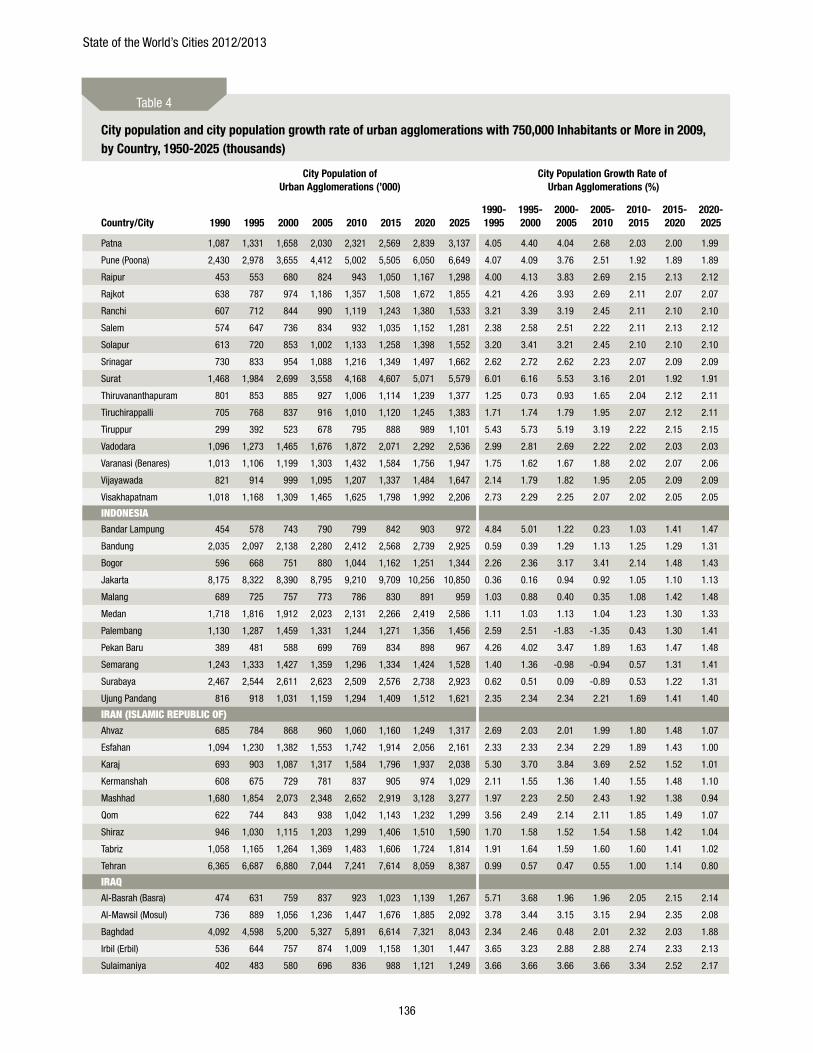
State of the World’s Cities 2012/2013
136
Country/City
City Population of Urban Agglomerations (’000)
City Population Growth Rate of Urban Agglomerations (%)
1990 1995 2000 2005 2010 2015 2020 20251990-1995
1995-2000
2000-2005
2005-2010
2010-2015
2015-2020
2020-2025
Patna 1,087 1,331 1,658 2,030 2,321 2,569 2,839 3,137 4.05 4.40 4.04 2.68 2.03 2.00 1.99
Pune (Poona) 2,430 2,978 3,655 4,412 5,002 5,505 6,050 6,649 4.07 4.09 3.76 2.51 1.92 1.89 1.89
Raipur 453 553 680 824 943 1,050 1,167 1,298 4.00 4.13 3.83 2.69 2.15 2.13 2.12
Rajkot 638 787 974 1,186 1,357 1,508 1,672 1,855 4.21 4.26 3.93 2.69 2.11 2.07 2.07
Ranchi 607 712 844 990 1,119 1,243 1,380 1,533 3.21 3.39 3.19 2.45 2.11 2.10 2.10
Salem 574 647 736 834 932 1,035 1,152 1,281 2.38 2.58 2.51 2.22 2.11 2.13 2.12
Solapur 613 720 853 1,002 1,133 1,258 1,398 1,552 3.20 3.41 3.21 2.45 2.10 2.10 2.10
Srinagar 730 833 954 1,088 1,216 1,349 1,497 1,662 2.62 2.72 2.62 2.23 2.07 2.09 2.09
Surat 1,468 1,984 2,699 3,558 4,168 4,607 5,071 5,579 6.01 6.16 5.53 3.16 2.01 1.92 1.91
Thiruvananthapuram 801 853 885 927 1,006 1,114 1,239 1,377 1.25 0.73 0.93 1.65 2.04 2.12 2.11
Tiruchirappalli 705 768 837 916 1,010 1,120 1,245 1,383 1.71 1.74 1.79 1.95 2.07 2.12 2.11
Tiruppur 299 392 523 678 795 888 989 1,101 5.43 5.73 5.19 3.19 2.22 2.15 2.15
Vadodara 1,096 1,273 1,465 1,676 1,872 2,071 2,292 2,536 2.99 2.81 2.69 2.22 2.02 2.03 2.03
Varanasi (Benares) 1,013 1,106 1,199 1,303 1,432 1,584 1,756 1,947 1.75 1.62 1.67 1.88 2.02 2.07 2.06
Vijayawada 821 914 999 1,095 1,207 1,337 1,484 1,647 2.14 1.79 1.82 1.95 2.05 2.09 2.09
Visakhapatnam 1,018 1,168 1,309 1,465 1,625 1,798 1,992 2,206 2.73 2.29 2.25 2.07 2.02 2.05 2.05
InDOnESIABandar Lampung 454 578 743 790 799 842 903 972 4.84 5.01 1.22 0.23 1.03 1.41 1.47
Bandung 2,035 2,097 2,138 2,280 2,412 2,568 2,739 2,925 0.59 0.39 1.29 1.13 1.25 1.29 1.31
Bogor 596 668 751 880 1,044 1,162 1,251 1,344 2.26 2.36 3.17 3.41 2.14 1.48 1.43
Jakarta 8,175 8,322 8,390 8,795 9,210 9,709 10,256 10,850 0.36 0.16 0.94 0.92 1.05 1.10 1.13
Malang 689 725 757 773 786 830 891 959 1.03 0.88 0.40 0.35 1.08 1.42 1.48
Medan 1,718 1,816 1,912 2,023 2,131 2,266 2,419 2,586 1.11 1.03 1.13 1.04 1.23 1.30 1.33
Palembang 1,130 1,287 1,459 1,331 1,244 1,271 1,356 1,456 2.59 2.51 -1.83 -1.35 0.43 1.30 1.41
Pekan Baru 389 481 588 699 769 834 898 967 4.26 4.02 3.47 1.89 1.63 1.47 1.48
Semarang 1,243 1,333 1,427 1,359 1,296 1,334 1,424 1,528 1.40 1.36 -0.98 -0.94 0.57 1.31 1.41
Surabaya 2,467 2,544 2,611 2,623 2,509 2,576 2,738 2,923 0.62 0.51 0.09 -0.89 0.53 1.22 1.31
Ujung Pandang 816 918 1,031 1,159 1,294 1,409 1,512 1,621 2.35 2.34 2.34 2.21 1.69 1.41 1.40
IRAn (ISLAmIC REPUBLIC OF)Ahvaz 685 784 868 960 1,060 1,160 1,249 1,317 2.69 2.03 2.01 1.99 1.80 1.48 1.07
Esfahan 1,094 1,230 1,382 1,553 1,742 1,914 2,056 2,161 2.33 2.33 2.34 2.29 1.89 1.43 1.00
Karaj 693 903 1,087 1,317 1,584 1,796 1,937 2,038 5.30 3.70 3.84 3.69 2.52 1.52 1.01
Kermanshah 608 675 729 781 837 905 974 1,029 2.11 1.55 1.36 1.40 1.55 1.48 1.10
Mashhad 1,680 1,854 2,073 2,348 2,652 2,919 3,128 3,277 1.97 2.23 2.50 2.43 1.92 1.38 0.94
Qom 622 744 843 938 1,042 1,143 1,232 1,299 3.56 2.49 2.14 2.11 1.85 1.49 1.07
Shiraz 946 1,030 1,115 1,203 1,299 1,406 1,510 1,590 1.70 1.58 1.52 1.54 1.58 1.42 1.04
Tabriz 1,058 1,165 1,264 1,369 1,483 1,606 1,724 1,814 1.91 1.64 1.59 1.60 1.60 1.41 1.02
Tehran 6,365 6,687 6,880 7,044 7,241 7,614 8,059 8,387 0.99 0.57 0.47 0.55 1.00 1.14 0.80
IRAQAl-Basrah (Basra) 474 631 759 837 923 1,023 1,139 1,267 5.71 3.68 1.96 1.96 2.05 2.15 2.14
Al-Mawsil (Mosul) 736 889 1,056 1,236 1,447 1,676 1,885 2,092 3.78 3.44 3.15 3.15 2.94 2.35 2.08
Baghdad 4,092 4,598 5,200 5,327 5,891 6,614 7,321 8,043 2.34 2.46 0.48 2.01 2.32 2.03 1.88
Irbil (Erbil) 536 644 757 874 1,009 1,158 1,301 1,447 3.65 3.23 2.88 2.88 2.74 2.33 2.13
Sulaimaniya 402 483 580 696 836 988 1,121 1,249 3.66 3.66 3.66 3.66 3.34 2.52 2.17
City population and city population growth rate of urban agglomerations with 750,000 Inhabitants or More in 2009, by Country, 1950-2025 (thousands)
Table 4
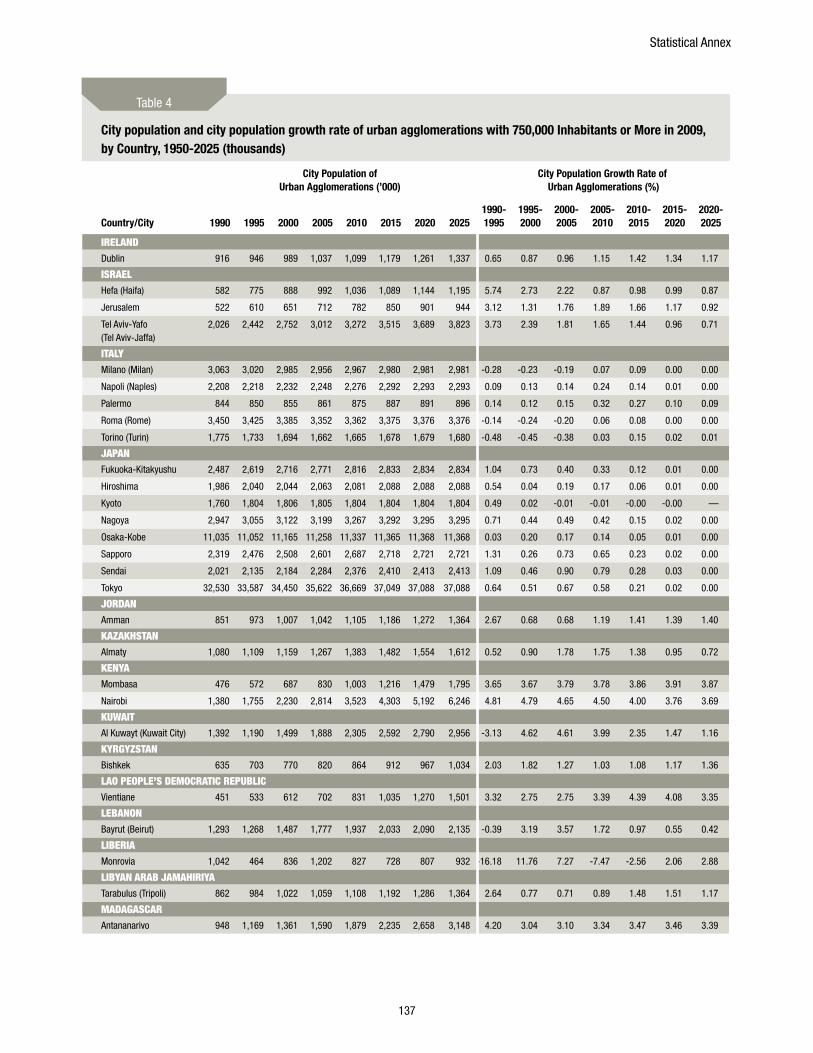
Statistical Annex
137
Country/City
City Population of Urban Agglomerations (’000)
City Population Growth Rate of Urban Agglomerations (%)
1990 1995 2000 2005 2010 2015 2020 20251990-1995
1995-2000
2000-2005
2005-2010
2010-2015
2015-2020
2020-2025
IRELAnDDublin 916 946 989 1,037 1,099 1,179 1,261 1,337 0.65 0.87 0.96 1.15 1.42 1.34 1.17
ISRAELHefa (Haifa) 582 775 888 992 1,036 1,089 1,144 1,195 5.74 2.73 2.22 0.87 0.98 0.99 0.87
Jerusalem 522 610 651 712 782 850 901 944 3.12 1.31 1.76 1.89 1.66 1.17 0.92
Tel Aviv-Yafo (Tel Aviv-Jaffa)
2,026 2,442 2,752 3,012 3,272 3,515 3,689 3,823 3.73 2.39 1.81 1.65 1.44 0.96 0.71
ITALyMilano (Milan) 3,063 3,020 2,985 2,956 2,967 2,980 2,981 2,981 -0.28 -0.23 -0.19 0.07 0.09 0.00 0.00
Napoli (Naples) 2,208 2,218 2,232 2,248 2,276 2,292 2,293 2,293 0.09 0.13 0.14 0.24 0.14 0.01 0.00
Palermo 844 850 855 861 875 887 891 896 0.14 0.12 0.15 0.32 0.27 0.10 0.09
Roma (Rome) 3,450 3,425 3,385 3,352 3,362 3,375 3,376 3,376 -0.14 -0.24 -0.20 0.06 0.08 0.00 0.00
Torino (Turin) 1,775 1,733 1,694 1,662 1,665 1,678 1,679 1,680 -0.48 -0.45 -0.38 0.03 0.15 0.02 0.01
jAPAnFukuoka-Kitakyushu 2,487 2,619 2,716 2,771 2,816 2,833 2,834 2,834 1.04 0.73 0.40 0.33 0.12 0.01 0.00
Hiroshima 1,986 2,040 2,044 2,063 2,081 2,088 2,088 2,088 0.54 0.04 0.19 0.17 0.06 0.01 0.00
Kyoto 1,760 1,804 1,806 1,805 1,804 1,804 1,804 1,804 0.49 0.02 -0.01 -0.01 -0.00 -0.00 —
Nagoya 2,947 3,055 3,122 3,199 3,267 3,292 3,295 3,295 0.71 0.44 0.49 0.42 0.15 0.02 0.00
Osaka-Kobe 11,035 11,052 11,165 11,258 11,337 11,365 11,368 11,368 0.03 0.20 0.17 0.14 0.05 0.01 0.00
Sapporo 2,319 2,476 2,508 2,601 2,687 2,718 2,721 2,721 1.31 0.26 0.73 0.65 0.23 0.02 0.00
Sendai 2,021 2,135 2,184 2,284 2,376 2,410 2,413 2,413 1.09 0.46 0.90 0.79 0.28 0.03 0.00
Tokyo 32,530 33,587 34,450 35,622 36,669 37,049 37,088 37,088 0.64 0.51 0.67 0.58 0.21 0.02 0.00
jORDAnAmman 851 973 1,007 1,042 1,105 1,186 1,272 1,364 2.67 0.68 0.68 1.19 1.41 1.39 1.40
kAzAkHSTAnAlmaty 1,080 1,109 1,159 1,267 1,383 1,482 1,554 1,612 0.52 0.90 1.78 1.75 1.38 0.95 0.72
kEnyAMombasa 476 572 687 830 1,003 1,216 1,479 1,795 3.65 3.67 3.79 3.78 3.86 3.91 3.87
Nairobi 1,380 1,755 2,230 2,814 3,523 4,303 5,192 6,246 4.81 4.79 4.65 4.50 4.00 3.76 3.69
kUWAITAl Kuwayt (Kuwait City) 1,392 1,190 1,499 1,888 2,305 2,592 2,790 2,956 -3.13 4.62 4.61 3.99 2.35 1.47 1.16
kyRgyzSTAnBishkek 635 703 770 820 864 912 967 1,034 2.03 1.82 1.27 1.03 1.08 1.17 1.36
LAO PEOPLE’S DEmOCRATIC REPUBLICVientiane 451 533 612 702 831 1,035 1,270 1,501 3.32 2.75 2.75 3.39 4.39 4.08 3.35
LEBAnOnBayrut (Beirut) 1,293 1,268 1,487 1,777 1,937 2,033 2,090 2,135 -0.39 3.19 3.57 1.72 0.97 0.55 0.42
LIBERIAMonrovia 1,042 464 836 1,202 827 728 807 932 -16.18 11.76 7.27 -7.47 -2.56 2.06 2.88
LIByAn ARAB jAmAHIRIyATarabulus (Tripoli) 862 984 1,022 1,059 1,108 1,192 1,286 1,364 2.64 0.77 0.71 0.89 1.48 1.51 1.17
mADAgASCARAntananarivo 948 1,169 1,361 1,590 1,879 2,235 2,658 3,148 4.20 3.04 3.10 3.34 3.47 3.46 3.39
City population and city population growth rate of urban agglomerations with 750,000 Inhabitants or More in 2009, by Country, 1950-2025 (thousands)
Table 4
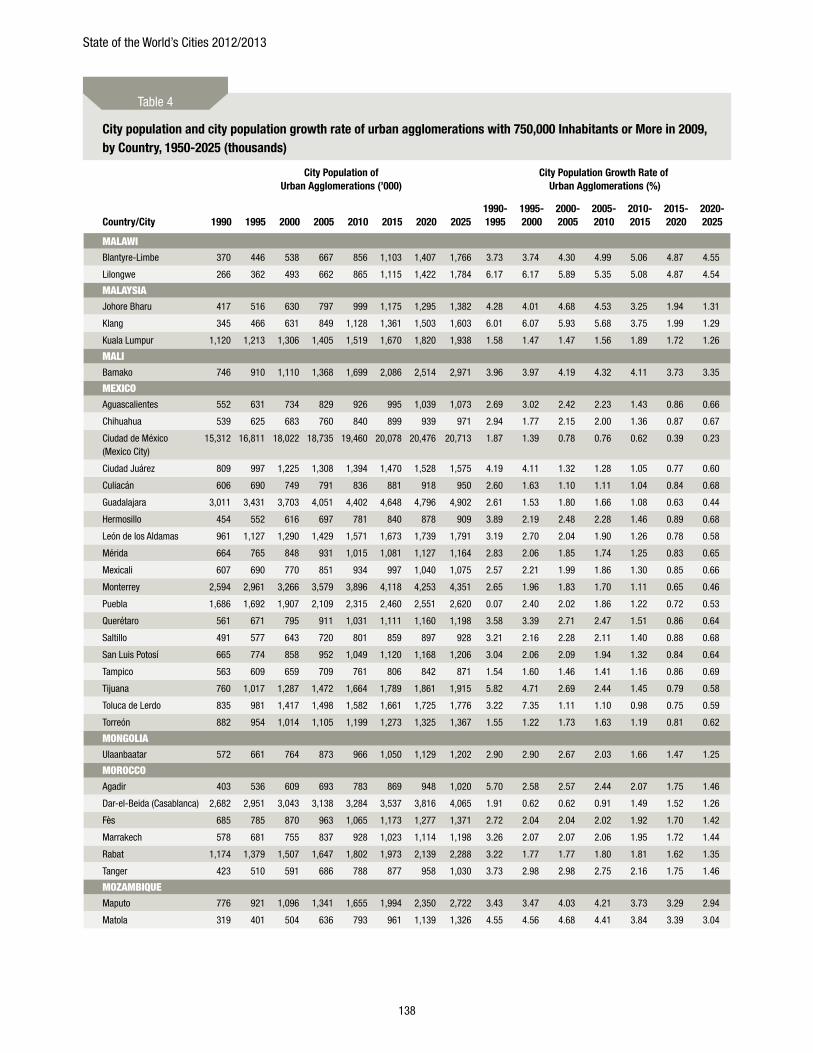
State of the World’s Cities 2012/2013
138
Country/City
City Population of Urban Agglomerations (’000)
City Population Growth Rate of Urban Agglomerations (%)
1990 1995 2000 2005 2010 2015 2020 20251990-1995
1995-2000
2000-2005
2005-2010
2010-2015
2015-2020
2020-2025
mALAWIBlantyre-Limbe 370 446 538 667 856 1,103 1,407 1,766 3.73 3.74 4.30 4.99 5.06 4.87 4.55
Lilongwe 266 362 493 662 865 1,115 1,422 1,784 6.17 6.17 5.89 5.35 5.08 4.87 4.54
mALAySIAJohore Bharu 417 516 630 797 999 1,175 1,295 1,382 4.28 4.01 4.68 4.53 3.25 1.94 1.31
Klang 345 466 631 849 1,128 1,361 1,503 1,603 6.01 6.07 5.93 5.68 3.75 1.99 1.29
Kuala Lumpur 1,120 1,213 1,306 1,405 1,519 1,670 1,820 1,938 1.58 1.47 1.47 1.56 1.89 1.72 1.26
mALIBamako 746 910 1,110 1,368 1,699 2,086 2,514 2,971 3.96 3.97 4.19 4.32 4.11 3.73 3.35
mExICOAguascalientes 552 631 734 829 926 995 1,039 1,073 2.69 3.02 2.42 2.23 1.43 0.86 0.66
Chihuahua 539 625 683 760 840 899 939 971 2.94 1.77 2.15 2.00 1.36 0.87 0.67
Ciudad de México (Mexico City)
15,312 16,811 18,022 18,735 19,460 20,078 20,476 20,713 1.87 1.39 0.78 0.76 0.62 0.39 0.23
Ciudad Juárez 809 997 1,225 1,308 1,394 1,470 1,528 1,575 4.19 4.11 1.32 1.28 1.05 0.77 0.60
Culiacán 606 690 749 791 836 881 918 950 2.60 1.63 1.10 1.11 1.04 0.84 0.68
Guadalajara 3,011 3,431 3,703 4,051 4,402 4,648 4,796 4,902 2.61 1.53 1.80 1.66 1.08 0.63 0.44
Hermosillo 454 552 616 697 781 840 878 909 3.89 2.19 2.48 2.28 1.46 0.89 0.68
León de los Aldamas 961 1,127 1,290 1,429 1,571 1,673 1,739 1,791 3.19 2.70 2.04 1.90 1.26 0.78 0.58
Mérida 664 765 848 931 1,015 1,081 1,127 1,164 2.83 2.06 1.85 1.74 1.25 0.83 0.65
Mexicali 607 690 770 851 934 997 1,040 1,075 2.57 2.21 1.99 1.86 1.30 0.85 0.66
Monterrey 2,594 2,961 3,266 3,579 3,896 4,118 4,253 4,351 2.65 1.96 1.83 1.70 1.11 0.65 0.46
Puebla 1,686 1,692 1,907 2,109 2,315 2,460 2,551 2,620 0.07 2.40 2.02 1.86 1.22 0.72 0.53
Querétaro 561 671 795 911 1,031 1,111 1,160 1,198 3.58 3.39 2.71 2.47 1.51 0.86 0.64
Saltillo 491 577 643 720 801 859 897 928 3.21 2.16 2.28 2.11 1.40 0.88 0.68
San Luis Potosí 665 774 858 952 1,049 1,120 1,168 1,206 3.04 2.06 2.09 1.94 1.32 0.84 0.64
Tampico 563 609 659 709 761 806 842 871 1.54 1.60 1.46 1.41 1.16 0.86 0.69
Tijuana 760 1,017 1,287 1,472 1,664 1,789 1,861 1,915 5.82 4.71 2.69 2.44 1.45 0.79 0.58
Toluca de Lerdo 835 981 1,417 1,498 1,582 1,661 1,725 1,776 3.22 7.35 1.11 1.10 0.98 0.75 0.59
Torreón 882 954 1,014 1,105 1,199 1,273 1,325 1,367 1.55 1.22 1.73 1.63 1.19 0.81 0.62
mOngOLIAUlaanbaatar 572 661 764 873 966 1,050 1,129 1,202 2.90 2.90 2.67 2.03 1.66 1.47 1.25
mOROCCOAgadir 403 536 609 693 783 869 948 1,020 5.70 2.58 2.57 2.44 2.07 1.75 1.46
Dar-el-Beida (Casablanca) 2,682 2,951 3,043 3,138 3,284 3,537 3,816 4,065 1.91 0.62 0.62 0.91 1.49 1.52 1.26
Fès 685 785 870 963 1,065 1,173 1,277 1,371 2.72 2.04 2.04 2.02 1.92 1.70 1.42
Marrakech 578 681 755 837 928 1,023 1,114 1,198 3.26 2.07 2.07 2.06 1.95 1.72 1.44
Rabat 1,174 1,379 1,507 1,647 1,802 1,973 2,139 2,288 3.22 1.77 1.77 1.80 1.81 1.62 1.35
Tanger 423 510 591 686 788 877 958 1,030 3.73 2.98 2.98 2.75 2.16 1.75 1.46
mOzAmBIQUEMaputo 776 921 1,096 1,341 1,655 1,994 2,350 2,722 3.43 3.47 4.03 4.21 3.73 3.29 2.94
Matola 319 401 504 636 793 961 1,139 1,326 4.55 4.56 4.68 4.41 3.84 3.39 3.04
City population and city population growth rate of urban agglomerations with 750,000 Inhabitants or More in 2009, by Country, 1950-2025 (thousands)
Table 4
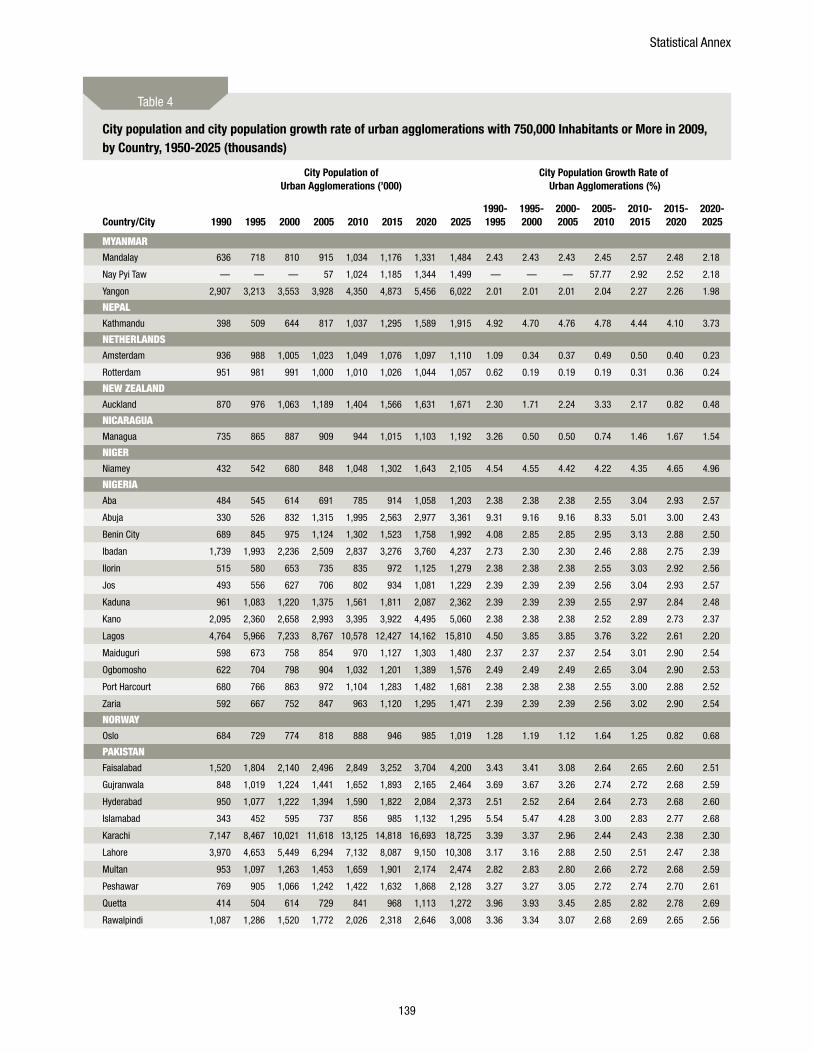
Statistical Annex
139
Country/City
City Population of Urban Agglomerations (’000)
City Population Growth Rate of Urban Agglomerations (%)
1990 1995 2000 2005 2010 2015 2020 20251990-1995
1995-2000
2000-2005
2005-2010
2010-2015
2015-2020
2020-2025
myAnmARMandalay 636 718 810 915 1,034 1,176 1,331 1,484 2.43 2.43 2.43 2.45 2.57 2.48 2.18
Nay Pyi Taw — — — 57 1,024 1,185 1,344 1,499 — — — 57.77 2.92 2.52 2.18
Yangon 2,907 3,213 3,553 3,928 4,350 4,873 5,456 6,022 2.01 2.01 2.01 2.04 2.27 2.26 1.98
nEPALKathmandu 398 509 644 817 1,037 1,295 1,589 1,915 4.92 4.70 4.76 4.78 4.44 4.10 3.73
nETHERLAnDSAmsterdam 936 988 1,005 1,023 1,049 1,076 1,097 1,110 1.09 0.34 0.37 0.49 0.50 0.40 0.23
Rotterdam 951 981 991 1,000 1,010 1,026 1,044 1,057 0.62 0.19 0.19 0.19 0.31 0.36 0.24
nEW zEALAnDAuckland 870 976 1,063 1,189 1,404 1,566 1,631 1,671 2.30 1.71 2.24 3.33 2.17 0.82 0.48
nICARAgUAManagua 735 865 887 909 944 1,015 1,103 1,192 3.26 0.50 0.50 0.74 1.46 1.67 1.54
nIgERNiamey 432 542 680 848 1,048 1,302 1,643 2,105 4.54 4.55 4.42 4.22 4.35 4.65 4.96
nIgERIAAba 484 545 614 691 785 914 1,058 1,203 2.38 2.38 2.38 2.55 3.04 2.93 2.57
Abuja 330 526 832 1,315 1,995 2,563 2,977 3,361 9.31 9.16 9.16 8.33 5.01 3.00 2.43
Benin City 689 845 975 1,124 1,302 1,523 1,758 1,992 4.08 2.85 2.85 2.95 3.13 2.88 2.50
Ibadan 1,739 1,993 2,236 2,509 2,837 3,276 3,760 4,237 2.73 2.30 2.30 2.46 2.88 2.75 2.39
Ilorin 515 580 653 735 835 972 1,125 1,279 2.38 2.38 2.38 2.55 3.03 2.92 2.56
Jos 493 556 627 706 802 934 1,081 1,229 2.39 2.39 2.39 2.56 3.04 2.93 2.57
Kaduna 961 1,083 1,220 1,375 1,561 1,811 2,087 2,362 2.39 2.39 2.39 2.55 2.97 2.84 2.48
Kano 2,095 2,360 2,658 2,993 3,395 3,922 4,495 5,060 2.38 2.38 2.38 2.52 2.89 2.73 2.37
Lagos 4,764 5,966 7,233 8,767 10,578 12,427 14,162 15,810 4.50 3.85 3.85 3.76 3.22 2.61 2.20
Maiduguri 598 673 758 854 970 1,127 1,303 1,480 2.37 2.37 2.37 2.54 3.01 2.90 2.54
Ogbomosho 622 704 798 904 1,032 1,201 1,389 1,576 2.49 2.49 2.49 2.65 3.04 2.90 2.53
Port Harcourt 680 766 863 972 1,104 1,283 1,482 1,681 2.38 2.38 2.38 2.55 3.00 2.88 2.52
Zaria 592 667 752 847 963 1,120 1,295 1,471 2.39 2.39 2.39 2.56 3.02 2.90 2.54
nORWAyOslo 684 729 774 818 888 946 985 1,019 1.28 1.19 1.12 1.64 1.25 0.82 0.68
PAkISTAnFaisalabad 1,520 1,804 2,140 2,496 2,849 3,252 3,704 4,200 3.43 3.41 3.08 2.64 2.65 2.60 2.51
Gujranwala 848 1,019 1,224 1,441 1,652 1,893 2,165 2,464 3.69 3.67 3.26 2.74 2.72 2.68 2.59
Hyderabad 950 1,077 1,222 1,394 1,590 1,822 2,084 2,373 2.51 2.52 2.64 2.64 2.73 2.68 2.60
Islamabad 343 452 595 737 856 985 1,132 1,295 5.54 5.47 4.28 3.00 2.83 2.77 2.68
Karachi 7,147 8,467 10,021 11,618 13,125 14,818 16,693 18,725 3.39 3.37 2.96 2.44 2.43 2.38 2.30
Lahore 3,970 4,653 5,449 6,294 7,132 8,087 9,150 10,308 3.17 3.16 2.88 2.50 2.51 2.47 2.38
Multan 953 1,097 1,263 1,453 1,659 1,901 2,174 2,474 2.82 2.83 2.80 2.66 2.72 2.68 2.59
Peshawar 769 905 1,066 1,242 1,422 1,632 1,868 2,128 3.27 3.27 3.05 2.72 2.74 2.70 2.61
Quetta 414 504 614 729 841 968 1,113 1,272 3.96 3.93 3.45 2.85 2.82 2.78 2.69
Rawalpindi 1,087 1,286 1,520 1,772 2,026 2,318 2,646 3,008 3.36 3.34 3.07 2.68 2.69 2.65 2.56
City population and city population growth rate of urban agglomerations with 750,000 Inhabitants or More in 2009, by Country, 1950-2025 (thousands)
Table 4
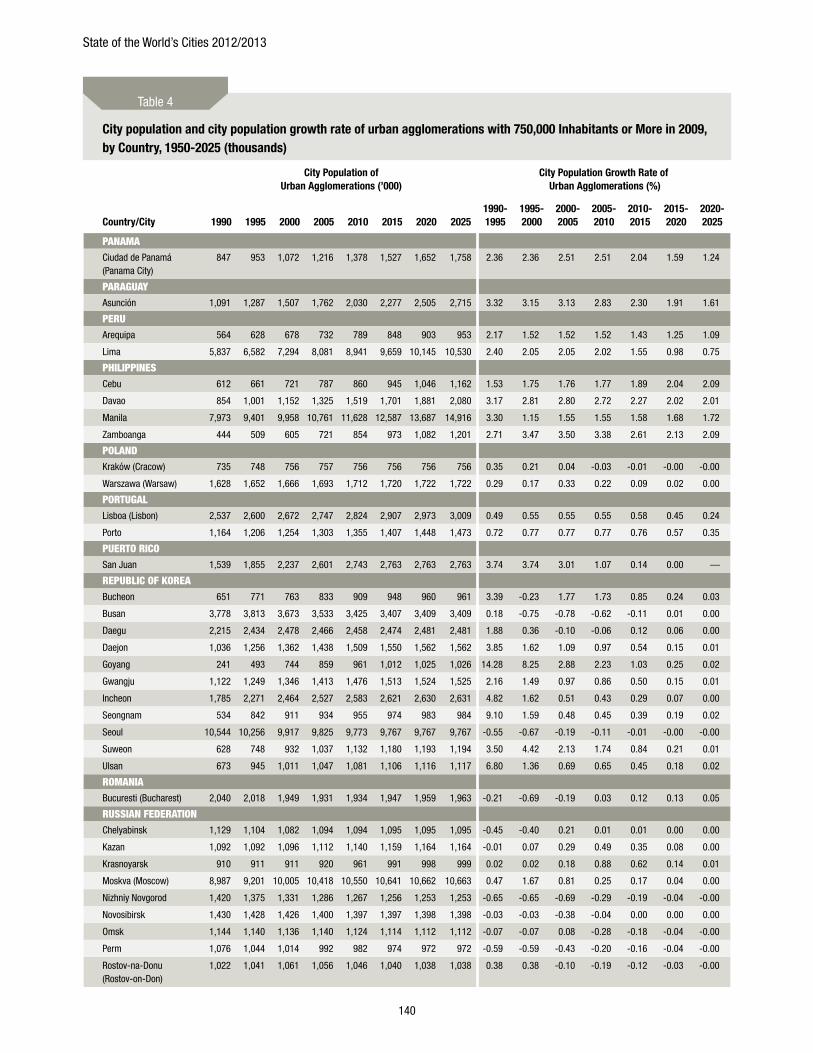
State of the World’s Cities 2012/2013
140
Country/City
City Population of Urban Agglomerations (’000)
City Population Growth Rate of Urban Agglomerations (%)
1990 1995 2000 2005 2010 2015 2020 20251990-1995
1995-2000
2000-2005
2005-2010
2010-2015
2015-2020
2020-2025
PAnAmACiudad de Panamá (Panama City)
847 953 1,072 1,216 1,378 1,527 1,652 1,758 2.36 2.36 2.51 2.51 2.04 1.59 1.24
PARAgUAyAsunción 1,091 1,287 1,507 1,762 2,030 2,277 2,505 2,715 3.32 3.15 3.13 2.83 2.30 1.91 1.61
PERUArequipa 564 628 678 732 789 848 903 953 2.17 1.52 1.52 1.52 1.43 1.25 1.09
Lima 5,837 6,582 7,294 8,081 8,941 9,659 10,145 10,530 2.40 2.05 2.05 2.02 1.55 0.98 0.75
PHILIPPInESCebu 612 661 721 787 860 945 1,046 1,162 1.53 1.75 1.76 1.77 1.89 2.04 2.09
Davao 854 1,001 1,152 1,325 1,519 1,701 1,881 2,080 3.17 2.81 2.80 2.72 2.27 2.02 2.01
Manila 7,973 9,401 9,958 10,761 11,628 12,587 13,687 14,916 3.30 1.15 1.55 1.55 1.58 1.68 1.72
Zamboanga 444 509 605 721 854 973 1,082 1,201 2.71 3.47 3.50 3.38 2.61 2.13 2.09
POLAnDKraków (Cracow) 735 748 756 757 756 756 756 756 0.35 0.21 0.04 -0.03 -0.01 -0.00 -0.00
Warszawa (Warsaw) 1,628 1,652 1,666 1,693 1,712 1,720 1,722 1,722 0.29 0.17 0.33 0.22 0.09 0.02 0.00
PORTUgALLisboa (Lisbon) 2,537 2,600 2,672 2,747 2,824 2,907 2,973 3,009 0.49 0.55 0.55 0.55 0.58 0.45 0.24
Porto 1,164 1,206 1,254 1,303 1,355 1,407 1,448 1,473 0.72 0.77 0.77 0.77 0.76 0.57 0.35
PUERTO RICOSan Juan 1,539 1,855 2,237 2,601 2,743 2,763 2,763 2,763 3.74 3.74 3.01 1.07 0.14 0.00 —
REPUBLIC OF kOREABucheon 651 771 763 833 909 948 960 961 3.39 -0.23 1.77 1.73 0.85 0.24 0.03
Busan 3,778 3,813 3,673 3,533 3,425 3,407 3,409 3,409 0.18 -0.75 -0.78 -0.62 -0.11 0.01 0.00
Daegu 2,215 2,434 2,478 2,466 2,458 2,474 2,481 2,481 1.88 0.36 -0.10 -0.06 0.12 0.06 0.00
Daejon 1,036 1,256 1,362 1,438 1,509 1,550 1,562 1,562 3.85 1.62 1.09 0.97 0.54 0.15 0.01
Goyang 241 493 744 859 961 1,012 1,025 1,026 14.28 8.25 2.88 2.23 1.03 0.25 0.02
Gwangju 1,122 1,249 1,346 1,413 1,476 1,513 1,524 1,525 2.16 1.49 0.97 0.86 0.50 0.15 0.01
Incheon 1,785 2,271 2,464 2,527 2,583 2,621 2,630 2,631 4.82 1.62 0.51 0.43 0.29 0.07 0.00
Seongnam 534 842 911 934 955 974 983 984 9.10 1.59 0.48 0.45 0.39 0.19 0.02
Seoul 10,544 10,256 9,917 9,825 9,773 9,767 9,767 9,767 -0.55 -0.67 -0.19 -0.11 -0.01 -0.00 -0.00
Suweon 628 748 932 1,037 1,132 1,180 1,193 1,194 3.50 4.42 2.13 1.74 0.84 0.21 0.01
Ulsan 673 945 1,011 1,047 1,081 1,106 1,116 1,117 6.80 1.36 0.69 0.65 0.45 0.18 0.02
ROmAnIABucuresti (Bucharest) 2,040 2,018 1,949 1,931 1,934 1,947 1,959 1,963 -0.21 -0.69 -0.19 0.03 0.12 0.13 0.05
RUSSIAn FEDERATIOnChelyabinsk 1,129 1,104 1,082 1,094 1,094 1,095 1,095 1,095 -0.45 -0.40 0.21 0.01 0.01 0.00 0.00
Kazan 1,092 1,092 1,096 1,112 1,140 1,159 1,164 1,164 -0.01 0.07 0.29 0.49 0.35 0.08 0.00
Krasnoyarsk 910 911 911 920 961 991 998 999 0.02 0.02 0.18 0.88 0.62 0.14 0.01
Moskva (Moscow) 8,987 9,201 10,005 10,418 10,550 10,641 10,662 10,663 0.47 1.67 0.81 0.25 0.17 0.04 0.00
Nizhniy Novgorod 1,420 1,375 1,331 1,286 1,267 1,256 1,253 1,253 -0.65 -0.65 -0.69 -0.29 -0.19 -0.04 -0.00
Novosibirsk 1,430 1,428 1,426 1,400 1,397 1,397 1,398 1,398 -0.03 -0.03 -0.38 -0.04 0.00 0.00 0.00
Omsk 1,144 1,140 1,136 1,140 1,124 1,114 1,112 1,112 -0.07 -0.07 0.08 -0.28 -0.18 -0.04 -0.00
Perm 1,076 1,044 1,014 992 982 974 972 972 -0.59 -0.59 -0.43 -0.20 -0.16 -0.04 -0.00
Rostov-na-Donu (Rostov-on-Don)
1,022 1,041 1,061 1,056 1,046 1,040 1,038 1,038 0.38 0.38 -0.10 -0.19 -0.12 -0.03 -0.00
City population and city population growth rate of urban agglomerations with 750,000 Inhabitants or More in 2009, by Country, 1950-2025 (thousands)
Table 4
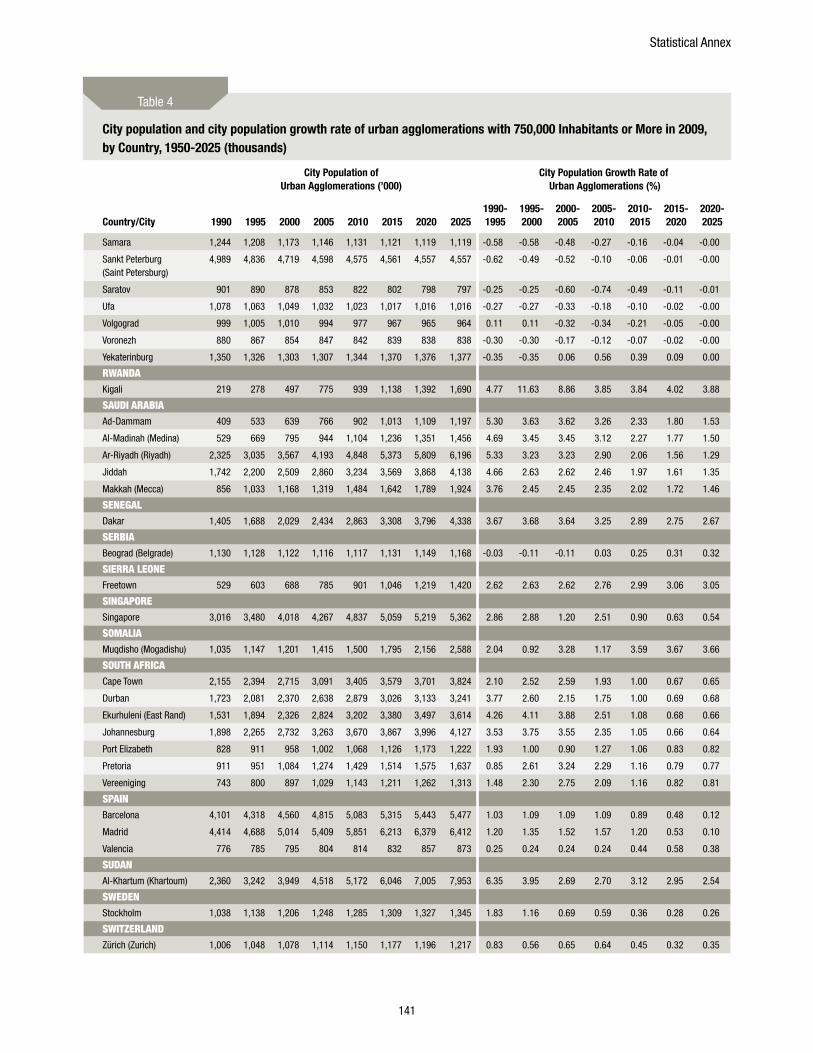
Statistical Annex
141
Country/City
City Population of Urban Agglomerations (’000)
City Population Growth Rate of Urban Agglomerations (%)
1990 1995 2000 2005 2010 2015 2020 20251990-1995
1995-2000
2000-2005
2005-2010
2010-2015
2015-2020
2020-2025
Samara 1,244 1,208 1,173 1,146 1,131 1,121 1,119 1,119 -0.58 -0.58 -0.48 -0.27 -0.16 -0.04 -0.00
Sankt Peterburg (Saint Petersburg)
4,989 4,836 4,719 4,598 4,575 4,561 4,557 4,557 -0.62 -0.49 -0.52 -0.10 -0.06 -0.01 -0.00
Saratov 901 890 878 853 822 802 798 797 -0.25 -0.25 -0.60 -0.74 -0.49 -0.11 -0.01
Ufa 1,078 1,063 1,049 1,032 1,023 1,017 1,016 1,016 -0.27 -0.27 -0.33 -0.18 -0.10 -0.02 -0.00
Volgograd 999 1,005 1,010 994 977 967 965 964 0.11 0.11 -0.32 -0.34 -0.21 -0.05 -0.00
Voronezh 880 867 854 847 842 839 838 838 -0.30 -0.30 -0.17 -0.12 -0.07 -0.02 -0.00
Yekaterinburg 1,350 1,326 1,303 1,307 1,344 1,370 1,376 1,377 -0.35 -0.35 0.06 0.56 0.39 0.09 0.00
RWAnDAKigali 219 278 497 775 939 1,138 1,392 1,690 4.77 11.63 8.86 3.85 3.84 4.02 3.88
SAUDI ARABIAAd-Dammam 409 533 639 766 902 1,013 1,109 1,197 5.30 3.63 3.62 3.26 2.33 1.80 1.53
Al-Madinah (Medina) 529 669 795 944 1,104 1,236 1,351 1,456 4.69 3.45 3.45 3.12 2.27 1.77 1.50
Ar-Riyadh (Riyadh) 2,325 3,035 3,567 4,193 4,848 5,373 5,809 6,196 5.33 3.23 3.23 2.90 2.06 1.56 1.29
Jiddah 1,742 2,200 2,509 2,860 3,234 3,569 3,868 4,138 4.66 2.63 2.62 2.46 1.97 1.61 1.35
Makkah (Mecca) 856 1,033 1,168 1,319 1,484 1,642 1,789 1,924 3.76 2.45 2.45 2.35 2.02 1.72 1.46
SEnEgALDakar 1,405 1,688 2,029 2,434 2,863 3,308 3,796 4,338 3.67 3.68 3.64 3.25 2.89 2.75 2.67
SERBIABeograd (Belgrade) 1,130 1,128 1,122 1,116 1,117 1,131 1,149 1,168 -0.03 -0.11 -0.11 0.03 0.25 0.31 0.32
SIERRA LEOnEFreetown 529 603 688 785 901 1,046 1,219 1,420 2.62 2.63 2.62 2.76 2.99 3.06 3.05
SIngAPORESingapore 3,016 3,480 4,018 4,267 4,837 5,059 5,219 5,362 2.86 2.88 1.20 2.51 0.90 0.63 0.54
SOmALIAMuqdisho (Mogadishu) 1,035 1,147 1,201 1,415 1,500 1,795 2,156 2,588 2.04 0.92 3.28 1.17 3.59 3.67 3.66
SOUTH AFRICACape Town 2,155 2,394 2,715 3,091 3,405 3,579 3,701 3,824 2.10 2.52 2.59 1.93 1.00 0.67 0.65
Durban 1,723 2,081 2,370 2,638 2,879 3,026 3,133 3,241 3.77 2.60 2.15 1.75 1.00 0.69 0.68
Ekurhuleni (East Rand) 1,531 1,894 2,326 2,824 3,202 3,380 3,497 3,614 4.26 4.11 3.88 2.51 1.08 0.68 0.66
Johannesburg 1,898 2,265 2,732 3,263 3,670 3,867 3,996 4,127 3.53 3.75 3.55 2.35 1.05 0.66 0.64
Port Elizabeth 828 911 958 1,002 1,068 1,126 1,173 1,222 1.93 1.00 0.90 1.27 1.06 0.83 0.82
Pretoria 911 951 1,084 1,274 1,429 1,514 1,575 1,637 0.85 2.61 3.24 2.29 1.16 0.79 0.77
Vereeniging 743 800 897 1,029 1,143 1,211 1,262 1,313 1.48 2.30 2.75 2.09 1.16 0.82 0.81
SPAInBarcelona 4,101 4,318 4,560 4,815 5,083 5,315 5,443 5,477 1.03 1.09 1.09 1.09 0.89 0.48 0.12
Madrid 4,414 4,688 5,014 5,409 5,851 6,213 6,379 6,412 1.20 1.35 1.52 1.57 1.20 0.53 0.10
Valencia 776 785 795 804 814 832 857 873 0.25 0.24 0.24 0.24 0.44 0.58 0.38
SUDAnAl-Khartum (Khartoum) 2,360 3,242 3,949 4,518 5,172 6,046 7,005 7,953 6.35 3.95 2.69 2.70 3.12 2.95 2.54
SWEDEnStockholm 1,038 1,138 1,206 1,248 1,285 1,309 1,327 1,345 1.83 1.16 0.69 0.59 0.36 0.28 0.26
SWITzERLAnDZürich (Zurich) 1,006 1,048 1,078 1,114 1,150 1,177 1,196 1,217 0.83 0.56 0.65 0.64 0.45 0.32 0.35
City population and city population growth rate of urban agglomerations with 750,000 Inhabitants or More in 2009, by Country, 1950-2025 (thousands)
Table 4
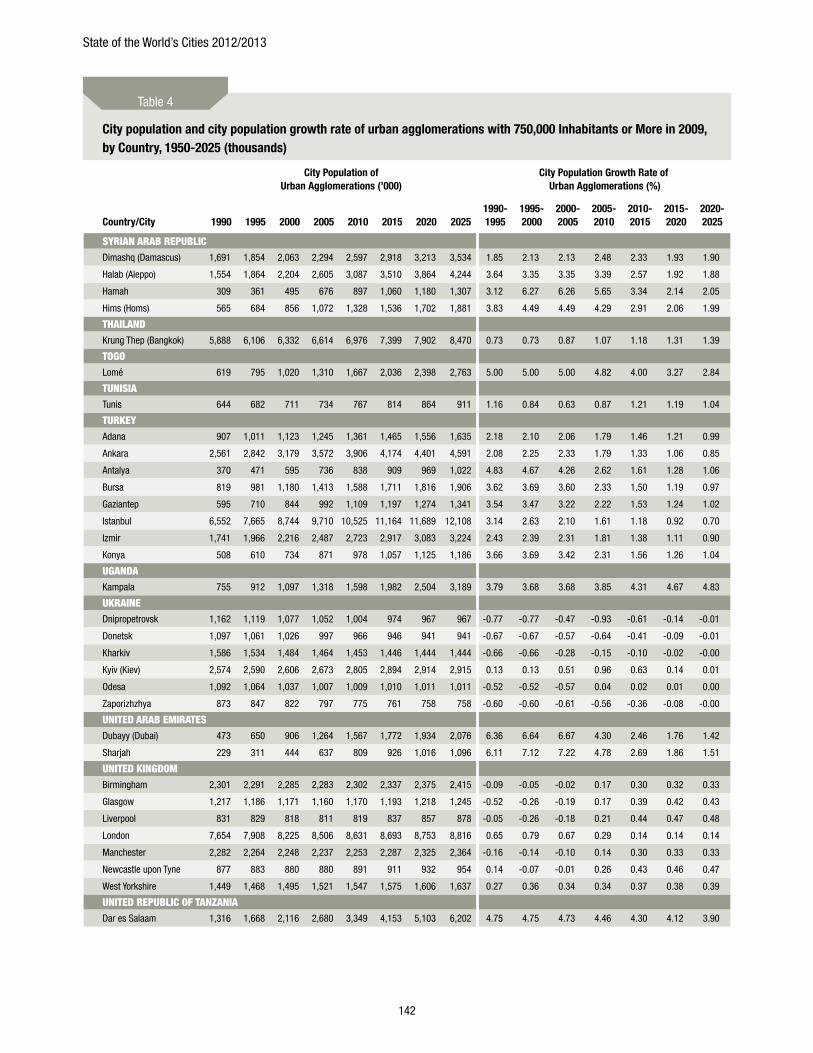
State of the World’s Cities 2012/2013
142
Country/City
City Population of Urban Agglomerations (’000)
City Population Growth Rate of Urban Agglomerations (%)
1990 1995 2000 2005 2010 2015 2020 20251990-1995
1995-2000
2000-2005
2005-2010
2010-2015
2015-2020
2020-2025
SyRIAn ARAB REPUBLICDimashq (Damascus) 1,691 1,854 2,063 2,294 2,597 2,918 3,213 3,534 1.85 2.13 2.13 2.48 2.33 1.93 1.90
Halab (Aleppo) 1,554 1,864 2,204 2,605 3,087 3,510 3,864 4,244 3.64 3.35 3.35 3.39 2.57 1.92 1.88
Hamah 309 361 495 676 897 1,060 1,180 1,307 3.12 6.27 6.26 5.65 3.34 2.14 2.05
Hims (Homs) 565 684 856 1,072 1,328 1,536 1,702 1,881 3.83 4.49 4.49 4.29 2.91 2.06 1.99
THAILAnDKrung Thep (Bangkok) 5,888 6,106 6,332 6,614 6,976 7,399 7,902 8,470 0.73 0.73 0.87 1.07 1.18 1.31 1.39
TOgOLomé 619 795 1,020 1,310 1,667 2,036 2,398 2,763 5.00 5.00 5.00 4.82 4.00 3.27 2.84
TUnISIATunis 644 682 711 734 767 814 864 911 1.16 0.84 0.63 0.87 1.21 1.19 1.04
TURkEyAdana 907 1,011 1,123 1,245 1,361 1,465 1,556 1,635 2.18 2.10 2.06 1.79 1.46 1.21 0.99
Ankara 2,561 2,842 3,179 3,572 3,906 4,174 4,401 4,591 2.08 2.25 2.33 1.79 1.33 1.06 0.85
Antalya 370 471 595 736 838 909 969 1,022 4.83 4.67 4.26 2.62 1.61 1.28 1.06
Bursa 819 981 1,180 1,413 1,588 1,711 1,816 1,906 3.62 3.69 3.60 2.33 1.50 1.19 0.97
Gaziantep 595 710 844 992 1,109 1,197 1,274 1,341 3.54 3.47 3.22 2.22 1.53 1.24 1.02
Istanbul 6,552 7,665 8,744 9,710 10,525 11,164 11,689 12,108 3.14 2.63 2.10 1.61 1.18 0.92 0.70
Izmir 1,741 1,966 2,216 2,487 2,723 2,917 3,083 3,224 2.43 2.39 2.31 1.81 1.38 1.11 0.90
Konya 508 610 734 871 978 1,057 1,125 1,186 3.66 3.69 3.42 2.31 1.56 1.26 1.04
UgAnDAKampala 755 912 1,097 1,318 1,598 1,982 2,504 3,189 3.79 3.68 3.68 3.85 4.31 4.67 4.83
UkRAInEDnipropetrovsk 1,162 1,119 1,077 1,052 1,004 974 967 967 -0.77 -0.77 -0.47 -0.93 -0.61 -0.14 -0.01
Donetsk 1,097 1,061 1,026 997 966 946 941 941 -0.67 -0.67 -0.57 -0.64 -0.41 -0.09 -0.01
Kharkiv 1,586 1,534 1,484 1,464 1,453 1,446 1,444 1,444 -0.66 -0.66 -0.28 -0.15 -0.10 -0.02 -0.00
Kyiv (Kiev) 2,574 2,590 2,606 2,673 2,805 2,894 2,914 2,915 0.13 0.13 0.51 0.96 0.63 0.14 0.01
Odesa 1,092 1,064 1,037 1,007 1,009 1,010 1,011 1,011 -0.52 -0.52 -0.57 0.04 0.02 0.01 0.00
Zaporizhzhya 873 847 822 797 775 761 758 758 -0.60 -0.60 -0.61 -0.56 -0.36 -0.08 -0.00
UnITED ARAB EmIRATESDubayy (Dubai) 473 650 906 1,264 1,567 1,772 1,934 2,076 6.36 6.64 6.67 4.30 2.46 1.76 1.42
Sharjah 229 311 444 637 809 926 1,016 1,096 6.11 7.12 7.22 4.78 2.69 1.86 1.51
UnITED kIngDOmBirmingham 2,301 2,291 2,285 2,283 2,302 2,337 2,375 2,415 -0.09 -0.05 -0.02 0.17 0.30 0.32 0.33
Glasgow 1,217 1,186 1,171 1,160 1,170 1,193 1,218 1,245 -0.52 -0.26 -0.19 0.17 0.39 0.42 0.43
Liverpool 831 829 818 811 819 837 857 878 -0.05 -0.26 -0.18 0.21 0.44 0.47 0.48
London 7,654 7,908 8,225 8,506 8,631 8,693 8,753 8,816 0.65 0.79 0.67 0.29 0.14 0.14 0.14
Manchester 2,282 2,264 2,248 2,237 2,253 2,287 2,325 2,364 -0.16 -0.14 -0.10 0.14 0.30 0.33 0.33
Newcastle upon Tyne 877 883 880 880 891 911 932 954 0.14 -0.07 -0.01 0.26 0.43 0.46 0.47
West Yorkshire 1,449 1,468 1,495 1,521 1,547 1,575 1,606 1,637 0.27 0.36 0.34 0.34 0.37 0.38 0.39
UnITED REPUBLIC OF TAnzAnIADar es Salaam 1,316 1,668 2,116 2,680 3,349 4,153 5,103 6,202 4.75 4.75 4.73 4.46 4.30 4.12 3.90
City population and city population growth rate of urban agglomerations with 750,000 Inhabitants or More in 2009, by Country, 1950-2025 (thousands)
Table 4
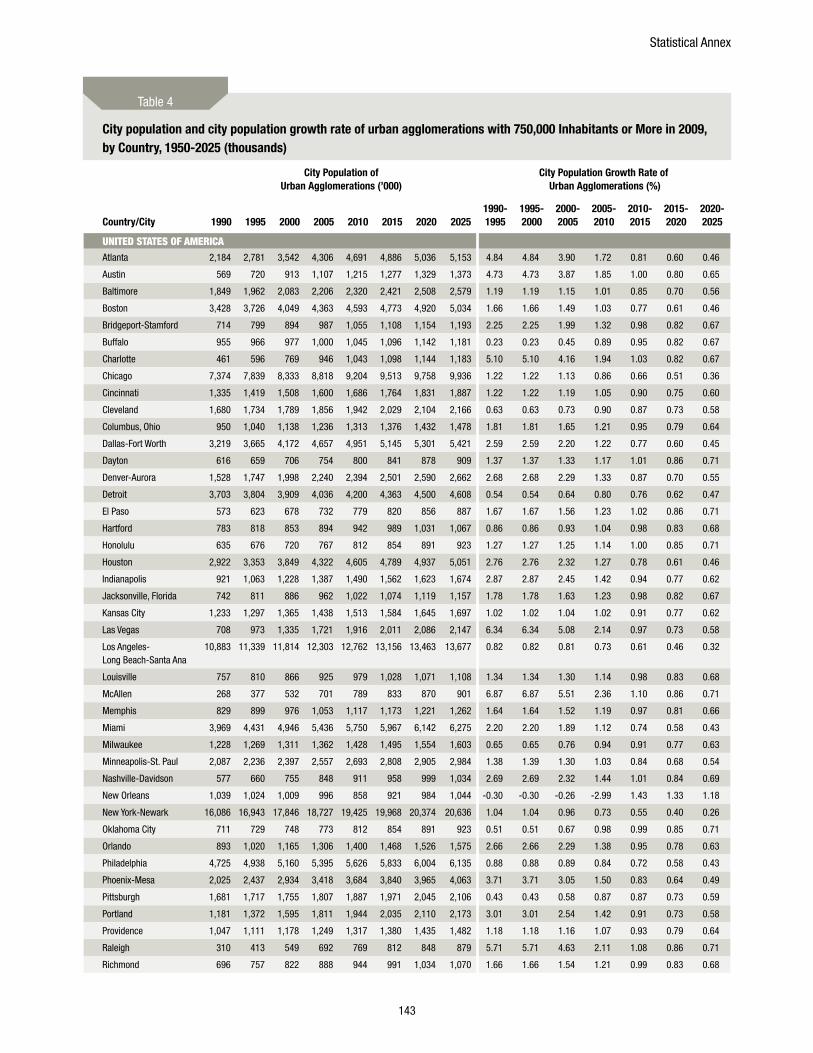
Statistical Annex
143
Country/City
City Population of Urban Agglomerations (’000)
City Population Growth Rate of Urban Agglomerations (%)
1990 1995 2000 2005 2010 2015 2020 20251990-1995
1995-2000
2000-2005
2005-2010
2010-2015
2015-2020
2020-2025
UnITED STATES OF AmERICAAtlanta 2,184 2,781 3,542 4,306 4,691 4,886 5,036 5,153 4.84 4.84 3.90 1.72 0.81 0.60 0.46
Austin 569 720 913 1,107 1,215 1,277 1,329 1,373 4.73 4.73 3.87 1.85 1.00 0.80 0.65
Baltimore 1,849 1,962 2,083 2,206 2,320 2,421 2,508 2,579 1.19 1.19 1.15 1.01 0.85 0.70 0.56
Boston 3,428 3,726 4,049 4,363 4,593 4,773 4,920 5,034 1.66 1.66 1.49 1.03 0.77 0.61 0.46
Bridgeport-Stamford 714 799 894 987 1,055 1,108 1,154 1,193 2.25 2.25 1.99 1.32 0.98 0.82 0.67
Buffalo 955 966 977 1,000 1,045 1,096 1,142 1,181 0.23 0.23 0.45 0.89 0.95 0.82 0.67
Charlotte 461 596 769 946 1,043 1,098 1,144 1,183 5.10 5.10 4.16 1.94 1.03 0.82 0.67
Chicago 7,374 7,839 8,333 8,818 9,204 9,513 9,758 9,936 1.22 1.22 1.13 0.86 0.66 0.51 0.36
Cincinnati 1,335 1,419 1,508 1,600 1,686 1,764 1,831 1,887 1.22 1.22 1.19 1.05 0.90 0.75 0.60
Cleveland 1,680 1,734 1,789 1,856 1,942 2,029 2,104 2,166 0.63 0.63 0.73 0.90 0.87 0.73 0.58
Columbus, Ohio 950 1,040 1,138 1,236 1,313 1,376 1,432 1,478 1.81 1.81 1.65 1.21 0.95 0.79 0.64
Dallas-Fort Worth 3,219 3,665 4,172 4,657 4,951 5,145 5,301 5,421 2.59 2.59 2.20 1.22 0.77 0.60 0.45
Dayton 616 659 706 754 800 841 878 909 1.37 1.37 1.33 1.17 1.01 0.86 0.71
Denver-Aurora 1,528 1,747 1,998 2,240 2,394 2,501 2,590 2,662 2.68 2.68 2.29 1.33 0.87 0.70 0.55
Detroit 3,703 3,804 3,909 4,036 4,200 4,363 4,500 4,608 0.54 0.54 0.64 0.80 0.76 0.62 0.47
El Paso 573 623 678 732 779 820 856 887 1.67 1.67 1.56 1.23 1.02 0.86 0.71
Hartford 783 818 853 894 942 989 1,031 1,067 0.86 0.86 0.93 1.04 0.98 0.83 0.68
Honolulu 635 676 720 767 812 854 891 923 1.27 1.27 1.25 1.14 1.00 0.85 0.71
Houston 2,922 3,353 3,849 4,322 4,605 4,789 4,937 5,051 2.76 2.76 2.32 1.27 0.78 0.61 0.46
Indianapolis 921 1,063 1,228 1,387 1,490 1,562 1,623 1,674 2.87 2.87 2.45 1.42 0.94 0.77 0.62
Jacksonville, Florida 742 811 886 962 1,022 1,074 1,119 1,157 1.78 1.78 1.63 1.23 0.98 0.82 0.67
Kansas City 1,233 1,297 1,365 1,438 1,513 1,584 1,645 1,697 1.02 1.02 1.04 1.02 0.91 0.77 0.62
Las Vegas 708 973 1,335 1,721 1,916 2,011 2,086 2,147 6.34 6.34 5.08 2.14 0.97 0.73 0.58
Los Angeles- Long Beach-Santa Ana
10,883 11,339 11,814 12,303 12,762 13,156 13,463 13,677 0.82 0.82 0.81 0.73 0.61 0.46 0.32
Louisville 757 810 866 925 979 1,028 1,071 1,108 1.34 1.34 1.30 1.14 0.98 0.83 0.68
McAllen 268 377 532 701 789 833 870 901 6.87 6.87 5.51 2.36 1.10 0.86 0.71
Memphis 829 899 976 1,053 1,117 1,173 1,221 1,262 1.64 1.64 1.52 1.19 0.97 0.81 0.66
Miami 3,969 4,431 4,946 5,436 5,750 5,967 6,142 6,275 2.20 2.20 1.89 1.12 0.74 0.58 0.43
Milwaukee 1,228 1,269 1,311 1,362 1,428 1,495 1,554 1,603 0.65 0.65 0.76 0.94 0.91 0.77 0.63
Minneapolis-St. Paul 2,087 2,236 2,397 2,557 2,693 2,808 2,905 2,984 1.38 1.39 1.30 1.03 0.84 0.68 0.54
Nashville-Davidson 577 660 755 848 911 958 999 1,034 2.69 2.69 2.32 1.44 1.01 0.84 0.69
New Orleans 1,039 1,024 1,009 996 858 921 984 1,044 -0.30 -0.30 -0.26 -2.99 1.43 1.33 1.18
New York-Newark 16,086 16,943 17,846 18,727 19,425 19,968 20,374 20,636 1.04 1.04 0.96 0.73 0.55 0.40 0.26
Oklahoma City 711 729 748 773 812 854 891 923 0.51 0.51 0.67 0.98 0.99 0.85 0.71
Orlando 893 1,020 1,165 1,306 1,400 1,468 1,526 1,575 2.66 2.66 2.29 1.38 0.95 0.78 0.63
Philadelphia 4,725 4,938 5,160 5,395 5,626 5,833 6,004 6,135 0.88 0.88 0.89 0.84 0.72 0.58 0.43
Phoenix-Mesa 2,025 2,437 2,934 3,418 3,684 3,840 3,965 4,063 3.71 3.71 3.05 1.50 0.83 0.64 0.49
Pittsburgh 1,681 1,717 1,755 1,807 1,887 1,971 2,045 2,106 0.43 0.43 0.58 0.87 0.87 0.73 0.59
Portland 1,181 1,372 1,595 1,811 1,944 2,035 2,110 2,173 3.01 3.01 2.54 1.42 0.91 0.73 0.58
Providence 1,047 1,111 1,178 1,249 1,317 1,380 1,435 1,482 1.18 1.18 1.16 1.07 0.93 0.79 0.64
Raleigh 310 413 549 692 769 812 848 879 5.71 5.71 4.63 2.11 1.08 0.86 0.71
Richmond 696 757 822 888 944 991 1,034 1,070 1.66 1.66 1.54 1.21 0.99 0.83 0.68
City population and city population growth rate of urban agglomerations with 750,000 Inhabitants or More in 2009, by Country, 1950-2025 (thousands)
Table 4
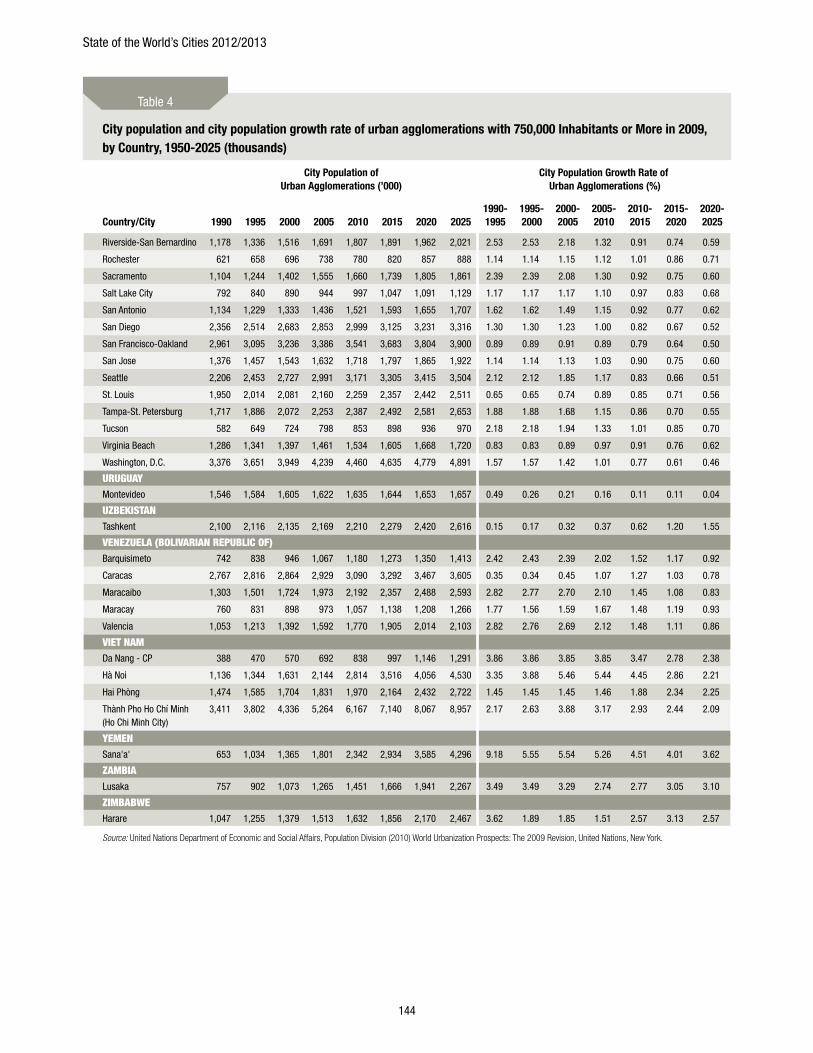
State of the World’s Cities 2012/2013
144
Country/City
City Population of Urban Agglomerations (’000)
City Population Growth Rate of Urban Agglomerations (%)
1990 1995 2000 2005 2010 2015 2020 20251990-1995
1995-2000
2000-2005
2005-2010
2010-2015
2015-2020
2020-2025
Riverside-San Bernardino 1,178 1,336 1,516 1,691 1,807 1,891 1,962 2,021 2.53 2.53 2.18 1.32 0.91 0.74 0.59
Rochester 621 658 696 738 780 820 857 888 1.14 1.14 1.15 1.12 1.01 0.86 0.71
Sacramento 1,104 1,244 1,402 1,555 1,660 1,739 1,805 1,861 2.39 2.39 2.08 1.30 0.92 0.75 0.60
Salt Lake City 792 840 890 944 997 1,047 1,091 1,129 1.17 1.17 1.17 1.10 0.97 0.83 0.68
San Antonio 1,134 1,229 1,333 1,436 1,521 1,593 1,655 1,707 1.62 1.62 1.49 1.15 0.92 0.77 0.62
San Diego 2,356 2,514 2,683 2,853 2,999 3,125 3,231 3,316 1.30 1.30 1.23 1.00 0.82 0.67 0.52
San Francisco-Oakland 2,961 3,095 3,236 3,386 3,541 3,683 3,804 3,900 0.89 0.89 0.91 0.89 0.79 0.64 0.50
San Jose 1,376 1,457 1,543 1,632 1,718 1,797 1,865 1,922 1.14 1.14 1.13 1.03 0.90 0.75 0.60
Seattle 2,206 2,453 2,727 2,991 3,171 3,305 3,415 3,504 2.12 2.12 1.85 1.17 0.83 0.66 0.51
St. Louis 1,950 2,014 2,081 2,160 2,259 2,357 2,442 2,511 0.65 0.65 0.74 0.89 0.85 0.71 0.56
Tampa-St. Petersburg 1,717 1,886 2,072 2,253 2,387 2,492 2,581 2,653 1.88 1.88 1.68 1.15 0.86 0.70 0.55
Tucson 582 649 724 798 853 898 936 970 2.18 2.18 1.94 1.33 1.01 0.85 0.70
Virginia Beach 1,286 1,341 1,397 1,461 1,534 1,605 1,668 1,720 0.83 0.83 0.89 0.97 0.91 0.76 0.62
Washington, D.C. 3,376 3,651 3,949 4,239 4,460 4,635 4,779 4,891 1.57 1.57 1.42 1.01 0.77 0.61 0.46
URUgUAyMontevideo 1,546 1,584 1,605 1,622 1,635 1,644 1,653 1,657 0.49 0.26 0.21 0.16 0.11 0.11 0.04
UzBEkISTAnTashkent 2,100 2,116 2,135 2,169 2,210 2,279 2,420 2,616 0.15 0.17 0.32 0.37 0.62 1.20 1.55
vEnEzUELA (BOLIvARIAn REPUBLIC OF)Barquisimeto 742 838 946 1,067 1,180 1,273 1,350 1,413 2.42 2.43 2.39 2.02 1.52 1.17 0.92
Caracas 2,767 2,816 2,864 2,929 3,090 3,292 3,467 3,605 0.35 0.34 0.45 1.07 1.27 1.03 0.78
Maracaibo 1,303 1,501 1,724 1,973 2,192 2,357 2,488 2,593 2.82 2.77 2.70 2.10 1.45 1.08 0.83
Maracay 760 831 898 973 1,057 1,138 1,208 1,266 1.77 1.56 1.59 1.67 1.48 1.19 0.93
Valencia 1,053 1,213 1,392 1,592 1,770 1,905 2,014 2,103 2.82 2.76 2.69 2.12 1.48 1.11 0.86
vIET nAmDa Nang - CP 388 470 570 692 838 997 1,146 1,291 3.86 3.86 3.85 3.85 3.47 2.78 2.38
Hà Noi 1,136 1,344 1,631 2,144 2,814 3,516 4,056 4,530 3.35 3.88 5.46 5.44 4.45 2.86 2.21
Hai Phòng 1,474 1,585 1,704 1,831 1,970 2,164 2,432 2,722 1.45 1.45 1.45 1.46 1.88 2.34 2.25
Thành Pho Ho Chí Minh (Ho Chi Minh City)
3,411 3,802 4,336 5,264 6,167 7,140 8,067 8,957 2.17 2.63 3.88 3.17 2.93 2.44 2.09
yEmEnSana'a' 653 1,034 1,365 1,801 2,342 2,934 3,585 4,296 9.18 5.55 5.54 5.26 4.51 4.01 3.62
zAmBIALusaka 757 902 1,073 1,265 1,451 1,666 1,941 2,267 3.49 3.49 3.29 2.74 2.77 3.05 3.10
zImBABWEHarare 1,047 1,255 1,379 1,513 1,632 1,856 2,170 2,467 3.62 1.89 1.85 1.51 2.57 3.13 2.57
Source: United Nations Department of Economic and Social Affairs, Population Division (2010) World Urbanization Prospects: The 2009 Revision, United Nations, New York.
City population and city population growth rate of urban agglomerations with 750,000 Inhabitants or More in 2009, by Country, 1950-2025 (thousands)
Table 4
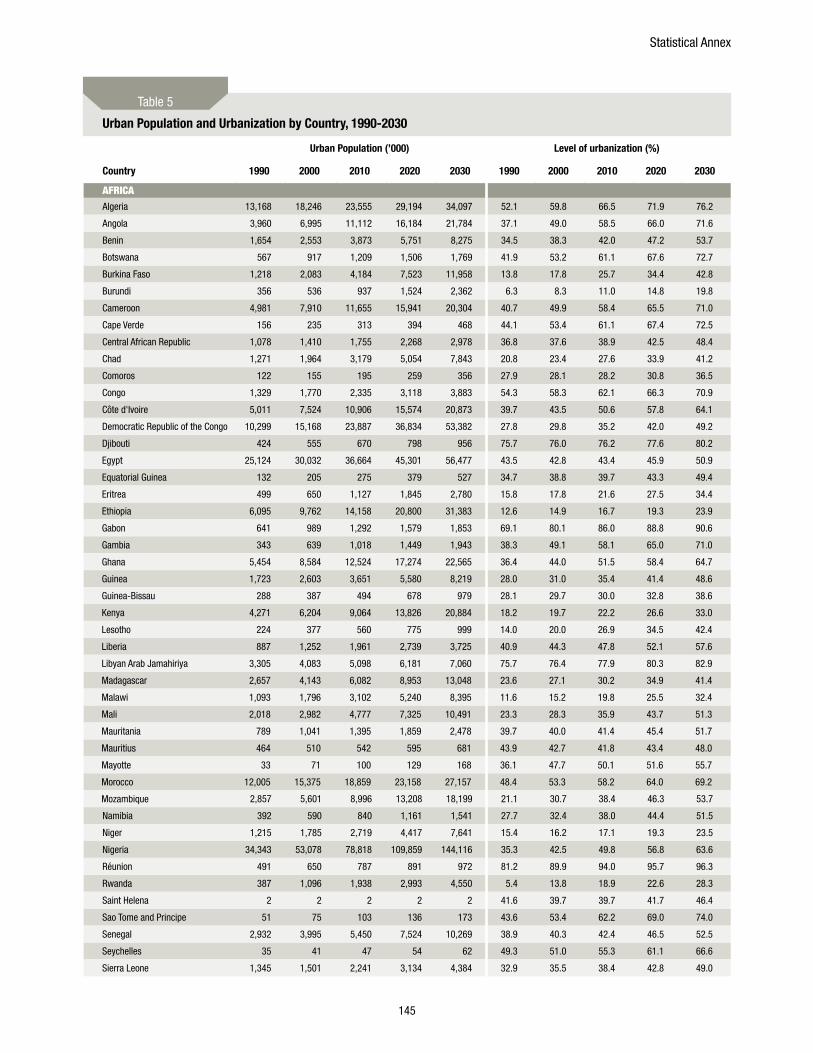
Statistical Annex
145
Urban Population (’000) Level of urbanization (%)
Country 1990 2000 2010 2020 2030 1990 2000 2010 2020 2030
AFRICAAlgeria 13,168 18,246 23,555 29,194 34,097 52.1 59.8 66.5 71.9 76.2
Angola 3,960 6,995 11,112 16,184 21,784 37.1 49.0 58.5 66.0 71.6
Benin 1,654 2,553 3,873 5,751 8,275 34.5 38.3 42.0 47.2 53.7
Botswana 567 917 1,209 1,506 1,769 41.9 53.2 61.1 67.6 72.7
Burkina Faso 1,218 2,083 4,184 7,523 11,958 13.8 17.8 25.7 34.4 42.8
Burundi 356 536 937 1,524 2,362 6.3 8.3 11.0 14.8 19.8
Cameroon 4,981 7,910 11,655 15,941 20,304 40.7 49.9 58.4 65.5 71.0
Cape Verde 156 235 313 394 468 44.1 53.4 61.1 67.4 72.5
Central African Republic 1,078 1,410 1,755 2,268 2,978 36.8 37.6 38.9 42.5 48.4
Chad 1,271 1,964 3,179 5,054 7,843 20.8 23.4 27.6 33.9 41.2
Comoros 122 155 195 259 356 27.9 28.1 28.2 30.8 36.5
Congo 1,329 1,770 2,335 3,118 3,883 54.3 58.3 62.1 66.3 70.9
Côte d'Ivoire 5,011 7,524 10,906 15,574 20,873 39.7 43.5 50.6 57.8 64.1
Democratic Republic of the Congo 10,299 15,168 23,887 36,834 53,382 27.8 29.8 35.2 42.0 49.2
Djibouti 424 555 670 798 956 75.7 76.0 76.2 77.6 80.2
Egypt 25,124 30,032 36,664 45,301 56,477 43.5 42.8 43.4 45.9 50.9
Equatorial Guinea 132 205 275 379 527 34.7 38.8 39.7 43.3 49.4
Eritrea 499 650 1,127 1,845 2,780 15.8 17.8 21.6 27.5 34.4
Ethiopia 6,095 9,762 14,158 20,800 31,383 12.6 14.9 16.7 19.3 23.9
Gabon 641 989 1,292 1,579 1,853 69.1 80.1 86.0 88.8 90.6
Gambia 343 639 1,018 1,449 1,943 38.3 49.1 58.1 65.0 71.0
Ghana 5,454 8,584 12,524 17,274 22,565 36.4 44.0 51.5 58.4 64.7
Guinea 1,723 2,603 3,651 5,580 8,219 28.0 31.0 35.4 41.4 48.6
Guinea-Bissau 288 387 494 678 979 28.1 29.7 30.0 32.8 38.6
Kenya 4,271 6,204 9,064 13,826 20,884 18.2 19.7 22.2 26.6 33.0
Lesotho 224 377 560 775 999 14.0 20.0 26.9 34.5 42.4
Liberia 887 1,252 1,961 2,739 3,725 40.9 44.3 47.8 52.1 57.6
Libyan Arab Jamahiriya 3,305 4,083 5,098 6,181 7,060 75.7 76.4 77.9 80.3 82.9
Madagascar 2,657 4,143 6,082 8,953 13,048 23.6 27.1 30.2 34.9 41.4
Malawi 1,093 1,796 3,102 5,240 8,395 11.6 15.2 19.8 25.5 32.4
Mali 2,018 2,982 4,777 7,325 10,491 23.3 28.3 35.9 43.7 51.3
Mauritania 789 1,041 1,395 1,859 2,478 39.7 40.0 41.4 45.4 51.7
Mauritius 464 510 542 595 681 43.9 42.7 41.8 43.4 48.0
Mayotte 33 71 100 129 168 36.1 47.7 50.1 51.6 55.7
Morocco 12,005 15,375 18,859 23,158 27,157 48.4 53.3 58.2 64.0 69.2
Mozambique 2,857 5,601 8,996 13,208 18,199 21.1 30.7 38.4 46.3 53.7
Namibia 392 590 840 1,161 1,541 27.7 32.4 38.0 44.4 51.5
Niger 1,215 1,785 2,719 4,417 7,641 15.4 16.2 17.1 19.3 23.5
Nigeria 34,343 53,078 78,818 109,859 144,116 35.3 42.5 49.8 56.8 63.6
Réunion 491 650 787 891 972 81.2 89.9 94.0 95.7 96.3
Rwanda 387 1,096 1,938 2,993 4,550 5.4 13.8 18.9 22.6 28.3
Saint Helena 2 2 2 2 2 41.6 39.7 39.7 41.7 46.4
Sao Tome and Principe 51 75 103 136 173 43.6 53.4 62.2 69.0 74.0
Senegal 2,932 3,995 5,450 7,524 10,269 38.9 40.3 42.4 46.5 52.5
Seychelles 35 41 47 54 62 49.3 51.0 55.3 61.1 66.6
Sierra Leone 1,345 1,501 2,241 3,134 4,384 32.9 35.5 38.4 42.8 49.0
Urban Population and Urbanization by Country, 1990-2030
Table 5
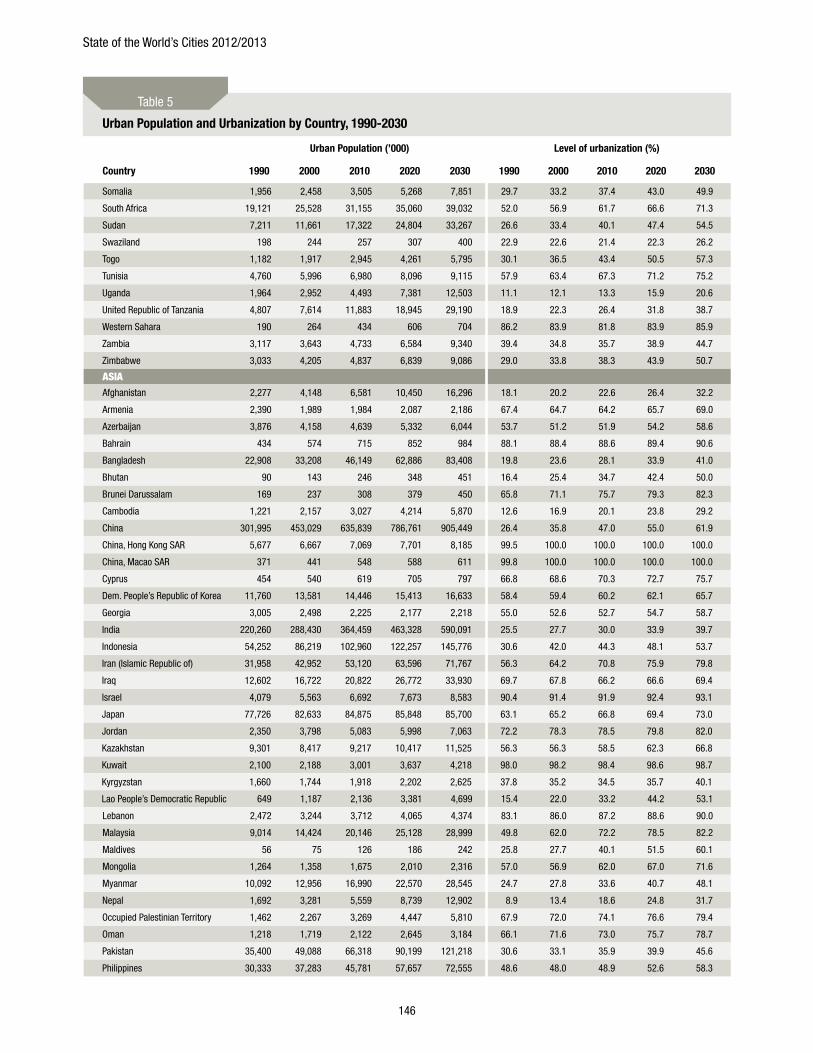
State of the World’s Cities 2012/2013
146
Urban Population (’000) Level of urbanization (%)
Country 1990 2000 2010 2020 2030 1990 2000 2010 2020 2030
Somalia 1,956 2,458 3,505 5,268 7,851 29.7 33.2 37.4 43.0 49.9
South Africa 19,121 25,528 31,155 35,060 39,032 52.0 56.9 61.7 66.6 71.3
Sudan 7,211 11,661 17,322 24,804 33,267 26.6 33.4 40.1 47.4 54.5
Swaziland 198 244 257 307 400 22.9 22.6 21.4 22.3 26.2
Togo 1,182 1,917 2,945 4,261 5,795 30.1 36.5 43.4 50.5 57.3
Tunisia 4,760 5,996 6,980 8,096 9,115 57.9 63.4 67.3 71.2 75.2
Uganda 1,964 2,952 4,493 7,381 12,503 11.1 12.1 13.3 15.9 20.6
United Republic of Tanzania 4,807 7,614 11,883 18,945 29,190 18.9 22.3 26.4 31.8 38.7
Western Sahara 190 264 434 606 704 86.2 83.9 81.8 83.9 85.9
Zambia 3,117 3,643 4,733 6,584 9,340 39.4 34.8 35.7 38.9 44.7
Zimbabwe 3,033 4,205 4,837 6,839 9,086 29.0 33.8 38.3 43.9 50.7
ASIAAfghanistan 2,277 4,148 6,581 10,450 16,296 18.1 20.2 22.6 26.4 32.2
Armenia 2,390 1,989 1,984 2,087 2,186 67.4 64.7 64.2 65.7 69.0
Azerbaijan 3,876 4,158 4,639 5,332 6,044 53.7 51.2 51.9 54.2 58.6
Bahrain 434 574 715 852 984 88.1 88.4 88.6 89.4 90.6
Bangladesh 22,908 33,208 46,149 62,886 83,408 19.8 23.6 28.1 33.9 41.0
Bhutan 90 143 246 348 451 16.4 25.4 34.7 42.4 50.0
Brunei Darussalam 169 237 308 379 450 65.8 71.1 75.7 79.3 82.3
Cambodia 1,221 2,157 3,027 4,214 5,870 12.6 16.9 20.1 23.8 29.2
China 301,995 453,029 635,839 786,761 905,449 26.4 35.8 47.0 55.0 61.9
China, Hong Kong SAR 5,677 6,667 7,069 7,701 8,185 99.5 100.0 100.0 100.0 100.0
China, Macao SAR 371 441 548 588 611 99.8 100.0 100.0 100.0 100.0
Cyprus 454 540 619 705 797 66.8 68.6 70.3 72.7 75.7
Dem. People’s Republic of Korea 11,760 13,581 14,446 15,413 16,633 58.4 59.4 60.2 62.1 65.7
Georgia 3,005 2,498 2,225 2,177 2,218 55.0 52.6 52.7 54.7 58.7
India 220,260 288,430 364,459 463,328 590,091 25.5 27.7 30.0 33.9 39.7
Indonesia 54,252 86,219 102,960 122,257 145,776 30.6 42.0 44.3 48.1 53.7
Iran (Islamic Republic of) 31,958 42,952 53,120 63,596 71,767 56.3 64.2 70.8 75.9 79.8
Iraq 12,602 16,722 20,822 26,772 33,930 69.7 67.8 66.2 66.6 69.4
Israel 4,079 5,563 6,692 7,673 8,583 90.4 91.4 91.9 92.4 93.1
Japan 77,726 82,633 84,875 85,848 85,700 63.1 65.2 66.8 69.4 73.0
Jordan 2,350 3,798 5,083 5,998 7,063 72.2 78.3 78.5 79.8 82.0
Kazakhstan 9,301 8,417 9,217 10,417 11,525 56.3 56.3 58.5 62.3 66.8
Kuwait 2,100 2,188 3,001 3,637 4,218 98.0 98.2 98.4 98.6 98.7
Kyrgyzstan 1,660 1,744 1,918 2,202 2,625 37.8 35.2 34.5 35.7 40.1
Lao People’s Democratic Republic 649 1,187 2,136 3,381 4,699 15.4 22.0 33.2 44.2 53.1
Lebanon 2,472 3,244 3,712 4,065 4,374 83.1 86.0 87.2 88.6 90.0
Malaysia 9,014 14,424 20,146 25,128 28,999 49.8 62.0 72.2 78.5 82.2
Maldives 56 75 126 186 242 25.8 27.7 40.1 51.5 60.1
Mongolia 1,264 1,358 1,675 2,010 2,316 57.0 56.9 62.0 67.0 71.6
Myanmar 10,092 12,956 16,990 22,570 28,545 24.7 27.8 33.6 40.7 48.1
Nepal 1,692 3,281 5,559 8,739 12,902 8.9 13.4 18.6 24.8 31.7
Occupied Palestinian Territory 1,462 2,267 3,269 4,447 5,810 67.9 72.0 74.1 76.6 79.4
Oman 1,218 1,719 2,122 2,645 3,184 66.1 71.6 73.0 75.7 78.7
Pakistan 35,400 49,088 66,318 90,199 121,218 30.6 33.1 35.9 39.9 45.6
Philippines 30,333 37,283 45,781 57,657 72,555 48.6 48.0 48.9 52.6 58.3
Urban Population and Urbanization by Country, 1990-2030
Table 5
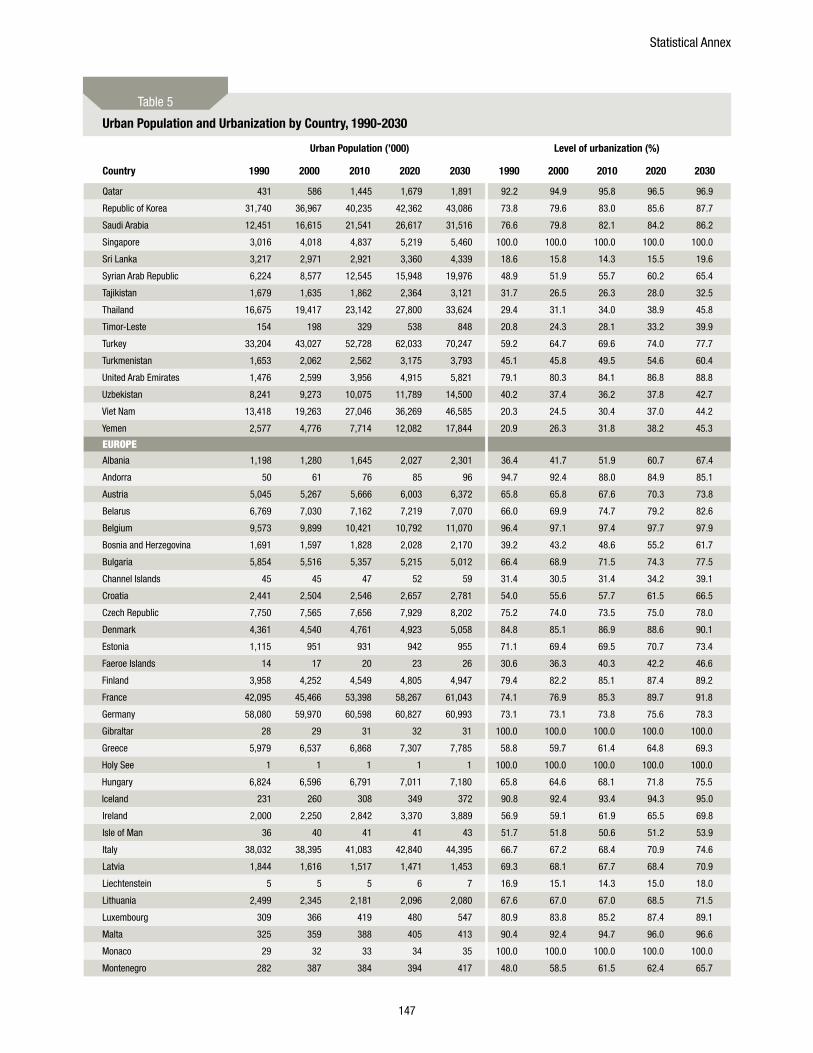
Statistical Annex
147
Urban Population (’000) Level of urbanization (%)
Country 1990 2000 2010 2020 2030 1990 2000 2010 2020 2030
Qatar 431 586 1,445 1,679 1,891 92.2 94.9 95.8 96.5 96.9
Republic of Korea 31,740 36,967 40,235 42,362 43,086 73.8 79.6 83.0 85.6 87.7
Saudi Arabia 12,451 16,615 21,541 26,617 31,516 76.6 79.8 82.1 84.2 86.2
Singapore 3,016 4,018 4,837 5,219 5,460 100.0 100.0 100.0 100.0 100.0
Sri Lanka 3,217 2,971 2,921 3,360 4,339 18.6 15.8 14.3 15.5 19.6
Syrian Arab Republic 6,224 8,577 12,545 15,948 19,976 48.9 51.9 55.7 60.2 65.4
Tajikistan 1,679 1,635 1,862 2,364 3,121 31.7 26.5 26.3 28.0 32.5
Thailand 16,675 19,417 23,142 27,800 33,624 29.4 31.1 34.0 38.9 45.8
Timor-Leste 154 198 329 538 848 20.8 24.3 28.1 33.2 39.9
Turkey 33,204 43,027 52,728 62,033 70,247 59.2 64.7 69.6 74.0 77.7
Turkmenistan 1,653 2,062 2,562 3,175 3,793 45.1 45.8 49.5 54.6 60.4
United Arab Emirates 1,476 2,599 3,956 4,915 5,821 79.1 80.3 84.1 86.8 88.8
Uzbekistan 8,241 9,273 10,075 11,789 14,500 40.2 37.4 36.2 37.8 42.7
Viet Nam 13,418 19,263 27,046 36,269 46,585 20.3 24.5 30.4 37.0 44.2
Yemen 2,577 4,776 7,714 12,082 17,844 20.9 26.3 31.8 38.2 45.3
EUROPEAlbania 1,198 1,280 1,645 2,027 2,301 36.4 41.7 51.9 60.7 67.4
Andorra 50 61 76 85 96 94.7 92.4 88.0 84.9 85.1
Austria 5,045 5,267 5,666 6,003 6,372 65.8 65.8 67.6 70.3 73.8
Belarus 6,769 7,030 7,162 7,219 7,070 66.0 69.9 74.7 79.2 82.6
Belgium 9,573 9,899 10,421 10,792 11,070 96.4 97.1 97.4 97.7 97.9
Bosnia and Herzegovina 1,691 1,597 1,828 2,028 2,170 39.2 43.2 48.6 55.2 61.7
Bulgaria 5,854 5,516 5,357 5,215 5,012 66.4 68.9 71.5 74.3 77.5
Channel Islands 45 45 47 52 59 31.4 30.5 31.4 34.2 39.1
Croatia 2,441 2,504 2,546 2,657 2,781 54.0 55.6 57.7 61.5 66.5
Czech Republic 7,750 7,565 7,656 7,929 8,202 75.2 74.0 73.5 75.0 78.0
Denmark 4,361 4,540 4,761 4,923 5,058 84.8 85.1 86.9 88.6 90.1
Estonia 1,115 951 931 942 955 71.1 69.4 69.5 70.7 73.4
Faeroe Islands 14 17 20 23 26 30.6 36.3 40.3 42.2 46.6
Finland 3,958 4,252 4,549 4,805 4,947 79.4 82.2 85.1 87.4 89.2
France 42,095 45,466 53,398 58,267 61,043 74.1 76.9 85.3 89.7 91.8
Germany 58,080 59,970 60,598 60,827 60,993 73.1 73.1 73.8 75.6 78.3
Gibraltar 28 29 31 32 31 100.0 100.0 100.0 100.0 100.0
Greece 5,979 6,537 6,868 7,307 7,785 58.8 59.7 61.4 64.8 69.3
Holy See 1 1 1 1 1 100.0 100.0 100.0 100.0 100.0
Hungary 6,824 6,596 6,791 7,011 7,180 65.8 64.6 68.1 71.8 75.5
Iceland 231 260 308 349 372 90.8 92.4 93.4 94.3 95.0
Ireland 2,000 2,250 2,842 3,370 3,889 56.9 59.1 61.9 65.5 69.8
Isle of Man 36 40 41 41 43 51.7 51.8 50.6 51.2 53.9
Italy 38,032 38,395 41,083 42,840 44,395 66.7 67.2 68.4 70.9 74.6
Latvia 1,844 1,616 1,517 1,471 1,453 69.3 68.1 67.7 68.4 70.9
Liechtenstein 5 5 5 6 7 16.9 15.1 14.3 15.0 18.0
Lithuania 2,499 2,345 2,181 2,096 2,080 67.6 67.0 67.0 68.5 71.5
Luxembourg 309 366 419 480 547 80.9 83.8 85.2 87.4 89.1
Malta 325 359 388 405 413 90.4 92.4 94.7 96.0 96.6
Monaco 29 32 33 34 35 100.0 100.0 100.0 100.0 100.0
Montenegro 282 387 384 394 417 48.0 58.5 61.5 62.4 65.7
Urban Population and Urbanization by Country, 1990-2030
Table 5
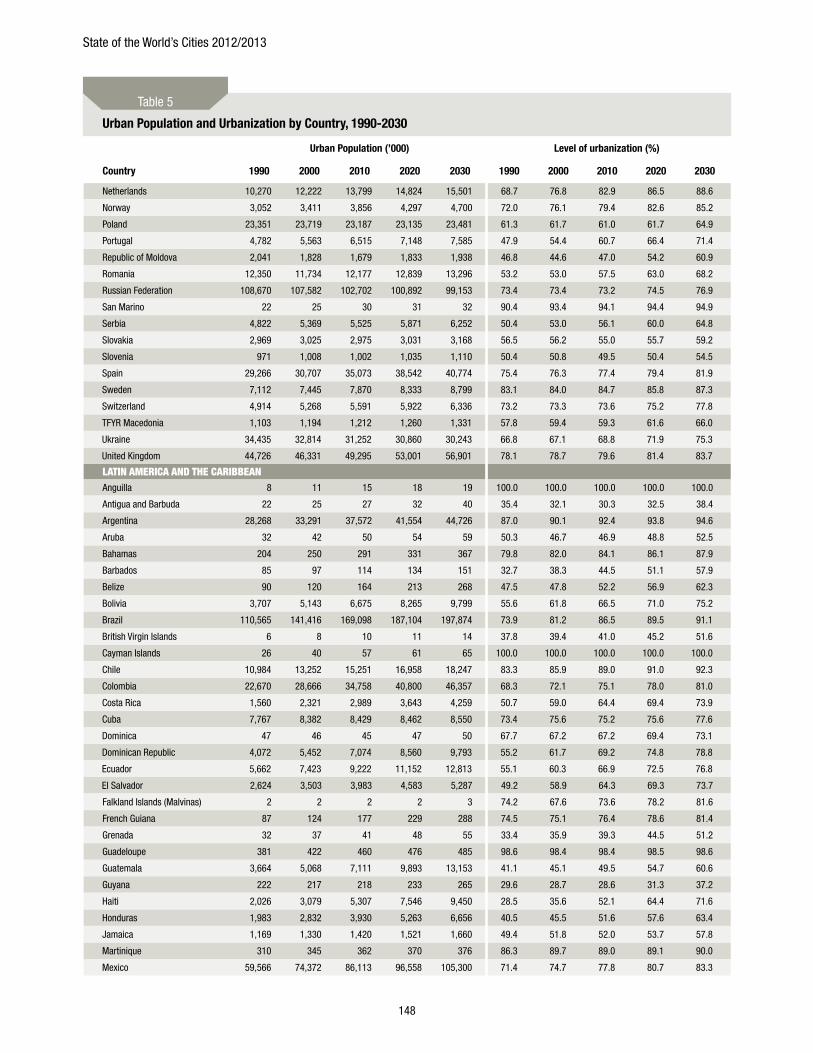
State of the World’s Cities 2012/2013
148
Urban Population (’000) Level of urbanization (%)
Country 1990 2000 2010 2020 2030 1990 2000 2010 2020 2030
Netherlands 10,270 12,222 13,799 14,824 15,501 68.7 76.8 82.9 86.5 88.6
Norway 3,052 3,411 3,856 4,297 4,700 72.0 76.1 79.4 82.6 85.2
Poland 23,351 23,719 23,187 23,135 23,481 61.3 61.7 61.0 61.7 64.9
Portugal 4,782 5,563 6,515 7,148 7,585 47.9 54.4 60.7 66.4 71.4
Republic of Moldova 2,041 1,828 1,679 1,833 1,938 46.8 44.6 47.0 54.2 60.9
Romania 12,350 11,734 12,177 12,839 13,296 53.2 53.0 57.5 63.0 68.2
Russian Federation 108,670 107,582 102,702 100,892 99,153 73.4 73.4 73.2 74.5 76.9
San Marino 22 25 30 31 32 90.4 93.4 94.1 94.4 94.9
Serbia 4,822 5,369 5,525 5,871 6,252 50.4 53.0 56.1 60.0 64.8
Slovakia 2,969 3,025 2,975 3,031 3,168 56.5 56.2 55.0 55.7 59.2
Slovenia 971 1,008 1,002 1,035 1,110 50.4 50.8 49.5 50.4 54.5
Spain 29,266 30,707 35,073 38,542 40,774 75.4 76.3 77.4 79.4 81.9
Sweden 7,112 7,445 7,870 8,333 8,799 83.1 84.0 84.7 85.8 87.3
Switzerland 4,914 5,268 5,591 5,922 6,336 73.2 73.3 73.6 75.2 77.8
TFYR Macedonia 1,103 1,194 1,212 1,260 1,331 57.8 59.4 59.3 61.6 66.0
Ukraine 34,435 32,814 31,252 30,860 30,243 66.8 67.1 68.8 71.9 75.3
United Kingdom 44,726 46,331 49,295 53,001 56,901 78.1 78.7 79.6 81.4 83.7
LATIn AmERICA AnD THE CARIBBEAnAnguilla 8 11 15 18 19 100.0 100.0 100.0 100.0 100.0
Antigua and Barbuda 22 25 27 32 40 35.4 32.1 30.3 32.5 38.4
Argentina 28,268 33,291 37,572 41,554 44,726 87.0 90.1 92.4 93.8 94.6
Aruba 32 42 50 54 59 50.3 46.7 46.9 48.8 52.5
Bahamas 204 250 291 331 367 79.8 82.0 84.1 86.1 87.9
Barbados 85 97 114 134 151 32.7 38.3 44.5 51.1 57.9
Belize 90 120 164 213 268 47.5 47.8 52.2 56.9 62.3
Bolivia 3,707 5,143 6,675 8,265 9,799 55.6 61.8 66.5 71.0 75.2
Brazil 110,565 141,416 169,098 187,104 197,874 73.9 81.2 86.5 89.5 91.1
British Virgin Islands 6 8 10 11 14 37.8 39.4 41.0 45.2 51.6
Cayman Islands 26 40 57 61 65 100.0 100.0 100.0 100.0 100.0
Chile 10,984 13,252 15,251 16,958 18,247 83.3 85.9 89.0 91.0 92.3
Colombia 22,670 28,666 34,758 40,800 46,357 68.3 72.1 75.1 78.0 81.0
Costa Rica 1,560 2,321 2,989 3,643 4,259 50.7 59.0 64.4 69.4 73.9
Cuba 7,767 8,382 8,429 8,462 8,550 73.4 75.6 75.2 75.6 77.6
Dominica 47 46 45 47 50 67.7 67.2 67.2 69.4 73.1
Dominican Republic 4,072 5,452 7,074 8,560 9,793 55.2 61.7 69.2 74.8 78.8
Ecuador 5,662 7,423 9,222 11,152 12,813 55.1 60.3 66.9 72.5 76.8
El Salvador 2,624 3,503 3,983 4,583 5,287 49.2 58.9 64.3 69.3 73.7
Falkland Islands (Malvinas) 2 2 2 2 3 74.2 67.6 73.6 78.2 81.6
French Guiana 87 124 177 229 288 74.5 75.1 76.4 78.6 81.4
Grenada 32 37 41 48 55 33.4 35.9 39.3 44.5 51.2
Guadeloupe 381 422 460 476 485 98.6 98.4 98.4 98.5 98.6
Guatemala 3,664 5,068 7,111 9,893 13,153 41.1 45.1 49.5 54.7 60.6
Guyana 222 217 218 233 265 29.6 28.7 28.6 31.3 37.2
Haiti 2,026 3,079 5,307 7,546 9,450 28.5 35.6 52.1 64.4 71.6
Honduras 1,983 2,832 3,930 5,263 6,656 40.5 45.5 51.6 57.6 63.4
Jamaica 1,169 1,330 1,420 1,521 1,660 49.4 51.8 52.0 53.7 57.8
Martinique 310 345 362 370 376 86.3 89.7 89.0 89.1 90.0
Mexico 59,566 74,372 86,113 96,558 105,300 71.4 74.7 77.8 80.7 83.3
Urban Population and Urbanization by Country, 1990-2030
Table 5
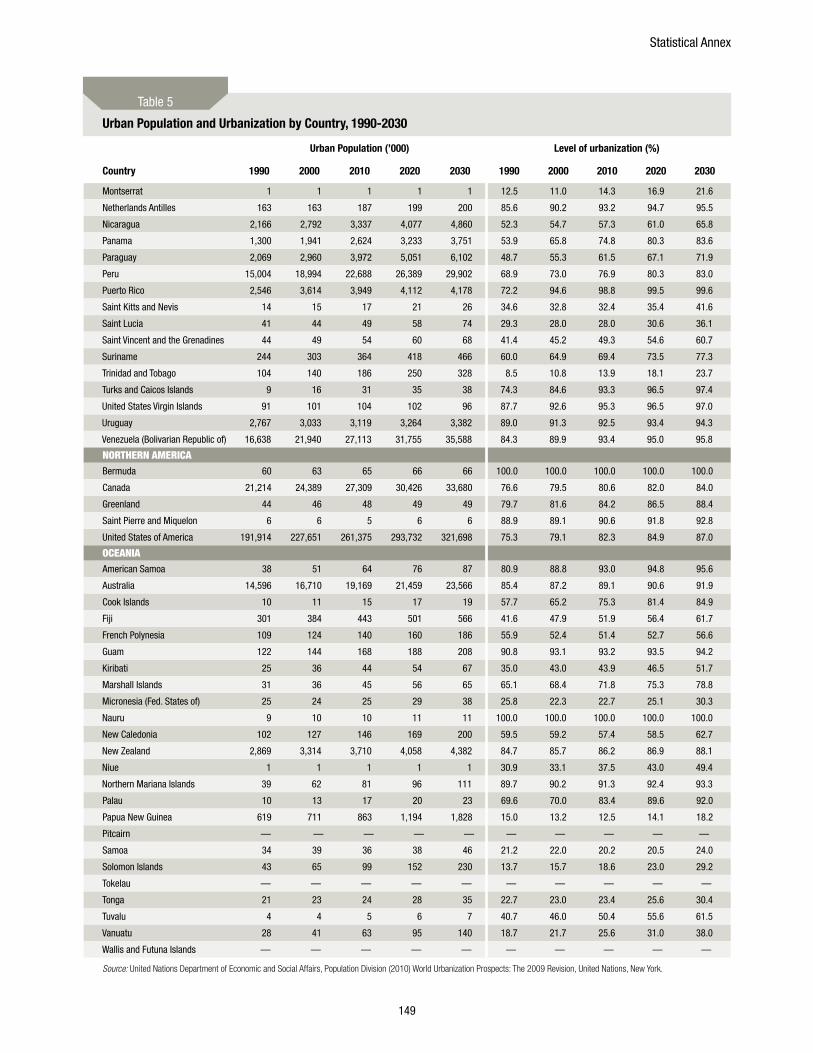
Statistical Annex
149
Urban Population (’000) Level of urbanization (%)
Country 1990 2000 2010 2020 2030 1990 2000 2010 2020 2030
Montserrat 1 1 1 1 1 12.5 11.0 14.3 16.9 21.6
Netherlands Antilles 163 163 187 199 200 85.6 90.2 93.2 94.7 95.5
Nicaragua 2,166 2,792 3,337 4,077 4,860 52.3 54.7 57.3 61.0 65.8
Panama 1,300 1,941 2,624 3,233 3,751 53.9 65.8 74.8 80.3 83.6
Paraguay 2,069 2,960 3,972 5,051 6,102 48.7 55.3 61.5 67.1 71.9
Peru 15,004 18,994 22,688 26,389 29,902 68.9 73.0 76.9 80.3 83.0
Puerto Rico 2,546 3,614 3,949 4,112 4,178 72.2 94.6 98.8 99.5 99.6
Saint Kitts and Nevis 14 15 17 21 26 34.6 32.8 32.4 35.4 41.6
Saint Lucia 41 44 49 58 74 29.3 28.0 28.0 30.6 36.1
Saint Vincent and the Grenadines 44 49 54 60 68 41.4 45.2 49.3 54.6 60.7
Suriname 244 303 364 418 466 60.0 64.9 69.4 73.5 77.3
Trinidad and Tobago 104 140 186 250 328 8.5 10.8 13.9 18.1 23.7
Turks and Caicos Islands 9 16 31 35 38 74.3 84.6 93.3 96.5 97.4
United States Virgin Islands 91 101 104 102 96 87.7 92.6 95.3 96.5 97.0
Uruguay 2,767 3,033 3,119 3,264 3,382 89.0 91.3 92.5 93.4 94.3
Venezuela (Bolivarian Republic of) 16,638 21,940 27,113 31,755 35,588 84.3 89.9 93.4 95.0 95.8
nORTHERn AmERICABermuda 60 63 65 66 66 100.0 100.0 100.0 100.0 100.0
Canada 21,214 24,389 27,309 30,426 33,680 76.6 79.5 80.6 82.0 84.0
Greenland 44 46 48 49 49 79.7 81.6 84.2 86.5 88.4
Saint Pierre and Miquelon 6 6 5 6 6 88.9 89.1 90.6 91.8 92.8
United States of America 191,914 227,651 261,375 293,732 321,698 75.3 79.1 82.3 84.9 87.0
OCEAnIAAmerican Samoa 38 51 64 76 87 80.9 88.8 93.0 94.8 95.6
Australia 14,596 16,710 19,169 21,459 23,566 85.4 87.2 89.1 90.6 91.9
Cook Islands 10 11 15 17 19 57.7 65.2 75.3 81.4 84.9
Fiji 301 384 443 501 566 41.6 47.9 51.9 56.4 61.7
French Polynesia 109 124 140 160 186 55.9 52.4 51.4 52.7 56.6
Guam 122 144 168 188 208 90.8 93.1 93.2 93.5 94.2
Kiribati 25 36 44 54 67 35.0 43.0 43.9 46.5 51.7
Marshall Islands 31 36 45 56 65 65.1 68.4 71.8 75.3 78.8
Micronesia (Fed. States of) 25 24 25 29 38 25.8 22.3 22.7 25.1 30.3
Nauru 9 10 10 11 11 100.0 100.0 100.0 100.0 100.0
New Caledonia 102 127 146 169 200 59.5 59.2 57.4 58.5 62.7
New Zealand 2,869 3,314 3,710 4,058 4,382 84.7 85.7 86.2 86.9 88.1
Niue 1 1 1 1 1 30.9 33.1 37.5 43.0 49.4
Northern Mariana Islands 39 62 81 96 111 89.7 90.2 91.3 92.4 93.3
Palau 10 13 17 20 23 69.6 70.0 83.4 89.6 92.0
Papua New Guinea 619 711 863 1,194 1,828 15.0 13.2 12.5 14.1 18.2
Pitcairn — — — — — — — — — —
Samoa 34 39 36 38 46 21.2 22.0 20.2 20.5 24.0
Solomon Islands 43 65 99 152 230 13.7 15.7 18.6 23.0 29.2
Tokelau — — — — — — — — — —
Tonga 21 23 24 28 35 22.7 23.0 23.4 25.6 30.4
Tuvalu 4 4 5 6 7 40.7 46.0 50.4 55.6 61.5
Vanuatu 28 41 63 95 140 18.7 21.7 25.6 31.0 38.0
Wallis and Futuna Islands — — — — — — — — — —
Source: United Nations Department of Economic and Social Affairs, Population Division (2010) World Urbanization Prospects: The 2009 Revision, United Nations, New York.
Urban Population and Urbanization by Country, 1990-2030
Table 5

STATE OF THE WORLD’S CITIES
2012/2013Prosperity of Cities
World Urban Forum Edition
EQUITY AND SOCIAL INCLUSION
ENVI
RONM
ENTA
L SUSTAINABILITY
PRODUCTIVITY
QUAL
ITY
OF L
IFE
INFRASTRUCTURE
STATE OF THEWORLD’S CITIES
2012/2013
Prosperity of Cities
PROSPERITY
STATE OF THE WORLD’S CITIES 2012/2013 Prosperity of Cities
The City is the Home of Prosperity. It is the place where human beings find satisfaction of basic needs and access to essential public goods. The city is also where ambitions, aspirations and other material
and immaterial aspects of life are realized, providing contentment and happiness. It is a locus at which e prospects of prosperity and individual and collective well-being can be increased.
However, when prosperity is restricted to some groups, when it is used to pursue specific interests, or when it is a justification for financial gains for the few to the detriment of the majority, the city becomes
the arena where the right to shared prosperity is claimed and fought for. As people in the latter part of 2011 gathered in Cairo’s Tahrir Square, in Madrid’s Puerta del Sol, in front of London’s St Paul’s
cathedral, or in New York’s Zuccotti Park, they were not only demanding more equality and inclusion; they were also expressing the need for prosperity to be shared across all segments of society.
What this new edition of State of the World’s Cities shows is that prosperity for all has been compromised by a narrow focus on economic growth. UN-Habitat suggests a fresh approach to
prosperity beyond the solely economic emphasis, including other vital dimensions such as quality of life, adequate infrastructures, equity and environmental sustainability. The Report proposes a new
tool – the City Prosperity Index – together with a conceptual matrix, the Wheel of Prosperity, both of which are meant to assist decision makers to design clear policy interventions.
The Report advocates for the need of cities to enhance the public realm, expand public goods and consolidate rights to the ‘commons’ for all as a way to expand prosperity. This comes in response to the observed trend of enclosing or restricting these goods and commons in enclaves of prosperity, or
depleting them through unsustainable use.
The Report maps out major policy steps to promote a new type of city – the city of the 21st century – that is a ‘good’, people-centred city. One that is capable of integrating the tangible and more intangible aspects of prosperity, and in the process shedding off the inefficient, unsustainable forms and functionalities of the city of the previous century. By doing this, UN-Habitat plays a pivotal role in ensuring that urban planning,
legal, regulatory and institutional frameworks become instruments of prosperity and well-being.
United Nations Human Settlements
Programme (UN-HABITAT)
P.O. Box 30030, Nairobi, Kenya
Tel: +254 20 7621 234
Fax: +254 20 7624 266/7
The City is the Home of Prosperity. It is the place where human beings find satisfaction of basic needs and access to essential public goods. The city is also where ambitions, aspirations and other material
and immaterial aspects of life are realized, providing contentment and happiness. It is a locus at which e prospects of prosperity and individual and collective well-being can be increased.
However, when prosperity is restricted to some groups, when it is used to pursue specific interests, or when it is a justification for financial gains for the few to the detriment of the majority, the city becomes
the arena where the right to shared prosperity is claimed and fought for. As people in the latter part of 2011 gathered in Cairo’s Tahrir Square, in Madrid’s Puerta del Sol, in front of London’s St Paul’s
cathedral, or in New York’s Zuccotti Park, they were not only demanding more equality and inclusion; they were also expressing the need for prosperity to be shared across all segments of society.
What this new edition of State of the World’s Cities shows is that prosperity for all has been compromised by a narrow focus on economic growth. UN-Habitat suggests a fresh approach to
prosperity beyond the solely economic emphasis, including other vital dimensions such as quality of life, adequate infrastructures, equity and environmental sustainability. The Report proposes a new
tool – the City Prosperity Index – together with a conceptual matrix, the Wheel of Prosperity, both of which are meant to assist decision makers to design clear policy interventions.
The Report advocates for the need of cities to enhance the public realm, expand public goods and consolidate rights to the ‘commons’ for all as a way to expand prosperity. This comes in response to the observed trend of enclosing or restricting these goods and commons in enclaves of prosperity, or
depleting them through unsustainable use.
The Report maps out major policy steps to promote a new type of city – the city of the 21st century – that is a ‘good’, people-centred city. One that is capable of integrating the tangible and more intangible aspects of prosperity, and in the process shedding off the inefficient, unsustainable forms and functionalities of the city of the previous century. By doing this, UN-Habitat plays a pivotal role in ensuring that urban planning,
legal, regulatory and institutional frameworks become instruments of prosperity and well-being.