Embed Size (px)
Citation preview

BRAZIL
UK
SMARTNESS FOR PROSPERITY: UK AND BRAZIL
I N N O V A T I O N I N C I T I E S
Research Topic – Intelligent InfrastructureReport commissioned by Future Cities Catapult and MACI Innovations Limited
Author and Executive Director Gavin McAdam Gavin McAdam is the Managing Director, owner and founder of MACI Innovations Ltd, he is an Entrepreneur, Chartered Engineer and Project Professional who is currently working towards to attaining his MSc Global Sustain-able Cities at Strathclyde University. He has been working in the infrastructure development field as a consultant for over 15 years specialising in large scale projects and has extensive experience in stakeholder engagement across both the public and private sectors and business strategy development. www.macii.co.uk @maciinnovations
Policy Academic AdvisorDr Igor Calzada Dr Igor Calzada, MBA, Lecturer, Research and Policy Adviser at the University of Oxford (Urban Transformations ESRC), University of Strathclyde (MSc in Global Sustainable Cities) and Vrije Universiteit Brussel (Brussels Centre for Urban Studies). He has been working in the last 15 years in the academia, private and public sectors. He researches on comparing Smart Cities and City-Region cases. www.igorcalzada.com/about @icalzada
Report Commissioner and Collaborator - Future Cities CatapultCommissioning Director Sofia Taborda Head of Projects at Future Cities Catapult
Collaborative Authors and Research TeamGemma Murray, Christopher Dynes
MACI Innovations Project and Development Teams
Design and publishingStirling printing.com - stirlingprinting.com
Brazilian Expert ContrastErnandy Luis Vasconcelos, PhD Post-doctoral Research Fellow at Federal University of Ceará
British Expert ContrastRudi Ball, Data Scientist and Independent Consultant, Former Future Cities Catapult Consultant
To cite this policy report: Calzada, I. & McAdam, G. (2016), Smartness for Prosperity: Brazil & UK, Policy report commissioned by Future Cities Cata-pult in collaboration with MACI Innovations and published by Translokal – Academic Entrepreneurship for Policy Making – Publishing, Donostia. ISBN: 978-84-942752-9-6.To request full version of this policy report: [email protected] & [email protected]
SMARTNESS FOR PROSPERITY UK AND BRAZIL

CONTENTSFuture Cities Catapult and MACI Innovations 1Executive Summary 3Introduction 4Case Study Context 5Case Study Structure 6Case Studies Methodology 7 UK Case Studies 8Newcastle Case Study 9 – 14Manchester Case Study 15 – 20Leeds Case Study 21 – 26Bristol Case Study 27 – 32Belfast Case Study 33 – 38Expert Contract – UK Cities 39Brazil Case Studies 40Brazil General Overview 41 – 46Sau Paulo Case Study 47 – 51Brasilia Case Study 52 – 56Belo Horizonte Case Study 57 – 61Expert Contrast Brazilian Cities 62Smart Infrastructure – Overview 63 Hardware and Software - Concept 64Smart Infrastructure – Core Principles 65Smart Infrastructure – City Focus 66Leeds Interviews 67Conclusions 68Taxonomy 69Road Map 70References 71 – 73
Phone number+44 (0)131 516 5777
Our address:Gyleview House, 3 Redheughs Rigg, Edinburgh, EH12 9DQ
Email address:[email protected]

MACI Innovations are an established professional services consultancy supporting high profile public and private client organisations in the development and delivery of successful projects across a wide range of business sectors.
Specialising in global sustainable cities strategy, urban theory development and project delivery. We understand, challenge and are striving to position ourselves at the front of new age smart city thinking through collaboration to take in all approaches and requirements to combine concept and best practice.
We see collaboration and innovative thinking in all things, our ethos is one of a holistic approach; we are adaptive by nature, open to learning, innovative in our practice and responsive to collaboration.
MACI INNOVATIONS
I N N O V A T I O N I N C I T I E S
Future Cities Catapult are an accelerator of urban ideas, taking companies and concepts through to the market place. Our objective is to encourage economic growth and make cities better. We bring together businesses, universities and city leaders so that they can work with each other to solve the problems that cities face.
From our Urban Innovation Centre in London, we provide world-class facilities and expertise to support the development of new products and services, as well as opportunities to collaborate with others, test ideas and develop business models.Our work currently focuses on three core themes: promoting healthy cities, building resilience in urban infrastructure, and designing strategies to help cities adopt and finance smarter technologies. Solutions that they could use to implement their plans.
FUTURE CITIES CATAPULT
1
ACKNOWLEDGEMENTS
MSC GLOBAL SUSTAINABLE CITIES - STRATHCLYDE UNIVERSITY INSTITUTE OF FUTURE CITIES
ANDREW FRANCIS “TONY” MCADAM - AN INSPIRATION

2

This report has been commissioned by the Future Cites Catapult as a collaborative undertaking with MACI Innovations to research the topic of Smart Infrastructure in nominated Cities in both the UK and Brazil.
Future Cities Catapult is a global centre of excel-lence for urban innovation and as part of this Collabora-tive Approach, Research & Development work is being delivered to support the UK government Prosperity Fund.
The smart city landscape is broad and complex in nature. And even though there’s an unmistakable need to make urban environments smarter and more liveable, the great majority of cities have to deal with a history of ‘siloed’ working, blocking a more integrated and holistic way of approaching urban challenges.
The study commences an explanation and demonstra-tion of the approach taken on how to structure the study and case studies themselves and proceeds to an in-depth review on how both the UK and Brazilian cities such as Bristol, Manchester, Newcastle, Leeds, Belfast Sau Paulo, Brasilia and Belo Horizonte have been addressing the smart city theme, by looking into the way they approached the challenge locally.
This research is supported by expert contrast accounts and targeted interviews with key stakeholders in the smart cities arena, to gather insights on methodologies, current practices, and the impact of these strategies in the urban environment.
The final section of the policy explores a fresh new concept of how UK smart city initiatives can be applied to Brazilian Cities and develops a methodology for implementing change.
The report concludes in the development of a road map model intended to inform key policy makers and influenc-ers working in this field on the next steps and collaborative opportunities.
Successful smart city change programmes must first look to the nature of the recipient city or urban environment to understand the need, issues and opportunities. These are often found in the very essence of the place; its urban culture, nation al traditions, heritage, and political landscape as well as any economic drivers/ aspirations, technological capabilities and the dynamics of society itself.
The emphasis on smart cities and technology must be firmly set in the context of the “place”. With this in mind, very rarely will single solutions be found and or developed that can deliver effective change that is applicable to all envi-ronments nationally or regionally and therefore a city ap-proach must be adopted.
Smartness must first start with the city not the “smart” and the key objective of smartness must be to foster prosperity. Throughout this policy document these concepts have been critically assessed and developed from first principles into models that define the nature of the thinking and structuring of successful change programmes.
The core principles are based on viewing these concepts as “sustainable economic hardware” and “sustainable social software” as often opposing yet critically linked drivers.
The defining output of combining these core principles is that “smartness for prosperity” should be the desired outcome of developing and implementing smart infrastructure strategies not only in Brazil, but here in the UK.
EXECUTIVE SUMMARY
3
This policy report aims to show the uniqueness behind the so-called ‘smart’ strategy in five British and three Brazilian cities primarily. Albeit it should be argued that care must be taken when going beyond the standard understanding and conceptualisation of ‘smartness,’ from the beginning is underlined the added value in unpacking how urban transforma-tions should be analysed by adding a particular significance to ‘the place’. Shall we contrast and compare Brazilian and British cities regarding the way their smart city strategies are implemented without considering any other inner factor? Likewise, does urban smartness only mean to achieve the most efficient technical system? Are we just referring to the way technology is designed in eight cities, or by contrast, are we interested in examining the interface between the hardware and the software of the intertwined urban life?
As such, smartness in cities cannot be designed in this day and age without considering prosperity, well-being and universal access for their citizens. In this regard, in an article published in The Economist, Benjamin Barber stated: ‘Above all, we need Smart Mayors and Smart Citizens, not Smart Cities’. In this same direction, in the last five years there is a significant consensus among academics about two main ideas that are unpacking the understanding of the mainstream ‘smart city’:
1. ‘Smart City’ has already become a ‘fetish’ term to simplify complex urban debates in an uneven, technology deterministically-driven society. 2. However, insofar as some transitions could be identified in the real urban arena, some could argue that the ‘smart city’ exists (or is already happening around us), but not in the way we anticipated. • Smartness in Brazilian and British Cities?
Thus, how will this report address such a challenge in capturing the smartness in incredibly diverse geographic global contexts? It should be pointed out that the prestigious Nature journal of science dedicates a section advocating that ‘amid the scientific and social priorities for the coming years, the study and design of cities must be right at the top’. And, in particular, urban health and well-being are the drivers of the urban transformations. So then, any comparative study about smartness in urban context should deliberately begin with the composition and indicators of prosperity in the particular contexts. In this rationale, the report presents some data collected by the OECD.
In summary, smartness approaches for inspiring urban transformation have been differentiated from each other by the interaction, interdependencies and power relations between stakeholders (See WEF 2016: 50). In this present report, there is an attempt to show for each case the smart governance composition by mapping stakeholders (Section 5). This unique form is due to the ‘essence of the place’, understood as an inner explanation of what the place branding (Cleave et al. 2016) produces in the real symbolic and material interactions in cities (Section 4).
However, as it is shown in the report, Brazilian city cases (Bello Horizonte, Brasilia and Sao Paulo) and British city cases (Newcastle, Manchester, Leeds, Belfast and Bristol) share the same kind of principle even if they follow differ-ent urban patterns. Rather than constructed on tabula rasa according to the centralised plans of multinational technology corporations, smart city interventions are always the outcomes of, and awkwardly integrated into, existing social and spatial constellations of urban governance and the built environment and infrastructure. (Shelton et al. 2015: 14)
• A comparative overview from the prosperity perspective
Despite the fact that the European H2020 has contributed to focus the attention on three sectors, mobility/transport, energy and ICTs (Section 2), very little has been analysed on the smartness and prosperity interactive loop so far (Section 6).
In fact, some of the current smart city implementations require an in-depth policy contextualisation to avoid the roots and the dramatic consequences of the 2008 financial crisis (Calzada 2013). In this sense, prosperity represents the necessary counterpart of the some apologetic and hegemonic concept of smart cities that has been rapidly prominent within the policy and governance agendas of urban development and is on its way to becoming the leading driver of urban sustainability and regeneration initiatives.
Nevertheless, the closer analyses of prosperity indicators depict entirely rather a different picture in Brazilian and British cities. As such, we should ask ourselves whether or not the cities this report covers, present themselves among their citizens this paradox: This is the story about us being persuaded to spend money we do not have, on things we do not need, to create impressions that will not last, on people we do not care about’.
Is the smart implementation in the presented cities, aware of this paradox? And, lately, are infrastructures in these cities designed to overcome such a socially (software) and economically (hardware) unsustainable gap? (Final Remarks: Smart Infrastructure section).
• Human-scale smart infrastructure and urbanism
To sum up, this report makes an effort to take a step back into the ‘essence’ of the ‘place’ as Jane Jacobs’ brilliantly described as urban setlements embedded in human-scale infrastructures. These days, though, there is a risk of a smart city model that potentially delimits urban citizenship to aseries of actions focused on monitoring and managing data recasting who or what counts as a citizen. And as we are go-ing to see in this report, regardless of whether it is British or Brazilian cities, the challenge for us remains the same: We have to be willing and able to get in, roll up our sleeves and discover how new applications and technologies can be used to improve the quality of urban life genuinely. Otherwise, we can’t complain we were locked out of this moment. (Glasmeier & Christopherson 2015: 11) .
INTRODUCTION
4

BRAZIL
UK
These case studies look to examine the best practice, successes and challenges across targeted UK Cities today, with a view to assessing their suitability and transferability to the context of comparative Brazilian cities, not in population size.
The case study research exercise also examined three targeted Brazilian Cities.
CASE STUDY CONTEXT
Newcastle
Manchester
Leeds
Bristol
Belfast
BRITISH & BRAZILIAN CITIESSau Paulo
Brasilia
Belo Horizonte
5

CASE STUDY STRUCTURE1. Background: The PlaceTo understand a city, you must first immerse yourself in its history, the people, the human geography and its standing in the regional context. All of the cities researched in these cases studies have embarked on a journey, whether it be from post industrialisation player to smart advocate or addressing adversity and challenge.
2. Smart City Strategy: There is a growing awareness of the importance of cities be-ing placed at the heart of successful sustainable economic development planning and delivery. Driving the development of many strategies are the need to focus on Energy Mobility/ Transport, ICT and H2020 principles. To this end, cities across the world are striving to re-invent themselves as “resilient”, “smart”,” sustainable” even “global” and “future cities” to breathe life back into society, communities and industry alike.
3. Challenges and Successes:A critical analysis of the varied strategies employed across each case study looking at creativity, innovation and ensuring collaboration are at the heart of strategic change and also that information is shared between peers and city clusters. The challenges faced and strategies employed to succeed through the initiatives developed and projects de-livered is an essential aspect of knowledge transferal and learning.
4. Essence of Place:The compilation of each of case studies adheres to a strict methodology by adopting a city based approach and focuses on the concept of understanding the uniqueness of the “place” - referred to as the “essence”. However, to succeed this change must be relevant for the respective inhabitants and be embedded in the very essence of the place.
5. Smart Governance in the Place: Stakeholder MappingA high level look at the relationship of the key players and motivators driving and influencing change programmes across each of the case studies. These dynamics and how they are managed this, with effective governance being at the very heart of effective change in cities and the general urban environment. A balance must be found by policy makers in the use of technology, commercial gain and the input and collaboration across society as whole to achieve satisfactory sustainable economic development.
6. Prosperity and Well-Being: Data AnalysisThis section draws on information developed and made available by the OECD. This data is presented as indicators of regional performance across certain metrics from health to jobs and education. Although not a true indicator of how the city is performing, as the data is drawn regional in the case of the UK cases and national in the Brazilian case studies - despite this, it can be seen that the data provides a useful insight into each case study.
DESCRIPTION EXPLANATION
1BackgroundThe Place
4Essence ofThe Place
2Smart CityStrategy
3Challenges
and Successes
5Smart
Governance in the Place: Stakeholder
Mapping
6Prosperity and
Well Being: Data Analysis
6

DESCRIPTION
1. Background: The Place.
2. Smart City Strategy:1
• Energy • Mobility/Transport • ICT
3. Challenges and Successes
EXPLANATION
4. Essence of the Place.2
5. Smart Governance in the Place: Stakeholder mapping
6. Prosperity & Well-being: Data analysis.3
CASE STUDY RESEARCH METHODOLOGY
PROSPERITY & WELL-BEING: DATA ANALYSIS
SMART GOVERNANCE IN THE PLACE: STAKEHOLDER MAPPING
ESSENCE OF THE PLACE
CHALLENGES & SUCCESSES
SMART CITY STRATEGY: ENERGY - MOBILITY / TRANSPORT - ICT
BACKGROUND: THE PLACE
12
3
4
5
6
The compilation of each of these case studies adheres to a strict methodology by adopting a city based approach and focuses on the concept of understanding the uniqueness of the “place” - referred to as the “essence”. This concept looks to explore smartness and prosperity through following these principles as per the diagram below.
7

UK CASE
STUDIES
I N N O V A T I O N I N C I T I E S
8

NEWCASTLE CASE STUDY
NEWCASTLE
9

City population: 289, 835. 39th in UKMetropolitan population: 1, 650, 000. 6th in UK
Focus was first given to smart city solutions in Newcastle when the city competed for funding from the Future Cities Demonstrator Programme. Whilst unsuccessful in acquiring funding, Newcastle received £50,000 to conduct a comprehensive feasibility study to assess possible opportunities for smart city solutions in Newcastle1.
The city has also built on its success after being named the UK’s most sustainable city in 2009 and 2010, and has since signed the EU ‘Covenant of Mayors’ which commits Newcastle to a 20% reduction in emissions for the 2005 baseline by 2020. The agreement also obligates Newcastle to produce a Sustainable Energy Action Plan (SEAP)2 to identify measures to achieve this target. In addition to the SEAP, Newcastle has also prepared a comprehensive urban policy plan to guide urban policy in Newcastle for the coming years. Titled the ‘Core Strategy and Urban Core Plan’3, this plan focused on the Gateshead and Newcastle upon Tyne areas between the years 2010-2030 and contains a full list of all urban objectives and the urban planning policies required to meet them.
In 2012 Newcastle signed the ‘Newcastle City Deal’ with the UK government to re-ignite investment and job creation. This deal reinforced the city’s commitment to establishing Newcastle as a ‘low carbon ‘pioneer city’’ and transforming Newcastle into a ‘super-connected’ city with significant investment in digital infrastructure. The ‘City Deal’4 established a new carbon reduction target of 34% by 2020 and, amongst other measures, provided £92 million funding to create the Newcastle Gateshead Accelerated Development Zone on three sites in the city centre. Amongst these zones is the ‘Science Central’ which will be used as a hub for Newcastle University to develop further smart city solutions such as the ‘decision theatre’.
BACKGROUND: THE PLACE
Newcastle’s feasibility was an excellent first step in developing smart city interventions and identifying smart city solutions to some of the city’s problems.
The two key challenges identified during the feasibility study were:
1. Achieving sustainability through the low carbon economy. 2. Being an age-friendly place to live, work and visit.
Further challenges and objectives were clarified as:
1. Ageing population and outward migration of youth. 2. Improved mobility, positive health and social benefits. 3. Behavioural improvements, described as follows: “the city and conurbation should enable people to live independent lives and enable them to make informed choices though smarter information, systems and services – it should not seek to enforce behaviour on people, but enable better choices through better information.” 4. Economic growth to improve quality of life. 5. Alleviate congestion on local/strategic networks. 6. Action to reduce transport emissions.
SMART CITY STRATEGY: ENERGY - MOBILITY / TRANSPORT - ICT
1 2 3 4 5 6
1 2 3 4 5 6
10

Newcastle benefits from excellent existing infrastructure, recent investment, focused urban policy (20 minute neighbourhood) and a comprehensive feasibility study which identified key smart city opportunities in the city. The city has also built on its success after being named the UK’s most sustainable city in 2009 and 2010, and has since signed the EU ‘Covenant of Mayors’ which commits Newcastle to a 20% reduction in emissions for the 2005 baseline by 2020.
The city has set up the £3.5 million i-BUILD Centre, led by Professor Richard Dawson, which is researching to interactions between energy, water, transport, waste and digital technology systems to gain better understandings and develop innovations.1
The University has also set up a £2 million grid–scale energy storage test bed, led by Professor Philip Taylor, to pave the way for the future of Smart Grids and energy storage across the UK. The University is also operating the £1.3 million My PLACE project, led by Professor Peter Wright, which is developing and testing a digital platform and toolkit for the public to engage with local councils and other organisations more effectively in the research, planning and design of the urban environment.2
However, an issue identified in the Newcastle feasibility study was that data within the city is often owned by private companies which can restrict access and creativity to innovative smart city solutions across sectors. The feasibility study also identified a lack of integration in Newcastle city, despite it being a state aim of the feasibility study for its smart city approach.
The ‘Newcastle City Deal’ strategy report 2012 cited inter-generational unemployment as a major challenge for Newcastle, with 14% of residents receiving out-of-work benefits. The report also found a disproportionate number of young people not in education, employment or training (NEET), and a workforce, which does not meet all the needs of the business community. These socio-economic challenges may pose as an issue and a barrier for smart city developments.3
CHALLENGES AND SUCCESSES
Post feasibility study, Newcastle does not have one specific smart city policy plan for the city, with certain smart city associated objectives and policies being contained within the broader ‘Core Strategy and Urban Core Plan’. Regardless, the feasibility study provides a comprehensive overview of Newcastle’s smart city initiatives, many of which align perfectly with Newcastle’s urban planning ambitions and build upon Newcastle’s existing smart infrastructure.
A review of the feasibility studies conducted by councils identified a lack of integration themes for Newcastle city, despite it being a state aim of the feasibility study5.
Ongoing research is being conducted by Newcastle as a future ‘smart city’6 from Science Central, conducting research on the ‘ways digital technology can enable people to make sound decisions about the present and future’. This research builds upon the initiatives outlined in the feasibility study. The University has conducted and presented research in their ‘Newcastle as a Future Smart City’ on the following themes:
1. Local energy supply and storage2. Green flood management3. Integrated transport
1 2 3 4 5 6
11
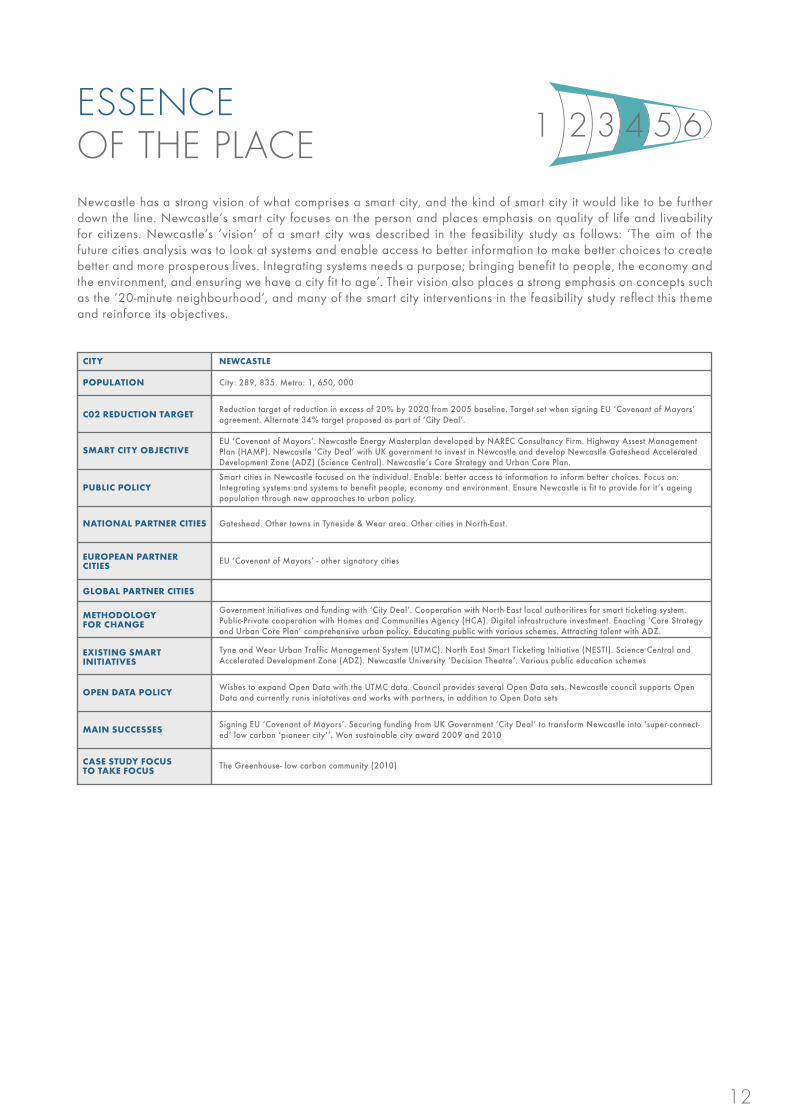
Newcastle has a strong vision of what comprises a smart city, and the kind of smart city it would like to be further down the line. Newcastle’s smart city focuses on the person and places emphasis on quality of life and liveability for citizens. Newcastle’s ‘vision’ of a smart city was described in the feasibility study as follows: ‘The aim of the future cities analysis was to look at systems and enable access to better information to make better choices to create better and more prosperous lives. Integrating systems needs a purpose; bringing benefit to people, the economy and the environment, and ensuring we have a city fit to age’. Their vision also places a strong emphasis on concepts such as the ’20-minute neighbourhood’, and many of the smart city interventions in the feasibility study reflect this theme and reinforce its objectives.
ESSENCE OF THE PLACE
CITY
POPULATION
C02 REDUCTION TARGET
SMART CITY OBJECTIVE
PUBLIC POLICY
NATIONAL PARTNER CITIES
EUROPEAN PARTNER CITIES
GLOBAL PARTNER CITIES
METHODOLOGY FOR CHANGE
EXISTING SMART INITIATIVES
OPEN DATA POLICY
MAIN SUCCESSES
CASE STUDY FOCUS TO TAKE FOCUS
NEWCASTLE
City: 289, 835. Metro: 1, 650, 000
Reduction target of reduction in excess of 20% by 2020 from 2005 baseline. Target set when signing EU ‘Covenant of Mayors’ agreement. Alternate 34% target proposed as part of ‘City Deal’. EU ‘Covenant of Mayors’. Newcastle Energy Masterplan developed by NAREC Consultancy Firm. Highway Assest Management Plan (HAMP). Newcastle ‘City Deal’ with UK government to invest in Newcastle and develop Newcastle Gateshead Accelerated Development Zone (ADZ) (Science Central). Newcastle’s Core Strategy and Urban Core Plan. Smart cities in Newcastle focused on the individual. Enable: better access to information to inform better choices. Focus on: Integrating systems and systems to benefit people, economy and environment. Ensure Newcastle is fit to provide for it’s ageing population through new approaches to urban policy.
Gateshead. Other towns in Tyneside & Wear area. Other cities in North-East.
EU ‘Covenant of Mayors’ - other signatory cities
Government initiatives and funding with ‘City Deal’. Cooperation with North-East local authoritires for smart ticketing system. Public-Private cooperation with Homes and Communities Agency (HCA). Digital infrastructure investment. Enacting ‘Core Strategy and Urban Core Plan’ comprehensive urban policy. Educating public with various schemes. Attracting talent with ADZ.
Tyne and Wear Urban Traffic Management System (UTMC). North East Smart Ticketing Initiative (NESTI). Science Central and Accelerated Development Zone (ADZ). Newcastle University ‘Decision Theatre’. Various public education schemes
Wishes to expand Open Data with the UTMC data. Council provides several Open Data sets. Newcastle council supports Open Data and currently runis iniatatives and works with partners, in addition to Open Data sets
Signing EU ‘Covenant of Mayors’. Securing funding from UK Government ‘City Deal’ to transform Newcastle into ‘super-connect-ed’ low carbon ‘pioneer city’’. Won sustainable city award 2009 and 2010
The Greenhouse- low carbon community (2010)
1 2 3 4 5 6
12

PUBLICNewcastle City Council,
British National Government, European Union, Association
of North East Councils, Innovate UK, European
Union.SOCIAL
ENTREPRENEURSSocial Enterprise Works ,
North East Social Enterprise Partnership, smart start-ups,
open data users, companies: Quadrant Leisure Community
Interest Company, Venture Compliance.
PRIVATE BBC, BT, Virgin, NHS, UKTI,
Centre for Offshore Renewable Engineering, Homes and Communities Agency, North East Local
Enterprise Partnership, Northumbria Water, Arup, Parsons Brinckerhoff, SKM,
Narec.
ACADEMIANewcastle University
Northumbria University.
CIVILSOCIETY
Northumbria Centre for Civil Society and Citizenship,
Newcastle Citizens, Lord Mayor of Newcastle.
Newcastle City Council took a lead role in developing smart city opportunities and initiatives for Newcastle when conducing their smart city feasibility study. This comprehensive plan has since been complemented by the council’s lead in developing urban policy plans and energy plans to guide the city’s development into the near future. There has been no update to the initial feasibility study to assess where smart city initiatives can complement the city’s ambitious plans for urban growth and renewable energy. Newcastle University has since developed further smart city solutions and can be expected to continue their research, but the city would overall benefit from revisiting the interventions proposed in the initial feasibility study. The city has also expressed a desire to enhance and expand its open data policies10 and make some of the data collected by the UTMC system available to the public, indicating a shift towards a bottom-up approach to smart city solutions in the future.
SMART GOVERNANCE IN THE PLACE: STAKEHOLDER MAPPING
1 2 3 4 5 6
Red Hat Computing have partnered successfully wih the Centre for Doctoral Training (CDT) in cloud computing for big data working with the Engineering Sciences Research Council (EPSRC) on big data projects promoting civic participa-tion in the design and delivery of public services, focusing on = public health, education and city planning.Arjuna helps cities overcome data politics, Agility data broker a product developed allows for ingested data to be aumatically cleansed, transformed and distributed to the key beneficiaries removing frsutrations and facilitating smart city iniatives.
KEY SME’S/PARTNERSHIPS
13

1 2 3 4 5 6
Newcastle scores highly in most of its wellbeing indicators, with the exception of civic engagement, health and jobs. Smart city solutions in Newcastle could be explored to help improve the city’s performance in these areas.
PROSPERITY & WELL-BEING: DATA ANALYSIS
31% IN ACCESS TO SERVICES
49% IN EDUCATION
25% IN ENVIRONMENT
49% IN INCOME
37% IN SAFETY
27% IN JOBS
31% IN CIVIC ENGAGEMENT
32% IN JOBS
41% IN HEALTH
14
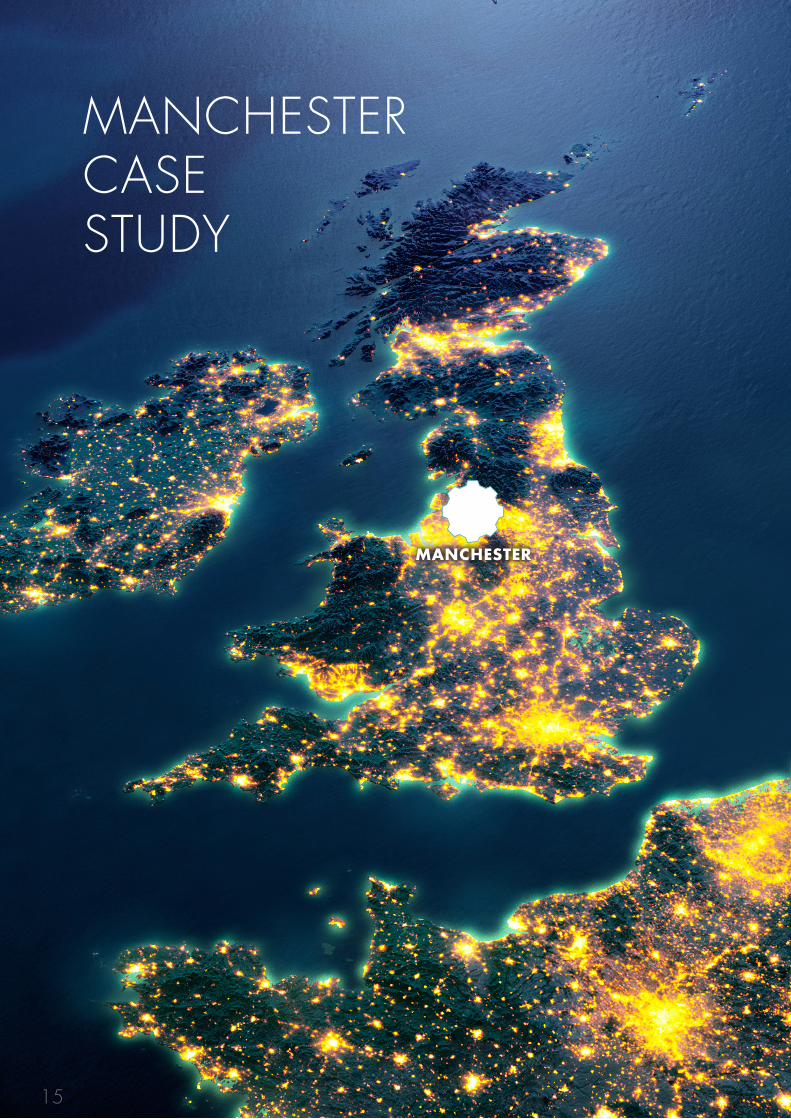
MANCHESTER CASE STUDY
MANCHESTER
15

The city has a population of 520 215, lying within the UK’s second most populated urban area with a total population of 2 553 379.2 The city’s area is 115.65 km2 whilst the urban area extends to 630.3 km2. The urban density is 4,051/km2.
Manchester is a beta world city according to GaWC3 along with the Brazilian Rio de Janeiro.
Manchester is a unique city for it is the first in the world to have become industrialised. Historically known for its textile manufacture and the Manchester Ship Canal providing the city with a port. After the Second World War, deindustrialisation was affecting Manchester, similarly to other UK cities, presenting the country with a major challenge. However, the unfortunate event of the Manchester bombing in 1996 had a positive effect in the form of drawing investment in for regeneration, which to some extent counter-balanced the post-industrial decline.
Today, Manchester is also a major location attracting vast amounts of foreign visitors, due to its musical, cultural and sports events. The city is a significant transport hub, with the third busiest airport in the UK and also critically important railway infrastructure. The UK’s ambitious planning of its first High Speed Rail network includes Manchester as a core destination. Manchester has three universities and it has a rich science, research and development heritage, as it was the location where scientists first split the atom, for example.
The city also scores the strongest annual growth in business stock amongst the UK Core Cities: Birmingham, Bristol, Leeds, Liverpool, Newcastle, Nottingham, and Sheffield.
Manchester is an important distribution hub for a number of global companies, has a significant amount of company headquarters and a strong presence of major financial companies and retail firms. Unlike some other UK cities, Manchester does not currently possess a cohesive vision of what defines a smart city, or what kind of smart city Manchester should be. Despite being awarded funds to create a feasibility study for implementing smart city solutions in the city, Manchester’s vision focused more on the economic future of the city.
BACKGROUND: THE PLACE
Manchester’s open data evolution started with the ‘Information City’ initiative, which identified some key early stage open data features5, followed by the Greater Manchester Open Data Infrastructure Map realized by Salford City Council in 2014.6
There is very rich history to Manchester in terms of community and social elements, providing invaluable lessons to a wider audience, certainly for many global cities as a positive example. Firstly, how this city successfully turned around the ‘post-Olympic depression’ to ‘City Pride’ carrying on the strong collaboration in order to achieve urban regeneration goals, a good example of resilience.7
SMART CITY STRATEGY: ENERGY - MOBILITY / TRANSPORT - ICT
1 1 2 3 4 5 6
1 2 3 4 5 6
16

A recent EU report ranked Manchester as the fifth most successful Smart City amongst 240 EU28 cities.1
Manchester has also been awarded the European City of Science 2016, which grants an excellent occasion to re-numerate the city’s scientific achievements and the city is amidst the elevated preparatory works of hosting a series of events to invite visitors from the STEM community to demonstrate the City of Science. 2
The Greater Manchester Waste Disposal Authority (GMWDA) combined policy and governing with the leadership of experts in the field, successfully implementing design solutions to engage and educate citizens, as an essential part to transform their Waste System, achieving by far more ambitious targets and goals than what the whole UK aimed and pledged to at the time.3
Corridor Manchester is an innovation hub, entrepreneurial district established in 2007 and has recently been awarded with funds within the EU’s H2020 initiative.4
Manchester has recently been awarded with £10 M by the Government for its ‘City Verve’ smart project. It will tackle projects such as; a biometric sensor network, community wellness, talkative bus stops, smart lighting, bike sharing and smart air-quality monitoring.5
The Smart Cities 2014 report identified a challenge for Manchester is the prevalence of private corporation control over public services such as gas, electricity, water and transport which makes the implementation of city-wide smart city strategies by the council more difficult. For example, in Greater Manchester the local authorities would have to get the consent of 66 bus operators to introduce an integrated smart ticketing system.6
The OECD report that Manchester faces a socio-economic challenge of financial sustainability due to its ageing population. This combined with lower numbers of younger, active citizens could be a challenge for smart city adoption and progression within the overall population. The report also cites Manchester as a city under financial pressure due to the recession and reductions in government funding. This has led to different means of providing public services such as through the use of private companies which can make overall smart-city strategy implementation and management far more complicated.7
The Manchester Core Strategy 2012 to 2027 identifies pockets of deprivation, a lack of skills and knowledge within the workforce to meet growing job demands, health inequalities, road congestion and unreliable public transport and air quality as major challenges which the city faces today and into the future.8
CHALLENGES AND SUCCESSES
The Manchester Multi Area Agreement was established in 2008 ‘to put together a single, cohesive city region that can collectively determine the best way forward… to implement our single ‘Economic Strategy’, in areas including innovation, investment, enterprise, branding, employment and skills. Getting regional and national agreement’8
The city also has a history of paying especial attention to its elderly. It started in 2003 with VOP (Valuing Older People) - the initiative then became part of a grander scheme: WHO Age-Friendly Cities. Manchester was amongst the first cities to join and launch its action plan in 2010, establishing a European city-link: Brussels within this programme. It is crucial to incorporate the elderly in the equation when designing and developing a city, moreover, actively involve them in this process, make them part of the living, breathing fabric of the habitat.9
Manchester also identified the crucial importance of managing Green Infrastructure and this is reflected in their vision for the future.10
Promoting and contributing to the city’s smart agenda is the FutureEverything, formerly known as Futuresonic, an organization acting as an art and digital innovation hotbed since 1995. They run significant events and projects throughout the year, including international locations such as Singapore and Moscow, however there is also a yearly FutureEverything Festival taking place in Manchester.
1 2 3 4 5 6
17

Unlike some other UK cities, Manchester does not currently possess a cohesive vision of what defines a smart city, or what kind of smart city Manchester should be. Despite being awarded funds to create a feasibility study for implementing smart city solutions in the city, Manchester’s vision focused more on the economic future of the city, with the feasibility study reporting ‘The City Council’s vision is to continue to increase Manchester’s economic competitiveness and employment growth, underpinned by a vibrant city culture, attractive neighbourhoods and public places, and an environmentally sustainable infrastructure’4. Whilst the feasibility study proposes smart city technologies and solutions in order the make this vision a reality, Manchester would benefit from a clearer vision of the kind of smart city it wants to be for its citizens, rather on focusing solely on how smart city solutions can be leveraged to achieve traditional urban objectives.
ESSENCE OF THE PLACE
CITY
POPULATION
C02 REDUCTION TARGET
SMART CITY OBJECTIVE
PUBLIC POLICY
NATIONAL PARTNER CITIES
EUROPEAN PARTNER CITIES
GLOBAL PARTNER CITIES
METHODOLOGY FOR CHANGE
EXISTING SMART INITIATIVES
OPEN DATA POLICY
MAIN SUCCESSES
CASE STUDY FOCUS TO TAKE FOCUS
MANCHESTER
City: 520,215. Urban: 2,553,379 (2nd in UK)
Between 2009/10 and 2013/14 the Council’s direct CO2 emissions have reduced by 17%. This reduction has enabled the Council to remain on the trajectory to reach the target of a 41% reduction in CO2 emissions by the end of 2019/20, from a 2009/10 baseline.
MAA (Manchester Multi Area Agreement), Greater Manchester Waste Disposal Authority (GMWDA), Association for Greater Manchester Authorities (AGMA), Commission for the New Economy, Greater Manchesters Combined Authority (GMCA), Greater Manchester Energy Group (GMEnG) ,Northern Powerhouse (heavily argued politically), URBED, AECOM.
Managing Green Infrastructure, Social Inclusion, Job creation, Bicycle paths, transport improvement, promoting parks & healthy lifestyles, improving intelligent infrastructure.
GMWDA: Salford, Bolton, Bury, Oldham, Rochdale, Salford, Stockport, Tameside, Trafford. Northern Powerhouse: Hull, Liverpool, Sheffield, Leeds, Newcastle.
WHO Age-Friendly Cities: Brussels
Public-Private Co-Operation, Governmental Policies for Citizen Engagement
Corridor Manchester (established in 2007), City Verve (2015), WHO Age-friendly Cities (2010) prevailing initiative: VOP (Valuing Older People) (2003-2010)
Information City (Governmental policy identifying key achievables: bulletin boards, open access to public information, e-mail, Internet world, Electronic Village Halls), Greater Manchester Open Data Infrastructure Map (2014) by Salford City Council European City of Science 2016, Corridor Manchester (EU, H2020), Greater Manchester Waste Disposal Authority (GMWDA) commencing in 1999 completely transformed the Waste Management System of the Area, City Verve- the winner of a £10m Government-led technology competition
Corridor Manchester (EU, H2020), Greater Manchester Waste Disposal Authority (GMWDA) - transforming the region’s Waste Management
1 2 3 4 5 6
18

Manchester’s Smart City approach involves a multitude of stakeholders who act independently to some extent but it is evident that there is strong co-operation between the Greater Manchester Authorities, such as: Association of Greater Manchester Authorities, Manchester Multi-Area Agreement, Greater Manchester Waste Disposal Authority. They control many incentives from the top-down whilst actively engaging with citizens, encouraging discussion. This nurtures civic participation and promotes social inclusion. It also enables the city to continue to act as a testing ground within the smart city arena. Manchester’s flagship project, Corridor Manchester allows contribution in the cities Smart City approach, providing research, technologies and infrastructure to shape and develop the city’s approach. This will also be the location for the City Verve project, which recently won a £10 million prize to demonstrate technological innovations.
SMART GOVERNANCE IN THE PLACE: STAKEHOLDER MAPPING
PUBLICGreater Manchester Open Data Infrastructure Map,
Manchester Council, Greater Manchester Authorities,
GMWDA, AGMA, GMenG, Northern Powerhouse, UK Government, EU, WHO
Age Friendly Cities.SOCIAL
ENTREPRENEURSCorridor Manchester,
Manchester Social Entrepreneurs, Women
Supporting Social Entrepreneurs.
PRIVATEURBED, Aecom,
Arup, Major Bank Companies, MediCityUK, Major Retail Companies.
ACADEMIAUniversity of Manchester, Manchester Metropolitan University, Royal Northern College of Music, MICRA,
Manchester Business School, other higher education
institutes.
CIVILSOCIETY
Greater Manchester Youth Network, William Temple Foundation, Manchester
Citizens, City Mayor.
1 2 3 4 5 6
Sparta Digital, an integrated IT and Digital marketing consultancy based in the Northern Quarter, Manchester has won an initial funding of 150,000 as part of the frontiercities accelerator program for developing a transport ticket-ing mobile app. URBED’s David Rudlin wins the The Wolfson prize in relation to the garden city concept and has been instrumental and key influencer at many pan private/ academic demonstrator and policy events for the smart city team at Manchester. Smart live, the events specialists have also been very active in manchester development luanching a northern branch of Medicity.
KEY SME’S/ PARTNERSHIPS
19
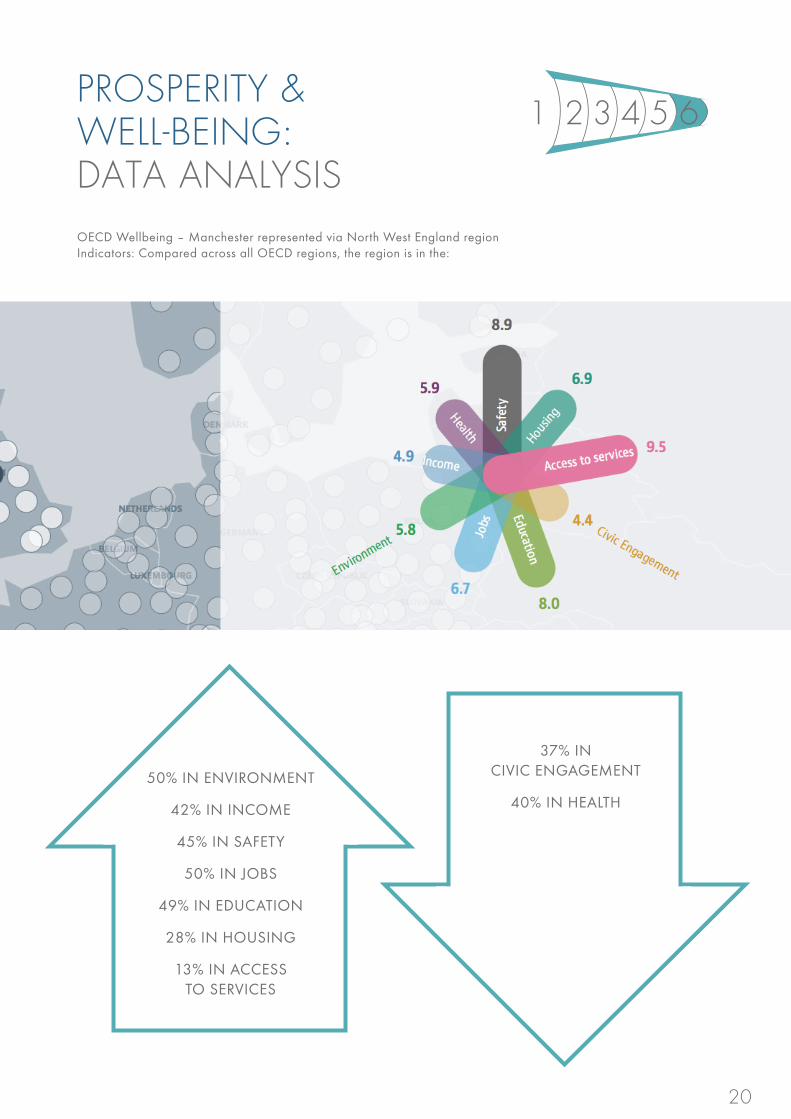
OECD Wellbeing – Manchester represented via North West England region Indicators: Compared across all OECD regions, the region is in the:
PROSPERITY & WELL-BEING: DATA ANALYSIS
50% IN ENVIRONMENT
42% IN INCOME
45% IN SAFETY
50% IN JOBS
49% IN EDUCATION
28% IN HOUSING
13% IN ACCESS TO SERVICES
37% IN CIVIC ENGAGEMENT
40% IN HEALTH
1 2 3 4 5 6
20

LEEDS CASE STUDY
LEEDS
21

The city has a population of 766 399 and it is the second largest local government district following Birmingham. The urban area’s population is 1 777 934, ranking at 4th place in the UK.2 The city’s area is 551.72 km2 whilst the urban area is 487.8 km2. The urban density is 3,645/km2.
Leeds is a gamma world city according to GaWC3 along with Glasgow in the UK and Belfast in Ireland.
Historically known for its wool trading activities, it enabled Leeds to evolve into a major mill town during the Industrial Revolution. The city is leading the way in the UK in terms of ‘telephone delivered banking and related financial services’, operating over 30 call centres and comes second largest as a legal centre in the country after London.
It is the dominant city in the West Yorkshire area, in terms of finance, commerce and culture. It also has a rich academic society with four universities, ranking fourth place in the UK in terms of student population. Leeds is also a prominent business location, with the presence of major financial corporations, food, vehicle and chemical manufacturing and major companies headquarters.
An important transport artery with the third busiest railway station in the UK, it also serves an impressive amount of passengers in its airport. The UK’s ambitious planning of its first High Speed Rail network includes Leeds as a core destination.
BACKGROUND: THE PLACE
Leeds has developed policy documents detailing their strategy for implementing smart city solutions in the city.
Leeds City Council’s 2014 report explains the city’s operative 3 layer approach to deliver ‘smartness’:
• Foundation Layer: ‘digital by design’ element • Differentiation Layer: identified unique priorities – health and wellbeing, data and co-production • Innovation Layer: ‘development of global leading projects that exploits the City’s differentiators through a unique combination of Information, Human Capabilities and Digital Technology to deliver city outcomes in a uniquely innovative way that can then be applied in other cities.’5
The city has also been working closely with the global IT player CISCO in driving a Smart City agenda, mainly working in developments within the field of the Internet of Everything, with an especial focus on what it means for cities, starting in 2014.6 Furthermore, open platform for healthcare is also on their smart city agenda, under the ‘Innovation Health Hub’ initiative, which include health-related mobile applications and an innovation laboratory, amongst other digital tools.7
With regards to carbon reduction commitments and energy efficiency, year 2012 marks Leeds becoming a member of the Climate Smart Cities, which is a coalition of cities across the globe for better climate governance, addressing crucially important issues for future sustainability in urban environments.8
SMART CITY STRATEGY: ENERGY - MOBILITY / TRANSPORT - ICT
1 1 2 3 4 5 6
1 2 3 4 5 6
22

A progressive success for the city of Leeds was achieving the runner up to the Next Generation Digital Challenge Award 2014 with their Leeds Data Mill initiative.
Leeds has succeeded in its large scale delivery of freely available Wi-Fi with installations in over 103 public buildings and to tower block residents to meet the city’s aim of closing the digital divide.
A further successful project is ‘The Greenhouse’, which welcomed its first habitants in 2010, with the aim of facilitating the creation of a low carbon community. It is a housing estate development in which architectural solutions are integrated with practical technical solutions allowing people constant, reliable and precise feedback regarding their consumption, in the form of a specially designed app. A supportive social media platform further enabled the formation of a strong community within the estate allowing residents to share their records, to compare and create positive, healthy competition. Also sharing tips and advice, furthermore having a positive impact on the ‘outsiders’ providing them with knowledge, showing them examples in very practical terms, thus encouraging a more environmental and energy conscious behaviour. As an indicator of this project’s success: Little Kelham in Sheffield based their design on this model and took it forward for their low carbon community. 1
A key challenge identified through the evaluation of Leeds Transport Strategy is an issue of accessibility from the disabled community’s perspective. 2 It is argued what is the degree of ‘true involvement’ of various minority groups during the design process and in prevailing planning and development. The raises the challenge of ‘access for all’ in smart city initiatives in Leeds.
The ‘Smart Cities: Delivering a sustainable City in the Digital Age’ 2014 Leeds Report highlighted that the city faces a challenge against time to meaningfully engage with communities, localities and businesses. It also states that the city faces a challenge of limited resources to meet its smart city capacity, achieving only ad-hoc smart city initiatives to date. 3
The city also reports that it faces the challenge of a lack of a specialised biding team to target smart city funding, inward investment and partnerships which is restricting its smart city capacity. A further issues raised is the challenge of low digital knowledge among all sectors, lacking in the business and technology skills necessary to navigate this new smart city and digital age trend. 4
CHALLENGES AND SUCCESSES
1 2 3 4 5 6
23

Leeds City Council have provided a clear vision of Leeds as a smart city, built around open data usage. Open data is crucial in the ethos of granting ‘access for all’ and an important aid in the cities’ future, evolving via collaboration between the public and private sector.4 This vision is well reflected in the city’s policy documents, indicating the city has taken steps towards turning their smart city vision into a reality.
ESSENCE OF THE PLACE
CITY
POPULATION
C02 REDUCTION TARGET
SMART CITY OBJECTIVE
PUBLIC POLICY
NATIONAL PARTNER CITIES
EUROPEAN PARTNER CITIES
GLOBAL PARTNER CITIES
METHODOLOGY FOR CHANGE
EXISTING SMART INITIATIVES
OPEN DATA POLICY
MAIN SUCCESSES
CASE STUDY FOCUS TO TAKE FOCUS
LEEDS
City: 766,399. Urban: 1,777,934 (4th in UK)
40% reduction between 2005 and 2020. Total emissions have reduced by 14.4% from 2005 to 2009, an annual rate of 3.6%. To reach the target, a rate of 3% every year will need to be sustained from 2009 to 2020.
Northern Powerhouse (heavily argued politically), Leeds City Council working in partnership with CISCO, Leeds City Region
Better energy management (Climate Smart Cities), development of Leed’s public sector services, urban environment and entrepreneurial ICT skillset,aiming to harness the potential of the IoT
Leeds City Region: Barnsley, Bradford, Calderdale, Craven, Harrogate, Kirklees, Selby, Wakefield, York. Northern Powerhouse: Hull, Liverpool, Sheffield, Leeds, Newcastle. Climate Smart Cities: Birmingham, Sheffield.
Open and Agile Smart Cities (OASC)
Climate Smart Cities: Kolkata (India), Lima-Callao (Peru), Johor Bahru and Pasir Gudang (Malaysia), Palembang (Indonesia), Recife (Brazil), Kigali (Rwanda)
Governmental Initiatives
Climate Smart Cities (2012), CISCO’s Smart City Agenda (2014), Leeds Data Mill (2014/15) by LCC (Leeds City Council)
Leeds Data Mill (2014/15) by LCC (Leeds City Council)
The Greenhouse- low carbon community (2010), Leeds Data Mill (2014)
The Greenhouse- low carbon community (2010)
1 2 3 4 5 6
24

Leeds’ Smart City approach involves a multitude of stakeholders who act independently to some extent but it is evident that Leeds City Council controls many incentives from the top-down. For example they facilitate entrepreneurship via Leeds Community Foundation and aid civil initiatives via their Office for Civil Society. This nurtures civic participation and innovation. It also enables the city to continue to act as a testing ground within the smart city arena. Leeds’ many higher education institutes allows contribution in the cities Smart City approach, providing research, technologies and infrastructure to shape and develop the city’s approach.
SMART GOVERNANCE IN THE PLACE: STAKEHOLDER MAPPING
PUBLICLeeds Data Mill, Leeds City Council, National
Government, UK Government, EU, Climate
Smart Cities, Leeds Community Foundation, Office for Civil Society.
SOCIALENTREPRENEURS
Caring For Life, Soul Circus, St George’s Crypt, smart
start-ups, open data users.
PRIVATECISCO, Siemens, BT, Virgin
media, Mitsubishi, Arla Foods UK, Major Banking Companies, Retail Compa-
nies.
ACADEMIAUniversity of Leeds,
Leeds Beckett University, Leeds Trinity University,
University of Law, Leeds City College, other higher education institutes.
CIVILSOCIETY
The Greenhouse (low carbon community), Leeds Citizens,
City Mayor.
1 2 3 4 5 6
Leeds IT company aql have helped develop and deliver the city’s integrated communication services network. Actuated Futures is a successful consulting company founded by Ian Jones have been instrumental in helping Leeds develop their strategies in ICT a success when coupled together with Health and Innovation director Tim Straughan has provided a focus on the agenda of of how smart cities iniatives can support positive change in healthcare.
KEY SME’S
25

OECD Wellbeing – Leeds represented via Yorkshire & The Humber region Indicators:
PROSPERITY & WELL-BEING: DATA ANALYSIS
31% IN HOUSING
17% IN ACCESS TO SERVICES
46% IN INCOME
45% IN SAFETY
40% IN ENVIRONMENT
39% IN CIVIC ENGAGEMENT
48% IN HEALTH
47% IN JOBS
49% IN EDUCATION
1 2 3 4 5 6
26

BRISTOL CASE STUDY
BRISTOL
27

Bristol, the largest city in the South West of England, has a population of around 442,5001. The city has a relatively young age profile with more children than people aged 65 and over. The median age in Bristol is 33.4 years compared to the GB median of 40 years2.
Bristol is the 10th largest city in Great Britain and one of the ten ‘Core Cities’. The city has the third strongest academic cluster in the UK after Oxford and Cambridge, with 46% of its working age residents being qualified to degree or higher levels compared to the national average of 36%3. It is one of the most successful cities in the UK, with a higher employment rate and lower unemployment rate than in most core cities. The city is now expanding its economic growth potential through its strong knowledge industries which are well connected. The city has a focus on high technology, digital and green industries. The city is enabling this through an award from the UK Government’s Urban Broadband Fund, creating ‘Gigabit Bristol’ providing ultrafast broadband speed. Bristol is identified by NESTA as one of nine UK creative hotspots, promoting innovation and economic growth across its region. The city is ranked 7th in the strongest European regions in attracting inward investments. The city has a strong start-up rate and is home to many independently owned businesses. It is also the strongest UK core city in terms of patents per 100,000 (population), with 8.3, almost double the UK average. Bristol boasts an impressive technology and creative industry, being home to the largest silicon chip industry outside Silicon Valley4. The city is home to one of Europe’s largest robotics laboratories - Bristol Robotics Laboratory, as collaboration between and it’s universities.
In 2011 Smart City Bristol was commissioned by Bristol City Council with funding from the UK Department of Energy and Climate Change. This was a collaborative programme between public, private, academic sectors and citizens. It was set up with the aim of using the cities increasingly smart and connected technologies to meet CO2 targets and social and economic objectives. The city’s established technology industry, academic credentials and investments in digital infrastructure and connectivity meant that Bristol was capable of developing as a future smart city.
BACKGROUND: THE PLACE
A forward-thinking mayor, a creative atmosphere and super-fast internet mean the city outdoes London when it comes to technological innovation. Bristol is making efficient and innovative use of existing infrastructure. For example the high-speed fibre network, which makes use of disused cable ducting owned by the city, is being combined with the university’s £12m supercomputer and a new ‘city operating system’ that will power the experimental network10. Bristol Data Dome has also been established as a central hub to analyse, manage, visualise and communicate smart city initiatives.
The city maintains focus and suitability in its smart city initiatives with the use of selection criterion as seen in Table 111.
Bristol has focused its initiatives in the areas of; smart data, smart transport, smart grids, smart metres and open data.
Bristol Is Open: A digital R&D joint venture company, owned by the University of Bristol and Bristol City Council, which makes use of an innovative digital infrastructure. The initiative is exploring new forms of digital connectivity, including software defined networks, network function virtualisation, Internet of Things, Big Data, data visualisation and smart city applications12. It supports local SME’s and community organisations in their ‘smart’ developments as well as working with global ICT companies.
RERUM (Resilient and secUre IoT for sMart city applications): Project to develop, evaluate, and trial an architectural
SMART CITY STRATEGY: ENERGY - MOBILITY / TRANSPORT - ICT
11 2 3 4 5 6
1 2 3 4 5 6
28

Bristol is the first UK city named European Green Capital and will hold the honour in 2015. The city adopted a Climate Change and Energy Security Framework17 to meet its 40% carbon reduction target by 2020. The city achieved a 15% reduction in CO2 emissions from 2005 to 2009. Bristol also won the 2014 International Making Cities Liveable Lewis Mumford Award for a healthy and liveable city, and is one of the first Rockefeller 100 Resilient Cities18.
Despite the city’s successes inequalities exist and many areas experience multiple deprivation. Life expectancy has a persistent gap between the most and least deprived areas (an estimated gap of 8.9 years for men and 6.6 years for women, 2011-13).Bristol’s economic success has also brought with it problems such as congestion, environmental pollution and high house prices (relative to income). Despite improvements in air quality, ozone and NO2 levels are still above EU limits in central areas and on main radial roads19. It has also been brought to attention that the city needs to improve its public transport systems and networks to provide connectivity and accessibility to all throughout the city.
Bristol’s smart city initiatives have received local and global funding. It was the EU 2020 Horizon Innovation Programme winner receiving 25 million in smart city and community funding. Bristol also received UK Government funding from BIS & DCMS and from UK Connected Cities. Bristol is open is part of TM Forum’s Smart Cities Global Leadership Team, and has created long term partnerships with global ICT industry companies20. The program has successfully engaged local citizens, SME’s and global companies in smart city design. The city has an ambition to be within the top 20 European cities, it will need to further develop its smart city initiatives to overcome the above challenges and achieve a healthier, more sustainable and liveable city.
CHALLENGES AND SUCCESSES
framework for dependable, reliable, and secure networks of heterogeneous smart objects supporting innovative Smart City applications. The framework will be based on the concept of “security and privacy by design”, addressing the most critical factors for the success of Smart City applications13.
Sphere (sensor platform for healthcare in a residential environment): Sees homes fitted with hundreds of monitors to amass an unprecedented amount of data that will allow a better understanding of the relationship between lifestyle and preventable diseases14.
Connecting Bristol15: A digital public, private and community partnership coordinated by the Bristol City Council’s City Innovation Team. This pilots the latest smart technologies to enhance Bristol’s resilience, sustainability, economic prosperity, inclusiveness and liveability.
You Decide (APP): a free digital tool that makes it easier for people to have a say in the decisions that affect them.
Open Data: The city’s fibre optics are forming an open, giant operating system that can learn from its citizens, while they, can use it to “customise their environment” by developing apps for it. The city has opened up almost two hundred of the city’s data sets on traffic flows, energy use, crime and health trends to kick-start the creation of innovative new services16. This is available online from Bristol is Open and the city council site.
1 2 3 4 5 6
29

Bristol Mayor George Ferguson has played a leading role in Bristol’s smart city strategy. He has pushed for the experimental, test-bed (internet of things experimenter) approach and in using smart initiatives to meet ambitious environmental targets5. Since 2011 the city has established itself as a testing ground for smart city innovation and is open to public, private, academic and citizen engagement. It aims to improved citizen engagement, enhance city systems, improve the environment, improve health, maintain a vibrant economy and achieve better quality of life through use of smart city initiatives. Bristol is on track to becoming a more prosperous, inclusive and sustainable city6. The high involvement of people and communities is what makes the Smart Bristol approach distinctive, looking to understand how people work with the technology but also to actively involve them at every stage in the development of the experiences, products and services that help the city to achieve its aims7. The idea of the city as a “living lab” has flourished, with local organisations like the Knowledge West Media Centre and Watershed supported in delivering technology projects designed by and for the city’s inhabitants8.
The city has developed a brand identity around its green achievements and in making green initiatives mainstream, encouraging citizens to live more sustainably, thereby helping everyone lead healthier, happier city lives. The brand strapline ‘in it for good’ communicates the benefit of being involved while conveying Bristol’s personality. It shows that while Bristol 2015 is about addressing global issues, it is firmly rooted in the city and Bristolians have the power to make it a happier and healthier place to live9.
ESSENCE OF THE PLACE
1 2 3 4 5 6
CITY
POPULATION
C02 REDUCTION TARGET
SMART CITY OBJECTIVE
PUBLIC POLICY
NATIONAL PARTNER CITIES
EUROPEAN PARTNER CITIES
GLOBAL PARTNER CITIES
METHODOLOGY FOR CHANGE
EXISTING SMART INITIATIVES
OPEN DATA POLICY
MAIN SUCCESSES
CASE STUDY FOCUS TO TAKE FOCUS
BRISTOL
City: 442,500, Urban: 617,000, Metro: 1,006,600
reduce CO2 emissions by 40% by 2020 from a 2005 baseline.
Bristol is Open - Bristol University, Bristol City Council & Private Companies.
Citizen engagement and enhancement of city systems focus. Cleaner environment, better health, vibrant economy and better quality of life. Investing in digital infrastructure and connectivity. Helping to achieve sustainability and carbon reduction goals - a greener, smarter city.
Bath, North Somerset, South Gloucester
Florence,San Sebastian REPLICATE (REnaissance of PLaces with Innovative Citizenship And TEchnologies) - was given the highest score of all the entries for its innovative proposal to integrate energy, transport and ICT at scale in the city. Public/private/academic partnerships, Citizen Engagement, Infrastructural developments, Local Public Policy - Bristol is Open. -technology and development into hands of citizens and SMEs - piecemeal testing ground. Selection criteria and process (MCDM)- Strategy Focus Areas: Smart Data, Smart Transport, Smart Grids, Smart Metres, Open data. Open Bristol, Data Dome, Smart City Bristol Report, REPLICATE, RERUM, SPHERE, Smart City Bristol, Connecting Bristol, You Decide, Playable City, Integrated, wifi mesh and city network cable system.
Open Bristol Access, Access to All, Data Dome, Bristol is open: the open ‘playable’ city.
EU 2020 Horizon Innovation Programme winner; 25 million smart city and community funding, Government funding (BIS & DCMS), UK Connected Citied Funding.
Use of and enhancement of existing infrastructure in Smart City development.
30

The Council is taking a leading role within the smart city strategy, working to build the partnerships and secure the funding to deliver the Smart City ambition and realise the Mayor’s vision to see Bristol develop as a “Testbed for Change”21. Bristol’s Smart City approach involves a multitude of stakeholders which act independently as well as being some-what integrated. Control comes from both the bottom-up and the top-down leading to a messier, unstructured set of stakeholders. However this allows for organic change and innovation. It also enables the city to continue to act as a testing ground within the smart city arena. Bristol University is also heavily involved in the cities Smart City approach, providing research, technologies and infrastructure to shape and develop the city’s approach.
In the future as it developed further as a smart city, Bristol will require a more robust and structured stakeholder management in order to maintain coherence and control in its growth.
SMART GOVERNANCE IN THE PLACE: STAKEHOLDER MAPPING
PUBLICBristo is Open, Bristol city council, National
Government, UK Government, EU, Tech City
UK, Innovate UK.
SOCIALENTREPRENEURS
Social Enterprise Work’s, West of England local
Enterprise Partnership, smart start-ups, open data users.
PRIVATEBBC, BT, NHS, Forum for the Future, HP, Toshiba,
NISSAN, Zuora, Zipabout, Imteck UK, GE, E&Y, Atkins Global, Esoterix systems, Rolls-Royce, Silversprings
network.
ACADEMIABristol UniversityHigher Education
establishments.
CIVILSOCIETY
Knowle West Media Centre (KWMC), Bristol Citizens,
City Mayor.
1 2 3 4 5 6
Bristol have targeted becoming the UK’sinternet of things demonstrator and combined multidisciplinary collaboration well to include communications platforms working with Zipabout and relationship management services in business with Zuora. Working Imtech a socially responsbile electrcial contractor and integrating Esoterix systems a Bristol base t technology company woth a focus on transport software platforms to deliver a combined coherent smart city strategy. Entrepreneurs Owen Maddock (a savy engineer) and his wife Karen spotted a gap in the bespoke solutions for families for whom a jittering copper connection to the nearest BT exchange.
KEY SME’S/ PARTNERSHIPS
31

OECD Wellbeing: Bristol represented by South West England regionBristol scores highly in all of the nine OECD indicators suggesting higher levels of wellbeing. This is consistent with their smart city approach in achieving a quality of life focus and a participatory environment for all.
PROSPERITY & WELL-BEING: DATA ANALYSIS
47% IN ENVIRONMENT
24% IN JOBS
42% IN EDUCATION
5% IN ACCESS TO SERVICES
46% IN CIVIC ENGAGEMENT
29% IN INCOME
22% IN HEALTH
21% IN SAFETY
27% IN HOUSING
1 2 3 4 5 6
32

BELFAST CASE STUDY
BELFAST
33

Belfast, the largest city and capital of Northern Ireland has a population of around 343 4451. Belfast’s city centre fits the structure of Burgess’ model as it is largely made up of the elderly, students and young single people, with majority of families living on the periphery. Historical sectarian conflict and political unrest have significantly influenced the city, particularly in terms of segregation. The city centre is characterised by varying socio-economic areas radiating from the CBD ranging from affluent areas such as Malone Roads to areas of deprivation such as Shankill Roads2. However the current period of relative peace has seen a boost in the economy and in CBD revitalisation with a focus on pedestrianisation, accessibility and retail development3,4.
As a post-industrial city which was historically a major trade port, linen producer and top engineering and ship building industry. Belfast experienced a major economic crisis between 1973 and 2001 with a total of 51,000 manufacturing jobs lost and major population losses5. However the city is successfully rebuilding its environment, economy and society from a low point of industrial decay and unemployment6. Developments such as the 1994 peace process, the 1996 ceasefires, 1998 city centre regeneration and the 1999 Good Friday Agreement along with EU and UK financial aid for conflict damage recovery have seen a turn have enabled this economic return7.
Belfast is the driver of the NI economy and is now an established business and technology hub. The city has enjoyed a growth of over 6% in the last decade and is second to London in the attraction of FDI. Belfast has half of NI’s hi-tech manufacturing jobs and two-thirds of creative media and arts jobs. It also has growing financial sector employing over 20,000 people and a creative industry composing 1,000 creative businesses in the city centre, employing over 17,000 people8. The city is now also growing in its health and biotechnology sectors, its clean technology industry and low carbon and waste reduction sectors. Belfast has five higher education institutions which are important city assets contributing to considerable impact on the city and regional economy. NI was also the first European region to achieve 100% broadband coverage and Belfast was one of 10 super connected cities chosen to receive government funding to roll out superfast broadband9.
With a 98% dependency on imported fossil fuels the city is a laggard in terms of sustainability and carbon reduction achievements. However a number of policies such as the ‘back to the Future’ report have been put in place to work towards a greener, lower carbon city with a target of becoming fossil fuel free by 205010. In 2001 Belfast was identified as the UK’s most car dependant city in ‘Contemporary lifestyles and the implications for sustainable development policy’ report . The city introduced its Transport Masterplan ‘Belfast on the Move’ in 2010 to reduce general traffic levels and encourage walking, cycling and public transport use. The city has a bus rapid transport system plan in place which has reached its first phase of development and is scheduled to become fully operational in 2018. The system looks to integrate ‘Intelligent Transport Systems’ (ITS) to enable users to be better informed and make safer, more coordinated, and ‘smarter’ use of the network.
With a growing economy, technology industry, a large young population, high broadband connection levels, established academic centres and increasing political stability Belfast was well-placed in its suitability in becoming a smart city when it first applied to IBM’s Smarter Cities Challenge in 2012 . Their focus on quality of life, accessibility and social inclusion stood out among high competition and in 2013 the city won the IBM grant worth an estimated $400,000 along with access to smart city experts and a city-wide consultation12.
BACKGROUND: THE PLACE
IBM’s expert consultation process with Belfast resulted in a number of recommendations mainly focusing on Belfast’s organisations working together in ‘smarter’ ways to tackle persistent, complex social problems16. These included the development of a collaborative planning environment, data and evidence-based decision making and enhanced technology systems such as software systems. This influenced a smart city approach based on the
SMART CITY STRATEGY: ENERGY - MOBILITY / TRANSPORT - ICT
1 1 2 3 4 5 6
1 2 3 4 5 6
34

A major success of Belfast’s smart city approach to date is its achievement of the integration of smart city strategy into overall, comprehensive city policy and planning. Policy reports such as The Belfast Masterplan, Belfast on the Move and Back to the Future (The Future Cities Initiative) embed smart city initiatives into the functions and processes of their overall city strategy, using smart city approaches as a means to tackle current city challenges such as quality of life and access for all. This was facilitated by another main success of achieving the IBM Smarter Cities award (2013). Achieving UK Governmental Super-connected Cities funding also allowed for the development of Belfast as a global leader in digital connectivity. Despite these achievements Belfast has been slow moving in the implementation of smart city projects, policies and initiatives following the IBM consultation in 2013. In order to remain competitive the city will need to reach key deliverables in its aims for improved life quality and social cohesion through its smart city initiatives.
Belfast still faces challenges of socio-economic inequalities such as in high demand for social welfare, 35% of people experiencing income deprivation and approximately 18.9% of households considered to be in relative poverty. The city also experiences high levels of fuel poverty (45% of households in 2009) and has one of the highest per capita carbon emissions in the UK. The NI Strategic Energy Framework have set an ambitious target for 40% electricity consumption from renewable resources by 202021 and 10 % of heat from renewables by 2020 .These ambitious targets could benefit from the use of smart city initiatives focused renewable energy from waste heat, post-industrial hydro technology and biomass.
Belfast City Council highlight that connectivity to the city centre is critical to ensure equality of access to opportunity and services for all. Further progress in sustainable public transport in needed to achieve this.
CHALLENGES AND SUCCESSES
cohesion and integration of city planning in collaboration with public, private and academic partners with a quality of life focus. The city is increasing SME and citizen engagement with the aim of creating a smart city ecosystem.
The Belfast Masterplan: initiated in 2004 and revised in 2013 aims for a singular, whole-city integrated vision in guiding development following years of unrest. This integration of city policies was held together by a focus on improving quality of life and wellbeing. Smart city approaches play a major role in the cohesion and integration of this strategy such as in the integration of public services via digital infrastructure17.
Digital Infrastructure (Belfast City Council): The cities ultrafast broadband network is now providing high quality Wi-Fi across the city and connections to global markets. Community facilities are being digitally enabled to enhance connectivity and digital skill levels throughout the city. The network looks to be used to address digital exclusion within deprived neighbourhoods and drive efficient delivery of coordinated public services. A city Digital Hub which provides Europe’s fastest direct fibre optic link to North America is also providing a range of flexible workspaces acting as a catalyst for development of digital businesses across the city18.
The Belfast Cube: Provides integration of information flows through an open source portal and data mining. The cube combines online data such as real time traffic streams with smart technologies, such as pc’s laptops and smart phones, smart meters and sensors linking the individual to the city and vice versa to improve both the needs of the individual and city functions. This informational matrix enables systems integration in partnership with central and local government and other public sector bodies, the private and voluntary sectors and the local community to achieve city goals19.
ODI Belfast: Part of the Open Data Institute’s global Node network, ODI Belfast provide open city data which can be accessed by public and private sectors along with citizens to facilitate the development of economic, social and environmental improvements through the use of data. Belfast City Council also provides a number of online, accessible to all city data sets20.
1 2 3 4 5 6
35

Belfast’s smart city approach is based on the cohesion and integration of city planning in collaboration with public, private and academic partners with a quality of life focus.
In 2008 Belfast developed a new city brand and logo which uses a heart-shaped B logo accompanies by messages including the word ‘be’ such as ‘be welcome… part of it … vibrant.’ The aim was to market the city to international visitors and to promote Belfast as an exciting, vibrant and welcoming place. It was identified that the welcoming nature of Belfast citizens is what sets the city apart from others. This was backed by the city mayor who states that the people of Belfast are key to the city’s success and in achieving a world class city in which to ‘live, work, invest and visit.’15
ESSENCE OF THE PLACE
CITY
POPULATION
C02 REDUCTION TARGET
SMART CITY OBJECTIVE
PUBLIC POLICY
NATIONAL PARTNER CITIES
EUROPEAN PARTNER CITIES
GLOBAL PARTNER CITIES
METHODOLOGY FOR CHANGE
EXISTING SMART INITIATIVES
OPEN DATA POLICY
MAIN SUCCESSES
CASE STUDY FOCUS TO TAKE FOCUS
BELFAST
City: 343445, Urban: 483,418, Metropolitan: 579,276
Fossil fuel free by 2050
IBM Smart Cities, The Belfast Masterplan, Belfast Metropolitan Area Plan, the Regional Development Strategy for Northern Ireland and the Regional Transportation Strategy, Belfast on the Move, STEM, Belfast: Future City initiative, Back to the Future.
Community and quality of life focus. Aim for technology to improve social cohesion. Enhancement of the digital infrastructure. Enhance economic competitiveness; and improve the provision of integrated public services.
Regional city leader. Co-ordinator/leader for Northern Ireland.
IBM Consultation, Public-private co-operation, Local Public Policy - The Belfast Masterplan. SME and Citizen engagement - creating a Smart City Ecosystem
IBM Smart City, The Belfast Masterplan, The Cube, The Digital Hub.
Council Open Data Set, Open Data Institute Belfast
IBM Smart City competition winner, Department of Culture, Media & Sport funding, UK Government`s Super-connected Cities funding.
Smart city integration into city masterplan (public policy).
1 2 3 4 5 6
36
See Sensse a crowd funding company developed a cycle light that provides data to collect real time information on accidents, near miss events and roads surfaces to build a better understanding of the built environment and roads conditions for users.Data Smarthub Belfast is an ecosystem of companies building a better urban environment for the city. it delivered a scoping exercise in 2015 with a view to publishing ajoint report on the opportunities and benefits for Belfast. The activites included acting a demonstrator projects funded by industry; highlight opportunities for analysis and deliver informatics and data brokerage; and finally, create a Future Belfast involved in providing evidence and analysis for a whole range of organisations dealing with urban change.
KEY SME’S/ PARTNERSHIPS

The city’s mayor played a significant role in advocating for, facilitating and achieving Belfast’s IBM smart city application and subsequent 2013 award. Consequently IBM and Belfast city council have much control within the cities Smart City approach. Top-down style of management is prevalent however there is encouragement of bottom-up engagement through the provision of open data and enterprise hubs. The private sector also has a large stake in the Smart City approach and therefore holds significant control over Smart City growth.
SMART GOVERNANCE IN THE PLACE: STAKEHOLDER MAPPING
OECD Wellbeing: Belfast represented by Northern Ireland regionIndicators: Compared across all OECD regions, the region is in the:
PROSPERITY & WELL-BEING: DATA ANALYSIS
PUBLICLocal council, National
Government, UK Government, EU, smart
cities council.
SOCIALENTREPRENEURS
Open data users, digital start-ups. Belfast Social
Enterprise Hub.
PRIVATEODI Belfast, IBM,
BT, Virgin, Invest NI.
ACADEMIAQueens UniversityHigher Education.
CIVILSOCIETY
Belfast citizens, City Mayor, Belfast Delivery Forum,Urban
Evolution Smarter Belfast Collaborative Network,
CommunityNI.
1 2 3 4 5 6
1 2 3 4 5 6
37

5% IN ACCESS TO SERVICES
48% IN JOBS
20% IN ENVIRONMENT
45% IN INCOME
45% IN SAFETY
42% IN HOUSING
22% IN CIVIC ENGAGEMENT
43% IN EDUCATION
44% IN HEALTH
Belfast’s smart city approach looks to improve quality of life. It scores highly in access to services, jobs, environment, income and housing however it is lagging in education and health. There is also a citizen engagement approach within their smart city agenda however Belfast scores low in civic engagement.
A top score in access to services suggests a high level of inclusivity which is essential in achieving their smart city goals, however this is contradicted by a lower rate of income and civic engagement.
https://en.wikipedia.org/wiki/Dublin-Belfast_corridor
The Dublin-Belfast corridor (population 3.3 million) is a term used to loosely describe a geographical area that encompasses the cities of Dublin and Belfastand the area between.[1] The term has been used in papers regarding planning strategies in the area, with the aim of capitalising on the expanding economies of both cities
The main route linking the two cities is along the M1 and N1 in the Republic of Ireland and the A1 and M1 in Northern Ireland.
There is also the Enterprise train service connecting the two city regions.
38

Open Data and Big Data PoliciesRudi Ball, Data Scientist & Independent Consultant.
During the past decade numerous Open Data policies have been adopted by various governments around the world. Broadly, the opening up of datasets publicly has been en-couraged by the direct opportunities in data processing and analysis (evidence-based decision making) as well as political motivations, transparency to citizenry and smart-cities agendas.
The potential to use data and statistics for governance has been well understood historically - for example censuses are conducted by some nations to collect demographic information - the periods between censuses (sample periods) have typically been large due to scale and cost. Even with its merits, the actual widespread usage of data to inform government decision making has been limited. Some cities like Singapore have benefited significantly from their intelligent usage of data. With many cities a number of factors have contributed to data analysis being unused, including cost, broad indecision in what data to collect, ensuring data quality and lack of expertise in analysing data - the extraction of valuable insights from data.
The Open Data revolution currently occurring is partly a mixture of technological evolution and political policies. It is easier today to directly collect data using various computing technologies as well as analyse such data, however issues relating to recordkeeping or data storage - consistency, accuracy and applicability persist. Political action by the Open Data movement has thus far made some electronic data public as well as easier to access in larger and larger datasets. Such datasets are fusible with other datasets and cover a variety of domains such as business, city government, education, the environment, health, housing, security, transportation and utilities.
Open Data portals supporting various data interfaces called Application Programming Interfaces (APIs) have been made available. Cities in the United Kingdom (UK)such as London, Manchester, Belfast, Bristol, Leeds and Newcastle have benefited from the centralised Data.gov.uk1 portal. Similar portals have been adopted and leveraged by developers in global cities like Helsinki, Singapore 2, New York3 and San Francisco - often split between two platforms Socrata4 and CKAN5.
EXPERT CONTRAST UK CITIES
Figure 1. A selection of dataset counts as provided by Open Data portals. In comparison the data available from these portals are broad and often inconsistent - this is largely expected because surveys and data collection have often been localised to the local aims of cities lacking standardisation - there was in many cases, historically little intention to fuse or organise data between political regions. In many cases portals have tried to retrofit surveys or government documents (often aggregated) to make them available publicly. Larger cities like London and Manchester have historically funded and collected data relating to domains such a transportation and modeled land development. In contrast, smaller cities have not funded similar data collection efforts due to need and cost considerations. Public organisations within cities have also moved to present their data using their own public portals - there has been some repetition for the maintenance of communication. For example, the Manchester City Council and the Greater London Authority both have their own open data portals for accessing public data also supported on the national portal (data.gov.uk). While data has been made available through these portals, a measure of usefulness of Open Data might be economic and social impact. In general the highest quality datasets are those repeatedly collected at short interval with high accuracy and consistency over time. Some of the most valuable Open Data datasets have been in transportation and immediate applications leveraged by the private sector. The internal improvement in governance is less well understood and there is an opportunity for further research.
In comparison the data available from these portals are broad and often inconsistent - this is largely expected because surveys and data collection have often been localised to the local aims of cities lacking standardisation - there was in many cases, historically little intention to fuse or organise data between political regions. In many cases por-tals have tried to retrofit surveys or government documents (often aggregated) to make them available publicly. Larger cities like London and Manchester have historically funded and collected data relating to domains such a transportation and modelled land development. In contrast, smaller cities have not funded similar data collection efforts due to need and cost considerations. Public organisations within cities have also moved to present their data using their own public portals - there has been some repetition for the
maintenance of communication. For example, the Manchester City Council and the Greater London Authority both have their own open data portals for accessing public data also supported on the national portal (data.gov.uk).
While data has been made available through these portals, a measure of usefulness of Open Data might be economic and social impact. In general the highest quality datasets are those repeatedly collected at short interval with high accuracy and consistency over time. Some of the most valuable Open Data datasets have been in transportation and immediate applications leveraged by the private sector. The internal improvement in governance is less well understood and there is an opportunity for further research.
Figure 1. A selection of dataset counts as provided by Open Data portals.
1 Data.gov.uk: Public Data Portal. 2016. https://data.gov.uk2 Data.gov.sg: Singapore Data Portal. 2016. https://data.gov.sg3 NYC Open Data. 2016. https://nycopendata.socrata.com4 Socrata Platform. 2016. https://www.socrata.com5 CKAN. The open source data portal service. 2016. http://ckan.org
39

BRAZIL CASE
STUDIES
I N N O V A T I O N I N C I T I E S
40

ECONOMICS
BRAZIL GENERAL OVERVIEW
BRAZIHJGFJHGFJHFJHGFJHGFHGFHJHFGFGJHFGD BRASILIA
São PaAditiunto te la int rero quo eaquod eost, comni undipis si dis exerum incimil lorrovita eni ut essimet estibus, velestios expere culparu ptatur sit represt, offic tem sit volestia cone doluptium, occuptatur, ut aborunt fuga. Nequam, officiatium labo.
41
URBAN POPULATION AND DENSITY
85%24 people per sq. km land
LANDMASS
8511965 sq. km5th in world
POPULATION
196.5 million2.83% of total world population
5th most populous in world
MUNICIPALITIES
5,570Average population 34,361
2016 IMPORT MARKET$11134 MILLION
2016 EXPORT MARKET$17571 MILLION
GOVERNMENT DEBT$116772966% OF GDP
9TH LARGEST OIL PRODUCER IN WORLD WITH PRODUCTION OS 2.57 MILLION BARRELS PER DAY
ONE OF WORLD’S LEADING PRODUCERS OF HYDROELECTRIC POWER, 69% OF TOTAL GENERATION
TOURISM IS GROWING SECTOR,5.2 MILLION VISITORS PER YEAR, BOOSTED BY OLYMPICS & WORLD CUP

Wellbeing in Belo Horizonte will be visualised in the same way to wellbeing in the British cities, through the use of OECD data. OECD data for Brazil is less comprehensive than data available for OECD member nations. Brazilian data looks at the country as a whole rather than identifying differences in wellbeing between specific regions. As a result, the majority of the information in this section will be the same across all three case studies. As a Brazilian city that has recently implemented a comprehensive BRT system in order to tackle urban mobility, alongside numerous green initiatives, we would hope further research to reveal Belo Horizonte to score above the national average for topics such as education, the environment and community.
PROSPERITY & WELL-BEING: DATA ANALYSIS
Brazil’s wellness indicators share most of the same topics as the OECD nations, with three exceptions11.
1. Life Satisfaction is rated for Brazil but is missing from OECD nations. The OECD note that life satisfaction in Brazil is above the OECD average, with Brazilians grading life satisfaction at 7.0 on a scale of 1 to 10, higher than the OECD average of 6.6. 2. Work-life Balance is also assessed in Brazil, but not in OECD nations. Brazil appears to have a better work-life balance than the OECD, with only 10% of Brazilians working very long hours, below the OECD average of 13%. 3. Brazil does not utilize ‘access to services’ as an indicator, unlike the OECD. Instead, Brazil’s data examines ‘community’, which is defined more broadly as a ‘strong social network, or community’ which can ‘provide emotional support during both good and bad times as well as provide access to jobs, services and other material opportunities’. Again, we find Brazilians feel their community support is strong, as ‘90% of people believe that they know someone they could rely on in a time of need, more than the OECD average of 88%’. This is an interesting disparity between Brazil and the OECD, with the focus on social support indicating community ties and social capital are more important than infrastructure in Brazil when examining how people satisfy their wants and needs.
42
LIFE EXPECTANCY AT BIRTH,74.4 YEARS
RANK 98 IN THE WORLD FOR PERCENTAGE LIVING IN POVERTY AT 21.4%
ADULT LITERACY RATE OF91.33%
EXPERNDITURE ON EDUCATION REPRESENTS 6.1% OF GDP
LIFE SATISFACTION GRADE OF 6.5 IN LINE WITH OECD AVERAGE
TOTAL HEALTH SPENDING ACCOUNTS FOR 9.3% OF GDP

A breakdown of Brazil’s wellness indictors follows, drawn from the OECD’s existing data.
• Housing: Key indicator is rooms per person. Brazil has 1.6 rooms per person on average, receiving a grade of 4.3 and ranking 21st out of 36 OECD nations. Above Slovenia but below Austria. • Income: Key indicator is household net adjusted disposable income. Brazilian households earn an aver age of 11,664USD after taxes, earning a grade of 0.1 and a ranking of 36th out of 36 OECD nations. • Jobs: Key indicator is employment rate. Brazil has an employment rate of 67% amongst 15-64 year olds, earning a grade of 5.8 and a ranking of 20th out of 36 OECD nations. Above Luxembourg and below Israel. • Community: Key indicator is quality of support network. 90% of Brazilians felt they had a high quality support network, receiving a grade of 7.2 and a ranking of 22nd out of 36 OECD nations. Above Austria, below the United Kingdom, and on par with Italy, Slovenia, Russia and the U.S.A. • Education: Key indicator is educational attainment. Defined as ‘percentage of people aged 25 to 64, having at least an upper-secondary (high-school) degree, latest available year’. Brazil has attainment rate of 44.9%, earning a grade of 1.8 and a ranking of 33rd out of 36 OECD nations. Above Portugal but below Spain. • Environment: Key indicator is air pollution. Brazil has 18.3 micrograms as average concentration of particulate matter in cities, receiving a grade of 5.8 a ranking of 21st out of 36 OECD nations. Above Switzerland and below Portugal. • Civic Engagement: Key indicator is voter turnout. Brazil has a high voter turnout at 78.9%, earning a grade 4.4 and a ranking of 9th out of 36 OECD nations. Above Norway and below France. • Health: Key indicator is life expectancy. With a life expectancy of 74 years, Brazil earns a grade of 4.6 and a ranking of 35th out of 36 OECD nations. Above Russia and below Mexico. • Life Satisfaction: Key indicator is life satisfaction. Brazil has a life satisfaction rating of 7.0, earning a grade of 8.1 and a ranking of 15th out of 36 OECD nations. Above Austria and below Germany. • Safety: key indicator is assault rate. In Brazil, 7.85% of people report having been assaulted in the previous year, earning a grade of 2.2 and a ranking of 35th out of 36 OECD nations. Above Mexico and below Chile. • Work-life Balance. Key indicator is employees working very long hours. 10.4% of Brazilian employees work very long hours, receiving a grade of 6.7 and a ranking of 25th out of 36 OECD nations. Above the United States and below Portugal.
PROSPERITY & WELL-BEING: DATA ANALYSIS (CONTINUED)
43
CRIME
HOMOCIDE RATE 26.5(RATE PER 1000,000
POPULATION)
THEFT RATE 114.3(RATE PER 1000,000
POPULATION)
ASSAULT RATE 330.1(RATE PER 1000,000
POPULATION)

COMMUNITY
LIFE SATISFACTION
WORK - LIFE BALANCE
EDUCATION
INCOME
SAFETY
2.2
4.3
7.2
4.3 & 4.41.85.8
5.8
0.1
4.6
Community
Housing &
Civic engagement
Education
Housin
g
Safe
ty
Health
Income
Environment
Jobs
KEYNOTE:The OECD do not provide data for Brazil in this format. For the purposes of this report and providing consistent data production these diagrams have been developed purely for visual purposes.
PROSPERITY & WELL-BEING: DATA ANALYSIS (CONTINUED)
44

GOVERNANCE & POLITICAL FRAMEWORKDespite having endured centuries of political unrest and discrimination, Brazil now enjoys the political rule of a democratic government - despite recent publicity, disruption and allegation of corruption.
At present, voting is compulsory for all Brazilian residents that are literate and between the ages of 18 and 69 years. Anyone that is 16, 17 or over 69 years of age, or is illiterate can choose to vote, but is not under obligation to do so. The government of Brazil is divided into the 1) executive branch, 2) legislative branch and 3) judicial branch. There are 27 states and more than 5 500 individual municipalities, each of which is run by a mayor.
The model below represents a diagramatic representation of Brazil’s political and governance framework.
45
Government of the Federal District 2015 - 2018
Democratised, Participatory, Ethical, Transparent and Innovative Government
Democratisation of rights and opportunities
Integrated and sustainable development of Brasilia and of the Integrated Development
Region of the Federal District (RIDE)
PRIN
CIP
LES
CITY
THEM
ES
CITIZEN
STRATEGIC GUIDELINES
Restore the role of the state as the authority responsible for land
occupation and driver of development.
Strengthen local potenti-alities, decentralise and diversify the economy.
Promote the role of in-novation, technology and social policy as enablers of development and job and income generation.
THEMES:
Environment
Planning
Metropolitan area
Infrastructure
Mobility
Science, technology and innovation
Sustainable development
THEM
ES
STRATEGIC GUIDELINES
Promote social justice.
Expand access and guarantee quality of
public services.
Promote quality of life and human development.
THEMES:
Health
Education
Culture
Security
Sectorial policies
Social assistance
Sport and leisure
CITIZENSHIP
Strengthen and expand citizen engagement and
social control
Expand planning and implementation
capacity
Strengthen and expand citizen engagement and
social control
Themes: Governance and management (planning, implementation, monitoring
and evaluation)

INFRASTRUCTURE INVESTMENT
PROJECTS
46
PLANNED INFRASTRUCTURE INVESTMENT OF $66 BILLION BY
2018
INFRASTRUCTURE INVESTMENT OF
1.5% OF GDP
ALL CITIZENS TO BE LIVING WITHIN 100
MILES OF AN AIRPORT
BIO-OCEANIC RAILWAY BRAZIL TO PERU
4.371 KM OF HIGHWAYS
EXPANSION OF EXISTING FREIGHT RAILWAYS AND THE BUILDING OF NEW ONES
OPEN 29 STATE-OWNED POER TERMINALS TO PRIVATE OPERATORS
GOVERNMENT EXPECTS 66.1 BILLION RISE IN INVESTMENTS IN HIGHWAYS, 86.4 BILLION IN RAILWAYS,
37.4 BILLION IN PORTS AND 8.5 BILLION IN AIRPORTS
TRANSPORT
WORLD RANKING OF
VEHICLES PER CAPITA.NUMBER 63
3BRAZILIAN CITIES IN
WORLD’S TOP 10 MOST
CONGESTED CITIES
NUMBER OF VEHICLES
PER 1000 PEOPLE.
263

SAU PAULO CASE STUDY
SAU PAULO
47

City population: 10 million. 1st in Brazil.Metropolitan population: 20 million. 1st in Brazil. Economy: Provides 62% of state GDP and 20% of national GDP.Age profile: 27% children, 66% working age, 7% seniors. Literacy: 97% ten or older.
The city Sao Paulo is Brazil’s largest city and the 12th largest in the world as of 2016 . Coupled with its greater metropolitan area, the population of Sao Paulo doubles, and is the world’s 10th largest metropolitan area as of 2014. Whilst the city’s population growth has slowed and fallen behind some of Brazil’s other metropolitan areas between 2000 and 2012, the city continues to remain Brazil’s economic powerhouse, with its GDP making up 20% of Brazil’s total GDP. As of 2012, the top employment sectors in Sao Paulo were public services at 20% of total employment, manufacturing at 19%, distribution & retail at 18% and business services at 15%.
Founded in the 16th century as a Portuguese colony, Sao Paulo became an official city in 1711. Its development and urban growth has been characterised by unsustainable urban sprawl, social segregation, insecurity, crime, poor work-life balances and clogged traffic arteries. Whilst ‘smart city’ technologies have the potential to mitigate many of Sao Paulo’s urban dilemmas, commentators have noted that ‘what matters first and foremost for the future of the metropolis is its spatial reorganization, lest these new technologies become accessories to the chaos’. The urban centre, for example, concentrates job for 17% of the city’s population has contains only 3% of its housing. It is encouraging then to find that Sao Paulo has taken steps to remedy its urban inefficiencies and has embraced the potential of smart technology.
Sao Paulo has set a carbon emissions reduction target of 20% below 2005 levels by 20202. The city also aims to generate 70% of its electricity from renewable energy sources by 2020. Whilst an ambitious target, around 61% of Sao Paulo’s emissions are currently generated from transport.
BACKGROUND: THE PLACE
At present, Sao Paulo has no direct policy document detailing a ‘smart city’ strategy or listing a number of specific planned policies, interventions or initiatives.
The majority of Sao Paulo’s future plans and policies that pertain to building a more sustainable city are contained within their ‘Guidelines for the Action Plan of the City of Sao Paulo for Mitigation and Adaptation to Climate Change’4. This comprehensive document details the city’s extensive efforts to tackle the important issue of sustainability. The policies proposed cover the following areas: transport, energy, construction, land use, solid waste, health, education and economic instruments. There is significant scope amongst these policies for ‘smart city’ solutions, and in some instances ‘smart city’ solutions have already been utilized.
The city has also enacted a new Master Plan5 for urban development as 2014. Intended to drive sustainable growth and urban densification, this plan contains scope to utilize ‘smart city’ technologies to achieve its objectives. Some of the measures imposed by the new plan involve mass transit corridors, building density, sidewalk widening, mixed-use development and reservations for affordable housing.
SMART CITY STRATEGY: ENERGY - MOBILITY / TRANSPORT - ICT
1 1 2 3 4 5 6
1 2 3 4 5 6
48

Sao Paulo has had notable success with smart city initiatives currently being employed in the city. Many of these initiatives take the form of what mayor Haddad labelled ‘intelligent interventions’, rather than expensive technological applications.
The city has won two awards in recent years6. In 2014 in successfully attained the 2014 Enterprising City/State MobiPrize for supporting user information and public participation platforms to advance sustainable transport solutions. The city also won a sustainable transport award in 2015 for enacting steps laid out in its ambitious plans to build a more sustainable transport system.
Building a more sustainable transport system has been Sao Paulo’s first step towards ‘smart city’ solutions to Sao Paulo’s numerous urban challenges. Under mayor Haddad, the city has vastly expanded its cycling and bus lane infrastructure. The city currently has over 400km of cycle lanes and aims to complete a 500km network7. The introduction of a BRT system and transit corridors in the city centre have worked in conjunction with the cycle lanes to help increase urban mobility and tackle congestion. Since 2014 daily car use by residents has dropped from 56% to 45% and journey times have been slashed.
Sao Paulo has also invested $22million in free Wi-Fi hot spots to cater to the poorer segments of Sao Paulo’s population8, in an effort to boost social inclusion. As of 2016 the city has 120 free Wi-Fi hotspots. The city has also begun to host open data initiatives such as hackathons and is exploring opportunities for public participation in planning decisions.
Sao Paulo is making excellent strides towards combating its primary urban issues. Its urban policy and sustainability plans have been well received and thus far, well implemented. The city could still benefit from additional policy documents exploring further ‘smart city’ initiatives and policies that could serve their overall objectives.
CHALLENGES AND SUCCESSES
1 2 3 4 5 6
49

Sao Paulo has not officially defined its vision of a smart city, or the kind of smart city Sao Paulo would like to become in the near future. Whilst there is a lack of official definitions, the concept of a smart city has been acknowledged by the city’s current Mayor Fernando Haddad, who has discussed his personal vision of Sao Paulo as a smart city and could be understood to reflect smarty city policy in the city. ‘In Haddad’s view’, writes Saxena (2015)3, ‘a smart city is not about handing over the city keys to big construction firms and hi-tech corporations. It’s about, what he calls, making intelligent interventions. “You can make a Smart City with low cost innovations. It’s unbelievable what you can do in a city with low cost. The important thing is to know what people want from the city,” says Haddad, emphasizing the word “inteligente” (intelligent) for smart.
Given the great scope and potential for such ‘low cost innovations’ to help with Sao Paulo’s urban challenges, it could benefit the city to make Mayor Haddad’s vision official city policy, and assist the city’s government and residents in coming to a better understanding of what comprises the essence of the smart city.
ESSENCE OF THE PLACE
CITY
POPULATION
C02 REDUCTION TARGET
SMART CITY OBJECTIVE
PUBLIC POLICY
NATIONAL PARTNER CITIES
METHODOLOGY FOR CHANGE
EXISTING SMART INITIATIVES
OPEN DATA POLICY
MAIN SUCCESSES
CASE STUDY FOCUS TO TAKE FOCUS
SAU PAULO
Urban: 11, 895, 893. Metro: 20, 935, 205
Global reduction target of 20% by 2020 from 2005 levels and 70% renewable by 2020 for Sao Paulo state.
Guidelines for the Action Plan of the City of Sao Paulo for Mitigation and Adaptation to Climate Change. Covers policies for fol-lowing areas: transport, energy, construction, land use, solid waste, health, education and economic instruments. Viva/University of Sao Paulo partnerships
Community and quality of life focus. Aim for technology to improve social cohesion. Enhancement of the digital infrastructure. Enhance economic competitiveness; and improve the provision of integrated public services. Quality of life focus. Integrating transport systems and empowering citizens, fostering innovation. Correcting spatial imbalances e.g. social segregation, insecurity, poor work-life balance through smart city solutions. Haddad ‘intelligent interventions’.
Government funding. Partnerships with citizens at ‘hackathons’ and partnerships with Universities. City/mayoral initiatives for transport integration.
Transport integration, bike lands and BRT system ‘Make way for the bus’. Free public wifi. Hackathons. VGI platform for citizen participation.
Open data and open government increasing priority for Sao Paulo government. Have established Sao Paulo Open Data API and working with Open Data Institute. MobiLab hackathons achieved transit solutions. Public participation via VGI (Volunteered Geographic Information) 2015 MobiPrize for empowering citizen innovation. 2015 Sustainable Transport Award
1 2 3 4 5 6
50

The primary stakeholder driving change in Sao Paulo has been the city’s mayor, Fernando Haddad. The city’s most recent successes installing bicycle lanes, BRT lanes and encouraging an uptake in these methods of transport have been the brainchild of Mayor Haddad. Mayor Haddad also provides the clearest vision Sao Paulo has to a ‘smart city’ when he stated his ambition to implement low cost ‘intelligent interventions’. Due to the nature of these interventions thus far, the public and society of Sau Paulo have been vital. Mayor Haddad’s plans would no doubt have been revered had citizens been unwilling to utilize the ‘intelligent’ forms of transport he advocates. The city is also increasingly moving towards a bottom-up or grassroots approach to smart cities through increased citizen participation. Inclusionary systems such as the Participatory Budget, Volunteered Geographic Information (VGI) and hackathons have all highlighted the potential for open data and citizen-powered smart city solutions in Sao Paulo9.
SMART GOVERNANCE IN THE PLACE: STAKEHOLDER MAPPING
PUBLICMayor of Sao Paulo,
Governor of Sao Paulo, Sao Paulo City Council, Sao Paulo State Government,
Brazilian Central Government , Union of
South American Nations. Prodam.
SOCIALENTREPRENEURS
Social Enterprise Work’s, West of England local
Enterprise Partnership, smart start-ups, open data users.
PRIVATESMEs, World Bank,
UNESCO, private financialinvestment in public
transport, Cities Alliance, UN-Habitat.
ACADEMIAUniversity of Sao Paulo
578 other higher education establishments in Sau Paulo
city and state.
CIVILSOCIETY
Sao Paulo citizens, Participatory Budget, NGOs:
Two Brothers Foundation, Calle, MonteAzul, OUAEI.
1 2 3 4 5 6
51
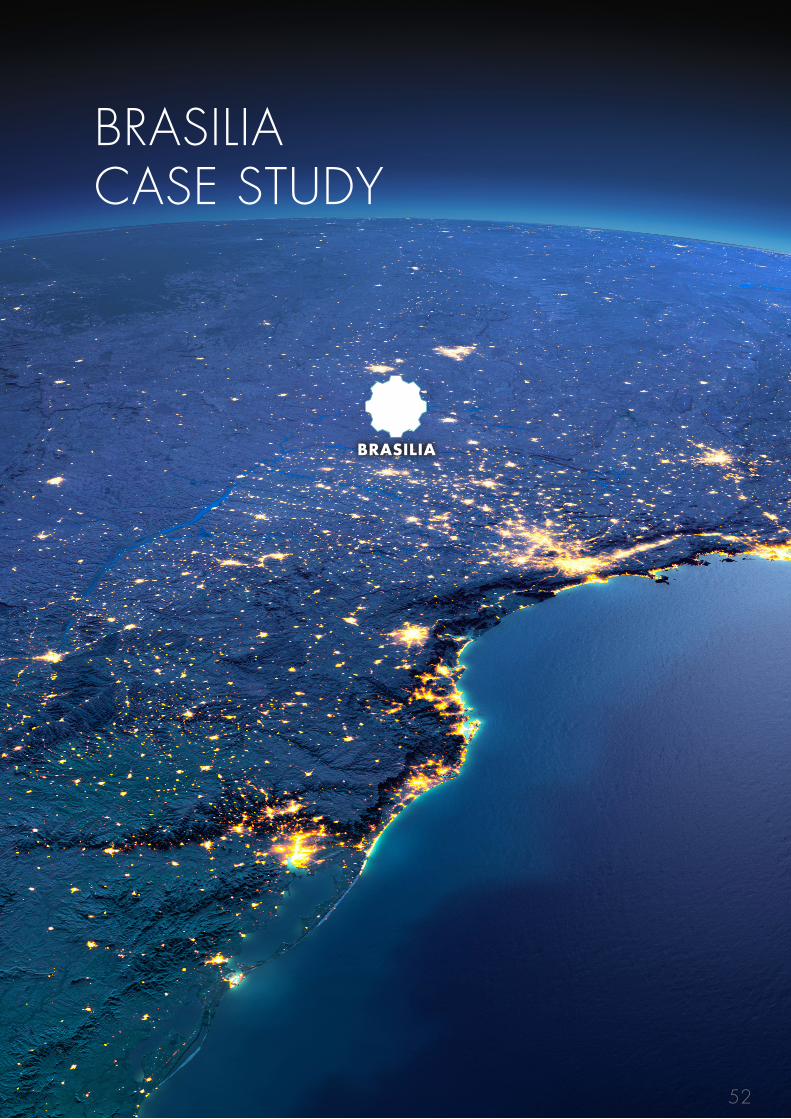
BRASILIA CASE STUDY
BRASILIA
52

City population: 2.48 million. Metropolitan Population: 3.8 million. 5th largest metro in Brazil. Economy: 5.8% of national GDP.Age profile: 31% children, higher than national average of 27%Literacy: 96% ten or older literate.
Brasilia is the capital city of Brazil and in a relatively young city compared to Belo Horizonte and Sao Paulo. Envisaged as a designed capital, the construction of the city was ordered in the 1950s as part of President Juscelino Kubitschek’s “fifty years of prosperity in five” plan1. The city was inaugurated in 1960 but has been the recipient of praise and scorn in equal measure. Designed as a locus of modernist architecture by architect Oscar Niemeyer, the city has been much criticized for the social problems and urban sprawl its urban design has inflicted upon its residents. As one commentator writes2‘ today, the city is quite correctly regarded as a colossally wrong turn in urban planning—but Brasília, paradoxically, contains some of the most graceful modernist government buildings ever’. Brasilia is doing well economically. Statistics3 highlight the cities impressive economic performance. Brasilia features the highest GDP per capita in Brazil at $36,175 per capita in 2012, three times the national average. The city’s total GDP is $139 billion, third after Sao Paulo and Rio de Janeiro, but its economic performance is ranked 1st amongst all Brazilian metros due to its aforementioned GDP per capita and its 3.1% growth since 2011, the highest growth in the nation. The top employment sectors in Brasilia are public services at 26%, business services at 20%, distribution & retail at 20% and all other services at 7%. Due to this focus on public services, Brasilia is the nation’s smallest exporter of goods.
BACKGROUND: THE PLACE
Brasilia does not appear to have a distinct policy approach towards exploring or implementing smart city initiatives. The few initiatives that do exist notably far less developed than those of Belo Horizonte and Sao Paulo. Unlike those cities, Brasilia also does not appear to possess any overall urban strategy, policies or spatial guidelines at present, which would help with identifying the cities current urban issues, set out measures to tackle them and assist with the creation of smart city solutions in order to achieve these objectives. As mentioned above, despite the city’s impressive economic performance, there are a number of issues inherited from Niemeyer’s sprawling vision of urban design and smart city solutions could assist in remedying them, even in the absence of an overall strategy.
SMART CITY STRATEGY: ENERGY - MOBILITY / TRANSPORT - ICT
1 1 2 3 4 5 6
1 2 3 4 5 6
53

Brasilia faces many of the same challenges as Belo Horizonte and Sao Paulo. Poverty, crime, sprawling urban design and poor urban mobility have led to socio-economic segregation and exacerbated social inclusion. Macedo and Ficher4 identify the following as the city’s hey inefficiencies: ‘An insufficient mass transportation system, segregation, and neglected public spaces—problems not unusual in metropolitan areas—are much amplified in Brasilia by misguided urban policies’. Another writer5 summaries Brasilia’s challenges when writing that the city’s urban design produced ‘Niemeyer’s greatest achievement, is also his most troubled creation. The structures in this artificial capital are impressive, yet few want to walk its barren streets. Politicians leave as soon as possible to return to grittier, but livelier, Brazilian cities … vision of skyscrapers surrounded by grassy spaces seems utterly ignorant of the street life that powers urban interactions. Cities are complicated organisms that thrive when they are messy and filled with mixed uses; the jumble enables people to experience the changing mix of urban marvels’
Amongst these challenges are:
1. The fragmented, dispersed, sprawling nature of the city. One study6 highlights spatial integration in the city to be well below international norms, making the city difficult to get around without extensive reliance on automobile transport. The study highlights the ‘low urban densities, dispersion of occupied areas with no man’s land in between, and a perverse relation between location of jobs and homes’ that define Brasilia’s urban structure. The study concludes that ‘urban infrastructure is underused, intense commuting between peripheral areas and the urban core is a daily nuisance, and urban configuration does not favour transit systems’. 2. Inefficient public transport systems that have damaged urban mobility and accessibility within the city. Recent surveys7 have revealed that ‘62% of Brasilia’s mass-transit users rated the city’s transportation system as “poor,” and a meager 0.3% categorized it as, “good”. An outdated fleet of mass-transit vehicles and limited station accessibility contribute to rider dissatisfaction’. 3. Booming population has also resulted in the growth of crime and congestion. The population of over 3 million is significantly higher than the 500,000 figure envisages when the city was first developed. Reports highlight8 ‘high levels of violence … the result of huge migration’, youth unemployment of around ‘40% in 2003’ and ‘cacophonous traffic jams’. Niemeyer himself reflected on the city’s issues, stating ‘the way Brasilia has evolved, it has problems. It should have stopped growing some time ago. Traffic is becoming more difficult, the number of inhabitants has surpassed the target, and limits are being exceeded’.
Despite the absence of official documentation aimed at tackling these challenges, there have been recent successes in combating the city’s poor urban transport. Recent initiatives9 have seen the city’s bus fleet upgraded to cleaner models that produce less emissions, and a new urban mobility law intends to install a light-rail system to improve urban mobility.
CHALLENGES AND SUCCESSES
1 2 3 4 5 6
54

No key stakeholders in the city have provided a clear vision of what a smart city would mean in the context of Brasilia. The lack of policy initiatives and smart city solutions also ensure no clues can be discerned by the city’s implementation of smarty city solutions in order to guide its development. As with the other Brazilian cities, Brasilia faces a myriad of urban issues including poverty, crime and urban sprawl. It would benefit from clarifying what kind of smart city Brasilia wishes to be in the near future, and provide a clear vision of Brasilia’s smart city ambitions to drive change.
ESSENCE OF THE PLACE
CITY
POPULATION
C02 REDUCTION TARGET
SMART CITY OBJECTIVE
PUBLIC POLICY
NATIONAL PARTNER CITIES
METHODOLOGY FOR CHANGE
EXISTING SMART INITIATIVES
OPEN DATA POLICY
MAIN SUCCESSES
CASE STUDY FOCUS TO TAKE FOCUS
BRASILIA
City: 2, 557, 000. Metro: 3, 599, 000
No specific target for city. Assumption of a target of 37% reduction by 2025 from 2005 levels, in line with Brazil’s nation target.
No clear smart city objectives specified but assumption made that objectives will correlate strongly to objectives in other cities e.g. improving urban mobility, integration, promoting social inclusion and integration.
No public policy documentation available.
CB27 Forum partner cities
Reshaping urban structure and improving public transport systems. Rectifying urban problems and urban design.
New Urban Mobility Law. Light Rail Transport system. Clean bus fleet deployment.
Deployment of clean bus fleet.
Smart city solutions to growing urban challenges in city.
1 2 3 4 5 6
55

From research conducted, it would appear no one key stakeholder is driving change in Brasilia. This is thanks, in part, to the city’s seemingly limited efforts to tackle its urban problems. What little change has been conducted has been conducted by the city’s government, indicating a preference for a top-down approach. The city offers no clear vision of what defines a smart city, nor an indication of the kind of city Brasilia wants to be ten or twenty years down the line. As the best performing economy in Brazil, the city could benefit from a clear and concise vision.
SMART GOVERNANCE IN THE PLACE: STAKEHOLDER MAPPING
PUBLICMayor of Brasilia, Governor of Federal District, Brasilia
City Council, Federal District State Government, Brazilian Central Government , Union of South American Nations.
SOCIALENTREPRENEURS
Social Enterprise Works, West of England local
Enterprise Partnership, smart start-ups, open data users.
PRIVATESMEs, World Bank,
UNESCO, EMBARQ.
ACADEMIAUniversity of BrasiliaCatholic University
of Brasilia.
CIVILSOCIETY
Brasilia citizens, Participatory Budget, NGOs: Two Brothers Foundation, Calle, MonteAzul, OUAEI , National Movement for the Right to Quality Public
Transport, National Association of Public
Transport.
1 2 3 4 5 6
56

BELO HORIZONTE CASE STUDY
BELO HORIZONTE
57

City population: 1.43 million. 6th largest city in Brazil.Metropolitan Population: 5.5 million. 3rd largest metro in Brazil. Economy: 45% of state GDP, 4% national GDP.Age profile: 27% children, 7% seniors, 66% working age.Literacy: 96% ten or older literate.
The city of Belo Horizonte (meaning beautiful horizon) is the 6th largest city in Brazil. When taking into account the metropolitan area, the city more than doubles in population size to 5.5 million, making it the 3rd largest metro in the country. The service sector drives Belo Horizonte’s economy. As of 2012, public services comprised 22% of the city’s employment, with distribution % retail at 18%, manufacturing 14% and business services 13%1.
The city faces many of the same issues that typify growing metropolises in the global south. Namely, unsustainable growth, poverty, crime, urban sprawl, socio-economic segregation and urban mobility. Urban mobility and a reliance on automobile transport have been named amongst the city’s most critical issues, with commentators’ noting that ‘public transport is expensive, distances too great, buses and metro trains overcrowded, and the use of individual vehicles encouraged’2.
Belo Horizonte has set a greenhouse gas emissions reduction target of 20% by 2030 as part of ‘The Municipal policy to Mitigate Climate Change Effects’ enacted in 20113. The city is currently in the envious position of generating the vast majority of its electricity from hydropower and has significant potential for solar power which is slowly being taken advantage of through private installations and government legislation that establishes a mandatory solar water heating bill for all new constructions4.
BACKGROUND: THE PLACE
Like other Brazilian cities, Belo Horizonte does not have any official documentation setting out the cities approach to ‘smart city’ policies. Like Sao Paulo, the uptake of ‘smart city’ solutions has been on an ad hoc basis and in service of broader sustainability or urban planning goals. The key document outlining the city’s sustainability driven and ‘smart city’ initiatives is ‘Belo Horizonte: Sustainable City5. This document was produced after the initiation of the aforementioned ‘Municipal Policy to Mitigate Climate Change Effects’ and provides a comprehensive overview of Belo Horizonte’s significant progress towards a more sustainable urban environment. This document contains excellent examples of traditional smart city initiatives.
SMART CITY STRATEGY: ENERGY - MOBILITY / TRANSPORT - ICT
1 2 3 4 5 6
1 2 3 4 5 6
58

Belo Horizonte was recently named the national solar energy capital of Brazil and, along with Sao Paulo, won an award for the steps taken towards improving urban mobility with a sustainable transport system6. The city was also chosen as the 2014 National Earth Hour Capital for its “integrated low carbon strategy, guided by a strong vision and built through concrete actions”7. This system comprises the city’s first BRT bus rapid transport system. Named “MOVE”, the BRT has proved hugely beneficial to the city and proved popular with its residents. The system is expected to have a total of 23 kilometres of dedicated bus lanes and serve 700,000 people each day8. The “MOVE” system has been the product of Belo Horizonte’s PlanMob-BH mobility plan, the first for a Brazilian city, and has reduced average travel time by an estimated 40%9.
Belo Horizonte has also introduced Latin America’s first ‘Tool for Rapid Assessment of City Energy’ (TRACE) system. The TRACE system is designed to identify energy efficiency opportunities by assessing six sectors: transportation, public lighting, buildings, power and heat, waste, and water and wastewater10.
The city’s ‘Belo Horizonte: Sustainable City’ plan details the numerous smart city and sustainable initiatives. Amongst there are:
• Operation Oxygen –initiative to control black smoke emissions from vehicles. • An extensive Air Quality Monitoring Centre. • A Biogass Centre. • Provisions for growth of green areas and green initiatives and competitions. • UNESCO Switch Project for urban water. • ‘Vila viva’ lively town program – aiming to promote urban renewal in towns, slums and favelas. • Structural program for dangerous areas – designed to remove families from dangerous environmental hazards.
CHALLENGES AND SUCCESSES
1 2 3 4 5 6
59
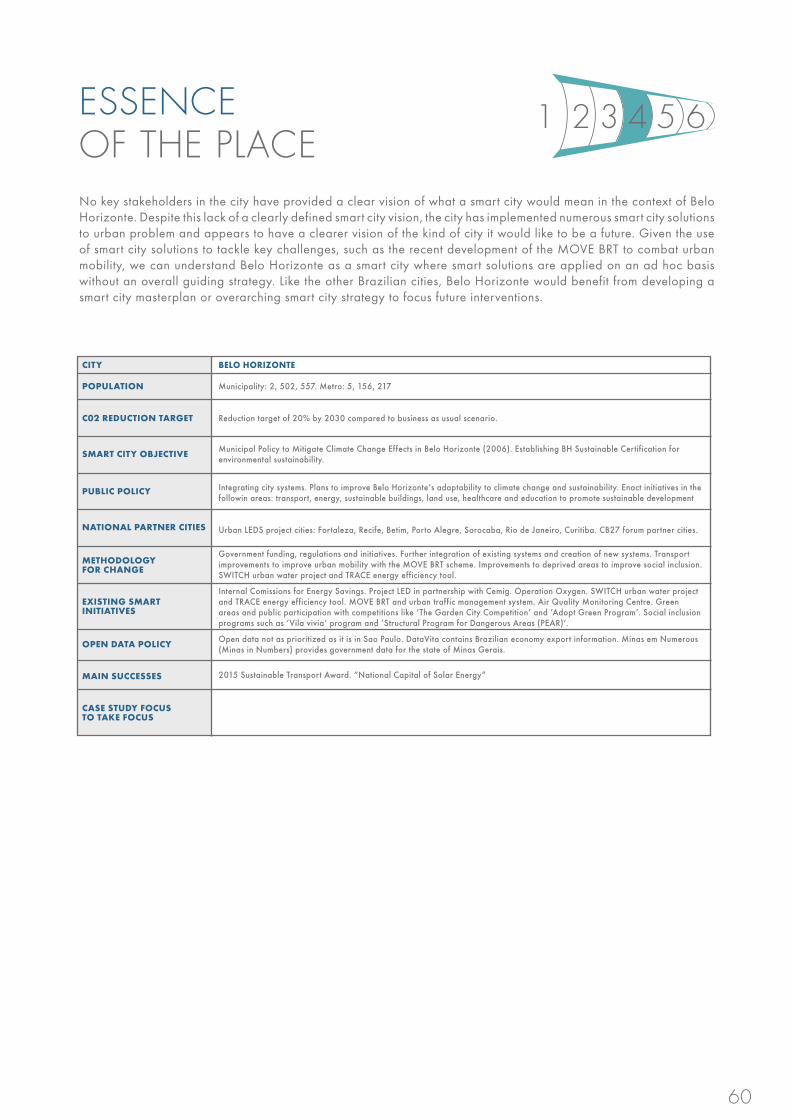
No key stakeholders in the city have provided a clear vision of what a smart city would mean in the context of Belo Horizonte. Despite this lack of a clearly defined smart city vision, the city has implemented numerous smart city solutions to urban problem and appears to have a clearer vision of the kind of city it would like to be a future. Given the use of smart city solutions to tackle key challenges, such as the recent development of the MOVE BRT to combat urban mobility, we can understand Belo Horizonte as a smart city where smart solutions are applied on an ad hoc basis without an overall guiding strategy. Like the other Brazilian cities, Belo Horizonte would benefit from developing a smart city masterplan or overarching smart city strategy to focus future interventions.
ESSENCE OF THE PLACE
CITY
POPULATION
C02 REDUCTION TARGET
SMART CITY OBJECTIVE
PUBLIC POLICY
NATIONAL PARTNER CITIES
METHODOLOGY FOR CHANGE
EXISTING SMART INITIATIVES
OPEN DATA POLICY
MAIN SUCCESSES
CASE STUDY FOCUS TO TAKE FOCUS
BELO HORIZONTE
Municipality: 2, 502, 557. Metro: 5, 156, 217
Reduction target of 20% by 2030 compared to business as usual scenario.
Municipal Policy to Mitigate Climate Change Effects in Belo Horizonte (2006). Establishing BH Sustainable Certification for environmental sustainability.
Integrating city systems. Plans to improve Belo Horizonte’s adaptability to climate change and sustainability. Enact initiatives in the followin areas: transport, energy, sustainable buildings, land use, healthcare and education to promote sustainable development
Urban LEDS project cities: Fortaleza, Recife, Betim, Porto Alegre, Sorocaba, Rio de Janeiro, Curitiba. CB27 forum partner cities.
Government funding, regulations and initiatives. Further integration of existing systems and creation of new systems. Transport improvements to improve urban mobility with the MOVE BRT scheme. Improvements to deprived areas to improve social inclusion. SWITCH urban water project and TRACE energy efficiency tool. Internal Comissions for Energy Savings. Project LED in partnership with Cemig. Operation Oxygen. SWITCH urban water project and TRACE energy efficiency tool. MOVE BRT and urban traffic management system. Air Quality Monitoring Centre. Green areas and public participation with competitions like ‘The Garden City Competition’ and ‘Adopt Green Program’. Social inclusion programs such as ‘Vila vivia’ program and ‘Structural Program for Dangerous Areas (PEAR)’.
Open data not as prioritized as it is in Sao Paulo. DataVita contains Brazilian economy export information. Minas em Numerous (Minas in Numbers) provides government data for the state of Minas Gerais.
2015 Sustainable Transport Award. “National Capital of Solar Energy”
1 2 3 4 5 6
60
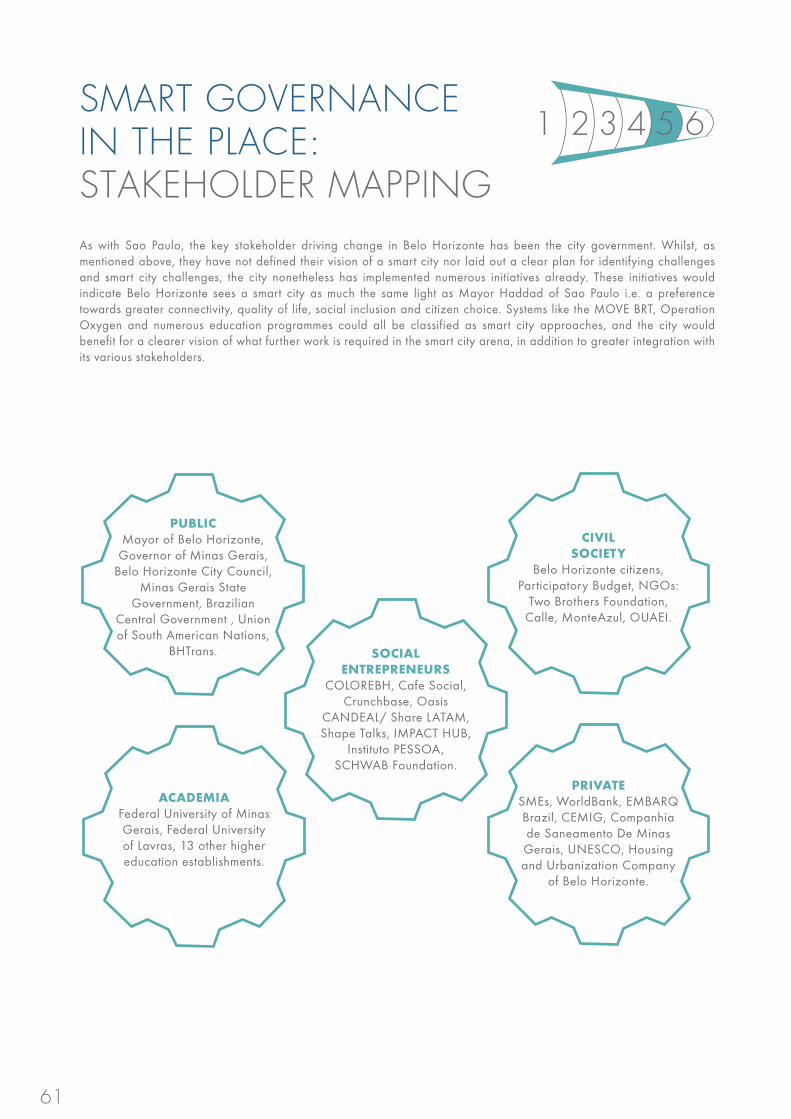
As with Sao Paulo, the key stakeholder driving change in Belo Horizonte has been the city government. Whilst, as mentioned above, they have not defined their vision of a smart city nor laid out a clear plan for identifying challenges and smart city challenges, the city nonetheless has implemented numerous initiatives already. These initiatives would indicate Belo Horizonte sees a smart city as much the same light as Mayor Haddad of Sao Paulo i.e. a preference towards greater connectivity, quality of life, social inclusion and citizen choice. Systems like the MOVE BRT, Operation Oxygen and numerous education programmes could all be classified as smart city approaches, and the city would benefit for a clearer vision of what further work is required in the smart city arena, in addition to greater integration with its various stakeholders.
SMART GOVERNANCE IN THE PLACE: STAKEHOLDER MAPPING
PUBLICMayor of Belo Horizonte,
Governor of Minas Gerais, Belo Horizonte City Council,
Minas Gerais State Government, Brazilian
Central Government , Union of South American Nations,
BHTrans. SOCIALENTREPRENEURS
COLOREBH, Cafe Social, Crunchbase, Oasis
CANDEAL/ Share LATAM, Shape Talks, IMPACT HUB,
Instituto PESSOA, SCHWAB Foundation.
PRIVATESMEs, WorldBank, EMBARQ Brazil, CEMIG, Companhia de Saneamento De Minas Gerais, UNESCO, Housing and Urbanization Company
of Belo Horizonte.
ACADEMIAFederal University of Minas Gerais, Federal University of Lavras, 13 other higher education establishments.
CIVILSOCIETY
Belo Horizonte citizens, Participatory Budget, NGOs:
Two Brothers Foundation, Calle, MonteAzul, OUAEI.
1 2 3 4 5 6
61

BRAZILIAN CITIES OF SÃO PAULO, BELO HORIZONTE AND BRASILIA
São Paulo, Belo Horizonte and Brasilia historically have been endorsed as a chief focus for urban renewal major projects. Lately these three Brazilian cities saw the preparation for 2014 World Cup as a great chance to achieve urban transformation and to manage socio-economic issues. Therefore, it has been used as a pretext to become a central focal point of urban transformation and city branding campaign where governance issues are managed with wider strategic planning at local and regional level. Most recently these Brazilian cities have incorporated a transformative phase of smartness in order to make city systems more resilient, efficient and equitable. They were unable to respond to its fast and unlimited impacts of urbanization such as in-formality and traffic congestion among other issues. In this context, major smart cities initiatives can be seen as a means of providing a set of opportunities intended for modernization and development of cities. Although those initiatives are increasingly expected to deliver a socio-economic and sustainable legacy, the effectiveness with which this is achieved remains highly contested. At that point, the evidence based on the experience of local communities affected by innovation and creative initia-tives associated with technology-led approaches is weak in terms of both the contemporary Brazilian context and in relation to North/South global comparisons. In order to address solutions to the physical and social deterioration in most urban deprived areas of São Paulo, Belo Horizonte and Brasilia, undertaking physical regeneration through the so-called smart city strategies has been widely perceived by authorities to be a driving force behind the attempts to restructure local urban economy. Therefore, creative and cultural-led policies with the help of ICT technologies also have also played an important role in neighbourhood regeneration of urban decay areas, mainly city centres.
Ernandy Luis Vasconcelos, PhDPost-doctoral Research Fellow at Federal University of Ceará
EXPERT CONTRAST
62

SMART INFRASTRUCTURE:OVERVIEWOECD data suggests that the level of investments required on an annual basis globally for all infrastructure projects between 2010 and 2030 will reach $1.8 trillion.
Global smart city market expected to increase by approx. 16-17 percent per year between 2014 and 2019.
“Smart infrastructure has the ability to influence and direct its own use, maintenance and support by responding intelligently to changes in its environment.”Cambridge Centre for Smart Infrastructure
63
SmartInfrastructure
BIM
Big/Open Data
SmartCities
Sensors
IoT GIS

Sustainable economic development as the “hardware” is a unique concept describing one of two key principles developed as part overall strategic approach to define the methodology which has been fully considered and thoroughly explored during the compilation of this policy report.
The hardware refers to the mechanics driving the necessary change globally, nationally and ever increasingly and importantly, at a city level. The hardware must provide a platform from which the “software” can be deployed, it is the physical world that we live in, the often criticised but never doubted necessity to have structure, regulation and motive.
Mostly formed of three consistent levels, these can be described in a very basic nature as –
• Political Environment• Public Policy and Law• Finance and Commercial Benefit
The necessity for infrastructure investment across the
world due to aging asset base’, population growth, rapid urbanisation and the need for developing more “liveable cities” is changing the way the global investment market are looking towards infra-structure for long term investment opportuni-ties. This approach to finance across pub-lic-private, partnerships has seen new and innovative finance and capital leverage models being developed.
However, despite the stage being set by the magnitude of need, the dynamics of political stability, openness and varying national environment remain a real concern and ultimately a barrier to expediting change.
Ever growing inequality is a real concern in many of our cites and across society as whole, as gated communities, issues with health and equality in educational attainment develop from disparity and lack of prosperity for many groups within modern societies. This aspect cannot be ignored as with the hardware of economic development we must deliver the change in our “software” strategies to meet the
ECONOMIC SUSTAINABILITY:(HARDWARE)
SOCIAL SUSTAINABILITY:(SOFTWARE)Smart urbanism is the consolidation and expansion of relatively novel ways of knowing and thinking about the city. It could be quite arbitory to distinguish between the social and technical systems. However, bearing in mind the extreme focus attained by data, algorithms, modelling and a combination of visual and media channels so far in the smartness policy docu-ments, socio-technical systems should be reframed. By considering a vast growing number of urban dashboards developed by local authorities, the open data platforms and the establishment of municipal operations centre integrating a variety of civic functions, services and infrastructures.
It is noteworthy that smartness has been understood entirely so far as efficient technical systems that had to reach a considerable economic profitable impact.
Economic sustainability that should be completed with the same sophisticated approach by including a social perspective. It is what in this report we have labelled ‘social sustainability’. Cities need to invest in who will be the user and what will be the cost/benefit analysis of the infrastructure.
As a summary, at the outset of the twenty-first century, smart urbanism adds new layers of complexity to these developments in infrastructures. It is why, following a metaphor, the renowned hardware should be completed by a contextually embedded software. Hence, knowing and seeing in its uniqueness each city case is no longer just about lighting and electrification, but about integrating this hardware and the software used for offering a smart infrastructure to the smart citizens.
64

SMART INFRASTRUCTURE:CORE PRINCIPLES
ENCOURAGING SMARTNESS – Structuring sustainable economic plans to minimise wealth disparity and not foster ever developing gated communities and division in health are addressed through the delivery of a universal access policy to ensure services are available for all demographic groups within the our communities. Our societies awareness of fundamental smart opportunities will combine with economic drivers to deliver the urban setting necessary to promote prosperity for all.
SMART INFRASTRUCTURE
PROSPERITY & WELL-BEING: DATA ANALYSIS
SMART GOVERNANCE IN THE PLACE: STAKEHOLDER MAPPING
ESSENCE OF THE PLACE
CHALLENGES & SUCCESSES
SMART CITY STRATEGY: ENERGY - MOBILITY / TRANSPORT - ICT
BACKGROUND: THE PLACE
12
3
4
5
67
SMARTNESS
PROSPERITYFOSTERING PROSPERITY - A true combined top down and bottom up approach is not only adopted but practical and delivered as a platform for all to engage, and be engaged at a viable and appropriate level. Timely influence of strategic public policy that will deliver the change needed in our urban environment as the community and infrastructure grow and become smarter together using technology to enhance and improve, health, wealth and well being.
METHODOLOGY - Following the case study analysis, demonstrated in the funnel diagram below, the objectives of Prosperity and its relationship with Smartness can be seen to be borne out as key functions of developing Smart Infrastructure. This concept looks at both the “Software” and “Hardware” aspects of developing the Smartness for Prosperity model.
65

Transport - Mobility – adopting key principles in transport orientated design and a focus of delivering universal access, will look to core principles such as car use management, quality public transport serving densely populated urban areas, properly considered and implemented integrated active transport to promote health and well-being in conjunction with real public spaces that are at the heart of well-constructed mixed use environments.
Energy – Developing renewable energy technologies and that of their distribution networks via the implementation of smart grid, metering, automation technology and making best use of the internet of energy concept, that allow utilities companies to predict fluctuations in energy usage, efficiently integrate current inconsistent renewable energy sources to deliver long term energy solutions that are reliable and viable alternatives.
Resilience – Further development of the collaboration of expertise and key technologies to inform the necessary planning to mitigate and recover from disaster events due to changes in climate. GIS / LIDDAR have been successfully used alongside academia with expertise in pre-dictive climatology to understand the vulnerability of core assets geographically allowing a focused approach to infrastructure adaptation and contingency planning.
Health – Smart city technology digital networks, the IoT and the rapid development in communication, smart mobile wearable technologies will play a huge part in delivering advances in healthcare services for communities across the world and in particular in deprived urban areas. The development of these technologies and increasing capability in connectivity will mean services can become more streamlined and offer remote monitoring of patients. The combination of all of these components regarding the interdependence of the stakeholder, has the potential to improve the quality, efficiency and frequency of an innovation the health care system .
Digital – All of the key focus areas for development, delivery of smart city strategies and smart infrastructure will rely heavily on established and emerging technologies. Nearly all nations states, regional clusters and cities are well down the road of understanding the importance and potential this offers – but what to do with it and when is enough? Understanding the difference between smartness, the role of the smart city and the need for “Unplugging” ourselves from the digital world, will undoubtedly pose the biggest challenge for our hyper connected societies.
SMART INFRASTRUCTURE:CITY FOCUS
66

Ian Jones, Solutions Architect (Smart Cities) ICT ServicesStrategy Architecture and Commissioning Leeds Council
Q1. What would say have been your greatest challenges on the road to defining what it means for Leeds to achieve its specific smart city aims and objectives?
The greatest challenges are around ensuring that city stakeholders are connected and agreed on the overall city outcomes and objectives. It is important that the need for new approaches to service delivery is recognised and agreed. This requires innovation and a Co-production approach blending skills and capability across the city. Reaching this point is difficult but is being achieved. Lack of funding is another significant challenge but working to achieve outcomes for the City to deliver clear outcomes rather than for organisational silos ensures available funding is targeted appropriately.
A PLACE BASED APPROACH TO DELIVERING BETTER OUTCOMES AND INTEGRATED PUBLIC SERVICES
Rather than being the main driver for outcomes delivery, Leeds City Council sees its role as providing leadership and facilitation in conjunction with City partners. To this end there are several city wide cross-cutting boards and partnerships designed to encourage facilitate joint working
Q2. The nature of city strategies must take on a city by city approach, with the essence of “the place” being at the heart of future cities, what would you say has been the most successful strategy for Leeds to understand its own unique dynamics and demographic challenges?
We have adopted a whole city view recognising that there are several layers to a future cities strategy. This includes City ‘ambitions’ where we identify key outcomes and under-pinning strengths. In our case we know that pressures on health and social care are growing with reducing funding affecting these outcomes, none the less our ambition is to be the best City for Health and Wellbeing. This is built on our key position as a leader in health in particular Digital Health.
OUR AGREED STRATEGY AND FOCUS
The foundation layer encompasses the development of core Digital Infrastructure. This includes improving broadband provision (supported by the DCMS Super Connected Cities Programme), installing public spaces Free Public Wi-Fi via concession agreements and Free Wi-Fi in all public buildings.
A robust digital infrastructure helps to ensure that Leeds is an attractive proposition with regard to inward investment, and to enable existing enterprise and communities to flourish
A regional Public Sector Network (PSN) is in place and is being developed to support shared services across public sector organisations.
Digital Skills development (Closing the digital divide) is a key objective and digital inclusion and skills development is support by a range of agencies including the Tinder Foundation, UK On-line Centres and Leeds Libraries Service. In addition local neighbourhood digital inclusion schemes are also supported.
It is also recognised that a more digitally capable population will enable businesses to offer cheaper digital access to their services which in turn provides economic savings. Commerce and industry can also increase productivity and expand their reach to new markets.
The ageing population is driving health innovation as costs and demand increase. The differentiation layer is focussing on Health and Well Being for the ageing population particularly those with multiple long term conditions including diabetes, dementia and social isolation.
Q3. What does the road map for Leeds look like in terms of local and national policy in support of delivering successful smart city projects?
We are of the view that Open approaches based on standards are essential in the development of Smart Cities. We have participated in the development BSI Smart City PAS – Including PAS 181, 182, 183 and the new PAS 184. Our Smart City strategy is centred on Health and Wellbeing – specifically Housing \ Assisted Living, Transport, Air quality and Citizen Driven Health utilising IoT approaches. The central feature of this approach is an open platform \ data hub (Hyper/cat enabled) which will provide access to data for citizens, 3rd sector and developers building an eco-system of innovation.
INTERVIEWS
Q2. The nature of city strategies must take on a city by city approach, with the essence of "the place" being at the heart of future cities, what would you say has been the most successful strategy for Leeds to understand its own unique dynamics and demographic challenges? We have adopted a whole city view recognising that there are several layers to a future cities strategy. This includes City ‘ambitions’ where we identify key outcomes and underpinning strengths. In our case we know that pressures on health and social care are growing with reducing funding affecting these outcomes, none the less our ambition is to be the best City for Health and Wellbeing. This is built on our key position as a leader in health in particular Digital Health.
The foundation layer encompasses the development of core Digital Infrastructure. This includes improving broadband provision (supported by the DCMS Super Connected Cities Programme), installing public spaces Free Public Wi-Fi via concession agreements and Free Wi-Fi in all public buildings. A robust digital infrastructure helps to ensure that Leeds is an attractive proposition with regard to inward investment, and to enable existing enterprise and communities to flourish A regional Public Sector Network (PSN) is in place and is being developed to support shared services across public sector organisations. Digital Skills development (Closing the digital divide) is a key objective and digital inclusion and skills development is support by a range of agencies including the Tinder Foundation, UK On-line Centres and Leeds Libraries Service. In addition local neighbourhood digital inclusion schemes are also supported. It is also recognised that a more digitally capable population will enable businesses to offer cheaper digital access to their services which in turn provides economic savings. Commerce and industry can also increase productivity and expand their reach to new markets, The ageing population is driving health innovation as costs and demand increase. The differentiation layer is focussing on Health and Well Being for the ageing population
67
Foundation Layer: For Leeds to be a sustainable cityA solid base of infrastructure and skills
Applied open digital principles in delivery
Differentiation Layer: Building on the foundationsBest city for health and wellbeing
Best city for data
Innovation LayerProven innovations that can be replicated anywhere
Voluntary Sector
Private Sector
IntegratedLocalPublic
Services
Citizens
LCCLeadership
Facilitation &Commissioning

CONCLUSIONS
By trying to be very careful with the conclusions of this data, a fair balance between social and economic sustainability should be based on the following drivers:
• Despite the fact that the Brazilian national average for education depicts rather a low indicator (1.8), regarding civic engagement, Brazilian cities show similar level as Manchester and Leeds, for instance. However, due to the intensive city strategy implemented (see Bristol case study), Bristol ranks amongst the leading cities (5.8). By contrast, other UK cities achievements are less (3.4) though often supported by key policy to improve.• Once again, due to the national average in Brazil, Education represent a very low position for Brazilian cities (1.8). Albeit we assume the case of Bello Horizonte could show a better position in the educational ranking due to the investment in the HEIs. On the other hand, British cities oscile slightly on education but mostly sharing the same average.• Employment shows a leadership position for Bristol (8.2.) as a combination of education, civic engagement and income.• In the case of the environmental well-being, there is work to be done and evidence shows that key strategies have been employed and projects planned to improve the position in postindustrial cities in the UK. case that shows
the. much work has been done in implementing these strate-gies in energy usage through smart city iniatives to improve this position.• Regardless the very low data about income provided for Brazil, which shows a clear social inequality, once again, Bristol appears as the best-in-class as a consequence of the innovative economic clustering that the city is building.• As long as we focus our attention on the comparison health-environment, just the opposite pattern is shown between Belfast and Bristol. Whereas Belfast present the best environmental context (8.3), the levels of health drop off (6.4). Just the contrary it occurs in Bristol (6.1. and 8.6). On the other hand, Brazilian average (4.6) is under the British average.• Not surprisingly, the Brazilian safety average ranks very low. By contrast, the safest cities in the UK are Bristol (once again being the leader of the well-being with 9.7) and Newcastle (9.2), in this order.• Finally, social sustainability should account for affordable housing policy. Brazilian cases present a broad picture with a worse average than the rest of the British cases. Being Bristol and Newcastle (both 7) the best positioned cases reviewed during this research exercise and through the case study analysis.
This assumption brings us to compare some dimensions that this report has presented before when prosperity was in the spotlight via OECD data .
The table below provides a qualitative assessment of the cities in the context of the case study research information, when measuring performance of the smartness and consequences in the prosperity model - social software and economic hardware. The metrics are based on cummualtive assessments found through case study evaluation when looking at policy intention versus OECD indicators.
This section will conclude by recommending a deeper analysis of this data in order to design and implement socially-driven smart policy. Instead of considering macro interpretations, micro interventions would be needed to maximise the merge of the hardware and the software of each city. A combination that should pay attention to the localised factors in a cause-effect explanation. Only this way, can social and economic sustainability meet for requirements of smarter infrastructures.
68
POLITICAL ENVIRONMENT
PUBLIC POLICY AND LAW
FINANCE AND COMMERCIAL BENEFIT
NEWCASTLE
Medium
High
Medium
Medium
LEEDS
Medium
High
Medium
Medium
MANCHESTER
High
High
Medium
High
BRISTOL
High
Medium
High
Medium
BELFAST
High
Medium
Medium
Medium
SAU PAULO
High
Low
Medium
Low
BRASILIA
High
Low
High
High
BELO HORIZONTE
Medium
Low
Medium
Medium
CITY CASE
Belfast
Bristol
Leeds
Manchester
Newcastle
Belo Horizonte
Brasilia
Sao Paulo
COUNTRY
UK
Brazil2
CIVIC ENGAGEMENT
3.4
5.8
4.5
4.4
4.1
4.4
4.4
4.4
EDUCATION
7.3
8.3
7.8
8
8
1.8
1.8
1.8
JOBS
6.8
8.2
6.5
6.7
5.7
5.8
5.8
5.8
ENVIRONMENT
8.3
6.1
6.6
5.8
7.8
5.8
5.8
5.8
INCOME
4.7
5.6
4.6
4.9
4.5
0.1
0.1
0.1
HEALTH
6.4
8.6
6.6
5.9
6
4.6
4.6
4.6
SAFETY
8.9
9.7
8.9
8.9
9.2
2.2
2.2
2.2
HOUSING
5.7
7
6.6
6.9
7
4.3
4.3
4.3

TAXONOMY
BRI
MCR
LDSBFS
NWC
BH
BRS
SP
10,00
40,00
50,00
30,00
20,00
1 128765432 11109
Smartness for Prosperity: UK & Brasil
Taxonomy
@icalzada
Tourles: IBGE, IPEA DATA &OECD.
GDP per Capita($ USD) Hardware Smartness
Population (Mill) Software Prosperity
Acronym British CitiesHardware " Prosperity"GDP per Capita USD $
Software " Smartness"Population Metro
MCR Manchester 35,029 $ 2,553,379NWC Newcastle 29,978 $ 1,650,000LDS Leeds 33,355 $ 1,777,934BRI Bristol 44,900 $ 1,006,600BLF Belfast 37,659 $ 579,236
Acronym Brazillian CitiesHardware " Prosperity"GDP per Capita USD $
Software " Smartness"Population Metro
SP Sau Paulo 23,704 $ 11,895,893BH Belo Horizonte 10,820 $ 2,491,109BRS Brasilia 36,175 $ 2,852,372
Sources: IBGE, IPEA DATA & OECD
69

ROADMAPThe road map has been developed to inform policy makers in Brazil working in this field, the key intention being to highlight potential areas for further collaboration with the prosperity fund and other key influencers working in the arena of Brazilian Smart Infrastructure Policy and Strategic development.
FOCUS AREAS
Central Goverment Public Policy
Federal Governance
InfrastructureFinancing
City Strategies
SmartInfrastructure
BARRIERS
1)Political Environment 2)Regional Competition and Instability 3)Antitrust Prevalence
1)Multi tiered governmental layering 2)Indifferent regulation across federal authorities 3)Uncertainty in central government
1)Ecomonic downturn, legacy debt 2)Unstable finance markets3)Hugely Imbalanced GDP across city regions
1)Lack of reliable knowledge of environment 2)Predominantly top down planning strategies 3)Unclear strategies and city identities
1)Ageing Infrastructure 2)Established Built Environment 3)Rapid Urbanisation/Urban Sprawl
INITIATIVES
1)Regulation fixity2)Simplified Taxation(s)3)Reform of the open Government Partnership
1)Devolved fiscal measures2)Regional collaboration3)Consistent Structured framework approach
1)Establish Dedicated Infrastructure Investment funds 2)Public Private Fund Partnership Mechanisms - PPP (P3 and P4) 3)Benchmark capital leveraging models - UK/EU/USA
1)Open / Big data2)SME acceleration/Technology development3)Citizen centred design approach - bottoms up and top down
1)Focus on Transport Orientated Development2)Focus on IoT, Internet of energy and embedded sensory 3)Improve population density
OUTPUT
1)Attracting external investment2)Appeal to trends in global investment markets favouring investment in infrastructure and asset development
1)Cultural-led policy development2)Data collection and intensive built environment surveying 3)City approach - Smart City Strategies
1)Shift from short to Long term investment in infrastructure 2)Economic Stimulus3)Innovative finance - Real estate Infrastructure Trusts (REITs)
1)Increased urban regeneration/land use 2)Availability of accurate and reliable performance data 3)Increased civic participation
1)Increase infrastructure capacity, capability and performance 2)Energy efficiency/ security 3)Improved City connectivity
BENEFITS
1)Increasing Long term investment opportunities 2)Attracting talent and expertise3)Regain confidence
1)Address growing inequality/ prevent gated communities 2)Disaster mitigation/ recovery planning 3)Talent attraction
1)Greater outurn certainty on investment 2)Accurate timeline preparation 3)Certainty in project delivery
1)Increased Social Capital2)Understanding core assets and their vulnerability 3)Improve Health and Being
1)Improving mobility and active Car Use Management 2)Meeting Carbon reduction commitments 3)Better public space and community environment
Public Policy, Finance and Smart InfrastructureThe awareness of efficient infrastructure as a key aspect to the overall economy and functionality of cities is growing. This topic is also high on the agenda of politicians, investment bankers, advisors, investment managers and private equity funds. Participation from the private sector in the UK (as in other OECD and developing countries) is through the adoption of public-private partnership initiatives, a financing model which has been maturing across variety of infrastructure sectors including, roads, bridges, schools, schools, prisons and utilities. The UK Government has been monitoring and develop new models to ensure sufficient affordable financing is made readily available for projects. This trending political strategy is a result of the constrained financing markets, leading to govern-ments investigating mechanisms to stimulate market interest and make the infrastructure asset class more attractive. The benefit of this approach is that a relatively small investment by authorities and governmental bodies (i.e through co-funding, taxation and guarantees) can be leveraged into larger finance funds, as private sector interest is increased by a multiple of governmental investment.
Infrastructure Finance Unit - The UK government set up the IFU to provide dedicated funding and act as a co-lender on major PPP projects in instances where the private sector was not sufficient. Despite a relatively low number of projects being funded by IFU, the program has been successful in increasing market confidence, resulting in additional private finance and removing the need for the IFU to invest. US TIFIA Loans - Transportation Infrastructure Finance and Innovation, approximate value equivalent to US Treasury bonds, and assessed as providing circa 30% of the total investment costs of transport projects. This program is generally accredited with delivering between $500m and $1bn of loans annually all of which are dedicated to the development of transport infrastructure.
EIB Debt Funding - The European Investment Bank aims to provide up to 50% of all the funding required for key infrastructure projects developed within the European Union. This offers a significantly reduced cost of capital and has reduced the financing requirement from commercial banks. As a result of its multilateral institution status, it is able to provide a significantly lower cost of funds.
Subordinated Debt - European Governments are looking at providing subordinated debt to projects in order to improve the credit quality of the senior debt, thus increasing supply of commercial funds and also reducing the costs. The Project Bond 2020 plan intends to esnure 15% of the total funding as subordinated debt, and as a result the remaining debt is more attractive to institutional investors. The same strategy is used in the Private sector involving subordinated debt funds for example the Hadrian’s Wall Capital fund.
Whilst these innovative public policy initiatives are providing a platform for economic stimulus in the UK/Across the EU and in the USA the debate must still remain fixed on transferability and application in a Brazilian context, especially where political instability, cultural differences and the value on well-being and community are placed as more important than wealth generation and the “mechanical” policy development approach in the UK and other global north countries.Despite Brazil’s focus over the past ten years on improving its infrastructure assets, as it can be seen from the general overview sec-tion, progress so far has not addressed rapid urbanisation or delivered universal access and effecient mobility - more must be done. The key to success is through policy reform and to do so consideration must be given to comparative fiscal policy, regional context and the growing devolved administration debate to examine how fiscall responsibility laws with the introduction of incentives can ac-comodate subnational interests without compromise to national programme of fiscall adjustment and stability. Jorge P. Gordin (2016).
70

REFERENCESNEWCASTLE1 Newcastle City Council (2012) Final Report. Available at: https://con-nect.innovateuk.org/documents/3130726/3794125/Feasibility+Study+-+Newcastle+City+Council.pdf/f52fb022-ca50-40d3-9fa8-cc757253ff34 (Accessed: April 2016)2 Newcastle Partnership (2010) Citywide Climate Change Strategy & Action Plan 2010-2020. Available at: https://www.newcastle.gov.uk/wwwfileroot/legacy/ns/environment/DRAFTforPublicConsultationClimateChangeStrateg-yActionPlanJune2010.pdf (Accessed: April 2016)3 Newcastle City Council (2010) Core Strategy and Urban Core Plan. Avail-able at: https://www.google.co.uk/#safe=off&q=newcastle+core+strategy+and+urban+core+plan (Accessed: April 2016)4 Newcastle City Council (2012) Newcastle City Deal. Available at: https://www.gov.uk/government/uploads/system/uploads/attachment_data/file/221015/Newcastle-City-Deal-Paper.pdf (Accessed: April 2016)5 Innovate UK (2013) Future Cities Demonstrator Competition. Available at: https://connect.innovateuk.org/documents/3130726/6091879/Future+Cities+Feasibility+Studies+-+Interim+Report.pdf/4ab345d6-105c-4a88-867f-12e7b976780b (Accessed: April 2016)6 Newcastle University (2015) Newcastle as a Future ‘Smart City’. Available at: http://www.ncl.ac.uk/sciencecentral/smart-city/ (Accessed: April 2016)7 Neca (2016) North East Combined Authority. Available at: http://www.transportnortheast.com/public/map/map.htm (Accessed: April 2016)8 The North East (2016) Smart Ticketing Initiative. Available at: https://www.google.co.uk/#safe=off&q=north+east+smart+ticketing (Accessed: April 2016)9 Newcastle University (2015) Decision Theatre. Available at: https://www.google.co.uk/#safe=off&q=newcastle+decision+theatre (Accessed: April 2016)10 Newcastle City Council (2014) Open Data Policy. Available at: https://www.newcastle.gov.uk/your-council-and-democracy/open-data-and-access-information/open-data/open-data-policy (Accessed: April 2016)1 Sustainable University, Newcastle, 2014 - https://sunewsinfo.wordpress.com/2014/01/16/newcastle-universitys-50-million-living-lab-project-to-dev-elop-the-future-smart-city/2 Sustainable University, Newcastle, 2014 - https://sunewsinfo.wordpress.com/2014/01/16/newcastle-universitys-50-million-living-lab-project-to-dev-elop-the-future-smart-city/3 Newcastle City Deal, July 2012, https://www.gov.uk/government/uploads/system/uploads/attachment_data/file/221015/Newcastle-City-Deal-Paper.pdf
MANCHESTER2 2014 estimation3 http://www.lboro.ac.uk/gawc/gawcworlds.html4 Innovate UK (2012) Feasibility Study. Available at: https://connect.innovateuk.org/documents/3130726/3794125/Feasibility+Study+-+Manchester+City+Council.pdf/f1a7d5eb-6651-471a-b9f8-7f9e0f3ec4fa (Accessed: April 2016)5 Cathy Bryan (1996) Manchester: Democratic Implications of an Economic Initiative?, Javnost - The Public, 3:1, 103-116 6 http://mappinggm.org.uk7 Gwyndaf Williams (1995) Manchester city pride — a focus for the future?, Local Economy, 10:2, 124-132 8 Mike Emmerich & Baron Frankal (2009) Building the Manchester of the Future, Local Economy, 24:1, 93-97 9 Tine Buffel PhD , Paul McGarry MA , Chris Phillipson PhD , Liesbeth De Donder PhD , Sarah Dury MA , Nico De Witte PhD , An-Sofie Smetcoren MA & Dominique Verté PhD (2014) Developing Age-Friendly Cities: Case Studies From Brussels and Manchester and Implications for Policy and Practice, Jour-nal of Aging & Social Policy, 26:1-2, 52-72 10 Jost Wilker, Karsten Rusche & Christine Rymsa-Fitschen (2016): Improving Participation in Green Infrastructure Planning, Planning Practice & Research 11 http://manchestersciencecity.com12 Sally Gee & Elvira Uyarra (2013) A role for public procurement in system innovation: the transformation of the Greater Manchester (UK) waste system, Technology Analysis & Strategic Management, 25:10, 1175-1188 13 http://www.corridormanchester.com Image credits:1.GoogleMaps3.http://files.datapress.io/leeds/wp-uploads/20141002224436/Certificate.png4.http://www.climatesmartcities.org/sites/all/themes/lcf/images/report_cov-er.png5.https://nationalhackthegovernment.wordpress.com/nhtg-leeds/6.http://littlekelham.com/uploads/crop_im-age/368/368/20131121132103_phone_app.jpg?x=3.181793212890625&y=-9.1761474609375&w=363&o=368?14 https://www.gov.uk/government/news/manchester-wins-10m-prize-to-
become-world-leader-in-smart-city-technology1 Smart Cities, Centre for Cities, 2014 Report, http://www.centreforcities.org/wp-content/uploads/2014/08/14-05-29-Smart-Cities-briefing.pdf2 http://manchestersciencecity.com3 Sally Gee & Elvira Uyarra (2013) A role for public procurement in system innovation: the transformation of the Greater Manchester (UK) waste system, Technology Analysis & Strategic Management, 25:10, 1175-1188 4 http://www.corridormanchester.com5 https://www.gov.uk/government/news/manchester-wins-10m-prize-to-become-world-leader-in-smart-city-technology6 Smart Cities, Centre for Cities, 2014 Report, http://www.centreforcities.org/wp-content/uploads/2014/08/14-05-29-Smart-Cities-briefing.pdf7 Ageing in Cities, by OECD, 2015, https://books.google.co.uk/books?id=ltDECAAAQBAJ&pg=PA172&lpg=PA172&dq=city+of+manchester+challenges&source=bl&ots=khaVmlnOxr&sig=WV3ZxiSBwikMOhSzbyM8iPAZxcg&hl=en&sa=X&ved=0ahUKEwiuwJGIosDMAhVKBMAKHQRsCrc4FBDoAQgmMAI#v=onepage&q=city%20of%20manchester%20challenges&f=false
LEEDS2 2014 estimation3 http://www.lboro.ac.uk/gawc/gawcworlds.html4 Leeds Data Mill, Leeds: Data City, Open Data Manifesto, 20155 Dylan Roberts, Smart Cities: Delivering a sustainable City in the Digital Age Report, 2014 Leeds City Council6 http://www.pressat.co.uk/releases/cisco-drives-smart-city-agenda-in-leeds-c8e83df3d67dd0da8f9240075b319dad/7 Straughan T (2013), Leeds Innovation Health Hub, Leaders for Leeds update, PowerPoint presentation, available online 8 http://www.climatesmartcities.org9 Jenni Viitanen, Paul Connell & Martine Tommis (2015) Creating Smart Neighborhoods: Insights from Two Low-Carbon Communities in Sheffield and Leeds, United Kingdom, Journal of Urban Technology, 22:2, 19-41 10 E. Barrett , M. Heycock , D. Hick & E. Judge (2003) The case of the Leeds Transport Strategy, Policy Studies, 24:4, 227-242 Image credits:1.GoogleMaps3.http://files.datapress.io/leeds/wp-uploads/20141002224436/Certificate.png4.http://www.climatesmartcities.org/sites/all/themes/lcf/images/report_cov-er.png5.https://nationalhackthegovernment.wordpress.com/nhtg-leeds/6.http://littlekelham.com/uploads/crop_im-age/368/368/20131121132103_phone_app.jpg?x=3.181793212890625&y=-9.1761474609375&w=363&o=368?1 Smart Cities: Delivering a sustainable City in the Digital Age, http://de-mocracy.leeds.gov.uk/documents/s124710/Smart%20Cities%20Report%20Appendix%20041214.pdf 2 E. Barrett , M. Heycock , D. Hick & E. Judge (2003) The case of the Leeds Transport Strategy, Policy Studies, 24:4, 227-242 3 Smart Cities: Delivering a sustainable City in the Digital Age, http://de-mocracy.leeds.gov.uk/documents/s124710/Smart%20Cities%20Report%20Appendix%20041214.pdf 4 Smart Cities: Delivering a sustainable City in the Digital Age, http://de-mocracy.leeds.gov.uk/documents/s124710/Smart%20Cities%20Report%20Appendix%20041214.pdf
BRISTOL1 https://www.bristol.gov.uk/statistics-census-information/the-population-of-bristol 2 https://www.bristol.gov.uk/documents/20182/33904/Briefing%20Note%20-%20Mid-2014%20Population%20Estimates.pdf/6db69b96-5f4e-4cbc-873b-e2a0e2bfc6b3 3 State of Bristol (2015): https://www.bristol.gov.uk/docu-ments/20182/32947/State%20of%20the%20City%202013-%20Mayor-al%20vision%20v8.pdf/cd19638b-9a4d-4b40-833f-c5866896db174 http://www.theguardian.com/uk-news/2014/nov/16/bristol-smart-city-future-technology5 http://www.policyexchange.org.uk/images/publications/smart%20cit-ies%20report.pdf6 https://hbb.org.uk/about-us/directory-of-members/bristol-city-council/ 7 https://hbb.org.uk/about-us/directory-of-members/bristol-city-council/8 http://www.policyexchange.org.uk/images/publications/smart%20cit-ies%20report.pdf9 http://www.bristolmedia.co.uk/news/1932/bristol-2015-european-green-capital-reveals-branding 10 http://www.wired.co.uk/news/archive/2015-03/17/bristol-smart-city11 Bristol Smart City Report: http://www.slideshare.net/Bristolcc/bristol-smart-city-report-7579696
71

REFERENCES CONTINUED12 Bristol is Open: http://www.bristolisopen.com/bristol-is-opens-response-to-the-governments-recent-request-for-input-into-the-uks-digital-strategy/13 http://www.bristol.ac.uk/engineering/research/eng-sys-design/projects/rerum/ 14 http://www.irc-sphere.ac.uk/ 15 http://www.connectingbristol.org/16 https://www.cse.org.uk/projects/view/129617 www.bristol.gov.uk/climatechange18 The State of Bristol (2015): https://www.bristol.gov.uk/docu-ments/20182/32947/State%20of%20the%20City%202013-%20Mayor-al%20vision%20v8.pdf/cd19638b-9a4d-4b40-833f-c5866896db1719 The State of Bristol (2015): https://www.bristol.gov.uk/docu-ments/20182/32947/State%20of%20the%20City%202013-%20Mayor-al%20vision%20v8.pdf/cd19638b-9a4d-4b40-833f-c5866896db1720 Bristol is Open: http://www.bristolisopen.com/bristol-is-opens-response-to-the-governments-recent-request-for-input-into-the-uks-digital-strategy/21 https://hbb.org.uk/about-us/directory-of-members/bristol-city-council/
BELFAST1 http://www.nisra.gov.uk/archive/demography/publications/urban_rural/ur_gaz.pdf 2 http://www.geographyinaction.co.uk/Urban_structure/Urbanstructure_intro.html 3 Belfast Transport Policy: file:///E:/Global%20Sustainable%20Cities/Pro-jects/Edinburgh%20Solar%20co-op/transportpolicybooklet.pdf 4 https://web.archive.org/web/20070208064520/http://www.mspacenyc.com/belfast.study.html 5 http://sticerd.lse.ac.uk/dps/case/cr/CASEreport49.pdf6 http://www.lse.ac.uk/newsAndMedia/news/archives/2008/phoenixcities.aspx7 http://sticerd.lse.ac.uk/dps/case/cr/CASEreport49.pdf8 Back to the Future Report: https://connect.innovateuk.org/docu-ments/3130726/3794125/Feasibility+Study+-+Belfast+City+Council.pdf/02a5ef0a-b06a-4163-9271-91408eb94b7d9 Belfast City Masterplan Report: http://smartcitiescouncil.com/system/files/premium_resources/Belfast%20City%20Masterplan.pdf?file=1&type=node&id=58110 Back to the Future Report: https://connect.innovateuk.org/docu-ments/3130726/3794125/Feasibility+Study+-+Belfast+City+Council.pdf/02a5ef0a-b06a-4163-9271-91408eb94b7d 11 Cooper, J., Ryley, T. and Smyth, A.,( 2001). Contemporary lifestyles and the implications for sustainable development policy: lessons from the UK’s most car dependent city, Belfast. Cities,18(2), pp.103-113.http://www.sciencedi-rect.com/science/article/pii/S0264275100000627 12 Belfast Rapid Transit (gov): https://www.drdni.gov.uk/articles/belfast-rapid-transit-introduction 13 https://www-03.ibm.com/press/uk/en/pressrelease/39458.wss 14 http://www.belfastchamber.com/news-story/273/belfast-wins-ibm-smarter-cities-challenge-grant 15 http://www.belfasttelegraph.co.uk/news/new-belfast-branding-aims-to-make-city-world-class-28395091.html16 http://www.belfastcity.gov.uk/community/IBM-smarter-cities-challenge.aspx17 Belfast City Masterplan Report: http://smartcitiescouncil.com/resources/belfast-city-masterplan 18 Belfast Digital Hub: http://titanic-quarter.com/tq-work/digitalhub#sthash.wUx1M8sB.dpufis 19 Back to the Future Report: https://connect.innovateuk.org/docu-ments/3130726/3794125/Feasibility+Study+-+Belfast+City+Council.pdf/02a5ef0a-b06a-4163-9271-91408eb94b7d20 http://belfast.theodi.org/about-odi-belfast/21 https://connect.innovateuk.org/documents/3130726/3794125/Feasibility+Study+-+Belfast+City+Council.pdf/02a5ef0a-b06a-4163-9271-91408eb94b7d
SAU PAULO1 Brookings (2012) Sao Paulo metropolitan area profile. Available at: http://www.brookings.edu/about/programs/metro//~/media/Research/Files/Papers/2012/11/30-metro-brazil-economy/30-brazil-profiles-en/Sao-Paulo.pdf (Accessed: April 2016)2 The Climate Group (2016) The State of Sao Paulo. Available at: http://www.theclimategroup.org/who-we-are/our-members/the-state-of-sao-paulo (Accessed: April 2016)3 Saxena, S. (2014) Simply Sao Paulo: How a ‘Community’ Mayor is Making a City Smart for its People. Available at: http://thewire.in/2015/11/14/simply-sao-paulo-how-a-communist-mayor-is-making-a-city-smart-for-its-peo-ple-15655/ (Accessed: April 2016)4 GIZ (2011) Guidelines for the Action Plan of the City of Sao Paulo for Miti-gation and Adaptation to Climate Change. Available at: http://www2.giz.
de/urbanet/focus/docdetail-ccc.asp?number=9688 (Accessed: April 2016)5 gestaourbanaSP (2015) Urban Management SP and the new Master Plan for São Paulo. Available at: http://gestaourbana.prefeitura.sp.gov.br/master-plan/ (Accessed: April 2016)6 Hidalgo, D. Rocha, P. S. and Evers, H. (2014) Sao Paulo wins 2014 City/State MobiPrize by empowering citizens and fostering innovation. Available at: http://thecityfix.com/blog/sao-paulo-mobiprize-empowering-citizens-fos-tering-innovation-sustainable-transport-hackathon-coby-joseph-dario-hidalgo-henrique-evers-paulo-santos-rocha/ (Accessed: 3rd April 2016)7 Barifouse (2015) Pedal power forges ahead in Sao Paulo’s famous Aveninda Paulista. Available at: http://www.bbc.co.uk/news/world-latin-america-33271772 (Accessed: April 2016)8 Mari, A. (2013) Sao Paulo city to invest $22 million in free Wi-Fi project. Available at: http://www.zdnet.com/article/sao-paulo-city-to-invest-22-mil-lion-in-free-wi-fi-project/ (Accessed: 3rd April 2016)9 ITDP (2015) Belo Horizonte, Rio de Janeiro, Sao Paulo Win 2015 Sustain-able Transport Award. Available at: https://www.itdp.org/belo-horizonte-rio-de-janeiro-sao-paulo-win-2015-sustainable-transport-award/ (Accessed: 3rd April 2016) 10 OECD (2015) Brazil: Better Life Index. Available at: http://www.oecdbet-terlifeindex.org/countries/brazil/ (Accessed: April 2016)
BRASILIA1 Kaye, L. (2011) Making Brasilia a model green city. Available at: http://www.theguardian.com/sustainable-business/brasilia-brazil-green-city-built-environment (Accessed: April 2016)2 Schwarz, B. (2008) A Vision in Concrete. Available at: http://www.theatlantic.com/magazine/archive/2008/07/a-vision-in-concrete/306846/ (Accessed: April 2016)3 Brookings (2012) Brasilia metropolitan area profile. Available at: http://www.brookings.edu/about/programs/metro/~/media/0FAE023563004C72833179F999F86B51.ashx (Accessed: April 2016)4 Macedo, D. M. and Ficher, S. (2013) Brasilia: Preservation of a Modernist City. Available at: http://www.getty.edu/conservation/publications_resourc-es/newsletters/28_1/brasilia.html (Accessed: April 2016)5 Glaeser, E. (2012) Brasilia is a warning to urban dreamers. Available at: http://www.ft.com/cms/s/0/52a967d0-409d-11e2-8f90-00144feabdc0.html#axzz45WfqjoaZ (Accessed: April 2016)6 Holanda et al. (2008) Brasilia, Brazil: economic and social costs of disper-sion. Available at: www.isocarp.net/data/case_studies/1261.pdf (Accessed: April 2016)7 Arioli, M. (2013) Brasilia Re-imagined. Available at: http://thecityfix.com/blog/brasilia-re-imagined-niemeyer-magdala-arioli/ (Accessed: April 2016)8 Carroll, R. and Phillips, T. (2008) Trouble in utopia as the real Brazil spills into Niemeyer’s masterpiece. Available at: http://www.theguardian.com/world/2008/mar/12/brazil (Accessed: April 2016)9 Zottis, L. (2015) How Two Brazlian Cities Upgraded Their Outdated Bus Fleets for Cleaner Air. Available at: http://thecityfix.com/blog/nossa-ci-dades-two-brazilian-cities-upgraded-outdated-bus-fleets-cleaner-air-luisa-zottis/ (Accessed: April 2016)10 OECD (2015) Brazil: Better Life Index. Available at: http://www.oecdbet-terlifeindex.org/countries/brazil/ (Accessed: April 2016)
BELO HORIZONTE1 Brookings (2012) Belo Horizonte metropolitan area profile. Available at: http://www.brookings.edu/about/programs/metro/~/media/Research/Files/Papers/2012/11/30-metro-brazil-economy/30-brazil-profiles-en/Belo-Horizonte.pdf (Accessed: April 2016)2 Maciel, C. (2014) Urbam mobility among most critical issues faced by Brazilian cities. Available at: http://agenciabrasil.ebc.com.br/en/geral/noticia/2014-09/urban-mobility-among-most-critical-issues-faced-brazilian-cit-ies (Accessed: April 2016)3 WWF (2014) Belo Horizonte Sustainability. Available at: http://wwf.panda.org/wwf_news/?228952 (Accessed: April 2016)4 Filho et al. (2015) Study of the Energy Matrix of Minas Gerais considering the contribution of nuclear power plants. Available at: http://www.feam.br/images/stories/2015/PeD/Paper_-_Study_of_The_Energy_Martix_of_Mi-nas_Gerais_Considering_the_Contribution_of_Nuclear_Power_Plants.pdf (Accessed: April 2016) 5 Belo Horizonte (2016) Belo Horizonte: Sustainable City. Available at: http://www.franceamsud.org/observatorio/images/pdf-20marzo/belohori-zonte_sostcity.pdf (Accessed: April 2016)
General References6 ITDP (2015) Belo Horizonte, Rio de Janeiro, Sao Paulo Win 2015 Sustain-able Transport Award. Available at: https://www.itdp.org/belo-horizonte-rio-de-janeiro-sao-paulo-win-2015-sustainable-transport-award/ (Accessed: 3rd April 2016)
72

REFERENCES CONTINUED7 WWF (2014) Belo Horizonte Sustainability. Available at: http://wwf.panda.org/wwf_news/?228952 (Accessed: April 2016)8 World Resources Institute (2014) MOVE BRT: A new path for urban mobility in Belo Horizonte. Available at: http://www.wrirosscities.org/news/move-brt-new-path-urban-mobility-belo-horizonte (Accessed: April 2016)9 Zottis, L. (2015) Belo Horizonte, Sao Paulo, and Rio de Janeiro announced co-winners of the 2015 Sustainable Transport Award. Available at: http://thecityfix.com/blog/belo-horizonte-sao-paulo-rio-de-janeiro-2015-sustainable-transport-award-luisa-zottis/(Accessed: April 2016)10 Cabi.org (2012) Belo Horizonte – the first Latin America city to implement TRACE energy saving tool. Available at: http://cabiblog.typepad.com/hand_picked/2012/08/belo-horizonte-will-be-the-first-city-in-latin-america-to-implement-energy-saving-tool.html (Accessed: April 2016) 11 OECD (2015) Brazil: Better Life Index. Available at: http://www.oecdbet-terlifeindex.org/countries/brazil/ (Accessed: April 2016)
General References
Calzada, I. & Cobo, C. (2015), Unplugging: Deconstructing the Smart City, Journal of Urban Technology. DOI: 10.1080/10630732.2014.971535.Calzada, I. (2013), Critical Social Innovation in the Smart City era for a City-Regional European Horizon 2020. Journal of Public Policies & Territory P3T. Vol 2, Nº 6 (2013): Social Innovation & Territory. Winter. pp. 1-20.Calzada, I. (2015), Benchmarking Future City-Regions beyond Nation-States, RSRS Regional Studies Regional Science, 2:1, 350-361, DOI: 10.1080/21681376.2015.1046908.Cleave, E., Arku, G., Sadler, R. & Gilliland, J. (2016) The roleof place branding in local and regional economic development: bridging the gap between policy and practicality, Regional Studies, Regional Science, 3:1, 207-228Gabrys, J. (2014), Programming environments: environmentality and citizen sensing in the smart city. Environment and Planning D: Society and Space 32, no. 1:30-48.Glasmeier, Amy, and Susan Christopherson (2015) Thinking about smart cit-ies. Cambridge Journal of Regions, Economy and Society 8, no. 1: 3-12.Hollands, R. G. (2008), Will the real smart city please stand up? Intelligent, progressive or entrepreneurial. City 12, no. 3: 303-320.Kitchin, R. (2015), Making sense of smart cities: addressing present shortcom-ings. Cambridge Journal of Regions, Economy and Society 8, 131-136.Luque-Ayala, A. And Marvin, S. (2015), Developing a critical understanding of smart urbanism. Urban Studies 52, no. 12: 2105-2116.Shelton, T., Zook, M. And Wiig, A. (2015), The ‘actually existing smart city’, Cambridge Journal of Regions, Economy and Society. World Economic Forum (2016), Inspiring Future Cities & Urban Services. Shaping the Future of Urban Development & Services Initiative.http://www.economist.com/news/special-report/21695194-better-use-data-could-make-cities-more-efficientand-more-democratic-how-cities-score/http://www.nature.com/news/metropolis-now-1.19559https://shar.es/1Ydd8r Network Democracy for a Better City, D-CENT event nests.org.ukhttps://shar.es/1Ydd8r Developing policy for innovation and entrepreneur-ship in city governments - See more at: http://www.nesta.org.uk/blog/developing-policy-innovation-and-entrepreneurship-city-governments#sthash.DYn3b6Nz.9F34isJB.dpufhttps://shar.es/1Yddje 8 steps toward a sharing cityhttp://www.slideshare.net/EMBARQNetwork/bh-lacerda-connectkarofi-nal-47275379 CONNECTKaro 2015 - Smart Cities - The City of Belo Horizontehttp://thecityfix.com/blog/challenges-bringing-tod-brazilian-cities-priscila-kichler-pacheco/ http://www.theguardian.com/world/2016/apr/18/dilma-rousseff-congress-impeach-brazilian-presidenthttp://www-smartinfrastructure.eng.cam.ac.uk/what-we-do-and-why/what-is-smart-infrastructurehttp://thecityfix.com/blog/7-principles-transit-oriented-development-tod-nossa-cidade-luisa-zottis/http://thecityfix.com/blog/finding-creative-ways-finance-transit-oriented-devel-opment-brazil-cities-henrique-evers-priscila-pacheco/http://www.smartscities.com/en/latest3/articles/item/605-evolution-and-perspectives-of-smart-cities-in-latin-america-4-brazilhttp://www.nationsencyclopedia.com/Americas/Brazil-TRANSPORTATION.htmlFederalism and the politics of fiscal responsibility laws: Argetina and Brazil in comparative perspective - Jorge P. Gordin (2016) 37:3, 236-253,DOI: 10.1080/01442872.2016.1144736
Brazil general overview - Infographic Reference List
Clifford Chance, (2015). BRAZIL ANNOUNCES MAJOR INFRASTRUCTURE CONCESSION PACKAGE WORTH R$198.4 BILLION (US$66 BILLION). Client Briefing, Willot, C., Available at: https://www.cliffordchance.com/briefings/2015/07/brazil_announcesmajorinfrastructureconcessio.htmlEconomy Watch, (2016). Brazil Industry Sectors. Available at: http://www.economywatch.com/world_economy/brazil/industry-sector-industries.htmlFinancial Times, (2016). Brazil’s debt dilemma. Available at: https://next.ft.com/content/5b2b6bde-a8c7-11e5-9700-2b669a5aeb83?siteedition=uk Global Traffic Congestion Index,(2014). Top 20 cities by traffic congestion. Available at: http://global-traffic-congestion-index.silk.co/Index Mundi, (2016). Population Below Poverty Line. Country Comparison. Available at: http://www.indexmundi.com/g/r.aspx?c=br&v=69 IMF, (2015). Filling the Gap: Infrastructure Investment in Brazil. IMF Work-ing Paper. Available at: https://www.imf.org/external/pubs/ft/wp/2015/wp15180.pdfKnomea, (2013). Brazil Crime Statistics. Available at: https://knoema.com/atlas/Brazil/topics/Crime-Statistics/Homicides/Homicide-rateNational Debt Clocks, (2016). National Debt of Brazil. Available at: http://www.nationaldebtclocks.org/debtclock/brazil OECD, (2012). OECD Health Statistics 2014 How does Brazil compare? Briefing Note. Available at: http://www.oecd.org/els/health-systems/Brief-ing-Note-BRAZIL-2014.pdfOECD, (2014). Country Note. Education at a Glance. Brazil. Available at: https://www.oecd.org/brazil/EAG2014-Country-Note-Brazil.pdfOECD, (2015). OECD Better Life Index. Brazil. Available at: http://www.oecdbetterlifeindex.org/countries/brazil/Reuters, (2015). Brazil’s Rousseff aims to lure $64 billion in infrastructure capital. BRASILIA, by ALONSO SOTO AND ANTHONY BOADLE. Available at: http://www.reuters.com/article/us-brazil-economy-infrastructure-idUSK-BN0OP1OE20150609Statistica, (2016). Brazil: Share of economic sectors in the gross domestic product (GDP) from 2004 to 2014. Available at: http://www.statista.com/statistics/254407/share-of-economic-sectors-in-the-gdp-in-brazil/Statistica, (2016). Gross domestic product (GDP) of the BRIC countries from 2010 to 2020 (in billion U.S. dollars. Available at: http://www.statista.com/statistics/254281/gdp-of-the-bric-countries/Trading Economics, (2016). Brazil Government Debt to GDP. Available at: http://www.tradingeconomics.com/brazil/government-debt-to-gdpTrading Economics, (2016). Brazil Imports and Exports. Available at: http://www.tradingeconomics.com/brazil/imports The Maritime Executive, (2015). Brazil Launches Massive Infrastructure Plan. Available at: http://www.maritime-executive.com/article/brazil-launches-massive-infrastructure-planWikipedia, (2011). List of countries by vehicles per capita. Available at: https://en.wikipedia.org/wiki/List_of_countries_by_vehicles_per_capitaWikipedia, (2016). Municipalities of Brazil. Available at: https://en.wikipedia.org/wiki/Municipalities_of_BrazilWorld Bank, (2016). Brazil. World Development Indicators. Available at: http://data.worldbank.org/country/brazil World Bank, (2016). Data. Urban Population. Available at: http://data.worldbank.org/indicator/SP.URB.TOTL.IN.ZS World by Map, (2016). Land Area. Available at: http://world.bymap.org/LandArea.html Worldometres.info, (2016). Brazil Population. Available at: http://www.worldometers.info/world-population/brazil-population/
73

74

MACI INNOVATIONS
Our address:Gyleview House,
3 Redheughs Rigg, Edinburgh, EH12 9DQ
Phone number+44 (0)131 516 5777
Email address:[email protected]
FUTURE CITIES CATAPULT
Our address:The Urban Innovation Centre
One Sekforde StreetLondon, EC1R OBE