Embed Size (px)
Citation preview

STATE OF THE CANADIAN PRINTING INDUSTRY 2011

State of the Canadian Printing Industry 2011For additional copies of this publication, please contact:
Publishing and Depository Services Public Works and Government Services Canada Ottawa ON K1A 0S5
Telephone (toll-free): 1-800-635-7943 (Canada and U.S.) Telephone (local): 613-941-5995 TTY: 1-800-465-7735 Fax (toll-free): 1-800-565-7757 (Canada and U.S.) Fax (local): 613-954-5779 Email: [email protected] Website: www.publications.gc.ca
This publication is available upon request in accessible formats. Contact:
Multimedia Services Section Communications and Marketing Branch Industry Canada Room 441F, East Tower 235 Queen Street Ottawa ON K1A 0H5
Telephone: 613-947-5177 Fax: 613-954-6436 Email: [email protected]
This publication is also available online at www.ic.gc.ca/printing-industry-2011.
Permission to Reproduce Except as otherwise specifically noted, the information in this publication may be reproduced, in part or in whole and by any means, without charge or further permission from Industry Canada, provided that due diligence is exercised in ensuring the accuracy of the information reproduced; that Industry Canada is identified as the source institution; and that the reproduction is not presented as an official version of the information reproduced, nor as having been made in affiliation with, or with the endorsement of, Industry Canada.
For permission to reproduce the information in this publication for commercial redistribution, please email [email protected].
Cat. No.: Iu44-86/2012 ISBN: 978-1-100-54220-1 IC registration #: 60969
This study was prepared for Industry Canada by the Canadian Printing Industries Association in collaboration with the Printing Industries of America. Opinions and statements in the publication attributed to named authors do not necessarily reflect the policy of Industry Canada or the Government of Canada.
Aussi offert en français sous le titre L’état de l’industrie canadienne de l’imprimerie 2011

STATE OF THE CANADIAN PRINTING INDUSTRY 2011


Contents
Executive Summary ........................................................................................................................................................... 1
Key Findings ............................................................................................................................................................................. 2
1. Introduction .................................................................................................................................................................... 3
2. Methodology .................................................................................................................................................................. 3
3. Statistical Findings ........................................................................................................................................................ 4
3.1 Respondent Demographics ............................................................................................................................................. 4
3.2 Trends and Expectations by Process and Market Segment ............................................................................................ 7
3.3 Marketing Tactics and Metrics ......................................................................................................................................... 8
3.4 Strategic Focus and Business Models .......................................................................................................................... 10
3.5 Competitive Situation .................................................................................................................................................... 11
3.6 Non-Print Ancillary Services .......................................................................................................................................... 13
3.7 Major Technological Capital Investments ...................................................................................................................... 17
3.8 Investment Areas in the Next Two Years ....................................................................................................................... 19
3.9 Process Automation Issues ........................................................................................................................................... 22
3.10 Investment Priorities ...................................................................................................................................................... 25
3.11 Business Conditions ...................................................................................................................................................... 25
4. Overview of Key Trends and Implications ................................................................................................................. 28
4.1 Key Trends ..................................................................................................................................................................... 28
4.2 The Next Two Years ....................................................................................................................................................... 31
4.3 Emerging Risks and Challenges .................................................................................................................................... 32
4.4 Planning Insights ........................................................................................................................................................... 33
4.5 The Longer Run — Future of Print ................................................................................................................................. 33
4.6 Looking Forward — Competitive Strategies and Tactics .............................................................................................. 34
5. Final Remarks .............................................................................................................................................................. 37
Annex: Tables ................................................................................................................................................................... 38

Figure 1 Business model process diagram ....................................... 10
Figure 2 Print by function — 2009 U.S. shipments (%) .................... 28
Figure 3 Shipment change 1999–2010 by print function (%) ............ 29
Figure 4 Print by process — 2009 U.S. shipments (%) .................... 29
Figure 5 Digital and litho jobs — total jobs using both processes (%) ... 30
Figure 6 Source of digital printing growth — digital printing jobs (%) .. 30
Figure 7 United States survivor sales 1999–2009 — change in shipments (%) ................................................................. 30
Figure 8 Print scenarios 2011–2012 — change in shipments (%) ......... 31
Figure 9 Survivors vs. the market — change in shipments (2011–2012) (%) .................................................................. 31
Figure 10 Profit rates by business model — first quarter 2010 (%) ..... 35
Table 1 Enterprise headquarters ......................................................... 4
Table 2 Type of organization ............................................................... 5
Table 3 Number of establishments ..................................................... 5
Table 4 Size (number of employees) ................................................... 5
Table 5 Foreign operations ................................................................. 6
Table 6 Export sales ........................................................................... 6
Table 7 Export locations ..................................................................... 6
Table 8 Printing processses — 2006, 2011 and expected in 2013 .... 7
Table 9 Print market segments — 2006, 2011 and expected in 2013.................................................................................... 8
Table 10 Dependence on largest customers ........................................ 8
Table 11 Value of print jobs .................................................................. 9
Table 12 Domestic sales focus ............................................................. 9
Table 13 Customers’ market focus ....................................................... 9
Table 14 Active customer accounts ................................................... 10
Table 15 Canadian printer business models — 2006 and 2011 ......... 11
Table 16 Relative size of competition ................................................. 11
Table 17 Location of competition ....................................................... 12
Table 18 Competitive pressures ......................................................... 12
Table 19 Changes in competitive pressures ....................................... 13
Table 20 Proportion of sales from ancillary services .......................... 13
Table 21 Ancillary services offered ..................................................... 14
Table 22 How long ancillary services have been offered .................... 14
Table 23 Share of sales of ancillary services ...................................... 15
Table 24 Ancillary services — effect on sales ..................................... 15
Table 25 Ancillary services — impact on profits ................................. 16
Table 26 Web-to-print branded storefronts — pricing and charges ... 16
Table 27 Sales through web-to-print storefronts ................................ 17
Table 28 Web-to-print branded storefronts — impact on sales ......... 17
Table 29 Investments in technology in the past 24 months ............... 18
Table 30 Effect of technology investments on return on investment .. 18
Table 31 Effect of technology investments on sales .......................... 19
Table 32 Reasons for investing in technology .................................... 19
Table 33 Planned investments in prepress technologies ................... 20
Table 34 Planned investments in digital printing technologies ........... 20
Table 35 Planned investments in sheetfed press technologies .......... 21
Table 36 Planned investments in web offset press technologies ....... 22
Table 37 Planned investments in binding and finishing technologies 22
Table 38 Implementation of process automation ............................... 23
Table 39 Reasons for not implementing process automation ............ 23
Table 40 Automation of operations ..................................................... 23
Table 41 Job Definition Format usage ................................................ 24
Table 42 Purpose of Job Definition Format usage ............................. 24
Table 43 Staff knowledge of Job Definition Format ............................ 24
Table 44 Plans to automate other aspects of operations ................... 25
Table 45 Highest priority investments in the next two years .............. 25
Table 46 Business conditions ............................................................. 26
Table 47 Employment levels ............................................................... 27
Table 48 Capital spending trends ....................................................... 27
Table 49 Impact of current credit conditions ...................................... 27
List of Figures and Tables

STATE OF THE CANADIAN PRINTING INDUSTRY 2011
1
Executive Summary The Canadian printing industry has undergone significant upheaval as a result of the recent global recession and market forces driven by technological change. This structural change to the industry is resulting in its contraction and consolidation. Post-recession, the North American printing industry is expected to be smaller, both in terms of the number of firms and domestic market size. To remain competitive, the remaining printers must adapt their business strategies and take advantage of new technologies.
Industry Canada has partnered with the Canadian Printing Industries Association to analyze aspects of the commercial printing industry in Canada. This report summarizes the results of a March 2011 survey of Canadian printing company executives. The survey explored the industry’s economic, management and technology issues, and sought to determine the degree to which Canadian printers are adopting new value-added business strategies and technological innovations. Additional analysis from Printing Industries of America reports and other research was also incorporated into this report.
The report also offers insights on printing industry market trends and metrics, major technological capital investments, and business conditions, and also includes a discussion of key printing industry trends.

STATE OF THE CANADIAN PRINTING INDUSTRY 2011
2
Key FindingsOver the last few years, digital and ancillary services have gained a greater share of the printing market at the expense of offset printing. Primary reasons for this gain include improvements in digital technologies, the increased targeting and personalization of printed material, and the expansion of the typical printer’s business model to include additional related services. Another indication of digital print’s growth is that more and more print work — or jobs — now combine both conventional and digital technologies.
In terms of business models, more than 40% of printers identified themselves as general commercial printers, with the remaining printers identifying themselves as niche printers by product segment (e.g., magazines) (21%), communications providers offering a complete set of value-added ancillary services (16%) or vertical niche printers focusing on a particular market segment (11%).
Canadian printers employ a broad cross-spectrum of printing processes and services. Sheetfed printing is the top printing process employed by Canadian printers in terms of sales followed by digital printing. The pattern of market segments served by Canadian printers remained fairly stable from 2006 to 2011, with general commercial printing declining slightly and quick printing increasing somewhat, as measured by share of total sales. Similar trends are projected through 2013.
Printing is generally a local and regional business, with a significant dependence on a few large customers. The five largest customers of respondents typically account for almost half of all sales dollars. Due to changes in customers’ marketing and promotion tactics, average run lengths of print jobs are declining.
The primary source of competition for most printers is another local printer. Already established printers remain the highest degree of competitive pressure, followed by digital displacement of print and new entrants to the market.
Another changing dynamic that is affecting printers is the expansion of the print market space from printed product to various ancillary services. The three most commonly offered services are professional creative design, mailing management and kit fulfillment. Revenues from ancillary services have grown more than revenues from traditional printing services.
As for major technological capital investments, printers must continually invest in new technologies. Almost 60 percent of respondents invested in digital technologies in 2009–2010, consistent with the shifting market dynamics towards greater use of digital print due to consumer demand and improved quality. Many Canadian printers have made major capital investments in workflow automation and process automation technologies to improve productivity.
Printers are feeling pressure due to competition from digital media, declining printing prices and increasing costs (e.g., materials and labour). As a result, printers’ profits and employment levels have declined in the last few years. The top three priorities for investments over the next two years are adding/replacing equipment, sales force development, and marketing and advertising.

STATE OF THE CANADIAN PRINTING INDUSTRY 2011
3
1. Introduction As a result of the recent global recession and the effects of emerging digital technologies — both competitive and supportive — the Canadian printing industry is experiencing an era of significant structural change. The number of players has shrunk through consolidation and closures and, post-recovery, the market size of the North American printing industry is expected to be smaller. For the remaining firms, the ability to remain competitive will involve adopting current business models and exploiting new technologies.
To make that shift, firms need new technologies — digital printing, integrated systems, customer interface software, variable data printing technologies, post-press automation, etc. — and the skilled employees to utilize them. Competitive firms are successfully using these technologies to evolve their businesses to meet the 21st century market.
2. Methodology In March 2011, a survey of Canadian printing company executives was conducted, which explored:
� business structure � sales trends by printing process and market segment � marketing practices � strategies and business models � competitive situation � non-print services � technologies � business conditions � profitability � employment and capital investments � credit conditions and issues
Over 105 Canadian printers participated in the survey, which was conducted through an online survey tool. The typical respondent employed 12 persons (median) in 2011, although all sizes of printing firms were represented. The survey addressed economic, management and technology issues, and responses focused on a variety of market segments, printing processes and geographic markets.
At the time of the survey, the North American economy was slowly recovering from the recent global recession. Print markets typically lead recessions and lag recoveries, and this recent recovery follows this pattern. This environment was reflected in the survey responses.
The objectives of the survey were to:
1. determine the degree to which Canadian printers are adopting new value-added business strategies and technological innovations
2. investigate the impacts of business processes and technological innovations of Canadian printers on mitigating market risks and creating opportunities, and assess the changes in these variables over the last few years and identify any developing trends
3. gather data for a comparative analysis of indicators (e.g., business models, adoption of new technologies, expansion of value-added services) in relation to the United States (U.S.) market1
1 Based on the Printing Industries of America’s fourth quarter 2010 market survey

STATE OF THE CANADIAN PRINTING INDUSTRY 2011
4
3. Statistical Findings
3.1 Respondent DemographicsFor the most part, the North American printing industry is composed of small to medium-sized firms operating one production facility. Canadian printers who participated in the survey demonstrated the usual profile of characteristics, including the number of establishments, number of employees, and number of foreign operations.
Enterprise HeadquartersOver half of survey respondents’ headquarters were located in Ontario, followed by Quebec (Table 1).
Table 1
LOCATION RESPONDENTS (%)
Ontario 53.3
Quebec 15.2
British Columbia 13.3
Alberta 7.6
Manitoba 6.7
Saskatchewan 1.9
Nova Scotia 1.0
New Brunswick -
Newfoundland and Labrador -
Northwest Territories -
Nunavut -
Prince Edward Island -
Yukon -
Other 1.0
Type of OrganizationHalf of the respondents are general commercial printers, while quick printers are the next largest category (Table 2). This respondent profile is generally similar to that found in Printing Industries of America surveys of U.S. printers.

STATE OF THE CANADIAN PRINTING INDUSTRY 2011
5
Table 2
TYPE OF ORGANIZATION RESPONDENTS (%)
General commercial printer 50.9
Quick printer 14.2
Specialty printer 3.8
Prepress/premedia services provider 3.8
Trade binding 3.8
In-plant printer 3.8
Business forms printer 2.8
Newspaper printer 1.9
Book printer 1.9
Packaging printer 1.9
Graphic finishing services 1.9
Screen printer 0.9
Supplier 0.9
Other 8.5
Number of EstablishmentsAbout eight out of ten Canadian printers operate one plant, a rate similar to American printers (Table 3).
Table 3
NUMBER OF ESTABLISHMENTSRESPONDENTS (%)
2011 2006
1 79.2 80.2
2 8.5 8.3
3 3.8 2.1
4 3.8 4.2
5+ 4.7 5.2
Size (Number of Employees)The typical respondent employed 12 persons (median) in 2011, down from 14 in 2005 (Table 4). Overall employment in the industry fell during this period due to both the recession and productivity enhancements. Respondents forecast stable employment over the remainder of 2011. A comparison with U.S. printers indicates similar expectations.
Table 4
ENTERPRISE EMPLOYMENTNUMBER OF FULL-TIME EQUIVALENT EMPLOYEES
2005 2011 EXPECTED YEAR-END 2011
Minimum 1 1 1
Average 135 128 133
Median 14 12 12
Maximum 5,200 5,500 5,500

STATE OF THE CANADIAN PRINTING INDUSTRY 2011
6
Foreign OperationsGenerally, the North American printing industry is domestically focused. The majority of Canadian respondents had only domestic operations (Table 5).
Table 5
FOREIGN OPERATIONSRESPONDENTS (%)
CANADA UNITED STATES
Yes 0.9 2.4
No 99.1 97.6
Export SalesApproximately 38 percent of respondents indicated they have export sales. These export sales comprise an average of 12.8 percent of these firms’ total sales (median is 5%) (Table 6). These proportions are higher than U.S. printers, which reflect the tendency of Canadian printers to sell to American customers.
Table 6
EXPORT
CANADA UNITED STATES
RESPONDENTS (%)COMPANY SALES (%)
RESPONDENTS (%)COMPANY SALES (%)
AVERAGE MEDIAN AVERAGE MEDIAN
Yes 37.7 12.8 5.0 23.5 7.3 2.0
No 62.3 - - 76.5 - -
Export LocationsThe most important export destinations are the U.S., followed by the United Kingdom and Mexico (Table 7).
Table 7
EXPORT DESTINATION NUMBER OF RESPONDENTS EXPORT DESTINATION NUMBER OF RESPONDENTS
United States 39 Croatia 1
United Kingdom 9 Egypt 1
Mexico 4 France 1
Bermuda 3 Haiti 1
Australia 2 Hong Kong 1
Bahamas 2 Italy 1
Canada 2 Kyrgyzstan 1
Germany 2 Luxembourg 1
Japan 2 Monaco 1
Republic of China (Taiwan) 2 Poland 1
Switzerland 2 Portugal 1
Thailand 2 Russia 1
China 1 Saudi Arabia 1
India 1 Slovakia 1
Barbados 1 Spain 1
Belize 1 Sweden 1
Bosnia and Herzegovina 1 Ukraine 1
British Virgin Islands 1

STATE OF THE CANADIAN PRINTING INDUSTRY 2011
7
3.2 Trends and Expectations by Process and Market SegmentSales trends of Canadian printers reflect the recession and recovery underway. Patterns vary somewhat by process and market segment, but are in line with American print market trends.
Printing Processes — 2006, 2011 and expected in 2013Canadian printers employ a broad cross-spectrum of printing processes and services. Sheetfed printing is the top printing process employed by Canadian printers in terms of sales (Table 8). However, the proportion of total sales derived from sheetfed operations has fallen significantly since 2006. Conversely, digital printing has grown as a proportion of sales.
Table 8
PRINTING PROCESSESTABLISHMENT SALES THAT ARE GENERATED FROM EACH PROCESS (%)
2006 2011 EXPECTED 2013
Non-print ancillary value-added services 6.6 7.3 8.1
Sheetfed printing 43.5 36.4 31.8
Web-fed printing heatset 1.9 1.1 0.9
Web-fed printing non-heatset 4.1 4.2 3.2
Screen printing 1.7 1.7 1.5
Digital printing (toner-based) 16.4 22.0 25.4
Digital printing (inkjet high speed production) 2.1 4.3 5.8
Inkjet wide and super wide format for production 5.3 5.5 6.9
Prepress/premedia services 4.5 4.1 3.1
Thermographer 0.8 0.5 0.4
Letterpress 1.3 0.9 0.7
Gravure - 0.1 -
Flexographic 1.3 1.2 1.1
Trade binding 2.0 2.4 2.0
Graphic finishing 4.6 3.8 3.2
Loose-leaf manufacturing 0.2 0.2 0.9
Other 3.6 4.2 5.1
Print Market Segments — 2006, 2011 and expected in 2013In general, a fairly stable pattern of print market segments served by Canadian printers has emerged from 2006 to 2011. General commercial printing has declined slightly, while quick printing has somewhat increased, as measured by share of total sales (Table 9). Similar trends are projected through 2013.

STATE OF THE CANADIAN PRINTING INDUSTRY 2011
8
Table 9
MARKET SEGMENTESTABLISHMENT SALES THAT ARE CONDUCTED IN EACH MARKET SEGMENT (%)
2006 2011 EXPECTED 2013
General commercial printing 37.7 35.5 33.7
Quick printing 13.9 14.6 15.9
Magazines and periodicals 3.6 3.3 3.0
Newspaper printing 1.9 1.6 1.7
Book printing 3.7 4.1 4.0
Financial/legal printing 1.2 1.6 1.8
Business forms printing 5.6 4.8 3.6
Converters/label/wrapper printing 1.7 1.3 1.1
Greeting card printing 0.3 0.5 0.6
Specialty printing 3.2 4.4 4.4
Package printing 2.8 2.8 3.6
Direct mail printing 2.3 3.4 4.7
Mailing services 1.4 2.0 2.2
Signs/signage (including business signs, banners, etc.) 5.5 6.1 6.2
In-plant printer 3.3 3.4 2.6
Supplier to the print industry 4.5 3.6 3.1
Other 7.5 7.1 7.6
3.3 Marketing Tactics and MetricsPrinting is generally a local and regional business, with a significant dependence on a few large customers. These tendencies are reflected in the marketing tactics and metrics of Canadian printers.
Dependence on Largest CustomersOn average, the typical Canadian printer’s largest customer in 2010 accounted for approximately 23 percent of sales (the median is slightly less at 17%), while the five largest customers together constituted almost half of annual sales dollars (Table 10). These figures generally correspond to U.S. trends.
Table 10
CUSTOMER2010 (% OF SALES) 2006 (% OF SALES)
MIN AVERAGE MEDIAN MAX MIN AVERAGE MEDIAN MAX
Largest customer 1.0 23.1 17.0 90.0 1.0 24.5 20.0 90.0
Five largest customers 2.0 48.2 41.0 100 10.0 49.6 45.0 100

STATE OF THE CANADIAN PRINTING INDUSTRY 2011
9
Value of Print JobsAverage run lengths of print jobs are declining, as printing customers adjust their marketing and promotion tactics — primarily through increased targeting and personalization of printed material. In terms of price, survey respondents reported an average job value of more than $43,200 for 2010, up almost nine percent from 2006 (Table 11). The median price of a print job was much less ($1,000), since the average is driven up by less frequent but extended-run jobs.
Table 11
DOLLAR VALUEENTERPRISE AVERAGE DOLLAR VALUE OF PRINT JOBS ($)
2010 2006
Minimum 25 20
Average 43,231 39,783
Median 1,000 1,000
Domestic Sales FocusMore than five out of ten printers surveyed have a local market focus of 259 square kilometres (100 square miles) or less. At the other end of the spectrum, approximately 16 percent of Canadian printers focus on customers across the country (Table 12). Compared to U.S. printers, more Canadian respondents (10%) focus on local market sales, while 20 percent more U.S. printers have a national sales focus.
Table 12
DOMESTIC SALES FOCUSRESPONDENTS (%)
CANADA UNITED STATES
Local—less than 259 square kms (100 square miles) 52.9 38.7
Sub-regional—260 to 649 square kms (101–250 square miles) 13.5 8.3
Regional—650 to 1,295 square kms (251–500 square miles) 17.3 17.9
National—across the country 16.3 35.1
Customers’ Market FocusOver six out of ten Canadian printers stated that their customers have a local market focus. In contrast, less than 3 percent of respondents indicated that their customers focus on foreign countries (Table 13).
Table 13
CUSTOMERS’ MARKET FOCUS RESPONDENTS (%)
Local 64.7
Sub-regional 8.3
Regional 9.7
National 13.2
International 2.9
Do not know 1.2
Active Customer AccountsMost Canadian printers had more than 51 active customer accounts on average in 2010 (Table 14). Of course, this number correlates with order size and the overall size of the printer, and reflects the “job shop” nature of print demand. American printers displayed similar tendencies, with approximately 65 percent of firms reporting 51 or more active customers on average.

STATE OF THE CANADIAN PRINTING INDUSTRY 2011
10
Table 14
NUMBER OF ACTIVE CUSTOMERSRESPONDENTS (%)
CANADA UNITED STATES
Fewer than 5 2.8 4.3
6 to 10 0.9 2.1
11 to 20 7.5 2.1
21 to 50 16.0 27.7
51+ 72.6 63.8
3.4 Strategic Focus and Business ModelsOver the last decade, printers have generally adopted a more strategic business focus. They have accomplished this by shifting from the industry’s traditional production-centred business model to one that is more customer- or market-focused. As the process diagram below illustrates, printers are evolving by offering additional services and communications solutions as well as printed products (Figure 1).
Figure 1
BUSINESS MODEL PROCESS DIAGRAM
Another key development in the area of business models is the strategic implementation of profitable commercial strategies based on specialization or diversification of products and services solutions.
� Specialization
Printing firms that specialize in a particular print market segment, such as labels/wrappers, direct marketing, or packaging, generally have higher profit rates than more generalist firms. Printers may also specialize by focusing on a certain customer segment or vertical market, such as hotels/resorts or automobile retailers. Some printers even combine these two approaches as a specialized hybrid, targeting a particular customer segment with a specific product offering.
� Diversification
Printing firms that provide additional value-added ancillary services generally have higher profits than firms that produce only printed products. Offering extra services that are supplementary to the printed product, such as creative design, database management, mailing, fulfillment, and inventory management, can add to a printer’s bottom line.
Integrating these two strategic options into a specialized diversification strategy enhances profitability by enabling printers to decrease costs and increase selling prices.
In implementing specialization and diversification, printers select and design business models for their organizations. Common business models in the printing industry include:
� Niche printer specializing in a narrow print product segment, such as direct mail or labels/wrappers
� Niche printer specializing in a narrow vertical market segment or specific industry, such as travel, entertainment or health care
� General commercial printer offering a wide variety of printed products and services to a general customer base
� Communications provider offering a complete set of value-added services such as printing, database management, fulfillment, or mailing
Printed ProductsAncillary and Adjacent
Market SpaceCommunications
Solutions
Outsourced PrintManagement
Services

STATE OF THE CANADIAN PRINTING INDUSTRY 2011
11
Canadian Printer Business Models — 2006 and 2011At the time of the survey, about four out of ten Canadian printers identified themselves as general commercial printers in terms of their business strategies (Table 15). The other main choices of strategies are: niche product printer (20.7%), communications provider (16%) and vertical niche printers (11.3%). This pattern is generally similar to the U.S., as no significant difference is found between Canada and the U.S. in the breakdown of business models. However, one key dissimilarity exists: Canadian printers that focus on a product niche or vertical market segment are more likely to offer ancillary services than their U.S. counterparts.
Table 15
ENTERPRISE LEVEL BUSINESS MODELRESPONDENTS (%)
CHANGE (%)2006 STRATEGY 2011 STRATEGY
Niche printer by product segment (e.g., book, magazine, newspaper) focusing solely on printed products
10.8 2.8 -8.0
Niche printer by product segment focusing on printed products and value-added ancillary services that are in line with printed product offerings
14.7 17.9 3.2
Niche printer by narrow vertical market segment/industry (e.g., gaming industry, hotels, advertising agencies, auto industry) focusing solely on printed products
2.9 2.8 -0.1
Niche printer by narrow vertical market segment/industry focusing on printed products and value-added ancillary services that are in line with printed product offerings
5.9 8.5 2.6
General commercial printer offering a wide variety of printed products and services (includes advertising printing, business cards, stationery, catalogs, and directories) to a general customer base
46.1 42.5 -3.6
Communications provider offering a complete set of value-added ancillary services including printing, database management, fulfillment, mailing
9.8 16.0 6.2
Other 9.8 9.4 -0.4
Generally, the pattern of business strategies for Canadian printers was similar to that found in 2006. Again, the top choice was the general commercial printer strategy. However, the industry has somewhat shifted away from the general commercial printer strategy. In particular, the communications provider strategy has gained a larger following.
3.5 Competitive SituationAs is the case in most industries, printers are constantly searching for customers and market share. Search efforts typically entail evaluating numerous issues, such as the appropriate geographic location to target, the relative size of competitors, and other competitive pressures.
Relative Size of CompetitionGenerally, a business enterprise might prefer to be larger than its competitors in order to gain a size and competitive advantage. In the printing industry, however, this typical business characteristic is not as prevalent (Table 16).
Table 16
COMPETITORS
RESPONDENTS (%)
MOST OFTEN (1)
OFTEN (2)
LEAST OFTEN (3)
Printers larger than their enterprise 43.8 28.6 27.6
Printers smaller than their enterprise 16.2 38.1 45.7
Printers of similar size 40.0 33.3 26.7
Note: Ranked on a scale of 1 to 3 (1=highest level of competitive pressure, 3=lowest level of competitive pressure)
STATE OF THE CANADIAN PRINTING INDUSTRY 2011
12
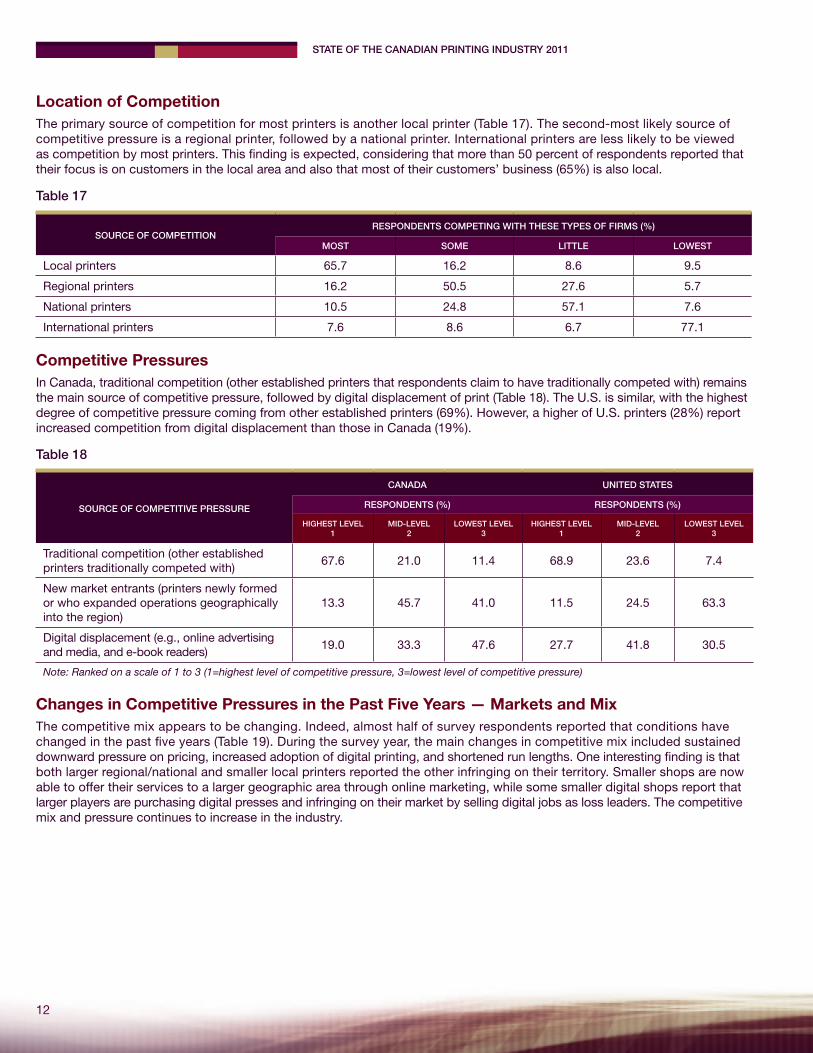
Location of CompetitionThe primary source of competition for most printers is another local printer (Table 17). The second-most likely source of competitive pressure is a regional printer, followed by a national printer. International printers are less likely to be viewed as competition by most printers. This finding is expected, considering that more than 50 percent of respondents reported that their focus is on customers in the local area and also that most of their customers’ business (65%) is also local.
Table 17
SOURCE OF COMPETITIONRESPONDENTS COMPETING WITH THESE TYPES OF FIRMS (%)
MOST SOME LITTLE LOWEST
Local printers 65.7 16.2 8.6 9.5
Regional printers 16.2 50.5 27.6 5.7
National printers 10.5 24.8 57.1 7.6
International printers 7.6 8.6 6.7 77.1
Competitive PressuresIn Canada, traditional competition (other established printers that respondents claim to have traditionally competed with) remains the main source of competitive pressure, followed by digital displacement of print (Table 18). The U.S. is similar, with the highest degree of competitive pressure coming from other established printers (69%). However, a higher of U.S. printers (28%) report increased competition from digital displacement than those in Canada (19%).
Table 18
SOURCE OF COMPETITIVE PRESSURE
CANADA UNITED STATES
RESPONDENTS (%) RESPONDENTS (%)
HIGHEST LEVEL 1
MID-LEVEL 2
LOWEST LEVEL 3
HIGHEST LEVEL 1
MID-LEVEL 2
LOWEST LEVEL 3
Traditional competition (other established printers traditionally competed with)
67.6 21.0 11.4 68.9 23.6 7.4
New market entrants (printers newly formed or who expanded operations geographically into the region)
13.3 45.7 41.0 11.5 24.5 63.3
Digital displacement (e.g., online advertising and media, and e-book readers)
19.0 33.3 47.6 27.7 41.8 30.5
Note: Ranked on a scale of 1 to 3 (1=highest level of competitive pressure, 3=lowest level of competitive pressure)
Changes in Competitive Pressures in the Past Five Years — Markets and MixThe competitive mix appears to be changing. Indeed, almost half of survey respondents reported that conditions have changed in the past five years (Table 19). During the survey year, the main changes in competitive mix included sustained downward pressure on pricing, increased adoption of digital printing, and shortened run lengths. One interesting finding is that both larger regional/national and smaller local printers reported the other infringing on their territory. Smaller shops are now able to offer their services to a larger geographic area through online marketing, while some smaller digital shops report that larger players are purchasing digital presses and infringing on their market by selling digital jobs as loss leaders. The competitive mix and pressure continues to increase in the industry.

STATE OF THE CANADIAN PRINTING INDUSTRY 2011
13
Respondents reported that over the past five years, the number of small printers has decreased due to bankruptcies and mergers/acquisitions. Digital printing is gradually displacing lithography, and its quality continues to improve. Larger players are competing for a smaller overall market, since total dollar spend on print is declining due to other forms of media infringing on print. This results in prices continuing to experience downward pressure. Many respondents reported the same change in competitive mix for both the past year and past five years.
Table 19
CHANGE IN COMPETITIVE MIXRESPONDENTS (%)
CHANGED OVER THE PAST YEAR CHANGED OVER THE PAST 5 YEARS
Yes 46.7 64.8
No 53.3 35.2
3.6 Non-Print Ancillary ServicesAnother changing dynamic that is impacting printers is the expansion of the print market space from printed product to various ancillary services, as printers adjust their strategic focus and business models — specializing in core print product but expanding into ancillary services. Some common benchmarks that track this trend include the proportion of sales from ancillary services, the type of services offered, and profit impacts from services.
Proportion of Sales from Ancillary ServicesAs printers have entered this new market space, their revenues from various ancillary services have grown more than their revenues from traditional printing services. The proportion of printers’ sales from ancillary services is considerably varied. While a great deal of printers are still entirely dependent on sales of print products and services, many others rely on ancillary services for more than 20 percent of their total sales. An average of 14.4 percent of survey respondents stated that ancillary services accounted for more than 20 percent of their sales (the median is 10%), while the U.S. average is 12.6 percent (the median is 5%) (Table 20).
Table 20
AVERAGE ESTABLISHMENT SALES FROM ANCILLARY VALUE-ADDED SERVICES (%)
CANADA UNITED STATES
Average 14.4 12.6
Median 10.0 5.0
Ancillary Services OfferedCanadian printers currently offer a broad range of ancillary services. The three most commonly offered services are professional creative design (50.9%), mailing management (40.6%), and kit fulfillment (31.1%) (Table 21). The U.S. shares the same top three services, but in a different order: mailing fulfillment (47.4%), kit fulfillment (44.5%), and professional creative design (38.7%). Many firms plan to invest in new ancillary services within the next 24 months. The most likely new services for both Canada and the U.S. are web-to-print e-commerce style storefronts for print procurement and mailing management. For more details on ancillary services, please refer to the Annex.

STATE OF THE CANADIAN PRINTING INDUSTRY 2011
14
Table 21
ANCILLARY SERVICE
RESPONDENTS (%)
CURRENTLY OFFERED PLAN TO INVEST IN THE NEXT
24 MONTHS
Digital studio photography 9.4 2.8
Professional creative design 50.9 14.2
Digital database management 13.2 10.4
Digital asset management 7.5 8.5
Digital database archiving 7.5 4.7
Mailing management 40.6 17.0
Kit fulfillment 31.1 3.8
Logistics management 18.9 10.4
CD/DVD services 17.0 0.9
Cross-media marketing services or support 7.5 11.3
Web-to-print e-commerce style storefront (print procurement) 17.0 18.9
Web-to-print e-commerce branded storefront (marketing/brand management/document management)
11.3 13.2
Not applicable (do not offer any ancillary services) 13.2 38.7
How Long Ancillary Services Have Been OfferedWhile many Canadian printers have offered these various ancillary services for some time, the actual length of time varies widely (Table 22). Cross-media marketing services or support, on average, has been offered for less than one year. No respondents reported offering this service for more than five years. At the other end of the spectrum, professional creative design has been offered on average for more than five years (72%).
Table 22
ANCILLARY SERVICELENGTH OF TIME SERVICE OFFERED RESPONDENTS (%)
> THAN 1 YEAR 1 TO 2 YEARS 2 TO 5 YEARS OVER 5 YEARS
Digital studio photography 30.0 10.0 20.0 40.0
Professional creative design 3.8 7.5 17.0 71.7
Digital database management 21.4 7.1 42.9 28.6
Digital asset management 12.5 25.0 25.0 37.5
Digital database archiving 12.5 12.5 25.0 50.0
Mailing management 9.3 20.9 32.6 37.2
Kit fulfillment 6.1 24.2 18.2 51.5
Logistics management 27.8 16.7 16.7 38.9
CD/DVD services 5.3 10.5 42.1 42.1
Cross-media marketing services or support 50.0 25.0 25.0 -
Web-to-print e-commerce style storefront (print procurement) 16.7 33.3 11.1 38.9
Web-to-print e-commerce branded storefront (marketing/brand management/document management)
15.4 38.5 23.1 23.1

STATE OF THE CANADIAN PRINTING INDUSTRY 2011
15
Share of Sales of Ancillary ServicesThe share of sales is increasing for most ancillary services (Table 23). For example, cross-media marketing services or support is reported to be increasing as a share of sales by 75 percent of respondents who currently offer the service, despite this service’s seemingly disappointing effect on sales and profitability. Although the sample size for this category is too small to draw any significant conclusions, those firms that have offered the service for at least one year are still on average trying to determine how to profit from doing so.
Table 23
ANCILLARY SERVICEAS A SHARE OF RESPONDENTS’ BUSINESS (% OF SALES)
INCREASING DECREASING NO CHANGE
Digital studio photography 60.0 10.0 30.0
Professional creative design 37.7 22.6 39.6
Digital database management 38.5 23.1 38.5
Digital asset management 28.6 42.9 28.6
Digital database archiving 12.5 37.5 50.0
Mailing management 61.4 9.1 29.5
Kit fulfillment 62.5 6.3 31.3
Logistics management 57.9 - 42.1
CD/DVD services 36.8 15.8 47.4
Cross-media marketing services or support 75.0 - 25.0
Ancillary Services – Effect on SalesRespondents were asked to evaluate their actual ancillary service sales compared to their expectations, and, for the most part, sales have been as expected (Table 24). Two services exceeded overall expectations:2 kit fulfillment (9.1%) and logistics management (5.3%). Two other services appear to have had an overall lower than expected3 average effect on sales: digital database archiving (-25.0%) and cross-media marketing services or support (-12.5%).
Table 24
ANCILLARY SERVICE
EFFECT ON SALES
RESPONDENTS (%)
HIGHER THAN EXPECTED
AS EXPECTEDLOWER THAN
EXPECTEDTOO SOON TO TELL DO NOT TRACK
Digital studio photography 10.0 60.0 10.0 20.0 -
Professional creative design 9.3 53.7 16.7 3.7 14.8
Digital database management - 35.7 21.4 14.3 28.6
Digital asset management 12.5 62.5 12.5 12.5 -
Digital database archiving - 25.0 50.0 12.5 12.5
Mailing management 15.9 47.7 15.9 11.4 6.8
Kit fulfillment 15.2 60.6 6.1 9.1 9.1
Logistics management 10.5 57.9 5.3 21.1 -
CD/DVD services 10.5 57.9 15.8 5.3 10.5
Cross-media marketing services or support
12.5 12.5 37.5 37.5 -
2 Exceed expectations = increase more than expected - lower than expected 3 Meet expectations = (increase higher than expected + as expected) - lower than expected

STATE OF THE CANADIAN PRINTING INDUSTRY 2011
16
Ancillary Services - Impact on ProfitsAmple evidence shows that incorporating value-added ancillary services to the sales mix increases profits. However, when evaluated against printers’ expectations on profit impacts, the results range widely. All services but digital database archiving (-25.0%) are at least meeting profit expectations4 (Table 25). Only kit fulfillment (3.0%) is currently exceeding profit expectations.5
Table 25
ANCILLARY SERVICE
EFFECT ON PROFITABILITY
RESPONDENTS (%)
HIGHER THAN EXPECTED
AS EXPECTED
LOWER THAN EXPECTED
TOO SOON TO TELL
DO NOT TRACK
NOT PERMITTED TO PROVIDE
EXCEED EXPECTATIONS
INDEX
MEET EXPECTATIONS
INDEX
Digital studio photography 10.0 50.0 10.0 30.0 - - - 50.0
Professional creative design 11.1 33.3 20.4 7.4 27.8 - -9.3 24.1
Digital database management
- 28.6 21.4 14.3 35.7 - -21.4 7.1
Digital asset management - 62.5 25.0 12.5 - - -25.0 37.5
Digital database archiving - 25.0 50.0 12.5 12.5 - -50.0 -25.0
Mailing management 13.6 36.4 15.9 18.2 15.9 - -2.3 34.1
Kit fulfillment 15.2 48.5 12.1 9.1 15.2 - 3.0 51.5
Logistics management 10.5 52.6 10.5 21.1 - 5.3 - 52.6
CD/DVD services 10.5 36.8 21.1 5.3 26.3 - -10.5 26.3
Cross-media marketing services or support
- 25.0 25.0 50.0 - - -25.0 -
Web-to-print e-commerce style storefront (print procurement)
11.1 55.6 16.7 16.7 - - -5.6 50.0
Web-to-print e-commerce branded storefront (marketing/brand management/document management)
23.1 46.2 23.1 7.7 - - - 46.2
Web-to-Print Branded StorefrontsSurvey respondents with web-to-print storefront technology were asked various questions about their tactics and experience. Generally, Canadian printers are about half as likely as American printers to charge for set-up or maintenance (Table 26).
Table 26
PRICING AND CHARGESRESPONDENTS (%)
CANADA UNITED STATES
Do not charge for set-up or maintenance 46.2 22.2
Do not charge for set-up but do charge for maintenance 7.7 38.9
Charge for initial set-up but no ongoing maintenance charge 30.8 27.8
Other* 15.4 11.1
* Canadian respondents who selected other charged for both the initial set-up and an ongoing maintenance fee, while American respondents charged both a set-up and ongoing maintenance fee or charged for this service on a case by case basis.
4 Meet expectations index = (increase higher than expected + as expected) - lower than expected 5 Exceed expectations index = increase higher than expected - lower than expected
STATE OF THE CANADIAN PRINTING INDUSTRY 2011
17
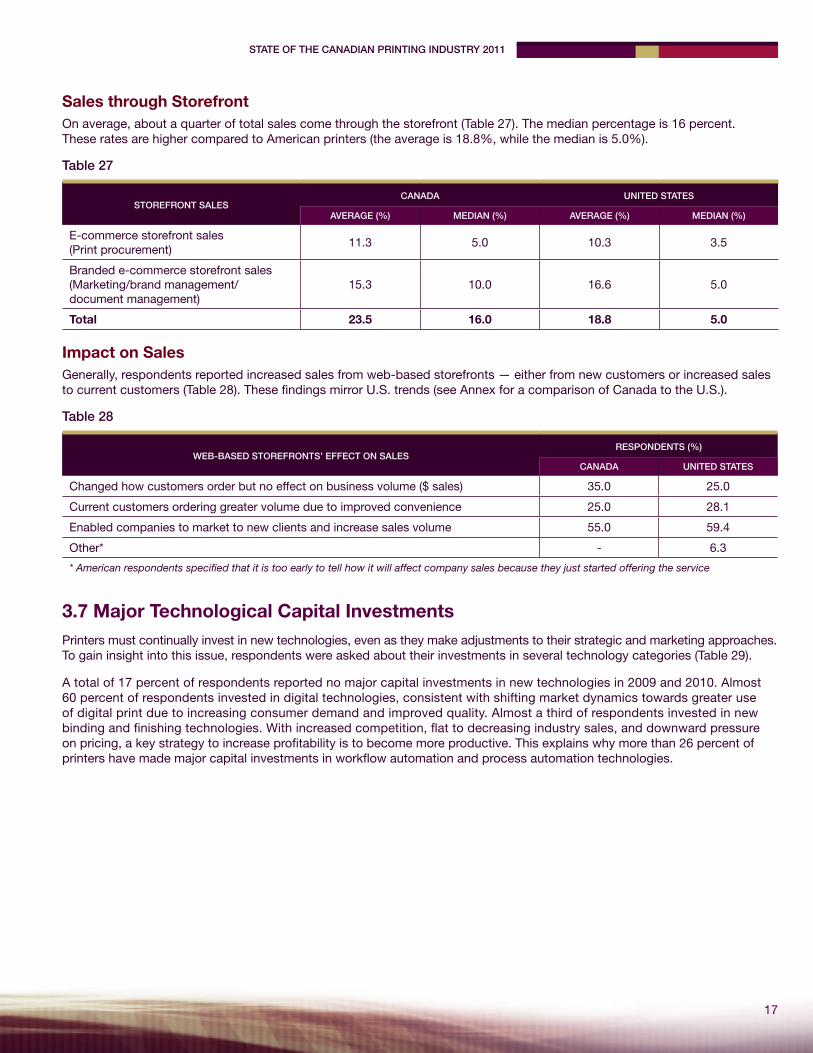
Sales through StorefrontOn average, about a quarter of total sales come through the storefront (Table 27). The median percentage is 16 percent. These rates are higher compared to American printers (the average is 18.8%, while the median is 5.0%).
Table 27
STOREFRONT SALESCANADA UNITED STATES
AVERAGE (%) MEDIAN (%) AVERAGE (%) MEDIAN (%)
E-commerce storefront sales (Print procurement)
11.3 5.0 10.3 3.5
Branded e-commerce storefront sales (Marketing/brand management/ document management)
15.3 10.0 16.6 5.0
Total 23.5 16.0 18.8 5.0
Impact on SalesGenerally, respondents reported increased sales from web-based storefronts — either from new customers or increased sales to current customers (Table 28). These findings mirror U.S. trends (see Annex for a comparison of Canada to the U.S.).
Table 28
WEB-BASED STOREFRONTS’ EFFECT ON SALESRESPONDENTS (%)
CANADA UNITED STATES
Changed how customers order but no effect on business volume ($ sales) 35.0 25.0
Current customers ordering greater volume due to improved convenience 25.0 28.1
Enabled companies to market to new clients and increase sales volume 55.0 59.4
Other* - 6.3
* American respondents specified that it is too early to tell how it will affect company sales because they just started offering the service
3.7 Major Technological Capital InvestmentsPrinters must continually invest in new technologies, even as they make adjustments to their strategic and marketing approaches. To gain insight into this issue, respondents were asked about their investments in several technology categories (Table 29).
A total of 17 percent of respondents reported no major capital investments in new technologies in 2009 and 2010. Almost 60 percent of respondents invested in digital technologies, consistent with shifting market dynamics towards greater use of digital print due to increasing consumer demand and improved quality. Almost a third of respondents invested in new binding and finishing technologies. With increased competition, flat to decreasing industry sales, and downward pressure on pricing, a key strategy to increase profitability is to become more productive. This explains why more than 26 percent of printers have made major capital investments in workflow automation and process automation technologies.

STATE OF THE CANADIAN PRINTING INDUSTRY 2011
18
Table 29
TECHNOLOGYINVESTMENTS IN THE PAST 24 MONTHS
RESPONDENTS (%)
Digital printing technologies 59.4
Prepress technologies 45.3
Binding and finishing technologies 31.1
Workflow automation/process automation investments 26.4
Sheetfed printing press technologies 16.0
Web offset printing press technologies 1.9
No major capital investments in technology 17.0
Other 6.6
Effect of Technology Investments on Return on InvestmentTable 30 examines reported return on investment (ROI) vs. expectations. The two highlighted columns show a quick synopsis of the overall figures. For example, digital printing technologies investments exceeded expectations6 12.7 percent of the time. While binding and finishing technologies investments exceeded expectations only 3 percent of the time, they at least met expectations7 81.8 percent of the time, which is the highest rating for that index. Workflow automation/process automation investments had the lowest index readings.
Table 30
TECHNOLOGY
EFFECT ON RETURN ON INVESTMENT
RESPONDENTS (%)
HIGHER THAN
EXPECTED
AS EXPECTED
LOWER THAN
EXPECTED
TOO SOON TO TELL
DO NOT TRACK
NOT PERMITTED TO PROVIDE
OTHEREXCEED
EXPECTATIONS INDEX
MEET EXPECTATIONS
INDEX
Prepress technologies 8.3 66.7 4.2 8.3 10.4 2.1 - 4.2 70.8
Digital printing technologies
19.0 54.0 6.3 9.5 9.5 1.6 - 12.7 66.7
Sheetfed printing press technologies
11.8 58.8 - 11.8 5.9 - 11.8 11.8 70.6
Web offset printing press technologies
- - - - - - - - -
Binding and finishing technologies
6.1 78.8 3.0 6.1 6.1 - - 3.0 81.8
Workflow automation/process automation investments
10.7 28.6 10.7 21.4 14.3 10.7 3.6 - 28.6
Effect of Technology Investments on SalesSurprisingly, many investments were made with little expectation of increasing sales (Table 31). For example, more than 40 percent of respondents reported investing in prepress technologies with no expected increase in sales, while only 9.5 percent of respondents made investments in digital printing technologies with no expected effect on sales. Net of those who reported not meeting expectations, digital printing investments at least met expectations8 for 49.2 percent of respondents.
6 Exceed expectations index = higher than expected - lower than expected 7 Meet expectations index = (higher than expected + as expected) - lower than expected 8 Meet expectations index = (increase more than expected + as expected) - less than expected

STATE OF THE CANADIAN PRINTING INDUSTRY 2011
19
Table 31
TECHNOLOGY
EFFECT OF THE INVESTMENT ON ESTABLISHMENT SALES
RESPONDENTS (%)
INCREASED MORE THAN EXPECTED
INCREASED AS EXPECTED
LESS THAN EXPECTED
NO EXPECTED EFFECT ON
SALES
TOO SOON TO TELL
DO NOT TRACK
NOT PERMITTED TO PROVIDE
OTHER
Prepress technologies 6.3 20.8 - 43.8 12.5 10.4 - 6.3
Digital printing technologies 7.9 50.8 9.5 9.5 15.9 1.6 4.8 -
Sheetfed printing press technologies 5.9 41.2 5.9 29.4 5.9 - - 11.8
Web offset printing press technologies
- - - - - - - -
Binding and finishing technologies - 30.3 9.1 33.3 18.2 3.0 3.0 3.0
Workflow automation/process automation investments
3.6 17.9 7.1 17.9 25.0 14.3 10.7 3.6
Reasons for Investing in TechnologyFor all categories, the main reason for investing in different technologies was to increase productivity (Table 32). A significant number of respondents also reported that they invested in digital printing technologies to improve customer service/customer experience (57.1%) and enter new markets (41.3%). Workflow automation/process automation was invested in to increase productivity (64.3%), improve customer service/customer experience (50%), and increase automation to reduce manual labour (46.4%). Workflow and process automation investments are expected to continue to increase as more printers invest in web-to-print and digital presses. Demand for digital printing continues to grow and workflow and process automation can help reduce costs, which can lead to profitable growth. Workflow and process automation investments also improve productivity for traditional ink-on-paper printing.
Table 32
TECHNOLOGY
MAIN REASONS FOR INVESTING IN TECHNOLOGY
RESPONDENTS (%)
INCREASE PRODUCTIVITY
INCREASE AUTOMATION TO REDUCE MANUAL
LABOUR
ENTER NEW MARKETS
IMPROVE CUSTOMER SERVICE/ CUSTOMER
EXPERIENCE
KEEP UP WITH
CUSTOMERS
INCREASE CAPACITY TO KEEP UP WITH
GROWTH/EXPECTED DEMAND
OTHER
Prepress technologies 70.8 35.4 25.0 37.5 31.3 20.8 8.3
Digital printing technologies
69.8 27.0 41.3 57.1 34.9 39.7 3.2
Sheetfed printing press technologies
52.9 35.3 23.5 41.2 23.5 29.4 -
Web offset printing press technologies
- - - - - - -
Binding and finishing technologies
69.7 30.3 27.3 51.5 21.2 12.1 9.1
Workflow automation/ process automation investments
64.3 46.4 17.9 50.0 10.7 14.3 10.7
3.8 Investment Areas in the Next Two Years The following section highlights the planned major technological investments over the next two years in the following areas: prepress, digital printing, sheetfed press, web offset press and binding and finishing technologies.
STATE OF THE CANADIAN PRINTING INDUSTRY 2011
20
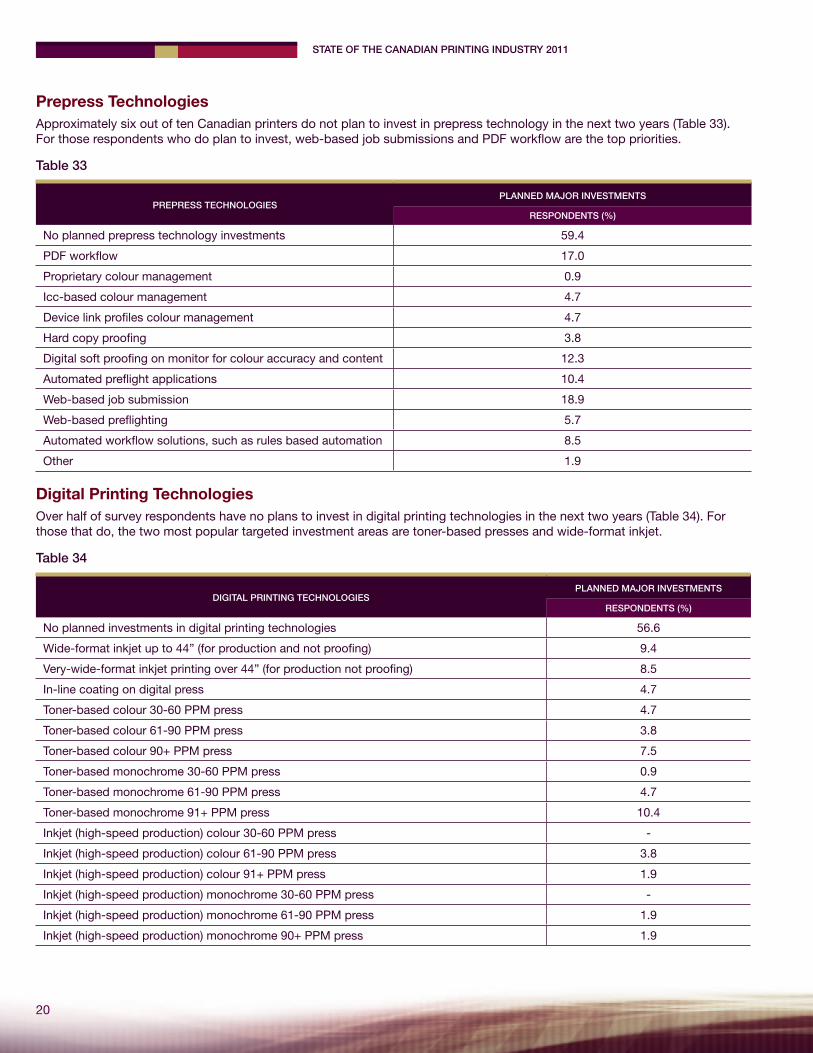
Prepress TechnologiesApproximately six out of ten Canadian printers do not plan to invest in prepress technology in the next two years (Table 33). For those respondents who do plan to invest, web-based job submissions and PDF workflow are the top priorities.
Table 33
PREPRESS TECHNOLOGIESPLANNED MAJOR INVESTMENTS
RESPONDENTS (%)
No planned prepress technology investments 59.4
PDF workflow 17.0
Proprietary colour management 0.9
Icc-based colour management 4.7
Device link profiles colour management 4.7
Hard copy proofing 3.8
Digital soft proofing on monitor for colour accuracy and content 12.3
Automated preflight applications 10.4
Web-based job submission 18.9
Web-based preflighting 5.7
Automated workflow solutions, such as rules based automation 8.5
Other 1.9
Digital Printing TechnologiesOver half of survey respondents have no plans to invest in digital printing technologies in the next two years (Table 34). For those that do, the two most popular targeted investment areas are toner-based presses and wide-format inkjet.
Table 34
DIGITAL PRINTING TECHNOLOGIESPLANNED MAJOR INVESTMENTS
RESPONDENTS (%)
No planned investments in digital printing technologies 56.6
Wide-format inkjet up to 44” (for production and not proofing) 9.4
Very-wide-format inkjet printing over 44” (for production not proofing) 8.5
In-line coating on digital press 4.7
Toner-based colour 30-60 PPM press 4.7
Toner-based colour 61-90 PPM press 3.8
Toner-based colour 90+ PPM press 7.5
Toner-based monochrome 30-60 PPM press 0.9
Toner-based monochrome 61-90 PPM press 4.7
Toner-based monochrome 91+ PPM press 10.4
Inkjet (high-speed production) colour 30-60 PPM press -
Inkjet (high-speed production) colour 61-90 PPM press 3.8
Inkjet (high-speed production) colour 91+ PPM press 1.9
Inkjet (high-speed production) monochrome 30-60 PPM press -
Inkjet (high-speed production) monochrome 61-90 PPM press 1.9
Inkjet (high-speed production) monochrome 90+ PPM press 1.9

STATE OF THE CANADIAN PRINTING INDUSTRY 2011
21
Sheetfed Press TechnologiesIn general, sheetfed technology is not a targeted investment over the next two years; more than nine out of ten printers are of this mindset (Table 35).
Table 35
SHEETFED PRESS TECHNOLOGIESPLANNED MAJOR INVESTMENTS
RESPONDENTS (%)
No planned sheetfed press technology investments 91.5
Computer-to-plate on press 2.8
Automatic plate mounting 0.9
Semi-automatic plate mounting -
Automatic roller washers 1.9
Automatic blanket wash systems 0.9
Automatic impression cleaner 0.9
Independent unit drives 0.9
Closed-loop colour control (in-line) 1.9
Closed-loop colour control (off-line) 0.9
Non-integrated scanning densitometer -
Automatic feeder and delivery set-up -
Coater unit(s) 2.8
Temperature controls for ink rollers 0.9
Static control systems 1.9
Automatic loading of job data using JDF or PPF 1.9
High fidelity printing with more than 5 colours 0.9
Multi unit perfecting for single pass printing 0.9
Stochastic screen -
Automated defect detection and sorting on press 0.9
Ultra violet/electron beam curing of inks 0.9
Other 2.8

STATE OF THE CANADIAN PRINTING INDUSTRY 2011
22
Web Offset Press TechnologiesSimilar to sheetfed, very few printers are planning to invest in new web offset technology in the next two years (Table 36).
Table 36
WEB OFFSET PRINTING PRESS TECHNOLOGIESPLANNED MAJOR INVESTMENTS
RESPONDENTS (%)
No planned web offset printing press technology investments 94.3
Automatic loading of job data using JDF or PPF 0.9
Automated defect detection and sorting on press 1.9
Ultra violet/electron beam curing of inks 1.9
Zero makeready web press -
Automatic plate mounting 0.9
Automatic roller washers -
Automatic blanket wash systems -
Automatic impression cleaner -
Closed loop colour control (in-line) -
Closed loop colour control (off-line) -
Non-integrated scanning densitometer -
Temperature controls for ink rollers 0.9
Inkjet head mounted on offset web (high-speed monochrome or colour) -
Other 1.9
Binding and Finishing TechnologiesTwo out of ten printers forecast investments in binding and finishing technologies in the next two years. The most likely investments in this area are digital and inkjet in-line finishing (Table 37).
Table 37
BINDING AND FINISHING TECHNOLOGIESPLANNED MAJOR INVESTMENTS
RESPONDENTS (%)
No planned binding and finishing technology investments 80.2
Automated makeready using JDF or PPF for cutter 4.7
Automated makeready using JDF or PPF for stitcher 1.9
Automated makeready using JDF or PPF for folder 2.8
In-line finishing applications — offset 1.9
In-line finishing applications — digital 6.6
Large format inkjet finishing (cutters/plotters) 6.6
Other 5.7
3.9 Process Automation IssuesOne particular area of technological investment that printers commonly target is process automation — improving the efficiency of their printing process from prepress to post-press.
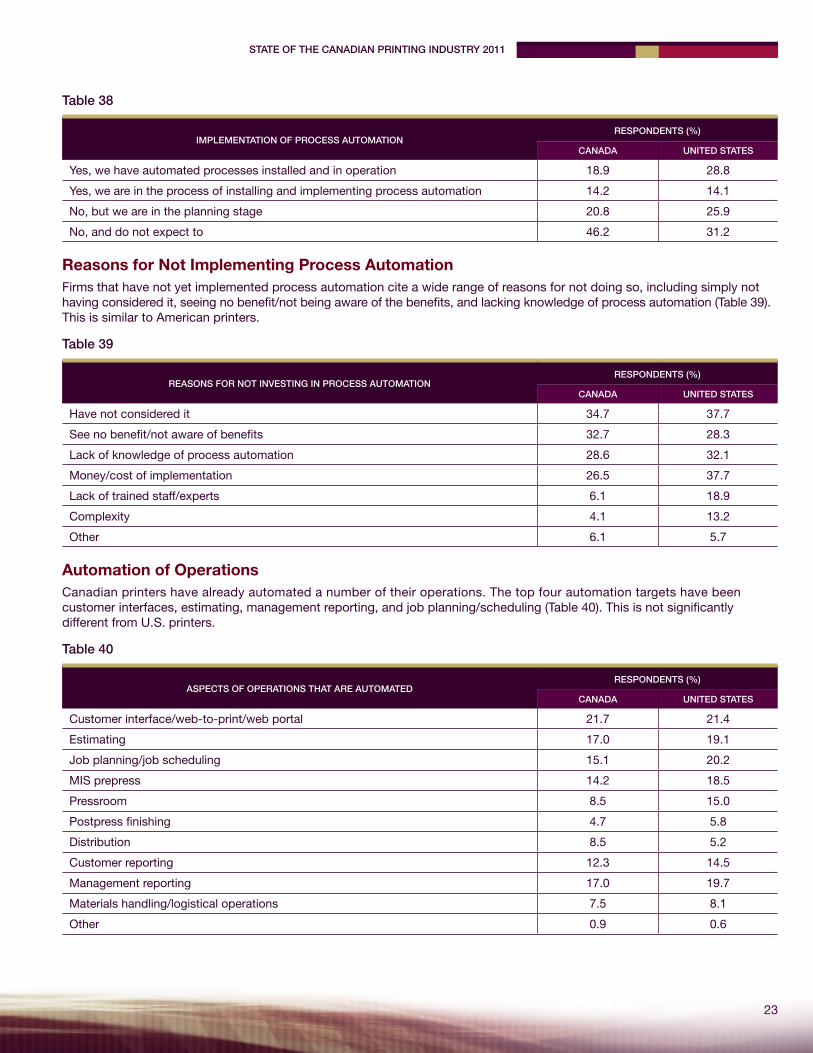
Approximately one in three Canadian printers has either already implemented process automation or is in the process of doing so (Table 38). Another one in five is in the planning stage to implement process automation. These implementation rates are about 10 percent lower than those in the U.S.
STATE OF THE CANADIAN PRINTING INDUSTRY 2011
23
Table 38
IMPLEMENTATION OF PROCESS AUTOMATIONRESPONDENTS (%)
CANADA UNITED STATES
Yes, we have automated processes installed and in operation 18.9 28.8
Yes, we are in the process of installing and implementing process automation 14.2 14.1
No, but we are in the planning stage 20.8 25.9
No, and do not expect to 46.2 31.2
Reasons for Not Implementing Process AutomationFirms that have not yet implemented process automation cite a wide range of reasons for not doing so, including simply not having considered it, seeing no benefit/not being aware of the benefits, and lacking knowledge of process automation (Table 39). This is similar to American printers.
Table 39
REASONS FOR NOT INVESTING IN PROCESS AUTOMATIONRESPONDENTS (%)
CANADA UNITED STATES
Have not considered it 34.7 37.7
See no benefit/not aware of benefits 32.7 28.3
Lack of knowledge of process automation 28.6 32.1
Money/cost of implementation 26.5 37.7
Lack of trained staff/experts 6.1 18.9
Complexity 4.1 13.2
Other 6.1 5.7
Automation of OperationsCanadian printers have already automated a number of their operations. The top four automation targets have been customer interfaces, estimating, management reporting, and job planning/scheduling (Table 40). This is not significantly different from U.S. printers.
Table 40
ASPECTS OF OPERATIONS THAT ARE AUTOMATEDRESPONDENTS (%)
CANADA UNITED STATES
Customer interface/web-to-print/web portal 21.7 21.4
Estimating 17.0 19.1
Job planning/job scheduling 15.1 20.2
MIS prepress 14.2 18.5
Pressroom 8.5 15.0
Postpress finishing 4.7 5.8
Distribution 8.5 5.2
Customer reporting 12.3 14.5
Management reporting 17.0 19.7
Materials handling/logistical operations 7.5 8.1
Other 0.9 0.6

STATE OF THE CANADIAN PRINTING INDUSTRY 2011
24
Job Definition Format Survey respondents were asked, “Is Job Definition Format used by any of the systems you’ve automated?” Almost four out of ten respondents answered yes (Table 41). These rates almost double those of U.S. printers.
Table 41
JOB DEFINITION FORMAT USAGERESPONDENTS (%)
CANADA UNITED STATES
Yes 37.1 22.5
Not Sure 11.4 23.9
No 51.4 53.5
Note: Based on respondents who reported implementing process automation
Although the sample size of printers in both Canada and the U.S. that use Job Definition Format (JDF) is rather small, one conclusion can be drawn: most enterprises that use JDF do so to connect devices within a department, or two or more departments within a plant (Table 42). Complete system integration — from customer order to delivery or end-to-end workflow between multiple plants — is not yet widely used in either country.
Table 42
PURPOSE OF JDF USAGERESPONDENTS (%)
CANADA UNITED STATES
Connect two or more devices in a department 53.8 25.0
Connect two or more departments within a plant 23.1 56.3
Automate the entire plant operation from customer to delivery 15.4 6.3
Automate more than one plant and workflow between plants - -
All of the above plus automation at or with the customer 7.7 12.5
Staff KnowledgeThe level of printing firm staff knowledge of Job Definition Format (JDF) is relatively low. Almost 70 percent of respondents rated their staff as not knowledgeable about JDF (Table 43). This is similar to American responses.
Table 43
STAFF KNOWLEDGEABLE CONCERNING JDFRESPONDENTS (%)
CANADA UNITED STATES
Yes 31.1 34.4
No 68.9 65.6
Plans to Automate Other Aspects of OperationsThe survey found that 43.4 percent of respondents expect to automate any (or additional) aspects of their operations, compared to 59.5 percent of American respondents (Table 44).

STATE OF THE CANADIAN PRINTING INDUSTRY 2011
25
Table 44
PLANS TO AUTOMATE OTHER ASPECTS OF OPERATIONS
RESPONDENTS (%)
CANADA UNITED STATES
Yes, in this fiscal year 11.3 22.1
Yes, in the next two years 18.9 22.7
Yes, but in long-range planning 13.2 14.7
Not sure 24.5 20.9
No 32.1 19.6
3.10 Investment PrioritiesFor the most part, investment rankings of Canadian printers are generally similar to American printers (Table 45). Canadian and American printers share the same view on the top priority investment areas (new equipment and sales force development), but differ in their rankings of subsequent investment priorities. American printers ranked marketing and advertising (14.5%) and web-to-print/digital storefronts (13.8%) higher than Canadian printers (10.4% and 8.5%, respectively), while printers in Canada placed greater priority on training (7.5%) than those in the U.S. (2.6%). For more details on respondents’ ranking of investment priorities, see Annex.
Table 45
HIGHEST PRIORITY INVESTMENT IN THE NEXT TWO YEARSRANKING (%)
CANADA UNITED STATES DIFFERENCE
Adding new equipment/equipment replacement 29.2 28.9 0.3
Sales force development 16.0 16.4 -0.4
Marketing and advertising 10.4 14.5 -4.1
Automation 9.4 9.2 0.2
Mergers and acquisitions 9.4 6.6 2.8
Web-to-print/digital storefronts 8.5 13.8 -5.3
Training 7.5 2.6 4.9
Hiring/staff expansion 4.7 2.6 2.1
New service offerings (such as adding mail list management or digital printing)
4.7 4.6 0.1
3.11 Business ConditionsThe past few years have been challenging for print markets. Survey respondents were asked about their business environment over the past few years and the major drivers of change (Table 46). Canadian printer responses generally correspond to those of the U.S. This finding is not surprising, given the fairly close integration of the printing industries within the two countries (see Annex for further details concerning business conditions).

STATE OF THE CANADIAN PRINTING INDUSTRY 2011
26
Table 46
BUSINESS CONDITIONS ALL RESPONDENTS (%)
Sales: % change (2010 vs. 2009) 4.4
Sales: % change (2006 vs. 2005) 9.3
Sales Expectations: % change 2011 vs. 2010 7.2
Profitability: Profit as a % of sales (2010) 9.3
Profitability: Profit as a % of sales (2006) 10.1
Profitability in fourth quarter 2010 vs. third quarter 2010
Increasing 37.6
Decreasing 23.8
No Change 38.6
Index 13.9
Printing Prices: % change January 2011 vs. January 2010 -1.4
Wages/Salaries: % change in 2010 vs. 2009 2.9
Expectations for second quarter 2011 1.1
Paper Prices: % change in 2010 vs. 2009 3.5
Expectations for second quarter 2011 2.2
Employee Health Benefits: % change January 2011 to January 2010 1.2
Expectations for second quarter 2011 0.6
Energy/Utilities: % change in 2010 vs. 2009 6.0
Expectations for second quarter 2011 4.0
� Sales
Printers’ sales in both Canada and the U.S. increased in 2010 compared to their 2009 lows. On average, Canadian printers reported sales increases of 4.4 percent despite continued declining printing prices (-1.4%). Expectations are for sales to continue to improve over 2011; on average, respondents expect sales to increase by 7.2 percent. A total of 62 percent of respondents reported sales increasing in 2010 and 73 percent of respondents expect sales to improve in 2011.
� Profitability
Generally, printers’ profits in both Canada and the U.S. have declined over the last few years due to both the recession and competition from digital media. These pressures are reflected in the survey findings. Profit rates as a percentage of sales are down from 2006, but appear to be stabilizing.
� Prices and Cost
In today’s market environment, printers are being pressured from two sides. Customers are reacting to the prices set by printers with considerable pushback, while costs for various materials and labour from suppliers are on the rise. The survey data reflect these two trends, with respondents describing declining printing prices and increases in cost for various line items as part of the current business environment.
EmploymentTwo major forces have combined over the last few years to induce printers to reduce headcount: sales pressures from the difficult economy, and productivity improvements from technology. However, survey respondents have experienced generally stable employment levels over the past year and expect this trend to continue in 2011 (Table 47).

STATE OF THE CANADIAN PRINTING INDUSTRY 2011
27
Table 47
EMPLOYMENT LEVELSRESPONDENTS REPORTING (%)
THIRD QUARTER TO FOURTH QUARTER 2010 EXPECTED 2011
Increase more than 10% 5.8 8.7
Increase 5 to 10% 1.0 9.7
Increase less than 5% 6.8 17.5
No change 67.0 51.5
Decrease less than 5% 7.8 8.7
Decrease 5 to 10% 2.9 2.9
Decrease more than 10% 8.7 1.0
Index -5.8 23.3
Capital Spending Trends Sales and pricing pressures together make investment decisions extremely difficult for printers. However, to remain competitive, printers must continue to invest. About half of survey respondents reported no change in their investment spending in 2010 compared to 2009 levels (Table 48). However, more respondents increased investment spending than decreased it (16.8% more reported increases compared to decreases). Expectations for 2011 are for a slight increase in capital spending, with a four percent increase in the 2011 expectations index compared to the 2010 actual index (21.2% – 16.8% = 4.4% increase).
Table 48
CAPITAL SPENDING CHANGE IN 2009–2010 (%) EXPECTED CHANGE IN 2010–2011 (%)
Increase more than 10% 15.8 10.1
Increase 5 to 10% 10.9 10.1
Increase less than 5% 6.9 17.2
No change 49.5 46.5
Decrease less than 5% 5.0 7.1
Decrease 5 to 10% 3.0 3.0
Decrease more than 10% 8.9 6.1
Index 16.8 21.2
Credit ConditionsCredit upheavals over the past few years have also been troublesome for printers. Challenges encountered include access to working capital and funds for investment. However, most printers reported they do not see a negative (or positive) impact (Table 49). Approximately one in three reported a negative impact. Credit conditions have had a more damaging effect on American printers with 42 percent reporting a negative impact.
Table 49
IMPACT OF CURRENT CREDIT CONDITIONSRESPONDENTS (%)
CANADA UNITED STATES
Significant negative impact 7.9 17.3
Moderate negative impact 21.8 24.7
Neither positive or negative impact 62.4 52.5
Moderate positive impact 6.9 4.3
Significant positive impact 1.0 1.2
Index -21.8 -36.4

STATE OF THE CANADIAN PRINTING INDUSTRY 2011
28
4. Overview of Key Trends and ImplicationsAs the survey findings indicate, Canadian print markets are notably segmented and diversified in both technical processes and business conditions. They also remain under considerable stress, even as the North American economy and print markets recover from the global recession.
4.1 Key TrendsThe most significant issue facing the printing industry is the role print will play in the increasingly digital environment. Will print products and services be able to hold or grow sales and market share, or will those decline? Will printers be able to change their strategies and business models to adjust to the evolving environment? The answers to these questions will determine the future of print.
To examine the core drivers of why print and what is printed, the source of demand — the functionality of print — must be examined.
Although many print products and services provide multiple functions, data on shipments and plants can be categorized into three major functions:
� Print intended to inform or communicate factual and editorial information, such as magazines, newspapers, books and reports
� Print that provides product logistics for manufactured products — packaging, labels, wrappers and product user manuals
� Print intended to market, promote or sell various products, services, political candidates, positions, or ideas — marketing and promotional print such as catalogues, direct mail and brochures
Of these three functions, only one — print logistics — is not subject to competition and substitution by digital media. Conversely, print’s inform/communicate function is subject to the highest risk of substitution from digital media. Print as a marketing, promotion and sales medium appears to be in the middle.
According to a Printing Industries of America analysis, the functional breakdown of U.S. print markets in 2009 (Figure 2) was as follows:
Print as a marketing/promotional medium remains the primary function, accounting for just over half of all shipments. The inform/communicate function is second largest (27.4%), while product logistics account for 19.8 percent. Most likely, given the integration of Canadian and American print markets, the numbers for Canada are similar.
A look back at the past ten years reveals significant differences in shipment trends for each function (Figure 3). It should be noted that this time frame encompasses the period of the global recession, thus the numbers are not representative of a more positive period. The inform/communicate function shows the largest decline in nominal shipments — down 15.7 percent or approximately 1.5 percent per year, on average. Marketing/promotion print has remained fairly stable with a decline of just 1.8 percent over the 10-year period. In contrast, product logistics shipments have grown by 5.1 percent.
PRINT BY FUNCTION2009 U.S. SHIPMENTS (%)
Figure 2
Product logistics
Marketing/promotionInformation/communication
19.852.8
27.4

STATE OF THE CANADIAN PRINTING INDUSTRY 2011
29
This pattern conforms to the earlier observation that of the three functions, only product logistics is not subject to competition and substitution by digital media, while the inform or communicate function is subject to the highest risk. Also in line with previous observations, print as marketing, promotion, and sales media falls in the middle in terms of competitive substitution.
As for print processes, Printing Industries of America’s tracking of North American print markets reveals that, for the past decade, digital print (toner-based and inkjet) has grown at the expense of traditional ink-on-paper print. Furthermore, printers’ shipments of ancillary services such as mailing, fulfillment, warehousing, database management and other services have also grown faster than traditional ink-on-paper shipments.
Printing Industries of America’s most recent detailed analysis of U.S. print markets demonstrates that conventional ink-on-paper (including sheetfed lithographic offset, web offset, letterpress, gravure, and flexography) remains the dominant print process, accounting for almost 75 percent of total revenues (Figure 4). Digital technologies and ancillary services account for the remaining sales, about 25 percent of total sales.
Over the last few years, digital and ancillary services have gained at the expense of offset printing. This shift is due primarily to improvements in digital technologies, increased targeting and personalization that have reduced run lengths, and expansion of the typical business model to include additional related services.
Another indication of the growth of digital printing is that more and more print work — or jobs — now combine both conventional and digital technologies. Approximately one in ten jobs is now so composed, and sales leaders (printers in the top quartile of sales growth) are even more inclined to combine the two technologies in individual jobs (Figure 5).
SHIPMENT CHANGE 1999–2010 BY PRINT FUNCTION (%)
-15-20 -10 -5 0 5 10
Figure 3
Information/communication
Marketing/promotion
Product logistics
PRINT BY PROCESS2009 U.S. SHIPMENTS (%)
Figure 4
Digital
ConventionalAncillary
13.074.9
12.1

STATE OF THE CANADIAN PRINTING INDUSTRY 2011
30
According to recent surveys, new digital print jobs come from three sources: transfers from conventional jobs, new jobs from existing customers, and new jobs from new customers (Figure 6). Regardless of the origin of digital printing growth, new digital technology is not only replacing conventional technology but is also creating entirely new printing demand.
Another key trend is the ongoing restructuring of printing firms and plants. As printing firms go out of business through liquidations, mergers, consolidations and bankruptcies, the number of firms sharing the market is dwindling. Thus, even in periods of declining total industry sales, surviving firms may see increased sales.
This outcome is demonstrated in the chart below reflecting U.S. trends from 1999 to 2009 for remaining plants (Figure 7). Sales growth rates by plants for all functions were healthy over this period.
DIGITAL AND LITHO JOBS
TOTAL JOBS USING BOTH PROCESSES (%)
0 5 10 15 20 25
Figure 5
All
Sales Leaders
Sales Laggards
SOURCE OF DIGITAL PRINTING GROWTH
DIGITAL PRINTING JOBS (%)
Figure 6
Transfer
New jobs/existing customers
New jobs/New clients28
26
46
UNITED STATES SURVIVOR SALES 1999–2009
CHANGE IN SHIPMENTS (%)
0 10 20 30 40 50
Figure 7
Information
Marketing
Logistics
All Print

STATE OF THE CANADIAN PRINTING INDUSTRY 2011
31
4.2 The Next Two YearsThe outlook for the North American economy for 2011 through to 2013 predicts modest to fairly robust growth. In fact, inflation-adjusted Gross Domestic Product (GDP) will likely grow by 3.3 percent in 2011 — the highest rate since 2004, when it grew 3.6 percent. Looking further out to 2012, Printing Industries of America forecasts inflation-adjusted GDP to grow 3.7 percent — the highest annual growth rate since 2000 (4.1%).
Other less likely scenarios include a sluggish recovery and a return to recession (“double dip”). While less likely, these scenarios should be considered as possible alternatives for planning purposes, if conditions change. The fact that the economy has gained traction and has achieved a growth rate above the less than two percent “stall speed” is a strong sign that the risk of a quick return to recession has decreased.
If the most likely economic outlook unfolds as projected, the printing industry is heading into an ideal situation of the economic cycle — the mature recovery phase. If the economy performs as projected, print markets should grow by approximately three percent in 2011 and 2012, based on the typical lag between the economy and print markets in recovery periods (Figure 8). However, even with the recovery achieved in 2010 and the projected dollar volumes of 2011 and 2012, printing shipments will remain below pre-recession levels.
Printing PricesPrinters will face continued conflicting pressures with cost increases from suppliers and price sensitivities from customers. Most likely, printing prices will remain fairly stable, with some passing on of cost increases.
Survivors’ SalesOver the past few decades the number of printing plants in North America has decreased, as the industry has restructured in response to both declining demand and increased productivity from technological change. As a result, surviving plants have experienced sales increases — even in years with decreasing total print sales — as they capture the market share of exiting plants (Figure 9). This conflicting pattern will continue.
SURVIVORS VS. THE MARKET CHANGE IN SHIPMENTS (2011–2012) (%)
-5 0 5 10 15 20
Ancillary Digital Conventional Total
Figure 9
Survivors
Market
Likely Rebound Sluggish Recovery Double Dip
-1
0
1
2
3
PRINT SCENARIOS 2011–2012 CHANGE IN SHIPMENTS (%)
2011 2012
Figure 8

STATE OF THE CANADIAN PRINTING INDUSTRY 2011
32
Printers’ ProfitsPrinting firms’ profits tend to lag both print sales and the economy. As the economy continues to recover, print profits should continue to rebound over the next two years. Printing Industries of America’s projections estimate that overall industry profit rates will rebound to approximately two percent and profit leaders’ rates to over nine percent in 2011, and to three percent and ten percent, respectively, in 2012.
4.3 Emerging Risks and ChallengesAs discussed so far in this report, the outlooks for the overall economy and print markets are generally optimistic; however, numerous risks do exist that can have profound effects on print markets and printing firms.
Risk: Inflation Escalates Overall inflation currently remains in check, but signs of price escalation are increasing — particularly with food and industrial commodities, including oil (see below). In fact, price escalation is the primary economic risk factor for the next two years.
� Impact on Print Markets and Printers
Input prices are likely to rise over the near term, as are wage and salary pressures later on. Paper, ink and other materials comprise about 30 percent of costs and could escalate. As well, as the cost of fuel goes up, delivery costs will rise substantially. Printers need to be prepared for this, and focus on waste and spoilage and other efficiencies to reduce materials cost. Delivery surcharges may also reappear.
Printers must remain cautious in their spending, continue to conserve cash, and thoroughly evaluate possible investments. However, at the same time, they must remain focused on building a sustainable business model and invest in training and education for their key staff.
Risk: Oil Price Shock In addition to fuel price implications discussed above, oil price escalation caused by both inflation pressures and, more significantly, the changing values of currencies, is a significant threat. Further, escalating tensions in the Middle East are extremely worrisome. Beyond increasing inflation lies the risk of another recession caused by oil price increases that reduce consumer and business spending. The more general economic result could be a return to recession combined with inflation.
� Impact on Print Markets and Printers
Printers should not become overly entrenched with the recovery and increased print sales. The recovery could crash from an “oil shock.” Firms should remain cautious on spending and investments.
Risk: Interest Rates Rise Substantially If prices begin rising beyond current rates and inflation expectations increase accordingly, interest rates will also rise. Rising interest rates could begin to slow the pace of expansion and even lead to a slowdown in economic activity.
� Impact on Print Markets and Printers
Again, caution is in order regarding spending, cash outlays, and investment.
Risk: Economic Decline Although the North American economy has achieved growth rates above the two percent “stall speed” over the past few quarters of 2010, the issue of sustainability remains. In particular, any of the above disruptions could destabilize the trajectory of the economy and send it back into recession.
� Impact on Print Markets and Printers
Printers will have to be flexible, careful about long-term commitments, and use caution regarding spending and investments.
While the outlook is for the economic recovery to gain momentum over the next two years and pull print markets along, a number of potential challenges lie ahead that could be disastrous. Any one of them could derail the economic recovery and if actualized, likely have a ripple effect.
Printers must remain extremely vigilant and flexible in planning and implementing programming over this tenuous period.

STATE OF THE CANADIAN PRINTING INDUSTRY 2011
33
4.4 Planning Insights Canadian printers face an interesting future, particularly in the next two years. In general, improved economic and print market conditions in North America should increase demand for print and related services from Canadian printers. Additional planning considerations include:
� Optimism with caution
While the projected path of the economy and print markets is an upswing, the future perspectives are uncertain. Canadian printers must be prepared for another downturn even as conditions improve.
� Flexibility and rapid adaptation
The economy and print markets are characterized by a certain instability. Therefore, accepting constant change is essential. Hence, market vigilance and quick decision making are crucial. The ability to spot and quickly capitalize on emerging market opportunities is more important than ever.
� Rapid transition to value added service
A key action printers can take to thrive (and in many cases survive) is to migrate the value-added benefits they offer onto a more sustainable path of non-print value-added ancillary services, solutions, and management services. Printers must focus on transitioning their product mix to include broader, value-added services.
� Promising future
Despite the abundance of negative news about sales declines, firm liquidations and bankruptcies, and other issues of the past few years, the printing sector has a role to play in the Canadian economy.
4.5 The Longer Run — Future of PrintAs for the longer term, two possible futures can be considered. One is based on the continuation of current trends; this future anticipates the continued shrinking of the print industry’s economic footprint over the coming decades. While this future is somewhat negative overall, it does have extenuating positive elements. These include the fact that the print industry’s current economic footprint is large, and even with the decline, print will remain a large North American industry for many years. As industry sales shrink, the number of printing firms is also projected to dwindle at an even faster pace. And while the industry’s overall economic footprint shrinks, various niche, product, and functional sectors will grow. Many industry survivors can still look forward to increasing revenues and continued opportunities.
An examination of print’s life cycle shows a decidedly complex nature rather than simple maturity or decline:
� Print’s overall life cycle has moved from growth, to mature, to possibly a declining position.
� A more nuanced picture emerges when life cycles are examined by process, product and function. While some of these elements of print are mature or declining, many remain in the growth phase.
� While all print sectors could be characterized as competitive, some sectors score significantly higher or lower in competitive intensity.
� On both a life cycle and competitive intensity measure, plenty of opportunity remains in the printing industry.
� Even in mature and declining sectors, management strategies and techniques exist for firms to improve their performance and succeed for a long period of time.
The other possible future for print is much more optimistic. It envisions a return to long-run growth sometime in the next decade or so. This competing future, of course, offers significant advantages. For this future to be realized, a number of conditions must come into play, including:
� postal service adjustments, with North America’s two major postal services becoming more “marketing” focused
� print logistics underpin growth
� digital print continues to grow

STATE OF THE CANADIAN PRINTING INDUSTRY 2011
34
� printers’ ancillary services remain strong
� information-based print eventually stabilizes
� print becomes a premium medium and marketing-based print grows
� saturation from digital media helps print
� increased productivity and efficiencies push real printing cost down
� targeted and personalized print marketing and promotion intensifies
While all of the above factors may not come to pass, if most or even a few actually unfold, total inflation-adjusted printing shipments may actually turn around and grow again.
Regardless of the exact path, many printers will still thrive. For example, even if industry sales decline by two percent and industry firms decline by three percent, survivors will actually experience, on average, a sales increase of one percent. Sales leaders (printers in the top quartile of sales growth) could easily see annual sales increase far in excess of the average. In this example scenario, sales leaders might see sales gains of well over five percent.
Today’s printing firms can be profiled in terms of their likelihood of surviving the competitive race for the future. Using Printing Industries of America’s Ratios9 data on printers’ financial performance four distinct competitive classifications can be defined:
� SuperPrinters
Printers in the top quartile of profitability that typically earn above six to seven percent on sales. These printers will survive and thrive.
� Survivors
Printers in the third quartile of profitability that are making a profit, perhaps two to five percent on sales. These printers are not in the profit-leading group, but will likely survive.
� At-risk printers
Printers in the second quartile of profitability that are barely breaking even or are losing money and have a high risk of going out of business.
� Expendables
Printers in the bottom quartile of profitability that are experiencing losses on a continuing basis and will most likely go out of business.
4.6 Looking Forward — Competitive Strategies and Tactics To take advantage of the opportunities discussed above, printers must make choices regarding strategies, business models, tactics and other decisions.
Strategies and Business Models to Improve PerformanceTwo key strategy choices — specialization and diversification — improve profitability (as outlined in Section 3.4). Printing firms can specialize by focusing on a particular print segment (e.g., labels/wrappers), customer segment or vertical market (e.g., hotels/resorts), or even a hybrid of these targeting a particular customer segment with a specific product offering. Alternatively, firms can diversify by offering value-added services ancillary in addition to the printed product in order to increase profit. Integrating these two strategic options into a specialized diversification strategy enhances profitability by enabling printers to decrease costs and increase selling prices.
Another strategic issue involves how printers select and design business models for their organizations (niche printer specializing in a market segment, general commercial printer and communications provider offering a complete set of value-added services).
9 Printing Industries of America Ratios are the industry’s benchmarking tool for measuring individual company financial performance against industry averages and profit leaders

STATE OF THE CANADIAN PRINTING INDUSTRY 2011
35
Aligning Business and Sales ModelsA key step for printers in implementing a successful business model is to align sales models with business models. A printer’s organizational and operating structure is closely tied to the types of products and services sold — and misalignment can affect success.
Traditionally, general commercial printers have successfully employed the standard sales force model, as it aligns well with selling longer-run single print jobs. In contrast, other sales models are more appropriate for different business models. Shorter-run digital-based jobs are better aligned with a web-based sales model; in a similar manner, product and service niche providers and marketing services provider printers are better served by a solutions selling sales model.
As printers gravitate to more sophisticated business models, they must also shift to implement appropriate and consistent sales models. This usually means an entirely new sales compensation system based on different incentives and training — and perhaps even a new sales force.
Multi-process and Hybrid AdvantagesA multi-process capability — offering digital toner-based printing as well as sheetfed printing — offers a distinct sales advantage. Sales leaders (printers in the top quartile of sales growth) note a much larger proportion of their sales as coming from combination digital and sheetfed jobs, compared to all printers and sales laggards (printers in the bottom quartile of sales growth).
Another competitive advantage that printers can achieve through business model design is the hybrid advantage. Printers with business models that combine multiple printing processes (specifically lithographic printing and digital printing — toner and inkjet — plus mailing services) have demonstrated a sales advantage over single-process printers that do not offer mailing services.
Profit Impacts Business model choice can enhance profitability. General commercial printers are less profitable than other printers, while the most profitable printers are vertical niche printers, followed by product niche printers and communications providers (Figure 10). These latter three strategic choices are approximately twice as profitable as general commercial printers.
Key Practices of SuperPrintersPrinters in the top quartile of profitability — superprinters — employ various tactics that improve their bottom line. In brief, these practices include:
� Striving for Manufacturing Efficiency
Superprinters produce more efficiently. Typically, they are approximately three percent more efficient than other printers in producing the actual printed product, and this affects the bottom line. Sources of manufacturing efficiency include using appropriate technology, placing an emphasis on workflow efficiency, reducing production headcounts to right-size operations to seasonal sales patterns, and benchmarking against industry leaders.
All Productniche
Verticalniche
Generalcommercial
Communicationsprovider
2
4
6
8
10
PROFIT RATES BY BUSINESS MODELFIRST QUARTER 2010 (%)
Figure 10

STATE OF THE CANADIAN PRINTING INDUSTRY 2011
36
� Enforcing Support Efficiency
Superprinters are also more efficient in support activities — factory, administrative and selling support. The difference here is even more significant than in manufacturing efficiency: they are 12 percent more efficient in this area. Again, sources of this efficiency include using technology, reducing support headcounts to right-size the organization, and benchmarking.
� Being a Learning Organization
Superprinters spend more than other printers in only one area: education and training. They spend more than twice the percentage of payroll on training and education. Further, they provide training and education to all types of employees — production, technical, administrative, sales and management.
� Sharing the Wealth
They are more likely to offer bonuses and profit-sharing programs. And, profit leaders are more likely to include all types of employees in these programs.
� Moving to Ancillary Services
An emerging key to profitability is the provision of ancillary services. Ancillary services account for approximately 10 percent of total print revenues and are projected to account for a larger share in the coming years. Some estimates claim that for every marketing dollar spent on print, another five dollars are devoted to ancillary services. Printers looking for growth are increasingly focusing on these ancillary services. By combining ancillary services with a specialized print focus, superprinters have a strategy of a “specialized yet diversified” value provider.
Pricing PowerFor some time, the printing industry has seen a disparity between two competing views of pricing. In summary, these views are:
� Demand or market-based pricing
In this view, demand is the focus of pricing and printers feel prices should be set at “what the market will bear.”
� Cost-based pricing
This view of pricing holds that printers need to price from a “cost plus” approach. Key to this approach is an accurate assessment of true cost, which is then combined with a reasonable mark-up for profits.
Which approach is best? The answer is “both.” The two approaches should actually be combined to attain effective pricing. More importantly, to increase profits, printers must practice power pricing. Many firms compete on price. Profit leading firms compete for price. They specifically seek to augment their business volume by developing the ability to charge higher prices than their competitors, with power pricing.
Shown in other published work by Printing Industries of America, a one-percent increase in price outscores similar percentage changes in sales or cost in terms of profit impact. In fact, the impact on profit of a one-percent increase in price is approximately three times greater than cutting costs of materials or increasing sales.
10 Printers in the top quartile of profitability

STATE OF THE CANADIAN PRINTING INDUSTRY 2011
37
5. Final RemarksWhile Canadian printers face numerous challenges in both the short and long term, significant opportunities do exist. Those Canadian printers that understand the challenges and make the difficult choices of strategy selection and tactical implementation can position their firms to take advantage of the coming opportunities.
Canadian printers are extremely varied in terms of size, printing processes and technologies, service offerings and business models. The North American printing industry does not have a “one size fits all” approach to success; however, distinct strategies and tactics can be deliberately selected that are most likely to correlate with future strength and survival.
At the core of print’s survival lies the functionality of print:
� Print intended to inform or communicate factual and editorial information;
� Print providing product logistics to manufactured products; and
� Print intended to market, promote or sell various products or services.
Canadian printers need to evaluate their product and service offerings in light of these functions and determine their immediate and future market opportunities and threats.
The ongoing restructuring of printing firms and plants is another key trend affecting printers. As printing firms go out of business due to liquidations, mergers, consolidations and bankruptcies, the market is shared by a dwindling number of firms. Thus, even in periods of declining total industry sales, the industry may see increased sales and profits.
Within this dynamic macro environment, printers must make key strategic decisions to improve performance and profitability, and to increase their chances for future survival. Firms can specialize by focusing on a particular market segment. Alternatively, firms can diversify by offering additional value-added services ancillary to the printed product in order to increase profit.
Printers must also adopt appropriate business models for their organizations. The most common business models are as follows:
� Niche printer specializing in a narrow print product segment such as labels/wrappers;
� Niche printer specializing in a narrow vertical market segment or specific industry such as travel and entertainment; and
� Communications provider offering a complete set of value added services including printing, database management, fulfillment and mailing.
The appropriate organizational and operating structure to successfully sell print products and services is very much tied to the types of products and services sold, and to the business model employed. Superprinters10 employ various tactics that improve their bottom line. These include: efficient production and administrative support processes, focus on education and training, offer bonuses and profit-sharing programs, and provide ancillary services.
Canadian printers that focus on these strategies and tactics should be able to manage a successful transition to the future.
10 Printers in the top quartile of profitability
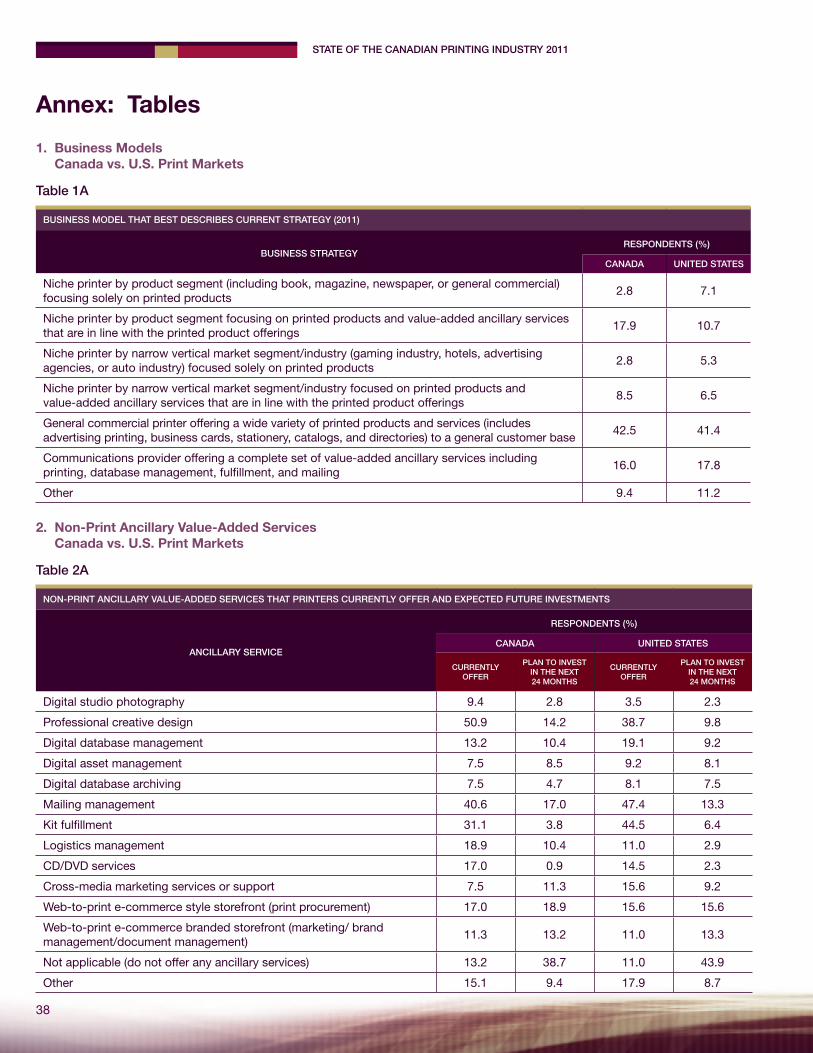
STATE OF THE CANADIAN PRINTING INDUSTRY 2011
38
Annex: Tables
1. Business Models Canada vs. U.S. Print Markets
Table 1A
BUSINESS MODEL THAT BEST DESCRIBES CURRENT STRATEGY (2011)
BUSINESS STRATEGYRESPONDENTS (%)
CANADA UNITED STATES
Niche printer by product segment (including book, magazine, newspaper, or general commercial) focusing solely on printed products
2.8 7.1
Niche printer by product segment focusing on printed products and value-added ancillary services that are in line with the printed product offerings
17.9 10.7
Niche printer by narrow vertical market segment/industry (gaming industry, hotels, advertising agencies, or auto industry) focused solely on printed products
2.8 5.3
Niche printer by narrow vertical market segment/industry focused on printed products and value-added ancillary services that are in line with the printed product offerings
8.5 6.5
General commercial printer offering a wide variety of printed products and services (includes advertising printing, business cards, stationery, catalogs, and directories) to a general customer base
42.5 41.4
Communications provider offering a complete set of value-added ancillary services including printing, database management, fulfillment, and mailing
16.0 17.8
Other 9.4 11.2
2. Non-Print Ancillary Value-Added Services Canada vs. U.S. Print Markets
Table 2A
NON-PRINT ANCILLARY VALUE-ADDED SERVICES THAT PRINTERS CURRENTLY OFFER AND EXPECTED FUTURE INVESTMENTS
ANCILLARY SERVICE
RESPONDENTS (%)
CANADA UNITED STATES
CURRENTLY OFFER
PLAN TO INVEST IN THE NEXT 24 MONTHS
CURRENTLY OFFER
PLAN TO INVEST IN THE NEXT 24 MONTHS
Digital studio photography 9.4 2.8 3.5 2.3
Professional creative design 50.9 14.2 38.7 9.8
Digital database management 13.2 10.4 19.1 9.2
Digital asset management 7.5 8.5 9.2 8.1
Digital database archiving 7.5 4.7 8.1 7.5
Mailing management 40.6 17.0 47.4 13.3
Kit fulfillment 31.1 3.8 44.5 6.4
Logistics management 18.9 10.4 11.0 2.9
CD/DVD services 17.0 0.9 14.5 2.3
Cross-media marketing services or support 7.5 11.3 15.6 9.2
Web-to-print e-commerce style storefront (print procurement) 17.0 18.9 15.6 15.6
Web-to-print e-commerce branded storefront (marketing/ brand management/document management)
11.3 13.2 11.0 13.3
Not applicable (do not offer any ancillary services) 13.2 38.7 11.0 43.9
Other 15.1 9.4 17.9 8.7

STATE OF THE CANADIAN PRINTING INDUSTRY 2011
39
Table 2B
LENGTH OF TIME NON-PRINT ANCILLARY VALUE-ADDED SERVICES OFFERED IN CANADA
ANCILLARY SERVICERESPONDENTS (%)
LESS THAN 1 YEAR 1 TO 2 YEARS 2 TO 5 YEARS 5 PLUS YEARS
Digital studio photography 30.0 10.0 20.0 40.0
Professional creative design 3.8 7.5 17.0 71.7
Digital database management 21.4 7.1 42.9 28.6
Digital asset management 12.5 25.0 25.0 37.5
Digital database archiving 12.5 12.5 25.0 50.0
Mailing management 9.3 20.9 32.6 37.2
Kit fulfillment 6.1 24.2 18.2 51.5
Logistics management 27.8 16.7 16.7 38.9
CD/DVD services 5.3 10.5 42.1 42.1
Cross-media marketing services or support 50.0 25.0 25.0 -
Web-to-print e-commerce style storefront 16.7 33.3 11.1 38.9
Web-to-print e-commerce branded storefront
15.4 38.5 23.1 23.1
Table 2C
LENGTH OF TIME NON-PRINT ANCILLARY VALUE-ADDED SERVICES OFFERED IN THE U.S.
ANCILLARY SERVICERESPONDENTS (%)
LESS THAN 1 YEAR 1 TO 2 YEARS 2 TO 5 YEARS 5 PLUS YEARS
Digital studio photography - 33.3 16.7 50.0
Professional creative design 3.0 12.1 18.2 66.7
Digital database management 9.1 24.2 27.3 39.4
Digital asset management 12.5 18.8 31.3 37.5
Digital database archiving 7.1 21.4 14.3 57.1
Mailing management 1.2 8.5 31.7 58.5
Kit fulfillment 1.3 16.9 27.3 54.5
Logistics management 16.7 11.1 22.2 50.0
CD/DVD services - 12.5 45.8 41.7
Cross-media marketing services or support 29.6 33.3 37.0 -
Web-to-print e-commerce style storefront 11.1 40.7 33.3 14.8
Web-to-print e-commerce branded storefront 5.9 23.5 64.7 5.9

STATE OF THE CANADIAN PRINTING INDUSTRY 2011
40
Table 2D
NON-PRINT ANCILLARY VALUE-ADDED SERVICES EFFECT ON SALES IN CANADA
ANCILLARY SERVICE
RESPONDENTS (%)
INCREASE MORE THAN EXPECTED
AS EXPECTEDLOWER THAN
EXPECTEDTOO SOON
TO TELLDO NOT TRACK
NOT PERMITTED TO PROVIDE
Digital studio photography 10.0 60.0 10.0 20.0 - -
Professional creative design 9.3 53.7 16.7 3.7 14.8 1.9
Digital database management - 35.7 21.4 14.3 28.6 -
Digital asset management 12.5 62.5 12.5 12.5 - -
Digital database archiving - 25.0 50.0 12.5 12.5 -
Mailing management 15.9 47.7 15.9 11.4 6.8 2.3
Kit fulfillment 15.2 60.6 6.1 9.1 9.1 -
Logistics management 10.5 57.9 5.3 21.1 - 5.3
CD/DVD services 10.5 57.9 15.8 5.3 10.5 -
Cross-media marketing services or support
12.5 12.5 37.5 37.5 - -
Table 2E
NON-PRINT ANCILLARY VALUE-ADDED SERVICES EFFECT ON SALES IN THE U.S.
ANCILLARY SERVICE
RESPONDENTS (%)
INCREASE MORE THAN EXPECTED
AS EXPECTEDLOWER THAN
EXPECTEDTOO SOON
TO TELLDO NOT TRACK
NOT PERMITTED TO PROVIDE
Digital studio photography - 83.3 16.7 - - -
Professional creative design 4.5 59.7 16.4 7.5 11.9 -
Digital database management 6.1 42.4 27.3 12.1 3.0 9.1
Digital asset management 12.5 31.3 43.8 12.5 - -
Digital database archiving 14.3 35.7 14.3 14.3 14.3 7.1
Mailing management 11.1 67.9 11.1 2.5 7.4 -
Kit fulfillment 13.2 52.6 17.1 10.5 6.6 -
Logistics management 10.5 47.4 15.8 15.8 10.5 -
CD/DVD services 8.3 45.8 20.8 12.5 12.5 -
Cross-media marketing services or support
7.4 33.3 29.6 29.6 - -

STATE OF THE CANADIAN PRINTING INDUSTRY 2011
41
Table 2F
NON-PRINT ANCILLARY VALUE-ADDED SERVICES EFFECT ON PROFITABILITY IN CANADA
ANCILLARY SERVICE
RESPONDENTS (%)
INCREASE MORE THAN EXPECTED
AS EXPECTEDLOWER THAN
EXPECTEDTOO SOON
TO TELLDO NOT TRACK
NOT PERMITTED TO PROVIDE
Digital studio photography 10.0 50.0 10.0 30.0 - -
Professional creative design 11.1 33.3 20.4 7.4 27.8 -
Digital database management - 28.6 21.4 14.3 35.7 -
Digital asset management - 62.5 25.0 12.5 - -
Digital database archiving - 25.0 50.0 12.5 12.5 -
Mailing management 13.6 36.4 15.9 18.2 15.9 -
Kit fulfillment 15.2 48.5 12.1 9.1 15.2 -
Logistics management 10.5 52.6 10.5 21.1 - 5.3
CD/DVD services 10.5 36.8 21.1 5.3 26.3 -
Cross-media marketing services or support
- 25.0 25.0 50.0 - -
Web-to-print e-commerce style storefont
11.1 55.6 16.7 16.7 - -
Web-to-print e-commerce branded storefront
23.1 46.2 23.1 7.7 - -
Table 2G
NON-PRINT ANCILLARY VALUE-ADDED SERVICES EFFECT ON PROFITABILITY IN THE U.S.
ANCILLARY SERVICE
RESPONDENTS (%)
INCREASE MORE THAN EXPECTED
AS EXPECTEDLOWER THAN
EXPECTEDTOO SOON
TO TELLDO NOT TRACK
NOT PERMITTED TO PROVIDE
Digital studio photography - 33.3 33.3 16.7 - 16.7
Professional creative design 4.5 29.9 23.9 17.9 22.4 1.5
Digital database management 3.0 39.4 18.2 21.2 15.2 3.0
Digital asset management 13.3 40.0 13.3 20.0 13.3 -
Digital database archiving 14.3 21.4 21.4 21.4 14.3 7.1
Mailing management 7.8 55.8 14.3 11.7 9.1 1.3
Kit fulfillment 10.7 40.0 24.0 13.3 10.7 1.3
Logistics management 5.3 31.6 15.8 36.8 10.5 -
CD/DVD services 4.5 27.3 36.4 4.5 27.3 -
Cross-media marketing services or support
11.5 23.1 19.2 38.5 7.7 -
Web-to-print e-commerce style storefont
7.7 46.2 23.1 15.4 7.7 -
Web-to-print e-commerce branded storefront
15.8 36.8 21.1 15.8 10.5 -

STATE OF THE CANADIAN PRINTING INDUSTRY 2011
42
Table 2H
SHARE OF SALES OF ANCILLARY SERVICES
ANCILLARY SERVICE
CANADA UNITED STATES
AS A SHARE OF YOUR BUSINESS (%) AS A SHARE OF YOUR BUSINESS (%)
INCREASING DECREASING NO CHANGE INCREASING DECREASING NO CHANGE
Cross-media marketing services or support 75.0 - 25.0 59.3 7.4 33.3
Kit fulfillment 62.5 6.3 31.3 45.3 9.3 45.3
Mailing management 61.4 9.1 29.5 63.8 11.3 25.0
Digital studio photography 60.0 10.0 30.0 - 50.0 50.0
Logistics management 57.9 - 42.1 57.9 10.5 31.6
Digital database management 38.5 23.1 38.5 60.6 6.1 33.3
Professional creative design 37.7 22.6 39.6 41.8 16.4 41.8
CD/DVD services 36.8 15.8 47.4 25.0 20.8 54.2
Digital asset management 28.6 42.9 28.6 43.8 12.5 43.8
Digital database archiving 12.5 37.5 50.0 50.0 7.1 42.9

STATE OF THE CANADIAN PRINTING INDUSTRY 2011
43
3. Ranking of Investment Priorities Canada vs. U.S. Print Markets
Table 3A
INVESTMENT PRIORITIES
RANKING OF INVESTMENT PRIORITIES
CATEGORIES
A Adding new equipment/equipment replacementB AutomationC Hiring/Staff expansionD Marketing and advertisingE Mergers and acquisitionsF New service offerings (such as adding mail list management or digital printing)G Sales force developmentH TrainingI Web-to-print/digital storefronts
CANADA
RANKING
CATEGORIES
RESPONDENTS (%)
A B C D E F G H I
1 (Most Important) 29.2 9.4 4.7 10.4 9.4 4.7 16.0 7.5 8.5
2 8.5 18.9 8.5 13.2 7.5 13.2 5.7 12.3 12.3
3 9.4 10.4 13.2 19.8 2.8 14.2 10.4 10.4 9.4
4 7.5 10.4 10.4 16.0 6.6 17.0 11.3 11.3 9.4
5 14.2 14.2 10.4 10.4 10.4 9.4 15.1 11.3 4.7
6 8.5 3.8 15.1 8.5 10.4 14.2 10.4 17.9 11.3
7 8.5 8.5 9.4 16.0 7.5 15.1 13.2 11.3 10.4
8 5.7 11.3 16.0 3.8 12.3 8.5 11.3 15.1 16.0
9 (Least Important) 8.5 13.2 12.3 1.9 33.0 3.8 6.6 2.8 17.9
UNITED STATES
RANKING
CATEGORIES
RESPONDENTS (%)
A B C D E F G H I
1 (Most Important) 28.9 9.2 2.6 14.5 6.6 4.6 16.4 2.6 13.8
2 17.1 11.8 8.6 14.5 5.9 7.2 13.2 11.8 9.2
3 4.6 14.5 10.5 14.5 3.9 9.9 15.8 14.5 11.2
4 10.5 9.2 6.6 15.1 6.6 17.8 11.8 11.8 13.8
5 8.6 11.2 13.2 11.2 5.9 13.8 17.1 13.2 5.9
6 9.2 5.3 13.8 13.2 7.9 11.2 7.9 22.4 9.2
7 5.3 18.4 12.5 9.2 9.9 17.1 9.2 13.8 3.9
8 3.9 14.5 23.7 4.6 16.4 11.2 5.3 6.6 13.8
9 (Least Important) 11.8 5.9 8.6 3.3 36.8 7.2 3.3 3.3 19.1

STATE OF THE CANADIAN PRINTING INDUSTRY 2011
44
4. Process Automation Canada vs. U.S. Print Markets
Table 4A
CAPTURING COSTING DATA DIRECTLY FROM DEVICES ON THE SHOP FLOOR TO A PRINT MIS OR OTHER CENTRAL DATA STORE
CAPTURING DATARESPONDENTS (%)
CANADA UNITED STATES
Yes 51.4 47.9
Not Sure 5.7 6.8
No 42.9 45.2
Table 4B
JOB MESSAGING FORMAT USED BY ANY OF THE AUTOMATED SYSTEMS
USE OF JOB MESSAGING FORMATRESPONDENTS (%)
CANADA UNITED STATES
Yes 8.6 16.9
Not Sure 31.4 26.8
No 60.0 56.3

STATE OF THE CANADIAN PRINTING INDUSTRY 2011
45
5. Business Conditions
Table 5A
BUSINESS CONDITIONS IN PERCENTAGE CANADA VS. U.S. PRINT MARKETS
INDICATOR
CANADA UNITED STATES
(%) (%)
ALL RESPONDENTS
WEIGHTED AVERAGE ALL
RESPONDENTS WEIGHTED AVERAGE
Sales: % change (2010 vs 2009) 4.4 3.2 1.9 5.0
Sales: % change (2006 vs 2005) 9.3 6.3 3.5 3.3
Sales Expectations: % change 2011 vs 2010 7.2 5.4 5.5 4.9
Profitability: Profit as a % of sales (2010) 9.3 8.2 4.8 4.1
Profitability: Profit as a % of sales (2006) 10.1 9.3 7.2 7.4
Profitability in Q4 2010 vs Q3 2010:
Increasing 37.6 43.5Decreasing 23.8 37.0No Change 38.6 19.5Index 13.9 6.5
Printing Prices: % change January 2011 vs January 2010 -1.4 -2.5 -0.7 -0.9
Wages/Salaries: % change in 2010 vs 2009 2.9 2.2 -0.3 0.5
Expectations for second quarter 2011 1.1 0.9 1.0 1.1
Paper Prices: % change in 2010 vs 2009 3.5 2.4 4.4 5.3
Expectations for second quarter 2011 2.2 1.5 4.0 4.2
Employee Health Benefits: % change January 2011 to January 2010
1.2 1.5 8.6 7.4
Expectations for second quarter 2011 0.6 0.9 6.7 5.7
Energy/Utilities: % change in 2010 vs 2009 6.0 5.9 3.9 2.2
Expectations for second quarter 2011 4.0 2.2 3.3 2.9
Employment: % change in employment
From Q3 2010 to Q4 2010 % of respondents reporting
Increase more than 10% 5.8 5.4Increase 5 to 10% 1.0 7.8Increase less than 5% 6.8 14.4No Change 67.0 53.9Decrease less than 5% 7.8 10.8Decrease 5 to 10% 2.9 4.2Decrease more than 10% 8.7 3.6Index -5.8 9.0
Expectations for 2011
Increase more than 10% 8.7 3.6Increase 5 to 10% 9.7 11.4Increase less than 5% 17.5 28.1No Change 51.5 41.3Decrease less than 5% 8.7 7.8Decrease 5 to 10% 2.9 3.0Decrease more than 10% 1.0 4.8Index 23.3 27.5

STATE OF THE CANADIAN PRINTING INDUSTRY 2011
46
Table 5B
CANADIAN BUSINESS CONDITIONS BY SIZE (NUMBER OF EMPLOYEES) IN PERCENTAGE
BUSINESS CONDITIONSALL
RESPONDENTS (%)
NUMBER OF EMPLOYEES (%) WEIGHTED AVERAGE (%)1-9 10-19 20-60 60+
Sales: % change (2010 vs 2009) 4.4 3.9 8.5 1.8 3.0 3.2
Sales: % change (2006 vs 2005) 9.3 11.3 13.8 3.8 5.8 6.3
Sales Expectations: % change 2011 vs 2010 7.2 9.1 7.1 5.8 4.9 5.4
Profitability: Profit as a % of sales (2010) 9.3 12.1 7.8 6.5 8.3 8.2
Profitability: Profit as a % of sales (2006) 10.1 11.8 9.0 9.1 9.2 9.3
Profitability in fourth quarter 2010 vs third quarter 2010
Increasing 37.6 25.6 33.3 50.0 60.0Decreasing 23.8 30.2 23.8 12.5 20.0No Change 38.6 44.2 42.9 37.5 20.0Index 13.9 -4.7 9.5 37.5 40.0
Printing Prices: % change January 2011 vs January 2010
-1.4 -0.7 -1.2 -1.9 -2.9 -2.5
Wages/Salaries: % change in 2010 vs 2009 2.9 3.4 2.9 3.5 1.8 2.2
Expected 2nd quarter of 2011 1.1 1.2 0.1 2.8 0.6 0.9
Paper Prices: % change in 2010 vs 2009 3.5 4.1 4.7 2.2 2.2 2.4
Expected 2nd quarter of 2011 2.2 2.6 2.1 1.9 1.2 1.5
Employee Health Benefits: % change January 2011 to January 2010
1.2 1.4 2.0 -1.1 2.0 1.5
Expected 2nd quarter of 2011 0.6 0.3 0.3 1.5 0.8 0.9
Energy/Utilities: % change in 2010 vs 2009 6.0 6.7 6.0 5.1 5.9 5.9
Expected 2nd quarter of 2011 4.0 6.2 3.7 2.4 1.7 2.2
Employment: % change in employment
From 3Q 2010 to 4Q 2010 % of respondents reporting
Weighted Index
Increase more than 10% 5.8 7.0 5.0 5.9 4.5Increase 5 to 10% 1.0 2.3 - - -Increase less than 5% 6.8 - - 11.8 22.7No Change 67.0 76.7 70.0 41.2 63.6Decrease less than 5% 7.8 - 10.0 23.5 9.1Decrease 5 to 10% 2.9 2.3 - 11.8 -Decrease more than 10% 8.7 11.6 15.0 5.9 -Index -5.8 -4.7 -20.0 -23.5 18.2 9.0
Expectations for 2011
Increase more than 10% 8.7 16.3 5.0 - 4.5Increase 5 to 10% 9.7 4.7 5.0 17.6 18.2Increase less than 5% 17.5 7.0 20.0 23.5 31.8No Change 51.5 67.4 50.0 41.2 27.3Decrease less than 5% 8.7 - 10.0 17.6 18.2Decrease 5 to 10% 2.9 2.3 10.0 - -Decrease more than 10% 1.0 2.3 - - -Index 23.3 23.3 10.0 23.5 36.4 32.3

STATE OF THE CANADIAN PRINTING INDUSTRY 2011
47
Table 5C
CAPITAL SPENDING IN PERCENTAGE — CANADA VS. U.S. PRINT MARKETS
CAPITAL SPENDING
CHANGE IN 2009-2010 (%) EXPECTED CHANGE IN 2010-2011 (%)
ALL RESPONDENTS ALL RESPONDENTS
CANADA UNITED STATES CANADA UNITED STATES
Increase more than 10% 15.8 16.6 10.1 14.8
Increase 5 to 10% 10.9 7.1 10.1 10.7
Increase less than 5% 6.9 13.0 17.2 29.0
No Change 49.5 42.6 46.5 32.5
Decrease less than 5% 5.0 4.7 7.1 4.7
Decrease 5 to 10% 3.0 3.0 3.0 3.0
Decrease more than 10% 8.9 13.0 6.1 5.3
Index 16.8 16.0 21.2 41.4
Table 5D
CANADIAN CAPITAL SPENDING AND CREDIT CONDITIONS BY SIZE (NUMBER OF EMPLOYEES)
INDICATORALL
RESPONDENTS (%)
NUMBER OF EMPLOYEES (%) WEIGHTED INDEX (%)1-9 10-19 20-60 60+
Capital Spending: % change in capital spending
Compared to previous year (2010 vs 2009)
Increase more than 10% 15.8 9.5 20.0 17.6 23.8Increase 5 to 10% 10.9 14.3 5.0 11.8 9.5Increase less than 5% 6.9 7.1 5.0 5.9 9.5No Change 49.5 54.8 45.0 41.2 47.6Decrease less than 5% 5.0 2.4 10.0 5.9 4.8Decrease 5 to 10% 3.0 2.4 5.0 5.9 -Decrease more than 10% 8.9 9.5 10.0 11.8 4.8Index 16.8 16.7 5.0 11.8 33.3 27.8
Expectations for future capital spending 2011 vs 2010
Increase more than 10% 10.1 4.9 15.8 5.9 19.0Increase 5 to 10% 10.1 9.8 - 17.6 14.3Increase less than 5% 17.2 22.0 15.8 11.8 14.3No Change 46.5 51.2 47.4 47.1 33.3Decrease less than 5% 7.1 2.4 5.3 5.9 19.0Decrease 5 to 10% 3.0 4.9 - 5.9 -Decrease more than 10% 6.1 4.9 15.8 5.9 -Index 21.2 24.4 10.5 17.6 28.6 25.8
Credit Conditions: Impact of current credit conditions
Significant negative impact 7.9 9.3 5.3 17.6 -Moderate negative impact 21.8 20.9 31.6 23.5 14.3Neither positive or negative impact 62.4 65.1 47.4 52.9 81.0Moderate positive impact 6.9 4.7 15.8 - 4.8Significant positive impact 1.0 - - 5.9 -Index -21.8 -25.6 -21.1 -35.3 -9.5 -14.7