Embed Size (px)
Citation preview

State of Rhode Island
Lincoln D. Chafee, Governor Department of Administration – Richard A. Licht, Director of Administration
Office of Accounts and Control – Marc A. Leonetti, CPA, State Controller
2013 Comprehensive Annual Financial Report
Fiscal Year Ended June 30, 2013

State of Rhode Island and Providence Plantations Comprehensive Annual Financial Report
Table of Contents Page
Introductory Section
Letter of Transmittal ................................................................................................................................. 3 Certificate of Achievement for Excellence in Financial Reporting ....................................................... 7
Organization Chart ................................................................................................................................... 8 Officials of State Government ................................................................................................................. 9
Financial Section
Independent Auditor's Report - Report of the Auditor General ............................................................. 10
Management’s Discussion and Analysis .................................................................................................... 13
Basic Financial Statements:
Government-wide Financial Statements:
Statement of Net Position ................................................................................................................................. 32 Statement of Activities ...................................................................................................................................... 33
Fund Financial Statements:
Balance Sheet – Governmental Funds ............................................................................................................. 35 Reconciliation of the Balance Sheet of the Governmental Funds
to the Statement of Net Position ................................................................................................................... 36 Statement of Revenues, Expenditures, and Changes in Fund
Balances – Governmental Funds ................................................................................................................. 37 Reconciliation of the Statement of Revenues, Expenditures, and Changes in
Fund Balances of the Governmental Funds to the Statement of Activities ............................................. 38 Statement of Net Position – Proprietary Funds .............................................................................................. 39 Statement of Revenues, Expenses, and Changes in Fund Net Position – Proprietary Funds ................................................................................................................. 40 Statement of Cash Flows – Proprietary Funds ............................................................................................... 41 Statement of Fiduciary Net Position – Fiduciary Funds ................................................................................. 43 Statement of Changes in Fiduciary Net Position – Fiduciary Funds ............................................................ 44
Component Unit Financial Statements:
Combining Statement of Net Position ............................................................................................................. 45 Combining Statement of Activities .................................................................................................................. 47
Notes to the Basic Financial Statements ........................................................................................................... 48
Required Supplementary Information:
Budgetary Comparison Schedule – General Fund ................................................................................................. 122 Budgetary Comparison Schedule – Intermodal Surface Transportation Fund .................................................... 125 Schedules of Funding Progress ............................................................................................................................... 126 Notes to Required Supplementary Information ...................................................................................................... 128
1

State of Rhode Island and Providence Plantations Comprehensive Annual Financial Report
Table of Contents Page
Combining Financial Statements:
Combining Balance Sheet – Nonmajor Governmental Funds ............................................................................... 134 Combining Statement of Revenues, Expenditures, and Changes in Fund Balances –
Nonmajor Governmental Funds ........................................................................................................................... 136 Budgetary Comparison Schedule – R.I. Temporary Disability Insurance Fund .................................................. 138 Combining Statement of Net Position – Internal Service Funds ........................................................................... 140 Combining Statement of Revenues, Expenses, and Changes in
Net Position – Internal Service Funds .................................................................................................................. 142 Combining Statement of Cash Flows – Internal Service Funds ............................................................................ 144 Combining Statement of Fiduciary Net Position – Pension and Other Post Employment Benefits Trust Funds .............................................................................................................. 149 Combining Statement of Changes in Fiduciary Net Position – Pension and Other Post Employment Benefits Trust Funds .............................................................................................................. 150
Combining Statement of Fiduciary Net Position – Pension Trust Funds ............................................................ 151 Combining Statement of Changes in Fiduciary Net Position – Pension Trust Funds ........................................ 152
Combining Statement of Fiduciary Net Position – Other Postemployment Benefits Trust Funds ................... 153 Combining Statement of Changes in Fiduciary Net Position – Other Postemployment Benefits Trust Funds ............................................................................................................... 154 Combining Statement of Changes in Fiduciary Assets and Liabilities - Agency Funds .................................... 156 Combining Statement of Net Position – Nonmajor Component Units ................................................................. 157 Combining Statement of Activities – Nonmajor Component Units ....................................................................... 158
Statistical Section
Index …………………………………………………………………………………………………………………………. .... 159 Net Position by Components ................................................................................................................................... 160 Changes in Net Position ............................................................................................................................................ 161 Fund Balances of Governmental Funds .................................................................................................................. 163 Changes in Fund Balances of Governmental Funds .............................................................................................. 164 Taxable Sales by Selected Industry ......................................................................................................................... 166 Personal Income by Industry ................................................................................................................................... 167 Personal Income Tax Rates as a Percent of Personal Income……………………………………………………... ... 168 Personal Income Tax Rates ...................................................................................................................................... 169 Resident Personal Income Tax Filers & Liability by AGI ....................................................................................... 171 Ratios of Outstanding Debt by Type ........................................................................................................................ 173 Pledged Revenue Coverage ...................................................................................................................................... 174 Personal Income and Per Capita Personal Income ................................................................................................ 175 Resident Population .................................................................................................................................................. 175 Economic Indicators .................................................................................................................................................. 175 Principal Employers .................................................................................................................................................. 176 Full Time State Employees by Function .................................................................................................................. 177 Operating Indicators by Function ............................................................................................................................ 178 Capital Asset Statistics by Function ........................................................................................................................ 179
2

Comprehensive Annual Financial Report State of Rhode Island Fiscal Year Ended June 30, 2013
State House and Providence Skyline – photo Kevin M. Bernard
2013 INTRODUCTORY SECTION

STATE OF RHODE ISLAND AND PROVIDENCE PLANTATIONS
DEPARTMENT OF ADMINISTRATION
Richard A. Licht, Director Office: (401) 222-2280 One Capitol Hill Fax: (401) 222-6436 Providence, RI 02908-5890
December 19, 2013 To the Citizens, Governor and Members of the General Assembly of the State of Rhode Island: In accordance with Section 35-6-1 of the General Laws, we are pleased to submit to you the Comprehensive Annual Financial Report (CAFR) of the State of Rhode Island and Providence Plantations for the fiscal year ended June 30, 2013. INTRODUCTION TO REPORT Responsibility: This report was prepared by the State’s Department of Administration - Office of Accounts and Control. Responsibility for the accuracy, completeness and fairness of the presentation rests with management. To the best of our knowledge and belief, the enclosed data accurately presents the State’s financial position and results of operations in all material aspects in accordance with generally accepted accounting principles (GAAP) as promulgated by the Governmental Accounting Standards Board. Furthermore, we believe this report includes all disclosures necessary to enable the reader to gain an understanding of the State’s financial activities. Independent Auditors: The State’s basic financial statements have been audited by the Office of the Auditor General as required by Section 35-7-10 of the General Laws. The Independent Auditor’s Report is included in the Financial Section of this report. Internal Control Structure: Management of the State is responsible for establishing and maintaining an internal control structure designed to provide reasonable, but not absolute, assurance that the assets of the State are protected from loss, theft, or misuse and that adequate accounting data is compiled to allow for preparation of financial statements in conformity with GAAP. The concept of reasonable assurance recognizes that the cost of a control should not exceed the benefits likely to be derived, and that the evaluation of costs and benefits requires estimates and judgments by management. Managers in all branches and components of government are required to maintain comprehensive internal control systems, to regularly evaluate the effectiveness and adequacy of these systems by internal reviews, and to submit an annual report on these internal controls to the Governor in accordance with the 1986 Financial Integrity and Accountability Act. Financial Reporting Entity: The funds and component units included in the CAFR are those for which the State is accountable, based on criteria for defining the reporting entity as prescribed by GAAP. The criteria include appointing a voting majority of an organization’s governing body and (1) the ability of the State to impose its will on the organization or (2) the potential for the organization to provide specific financial benefits or impose specific financial burdens on the State. More information about the State reporting entity can be found in Note 1 to the basic financial statements. Management’s Discussion and Analysis (MD&A): The MD&A immediately follows the independent auditor’s report and provides a narrative introduction, overview, and analysis of the basic financial statements. The MD&A also includes information on a number of important factors that are expected to affect future operations of our State. This letter of transmittal is intended to complement the MD&A and should be read in conjunction with it.
3

PROFILE OF THE GOVERNMENT Government Structure: As shown in the organizational chart that follows this transmittal letter, State government is divided into three separate branches: legislative, executive and judicial. The duties of each branch are outlined in the State’s Constitution, which can be amended only by a majority vote of the State’s citizens, and in the Rhode Island General Laws, which can be amended only by the General Assembly. State government services provided to citizens include building and maintaining roads; providing public safety, health and environmental protection services to protect the general welfare of the State’s citizens; assisting adults, children and families through difficult times resulting from abuse, neglect, illness or unemployment; promoting an attractive business climate to encourage economic development; and protecting natural resources for conservation and recreational activities. The State also provides significant support to its three institutions of higher education and to the public schools within the State.
Budgetary Information - Annual and Long-term: Preparation and submission of the budget is governed by both the State’s Constitution and Rhode Island General Laws. The budget, as enacted by the General Assembly, contains a complete plan of appropriations supported by estimated revenues. Estimated general revenues are determined by a consensus of the Revenue Estimating Conference, which is made up of the State Budget Officer, House Fiscal Advisor, and the Senate Fiscal Advisor. The Conference was established to provide a stable and accurate method of financial planning and budgeting to facilitate the adoption of a balanced budget wherein appropriations and expenditures do not exceed anticipated revenues, as is required by the statutes and Constitution of Rhode Island. Appropriations for restricted and dedicated revenue sources are supported by estimates submitted by the agencies. There is a State Budget Reserve Account (Reserve) which is maintained within the General Fund. According to the State’s Constitution, general revenue appropriations in the general fund cannot exceed 97% of available general revenue sources. These sources consist of the current fiscal year’s budgeted general revenue plus the general fund available fund balance from the prior fiscal year. Excess revenue is transferred to the Reserve. If the balance in the Reserve exceeds five percent of the total general revenues and opening surplus, the excess is transferred to the R.I. Capital Plan Fund to be used for capital projects. The Reserve, or any portion thereof, may be appropriated in the event of an emergency involving the health, safety or welfare of the citizens of the State or in the event of an unanticipated deficit in any given fiscal year, such appropriations to be approved by a majority of each chamber of the General Assembly. A five-year financial projection is prepared annually as part of the Governor's budget submission pursuant to Section 35-3-1 of the Rhode Island General Laws. The five-year financial projection includes tables that present anticipated revenues and expenditures for the ensuing five fiscal years. Also included are tables that provide detail on the planning values used in these projections. The planning values reflect policy assumptions, as well as economic and demographic forecasts. The purpose of the five-year forecast is to provide a baseline fiscal outlook for the State. Although the forecast may be utilized as a benchmark in assessing the affordability and desirability of alternative policy options, caution should be exercised in the interpretation of the forecast.
Economic Conditions and Outlook: Rhode Island’s preliminary seasonally adjusted unemployment rate in October 2013 was 9.2 percent, a decrease from October 2012’s rate of 10.1 percent. The State’s unemployment rate continued to lag the October 2013 U.S. unemployment rate of 7.3 percent. Rhode Island’s unemployment rate is declining at a faster rate than that of the U.S., resulting in a decrease in the gap between the U.S. unemployment rate and the Rhode Island unemployment rate. In October 2013, Rhode Island’s unemployment rate was 126 percent greater than that of the U.S., with the comparable number in October 2012 being 131.6 percent. In their November 2013 forecast, Moody’s Analytics noted that information and construction have been the primary drag on employment in 2013, while professional and business services as well as financial activities have been the largest sources of job growth in the State. Additionally, the Rhode Island Department of Labor and Training (DLT) testified at the November 2013 Revenue Estimating Conference that the U.S. Bureau of Labor Statistics official job numbers for June 2013 would likely be revised upward by an estimated 2,800 jobs in the private sector. The Accommodation & Food Services industry recorded an increase of 2,900 jobs according to DLT. Moody’s
4

Analytics’ November 2013 forecast projects that Rhode Island’s non-farm employment will surpass pre-recession peak levels in calendar year 2017. In their November 2013 forecast, Moody’s Analytics noted that policy uncertainty has not helped the economic recovery. Moody’s Analytics noted that until businesses see a clearer picture of what the future holds with respect to the potential phase out of the Federal Reserve’s Quantitative Easing monetary policy and the resolution of the ongoing debt ceiling long-term, hiring will remain anemic. As a small open economy, the State’s economic recovery is being slowed by these significant U.S. macroeconomic headwinds and uncertainty. Rhode Island continues to transition from a manufacturing based economy to a services oriented economy. Moody’s Analytics notes that the long-term growth of Rhode Island’s economy hinges on retraining and retaining workers that transition from manufacturing to services. On a positive note, Moody’s Analytics stated that the housing market in Rhode Island has turned the corner and will soon be undersupplied placing upward pressure on prices. The primary factors for the beginning of a housing recovery are a reduction in the excess housing inventory and in foreclosure sales. Mortgage delinquency rates are almost back to prerecession levels suggesting more stringent credit conditions have improved these rates. In addition, Moody’s noted that all the prerequisites are in place for an economic expansion through increased private sector hiring. Rhode Island, however, will continue to experience stagnant growth until political uncertainty surrounding the federal debt ceiling and the Federal Reserve’s Quantitative Easing monetary policy are resolved. MAJOR INITIATIVES The fiscal year 2014 enacted budget included a number of initiatives. These include:
Reinstating the historic structures tax credit program; Increasing aid to local communities through enhanced assistance payments and a new Municipal
Incentive Aid program; Changing the Rhode Island tax structure to allow accelerated depreciation for major equipment
purchases in the same manner as federal tax law; Restructuring of taxes on liquor through the elimination of the sales tax on spirits and wine from
December 1, 2013 to June 30, 2015 and increasing the excise tax on beer, spirits and wine from July 1, 2013 to March 31, 2015.
The enacted budget also authorizes new federal spending to expand Medicaid eligibility under the Affordable Care Act for non-pregnant, childless adults up to 138 percent of the federal poverty level. A combination of federal and state funds is authorized for the development of the Unified Health Infrastructure Project, a new eligibility system that will support a number of human service programs, in addition to the RI Health Benefits Exchange (HealthSource RI).
The fiscal year 2014 enacted budget also included initiatives to promote capital investment and economic development in Rhode Island. These include:
Improvements to the Eisenhower House at Fort Adams, in anticipation of sailing competitions in the waters off Newport;
Providing resources to maintain the Dunkin Donuts Center and RI Convention Center; Issuing authorized general obligation bonds for construction of a new Veterans’ Home,
renovations to buildings and infrastructure at Rhode Island College, as well as affordable housing, clean water projects and open space;
Investing $500,000 for the I-195 Redevelopment Commission to develop the Knowledge District in Providence;
Investment of $2.5 million from the Rhode Island Capital Plan Fund for maintenance and renovations at Rocky Point State Park, which was acquired in September 2012 with proceeds from a voter approved bond issue;
5
Investment of $5.6 million from state and federal sources for infrastructure improvements at the Port of Galilee.
AWARDS AND ACKNOWLEDGMENTS The Government Finance Officers Association of the United States and Canada (GFOA) awarded a Certificate of Achievement for Excellence in Financial Reporting to the State of Rhode Island and Providence Plantations for its comprehensive annual financial report for the fiscal years ended June 30, 2011 and 2012. In order to be awarded a Certificate of Achievement, a government must publish an easily readable and efficiently organized comprehensive annual financial report. This report must satisfy both generally accepted accounting principles and applicable legal requirements. A Certificate of Achievement is valid for a period of one year only. We believe that our current comprehensive annual financial report continues to meet the Certificate of Achievement Program’s requirements and we are submitting it to the GFOA to determine its eligibility for another certificate. We wish to express our sincere appreciation to the many individuals who assisted and contributed to the timely preparation of this report. It could not have been accomplished without the professionalism and dedication demonstrated by the entire staff of the Office of Accounts and Control, the Office of the Auditor General, and numerous other State agencies. We also want to thank the Governor and members of the General Assembly for their interest and support in planning and conducting the financial operations of the State in a responsible and progressive manner.
Respectfully submitted,
Richard A. Licht Director
Marc A. Leonetti, CPA State Controller
6

7

State of Rhode Island and Providence Plantations
Legislative
SenateHouse of Representatives
Judicial
Supreme CourtSuperior Court
Family CourtDistrict Court
Traffic Tribunal
Executive
Lieutenant GovernorGeneral TreasurerAttorney General
Secretary of State
HigherEducation
Elementary& Secondary
Education
Governor
Organization Chart
State Departments
AdministrationBusiness Regulation
CorrectionsEnvironmental Management
Labor & TrainingOther Commissions & Agencies
Public SafetyRevenue
Transportation
Executive Office of Health and Human Services:Behavioral Healthcare, Developmental Disabilities and Hospitals
Children, Youth & FamiliesHealth
Human Services
Board ofeducation
Public Authorities & Corporations
8

STATE OF RHODE ISLAND AND PROVIDENCE PLANTATIONS
OFFICIALS OF STATE GOVERNMENT
EXECUTIVE BRANCH
Governor Lincoln D. Chafee
Lieutenant Governor Elizabeth H. Roberts
Secretary of State
A. Ralph Mollis
General Treasurer Gina M. Raimondo
Attorney General Peter F. Kilmartin
LEGISLATIVE BRANCH
Senate President of the Senate M. Teresa Paiva Weed
House of Representatives Speaker of the House
Gordon D. Fox
JUDICIAL BRANCH
Chief Justice of the Supreme Court Paul A. Suttell
9

Comprehensive Annual Financial Report State of Rhode Island Fiscal Year Ended June 30, 2013
Waterfire Providence – photo Kevin M. Bernard
2013 FINANCIAL SECTION

86 Weybosset Street Providence, RI 02903-2800 tel: 401.222.2435 fax: 401.222.2111
Office of the Auditor General State of Rhode Island and Providence Plantations - General Assembly Dennis E. Hoyle, CPA - Auditor General
oag.ri.gov
INDEPENDENT AUDITOR'S REPORT Finance Committee of the House of Representatives Joint Committee on Legislative Services, General Assembly, State of Rhode Island and Providence Plantations: Report on the Financial Statements
We have audited the accompanying financial statements of the governmental activities, the business-type activities, the aggregate discretely presented component units, each major fund, and the aggregate remaining fund information of the State of Rhode Island and Providence Plantations (the State), as of and for the year ended June 30, 2013, and the related notes to the financial statements, which collectively comprise the State’s basic financial statements as listed in the Table of Contents.
Management’s Responsibility for the Financial Statements
Management is responsible for the preparation and fair presentation of these financial statements in
accordance with accounting principles generally accepted in the United States of America; this includes the design, implementation, and maintenance of internal control relevant to the preparation and fair presentation of financial statements that are free from material misstatement, whether due to fraud or error.
Auditor’s Responsibility
Our responsibility is to express opinions on these financial statements based on our audit. We did not audit
the financial statements of:
• the Tobacco Settlement Financing Corporation, a blended component unit which represents 2% of the assets and 1% of the revenues of the governmental activities and 1% of the assets and 3% of the revenues of the aggregate remaining fund information;
• the Convention Center Authority, a major fund, which also represents 64% of the assets and 2% of the
revenues of the business-type activities; • the Ocean State Investment Pool, an external investment trust, which represents less than 1% of the
assets and revenues of the aggregate remaining fund information; and
• all the component units comprising the aggregate discretely presented component units. Those financial statements were audited by other auditors whose reports have been furnished to us, and our opinions, insofar as they relate to the amounts included for the governmental activities, the business-type activities, the aggregate discretely presented component units, the Convention Center Authority major fund, and the aggregate remaining fund information, are based solely on the reports of the other auditors. We conducted our audit in accordance with auditing standards generally accepted in the United States of America and the standards applicable to financial audits contained in Government Auditing Standards, issued by the
10

Office of the Auditor General
Finance Committee of the House of Representatives Joint Committee on Legislative Services
Comptroller General of the United States. Those standards require that we plan and perform the audit to obtain reasonable assurance about whether the financial statements are free from material misstatement. An audit involves performing procedures to obtain audit evidence about the amounts and disclosures in the financial statements. The procedures selected depend on the auditor’s judgment, including the assessment of the risks of material misstatement of the financial statements, whether due to fraud or error. In making those risk assessments, the auditor considers internal control relevant to the entity’s preparation and fair presentation of the financial statements in order to design audit procedures that are appropriate in the circumstances, but not for the purpose of expressing an opinion on the effectiveness of the entity’s internal control. Accordingly, we express no such opinion. An audit also includes evaluating the appropriateness of accounting policies used and the reasonableness of significant accounting estimates made by management, as well as evaluating the overall presentation of the financial statements. We believe that the audit evidence we have obtained is sufficient and appropriate to provide a basis for our audit opinions.
Opinions
In our opinion, based on our audit and the reports of other auditors, the financial statements referred to above present fairly, in all material respects, the respective financial position of the governmental activities, the business-type activities, the aggregate discretely presented component units, each major fund, and the aggregate remaining fund information of the State, as of June 30, 2013, and the respective changes in financial position and, where applicable, cash flows thereof for the year then ended in accordance with accounting principles generally accepted in the United States of America. Matters of Emphasis
As described in Notes 1(T) and 18(F), the State implemented Governmental Accounting Standards Board Statement No. 61, The Financial Reporting Entity: Omnibus – an amendment of GASB Statements No. 14 and No. 34, which resulted in a change in the component units included within the State reporting entity. As described in Note 7(J), the State has borrowed from the federal Unemployment Insurance Trust Fund to fund unemployment benefits paid from the Employment Security Fund, a major fund. At June 30, 2013, the amount outstanding was $155 million and the Employment Security Fund had a net deficit of $81 million. As described in Note 13, various lawsuits have been filed challenging legislatively enacted pension reforms. The parties are participating in on-going court ordered mediation. An adverse judgment to the State resulting from these challenges could significantly increase both the unfunded liability of the plans included within the pension trust funds and the State’s actuarially determined annual required contribution.
Our opinions are not modified with respect to these matters. Other Matters Required Supplementary Information
Accounting principles generally accepted in the United States of America require that the Management’s Discussion and Analysis on pages 13 through 31, the Budgetary Comparison Schedules on pages 122 through 125, and the Schedules of Funding Progress on pages 126 through 127 be presented to supplement the basic financial statements. Such information, although not a part of the basic financial statements, is required by the Governmental Accounting Standards Board who considers it to be an essential part of financial reporting for placing the basic
11

Office of the Auditor General
Finance Committee of the House of Representatives Joint Committee on Legislative Services
financial statements in an appropriate operational, economic, or historical context. We have applied certain limited procedures to the required supplementary information in accordance with auditing standards generally accepted in the United States of America, which consisted of inquiries of management about the methods of preparing the information and comparing the information for consistency with management’s responses to our inquiries, the basic financial statements, and other knowledge we obtained during our audit of the basic financial statements. We do not express an opinion or provide any assurance on the information because the limited procedures do not provide us with sufficient evidence to express an opinion or provide any assurance.
Other Information
Our audit was conducted for the purpose of forming opinions on the financial statements that collectively
comprise the State’s basic financial statements. The supplementary information, such as combining and individual nonmajor fund financial statements on pages 134 through 158 which includes the budgetary comparison schedule for the Temporary Disability Insurance (TDI) Fund on page 138, and the other information, such as the introductory and statistical sections on pages 3 through 9 and pages 159 through 179, respectively, are presented for purposes of additional analysis and are not a required part of the basic financial statements.
The combining and individual nonmajor fund financial statements and the budgetary comparison schedule
for the TDI Fund are the responsibility of management and were derived from and relate directly to the underlying accounting and other records used to prepare the basic financial statements. Such information has been subjected to the auditing procedures applied in the audit of the basic financial statements and certain additional procedures, including comparing and reconciling such information directly to the underlying accounting and other records used to prepare the basic financial statements or to the basic financial statements themselves, and other additional procedures in accordance with auditing standards generally accepted in the United States of America by us and other auditors. In our opinion, based on our audit, the procedures performed as described above, and the reports of the other auditors, the combining and individual nonmajor fund financial statements and the budgetary comparison schedule for the TDI Fund are fairly stated, in all material respects, in relation to the basic financial statements as a whole.
The introductory and statistical sections have not been subjected to the auditing procedures applied in the
audit of the basic financial statements, and accordingly, we do not express an opinion or provide any assurance on them.
Other Reporting Required by Government Auditing Standards
In accordance with Government Auditing Standards, we will issue our report on our consideration of the
State’s internal control over financial reporting and on our tests of its compliance with certain provisions of laws, regulations, contracts, and grant agreements and other matters. That report will be included in the State’s 2013 Single Audit Report. The purpose of that report is to describe the scope of our testing of internal control over financial reporting and compliance and the results of that testing, and not to provide an opinion on internal control over financial reporting or on compliance. That report is an integral part of an audit performed in accordance with Government Auditing Standards in considering the State’s internal control over financial reporting and compliance.
Dennis E. Hoyle, CPA Auditor General December 19, 2013
12

Management’s Discussion
and
Analysis
State of Rhode Island Fiscal Year Ended June 30, 2013

State of Rhode Island and Providence Plantations Management’s Discussion and Analysis Fiscal Year Ended June 30, 2013
Management’s discussion and analysis (MD&A) provides a narrative overview and analysis of the financial activities of the State of Rhode Island (State) for the fiscal year ended June 30, 2013. The MD&A is intended to serve as an introduction to the State’s basic financial statements, which have the following components: (1) government-wide financial statements, (2) fund financial statements, and (3) notes to the financial statements. The MD&A is designed to (a) assist the reader in focusing on significant financial matters, (b) provide an overview of the State’s financial activities, (c) identify any material changes from the original budget, and (d) highlight individual fund matters. The following presentation is by necessity highly summarized, and in order to gain a thorough understanding of the State’s financial condition, the following financial statements, notes and required supplementary information should be reviewed in their entirety.
Financial Highlights – Primary Government Government-wide Financial Statements
Net Position: The total assets of the State exceeded total liabilities on June 30, 2013 by $1,698.8 million. This amount is presented as "net position" on the Statement of Net Position for the Total Primary Government. Of this amount, ($1,385.2) million was reported as unrestricted net position (deficit), $660.5 million as restricted net position, and $2,423.5 million as net investment in capital assets.
Changes in Net Position: In the Statement of Activities, the State's total net position
increased by $370.4 million in fiscal year 2013. Net position of governmental activities increased by $301.4 million, primarily because increases in tax revenue, charges for services and miscellaneous revenue exceeded the growth in expenses which were subject to careful control and management. Tax revenues increased primarily because of the stronger economy as the State gradually emerged from the “Great Recession.” Net position of the business-type activities increased by $69.1 million due primarily to the significant operating surplus of the Employment Security Fund. The fund was positively impacted by a declining unemployment rate, changes in benefits and measures implemented to increase the longer term financial strength of the fund.
Fund Financial Statements Governmental Funds
The State's governmental funds reported a combined ending fund balance of $1,057.8 million, an increase of $67.3 million in comparison with the previous fiscal year. This is primarily a result of the increase in the fund balance of the General Fund, which in turn is attributable to increases in general revenues coupled with careful management of expenditures. In addition, the fund balance of the Intermodal Surface Transportation Fund benefited from an inflow of funds from the transfer of land to a discretely presented component unit.
As of June 30, 2013, the State’s General Fund reported an ending fund balance of $401.1
million, an increase of $28.0 million as compared to the prior year. This change resulted from increases in general revenue, primarily taxes, in fiscal year 2013 and further enhanced controls over expenditures, which resulted in general revenue expenditures being less than appropriations by $17.8 million.
As of June 30, 2013, the State’s Intermodal Surface Transportation Fund reported an ending
fund balance of $141.7 million, an increase of $33.0 million as compared to the prior year. The increase was mainly due to an inflow of funds from a transaction involving the transfer of land to a discretely presented component unit.
13
State of Rhode Island and Providence Plantations Management’s Discussion and Analysis Fiscal Year Ended June 30, 2013
Proprietary Funds The Rhode Island State Lottery transferred $379.2 million to the General Fund in support of
general revenue expenditures during the fiscal year, an increase of $1.5 million in comparison with the previous fiscal year.
The Employment Security Fund ended the fiscal year with a fund deficit of ($81.3) million, as
compared with a ($151.5) million deficit at the end of fiscal year 2012. This favorable change is primarily attributable to a significant reduction in benefits paid due to the improving employment level in the State and changes in benefits.
The R.I. Convention Center Authority ended the fiscal year with a net position deficiency of
($55.9) million, a deficit increase of ($1.7) million compared with the prior year. The Authority has historically had a net position deficiency as the amount of debt related to capital assets has exceeded the net book value of the capital assets, because the repayment term for the debt is generally longer than the depreciable life of the assets.
Overview of the Financial Statements This discussion and analysis is intended to serve as an introduction to the State's basic financial statements. The State's basic financial statements include three components:
1. Government-wide financial statements 2. Fund financial statements 3. Notes to the financial statements
This report also contains other supplementary information in addition to the basic financial statements. Government-wide Financial Statements The government-wide financial statements provide a broad view of the State's finances. The statements provide both short-term and long-term information about the State's financial position, which assist in assessing the State's financial condition at the end of the year. These financial statements are prepared using the accrual basis of accounting, which recognizes all revenues and grants when earned, and expenses at the time the related liabilities are incurred.
The Statement of Net Position presents all of the government's assets, deferred outflows of resources, liabilities, and deferred inflows of resources with the difference reported as "net position." Over time, increases and decreases in the government's net position may serve as a useful indicator of whether the financial position of the State is improving or deteriorating.
The Statement of Activities presents information showing how the government's net position
changed during the fiscal year. All changes in net position are reported as soon as the underlying event giving rise to the change occurs, regardless of the timing of related cash flows. Therefore, revenues and expenses are reported in this statement for some items that will not result in cash flows until future fiscal periods; for example, uncollected taxes and earned but unused vacation leave. This statement also presents a comparison between direct expenses and program revenues for each function of the government.
Both of the government-wide financial statements have separate sections for three different types of activities:
Governmental Activities: The activities in this section represent most of the State's basic services and are generally supported by taxes, grants and intergovernmental revenues. The governmental activities of the State include general government, human services, education,
14

State of Rhode Island and Providence Plantations Management’s Discussion and Analysis Fiscal Year Ended June 30, 2013
public safety, natural resources, and transportation. The net position and change in net position of the internal service funds are also included in this column.
Business-type Activities: These activities are normally intended to recover all or a significant
portion of their costs through user fees and charges to external users of goods and services. These business-type activities of the State include the operations of the Rhode Island Lottery, Rhode Island Convention Center Authority and the Employment Security Trust Fund.
Discretely Presented Component Units: Component units are entities that are legally
separate from the State, but for which the State is financially accountable. These entities are listed in Note 1. The financial information for these entities is presented separately from the financial information presented for the primary government.
Fund Financial Statements A fund is a grouping of related accounts that is used to maintain control over resources that have been segregated for specific activities or objectives. The State uses fund accounting to ensure and demonstrate compliance with finance-related legal requirements. The fund financial statements focus on the individual parts of State government and report the State's operations in more detail than the government-wide financial statements. The State's funds are divided into three categories: governmental, proprietary and fiduciary.
Governmental funds: Most of the State's basic services are financed through governmental funds. Governmental funds are used to account for essentially the same functions reported as governmental activities in the government-wide financial statements. However, unlike the government-wide financial statements, the governmental fund financial statements focus on near-term inflows and outflows of spendable resources, as well as on spendable resources available at the end of the fiscal year. Such information helps determine whether there are more or fewer financial resources that can be spent in the near future to finance the State's programs.
Because the focus of governmental funds is narrower than that of the government-wide
financial statements, it is useful to compare the information presented for governmental funds with similar information presented for governmental activities in the government-wide financial statements. By doing so, readers may better understand the long-term impact of the State's near-term financial decisions. Both the governmental fund balance sheet and the governmental fund statement of revenues, expenditures and changes in fund balances provide a reconciliation to facilitate this comparison between governmental funds and the governmental activities.
Governmental funds include the general fund, special revenue, capital projects, debt service,
and permanent funds. The State has several governmental funds, of which GASB Statement No. 34, Basic Financial Statements – and Management’s Discussion and Analysis – for State and Local Governments defines the general fund as a major fund. The criteria for determining if any of the other governmental funds are major funds are detailed in Note 1 C. Each of the major funds is presented in a separate column in the governmental funds balance sheet and statement of revenues, expenditures and changes in fund balances. The remaining governmental funds are combined in a single aggregated column on these financial statements. Individual fund data for each of these nonmajor governmental funds can be found in the supplementary information section of the State’s Comprehensive Annual Financial Report.
Proprietary funds: Services for which the State charges customers a fee are generally
reported in proprietary funds. The State maintains two different types of proprietary funds; enterprise funds and internal service funds. Enterprise funds report activities that provide supplies and services to the general public. Internal service funds report activities that provide supplies and services for the State's other programs and activities. Similar to the government-wide statements, proprietary funds use the accrual basis of accounting. The State has three
15

State of Rhode Island and Providence Plantations Management’s Discussion and Analysis Fiscal Year Ended June 30, 2013
enterprise funds, the Lottery Fund, Convention Center Authority (RICCA) and the Employment Security Fund. These funds are each presented in separate columns on the basic proprietary fund financial statements. The State's internal service funds are reported as governmental activities on the government-wide statements, because the services they provide predominantly benefit governmental activities. The State's internal service funds are reported on the basic proprietary fund financial statements in a single combined column. Individual fund data for these funds is provided in the form of combining statements and can be found in the supplementary information section of the State’s CAFR.
Fiduciary funds: These funds are used to account for resources held for the benefit of parties
outside the State government. Fiduciary funds are not included in the government-wide financial statements because the resources of these funds are not available to support the State's programs. These funds, which include the pension and other post-employment benefits trusts, an external investment trust, a private-purpose trust and agency funds, are reported using accrual accounting. Individual fund data for fiduciary funds can be found in the supplementary information section of the State’s CAFR.
Discretely Presented Component Units Discretely presented component units are legally separate from the primary government. They are financially accountable to the primary government, or have relationships with the primary government such that exclusion would cause the reporting entity's financial statements to be misleading or incomplete. These discretely presented component units serve or benefit those outside of the primary government. The State distinguishes between major and nonmajor component units. The criteria for distinguishing between major and nonmajor component units are discussed in Note 1 (B).
Notes to the Financial Statements The notes provide additional information that is essential to a full understanding of the data provided in the government-wide and fund financial statements. The notes to the financial statements can be found immediately following the fiduciary funds financial statements. Required Supplementary Information The basic financial statements and accompanying notes are followed by a section of required supplementary information, including information concerning the State's progress in funding its obligation to provide pension and other post-employment benefits to its employees. This section also includes a budgetary comparison schedule for each of the State's major governmental funds that have a legally enacted budget. Other Supplementary Information Other supplementary information, which follows the required supplementary information in the State’s CAFR, includes the combining financial statements for nonmajor governmental funds, internal service funds and fiduciary funds.
Government-Wide Financial Analysis Net Position As noted earlier, net position may serve over time as a useful indicator of a government's financial position. The State's combined net position (governmental and business-type activities) totaled $1,698.8 million at the end of fiscal year 2013, compared to $1,328.4 million (as restated) at the end of the prior fiscal year. Governmental activities reported unrestricted net position (deficit) of ($1,298.6) million.
16

State of Rhode Island and Providence Plantations Management’s Discussion and Analysis Fiscal Year Ended June 30, 2013
A portion of the State's net position reflects its investment in capital assets such as land, buildings, equipment and infrastructure (roads, bridges, and other immovable assets), less any related debt outstanding that was needed to acquire or construct the assets. The State uses these capital assets to provide services to its citizens; consequently, these assets are not available for future spending. Although the State's investment in its capital assets is reported net of related debt, it should be noted that the resources needed to repay this debt must be provided from other sources. An additional portion of the State's net position represents resources that are subject to external restrictions on how they may be used.
Current and other assets $ 2,045,687 $ 1,881,099 $ 124,168 $ 126,097 $ 2,169,855 $ 2,007,196Capital assets 3,492,383 3,324,273 169,270 177,461 3,661,653 3,501,734
Total assets 5,538,070 5,205,372 293,438 303,558 5,831,508 5,508,930
Long-term liabilities outstanding 2,621,233 2,671,882 386,108 464,090 3,007,341 3,135,972Other liabilities 1,047,652 992,542 50,844 52,048 1,098,496 1,044,590
Total liabilities 3,668,885 3,664,424 436,952 516,138 4,105,837 4,180,562
Net position (deficit):Net investment in capital assets 2,488,755 2,302,368 (65,283) (64,492) 2,423,472 2,237,876Restricted 652,126 576,387 8,340 9,308 660,466 585,695Unrestricted (1,298,579) (1,337,807) (86,571) (157,396) (1,385,150) (1,495,203)
Total net position (deficit) as restated $ 1,842,302 $ 1,540,948 $ (143,514) $ (212,580) $ 1,698,788 $ 1,328,368
* Certain fiscal year balances were restated as discussed in Note 18(F).
2013 2012*
Activities Activities Government
2013 2012* 2013 2012
PrimaryGovernmental Business-Type
State of Rhode Island's Net Position as of June 30, 2013(Expressed in Thousands)
Total
As indicated above, the State reported a balance in unrestricted net position (deficit) of ($1,385.2) million as of June 30, 2013 in the Statement of Net Position. This deficit results in part from the State’s use of general obligation bond proceeds (which are reported as debt of the primary government) for other than the primary government’s direct capital purposes. In these instances, proceeds are transferred to municipalities, discretely presented component units, and non-profit organizations within the State to fund specific projects. As of June 30, 2013 approximately $605.6 million of general obligation bonds related to such projects were outstanding. Examples of these uses of general obligation bond proceeds include, but are not limited to, the following:
Certain transportation projects funded with bond proceeds that do not meet the State’s criteria for capitalization as infrastructure;
Construction of facilities at the State’s university and colleges, which are reflected in the
financial statements as discretely presented component units; Water resources projects including the acquisition of sites for future water supply resources,
various water resources planning initiatives, and funding to upgrade local water treatment facilities;
Environmental programs to acquire, develop, and rehabilitate local recreational facilities and
ensure that open space is preserved; Historical preservation initiatives designed to protect and preserve historical buildings as well as
to provide funding for cultural facilities.
Other debt that is not for the State’s acquisition of capital assets is as follows:
17

State of Rhode Island and Providence Plantations Management’s Discussion and Analysis Fiscal Year Ended June 30, 2013
Tobacco Settlement Asset-Backed Bonds and Accreted Interest - The Tobacco Settlement Financing Corporation (TSFC), a blended component unit, has issued $882.4 million of Tobacco Asset-Backed Bonds that were used to purchase the State’s future rights in the Tobacco Settlement Revenues under the Master Settlement Agreement and the Consent Decree and Final Judgment. The bonds are secured solely by and are payable solely from the tobacco receipts sold to the TSFC and other monies of the TSFC and do not constitute a general, legal, or moral obligation of the State or any political subdivision thereof, and the State has no obligation to satisfy any deficiency or default of any payment of the bonds. As of June 30, 2013 approximately $765.2 million of principal and $83.1 million of accreted interest are included in the State’s debt.
Historic Tax Credit Bonds - In fiscal year 2009 the R.I. Economic Development Corporation
(RIEDC), on behalf of the State, issued $150.0 million of revenue bonds under the Historic Structures Tax Credit Financing Program. The bonds do not constitute a debt, liability, or obligation of the State or any political subdivision thereof. The State is obligated under a Payment Agreement to make payments to the trustee. This obligation is subject to annual appropriation by the General Assembly. The proceeds of the bonds are being used to provide funds for redemption of Historic Structures Tax Credits. As of June 30, 2013, approximately $90.6 million is outstanding.
The State has entered into certain capital lease agreements, Certificates of Participation (COPS),
the proceeds of which are to be used by the State’s university and colleges for energy conservation projects or by local school districts to increase electronic communication on a state-wide basis. Obligation of the State to make payments under lease agreements is subject to and dependent upon annual appropriations being made by the General Assembly. As of June 30, 2013, approximately $33.9 million is outstanding relating to these projects.
In the above instances, the primary government records a liability for the outstanding debt but no related capitalized asset is recorded. A cumulative deficit in unrestricted net position results from financing these types of projects through the years. Changes in Net Position The State’s overall net position for the primary government improved by $370.4 million during fiscal year 2013. Total revenues of $7,222.6 million were more than expenses of $6,852.1 million. The favorable results were aided by increased general revenues due primarily to an increase in tax collections attributable to the improving economy and increases in miscellaneous revenues. The next largest source of revenues was operating grants and contributions (including federal financial aid) which actually decreased due to the winding down of funding under the American Recovery and Reinvestment Act of 2009 and a significant decline in federal assistance for unemployment insurance benefits. The State’s expenses in total, which cover a wide range of services, declined by $81.4 million. This net decrease was caused by reductions in general government costs due to careful expense control and by reductions in employment insurance costs due to fewer workers receiving such payments. These decreases were offset in part by increased spending on human services programs and education due to spending on the Race to the Top program and greater education assistance for local communities. A more detailed analysis of changes in revenues and program expenses for both governmental activities and business-type activities is presented after each of the following pie charts.
18

State of Rhode Island and Providence Plantations Management’s Discussion and Analysis Fiscal Year Ended June 30, 2013
Revenues:Program revenues:
Charges for services $ 551,500 $ 508,140 $ 1,055,070 $ 1,056,285 $ 1,606,570 $ 1,564,425Operating grants and contributions 2,211,800 2,194,892 166,164 278,671 2,377,964 2,473,563Capital grants and contributions 190,551 210,720 190,551 210,720
General revenues:Taxes 2,870,969 2,824,368 2,870,969 2,824,368Interest and investment earnings 4,893 4,304 117 94 5,010 4,398Miscellaneous 146,997 118,506 24,490 16,564 171,487 135,070
Total revenues 5,976,710 5,860,930 1,245,841 1,351,614 7,222,551 7,212,544
Program expenses:General government 625,081 653,003 625,081 653,003Human services 3,038,841 2,970,269 3,038,841 2,970,269Education 1,364,575 1,334,355 1,364,575 1,334,355Public safety 473,580 468,098 473,580 468,098Natural resources 76,730 85,039 76,730 85,039Transportation 300,639 268,523 300,639 268,523Interest 129,714 145,964 129,714 145,964Lottery 397,625 399,421 397,625 399,421Convention Center 48,437 49,439 48,437 49,439Employment insurance 396,909 559,440 396,909 559,440
Total expenses 6,009,160 5,925,251 842,971 1,008,300 6,852,131 6,933,551
Excess (deficiency) before transfers (32,450) (64,321) 402,870 343,314 370,420 278,993Transfers 333,804 344,386 (333,804) (344,386)
Change in net position 301,354 280,065 69,066 (1,072) 370,420 278,993Net position (deficit) - Beginning 1,418,495 1,138,430 (212,580) (211,508) 1,205,915 926,922Cumulative effect of prior period adjustments 122,453 122,453
Net position (deficit) - Beginning, as restated 1,540,948 1,138,430 (212,580) (211,508) 1,328,368 926,922
Net position (deficit) - Ending $ 1,842,302 $ 1,418,495 $ (143,514) $ (212,580) $ 1,698,788 $ 1,205,915
TotalActivities
2013 2013 2012
Business-TypeGovernmentalActivities Primary Government
State of Rhode Island's Changes in Net PositionFor the Fiscal Year Ended June 30, 2013
(Expressed in Thousands)
2013 2012 2012
Chart 1 depicts the State’s sources of revenues from Governmental Activities for the fiscal year ended June 30, 2013.
Chart 1 - Revenues and Transfers - Governmental Activities
Charges for services
9%
Operating grants and contributions
35%
Capital grants and contributions
3%
Taxes46%
Miscellaneous2%
Transfers5%
19

State of Rhode Island and Providence Plantations Management’s Discussion and Analysis Fiscal Year Ended June 30, 2013
The relative mix of revenue and transfers by source for governmental activities remained fairly constant in fiscal year 2013 versus the prior fiscal year. Taxes continued to represent the largest source of revenue at 46% of the total while operating grants and contracts represented 35% of the total in fiscal year 2013. Chart 2 depicts the purposes that program expenses related to Governmental Activities were expended for during the fiscal year ended June 30, 2013.
Chart 2 - Program Expenses - Governmental Activities
General government
10%
Human services51%
Education23%
Public safety8%
Natural resources1%
Transportation5%
Interest2%
The relative mix of program expenses - governmental activities remained about the same in fiscal year 2013 as the prior fiscal year. A slight increase from 50% to 51% occurred in the percent of total spending that is directed towards human services programs. This was offset by a decline in spending on general government which went from 11% to 10% of the total, primarily because of careful management of costs.
20

State of Rhode Island and Providence Plantations Management’s Discussion and Analysis Fiscal Year Ended June 30, 2013
Chart 3 depicts the State’s sources of revenues from Business Type Activities for the fiscal year ended June 30, 2013.
Chart 3 - Revenues – Business Type Activities
Operating grants and contributions declined from 21% to 13% of total revenues - business type activities in fiscal year 2013 when compared to the prior fiscal year because of a significant reduction in spending on the employment insurance program. Chart 4 depicts the expenses and transfers related to Business Type Activities that were expended during the fiscal year ended June 30, 2013.
Chart 4 - Expenses and Transfers – Business Type Activities
The relative mix of expenses and transfers – business type activities changed significantly due to a reduction in the amount of benefits paid under the employment insurance program. In fiscal year 2013 such payments represented 34% of total business type expenses and transfers as compared to 41% in fiscal year 2012.
21

State of Rhode Island and Providence Plantations Management’s Discussion and Analysis Fiscal Year Ended June 30, 2013
Financial Analysis of the State’s Funds As noted earlier, the State uses fund accounting to ensure and demonstrate compliance with finance-related legal requirements. Governmental Funds The focus of the State's governmental funds is to provide information on near-term inflows, outflows, and balances of spendable resources. Such information is useful in assessing the State's financing requirements. At the end of the current fiscal year, the State's governmental funds reported a combined ending fund balance of $1,057.8 million, an increase of $67.3 million from June 30, 2012. A breakdown of the components follows (expressed in thousands):
PercentGovernmental Funds
Nonspendable $ 174 $ 174 $Restricted 942,335 852,147 90,188 10.58%Unrestricted
Committed 4,198 24,535 (20,337) -82.89%Assigned 105,894 97,957 7,937 8.10%Unassigned 5,210 15,657 (10,447) -66.72%
Total $ 1,057,811 $ 990,470 $ 67,341 6.80%
* Certain fiscal year balances were restated as discussed in Note 18(F).
2013 2012* Change
In the fund financial statements, governmental funds report fund balance as nonspendable, restricted, committed, assigned or unassigned primarily based on the extent to which the State is bound to honor constraints on how specific amounts can be spent. More information about each category is presented below:
Nonspendable fund balance – amounts that cannot be spent because they are either (a) not spendable in form or (b) legally or contractually required to be maintained intact.
Restricted fund balance – amounts with constraints placed on their use that are either (a) externally imposed by creditors, grantors, contributors, or laws or regulations of other governments; or (b) imposed by constitutional provisions, as is the case for the Budget Reserve and Cash Stabilization Account, or by law through enabling legislation enacted by the General Assembly.
Committed fund balance – amounts that can only be used for specific purposes determined by the enactment of legislation by the General Assembly, and that remain binding unless removed in the same manner. The underlying action that imposed the limitation must occur no later than the close of the fiscal year and must be binding unless repealed by the General Assembly.
Assigned fund balance – amounts that are constrained by the State’s intent to be used for specific purposes. The intent is generally established by legislation enacted by the General Assembly and is implemented at the direction of the Governor. This is also the classification for residual funds in the State’s special revenue funds.
Unassigned fund balance – the residual classification for the State’s General Fund that includes amounts not contained in the other classifications. In other funds, the unassigned classification is used only if expenditures incurred for specific purposes exceed the amounts restricted, committed, or assigned to those purposes.
Significant changes in fund balance are discussed below:
The increase in restricted fund balance is primarily a result of new debt issues in fiscal year 2013 reflected in certain capital projects funds.
22

State of Rhode Island and Providence Plantations Management’s Discussion and Analysis Fiscal Year Ended June 30, 2013
The increase in the assigned portion of the unrestricted fund balance is primarily attributable to
the general fund surplus that has been earmarked as a resource in the fiscal year 2014 budget. The major governmental funds of the primary government are: General Fund The General Fund is the chief operating fund of the State. The fund balance of the General Fund consisted of the following (expressed in thousands):
PercentRestricted $ 282,137 $ 232,348 $ 49,789 21.43%Unrestricted
Committed 4,035 22,793 (18,758) -82.30%Assigned 105,639 97,639 8,000 8.19%Unassigned 9,323 20,374 (11,051) -54.24%
Total $ 401,134 $ 373,154 $ 27,980 7.50%
2013 2012 Change
Revenues and transfers of the General Fund totaled $5,737.2 million in fiscal year 2013, an increase of $86.7 million or 1.53%, from the previous year. The revenues from various sources and the change from the previous year are shown in the following tabulation (expressed in thousands):
Percent
Taxes:Personal income $ 1,083,011 $ 1,059,119 $ 23,892 2.26%Sales and use 1,073,428 1,043,141 30,287 2.90%General business 375,014 355,457 19,557 5.50%Other 37,060 54,174 (17,114) -31.59%
Subtotal 2,568,513 2,511,891 56,622 2.25%
Federal grants 2,129,847 2,119,476 10,371 0.49%Restricted revenues 220,983 192,642 28,341 14.71%Licenses, fines, sales, and services 323,308 313,455 9,853 3.14%Other general revenues 57,537 71,059 (13,522) -19.03%
Subtotal 2,731,675 2,696,632 35,043 1.30%
Total revenues 5,300,188 5,208,523 91,665 1.76%
Transfers 437,012 441,953 (4,941) -1.12%
Total revenue and transfers $ 5,737,200 $ 5,650,476 $ 86,724 1.53%
2013 2012
Increase (decrease)
Amount
from 2012
Personal income taxes increased modestly between fiscal year 2012 and fiscal year 2013. Final payments, payments made with a return and extension payments, increased by 12.8 percent while withholding tax payments and estimated tax payments had more muted growth of 0.7 percent and 1.3 percent, respectively. These increases were offset in part by an increase in income tax refunds and adjustments paid of 4.0 percent. The spike in final tax payments and the increase in income tax refunds and adjustments paid are due in part to the 2012 Tax Amnesty Act which allowed taxpayers to pay overdue taxes while waiving late payment penalties and reducing the interest rate on overdue taxes by 25.0 percent. The 2012 tax amnesty program, which ran from September 1, 2012 through November 15, 2012, increased final income tax payments received by $5.3 million and increased income tax refunds
23

State of Rhode Island and Providence Plantations Management’s Discussion and Analysis Fiscal Year Ended June 30, 2013
and adjustments paid by $2.4 million. Accounting for these tax amnesty payments reduces the growth rate for final payments to 8.1 percent and reduces the growth rate for income tax refunds and adjustments paid to 3.1 percent. The modest increase in withholding tax payments in fiscal year 2013 compared to fiscal year 2012 is due to the State's improving economy which saw a decline in the State’s unemployment rate from 10.6 percent to 8.8 percent on a state fiscal year basis. The remaining taxes exhibited reasonable year-over-year growth with the exception of Other Taxes which fell by 31.59 percent in fiscal year 2013. This decline was attributable to a sharp drop off in estate and transfer taxes paid in fiscal year 2013 which declined on a nominal basis by $17.9 million or -38.6 percent. Chart 5 depicts the General Fund’s revenues and other sources for the fiscal year ended June 30, 2013.
Chart 5 – Revenues and Other Sources – General Fund
Personal income taxes19%
Sales and use taxes19%
General business taxes6%
Other taxes1%
Federal grants37%
Restricted revenues
4%
Licenses, fines, sales, and services
6%
Other general revenues
1%Transfers
7%
Expenditures and other uses totaled $5,709.2 million in fiscal year 2013, an increase of $161.0 million, or 2.90%, from the previous year. Changes in expenditures and other uses by function from the previous year are shown in the following tabulation (expressed in thousands):
Percent
General government $ 470,328 $ 474,135 $ (3,807) -0.80%Human services 3,042,705 2,969,166 73,539 2.48%Education 1,330,128 1,281,879 48,249 3.76%Public safety 463,734 459,114 4,620 1.01%Natural resources 70,145 75,141 (4,996) -6.65%Debt Service:
Principal 125,148 111,711 13,437 12.03%Interest 68,295 73,249 (4,954) -6.76%
Total expenditures 5,570,483 5,444,395 126,088 2.32%
Other uses 138,737 103,827 34,910 33.62%
Total expenditures and other uses $ 5,709,220 $ 5,548,222 $ 160,998 2.90%
Increase (decrease)
2013 2012 Amount
from 2012
The significant increase in the Human Services function is partially attributable to increased Medicaid costs, in both state and federal funds. In addition, there were substantial increases in costs pertaining to the Low Income Home Energy Assistance Program (LIHEAP) and the Supplemental Nutrition Assistance
24
State of Rhode Island and Providence Plantations Management’s Discussion and Analysis Fiscal Year Ended June 30, 2013
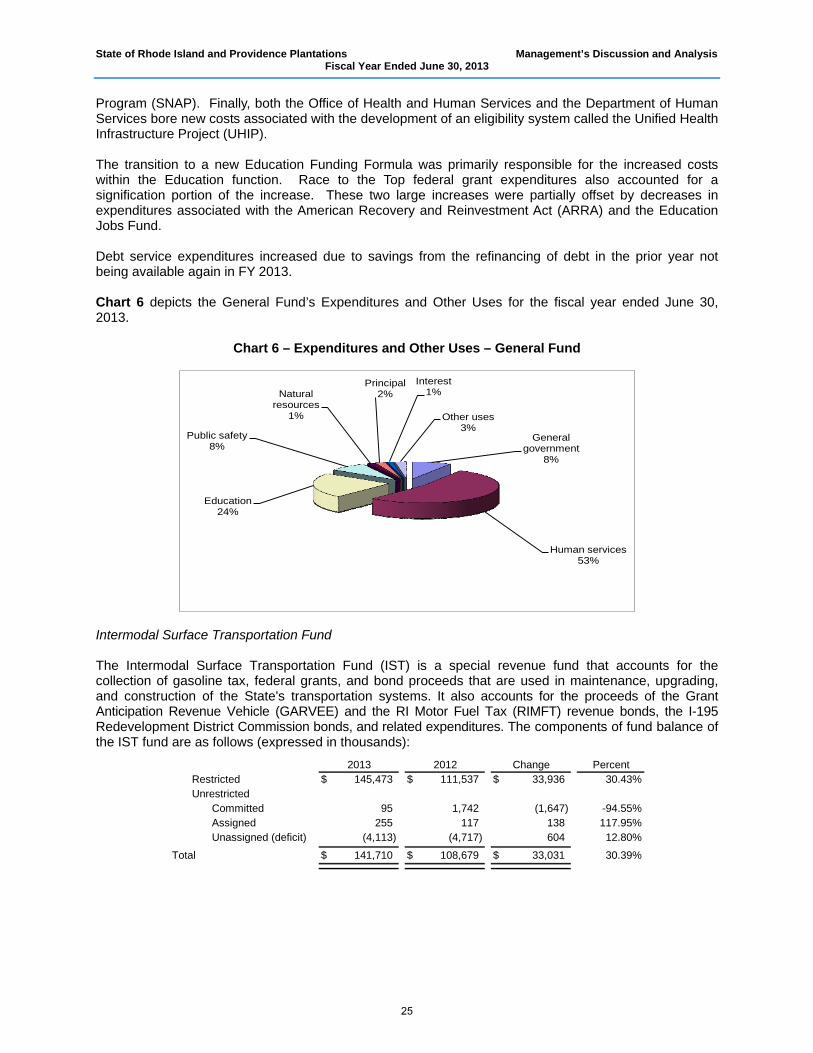
Program (SNAP). Finally, both the Office of Health and Human Services and the Department of Human Services bore new costs associated with the development of an eligibility system called the Unified Health Infrastructure Project (UHIP). The transition to a new Education Funding Formula was primarily responsible for the increased costs within the Education function. Race to the Top federal grant expenditures also accounted for a signification portion of the increase. These two large increases were partially offset by decreases in expenditures associated with the American Recovery and Reinvestment Act (ARRA) and the Education Jobs Fund. Debt service expenditures increased due to savings from the refinancing of debt in the prior year not being available again in FY 2013. Chart 6 depicts the General Fund’s Expenditures and Other Uses for the fiscal year ended June 30, 2013.
Chart 6 – Expenditures and Other Uses – General Fund
General government
8%
Human services53%
Education24%
Public safety8%
Natural resources
1%
Principal2%
Interest1%
Other uses3%
Intermodal Surface Transportation Fund The Intermodal Surface Transportation Fund (IST) is a special revenue fund that accounts for the collection of gasoline tax, federal grants, and bond proceeds that are used in maintenance, upgrading, and construction of the State's transportation systems. It also accounts for the proceeds of the Grant Anticipation Revenue Vehicle (GARVEE) and the RI Motor Fuel Tax (RIMFT) revenue bonds, the I-195 Redevelopment District Commission bonds, and related expenditures. The components of fund balance of the IST fund are as follows (expressed in thousands):
PercentRestricted $ 145,473 $ 111,537 $ 33,936 30.43%Unrestricted
Committed 95 1,742 (1,647) -94.55%Assigned 255 117 138 117.95%Unassigned (deficit) (4,113) (4,717) 604 12.80%
Total $ 141,710 $ 108,679 $ 33,031 30.39%
2013 2012 Change
25

State of Rhode Island and Providence Plantations Management’s Discussion and Analysis Fiscal Year Ended June 30, 2013
General Fund Budgetary Highlights – General Revenue Sources According to the State’s Constitution, general revenue appropriations in the general fund cannot exceed 97% of available general revenue sources. These sources consist of the current fiscal year’s budgeted general revenue plus the general fund undesignated fund balance from the prior fiscal year. Excess revenue is transferred to the State Budget Reserve Account. If the balance in the Reserve exceeds five percent of the total general revenues and opening surplus, the excess is transferred to the R.I. Capital Plan Fund to be used for capital projects. The budgets for the components of the current fiscal year’s general revenue estimates are established by the State’s revenue estimating conference. If actual general revenue is less than the projection, appropriations have to be reduced or additional revenue sources must be identified. Certain agencies have federal programs that are entitlements, which continue to require State funds to match the federal funds. Agencies may get additional appropriations provided a need is established. Adjustments to general revenue receipt estimates resulted in a slight increase of $2.9 million between the original budget and the final budget. General revenue appropriations decreased from the original budget by $62.0 million. Some significant changes between the preliminary and final estimated general revenues and the enacted and final general revenue appropriations (expressed in thousands) are listed below.
Revenues and sources:Taxes:
Personal income $ 1,080,857 $ 1,075,300 $ 1,085,765 $ 10,465General business 369,183 385,600 381,255 (4,345)Sales and use 1,085,833 1,068,200 1,073,428 5,228Other taxes 42,249 38,500 37,060 (1,440)
Departmental revenue 342,874 363,400 356,832 (6,568)Other sources:
Miscellaneous 4,440 5,665 4,166 (1,499)Lottery transfer 387,553 380,160 379,225 (935)Unclaimed property 7,900 7,000 6,269 (731)
Total revenues and other sources 3,320,889 3,323,825 3,324,000 175
Expenditures and other uses:General government 441,780 438,416 426,503 11,913Human services 1,294,456 1,245,771 1,243,282 2,489Education 1,118,040 1,111,779 1,111,267 512Public safety 404,750 401,398 398,648 2,750Natural resources 36,811 36,447 36,346 101
Total expenditures and other uses 3,295,837 3,233,811 3,216,046 17,765
Excess of revenues and other sourcesover expenditures and other uses $ 25,052 $ 90,014 $ 107,954 $ 17,940
BudgetOriginal Final
Budget Actual Variance
General Fund Budgetary Highlights
Final Budgetvs. Actual
General Revenue Sources
The positive variance from the fiscal year 2013 actual revenues to the fiscal year 2013 Original Budget for Personal Income Taxes is due in part to the stronger revenue performance of the 2012 tax amnesty program than was forecasted when the fiscal year 2013 Original Budget was enacted. The fiscal year 2013 Original Budget projected tax amnesty receipts for personal income tax of $3.0 million while actual personal income tax amnesty receipts came in at $5.7 million. In addition, actual personal income tax refunds and adjustments came in 4.0 percent below the original budget. These two positive changes in fiscal year 2013 actual revenues relative to the fiscal year 2013 Original Budget were offset in part by personal income tax withholding payments falling short of the Original Budget amount by 1.9 percent. Fiscal year 2013 actual sales and use tax revenues were 0.7 percent above the Final Budget amount
26

State of Rhode Island and Providence Plantations Management’s Discussion and Analysis Fiscal Year Ended June 30, 2013
reflecting the improved economic climate in the State. The decline in departmental revenue between the fiscal year 2013 Final Budget and the actual revenues was primarily the result of the state not receiving hospital license fee payments that were expected to be received. The positive expenditure variance in the General Government function of approximately $11.9 million was primarily in three agencies, Administration, Revenue and the General Assembly. Within Administration, the majority of the positive variance was in the Facilities Management program due to lower utility costs and/or usage, as well as personnel savings in many programs and unspent funds for the I-195 Commission that will be carried forward for expenditure in FY 2014. In the Revenue budget, the primary driver of the surplus was unspent local aid funds for local property revaluations, followed by personnel savings due to staff turnover. In the General Assembly budget, the positive variance was primarily in the grants category, where funds may be committed but not fully expended within the fiscal year. The entire surplus for the General Assembly is reappropriated to fiscal year 2014. The positive expenditure variance in the Human Services function of approximately $2.5 million was due to a positive variance of $8.1 million in the Office of Health and Human Services (OHHS), offset by negative variances in the Department of Human Services (DHS) of $1.8 million and the Department of Behavioral Healthcare, Developmental Disabilities and Hospitals (BHDDH) of $4.5 million. The OHHS positive variance was primarily in the Medicaid program due to final caseloads being lower than estimated by the Caseload Estimating Conference in May 2013. The DHS negative variance was primarily due to a payable established for a penalty imposed on the TANF program by the federal government over eligibility and verification discrepancies in a prior year audit. The BHDDH negative variance is primarily attributable to overtime expenditures due to staffing shortages in their 24/7 facilities. The positive expenditure variance in the Public Safety function of approximately $2.7 million was due to positive variances in the Department of Corrections (DOC) and the Department of Public Safety (DPS). The DOC surplus was the result of a number of equipment purchases not being received prior to the close of the fiscal year and thus requiring reappropriation of funds in fiscal year 2014 to cover the expense when it came due. The DPS surplus was primarily in the Security Services (Capitol Police and Sheriffs) program and was attributable to lower than anticipated equipment purchases, as well as savings from personnel turnover.
Capital Assets and Debt Administration Capital Assets The State's investment in capital assets for its governmental and business-type activities as of June 30, 2013, amounts to $3,661.7 million, net of accumulated depreciation of $2,328.4 million. This investment in capital assets includes land, buildings, improvements, equipment, infrastructure, and construction in progress. The total increase in the State's investment in capital assets for the current fiscal year was approximately 4.57% of net book value (as restated). This increase is primarily caused by investments in the construction and rehabilitation of highways and other infrastructure as discussed in the second paragraph below. Actual expenditures to purchase or construct capital assets were $303.2 million for the year. Of this amount $179.6 million was used to construct or reconstruct highways. Depreciation charges for the year totaled $156.2 million.
27

State of Rhode Island and Providence Plantations Management’s Discussion and Analysis Fiscal Year Ended June 30, 2013
Capital assets not being depreciatedor amortized
Land $ 375,225 $ 358,968 $ 45,558 $ 45,558 $ 420,783 $ 404,526Works of Art 2,389 1,414 2,389 1,414Intangibles 161,777 159,093 161,777 159,093Construction in progress* 594,657 450,433 446 24 595,103 450,457
Total capital assets not being depreciatedor amortized 1,134,048 969,908 46,004 45,582 1,180,052 1,015,490
Capital assets being depreciatedor amortized
Land improvements 3,700 3,700 3,700 3,700Buildings* 711,315 685,494 234,384 234,384 945,699 919,878Building improvements* 270,378 267,714 270,378 267,714Equipment* 253,089 244,916 27,080 25,646 280,169 270,562Intangibles 14,040 14,049 175 14,215 14,049Infrastructure* 3,295,847 3,193,823 3,295,847 3,193,823
4,548,369 4,409,696 261,639 260,030 4,810,008 4,669,726Less: Accumulated depreciation
or amortization* 2,190,034 2,055,332 138,373 128,152 2,328,407 2,183,484
Total capital assets being depreciatedor amortized 2,358,335 2,354,364 123,266 131,878 2,481,601 2,486,242
Total capital assets (net) $ 3,492,383 $ 3,324,272 $ 169,270 $ 177,460 $ 3,661,653 $ 3,501,732
*Certain f iscal year 2012 balances have been restated.
State of Rhode Island's Capital Assets as of June 30, 2013(Expressed in Thousands)
Governmental Activities Business-Type Activities Primary Government
2013 2012 2013 2012
Total
2013 2012
In fiscal year 2013, the State completed several significant capital projects, including the Sakonnet River Bridge in Tiverton/Portsmouth and the new Pawtucket River Bridge on Route I-95 in Pawtucket. Additional information on the State's capital assets can be found in Note 6 to the financial statements of this report. Debt Administration Under the State's Constitution, the General Assembly has no power to incur State debts in excess of $50,000 without the consent of the people (voters), except in the case of war, insurrection or invasion, or to pledge the faith of the State to the payment of obligations of others without such consent. At the end of the current fiscal year, the State’s governmental activities had total bonded debt outstanding of $2,337.8 million, of which $1,103.9 million is general obligation debt, $468.7 million is special obligation debt and $765.2 million is debt of the blended component units. Additionally, accreted interest of $83.1 million has been recognized for debt of one blended component unit, which is not scheduled to be paid until 2052. On an overall basis the State's total bonded debt decreased by $71.5 million during fiscal year 2013. This decrease consists of a $6.8 million decrease in general obligation debt, a decrease of $50.4 million in special obligation debt, and a decrease of $14.3 million in the blended component units’ debt. The general obligation debt is supported by the full faith and credit of the State. Other obligations subject to annual appropriation by the R.I. General Assembly totaled $396.7 million and are discussed in Note 7. The State’s assigned general obligation bond ratings are as follows: AA by Standard & Poor’s Ratings Services (S&P), Aa2 by Moody’s Investor Service, Inc. and AA by Fitch Ratings. The State does not have any debt limitation. Bonds authorized by the voters that remain unissued as of June 30, 2013 amounted to $244.6 million; other obligations that are authorized but unissued totaled $277.5 million and are described in Note 7. Additional information on the State's long-term debt can be found in the notes to the financial statements of this report.
28

State of Rhode Island and Providence Plantations Management’s Discussion and Analysis Fiscal Year Ended June 30, 2013
Conditions Expected to Affect Future Operations Fiscal Year 2014 Budget The first quarter report for fiscal year 2014 prepared by the State Budget Office contains estimates of annual expenditures based upon analysis of expenditures through the first quarter of fiscal year 2014, as well as caseload and medical assistance expenditure estimates and revenue estimates adopted at the November 2013 Caseload and Revenue Estimating Conferences. The fiscal year 2014 balance, based upon these assumptions, is estimated to reflect a $33.4 million surplus in the General Fund.
The Budget Office continues to review department and agency fiscal year 2014 expenditure plans in conjunction with the fiscal year 2015 budget process. Any changes recommended by the Governor to the fiscal year 2014 enacted appropriations, or adopted revenues, will be incorporated in the supplemental appropriations bill, which under current law must be submitted to the General Assembly in January 2014.
The November Revenue Estimating Conference’s estimates reflect recent revenue trends and expected collections based upon the current economic forecast. On the revenue side, general revenue receipts are expected to be $45.6 million more than enacted for fiscal year 2014. Taxes are expected to exceed enacted estimates by $31.0 million, while departmental revenues and other sources, including lottery revenues, are also expected to exceed enacted estimates by $14.6 million. The November Revenue Estimating Conference estimates that revenues will be $3,426.6 million as compared with the enacted estimate of $3,381.0 million for fiscal year 2014.
Lottery Revenue The General Fund derives more than 11% of general revenue from the Rhode Island Lottery. The Lottery’s video lottery operations currently compete with casinos in nearby Connecticut. In addition, Massachusetts lawmakers have passed a bill to allow three casinos and one slot parlor in that State. Massachusetts has developed a two-phase application process for potential operators and developers. The process is anticipated to be completed and operators selected during spring 2014. It is anticipated that there could be an adverse effect on the amount of revenue derived from video lottery facilities in Rhode Island. The Lottery and the State continually monitor the risk to gaming operations resulting from competition in nearby states. A statewide ballot referendum was approved in November 2012 to allow the expansion of gaming at the Twin River facility located in Lincoln, RI. The expansion allows the facility to offer casino style gaming (i.e., table games) to the public subject to the operational control by the Lottery and/or Department of Business Regulation. The expanded gaming went into operation in June 2013. Pension Benefits During fiscal year 2012, the General Treasurer and Governor undertook a comprehensive pension reform initiative with the goal of improving the funded status of the plans within the Employees’ Retirement System, reducing required employer contributions, and ensuring the long-term viability of the System. The General Assembly convened a special legislative session to address pension reform measures which were enacted on November 18, 2011.
The pension reform measures make significant changes to member benefit provisions including retirement eligibility age and service credit accrual factors. Additionally, cost of living allowances are generally suspended until the funded status of the plans improves and are now linked to performance of the System’s investments. A defined contribution plan has been implemented for most active employees to supplement the reduced benefits provided through the defined benefit plans. The restated unfunded liability of the plans is being reamortized over a 25 year period. See Note 13 for information about litigation that has been filed relating to these reforms.
29

State of Rhode Island and Providence Plantations Management’s Discussion and Analysis Fiscal Year Ended June 30, 2013
Other Postemployment Benefits (OPEB) Pursuant to legislation enacted by the General Assembly, the State established a trust in fiscal year 2011 to accumulate assets and pay benefits and other costs associated with its OPEB plans. In addition, effective in fiscal year 2011, all participating employers are required by law to fully fund the actuarially determined annual required contribution. In accordance with GASB Statement No. 45, the State began accounting for retiree health care benefits on an actuarial basis in fiscal year 2008. The most recent actuarial study completed as of June 30, 2011 has determined the State’s unfunded actuarial liability for all six plans included in the Rhode Island State Employees’ and Electing Teachers OPEB System to be $858.7 million. Based on a discount rate of 5.0%, the State and other participating employers’ annual required contribution was $56.8 million. For fiscal year 2013, the State funded the retiree health care program in accordance with law by contributing the actuarially required contribution. See Note 19 – Subsequent Events for information about future changes in the way benefits are provided to certain Medicare eligible retirees. Actuarial valuations of an ongoing plan involve estimates of the value of reported amounts and assumptions about the probability of occurrence of events far into the future. Examples include assumptions about future employment, mortality, and the healthcare cost trends. Amounts determined regarding the funded status of the plan and the annual required contributions of the employer are subject to continual revision as actual results are compared with past expectations and new estimates are made about the future. Future changes in healthcare costs, as well as investment returns and other assumptions, could significantly affect the level of contributions required of the State. Collective Bargaining The State is currently in negotiations with the various unions which represent certain State employees for new contracts that would be retroactively effective to July 1, 2013. Transportation Funding Initiatives In order to address possible future reductions in federal highway funding and the State’s aging transportation infrastructure, the Governor formed a Blue Ribbon Panel for Transportation Funding in 2008. The Panel reviewed Rhode Island’s aging transportation infrastructure, the projects required to maintain the transportation infrastructure for the next five years, and the available funding or shortfall in funding for such projects in light of the current status of the Federal Highway Trust Fund, and identified possible options for future funding. The Blue Ribbon Panel for Transportation Funding released its report in December, 2008. The Blue Ribbon Panel projected that the State would need to spend approximately $639.0 million per year during the next 10 years to maintain Rhode Island’s highway system in a state of good operation and repair but that state and federal funding only provided approximately $425.9 million in FY 2013. The Blue Ribbon panel suggested various funding strategies that could possibly be implemented to meet, in whole or in part, the $285 million funding gap each year. Such recommended funding strategies included levying a $3.00 toll on all cars and $6.00 on all trucks entering the State, imposing tolls on all bridges between Aquidneck Island and the mainland, raising passenger-vehicle registration fees, raising the State gasoline tax by as much as 15 cents per gallon, creation of a petroleum product gross receipts tax and a vehicle miles traveled fee. The various revenue strategies outlined would require legislation for implementation. Despite the temporary relief provided through America Recovery and Reinvestment Act (ARRA) funding, transportation infrastructure funding will continue to present challenges and the Blue Ribbon Panel funding strategies may be revisited. The Department of Transportation submitted an application to the Federal Highway Administration requesting permission to establish tolls on I-95, under a pilot program that permits tolling on roads that were constructed with federal funds, but has been informed that the final slot under this pilot program has been granted to another state.
The FY 2014 Appropriations Act established a Special Legislative Commission to make a comprehensive study of all types of funding mechanisms and strategies to support Rhode Island’s infrastructure.
30
State of Rhode Island and Providence Plantations Management’s Discussion and Analysis Fiscal Year Ended June 30, 2014
Unemployment Insurance Program The State has borrowed from the Federal Unemployment Trust Fund to continue to pay benefits to unemployed individuals. Outstanding borrowings through June 30, 2013 totaled $155.3 million and the State anticipates needing to continue borrowing in fiscal 2014 in order to fund unemployment benefit payments. The General Assembly passed legislation effective in fiscal years 2012 and 2013 increasing the taxable wage base for employers and reducing the maximum weekly benefit amounts to unemployed individuals. The Department of Labor and Training currently estimates that the combination of benefit adjustments and increased federal and state taxes could enable the State to repay its federal loans from the Federal Unemployment Trust Fund as soon as 2015. This estimate is based on the department’s projections of employment and unemployment levels assuming a gradual economic recovery and therefore is uncertain and subject to change. Google Inc. Settlement
An investigation by the United States Attorney’s Office in Rhode Island and the U.S. Food and Drug Administration’s Office of Criminal Investigations Rhode Island Task Force resulted in the forfeiture of $500 million in revenue by Google. The State of Rhode Island will receive approximately $110 million of that amount to be utilized for public safety purposes. Local Government Financial Matters
A number of local governments in the State continue to experience financial difficulties involving cumulative deficits, budgetary imbalances, unfunded pension and OPEB obligations, and rating agency downgrades. Most notably, the City of Central Falls was under the control of a State appointed receiver and subsequently filed for federal bankruptcy protection in August 2011. The Fourth Amended Plan of Debt Adjustment became effective on October 25, 2012 and allowed the City of Central Falls to emerge from bankruptcy. Under the plan, the City will have court-ordered balanced budgets for Fiscal Years 2013, 2014, 2015, 2016 and 2017 and will impose a 4 percent property tax increase in each of the next five years. Also, as a result of the agreement with the retirees, the City’s five-year budget plan contains affordable pay as you go pension and retiree health insurance costs based upon the restructured plans. The State has certain oversight responsibilities with respect to municipalities which are outlined in the General Laws and carried out by the Department of Revenue – Division of Municipal Finance and the Office of the Auditor General. The General Laws give the State, acting through the Department of Revenue, the power to implement three levels of oversight and control: fiscal overseer, budget commission, and state receiver. A State fiscal overseer and a budget commission were appointed for the City of East Providence in 2011. In September 2013 it was determined that the fiscal health of the City improved to a level that such oversight was no longer necessary. In addition, a budget commission was appointed for the City of Woonsocket in May 2012. The State is continually monitoring the financial status of all municipalities to forestall the need for more extensive intervention.
Requests for Information This report is designed to provide a general overview of the State’s finances and accountability for all of the State’s citizens, taxpayers, customers, investors and creditors. Questions concerning any of the information provided in this report or requests for additional information should be sent to [email protected]. The State’s Comprehensive Annual Financial Report may be found on the State Controller’s home page, http://controller.admin.ri.gov/index.php. Requests for additional information related to component units should be addressed to the entities as listed in Note 1 of the financial statements.
31

Basic Financial
Statements
State of Rhode Island
Fiscal Year Ended June 30, 2013

AssetsCurrent assets:
Cash and cash equivalents $ 871,900 $ 23,702 $ 895,602 $ 277,569Funds on deposit with fiscal agent 154,172 518 154,690Investments 18,034Receivables (net) 576,545 80,676 657,221 64,625Restricted assets:
Cash and cash equivalents 8,338 8,338 272,037Investments 69,319 69,319 38,693Receivables (net) 4,113Other assets 39,605
Due from primary government 19,142Due from component units 4,489 4,489 552Internal balances (4,625) 4,625Due from other governments and agencies 239,585 1,565 241,150 955Inventories 1,694 699 2,393 10,246Other assets 6,984 435 7,419 6,748
Total current assets 1,920,063 120,558 2,040,621 752,319
Noncurrent assets:Investments 165,375Receivables (net) 22,359 22,359 36,201Due from other governments and agencies 2,680 2,680Restricted assets:
Cash and cash equivalents 101,506Investments 370,144Other assets 1,555,854
Due from component units 55,415 55,415 1,394Capital assets - nondepreciable 1,134,048 46,004 1,180,052 230,599Capital assets - depreciable (net) 2,358,335 123,266 2,481,601 1,603,157Derivative instruments 26,883 26,883Other assets 18,287 3,610 21,897 185,693
Total noncurrent assets 3,618,007 172,880 3,790,887 4,249,923
Total assets 5,538,070 293,438 5,831,508 5,002,242
LiabilitiesCurrent Liabilities:
Accounts payable 624,836 19,574 644,410 93,908Due to primary government 4,489Due to component units 19,142 19,142 552Due to other governments and agencies 5,933 5,933 114Accrued expenses 4,408 4,408 30Unearned revenue 74,837 74,837Other current liabilities 105,110 105,110 196,406Current portion of long-term debt 223,727 13,533 237,260 194,446Obligation for unpaid prize awards 7,396 7,396
Total current liabilities 1,047,652 50,844 1,098,496 489,945
Noncurrent Liabilities:Due to primary government 55,415Due to other governments and agencies 155,276 155,276Net pension obligation 1,816 1,816Net OPEB obligation 11,341 11,341 46,878Unearned revenue 6,305 6,305 12,916Due to component units 1,394Notes payable 5,110 43 5,153 20,177Loans payable 41,375Obligations under capital leases 222,315 222,315 6,931Compensated absences 14,387 223 14,610 23,275Bonds payable 2,334,131 224,261 2,558,392 2,139,690Other liabilities 32,133 32,133 305,328
Total noncurrent liabilities 2,621,233 386,108 3,007,341 2,653,379
Total liabilities 3,668,885 436,952 4,105,837 3,143,324
Deferred inflows of resourcesFair value of hedging derivatives 26,883 26,883
Net position (deficit)Net investment in capital assets 2,488,755 (65,283) 2,423,472 1,120,009Restricted for:
Budget reserve 171,959 171,959Transportation 1,432 1,432Debt 114,242 8,340 122,582 284,019Assistance to other entities 98,293 98,293Temporary disability insurance program 154,004 154,004Other 112,022 112,022 169,563Nonexpendable 174 174 90,616
Unrestricted (1,298,579) (86,571) (1,385,150) 194,711
Total net position (deficit) $ 1,842,302 $ (143,514) $ 1,698,788 $ 1,858,918
State of Rhode Island and Providence Plantations
Statement of Net Position
June 30, 2013
Governmental Component
(Expressed in Thousands)
Business - TypeTotals
The notes to the financial statements are an integral part of this statement.
Units
Primary Government
Activities Activities
32

Primary government:Governmental activities:
General government $ 625,081 $ 220,376 $ 96,706 $ 1,852 $ (306,147) $ $ (306,147) $Human services 3,038,841 227,158 1,742,901 1,280 (1,067,502) (1,067,502)Education 1,364,575 26,840 219,585 121 (1,118,029) (1,118,029)Public safety 473,580 47,075 44,962 2,083 (379,460) (379,460)Natural resources 76,730 28,975 18,658 3,558 (25,539) (25,539)Transportation 300,639 1,076 88,988 181,657 (28,918) (28,918)Interest and other charges 129,714 (129,714) (129,714)
Total governmental activities 6,009,160 551,500 2,211,800 190,551 (3,055,309) (3,055,309)
Business-type activities:State lottery 397,625 775,993 378,368 378,368Convention center 48,437 22,485 (25,952) (25,952)Employment security 396,909 256,592 166,164 25,847 25,847
Total business-type activities 842,971 1,055,070 166,164 378,263 378,263
Total primary government $ 6,852,131 $ 1,606,570 $ 2,377,964 $ 190,551 (3,055,309) 378,263 (2,677,046)
Component units: $ 1,232,182 $ 616,480 $ 456,029 $ 86,943 (72,730)
General Revenues:Taxes:
Personal income 1,082,035 1,082,035General business 381,252 381,252Sales and use 1,070,648 1,070,648Gasoline 134,465 134,465Other 202,569 202,569
Interest and investment earnings 4,893 117 5,010 101,462Miscellaneous revenue 143,240 24,490 167,730 11,849Gain on sale of capital assets 3,757 3,757
Transfers (net) 333,804 (333,804)
Total general revenues and transfers 3,356,663 (309,197) 3,047,466 113,311
Change in net position 301,354 69,066 370,420 40,581Net position (deficit) - beginning as restated 1,540,948 (212,580) 1,328,368 1,818,337
Net position (deficit) - ending $ 1,842,302 $ (143,514) $ 1,698,788 $ 1,858,918
The notes to the financial statements are an integral part of this statement.
Functions/Programs ExpensesCharges for
contributions
State of Rhode Island and Providence Plantations
Statement of Activities
For the Fiscal Year Ended June 30, 2013
(Expressed in Thousands)
activities activitiescontributions Units
Net (Expense) Revenue and Changes in Net Position
Services
Program Revenues
TotalsGovernmental Business-type
Primary Government
Componentgrants and grants andCapitalOperating
33

Governmental
Special Revenue Funds - account for the proceeds of specific revenue sources that are legally restricted.
Intermodal Surface Transportation Fund – accounts for the collection of the gasoline tax, federal grants,and bond proceeds that are used in maintenance, upgrading, and construction of the state’s highwaysystem. It also accounts for the proceeds of the Grant Anticipation Revenue Vehicle (GARVEE) bonds, theRI Motor Fuel Tax (RIMFT) revenue bonds, and the I-195 Redevelopment District Commission bonds andrelated expenditures.
Proprietary
State Lottery Fund - operates lottery games for the purpose of generating resources for the State’sGeneral Fund.
Rhode Island Convention Center Authority - created in 1987 to facilitate the construction anddevelopment of a convention center, parking garages and related facilities within the City of Providence.RICCA is responsible for the management and operations of the R.I. Convention Center, Dunkin’ DonutsCenter and the Veteran’s Memorial Auditorium Arts and Cultural Center located in Providence.
Employment Security Fund – accounts for the State’s unemployment compensation benefits. Revenuesconsist of taxes assessed on employers and federal grants to pay benefits to qualified unemployed persons.
Major Funds
General Fund – is the operating fund of the State and is used to account for all financial transactions exceptthose required to be accounted for in another fund.
Enterprise Funds - account for operations where management has decided that periodic determination ofrevenues earned, expenses incurred (including depreciation), and/or net income is appropriate for capitalmaintenance, public policy, management control, accountability, or other purposes.
34

AssetsCash and cash equivalents $ 501,054 $ 19,292 $ 312,634 $ 832,980Funds on deposit with fiscal agent 109,234 44,938 154,172Restricted investments 69,319 69,319Receivables (net) 499,691 12,519 67,037 579,247Due from other funds 283 9,379 291 9,953Due from component units 454 454Due from other governments
and agencies 188,377 50,740 239,117Loans to other funds 15,568 84,546 100,114Other assets 367 367
Total assets $ 1,205,340 $ 201,618 $ 578,765 $ 1,985,723
Liabilities and Fund BalancesLiabilities
Accounts payable 548,672 31,657 29,488 609,817Due to other funds 15,714 15,714Due to component units 5,093 5,387 8,662 19,142Loans from other funds 84,545 9,608 94,153Unearned revenue 89,545 18,384 107,929Other liabilities 76,351 4,480 326 81,157
Total liabilities 804,206 59,908 63,798 927,912
Fund BalancesNonspendable 174 174Restricted 282,137 145,473 514,725 942,335Unrestricted
Committed 4,035 95 68 4,198Assigned 105,639 255 105,894Unassigned 9,323 (4,113) 5,210
Total fund balances 401,134 141,710 514,967 1,057,811
Total liabilities and fund balances $ 1,205,340 $ 201,618 $ 578,765 $ 1,985,723
GovernmentalFunds
(Expressed in Thousands)
OtherGovernmental
Funds
State of Rhode Island and Providence Plantations
Balance Sheet
Governmental Funds
June 30, 2013
Total
The notes to the financial statements are an integral part of this statement.
General
Intermodal
TransportationSurface
35

Fund balance - total governmental funds $ 1,057,811
Amounts reported for governmental activities in the Statement of Net Position are differentbecause:
Capital Assets used in the governmental activities are not financial resources and therefore arenot reported in the funds.
Capital assets 5,676,713Accumulated depreciation (2,186,648)
3,490,065Bonds, notes, certificates of participation, accrued interest and other liabilities are not due and
payable in the current period and therefore are not recorded in the governmental funds.
Compensated absences (78,392)Bonds payable (2,420,887)
Net premium/discount (58,619)Refunding costs 15,775Costs of issuance 10,720
Obligations under capital leases (232,975)Premium (18,441)Refunding costs 6,266Costs of issuance 2,463
Interest payable (21,871)Other liabilities (54,504)
(2,850,465)Other long-term assets and unearned revenue are not available to pay for current-period
expenditures and, therefore, are deferred in the funds.
Receivables 16,316Due from component units 59,450Other assets 5,104Unearned revenue 33,094
113,964Internal service funds are used by management to charge the costs of certain activities to
individual funds. The net position of the internal service funds is reported withgovernmental activities. 30,927
Net position - total governmental activities $ 1,842,302
The notes to the financial statements are an integral part of this statement.
(Expressed in Thousands)
State of Rhode Island and Providence PlantationsReconciliation of the Balance Sheet of the Governmental Funds
to the Statement of Net PositionJune 30, 2013
36

Revenues:Taxes $ 2,568,513 $ 134,465 $ 165,525 $ 2,868,503Licenses, fines, sales, and services 323,308 (2,541) 320,767Departmental restricted revenue 220,983 1,044 222,027Federal grants 2,129,847 272,597 2,402,444Income from investments 693 174 3,973 4,840Other revenues 56,844 43,876 46,370 147,090
Total revenues 5,300,188 452,156 213,327 5,965,671Expenditures:
Current:General government 470,328 163,682 634,010Human services 3,042,705 3,042,705Education 1,330,128 260 1,330,388Public safety 463,734 463,734Natural resources 70,145 57 70,202Transportation 372,083 1,804 373,887
Capital outlays 130,415 130,415Debt service:
Principal 125,148 36,057 15,765 176,970Interest and other charges 68,295 20,683 37,874 126,852
Total expenditures 5,570,483 428,823 349,857 6,349,163
Excess (deficiency) of revenuesover (under) expenditures (270,295) 23,333 (136,530) (383,492)
Other financing sources (uses):Bonds and notes issued 81,400 81,400Proceeds from refundings 88,175 88,175Proceeds from the sale of certificates
of participation 26,690 26,690Premium 27,507 27,507Transfers in 437,012 57,513 98,279 592,804Payment to refunded bonds escrow agent (101,172) (101,172)Transfers out (138,737) (47,815) (78,019) (264,571)
Total other financing sources (uses) 298,275 9,698 142,860 450,833
Net change in fund balances 27,980 33,031 6,330 67,341
Fund balances - beginning as restated 373,154 108,679 508,637 990,470
Fund balances - ending $ 401,134 $ 141,710 $ 514,967 $ 1,057,811
OtherGovernmental
Funds
State of Rhode Island and Providence Plantations
Statement of Revenues, Expenditures, and Changes in Fund Balances
Governmental Funds
For the Fiscal Year Ended June 30, 2013
(Expressed in Thousands)
The notes to the financial statements are an integral part of this statement.
TotalGovernmentalSurface
General Transportation
Intermodal
Funds
37

Net change in fund balances - total governmental funds $ 67,341
Amounts reported for governmental activities in the Statement of Activities are different because:
Governmental funds report capital outlays as expenditures. However, in the Statement of Activities the costof those assets is allocated over their estimated useful lives and reported as depreciation expense.Current year acquisitions are therefore deducted from expenses on the Statement of Activities, less current year depreciation expense and revenue resulting from current year disposals.
Capital outlay 315,644Depreciation expense (145,594)
170,050Bond, note, and certificate of participation proceeds provide current financial resources to governmental
funds by issuing debt which increases long-term debt in the Statement of Net Position. Repayments ofbond principal is an expenditure in the governmental funds, but the repayment reduces long-termliabilities in the Statement of Net Position.
Principal paid on debt 176,970Debt defeased in refunding 92,855Accrued interest and other charges (13,196)Proceeds from sale of debt (196,265)Deferral of premium/discount (27,507)Amortization of premium/discount 14,939Deferral of issuance costs 1,366Amortization of issuance costs (1,896)Deferral of refunding costs 5,523Amortization of refunding costs (1,281)
51,508Revenues (expenses) in the Statement of Activities that do not provide (use) current financial
resources are not reported as revenues (expenditures) in the governmental funds.
Compensated absences (666)Program expenses (3,321)Program revenue 8,707Capital grant revenue (95)General revenue - taxes 2,466General revenue-miscellaneous (3,779)
3,312Internal service funds are used by management to charge the costs of certain activities to individual funds.
The change in net position of the internal service funds is reported with governmental activities. 9,143
Change in net position - total governmental activities $ 301,354
The notes to the financial statements are an integral part of this statement.
(Expressed in Thousands)
State of Rhode Island and Providence PlantationsReconciliation of the Statement of Revenues, Expenditures, and
Changes in Fund Balances of the Governmental Funds to the Statement of ActivitiesFor the Fiscal Year Ended June 30, 2013
38

AssetsCurrent assets:
Cash and cash equivalents $ 18,915 $ 3,648 $ 1,139 $ 23,702 $ 38,737Restricted cash and cash equivalents 8,338 8,338Funds on deposit with fiscal agent 518 518Receivables (net) 7,325 677 72,674 80,676 6,488Due from other funds 1,859 3,967 5,826 1,437Due from other governments and agencies 1,565 1,565Inventories 699 699 1,692Other assets 42 393 435 6,610
Total current assets 26,981 14,915 79,863 121,759 54,964
Noncurrent assets:Capital assets - nondepreciable 46,004 46,004Capital assets - depreciable (net) 402 122,864 123,266 2,317Other assets 3,610 3,610
Total noncurrent assets 402 172,478 172,880 2,317
Total assets 27,383 187,393 79,863 294,639 57,281
LiabilitiesCurrent liabilities:
Accounts payable 13,942 5,632 19,574 17,642Due to other funds 1,201 1,201 301Due to other governments and agencies 5,933 5,933Loans from other funds 5,961Accrued expenses 4,408 4,408Unearned revenue 2,447 2,447Other current liabilities 671 671 2,450Notes payable 188 188Bonds payable 10,060 10,060Compensated absences 167 167Obligation for unpaid prize awards 7,396 7,396
Total current liabilities 27,785 18,327 5,933 52,045 26,354
Noncurrent liabilities:Due to other governments and agencies 155,276 155,276Unearned revenue 5,625 680 6,305Notes payable 43 43Bonds payable 224,261 224,261Compensated absences 223 223
Total noncurrent liabilities 5,848 224,984 155,276 386,108
Total liabilities 33,633 243,311 161,209 438,153 26,354Net Position (Deficit)
Net investment in capital assets 402 (65,685) (65,283) 2,317Restricted for:
Debt 8,340 8,340Unrestricted (6,652) 1,427 (81,346) (86,571) 28,610
Total net position (deficit) $ (6,250) $ (55,918) $ (81,346) $ (143,514) $ 30,927
State of Rhode Island and Providence PlantationsStatement of Net Position
June 30, 2013(Expressed in Thousands)
Proprietary Funds
The notes to the financial statements are an integral part of this statement.
GovernmentalActivitiesEnterprise Funds
Lottery Center
Business-type Activities--
InternalR.I.
ConventionSecurity Totals Service Funds
R.I. State Employment
39

Operating revenues:Charges for services $ $ 22,068 $ 256,592 $ 278,660 $ 284,447Lottery sales 253,365 253,365Video lottery, net 520,747 520,747Table games 1,881 1,881Federal grants 166,164 166,164Miscellaneous 417 417
Total operating revenues 775,993 22,485 422,756 1,221,234 284,447
Operating expenses:Personal services 6,212 14,344 20,556 11,983Supplies, materials, and services 241,384 9,574 250,958 268,724Prize awards, net of prize recoveries 149,878 149,878Depreciation and amortization 151 10,169 10,320 234Benefits paid 382,162 382,162
Total operating expenses 397,625 34,087 382,162 813,874 280,941
Operating income (loss) 378,368 (11,602) 40,594 407,360 3,506
Nonoperating revenues (expenses):Interest revenue 115 2 117 52Other nonoperating revenue 1,095 806 22,589 24,490 14Interest expense (14,350) (6,029) (20,379)Other nonoperating expenses (8,718) (8,718)
Total nonoperating revenue (expenses) 1,210 (13,542) 7,842 (4,490) 66
Income (loss) before transfers 379,578 (25,144) 48,436 402,870 3,572
Transfers in 272 23,423 22,532 46,227 7,400Transfers out (379,225) (806) (380,031) (1,829)
Change in net position 625 (1,721) 70,162 69,066 9,143
Net position (deficit) - beginning (6,875) (54,197) (151,508) (212,580) 21,784
Net position (deficit) - ending $ (6,250) $ (55,918) $ (81,346) $ (143,514) $ 30,927
The notes to the financial statements are an integral part of this statement.
InternalService FundsSecurity
EmploymentTotals
Business-type Activities--Enterprise Funds
GovernmentalActivities
R.I.Convention
CenterR.I. StateLottery
State of Rhode Island and Providence Plantations
Statement of Revenues, Expenses and Changes in Fund Net Position
Proprietary Funds
For the Fiscal Year Ended June 30, 2013
(Expressed in Thousands)
40

Cash flows from operating activities:Cash received from customers $ 254,142 $ 22,401 $ 254,458 $ 531,001 $ 279,520Cash received from video lottery operations, net 518,621 518,621Cash received from MUSL for grand prize winners 2,333 2,333Cash received from grants 167,066 167,066Cash payments to suppliers for goods and services (3,671) (8,078) (11,749) (267,427)Cash payments to employees (6,222) (14,535) (20,757) (12,870)Cash payments to prize winners (153,161) (153,161)Cash payments for commissions (233,345) (233,345)Cash payments for benefits (382,176) (382,176)Other operating revenue (expense) 14
Net cash provided by (used for) operating activities 378,697 (212) 39,348 417,833 (763)
Cash flows from noncapital financing activities:Loan from federal government 180,177 180,177Payment of interest on loan from federal government (7,573) (7,573)Loans from other funds 4,412Loans to other funds (868)Repayment of loans to other funds 849Repayment of loans from other funds (1,111)Transfers in 21,878 24,641 46,519 7,400Transfers out (380,638) (736) (381,374) (1,829)Net transfers from (to) fiscal agent (236,296) (236,296)
Net cash provided by (used for) noncapital financing activities (380,638) 21,878 (39,787) (398,547) 8,853
Cash flows from capital and related financing activities:Principal paid on capital obligations (51,073) (51,073)Interest paid on capital obligations (8,151) (8,151)Acquisition of capital assets (294) (1,376) (1,670) (82)Proceeds from the disposition of capital assets 8 8Proceeds from bonds 38,141 38,141
Net cash provided by (used for) capital and related financing activities (286) (22,459) (22,745) (82)
Cash flows from investing activities:Interest on investments 115 2 117 52
Net cash provided by investing activities 115 2 117 52
Net increase (decrease) in cash and cash equivalents (2,112) (791) (439) (3,342) 8,060Cash and cash equivalents, July 1 21,027 12,777 1,578 35,382 30,677
Cash and cash equivalents, June 30 $ 18,915 $ 11,986 $ 1,139 $ 32,040 $ 38,737
Reconciliation of operating income (loss) to net cashprovided by (used for) operating activities:Operating income (loss) 378,368 (11,602) 40,594 407,360 3,506
Adjustments to reconcile operating income (loss)to net cash provided by (used for) operatingactivities:
Depreciation and amortization 151 10,169 10,320 234Other revenue (expense) and operating transfer in (out) 469 887 1,356 14Net changes in assets and liabilities:
Receivables, net 243 424 (2,133) (1,466) (3,681)Inventory 116 116 18Prepaid items 51 51 (486)Other assets (38) (38)Due to / due from transactions 12 12Accounts and other payables (122) 1,254 1,132 519Accrued expenses 422 422 (887)Unearned revenue 26 (508) (482)Prize awards payable (950) (950)
Total adjustments 329 11,390 (1,246) 10,473 (4,269)
Net cash provided by (used for) operating activities $ 378,697 $ (212) $ 39,348 $ 417,833 $ (763)
(Expressed in Thousands)
Business-type Activities-- GovernmentalEnterprise Funds Activities
The notes to the financial statements are an integral part of this statement.
Lottery Security Totals
State of Rhode Island and Providence Plantations
Statement of Cash Flows
Proprietary Funds
For the Fiscal Year Ended June 30, 2013
Service FundsR.I. State Employment Internal
R.I.Convention
Center
41

Touro Jewish Synagogue – accounts for the earnings on monies bequeathed to the State for thepurpose of maintaining the Touro Jewish Synagogue.
Private-Purpose Trust – used to report all other trust arrangements under which principal and incomebenefit individuals, private organizations, or other governments.
Agency Funds – used to report resources held by the State in a purely custodial capacity (assets equalliabilities).
Fiduciary Funds
Fiduciary Funds – used to report assets held in a trustee or agency capacity for others and therefore cannot beused to support the State’s own programs.
Pension and Other Postemployment Benefits Trusts – used to report resources that are required to beheld in trust for the members and beneficiaries of the State sponsored defined benefit pension plans,defined contribution plan and other postemployment benefit plans.
External Investment Trust – Ocean State Investment Pool (OSIP) – Accounts for the share of the Ocean State Investment Pool that is external to the reporting entity.
42

AssetsCash and cash equivalents 5,931 $ $ $ 14,487
Deposits held as security for entitiesdoing business in the State 70,211
Advance held by claims processing agent 1,248
ReceivablesContributions 30,665Due from state for teachers 14,549Miscellaneous 16,417 7 1,891
Total receivables 61,631 7 1,891
Investments, at fair valueEquity in short-term investment fund 13,384Equity in pooled trust 7,599,444Other investments 122,405 2,267
Total investments 7,721,849 13,384 2,267
Total assets 7,790,659 13,391 2,267 $ 86,589
LiabilitiesAccounts payable 5,132 3 2,930Incurred but not reported claims 2,785Unearned revenue 6,064Deposits held for others 83,659
Total liabilities 13,981 3 $ 86,589
Net positionHeld in trust for:
Pension benefits 7,710,558Other postemployment benefits 66,120Other 13,388 2,267
Total net position $ 7,776,678 $ 13,388 $ 2,267
Purpose
The notes to the financial statements are an integral part of this statement.
Benefits Trusts Synagogue
State of Rhode Island and Providence Plantations
Statement of Fiduciary Net Position
June 30, 2013
(Expressed in Thousands)
Fiduciary Funds
Pension and ExternalInvestment Trust
AgencyPostemployment Touro JewishOcean State
Investment Pool
OtherPrivate
43

AdditionsContributions
Member contributions $ 190,355 $ $Employer contributions 370,498Supplemental employer contributions 15,690State contributions for teachers 70,703Interest on service credits purchased 1,002Service credit transfer payments 593From participants 12,178
Total contributions 648,841 12,178
Other income 1,256
Investment incomeNet appreciation in fair value of investments 711,597 224Interest 60,094 27Dividends 17,182 37Other investment income 7,877
796,750 27 261
Less investment expense 14,583 14
Net income from investing activities 782,167 13 261
Total additions 1,432,264 12,191 261
DeductionsRetirement benefits 899,223Death benefits 3,518Distributions 338 1,083 96Refund of contributions 11,941Administrative expense 7,507Service credit transfers 593OPEB benefits 53,803
Total deductions 976,923 1,083 96
Change in net position:Pension benefits 426,083Other postemployment benefits 29,258Other 11,108 165
Net position - beginning 7,321,337 2,280 2,102
Net position - ending $ 7,776,678 $ 13,388 $ 2,267
State of Rhode Island and Providence Plantations
Statement of Changes in Fiduciary Net Position
For the Fiscal Year Ended June 30, 2013
Fiduciary Funds
(Expressed in Thousands)
The notes to the financial statements are an integral part of this statement.
Other Purpose
Benefits Trusts SynagogueOcean State
Investment PoolPostemployment Touro Jewish
Pension and PrivateExternalInvestment Trust
44

State of Rhode Island and Providence PlantationsCombining Statement of Net Position
Component UnitsJune 30, 2013
(Expressed in Thousands)
AssetsCurrent Assets:
Cash and cash equivalents $ 47,167 $ 5,569 $ 166 $ 3,304 $ 2,051Investments 2,789 2,728Receivables (net) 5,229 2,748 4,295 72Restricted assets:
Cash and cash equivalents 22,654 12,894 5,365Investments 11,793 2,967 10,850Receivables (net) 2,437 1,676Other assets 52 390
Due from primary government 108 8,630Due from other governmentsDue from other component units 131 95Inventories 2,342 166Other assets 717 77 44 142 107
Total current assets 90,180 26,134 210 21,502 21,729
Noncurrent Assets:Investments 1,878 1,622 5,638Receivables (net) 127 4,551Restricted assets:
Cash and cash equivalents 50,692 6,401Investments 26,113 2,483Other assets 1,135
Capital assets - nondepreciable 47,885 129 17,052 3,760Capital assets - depreciable (net) 464,939 53 150,478 148,146Due from other component units 697Other assets, net of amortization 4,840 1,492 1,049
Total noncurrent assets 568,483 40,957 1,492 169,152 161,076
Total assets 658,663 67,091 1,702 190,654 182,805
Liabilities Current liabilities:
Accounts payable 3,455 589 43 7,794 8,065Due to primary government 454 930Due to other component unitsDue to other governmentsAccrued liabilitiesOther liabilities 15,313 3,846 118 5,859 3,077Current portion of long-term debt 11,672 2,566 32 2,595
Total current liabilities 30,894 7,001 161 14,615 13,737
Noncurrent liabilities:Due to primary government 3,575 14,978Due to other component unitsUnearned revenue 12,098Notes payable 151 5,000Loans payable 40,059Obligations under capital leasesNet OPEB obligation 37,397Other liabilities 3,717 8,200Compensated absencesBonds payable 281,480 28,698 38,400 61,059
Total noncurrent liabilities 325,265 44,513 38,400 60,575 66,059
Total liabilities 356,159 51,514 38,561 75,190 79,796
Net position (deficit)Net investment in capital assets 207,389 182 151,622 80,222Restricted for:
Debt 16,605Other 47,379 2,805Other nonexpendable
Unrestricted 47,736 12,590 (36,859) (36,158) 6,182
Total net position (deficit) $ 302,504 $ 15,577 $ (36,859) $ 115,464 $ 103,009
(Continued)
RITBARIAC RIPTARIEDC I-195 RDC
The notes to the financial statements are an integral part of this statement.
45

State of Rhode Island and Providence PlantationsCombining Statement of Net Position
Component UnitsJune 30, 2013
(Expressed in Thousands)
AssetsCurrent Assets:
Cash and cash equivalentsInvestmentsReceivables (net)Restricted assets:
Cash and cash equivalentsInvestmentsReceivables (net)Other assets
Due from primary governmentDue from other governmentsDue from other component unitsInventoriesOther assets
Total current assets
Noncurrent Assets:InvestmentsReceivables (net)Restricted assets:
Cash and cash equivalentsInvestmentsOther assets
Capital assets - nondepreciableCapital assets - depreciable (net)Due from other component unitsOther assets, net of amortization
Total noncurrent assets
Total assets
Liabilities Current liabilities:
Accounts payableDue to primary governmentDue to other component unitsDue to other governmentsAccrued liabilitiesOther liabilitiesCurrent portion of long-term debt
Total current liabilities
Noncurrent liabilities:Due to primary governmentDue to other component unitsUnearned revenueNotes payableLoans payableObligations under capital leasesNet OPEB obligationOther liabilitiesCompensated absencesBonds payable
Total noncurrent liabilities
Total liabilities
Net position (deficit)Net investment in capital assetsRestricted for:
DebtOtherOther nonexpendable
Unrestricted
Total net position (deficit)
$ 124,156 $ 20,627 $ 17,302 $ 57,227 $ 277,56912,517 18,034
30,295 4,777 4,518 12,691 64,625
231,124 272,03713,083 38,693
4,11339,163 39,605
6,198 2,069 2,137 19,142955 955326 552
2,749 508 820 3,661 10,2461,326 120 4,215 6,748
164,724 27,981 22,760 377,099 752,319
129,805 22,832 2,461 1,139 165,37515,653 4,785 40 11,045 36,201
745 92 3,973 39,603 101,506341,548 370,144
27,194 1,002 784 1,525,739 1,555,85427,763 15,406 13,277 105,327 230,599
557,036 109,895 61,605 111,005 1,603,157697 1,394
12,806 24 165,482 185,693
771,002 154,012 82,164 2,301,585 4,249,923
935,726 181,993 104,924 2,678,684 5,002,242
39,142 8,567 3,537 22,716 93,9081,600 890 615 4,489
552 552114 11430 30
1,341 1,352 165,500 196,40629,129 6,883 7,200 134,369 194,446
69,871 17,681 12,704 323,281 489,945
17,305 14,632 4,925 55,4151,394 1,394
818 12,9161,334 13,692 20,177
834 482 41,3756,565 366 6,931
9,481 46,87812,815 3,753 22 276,821 305,32817,789 1,915 840 2,731 23,275
233,835 18,364 2,954 1,474,900 2,139,690
289,143 39,998 8,741 1,780,685 2,653,379
359,014 57,679 21,445 2,103,966 3,143,324
351,442 89,220 66,096 173,836 1,120,009
267,414 284,01955,118 4,003 3,936 56,322 169,56374,528 16,078 10 90,61695,624 15,013 13,437 77,146 194,711
$ 576,712 $ 124,314 $ 83,479 $ 574,718 $ 1,858,918
(Concluded)
OtherComponent
UnitsURI TotalsRIC CCRI
The notes to the financial statements are an integral part of this statement.
46

State of Rhode Island and Providence PlantationsCombining Statement of Activities
Component UnitsFor the Fiscal Year Ended June 30, 2013
(Expressed in Thousands)
Expenses $ 61,286 $ 34,690 $ 39,177 $ 120,045 $ 21,945 $ 471,094 $ 141,851 $ 117,076 $ 225,018 $ 1,232,182
Program revenues:Charges for services 50,320 2,518 33,239 19,031 308,739 70,800 42,492 89,341 616,480Operating grants and contributions 4,927 28,474 2,495 65,073 163,258 63,411 78,664 49,727 456,029Capital grants and contributions 6,427 7 28,896 26,936 14,525 3,275 6,877 86,943
Total program revenues 61,674 30,992 2,502 127,208 19,031 498,933 148,736 124,431 145,945 1,159,452
Net (Expenses) Revenues 388 (3,698) (36,675) 7,163 (2,914) 27,839 6,885 7,355 (79,073) (72,730)
General revenues:Interest and investment earnings 47 4,130 497 10,702 2,092 340 83,654 101,462Miscellaneous revenue 965 254 991 1,675 353 7,611 11,849
Total general revenue 47 4,130 965 751 11,693 3,767 693 91,265 113,311
Change in net position 435 432 (36,675) 8,128 (2,163) 39,532 10,652 8,048 12,192 40,581
Net position (deficit) - beginning as restated 302,069 15,145 (184) 107,336 105,172 537,180 113,662 75,431 562,526 1,818,337
Net position (deficit) - ending $ 302,504 $ 15,577 $ (36,859) $ 115,464 $ 103,009 $ 576,712 $ 124,314 $ 83,479 $ 574,718 $ 1,858,918
OtherComponent
UnitsRIAC RIEDC I-195 RDC RIPTA TotalsCCRIURI RICRITBA
The notes to the financial statements are an integral part of this statement.
47

State of Rhode Island and Providence Plantations Fiscal Year Ended June 30, 2013
Notes to Basic Financial Statements
48
Index
Note 1. Summary of Significant Accounting Policies. ......................................................... 50 A. Basis of Presentation ............................................................................................ 50 B. Reporting Entity ..................................................................................................... 50 C. Financial Statement Presentation ........................................................................ 54 D. Measurement Focus and Basis of Accounting ................................................... 57 E. Cash and Cash Equivalents .................................................................................. 57 F. Funds on Deposit with Fiscal Agent .................................................................... 57 G. Investments ........................................................................................................... 57 H. Receivables ............................................................................................................ 57 I. Due From Other Governments and Agencies .................................................... 58 J. Interfund Activity ................................................................................................... 58 K. Inventories ............................................................................................................. 58 L. Capital Assets ........................................................................................................ 58 M. Bonds Payable. ...................................................................................................... 59 N. Obligations under Capital Leases ........................................................................ 59 O. Compensated Absences ....................................................................................... 59 P. Other Assets and Liabilities ................................................................................. 59 Q. Deferred Inflows/Outflows – Derivative Investments ......................................... 59 R. Fund Balances ....................................................................................................... 60 S. Recently Issued Accounting Standards .............................................................. 60 T. Changes in Reporting Entity ................................................................................. 61 U. Changes in Financial Reporting and Financial Statement Presentation .......... 62
Note 2. Cash, Cash Equivalents, Investments, and Funds in Trust ................................... 63 A. Primary Government-Governmental and Business-Type Activities ................. 63 B. Concentration of Credit Risk ................................................................................ 68 C. Pension Trusts ....................................................................................................... 68 D. OPEB Trust Funds ................................................................................................. 75 E. Private Purpose Trust ........................................................................................... 77 F. Agency Funds ........................................................................................................ 77
Note 3. Hedging Derivatives ................................................................................................. 77
Note 4. Receivables ............................................................................................................... 78
Note 5. Intra-Entity Receivables and Payables ................................................................... 79
Note 6. Capital Assets ............................................................................................................ 80
Note 7. Long-Term Liabilities ................................................................................................ 82 A. Changes in Long-Term Liabilities ........................................................................ 82 B. Bonds Payable ....................................................................................................... 83 C. Notes Payable ........................................................................................................ 87 D. Loans Payable........................................................................................................ 88 E. Obligations Under Capital Leases. ....................................................................... 88

State of Rhode Island and Providence Plantations Notes to Basic Financial Statements Fiscal Year Ended June 30, 2013
F. Defeased Debt ......................................................................................................... 90 G. Conduit Debt ........................................................................................................... 90 H. Short-Term Borrowing ........................................................................................... 90 I. Pollution Remediation Liabilities ............................................................................ 90 J. Due to Other Governments and Agencies ............................................................ 91 K. Compensated Absences ........................................................................................ 91 L. Arbitrage Rebate ..................................................................................................... 91 M. Due to the Primary Government ........................................................................... 91 N. Other Long-Term Liabilities ................................................................................... 91
Note 8. Net Position/Fund Balances ..................................................................................... 92
Note 9. Taxes ........................................................................................................................... 93
Note 10. Operating Transfers ................................................................................................. 94
Note 11. Operating Lease Commitments .............................................................................. 94
Note 12. Commitments ........................................................................................................... 95
Note 13. Contingencies .......................................................................................................... 99
Note 14. Employer Pension Plans ......................................................................................... 104
Note 15. Other Post-Employment Benefits .......................................................................... 110
Note 16. Deferred Compensation .......................................................................................... 116
Note 17. Risk Management .................................................................................................... 116
Note 18. Other Information ..................................................................................................... 117 A. Elimination Entries ................................................................................................ 117 B. Related Party Transactions .................................................................................. 117 C. Budgeting, Budgetary Control, and Legal Compliance ..................................... 118 D. Significant Transactions with Component Units ................................................ 119 E. Individual Fund Deficits ........................................................................................ 119 F. Restatements – Net Position and Fund Balances ............................................... 119
Note 19. Subsequent Events .................................................................................................. 120
49

State of Rhode Island and Providence Plantations Notes to Basic Financial Statements Fiscal Year Ended June 30, 2013
Note 1. Summary of Significant Accounting Policies
A. Basis of Presentation
The accompanying basic financial statements of the State of Rhode Island and Providence Plantations (the State) and its component units have been prepared in conformance with generally accepted accounting principles (GAAP) for governments as prescribed by the Governmental Accounting Standards Board (GASB). GASB is the accepted standard setting body for establishing governmental accounting and financial reporting principles.
B. Reporting Entity
The accompanying financial statements include all funds of the State and its component units. GASB Statement No. 14, The Financial Reporting Entity, as amended by GASB Statement No. 39, Determining Whether Certain Organizations are Component Units and GASB Statement No. 61, The Financial Reporting Entity: Omnibus, defines component units as a) legally separate entities for which the elected officials of the primary government (such as the State) are financially accountable, or b) legally separate entities for which a primary government is not financially accountable but whose exclusion from the State’s financial statements would cause said statements to be misleading. GASB has set forth criteria to be considered in determining financial accountability. The primary government (the State) is financially accountable if it appoints a voting majority of the entity’s governing body and (1) it is able to impose its will on that entity or (2) there is a potential for the entity to provide specific financial benefits to, or to impose specific financial burdens on, the State. Also, the State is financially accountable if an entity is fiscally dependent on the State and there is the potential for the entity to provide specific financial benefits to, or to impose specific financial burdens on, the State, regardless of the State’s appointment power over the governing body. The State has considered all agencies, boards, commissions, public benefit authorities and corporations, the State university and colleges and the Central Falls School District to be potential component units. Audited financial statements of the individual component units can be obtained from their respective administrative offices. Those entities that were deemed to be component units were included as such because of the entity’s relationship with the State as determined by application of GASB statements 14, 39, and 61. Blended Component Units A component unit should be reported as part of the primary government and blended into the appropriate funds in any of the following circumstances:
The component unit provides services entirely or almost entirely to the primary government, or otherwise exclusively, or almost exclusively, benefits the primary government even though it does not provide services directly to it;
The component unit’s governing body is substantively the same as the governing body of the primary government and (a) there is a financial benefit or burden relationship between the primary government and the component unit, or (b) management of the primary government has operational responsibility for the component unit; or
The component unit’s total debt outstanding is expected to be repaid entirely or almost entirely with resources of the primary government.
The following component units are reported as part of the primary government in both the fund and government-wide financial statements. Rhode Island Convention Center Authority (RICCA) The RICCA was established by State law as a single purpose building authority to finance the development of convention and other event facilities in Providence, RI. RICCA is responsible for the management and operations of the R.I. Convention Center, Dunkin’ Donuts Center and the Veteran’s Memorial Auditorium Arts and Cultural Center located in Providence. RICCA is dependent upon annual State appropriations of lease revenue by the General Assembly to fund debt service on its outstanding bonds. For more detailed information, a copy of the financial statements can be obtained by writing to the R.I. Convention Center Authority, One LaSalle Square, Providence, RI 02903.
50
State of Rhode Island and Providence Plantations Notes to Basic Financial Statements Fiscal Year Ended June 30, 2013
Tobacco Settlement Financing Corporation (TSFC) TSFC was organized in June 2002 as a public corporation by the State. TSFC is legally separate and provides services exclusively to the State through the purchase of its future tobacco settlement revenues. TSFC is authorized to issue bonds necessary to provide sufficient funds for carrying out its purpose. TSFC’s purchase of tobacco settlement revenues from the State did not meet all the requirements of a sale of future revenues and consequently, consistent with generally accepted accounting principles, the TSFC is reflected as a blended component unit. For more detailed information, a copy of the financial statements can be obtained by writing to the Tobacco Settlement Financing Corporation, One Capitol Hill, Providence, RI 02908. Rhode Island Public Rail Corporation (RIPRC) This corporation was created and established for the purpose of enhancing and preserving the viability of commuter rail operations in the State. Currently its primary purpose, as outlined in the State’s General Laws, is to provide indemnity for rail service operating within the State. The State is fully responsible for reimbursing the RIPRC for all costs associated with the purchase of such coverage. Separately issued financial statements are not available for the RIPRC. Discretely Presented Component Units Discretely presented component units are reported in a separate column in the government-wide financial statements to emphasize that they are legally separate from the primary government. They are financially accountable to the primary government, or have relationships with the primary government such that exclusion would cause the reporting entity's financial statements to be misleading. For each discretely presented component unit the potential exists for a financial burden or benefit to be imposed on the State as a result of the existence of the component unit. For the discretely presented component units (DPCU’s) included in the State’s CAFR, the State, generally acting through the Governor, appoints a voting majority of the component units’ governing boards. These discretely presented component units primarily serve or benefit those outside of the primary government. The State distinguishes between major and nonmajor component units based upon the nature and significance of the component unit’s relationship to the State. The factors underlying this determination include the type and dollar value of services provided to the citizens of the State, the presence of significant transactions with the State, and a significant benefit or burden relationship with the State. Discretely presented component units, grouped by major and nonmajor categories, are as follows: Major Component Units
Rhode Island Airport Corporation (RIAC) This corporation was created in 1992 and its purpose is to undertake the management, operation, maintenance and improvements of the six airports in the State. Revenues of RIAC include airline and concession contract revenues, federal grants, licenses, and permits. The RIAC leases the land on which the State’s largest airport is located and reimburses the State annually for general obligation proceeds utilized for airport projects. For more detailed information, a copy of the financial statements can be obtained by writing to the Chief Financial Officer, Rhode Island Airport Corporation, 2000 Post Road, Warwick, RI 02886 or at www.pvdairport.com. Rhode Island Economic Development Corporation (RIEDC) This corporation was created in 1995 and its purpose is to promote and encourage the preservation, expansion, and sound development of new and existing industry, business, commerce, agriculture, tourism, and recreational facilities in the State, so as to promote economic development. It has the power to issue tax-exempt bonds to accomplish its corporate purpose. The RIEDC has one component unit, the Small Business Loan Fund Corporation, which was created for the purpose of granting secured and unsecured loans to Rhode Island’s small business community. The RIEDC’s activities are largely supported by State appropriations and the RIEDC has used its debt issuance authority to finance various economic
51

State of Rhode Island and Providence Plantations Notes to Basic Financial Statements Fiscal Year Ended June 30, 2013
development initiatives on behalf of the State. For more detailed information, a copy of the financial statements can be obtained by writing to the Director of Finance and Administration, R.I. Economic Development Corporation, 315 Iron Horse Way, Suite 101, Providence, RI 02903, or at www.riedc.com. I-195 Redevelopment District Commission (I-195 RDC) This commission was created in 2011 by the Rhode Island General Assembly, to oversee, plan, implement, and administer the development of land reclaimed from the Interstate 195 relocation project and the Washington Bridge project. Upon completion of the redevelopment of the I-195 land, the commission will oversee the sale of the land in an attempt to maximize the economic benefits for the State. The commission issued debt and utilized the proceeds to reimburse the primary government for the fair value of the land acquired from the State. The State will appropriate amounts to the commission for debt service and operating assistance until sufficient land sale proceeds are available to fund these expenses. Proceeds from land sales are expected to fund the majority of the debt service. For more detailed information, a copy of the financial statements can be obtained by writing to the Director of Finance and Administration, Rhode Island Economic Development Corporation, 315 Iron Horse Way, Suite 101, Providence, RI 02903. Rhode Island Public Transit Authority (RIPTA) This authority was established in 1964 to acquire any mass motor bus transportation system that has filed a petition to discontinue its service, provided that the Authority has determined it to be in the public interest to continue such service. Revenues of RIPTA include passenger revenue and operating assistance grants from the State and federal governments. In addition to significant operating assistance, the State has also forgiven certain debt service obligations owed to the primary government as a means to provide additional financial assistance to the Authority. For more detailed information, a copy of the financial statements can be obtained by writing to the Finance Department, R.I. Public Transit Authority, 265 Melrose Street, Providence, RI 02907, or at www.ripta.com. Rhode Island Turnpike and Bridge Authority (RITBA) This authority was created by the General Assembly as a body corporate and politic, with powers to construct, acquire, maintain and operate bridge projects as defined by law. The authority is responsible for the maintenance and operation of the Claiborne Pell, Mount Hope, Jamestown, and Sakonnet River Bridges which are a vital segment of the State’s infrastructure. Title relating to the Jamestown and Sakonnet River bridges has remained with the State, thus those capital assets are reported within the primary government on the State’s government-wide financial statements. The Claiborne Pell and Mount Hope bridges are reported as capital assets of the authority. For more detailed information, a copy of the financial statements can be obtained by writing to the Executive Director, R.I. Turnpike and Bridge Authority, P.O. Box 437, Jamestown, RI 02835-0437, or at www.ritba.org. University and Colleges The Board of Education has oversight responsibility for the University of Rhode Island, Rhode Island College and the Community College of Rhode Island. The university and colleges are funded through State appropriations, tuition, federal grants, private donations and grants. For more detailed information, a copy of the financial statements can be obtained by writing to Office of the Controller, University of Rhode Island, 75 Lower College Road, Kingston, RI 02881; Office of the Controller, Rhode Island College, 600 Mount Pleasant Avenue, Providence, RI 02908; and Office of the Controller, Community College of Rhode Island, 400 East Avenue, Warwick, RI 02886-1805. The financial statements can also be viewed at www.ribghe.org. Nonmajor Component Units Central Falls School District The Central Falls School District (“District”) is governed by a seven member board of trustees that is appointed by the State’s Board of Education (“Board”). As a result of the enactment of Chapter 312 of Rhode Island Public Laws of 1991, the State of Rhode Island assumed responsibility for the administration and operational funding of the Central Falls School District effective July 1, 1991. In June 2002, Chapter 16-2 of the Rhode Island General Laws established the board of trustees to govern the Central Falls School District in a manner consistent with most local school committees. In addition, the Commissioner of
52

State of Rhode Island and Providence Plantations Notes to Basic Financial Statements Fiscal Year Ended June 30, 2013
Education and the Board have oversight over the development and approval of the District’s operating budget and for other significant operating decisions and contracts. The District, which provides elementary and secondary education to residents of the City of Central Falls, is funded primarily through State appropriations and federal grant funds. For more detailed information, a copy of the financial statements can be obtained by writing to the Central Falls School District, 949 Dexter Street – Lower Level, Central Falls, RI 02863-1715. Rhode Island Higher Education Assistance Authority (RIHEAA) This authority was created by law in 1977 for the dual purpose of guaranteeing loans to students in eligible institutions and administering other programs of post-secondary student assistance. The authority receives significant appropriations from the State annually to administer certain scholarship and grant programs on its behalf. For more detailed information, a copy of the financial statements can be obtained by writing to the Chief Financial Officer, R.I. Higher Education Assistance Authority, 560 Jefferson Boulevard, Warwick, RI 02886, or at www.riheaa.org. Rhode Island Housing and Mortgage Finance Corporation (RIHMFC) This corporation, established in 1973, was created in order to expand the supply of housing available to persons of low and moderate income and to stimulate the construction and rehabilitation of housing and health care facilities in the State. It has the power to issue notes and bonds to achieve its corporate purpose. Certain debt issued by the RIHMFC is secured in part by capital reserve funds which the Generally Assembly may, but is not required to, appropriate amounts to fund any deficiencies in such reserves. For more detailed information, a copy of the financial statements can be obtained by writing to the Chief Financial Officer, R.I. Housing and Mortgage Finance Corporation, 44 Washington Street, Providence, RI 02903-1721, or at www.rhodeislandhousing.org. Rhode Island Industrial Facilities Corporation (RIIFC) The purpose of this corporation is to issue revenue bonds, construction loan notes and equipment acquisition notes for the financing of projects which further industrial development in the State. All bonds and notes issued by RIIFC are payable solely from the revenues derived from leasing or sale by RIIFC of its projects. The bonds and notes do not constitute a debt or pledge of the faith and credit of RIIFC or the State and, accordingly, have not been reported in the accompanying financial statements. Certain obligations of the RIIFC are secured by mortgages which are insured by the Rhode Island Industrial-Recreational Building Authority for which the State’s full faith and credit is pledged. For more detailed information, a copy of the financial statements can be obtained by writing to the Director of Finance and Administration, R.I. Industrial Facilities Corporation, 315 Iron Horse Way, Suite 101, Providence, RI 02903, or at www.riedc.com. Rhode Island Industrial-Recreational Building Authority (RIIRBA) This authority is authorized to insure first mortgages and first security agreements granted by financial institutions and the Rhode Island Industrial Facilities Corporation for companies conducting business in the State. The authority’s insurance of first mortgages and first security agreements is backed by a pledge of the full faith and credit of the State. For more detailed information, a copy of the financial statements can be obtained by writing to the Director of Finance and Administration, R.I. Industrial-Recreational Building Authority, 315 Iron Horse Way, Suite 101, Providence, RI 02903, or at www.riedc.com. Rhode Island Resource Recovery Corporation (RIRRC) This corporation was established in 1974 in order to provide and/or coordinate solid waste management services to municipalities and persons within the State. RIRRC has the power to issue negotiable bonds and notes to achieve its corporate purpose. The RIRRC coordinates and administers a statewide recycling program and has periodically transferred amounts to the State’s general fund as operating assistance. Additionally, the State is one of several potentially responsible parties for the costs of remedial actions at the RIRRC’s superfund site. For more detailed information, a copy of the financial statements can be obtained by writing to the R.I. Resource Recovery Corporation, 65 Shun Pike, Johnston, RI 02919, or at www.rirrc.org.
53

State of Rhode Island and Providence Plantations Notes to Basic Financial Statements Fiscal Year Ended June 30, 2013
Rhode Island Water Resources Board Corporate (RIWRBC) This board was created by law to foster and guide the development of water resources, including the establishment of water supply facilities, and to lease these facilities to cities, towns, districts, and other municipal, quasi-municipal or private corporations engaged in the water supply business in the State. RIWRBC is authorized to issue revenue bonds which are payable solely from revenues generated by the lease of its facilities or the sale of water. All administrative duties of the board are being performed by the State Division of Planning as RIWRBC transfers all functions, programmatic and financial, to the Rhode Island Clean Water Finance Agency, a related organization of the State, upon repayment of the RIWRBC’s existing debt due to be fully repaid in fiscal 2015. For more detailed information, a copy of the financial statements can be obtained by writing to the R.I. Water Resources Board Corporate, One Capitol Hill, Providence, RI 02908. Quonset Development Corporation (QDC) This corporation was established in 2004 as a real estate development and management company for the Quonset Point/Davisville Industrial Park. Its purpose is to promote the preservation, expansion, and development of new and existing industry and business, in order to stimulate and support diverse employment opportunities in the State. The State has provided funding for certain capital improvements required at the industrial park to aid in its expansion and development. For more detailed information, a copy of the financial statements can be obtained by writing to the Finance Director, Quonset Development Corporation, 95 Cripe Street, North Kingstown, RI 02852 or at www.quonset.com. Related Organizations The following are “related organizations” under GASB Statement No. 14, The Financial Reporting Entity, as amended by GASB Statement No. 39, Determining Whether Certain Organizations are Component Units and Statement No. 61, The Financial Reporting Entity: Omnibus: Rhode Island Student Loan Authority, Narragansett Bay Commission, Rhode Island Health and Education Building Corporation, and Rhode Island Clean Water Finance Agency. The State is responsible for appointing a voting majority of the members of each entity’s board. However, the State’s accountability does not extend beyond the appointments. These entities do not meet the criteria for inclusion as component units of the State and therefore are not part of these financial statements.
C. Financial Statement Presentation
Government-wide Financial Statements The government-wide financial statements (i.e., the Statement of Net Position and the Statement of Activities) report information on all nonfiduciary activities of the primary government and its component units. For the most part, the effect of interfund activity has been removed from these statements. Governmental activities, which normally are supported by taxes and intergovernmental revenues, are reported separately from business-type activities, which rely to a significant extent on fees and charges for support. Likewise, the primary government is reported separately from certain legally separate component units for which the primary government is financially accountable. The Statement of Net Position presents the reporting entity's nonfiduciary assets and liabilities, with the difference reported as net position. The net position is reported in three categories:
Net investment in capital assets – This category reflects the portion of net position associated with capital assets, net of accumulated depreciation and the amount of outstanding bonds and other debt attributable to the acquisition, construction or improvement of those assets. Restricted – This category represents the portion of net position whose use is subject to constraints that are either a) imposed externally by creditors, grantors or contributors, or b) imposed by law through constitutional provisions or enabling legislation. Unrestricted – This category represents the portion of net position that does not meet the definition of the two preceding categories. The use of the unrestricted net position is often subject to constraints imposed by management, but such constraints can be removed or modified.
54

State of Rhode Island and Providence Plantations Notes to Basic Financial Statements Fiscal Year Ended June 30, 2013
The Statement of Activities demonstrates the degree to which the direct expenses of a given function are offset by program revenues. Direct expenses are those that are specifically associated with a service, program, or department and, thus, are clearly identifiable to a particular function. The State includes certain centralized services charged through internal service funds as direct expenses by charging these amounts directly to departments and programs. The State does not allocate indirect costs amongst the functional expenditure categories. Program revenues include 1) charges to customers or applicants who purchase, use, or directly benefit from goods, services, or privileges provided by a given function, and 2) grants and contributions that are restricted to meeting the operational or capital requirements of a particular function. Taxes and other items not properly included among program revenues are reported instead as general revenues. Fund Financial Statements Separate financial statements are provided for governmental funds, proprietary funds, and fiduciary funds, even though the latter are excluded from the government-wide financial statements. Major individual governmental funds and enterprise funds are reported as separate columns in the fund financial statements, with nonmajor funds being combined into a single column. The State reports the following fund types: Governmental Fund Types
Special Revenue Funds - These funds account for the proceeds of specific revenue sources that are legally restricted to expenditures for specified purposes and where a separate fund is legally mandated. Capital Projects Funds - These funds reflect transactions related to resources received and used for the acquisition, construction, or improvement of capital facilities of the State and its component units. Debt Service Fund – This fund is used to account for and report financial resources that are restricted, committed, or assigned to expenditure for principal and interest. Debt service funds are used to report resources if legally mandated or when financial resources are being accumulated for principal and interest maturing in future years. Permanent Fund - The Permanent School Fund accounts for certain resources and the earnings thereon, which are used for the promotion and support of public education.
Proprietary Fund Types
Internal Service Funds - These funds account for, among other things, employee medical benefits, State fleet management, unemployment and workers' compensation for State employees, prison industry operations, surplus property, telecommunications and other utilities, and records maintenance.
Enterprise Funds - These funds may be used to report any activity for which a fee is charged to external users for goods and services.
Fiduciary Fund Types Pension and Other Post-Employment Benefit Trust Funds
Pension Trust Funds - These funds account for the activities of the Employees' Retirement System, Municipal Employees' Retirement System, State Police Retirement Benefit Trust, Judicial Retirement Benefit Trust, Rhode Island Judicial Retirement Fund Trust, and the defined contribution retirement plan which accumulate resources for pension benefit payments to eligible employees.
55

State of Rhode Island and Providence Plantations Notes to Basic Financial Statements Fiscal Year Ended June 30, 2013
Other Post-Employment Benefit (OPEB) Trust Funds - These funds account for the activities of the Rhode Island State Employees’ and Electing Teachers OPEB System, which accumulate resources for other post-employment benefit payments to eligible employees.
External Investment Trust – This fund accounts for the share of the Ocean State Investment Pool that is owned by participants external to the reporting entity.
Private Purpose Trust Fund - The Touro Jewish Synagogue Fund accounts for the earnings on monies bequeathed to the State for the purpose of maintaining the Touro Jewish Synagogue. Agency Funds - These funds account for assets held by the State pending distribution to others, assets pledged to the State as required by statute, and health insurance for certain employees and retirees of a component unit.
In accordance with GASB Statement No. 34, Basic Financial Statements - and Management's Discussion and Analysis for State and Local Governments, the focus in the fund financial statements is on major and nonmajor funds rather than on fund type. Statement No. 34 defines the general fund as a major fund. Other governmental funds and enterprise funds are evaluated on these criteria:
Total assets, liabilities, revenues, or expenditures/expenses of that fund are at least 10% of the respective total for all funds of that type, and
Total assets, liabilities, revenues, or expenditures/expenses of that fund are at least 5% of the
same respective total for all funds being evaluated. Major Funds Governmental funds: General Fund This is the State's primary operating fund. It accounts for all financial resources of the general government, except those required to be accounted for in another fund. Intermodal Surface Transportation Fund This fund accounts for the collection of the gasoline tax, federal grants, and bond proceeds that are used in maintenance, upgrading, and construction of the State's highway system. It also accounts for the proceeds from the Grant Anticipation Revenue Vehicle (GARVEE) bonds, the RI Motor Fuel Tax (RIMFT) revenue bonds, the I-195 Redevelopment District Commission bonds, and related expenditures. Proprietary funds: State Lottery Fund The State Lottery Fund, a division of the Department of Revenue, operates games of chance for the purpose of generating resources for the State's General Fund. For more detailed information, a copy of the financial statements can be obtained by writing to the Rhode Island Lottery, 1425 Pontiac Avenue, Cranston, RI 02920, or at www.rilot.com. Rhode Island Convention Center Authority (RICCA) The RICCA was established by State law as a single purpose building authority to finance the development of convention and other event facilities in Providence, RI. RICCA is responsible for the management and operations of the R.I. Convention Center, Dunkin’ Donuts Center and the Veteran’s Memorial Auditorium Arts and Cultural Center located in Providence.
56

State of Rhode Island and Providence Plantations Notes to Basic Financial Statements Fiscal Year Ended June 30, 2013
Employment Security Fund This fund accounts for the State's unemployment compensation program. Revenues consist of taxes assessed on employers to pay benefits to qualified unemployed persons. Funds are also provided by the federal government, interest income, and loans from the Federal Unemployment Trust Fund.
D. Measurement Focus and Basis of Accounting
The government-wide financial statements are reported using the economic resources measurement focus and the accrual basis of accounting, as are the proprietary fund and fiduciary fund financial statements. Revenues are recorded when earned and expenses are recorded when a liability is incurred, regardless of the timing of related cash flows. Grants and similar items are recognized as revenue as soon as all eligibility requirements imposed by the provider have been met. Governmental fund financial statements are reported using the current financial resources measurement focus and the modified accrual basis of accounting. Revenues and related receivables are recognized as soon as they are both measurable and available. Revenues are considered to be available when they are collectible within the current period (i.e., earned and collected within the next 12 months) or soon enough thereafter to pay liabilities of the current period. Significant sources of tax revenues susceptible to accrual are recorded as taxpayers earn income (personal income and business corporation taxes), as sales are made (sales and use taxes) and as other taxable events occur (miscellaneous taxes), net of estimated tax refunds. Expenditures generally are recorded when a liability is incurred, as under accrual accounting. However, expenditures for principal and interest on long-term debt and compensated absences are recorded when payments come due. Expenditures and liabilities relating to other claims and judgments are recorded to the extent that such amounts are expected to be paid within the current period. Proprietary funds distinguish operating revenues and expenses from nonoperating items. Operating revenues and expenses generally result from providing services and producing and delivering goods in connection with a proprietary fund's principal ongoing operations. The principal operating revenues of the enterprise and internal service funds are charges to customers for sales and services. Operating expenses for enterprise and internal service funds include the cost of sales and services, administrative expenses and depreciation on capital assets. All revenues and expenses not meeting these definitions are reported as nonoperating revenues and expenses. The State’s enacted budget designates the source of funds for expenditures. When a type of expenditure is allocable to multiple funding sources, generally the State uses restricted resources first, then unrestricted resources as they are needed.
E. Cash and Cash Equivalents
Cash represents amounts in demand deposit accounts with financial institutions. Cash equivalents are highly liquid investments with a maturity of three months or less at the time of purchase. Cash equivalents are stated at cost, which approximates fair value except for those of the Ocean State Investment Pool which are stated at amortized cost, which approximates fair value. Except for certain internal service funds, the State does not pool its cash deposits. For those internal service funds that pool cash, each fund reports its share of the cash on the Statement of Net Position.
F. Funds on Deposit with Fiscal Agent
Funds on deposit with fiscal agent in the governmental activities and business-type activities represent the unexpended portion of debt instruments sold primarily for capital acquisitions and historic tax credit financing, as well as funds held by the United States Treasury for the payment of unemployment benefits, respectively.
G. Investments
Investments have a maturity of more than three months and are generally stated at fair value. Fair value is the amount at which a financial instrument could be exchanged in a current transaction between willing parties, as opposed to a forced or liquidation sale.
H. Receivables
Receivables are stated net of estimated allowances for uncollectible amounts, which are determined based upon past collection experience. Within governmental funds, an allowance for unavailable (amounts not expected to be collected in the next twelve months) amounts is also reflected.
57

State of Rhode Island and Providence Plantations Notes to Basic Financial Statements Fiscal Year Ended June 30, 2013
I. Due From Other Governments and Agencies
Due from other governments and agencies is primarily comprised of amounts due from the federal government for reimbursement-type grant programs.
J. Interfund Activity
In general, eliminations have been made to minimize the double counting of internal activity, including internal service fund type activity, on the government-wide financial statements. However, in order to avoid distorting the direct costs and program revenues of the applicable functions, interfund services provided and used between different functional categories have not been eliminated.
The Due From/To Other Funds are reported at the net amount on the fund financial statements. Transfers between governmental and business-type activities are reported at the net amount on the government-wide financial statements. In the fund financial statements, transactions for services rendered by one fund to another are treated as revenues of the recipient fund and expenditures/expenses of the disbursing fund. Reimbursements of expenditures/expenses made by one fund for another are recorded as expenditures/expenses in the reimbursing fund and as a reduction of expenditures/expenses in the reimbursed fund. Transfers represent flows of assets between funds of the primary government without equivalent flows of assets in return and without a requirement for payment.
K. Inventories
Inventory type items acquired by governmental funds are accounted for as expenditures at the time of purchase. Inventories of the proprietary funds are stated at cost (first-in, first-out). Inventories of university and colleges are stated at the lower of cost (first-in, first-out and retail inventory method) or market, and consist primarily of bookstore and dining, health and residential life services items. Inventories of all other component units are stated at cost.
L. Capital Assets
Capital assets, which include land, intangible assets not being amortized, construction in progress, land improvements, buildings, building improvements, furniture and equipment (which also includes subcategories for vehicles and computer systems), depreciable intangibles (computer software), and infrastructure (e.g., roads, bridges, dams, piers) are reported in the applicable governmental or business-type activities columns in the government-wide financial statements. Capital assets are recorded at historical cost or estimated historical cost. Donated capital assets are recorded at estimated fair value at the date of donation. Intangible assets not being amortized consist mostly of perpetual land rights such as conservation, recreational, and agricultural easements. Applicable capital assets are depreciated or amortized using the straight-line method (using a half-year convention). Capitalization thresholds and estimated useful lives for depreciable capital asset categories of the primary government are as follows:
Cap ita lization
Thresho lds E st imated Usefu l Lives
Capital Assets (Depreciable)
Land improvements $1 million 20 years
Buildings $1 million 20 - 50 years
Building Improvements $1 million 10 - 20 years
Furniture and equ ipment $5 thousand 3 - 10 years
Intang ib les $1 million 5 yearsInfrastructure $1 million 7 - 75 years
Asset Category
The costs of normal maintenance and repairs that do not add to the value of the asset or materially extend asset lives are not capitalized. Interest incurred during the construction of capital facilities is not capitalized. Capital assets acquired in the governmental funds are recorded as capital outlay expenditures in capital projects funds and current expenditures by function in other governmental fund financial statements.
58

State of Rhode Island and Providence Plantations Notes to Basic Financial Statements Fiscal Year Ended June 30, 2013
Depreciation and amortization are recorded in the government-wide financial statements, proprietary funds, fiduciary funds and component unit financial statements. Capital assets of the primary government are depreciated using the straight-line method over the assets’ estimated useful life. The State has recorded its investment in intangible assets, which includes certain land rights such as conservation and agricultural easements as well as certain rights of way obtained by the State. These easements tend to be of a perpetual nature and thus are not amortized. Intangible assets also include the State’s capitalization of internally developed or substantially customized computer software, which is amortized over a 5-year period. The State has included its investment in intangible assets within Note 6, Capital Assets. Discretely presented component units have adopted estimated useful lives for their capital assets as well as capitalization thresholds. These entities depreciate capital assets using the straight-line method.
M. Bonds Payable
In the Statement of Revenues, Expenditures, and Changes in Fund Balances-Governmental Funds, bond discounts, premiums, and issuance costs are recognized in the current period. In the government-wide financial statements bond discounts, premiums, issuance costs and deferred amounts on refundings are deferred and amortized over the term of the bonds using the outstanding principal method. For proprietary fund types and component units, bond discounts, premiums, deferred amounts on refundings, discounts, and issuance costs are generally deferred and amortized over the term of the bonds using the straight-line method for issuance costs and the interest method for premiums and discounts. Bond premiums and discounts are presented as adjustments to the face amount of the bonds payable. Deferred bond issuance costs are included in other assets.
N. Obligations under Capital Leases
The construction and acquisition of certain office buildings, campus facilities and other public facilities, as well as certain equipment acquisitions, have been financed through bonds and notes issued by a trustee pursuant to a lease/purchase agreement with the State (See Note 7(E)).
O. Compensated Absences
Vacation pay may be discharged, subject to limitations as to carry-over from year to year, by future paid leave or by cash payment upon termination of service. Sick pay may be discharged by payment for an employee's future absence caused by illness or, to the extent of vested rights, by cash payment upon death or retirement. Also, an additional category of leave obligation has been established as a result of pay reductions taken by certain classes of employees. For governmental fund types, such obligations are recognized when paid. For the government-wide financial statements and proprietary fund types, they are recorded as liabilities when earned.
P. Other Assets and Liabilities
Other assets reported within the primary government mainly consist of deposits required by contract with the State’s healthcare claims administrator. Other liabilities include 1) escrow deposits, accrued salary and fringe benefits for the governmental fund types; 2) accrued interest payable, accrued salaries, accrued vacation and sick leave for the proprietary fund types; and 3) escrow deposits, landfill closure costs, accrued expenses, and arbitrage and interest payable for the component units.
Q. Deferred Inflows/Outflows – Derivative Investments
The State reported deferred inflows of resources on the Statement of Net Position relating to the fair value of two interest-earning investment contracts that the Tobacco Settlement Financing Corporation, a blended component unit, entered into in 2002 in conjunction with the issuance of tobacco settlement revenue bonds. The change in the fair value of these instruments is deferred and recognized as investment income consistent with the timing of the purchase of investments pursuant to the related investment contract. See Note 3 for complete details of this derivative transaction.
59

State of Rhode Island and Providence Plantations Notes to Basic Financial Statements Fiscal Year Ended June 30, 2013
R. Fund Balances
In the fund financial statements, governmental funds report fund balance as nonspendable, restricted, committed, assigned or unassigned based primarily on the extent to which the State is bound to honor constraints on how specific amounts can be spent. More information about each category is presented below:
Nonspendable – amounts that cannot be spent because they are either (a) not spendable in form or (b) legally or contractually required to be maintained intact.
Restricted – amounts with constraints placed on their use that are either (a) externally imposed by creditors, grantors, contributors, or laws or regulations of other governments; or (b) imposed by constitutional provisions, as is the case for the Budget Reserve and Cash Stabilization Fund, or (c) by law through enabling legislation enacted by the General Assembly.
Committed – amounts that can only be used for specific purposes as established through the enactment of legislation by the General Assembly, and that remain binding unless modified or rescinded through subsequent legislative action. The underlying action that imposed the limitation must occur no later than the close of the fiscal year and must be binding unless repealed by the General Assembly.
Assigned – amounts that are constrained by the State’s intent that they be used for specific purposes. The intent is generally established by legislation enacted by the General Assembly and is implemented at the direction of the Governor. This is also the classification for residual funds in the State’s special revenue funds.
Unassigned – the residual classification for the State’s General Fund that includes amounts not contained in the other classifications. In other funds, the unassigned classification is used only if expenditures incurred for specific purposes exceed the amounts restricted, committed, or assigned to those purposes.
When both restricted and unrestricted resources are available for use, it is the State’s policy to use restricted resources first, followed by unrestricted resources. Unrestricted resources, when available for a particular use, are used in the following order: committed, assigned, and unassigned.
S. Recently Issued Accounting Standards
During the fiscal year ended June 30, 2013, the State adopted the following new accounting standards issued by GASB:
GASB Statement No. 60 – Accounting and Financial Reporting for Service Concession Arrangements. This Statement establishes guidance for accounting and financial reporting for service concession arrangements (SCAs). These arrangements are often referred to as public-private partnerships or public-public partnerships (PPP). Implementation of this standard did not impact the State’s financial statements. GASB Statement No. 61 – The Financial Reporting Entity: Omnibus an amendment of GASB Statements No. 14 and No. 34. This Statement modifies existing requirements for the assessment of potential component units in determining which entities should be included in the financial reporting entity, how those component units should be displayed (blending vs. discrete presentation), and certain disclosure requirements. The implementation of this standard resulted in a number of changes in reported discretely presented component units and related organizations within the State’s reporting entity. GASB Statement No. 62 – Codification of Accounting and Financial Reporting Guidance Contained in Pre-November 30, 1989 FASB and AlCPA Pronouncements. This Statement incorporates into the GASB’s authoritative literature certain accounting and financial reporting guidance included in Financial Accounting Standards Board and AICPA pronouncements issued on or before November 30, 1989. Implementation of this standard did not significantly impact the State’s financial statements.
60

State of Rhode Island and Providence Plantations Notes to Basic Financial Statements Fiscal Year Ended June 30, 2013
GASB Statement No. 63 – Financial Reporting of Deferred Outflows of Resources, Deferred Inflows of Resources, and Net Position. Deferred outflows of resources represent the consumption of the State’s net position that is applicable to a future reporting period. Deferred inflows of resources represent the acquisition of net position that is applicable to a future period. GASB 63 prescribes the reporting requirements for these two elements and requires that the title of the statement of net assets be changed to the statement of net position. In addition to this financial statement title change, implementation of this standard resulted in the reporting of a deferred inflows of resources on the State’s government-wide financial statements relating to the fair value of a hedging derivative.
The State will adopt the following new accounting pronouncements in future years:
GASB Statement No. 65 – Items Previously Reported as Assets and Liabilities. This Statement specifies the items that were previously reported as assets and liabilities that should now be reported as deferred outflows of resources, deferred inflows of resources, outflows of resources, or inflows of resources. The requirements of this Statement are effective for financial statements for periods beginning after December 15, 2012. GASB Statement No. 66 – Technical Corrections – 2013 – an amendment to GASB No. 10 and No. 62. The requirements of this Statement are effective for financial statements for periods beginning after December 15, 2012. GASB Statement No. 67 – Financial Reporting for Pension Plans – an amendment to GASB Statement No. 25. This Statement replaces the requirements of Statements No. 25 and No. 50 related to pension plans that are administered through trusts or equivalent arrangements. The requirements of Statements No. 25 and No. 50 remain applicable to pension plans that are not administered through trust or equivalent arrangements. The requirements of this Statement are effective for financial statements for fiscal years beginning after June 15, 2013. GASB Statement No. 68 – Accounting and Financial Reporting for Pensions - an amendment to GASB Statement No. 27. This Statement replaces the requirements of Statements No. 27 and No. 50 related to pension plans that are administered through trusts or equivalent arrangements. The requirements of Statements No. 27 and No. 50 remain applicable for pensions that are not administered as trusts or equivalent arrangements. The requirements of this Statement are effective for financial statements for fiscal years beginning after June 15, 2014. GASB Statement No. 69 – Government Combinations and Disposals of Governmental Operations. The requirements of this Statement are effective for financial statements for fiscal years beginning after June 15, 2013. GASB Statement No. 70 – Accounting and Financial Reporting for Nonexchange Financial Guarantees. The requirements of this Statement are effective for financial statements for fiscal years beginning after June 15, 2013.
GASB Statement Nos. 65, 68 and 70, in particular, could impact the State’s recognition of assets and liabilities in government-wide and/or fund financial statements. The requirements of these statements may require the restatement of beginning net position and fund balances in future periods. The State is currently not planning to early implement these statements, and has made no estimation of the effect these statements will have on the financial statements, except for GASB Statement No. 65. GASB Statement No. 65 requires that issue costs for long-term debt be expensed in the year incurred. The State estimates that the beginning net position for fiscal year 2014 will decrease by approximately $13 million due to the implementation of GASB Statement No. 65. This will result from the write-off of deferred issuance costs on certain long-term debt.
T. Changes in Reporting Entity
As discussed above in fiscal year 2013 the State implemented GASB Statement No. 61 – The Financial Reporting Entity: Omnibus an amendment of GASB Statements No. 14 and No. 34. After a full review of all
61

State of Rhode Island and Providence Plantations Notes to Basic Financial Statements Fiscal Year Ended June 30, 2013
existing component units the following entities are no longer considered component units as they do not present the potential to provide a financial benefit or impose a financial burden on the State.
Rhode Island Student Loan Authority Narragansett Bay Commission Rhode Island Health and Educational Building Corporation Rhode Island Clean Water Finance Agency The College Crusade of Rhode Island
Except for The College Crusade of Rhode Island, the above entities met the criteria to be related organizations of the State. In addition, the Rhode Island Public Telecommunications Authority is no longer a component unit as its operations have been assumed by the Rhode Island PBS Foundation. See Note 18F regarding restatements of prior period net position for the State’s discretely presented component units resulting from changes in the State’s reporting entity resulting from the implementation of GASB Statement No. 61.
U. Changes in Financial Reporting and Financial Statement Presentation
Changes in Financial Reporting
(a) The Tobacco Settlement Financing Corporation modified its revenue recognition policy for tobacco settlement revenues (TSRs) by recognizing the revenue and related receivables at the time of the domestic shipment of cigarettes as opposed to when the TSRs are received. TSRs recognized for fiscal year 2013 included an accrual of $23.2 million. See details regarding the restatement of the TSFC’s beginning net position relating to this change in Note 18F.
Changes in Financial Statement Presentation
(a) As a result of the reexamination of all potential component units in conjunction with the implementation of GASB Statement No. 61 – The Financial Reporting Entity: Omnibus an amendment of GASB Statements No. 14 and No. 34, it was determined that Quonset Development Corporation, Rhode Island Airport Corporation, and the I-195 Redevelopment District Commission are component units of the State. In each instance the entities have the potential to provide a financial benefit or impose a financial burden on the State. They were formerly included as component units of the Rhode Island Economic Development Corporation.
The implementation of GASB Statement No. 61 also resulted in changes to those entities identified as major component units in the State’s financial reporting entity. The RI Housing and Mortgage Finance Corporation and RI Resource Recovery Corporation are reported as nonmajor for fiscal year 2013 after previously being reported as major component units in previous financial statements. The RI Turnpike and Bridge Authority is reported as major for fiscal year 2013 after previously being reported as a nonmajor component unit in previous financial statements.
(b) The financial statements of the Tobacco Settlement Financing Corporation (TSFC), a blended
component unit, were determined to be more appropriately reflected as a Debt Service Fund, consistent with the implementation of GASB Statement No. 61. This change in presentation resulted from the TSFC’s financial statement presentation being consolidated to a single governmental fund.
62

State of Rhode Island and Providence Plantations Notes to Basic Financial Statements Fiscal Year Ended June 30, 2013
Note 2. Cash, Cash Equivalents, Investments, and Funds in Trust
A. Primary Government-Governmental and Business-Type Activities
Cash Deposits Cash deposits include demand deposit accounts, interest-bearing deposit accounts, and certificates of deposit. Deposits are exposed to custodial credit risk if they are not covered by federal depository insurance and the deposits are a) uncollateralized, b) collateralized with securities held by the pledging financial institution, or c) collateralized with securities held by the pledging financial institution’s trust department or agent but not in the State’s name. In accordance with Chapter 35-10.1 of the General Laws, depository institutions holding deposits of the State, its agencies or governmental subdivisions of the State shall, at a minimum, insure or pledge eligible collateral equal to one hundred percent of time deposits with maturities greater than 60 days. Any of these institutions which do not meet minimum capital standards prescribed by federal regulators shall insure or pledge eligible collateral equal to one hundred percent of deposits, regardless of maturity. None of the cash deposits of the primary government were required to be collateralized at June 30, 2013 pursuant to this statutory provision. However, the Office of the General Treasurer has instituted a collateralization requirement for institutions holding the State’s deposits. Financial institutions are required to pledge collateral equal to 102% of the balance of uninsured deposits. Additionally, consistent with State Investment Commission guidelines, certain interest-bearing deposit accounts used as short-term investments are required to be collateralized at 102% of the outstanding balance. The lone exception to the full collateralization requirement is the Ocean State Investment Pool Trust (OSIP or the Trust), which follows the 60 day time deposit rule, but otherwise does not require full collateralization. The investment objective of the OSIP's Cash Portfolio is to seek to obtain as high a level of current income as is generally consistent with the preservation of principal and liquidity within the OSIP's investment guidelines which are consistent with SEC Rule 2-A-7. While investment in the pool is not guaranteed or fully collateralized certain investments within the pool are collateralized. At June 30, 2013, of the $545 million invested, $157 million was either a US Government or Agency Security ($66.2 million) or a Collateralized Repurchase Agreement ($90.7 million). With the exception of $580,240 in bank balances of the R.I. Convention Center Authority, as of June 30, 2013 all of the bank balances were either covered by federal depository insurance or collateralized by securities held by an independent third party in the State’s or the blended component unit’s name. Cash Equivalent Investments and Investments The State Investment Commission (Commission) is responsible for the investment of all State funds. Pursuant to Chapter 35-10 of the General Laws, the Commission may, in general, "invest in securities as would be acquired by prudent persons of discretion and intelligence in these matters who are seeking a reasonable income and the preservation of their capital.” The Ocean State Investment Pool Cash Portfolio (the Cash Portfolio) is a portfolio of the Ocean State Investment Pool Trust, which is an investment pool established by the General Treasurer of the State of Rhode Island under Declaration of Trust, dated January 25, 2012 under the Rhode Island Local Government Investment Pool Act, G.L. 35-10.2 of the Rhode Island General Laws as amended, for the purpose of investing funds of, and funds under custody of, agencies, authorities, commissions, boards, municipalities, political subdivisions, and other public units of the State of Rhode Island. The Cash Portfolio, which began operations on March 6, 2012, is not registered with the Securities and Exchange Commission (SEC) as an investment company, but maintains a policy to operate in a manner consistent with the SEC’s Rule 2a-7 of the Investment Company Act of 1940 (Rule 2a-7). The Cash Portfolio may invest in securities that would constitute an “Eligible Security” under and as defined in Rule 2a-7 which may include certain U.S. government and government agency obligations, U.S. dollar-denominated money market securities of domestic and foreign issuers such as short-term certificates of deposit, commercial paper, corporate bonds and notes, time deposits, municipal securities, asset-backed securities and repurchase agreements.
63

State of Rhode Island and Providence Plantations Notes to Basic Financial Statements Fiscal Year Ended June 30, 2013
Government Accounting Standards Board Statement No. 31, “Accounting and Financial Reporting for Certain Investments and for External Investment Pools,” establishes standards for accounting for investments held by government entities. The Cash Portfolio operates as a Rule 2a-7-like pool and thus reports all investments at amortized cost rather than fair value. A copy of the annual report for the Ocean State Investment Pool can be obtained by writing to the Office of the General Treasurer, 50 Service Avenue, Warwick, RI 02886. Other short-term cash equivalent type investments are made by the General Treasurer in accordance with guidelines established by the Commission. Investments of certain blended component units are not made at the direction of the Commission, but are governed by specific statutes or policies established by their governing body.
64

State of Rhode Island and Providence Plantations Notes to Basic Financial Statements Fiscal Year Ended June 30, 2013
The State's cash equivalents and investments (expressed in thousands) at June 30, 2013 are as follows:
Pooled cash equivalents (at amortized cost)Financial company commercial paper 219,900$ Other commercial paper 9,500 Asset backed commercial paper 95,660 Government agency repurchase agreement 57,670 Other repurchase agreements 33,000 Treasury debt 51,216 Certificates of deposit 21,000 Government agency debt 14,997 Other notes 31,000 Other Instruments 11,000 Total investments 544,943 Plus: other assets in excess of other liabilities 162 Total investment pool 545,105
Funds held by fiduciary funds and discretely presented component unitsLess:Amounts categorized as funds on deposit with fiscal agent 20,821 Amounts held by fiduciary trust funds:
Pension trusts 200,216 OPEB trust 3,266 RIPTA health fund 1,488
Amounts held for external parties 13,388 Amounts held by discretely presented component units:
URI 11,018 RIHEAA 306 RIIRBA 3,153
Primary government pooled cash equivalents 291,449
Other primary government cash equivalents and investmentsRepurchase agreements 1,128 Financial company commercial paper 52,633 Government agency debt 16,686 Money Market Mutual Funds 11,214
Total primary government cash equivalents and investments 373,110$
Cash equivalents and investments 373,110Cash 600,149Total cash, cash equivalents and investments 973,259$
Statement of Net PositionCash and cash equivalents 895,602Restricted cash and cash equivalents 8,338Restricted investments 69,319Total cash, cash equivalents and investments 973,259$
The State’s restricted investments, equaling $69,319,000 are held by the Tobacco Settlement Financing Corporation, a blended component unit. Custodial credit risk for deposits is the risk that, in the event of the failure of a depository financial institution, the State will not be able to recover deposits or will not be able to recover collateral securities that are in the possession of an outside party. Investment securities are exposed to custodial credit risk if the securities are uninsured, are not registered in the name of the government, and are held by either: a. the counterparty, or b. the counterparty’s trust department or agent but not in the government’s name. Pursuant to guidelines established by the SIC, securities purchased or underlying collateral are required to be delivered to an independent third party custodian for the investments of the primary government.
65

State of Rhode Island and Providence Plantations Notes to Basic Financial Statements Fiscal Year Ended June 30, 2013
Interest rate risk is the risk that changes in interest rates will adversely affect the fair value of an investment. Based on SIC policy, the State’s short-term investment portfolio is structured to minimize interest rate risk by matching the maturities of investments with the requirements for funds disbursement. As of June 30, 2013, information about the State’s exposure to interest rate risk for cash equivalents and investments (expressed in thousands) is as follows: Pooled Cash Equivalents:
Investment TypeFinancial Company Commercial Paper $ 219,914 $ 219,900 $ 43,984 $ 108,967 $ 65,951 $ 998 $Other Commercial Paper 9,498 9,500 5,500 1,000 3,000 --Asset Backed Commercial Paper 95,660 95,660 49,996 45,664 -- --Gov't Agency Repurchase Agreements 57,670 57,670 57,670 -- -- --Other Repurchase Agreements 33,007 33,000 12,000 21,000 -- --Treasury Debt 51,223 51,216 -- 14,027 25,052 12,137Certificates of Deposit 21,000 21,000 21,000 -- -- --Government Agency Debt 15,003 14,997 -- 1,000 -- 5,999 7,998Other Notes 31,000 31,000 4,000 22,000 5,000 --Other Instruments 11,000 11,000 11,000
Grand Total $ 544,975 $ 544,943 $ 205,150 $ 213,658 $ 99,003 $ 19,134 $ 7,998
>397
Investment Maturities (in days) (At Amortized Cost)
AtFair Value
TotalAmortized Cost 0-30 31-90 91-180 181-397
Non-pooled Cash Equivalents and Investments:
FairInvestment Type Value
Financial company commercial paper $ 52,633 $ 52,633 $ 0 $ 0 $ 0Government agency debt 16,686 16,686 0 0 0Money Market Mutual Funds 11,214 11,214 0 0 0Repurchase agreements 1,128 1,128 0 0 0
Cash equivalents and investments $ 81,661 $ 81,661 $ 0 $ 0 $ 0
Than 1 1-5 6-10 Than 10
Investment Maturities (in Years)
Less More
Credit risk is the risk that an issuer or other counterparty to an investment will not fulfill its obligations. Credit risk is mitigated by the State’s minimum rating criteria policy, collateralization requirements, and the fact that maximum participation by any one issuer is limited to 35% of the total portfolio. Credit risk policies have been developed for investments in commercial paper. As of June 30, 2013, information about the State’s exposure to credit risk for cash equivalents and investments (expressed in thousands) is as follows: Pooled Cash Equivalents:
Investment TypeFinancial Company Commercial Paper $ 219,914 $ 219,900 $ 112,940 $ 106,960 $ --Other Commercial Paper 9,498 9,500 -- 3,000 6,500Asset Backed Commercial Paper 95,660 95,660 -- 95,660 --Gov't Agency Repurchase Agreements 57,670 57,670 54,670 3,000 --Other Repurchase Agreements 33,007 33,000 -- 33,000 --Treasury Debt 51,223 51,216 51,216 -- --Certificates of Deposit 21,000 21,000 -- 21,000 --Government Agency Debt 15,003 14,997 14,997 -- --Other Notes 31,000 31,000 21,000 8,000 2,000Other Instruments 11,000 11,000 11,000 --
Grand Total $ 544,975 $ 544,943 $ 254,823 $ 281,620 $ 8,500
AtA-1 A-2
Quality Ratings (1) (At Amortized Cost)
Fair ValueTotal
Amortized Cost A-1+
The Ocean State Investment Pool has not been assigned credit quality ratings by rating agencies.
66

State of Rhode Island and Providence Plantations Notes to Basic Financial Statements Fiscal Year Ended June 30, 2013
Non-pooled Cash Equivalents and Investments:
AverageType of Moody's Maturities
Issuer Fair Value Investment Rating in Days
Government Agencies
Federal Home Loan Bank Discount Note $ 16,686 Government Agency P-1 Not ApplicableMoney market mutual funds
Fidelity Institutional Money Market Gvt. Port Class III 9,622 Money Market Aaa-mf 56Goldman Sachs Treasury Instruments Fund 4 Money Market Aaa-mf 57Wells Fargo Advantage 100% Treasury Money Market Fund 1,588 Money Market Aaa-mf 55
Commercial PaperBanco Santander Chile Commercial Paper 52,633 Commercial Paper P-1 Not Applicable
$ 80,533
The Tobacco Settlement Financing Corporation, a blended component unit, purchased the Federal Home Loan Bank Discount Note and the Banco Santander Chile Commercial Paper listed in the above table under the terms of two contracts that are discussed in Note 3. Funds on Deposit with Fiscal Agent Investments within the category – Funds on deposit with fiscal agent – are governed by specific trust agreements entered into at the time of the issuance of the debt. The trust agreements outline the specific permitted investments, including any limitations on credit quality and concentrations of credit risk. The State's funds on deposit with fiscal agent reported in the governmental funds (expressed in thousands) at June 30, 2013 and the breakdown by maturity are as follows:
FairInvestment Type Value
Money Market Mutual Funds $ 148,758 $ 148,758 0 0 0Investment Contracts 5,414 5,414 0 0 0
Investments $ 154,172 $ 154,172 $ 0 $ 0 $ 0
Than 1 1-5 6-10 Than 10Less
Investment Maturities (in Years)
More
The above investments with fiscal agent (expressed in thousands) consist of the following:
AverageMoody's Maturities
Issuer Fair Value Rating in Days
Money Market FundsDreyfus Treasury Prime Cash Management Fund $ 2,902 Aaa-mf 52Federated Govt. Obligation Tax Managed Fund 12,376 Aaa-mf 50Fidelity Institutional Money Market Gvt. Port Class III 67,215 Aaa-mf 56First American Treasury Obligations Fund 39,401 Aaa-mf 54JP Morgan US Govt. Money Market Fund Agency Class 801 Aaa-mf 52Wells Fargo Advantage 100% Treasury Money Market Fund 744 Aaa-mf 55Morgan Stanley Prime Portfolio 4,500 Aaa-mf 26Ocean State Investment Pool 20,819 N/A N/A
Investment ContractsFSA Capital Management GIC 5,414 N/A N/A
$ 154,172
Funds on deposit with fiscal agent also include approximately $518 thousand held by the Federal Unemployment Insurance Trust Fund.
67

State of Rhode Island and Providence Plantations Notes to Basic Financial Statements Fiscal Year Ended June 30, 2013
B. Concentration of Credit Risk
The SIC has adopted limitations as to the maximum percentages of the State’s total short-term investment portfolio that may be invested in a specific investment type or with any one issuer of securities. The combined portfolio concentrations for cash equivalents, investments and funds in trust by issuer (expressed in thousands) that are greater than 5% are as follows:
Type Issuer Percentage
Money Market Funds Fidelity Institutional Money Market Gvt. Port Class III $ 76,837 14.57%Money Market Funds First American Treasury Obligations Fund 39,401 7.47%Commercial Paper Banco Santander Chile Commercial Paper 52,633 9.98%
Amount
C. Pension Trusts
The Employees’ Retirement System (ERS) consists of five plans: the Employees’ Retirement System, Municipal Employees’ Retirement System (MERS), State Police Retirement Board Trust (SPRBT), Judicial Retirement Board Trust (JRBT), and Rhode Island Judicial Retirement Fund Trust (RIJRFT). Cash Deposits and Cash Equivalents At June 30, 2013, the carrying amount of the ERS cash deposits was $2,350,000 and the bank balance was $2,688,000. The bank and book balances represent the plans’ deposits in short-term trust accounts which include demand deposit accounts and interest-bearing, collateralized bank deposit accounts. The bank balance, $1,904,000, and the remainder representing interest-bearing collateralized bank deposits totaling $784,000, are either federally insured or collateralized (102%) with U.S. Treasury, agencies, and Federal Home Loan Bank letters of credit held by a third party custodian. In accordance with Rhode Island General Law Chapter 35-10.1, depository institutions holding deposits of the State, its agencies or governmental subdivisions of the State shall, at a minimum, insure or pledge eligible collateral equal to one hundred percent of time deposits with maturities greater than sixty days. Any of these institutions that do not meet minimum capital standards prescribed by federal regulators shall insure or pledge eligible collateral equal to one hundred percent of deposits, regardless of maturity. None of the System’s deposits were required to be collateralized at June 30, 2013 (excluding the collateralized interest-bearing deposits). However, the State Investment Commission has adopted a collateralization requirement for institutions holding the State’s deposits. Financial institutions are required to pledge collateral equal to 102% of the deposit amounts that are not insured by federal depository insurance.
Investments The State Investment Commission oversees all investments made by the State of Rhode Island, including those made for the System. Investment managers engaged by the Commission, at their discretion and in accordance with the investment objectives and guidelines for the System, make certain investments. The General Treasurer makes certain short-term investments on a daily basis. Rhode Island General Law Section 35-10-11 (b)(3) requires that all investments shall be made in securities as would be acquired by prudent persons of discretion and intelligence who are seeking a reasonable income and the preservation of capital. On July 1, 1992, the State Investment Commission pooled the assets of the ERS with the assets of the MERS for investment purposes only, and assigned units to the plans based on their respective share of market value. On September 29, 1994 and November 1, 1995, the assets of the SPRBT and the JRBT, respectively, were added to the pool for investment purposes only. The custodian bank holds assets of the System in a Pooled Trust and each plan holds units in the trust. The number of units held by each plan is a function of each plans’ respective contributions to, or withdrawals from, the trust.
68

State of Rhode Island and Providence Plantations Notes to Basic Financial Statements Fiscal Year Ended June 30, 2013
Investment expense is allocated to each plan based on the plan’s units in the Pooled Trust at the end of each month. The following table presents the fair value of investments by type that are held within the Pooled Trust for the defined benefit plans at June 30, 2013 (expressed in thousands):
Pooled Investment Trust - Investment Type
Cash and Cash Equivalents $ 34,812Foreign Currencies 6,247Money Market Mutual Fund 347,748U.S. Government Securities 485,705U.S. Government Agency Securities 369,389Global Inflation Linked Bonds 139,739Collateralized Mortgage Obligations 23,158Corporate Bonds 408,309Term Loans 291,140Domestic Equity Securities 805International Equity Securities 194Commingled Funds - Domestic Equity 1,843,373Commingled Funds - International Equity 1,736,807Private Equity 557,190Real Estate Limited Partnerships and Commingled Funds 241,159Hedge Funds 1,084,675Derivative Investments (894)
Investments at Fair Value $ 7,569,556Receivable for investments sold 260,370Payable for investments purchased (297,226)Payable to broker (1,843)
Total $ 7,530,857
Fair Value
Consistent with a target asset allocation model adopted by the State Investment Commission (SIC), the ERS directs its separate-account investment managers to maintain, within the mandate specified by the SIC, diversified portfolios by sector, credit rating and issuer using the prudent person standard, which is the standard of care employed solely in the interest of the participants and beneficiaries of the funds and for the exclusive purpose of providing benefits to participants and defraying reasonable expenses of administering the funds. Specific manager performance objectives are outlined and generally stated in relation to a benchmark or relevant index. These guidelines also include prohibited investments, limitations on maximum exposure to a single industry or single issuer, a minimum number of holdings within the manager’s portfolio and, for fixed income managers, minimum credit quality ratings and duration/maturity targets. Interest Rate Risk Interest rate risk is the risk that changes in interest rates will adversely affect the fair value of an investment. Duration is a measure of a debt security’s sensitivity to fair value changes arising from changes in the level of interest rates. It is the weighted average maturity of a bond’s cash flows. The ERS manages its exposure to interest rate risk by comparing each fixed income manager portfolio’s effective duration against a predetermined benchmark index based on that manager's mandate. The fixed income indices currently used by the ERS are:
Barclays US Aggregate Index Barclays World Government Inflation –Linked All Maturities USD Hedge Custom High Yield and Bank Loan Index – 30% Bank of America Merrill Lynch 1-3 BB-B High
Yield and 70% Credit Suisse Institutional Leveraged Loan Index At June 30, 2013, no fixed income manager was outside of the policy guidelines.
69

State of Rhode Island and Providence Plantations Notes to Basic Financial Statements Fiscal Year Ended June 30, 2013
The following table shows the ERS’s fixed income investments by type, fair value and the effective duration at June 30, 2013 (expressed in thousands):
EffectiveInvestment Type Fair Value Duration
U.S. Government Securities $ 485,705 5.41U.S. Government Agency Securities 369,389 3.72Collateralized Mortgage Obligations 23,158 3.52Corporate Bonds 408,309 6.21Global Inflation Linked Bonds 139,739 14.40Term Loans 291,140 0.60
Total Fixed Income $ 1,717,440 5.13
The ERS had investments at June 30, 2013 totaling $200,216,449 in the Ocean State Investment Pool Trust (OSIP), an investment pool established by the State General Treasurer. The ERS’s investment accounted for 37% of the total OSIP at June 30, 2013. OSIP operates in a manner consistent with SEC Rule 2a-7 like pool and thus, reports all investments at amortized cost rather than fair value. The OSIP is not rated and the weighted average maturity of investments held in the pool, by policy, is not to exceed 60 days. OSIP issues a publicly available financial report that can be obtained by writing to the Office of the General Treasurer, Finance Department, 50 Service Avenue - 2nd Floor, Warwick, RI 02886. The ERS also invested $147,529,772 in a short-term money market mutual fund that held investments with a weighted average maturity of 66 days at June 30, 2013. The ERS invests in various mortgage-backed securities, such as collateralized mortgage obligations (CMO), interest-only and principal-only strips. They are reported in U.S. Government Agency Securities and Collateralized Mortgage Obligations in the table above. CMO’s are bonds that are collateralized by whole loan mortgages, mortgage pass-through securities or stripped mortgage-backed securities. Income is derived from payments and prepayments of principal and interest generated from collateral mortgages. Cash flows are distributed to different investment classes or tranches in accordance with the CMO’s established payment order. Some CMO tranches have more stable cash flows relative to changes in interest rates while others are significantly sensitive to interest rate fluctuations. The ERS may invest in interest-only and principal-only strips in part to hedge against a rise in interest rates. Interest-only strips are based on cash flows from interest payments on underlying mortgages. Therefore, they are sensitive to pre-payments by mortgagees, which may result from a decline in interest rates. Principal-only strips receive principal cash flows from the underlying mortgages. In periods of rising interest rates, homeowners tend to make fewer mortgage prepayments.
70

State of Rhode Island and Providence Plantations Notes to Basic Financial Statements Fiscal Year Ended June 30, 2013
Credit Risk The ERS manages exposure to credit risk generally by instructing fixed income managers to adhere to an overall target weighted average credit quality for their portfolios and by establishing limits on the percentage of the portfolios that are invested in non-investment grade securities. The ERS’s exposure to credit risk as of June 30, 2013 is as follows (expressed in thousands):
QualityRating (1)
Aaa $ 12,131 $ 369,389 $ 10,451 $ 22,240 $Aa 6,069 4,603 112,135A 3,710 86,513Baa 1,248 199,182 5,364 14,611Ba 42,929 96,356B 53,323 119,498Caa 11,259 4,511CaCDNot rated 49 56,164
Fair Value $ 23,158 $ 369,389 $ 408,309 $ 139,739 $ 291,140
TermLoans
CollateralizedMortgage Obligations
Gobal
Obligations
U.S. GovernmentInflation Linked
BondsCorporate
BondsAgency
Concentration of Credit Risk Concentration of credit risk is the risk of loss attributed to the magnitude of investments in a single issuer. There is no single issuer exposure within the ERS’s pooled investment trust that comprises 5% of the overall portfolio.
Custodial Credit Risk For an investment, custodial credit risk is the risk that, in the event of the failure of a counterparty, the ERS will not be able to recover the value of its investment or collateral securities that are in the possession of an outside party. At June 30, 2013, all securities were registered in the name of the ERS (or in the nominee name of its custodial agent) and were held in the possession of the ERS's custodial bank, Bank of New York Mellon.
71

State of Rhode Island and Providence Plantations Notes to Basic Financial Statements Fiscal Year Ended June 30, 2013
Foreign Currency Risk Foreign currency risk is the risk that changes in exchange rates will adversely impact the fair value of an investment. Portfolios are diversified to limit foreign currency and security risk. The ERS may enter into foreign currency exchange contracts to minimize the short-term impact of foreign currency fluctuations on foreign investments. The ERS's exposure to foreign currency risk at June 30, 2013, was as follows (expressed in thousands):
Currency
Australian Dollar $ 95,062 $ $ 5 $ 3,146 $ $ $ 98,213Austrian Schilling 3,210 3,210Belgian Franc 13,699 13,699Brazilian Real 41,249 2,434 43,683British Pound 256,629 (187) 61,573 318,015Canadian Dollar 120,814 1 10,004 194 12,507 143,520Chilean Peso 7,049 7,049Chinese Yuan Renminbi 49,580 49,580Colombian Peso 4,461 4,461Czech Republic Koruna 903 903Danish Krone 13,363 13,363Egyptian Pound 914 914Euro Currency 323,896 6,247 (490) 45,269 85,088 460,010Hong Kong Dollar 60,920 60,920Hungarian Forint 980 980Indian Rupee 27,727 27,727Indonesia Rupiah 12,495 12,495Israeli Shekel 6,035 6,035Japanese Yen 276,406 311 5,258 281,975Malaysian Ringgit 16,090 16,090Mauritian Rupee 348 348Mexican Peso 21,584 2,931 24,515Moroccan Dirham 295 295New Zealand Dollar 1,432 1,432Norwegian Krone 9,426 9,426Peruvian Nouveau Sol 1,307 1,307Philippine Peso 4,100 4,100Polish Zloty 6,087 6,087Russian Ruble 21,564 21,564Singapore Dollar 19,479 19,479South Africa Rand 28,631 28,631South Korean Won 58,042 58,042Swedish Krona 37,358 (44) 9,124 46,438Swiss Franc 113,442 113,442Taiwan Dollar 47,179 47,179Thailand Baht 11,103 11,103Turkish Lira 7,730 7,730
Total $ 1,720,589 $ 6,247 $ (404) $ 139,739 $ 194 $ 97,595 $ 1,963,960
US Dollar 16,218
Commingled Fund $ 1,736,807
Derivative
Contracts
GlobalInflation Linked
Bonds TotalFund Cash
Commingled Foreign Private
EquityEquities
In addition to the foreign currency exposure highlighted in the foregoing table, certain hedge and private equity fund investments may have foreign currency exposure. Derivatives and Other Similar Investments Certain of the ERS’s investment managers are allowed to invest in derivative type transactions consistent with the terms and limitations governing their investment objective and related contract specifications. Derivatives and other similar investments are financial contracts whose value depends on one or more underlying assets, reference rates, or financial indices.
The ERS’s derivative investments include forward foreign currency transactions, futures contracts, options, rights, and warrants. The ERS enters into these transactions to enhance performance, rebalance the portfolio consistent with overall asset allocation targets, gain or reduce exposure to a specific market, or mitigate specific risks.
72

State of Rhode Island and Providence Plantations Notes to Basic Financial Statements Fiscal Year Ended June 30, 2013
Forward foreign currency contracts – The ERS enters into foreign currency exchange contracts to minimize the short-term impact of foreign currency fluctuations on foreign investments. A currency forward is a contractual agreement to pay or receive specific amounts of foreign currency at a future date in exchange for another currency at an agreed upon exchange rate. If not offset by a corresponding position with the opposite currency exposure, these contracts involve risk in excess of the amount reflected in the ERS’s Statements of Fiduciary Net Position. The face or contract amount in U.S. dollars reflects the total exposure the ERS has in currency contracts. The U.S. dollar value of forward foreign currency contracts is determined using forward currency exchange rates supplied by a quotation service. Losses may arise due to changes in the value of the foreign currency or if the counterparty does not perform under the contract.
Futures contracts – The ERS uses futures to manage its exposure to the domestic and international equity, money market, and bond markets and the fluctuations in interest rates and currency values. Futures are also used to obtain target market exposures in a cost effective manner and to narrow the gap between the ERS’s actual cash exposures and the target policy exposures. Using futures contracts in this fashion is designed to reduce (or hedge) the risk of the actual plan portfolio deviating from the policy portfolio more efficiently than by using cash securities. The program is only used to manage intended exposures and asset allocation rebalancing.
Buying futures tends to increase the ERS’s exposure to the underlying instrument. Selling futures tends to decrease the ERS’s exposure to the underlying instrument, or hedge other ERS investments. Losses may arise due to movements in the underlying or reference markets.
Through commingled funds, the ERS also indirectly holds derivative type instruments, primarily equity index futures. The ERS invests in mortgage-backed securities, which include collateralized mortgage obligations and U.S. Government Agency Securities. These securities are based on the cash flows from interest and principal payments by the underlying mortgages. As a result, they are sensitive to prepayments by mortgagees, which are likely in declining interest rate environments, thereby reducing the value of these securities. Additional information regarding interest rate risks for these investments is included in the Interest Rate Risk section of this note. The ERS may sell a security in anticipation of a decline in the fair value of that security or to lessen the portfolio allocation of an asset class. Short sales may increase the risk of loss to the ERS when the price of a security underlying the short sale increases and the ERS is obligated to deliver the security in order to cover the position. The following summarize the ERS’s exposure to specific derivative investments at June 30, 2013 (expressed in thousands).
Investment DerivativeInstruments
Fixed income futures - long $ (873) $ $ 40,255Fixed income futures - short (7,086) (615)Index futures - long 30,736 378 39,036Index futures - short (32) (721) (14,562)Credit default swap 63 2,000
$ 22,745 $ (895)
Foreign Currency Forward Contracts: Pending payable (liability) $ (1,357)
Notionalamount
Fair value atJune 30, 2013
Change in fairvalue included in
investmentincome
The ERS is exposed to counterparty risk on foreign currency contracts that are in asset positions. The aggregate fair value of derivative instruments in asset positions at June 30, 2013 was $441 thousand.
73

State of Rhode Island and Providence Plantations Notes to Basic Financial Statements Fiscal Year Ended June 30, 2013
This represents the maximum loss that would be recognized if all counterparties failed to perform as contracted. Risk is mitigated by using a continuous linked settlement process. Credit Default Swaps can be used in the portfolio by the credit manager to either obtain exposure to the high yield market efficiently (i.e. by selling protection) at a similar or better price than what can be obtained in cash bonds, or to hedge the credit risk of the portfolio (i.e. buy protection). The actual swap entered into sold protection on an index to effectively and quickly gain long exposure to the high yield markets giving this new manager time to invest in individual cash bonds in line with the mandate. The ERS executes (through its investment managers) derivative instruments with various counterparties. The credit ratings of these counterparties were Baa1 (Moody’s) or better, one counterparty was not rated by Moody’s but is rated A+ by Fitch. Other Investments –Defined Contribution Plan The State Investment Commission selected various investment options for defined contribution plan participants with the overall objective of offering low-cost, strategic, and long-term oriented investment products. Plan participants can choose one or more of the various options and can change options at any time. Plan participants who do not elect a specific option default to a target date retirement fund consistent with their anticipated Social Security retirement eligibility date. The plan’s holdings at June 30, 2103 are as follows (expressed in thousands):
Weighted
Average
% of Duration Maturity
Total (years) (days)
Annuities
TIAA Stable Value $ 1,554 1.3%
TIAA Real Estate-variable annuity 579 0.5%
Total $ 2,133 1.8%
Money Market
Vanguard Prime Money Market Fund $ 148 0.1% 59
Fixed Income Funds
Primco Real Return Institutional Class 1,145 0.9% 6.35
Vanguard Total Bond Market Index 803 0.7% 5.31
Total $ 1,948 1.6%
Target Retirement Funds
Vanguard Target Retirement 2010 Investor Class 2,651 2.2%
Vanguard Target Retirement 2015 Investor Class 10,096 8.2%
Vanguard Target Retirement 2020 Investor Class 17,484 14.3%
Vanguard Target Retirement 2025 Investor Class 18,383 14.9%
Vanguard Target Retirement 2030 Investor Class 17,986 14.7%
Vanguard Target Retirement 2035 Investor Class 17,060 13.9%
Vanguard Target Retirement 2040 Investor Class 13,082 10.7%
Vanguard Target Retirement 2045 Investor Class 9,653 7.9%
Vanguard Target Retirement 2050 Investor Class 5,103 4.2%
Vanguard Target Retirement 2055 Investor Class 1,086 0.9%
Vanguard Target Retirement 2060 Investor Class 105 0.1%
Vanguard Target Retirement Income Investor Class 813 0.7%
Total $ 113,502 92.7%
Equity Mutual Funds
TIAA-CREF International Equity Index Fund Institutional 509 0.4%
Vanguard 500 Index Fund Signal Class 2,085 1.7%
Vanguard Emerging Markets Stock Index Signal Class 502 0.4%
Vanguard Mid-Cap Index Fund Signal Class 834 0.7%
Vanguard Small Cap Index Fund Signal Class 744 0.6%
Total $ 4,674 3.8%
Total $ 122,405 100.0%
Investment Type
Fair
Value
74

State of Rhode Island and Providence Plantations Notes to Basic Financial Statements Fiscal Year Ended June 30, 2013
For an investment, custodial credit risk is the risk that, in the event of the failure of the counterparty, the ERS will not be able to recover the value of its investment or collateral securities that are in the possession of an outside party. At June 30, 2013, all assets and securities were registered in the name of TIAA-CREF as the Defined Contribution Plan’s record keeper for the benefit of plan members and were held in the possession of TIAA-CREF’s custodian, J.P. Morgan Bank.
The majority of the defined contribution plan investment options are mutual funds that invest in diversified portfolios of securities including equity and fixed-income investments. For investment options that are solely fixed income, weighted-average maturity or duration have been disclosed as a measure of interest rate risk.
Fixed income mutual funds and variable annuity accounts are subject to interest rate, inflation and credit risks. Target-date retirement mutual funds share the risks associated with the types of securities held by each of the underlying funds in which they invest including equity and fixed income funds. Mutual funds may have exposure to foreign currency risk through investment in non-US denominated securities.
D. OPEB Trust Funds
The Rhode Island State Employees’ and Electing Teachers OPEB System (OPEB System), which accumulates resources for other post-employment benefit payments to qualified employees, consists of six plans: State employees, Teachers, Judges, State police, Legislators and Board of Education. Cash Deposits and Cash Equivalents At June 30, 2013, the carrying amount of the OPEB System’s cash deposits was $313,747 and the bank balance was the same amount. The bank and book balances represent the OPEB System’s deposits in short-term trust accounts, which include fully insured demand deposit accounts and interest-bearing, collateralized bank deposit accounts. In accordance with Rhode Island General Law Chapter 35-10.1, depository institutions holding deposits of the State, its agencies or governmental subdivisions of the State shall, at a minimum, insure or pledge eligible collateral equal to one hundred percent of time deposits with maturities greater than sixty days. Any of these institutions that do not meet minimum capital standards prescribed by federal regulators shall insure or pledge eligible collateral equal to one hundred percent of deposits, regardless of maturity. In addition, the State Investment Commission has adopted a collateralization requirement for institutions holding the State’s deposits. Financial institutions are required to pledge collateral equal to 102% of the uninsured deposit amounts. At June 30, 2013, the System’s cash deposits were either federally insured or collateralized. In addition, at June 30, 2013, the System also had cash equivalent investments consisting of $3,265,884 in the Ocean State Investment Pool Trust (OSIP), an investment pool established by the State General Treasurer. The System’s investment accounted for .6% of the total investment in OSIP at June 30, 2013. Funds of agencies, authorities, commissions, boards, municipalities, political subdivisions, and other public units of the State are eligible to invest in OSIP. OSIP operates in a manner consistent with a SEC Rule 2a-7 like pool and thus, reports all investments at amortized cost rather than fair value. The OSIP is not rated and the weighted average maturity of investments held in the pool, by policy, is not to exceed 60 days. OSIP issues a publicly available financial report that can be obtained by writing to the Office of the General Treasurer, Finance Department, 50 Service Avenue - 2nd Floor, Warwick, RI 02886. Investments The State Investment Commission oversees all investments made by the State of Rhode Island, including those made for the OPEB System. The General Treasurer makes certain short-term investments on a daily basis. Rhode Island General Law Section 35-10-11 (b) (3) requires that all investments shall be made in securities as would be acquired by prudent persons of discretion and intelligence who are seeking a reasonable income and the preservation of capital. The assets of each of the plans are pooled for investment purposes only, and units are assigned to the plans based on their respective share of market value. The custodian bank holds assets of the OPEB
75

State of Rhode Island and Providence Plantations Notes to Basic Financial Statements Fiscal Year Ended June 30, 2013
System in a Pooled Account and each plan holds units in the account. The number of units held by each plan is a function of each plan’s respective contributions to, or withdrawals from, the account. Investment expense is allocated to each plan based on the plan’s units in the pooled trust at the end of each month.
The following table presents the fair value of investments by type that are held within the pooled trust at June 30, 2013 (expressed in thousands):
Investment Type Fair Value
Money Market Mutual Fund 2,612$
US Government Securities 8,272
US Government Agency Securities 7,998
Collateralized Mortgage Obligations 623
Corporate Bonds 6,167
Commingled Funds - Domestic Equity 44,835
70,507
Net investment receivable (payable) (1,919)
Total Investments at Fair Value 68,588$
Consistent with a target asset allocation model adopted by the State Investment Commission, the OPEB System maintains a diversified portfolio by sector, credit rating and issuer using the prudent person standard, which is the standard of care employed solely in the interest of the participants and beneficiaries of the funds and for the exclusive purpose of providing benefits to participants and defraying reasonable expenses of administering the funds. Interest Rate Risk Interest rate risk is the risk that changes in interest rates will adversely affect the fair value of an investment. The following table shows the OPEB System’s fixed income investments by type, fair value and the effective duration at June 30, 2013 (expressed in thousands):
Effective
Investment Type Fair Value Duration
US Government Securities 8,272$ 4.32
US Government Agency Securities 7,998 4.00
Collateralized Mortgage Obligations 623 5.16
Corporate Bonds 6,167 7.87
Total Fixed Income 23,060$ 4.67
The OPEB System’s investment in Dreyfus Institutional Cash Advantage Fund, a money market mutual fund, had an average maturity of 41 days at June 30, 2013. Credit Risk The OPEB System generally manages exposure to credit risk by adhering to an overall target weighted average credit quality for the portfolio.
76

State of Rhode Island and Providence Plantations Notes to Basic Financial Statements Fiscal Year Ended June 30, 2013
The OPEB System’s exposure to credit risk on corporate bonds as of June 30, 2013 is as follows (expressed in thousands):
Collateralized US Government
Mortgage Agency Corporate
Rating (1) Obligations Obligations Bonds
Aaa 623$ 7,998$ -$
Aa 99
A 1,460
Baa 4,453
Ba 155
Fair Value 623$ 7,998$ 6,167$
(1) Moody's Investor Service
The OPEB System’s investment in a short-term money market mutual fund (Dreyfus Institutional Cash Advantage Fund) was rated AAAm by Standard & Poor’s Investors Service. Concentration of Credit Risk Concentration of credit risk is the risk of loss attributed to the magnitude of the OPEB System’s investments in a single issuer. There is no single issuer exposure within the OPEB System’s portfolio that comprises more than 5% of the overall portfolio. Custodial Credit Risk For an investment, custodial credit risk is the risk that, in the event of the failure of the counterparty, the OPEB System will not be able to recover the value of its investment or collateral securities that are in the possession of an outside party. At June 30, 2013, all securities were registered in the name of the OPEB System (or in the nominee name of its custodial agent) and were held in the possession of its custodial bank, Bank of New York Mellon. Derivatives and Other Similar Investments Through its commingled fund, the OPEB System indirectly holds derivative type instruments, primarily equity index futures.
E. Private Purpose Trust
The private purpose trust (Touro Jewish Synagogue) had investments of $2,267,000 in the Fidelity Balanced Fund as of June 30, 2013.
F. Agency Funds
As of June 30, 2013, all of the bank balances of Agency Funds were either covered by federal depository insurance or collateralized by securities held by an independent third party in the State’s name. Note 3. Hedging Derivatives In connection with the issuance of revenue bonds in June 2002, the Tobacco Settlement Financing Corporation (TSFC) entered into two interest-bearing contracts. The contracts are considered hedging derivatives. The contracts are a type of investment in which the investor, in this case the TSFC, purchases eligible securities selected by the agreement provider on a periodic basis from the agreement provider at a fixed rate of return that is specified in the contract.
77

State of Rhode Island and Providence Plantations Notes to Basic Financial Statements Fiscal Year Ended June 30, 2013
One contract, having a notional amount of $51,351,531, with Morgan Stanley & Co. Inc. as provider, generates a fixed annual rate of return of 5.48% through June 1, 2042. As of June 30, 2013 Morgan Stanley & Co. Inc. long-term debt was rated Baa1 by Moody’s and A- by Standard & Poor’s. At June 30, 2013 Banco Santander Chile Commercial Paper was held pursuant to this contract. The other contract, the notional amount of which varies based on the TSFC’s debt service payment requirements, is with JP Morgan Chase Bank, N.A. as provider and generates a fixed annual rate of return of 4.013% through June 1, 2022 or the date on which the trustee and the TSFC have satisfied all of their obligations under the agreement. As of June 30, 2013 JP Morgan Chase Bank, N.A. long-term debt was rated A2 by Moody’s and A- by Standard & Poor’s. At June 30, 2013 a Federal Home Loan Bank Discount Note was held pursuant to this contract. The interest-earning investment contracts provide for a fixed annual rate of return for investments held within the TSFC’s debt service reserve fund and debt service fund. The counterparty to the investment contract purchases investments based on types permitted by the TSFC’s trust indenture. When the earnings on such investments are less than the fixed annual return rate as specified in the contract, the counterparty is required to make an additional payment to the trustee on behalf of the TSFC. Through the interest-earning investment contracts, the TSFC is exposed to concentration of credit risk since the counterparty is required to purchase only permitted investments but not necessarily diversify such holdings. The fair value of the investment contracts is estimated based on the present value of their estimated future cash flows and is sensitive to interest rate changes. The terms of the investment contracts generally coincide with the TSFC’s outstanding indebtedness and maintenance of the debt service and debt service reserve fund. The contracts provide for the payment of a termination amount under certain conditions specified in the agreement (e.g., defeasance, default). The termination amount payable between the provider and the TSFC would vary depending on prevailing interest rates at the time the termination amount was calculated. Under certain market conditions, the termination amount payable by the TSFC (or its trustee) could be substantial. In addition, the contracts also require the providers to pledge collateral in certain circumstances. Note 4. Receivables Receivables at June 30, 2013 (expressed in thousands) consist of the following:
Governmental receivables $ 446,381 $ 356,944 $ 1,530 $ 804,855 $ 242,265 $ 59,904Less: Allowance for Uncollectibles 102,118 103,369 464 205,951
Governmental receivables, net 344,263 253,575 1,066 598,904 242,265 59,904
Business-type receivables 73,687 32,760 106,447 1,565Less: Allowance for Uncollectibles 4,668 21,103 25,771
Business-type receivables, net 69,019 11,657 80,676 1,565
Uncollectibles 413,282 265,232 1,066 679,580 243,830 59,904
Less: Current PortionGovernmental receivables 337,204 239,236 105 576,545 239,585 4,489Business-type receivables 69,019 11,657 80,676 1,565
Noncurrent Receivables, Net $ 7,059 $ 14,339 $ 961 $ 22,359 $ 2,680 $ 55,415
Receivables, Net of Allowance for
UnitsComponent
Due from
ReceivableTaxes Accounts
ReceivableLoans
ReceivablePrimary GovernmentReceivables,
Net
Due from OtherGovernmentsand Agencies
TotalNotes and
78

State of Rhode Island and Providence Plantations Notes to Basic Financial Statements Fiscal Year Ended June 30, 2013
Note 5. Intra-Entity Receivables and Payables Intra-entity receivables and payables as of June 30, 2013 are the result of ongoing operations and are expected to be reimbursed within the subsequent fiscal year. They are summarized below (expressed in thousands):
Interfund InterfundReceivable Payable Description
Governmental FundsMajor Funds
General $ 283 $ Reimbursement for operating expensesIntermodal Surface Transportation 9,379 Transportation funding
Non-Major FundsRI Temporary Disability Insurance 605 Debt service and administrative costsBond Capital 41 State match for transportationRI Capital Plan 15,068 Primarily for transportation State match
291 Fees restricted for COPS debt service
Total Non-Major Funds 291 15,714
Total Governmental 9,953 15,714Proprietary Funds
Enterprise RI Lottery 1,201 Net income owed to General FundRI Convention Center Authority 1,859 Project fundingEmployment Security Trust 3,967 Benefit reimbursements
Total Enterprise 5,826 1,201Internal Service 1,437 301 Settlement of services rendered
Total Internal Service
Total primary government $ 17,216 $ 17,216
Certificates of Participation
79

State of Rhode Island and Providence Plantations Notes to Basic Financial Statements Fiscal Year Ended June 30, 2013
Note 6. Capital Assets The capital asset activity of the reporting entity for the year ended June 30, 2013 consists of the following (expressed in thousands): Primary Government
Governmental Activities
Capital assets not being depreciated or amortized:Land $ 358,968 $ 16,657 $ (400) $ 375,225Works of Art 1,414 975 2,389Intangibles 159,093 2,684 161,777Construction in progress * 450,433 281,824 (137,600) 594,657
Total capital assets not being depreciated or amortized 969,908 302,140 (138,000) 1,134,048
Capital assets being depreciated or amortized:Land improvements 3,700 3,700Buildings * 685,494 27,456 (1,635) 711,315Building Improvements * 267,714 2,664 270,378Furniture and equipment * 244,916 17,303 (9,130) 253,089Intangibles 14,049 (9) 14,040Infrastructure * 3,193,823 102,024 3,295,847
Total capital assets being depreciated or amortized 4,409,696 149,447 (10,774) 4,548,369
Less accumulated depreciation or amortization for:Land improvements 3,389 50 3,439Buildings * 214,035 13,294 (2,145) 225,184Building Improvements * 175,130 8,942 184,072Furniture and equipment 217,398 11,752 (8,972) 220,178Intangibles 12,270 712 (9) 12,973Infrastructure * 1,433,110 111,078 1,544,188
Total accumulated depreciation or amortization 2,055,332 145,828 (11,126) 2,190,034
Total capital assets being depreciated or amortized, net 2,354,364 3,619 352 2,358,335
Governmental activities capital assets, net $ 3,324,272 $ 305,759 $ (137,648) $ 3,492,383
Beginning EndingBalance Increases Decreases Balance
The current period depreciation or amortization was charged to the governmental functions on the Statement of Activities as follows:
General government $ 8,289Human services 6,090Education 3,512Public safety 11,075Natural resources 5,413Transportation 111,449
Total depreciation or amortization expense - governmental activities $ 145,828
* Beginning balances have been restated.
80

State of Rhode Island and Providence Plantations Notes to Basic Financial Statements Fiscal Year Ended June 30, 2013
Business-type Activities
Capital assets not being depreciated:Land $ 45,558 $ $ $ 45,558Construction in progress 24 446 (24) 446
Total capital assets not being depreciated 45,582 446 (24) 46,004
Capital assets being depreciated:Buildings 234,384 33 (33) 234,384Machinery and equipment 25,646 1,539 (105) 27,080Intangibles 175 175
Total capital assets being depreciated 260,030 1,747 (138) 261,639
Less accumulated depreciation for:Buildings 109,229 8,266 (18) 117,477Machinery and equipment 18,923 2,057 (99) 20,881Intangibles 15 15
Total accumulated depreciation 128,152 10,338 (117) 138,373
Total capital assets being depreciated, net 131,878 (8,591) (21) 123,266
Business-type activities capital assets, net $ 177,460 $ (8,145) $ (45) $ 169,270
Discretely Presented Component Units
Capital assets not being depreciated or amortized:Land * $ 109,115 $ 1,376 $ (125) $ 110,366Construction in progress * 186,309 122,592 (188,918) 119,983Other 250 250
Total capital assets not being depreciated or amortized 295,674 123,968 (189,043) 230,599
Capital assets being depreciated or amortized:Buildings * 1,728,139 169,219 (52) 1,897,306Land improvements 194,237 3,325 197,562Machinery and equipment * 376,409 47,711 (15,884) 408,236Infrastructure * 171,290 18,459 189,749
Total capital assets being depreciated or amortized 2,470,075 238,714 (15,936) 2,692,853
Less accumulated depreciation or amortization for:Buildings * 621,457 56,942 (23) 678,376Land improvements * 112,214 6,891 119,105Machinery and equipment * 224,425 27,929 (15,633) 236,721Infrastructure * 48,169 7,325 55,494
Total accumulated depreciation or amortization 1,006,265 99,087 (15,656) 1,089,696
Total capital assets being depreciated or amortized, net 1,463,810 139,627 (280) 1,603,157
Total capital assets, net $ 1,759,484 $ 263,595 $ (189,323) $ 1,833,756
Beginning EndingBalance Increases Decreases Balance
Beginning EndingBalance Increases Decreases Balance
* Beginning balances have been restated.
81

State of Rhode Island and Providence Plantations Notes to Basic Financial Statements Fiscal Year Ended June 30, 2013
Note 7. Long-Term Liabilities
A. Changes in Long-Term Liabilities
Changes in long-term liabilities for the year ended June 30, 2013 are presented in the following table:
Governmental ActivitiesBonds PayableGeneral obligation bonds (see section B) $ 1,110,585 $ 81,400 $ (88,040) $ 1,103,945 $ 76,825 $ 1,027,120RIEDC Grant Anticipation Revenue Bonds 342,720 (31,075) 311,645 32,615 279,030RIEDC Rhode Island Motor Fuel Tax Revenue Bonds 70,350 (3,840) 66,510 3,985 62,525Tobacco Settlement Asset-Backed Bonds 779,426 (14,265) 765,161 765,161Accreted interest on TSFC bonds 66,901 16,150 83,051 83,051RIEDC Historic Tax Credit Bonds 105,990 (15,415) 90,575 16,175 74,400Net unamortized premium/discount 59,870 10,410 (11,661) 58,619 58,619Deferred amount on refunding (16,839) 1,064 (15,775) (15,775)
Bonds Payable, net 2,519,003 107,960 (163,232) 2,463,731 129,600 2,334,131
Obligation under capital leases (see section E) 233,800 114,865 (115,690) 232,975 22,835 210,140Net unamortized premium/discount 4,622 17,097 (3,278) 18,441 18,441Deferred amount on refunding (958) (5,523) 215 (6,266) (6,266)
Obligation under capital leases, net 237,464 126,439 (118,753) 245,150 22,835 222,315
Compensated absences 81,063 64,138 (64,903) 80,298 65,911 14,387Net pension obligation 1,816 1,816 1,816Net OPEB Obligation (see note 15 C) 11,248 93 11,341 11,341Special obligation notes 8,175 (1,500) 6,675 1,565 5,110
Other Long-term LiabilitiesPollution remediation 11,515 2,962 (4,970) 9,507 2,307 7,200Other 46,178 1,583 (21,319) 26,442 1,509 24,933
Total Governmental Long-term Liabilities $ 2,914,646 $ 304,991 $ (374,677) $ 2,844,960 $ 223,727 $ 2,621,233
Business-type ActivitiesRevenue bonds (see section B) $ 250,510 $ 37,335 $ (50,885) $ 236,960 $ 10,060 $ 226,900Net unamortized premium/discount 825 5,823 (1,549) 5,099 5,099Deferred amount on refunding (9,800) 976 1,086 (7,738) (7,738)
Revenue bonds, net 241,535 44,134 (51,348) 234,321 10,060 224,261
Notes payable 419 (188) 231 188 43Unearned Revenue 7,645 2,911 (1,133) 9,423 3,118 6,305Compensated absences 400 246 (256) 390 167 223Due to Other Governments and Agencies (see Section J) 224,646 (69,370) 155,276 155,276
Total Business-type Long-term Liabilities $ 474,645 $ 47,291 $ (122,295) $ 399,641 $ 13,533 $ 386,108
Component UnitsBonds payable (see section B) $ 2,191,735 $ 435,518 $ (422,808) $ 2,204,445 $ 73,985 $ 2,130,460Net unamortized premium/discount 9,385 7,479 (1,053) 15,811 864 14,947Deferred amount on refunding (6,355) 638 (5,717) (5,717)
Bonds Payable, net 2,194,765 442,997 (423,223) 2,214,539 74,849 2,139,690
Notes payable (see section C) 95,761 324,000 (321,785) 97,976 77,799 20,177Loans payable (see section D) 42,476 173 (672) 41,977 602 41,375Obligations under capital leases 9,629 (1,603) 8,026 1,095 6,931Net OPEB obligation 38,466 8,425 (13) 46,878 46,878Compensated absences 33,601 1,024 (2,002) 32,623 9,348 23,275Due to primary government 60,508 4,954 (5,558) 59,904 4,489 55,415Due to Other Governments and Agencies 165 (51) 114 114Unearned Revenue 37,543 17,149 (19,331) 35,361 22,445 12,916Due to Component Units 1,858 337 (249) 1,946 552 1,394Other Long-term liabilities Arbitrage rebate 3,814 (2,114) 1,700 1,700 Pollution remediation 25,502 (8,598) 16,904 987 15,917 Other liabilities 256,557 54,321 (15,846) 295,032 7,321 287,711
Total Component Units Long-term Liabilities $ 2,800,645 $ 853,380 $ (801,045) $ 2,852,980 $ 199,601 $ 2,653,379
Beginning Ending
Long-term Liabilities(Expressed in Thousands)
AmountsDue
AmountsDue Within
ThereafterOne YearBalance BalanceReductionsAdditions
82

State of Rhode Island and Providence Plantations Notes to Basic Financial Statements Fiscal Year Ended June 30, 2013
Certain beginning balances of the component units have been reclassified to conform to the current financial statement presentation or restated due to changes in the reporting entity, see Note 18 F.
B. Bonds Payable
At June 30, 2013, future debt service requirements were as follows (expressed in thousands):
Governmental Activities Business Type Activities Component Units
Principal Interest Principal Interest Principal Interest
$ 129,600 $ 111,198 $ 10,060 $ 12,970 $ 73,985 $ 88,505141,060 105,085 10,750 12,229 77,741 86,146147,095 98,331 11,300 11,673 73,196 83,420154,725 90,900 11,285 11,182 73,681 80,656147,310 83,500 10,955 10,620 80,094 77,763
2019 - 2023 518,340 327,393 68,355 43,884 420,200 301,1332024 - 2028 269,115 226,823 75,785 23,147 422,468 245,9302029 - 2033 261,885 167,141 25,820 8,711 407,440 154,2432034 - 2038 116,156 12,650 1,161 287,045 75,8942039 - 2043 371,700 92,925 204,015 30,4832044 - 2048 61,270 10,7562049 - 2053 197,006 2,637,174 * 23,310 1,295
$ 2,337,836 $ 4,056,626 $ 236,960 $ 135,577 $ 2,204,445 $ 1,236,224
* Accreted interest on capital appreciation bonds of the Tobacco Settlement Financing Corporation.
Primary GovernmentFiscalYear
Ending
20172018
June 30
201420152016
Primary Government - Governmental Activities General obligation bonds of the State are serial bonds with interest payable semi-annually. During the year ended June 30, 2013 the State issued $81,400,000 of general obligations bonds with interest rates ranging from 2.00% to 5.00%, maturing from 2014 through 2033. At June 30, 2013, general obligation bonds authorized by the voters and unissued amounted to $244,600,000. In accordance with the General Laws, unissued bonds are subject to extinguishment seven years after the debt authorization was approved, unless extended by the General Assembly. In addition to the debt authorized by the voters for which the full faith and credit is pledged, the General Assembly has authorized the issuance of other debt that is subject to annual appropriation. The following authorizations have been enacted and the State plans to issue the debt over the next several years: (1) Energy Conservation Certificates of Participation - $109,240,000, and (2) Information Technology Improvements Certificates of Participation - $45,300,000. The unissued balances are $35,200,000 and $36,130,000 respectively. Historic Tax Credit Bonds - In FY2009 the RIEDC, on behalf of the State, issued $150,000,000 of revenue bonds under the Historic Structures Tax Credit Financing Program. The bonds do not constitute a debt, liability, or obligation of the State or any political subdivision thereof. The RIEDC has no taxing power. The State is obligated under a Payment Agreement to make payments to the trustee. This obligation is subject to annual appropriation by the General Assembly. The proceeds of the bonds are being used to provide funds for redemption of Historic Structures Tax Credits. There is remaining authorization to issue up to $206,200,000 of Historic Tax Credit Bonds. RIEDC Grant Anticipation Bonds and Rhode Island Motor Fuel Tax Revenue Bonds - The R.I. Economic Development Corporation (RIEDC), on behalf of the State, issues special obligation debt. Grant Anticipation Revenue Vehicle Bonds are payable solely from future federal aid revenues to be received by the State in reimbursement of federally eligible costs of specific transportation construction projects. Rhode Island Motor Fuel Tax Revenue Bonds are payable solely from certain pledged revenues derived from two cents ($.02) per gallon of the thirty-two cents ($.32) per gallon Motor Fuel Tax. The bonds provide the State matching funds for the Grant Anticipation Revenue Vehicle Bonds. The bonds do not constitute a debt, liability, or obligation of the State or any political subdivision thereof. The RIEDC has no taxing power. The obligation of the State to make payments to the trustee of future federal aid revenues and future pledged motor fuel taxes is subject to annual appropriation by the General Assembly. Pledged revenues were sufficient to fund
83

State of Rhode Island and Providence Plantations Notes to Basic Financial Statements Fiscal Year Ended June 30, 2013
fiscal 2013 debt service payments for Grant Anticipation and Motor Fuel Tax Revenue Bonds. These revenues have been pledged for the term of the Grant Anticipation and Motor Fuel Tax Revenue Bonds through fiscal 2021 and 2027, respectively. Tobacco Settlement Asset-Backed Bonds and Accreted Interest - The Tobacco Settlement Financing Corporation (TSFC), a blended component unit, has issued $882,395,742 of Tobacco Asset-Backed Bonds that were used to purchase the State’s future rights in the Tobacco Settlement Revenues under the Master Settlement Agreement and the Consent Decree and Final Judgment. The bonds are secured solely by and are payable solely from the tobacco receipts sold to the TSFC and other monies of the TSFC and do not constitute a general, legal, or moral obligation of the State or any political subdivision thereof, and the State has no obligation or intention to satisfy any deficiency or default of any payment of the bonds. The TSFC has no taxing power. Certain of the TSFC bonds are capital appreciation bonds on which no periodic interest payments are made, but which were issued at a deep discount from par and accrete to full value at maturity in the year 2052. The bond indenture contains “Turbo Maturity” provisions, whereby the TSFC is required to apply 100% of all collections that are in excess of the current funding requirements of the indenture to the early redemption of the bonds. During the year ended June 30, 2013, TSFC utilized $14,265,000 of excess collections to early redeem an equal amount of outstanding bonds. Pledged tobacco revenues were sufficient to fund fiscal 2013 debt service payments for Tobacco Settlement Asset-Backed bonds. These revenues have been pledged for the term of the underlying debt through fiscal 2052. Primary Government - Business-Type Activities R.I. Convention Center Authority The R.I. Convention Center Authority (RICCA) is limited to the issuance of bonds or notes in an aggregate principal amount of $305,000,000. At June 30, 2013, outstanding bond and note indebtedness totaled $237,191,000. Revenue bonds of RICCA were issued to (a) refund bonds and notes, (b) pay construction costs, (c) pay costs of issuance and (d) acquire and renovate the Dunkin Donuts Center. The revenue bonds are secured by all rents receivable, if any, under a lease agreement between the RICCA and the State covering all property purchased by the RICCA. The agreement also covers a mortgage on facilities and land financed by the proceeds of the revenue bonds and amounts held in various accounts into which bond proceeds were deposited. Minimum annual lease payments by the State are equal to the gross debt service of RICCA. In the event of an operating deficit (excluding depreciation), annual lease payments may be increased by the amount of the deficit. The obligation of the State to pay such rentals is subject to and dependent upon annual appropriations of such payments being made by the Rhode Island General Assembly for such purpose. Those appropriations are made in connection with the State’s annual budgetary process and are therefore dependent upon the State’s general financial resources and factors affecting such resources. In addition, outstanding indebtedness is insured under certain financial guaranty insurance policies. All outstanding indebtedness is subject to optional and mandatory redemption provisions. Mandatory redemption is required for certain bonds over various years through 2027 at the principal amount of the bonds. Certain bonds may be redeemed early, at the option of RICCA, at amounts ranging from 100% to 102% of the principal balance. During March 2013, RICCA issued Refunding Revenue Bonds, 2013 Series A, in an aggregate principal amount of $37,335,000 for the purpose of refunding RICCA’s outstanding Refunding Revenue Bonds, 2003 Series A, refunding a portion of RICCA’s Refunding Revenue Bonds, 1993 Series B, and to pay costs of issuance. The bonds bear interest at rates ranging from 2% to 5% and mature in varying installments beginning May 15, 2015 through May 15, 2020. The debt service prior to refunding was $53,325,950 while the debt service subsequent to the refunding is $46,426,283; therefore, the refunding resulted in savings of $6,899,667, the present value of which is $6,444,627. Each of the RICCA’s Bond Resolutions contains certain restrictive covenants. During fiscal year 2013, the RICCA was unable to fund the Operating Reserve and Debt Service Reserve requirements. Subsequent to June 30, 2013, RICCA and the Rhode Island Department of Administration (DOA) entered into two grant agreements that provide for total appropriations of $6,475,000 for the purpose of funding the
84

State of Rhode Island and Providence Plantations Notes to Basic Financial Statements Fiscal Year Ended June 30, 2013
renewal and replacement requirement included in the 2006 Series A Bonds (DDC) and $5,500,000 for the purpose of funding renovations and repairs to the RICCA through June 30, 2018. Under the grant agreement for the DDC, RICCA will receive funding of $925,000 in fiscal year 2014 and will receive annual appropriations of $1,387,500 through fiscal year 2018. Under the grant agreement for the RICCA, they received funding of $500,000 in fiscal year 2013 and will receive annual appropriations of $1,000,000 through fiscal year 2018. Any unexpended funds from one fiscal year will be recommended to be re-appropriated to the subsequent fiscal year. Discretely Presented Component Units University of Rhode Island, Rhode Island College and the Community College of Rhode Island The University of Rhode Island (URI), Rhode Island College (RIC), and the Community College of Rhode Island (CCRI) have issued a number of series of revenue bonds to finance housing, student union (including bookstores) and dining facilities. Under terms of the trust indentures, certain net revenues from these operations must be transferred to the trustees for payment of interest, retirement of bonds, and maintenance of facilities. The bonds are payable in annual or semi-annual installments to various maturity dates. Revenue bonds also include amounts borrowed under loan and trust agreements between the R.I. Health and Educational Building Corporation (RIHEBC) and the Board of Education acting for URI, RIC, and CCRI. The agreements provide for RIHEBC's issuance of the bonds with a loan of the proceeds to the university and colleges and the payment by the university and colleges to RIHEBC of loan payments that are at least equal to debt service on the bonds. The bonds are secured by a pledge of revenues of the respective institutions. At June 30, 2013 revenue bonds outstanding were as follows: URI - $235,502,000, RIC - $18,447,000 and CCRI - $3,117,000. R.I. Airport Corporation Per its Master Indenture of Trust and Supplemental Indentures, the R.I. Airport Corporation (RIAC) has pledged net revenues derived from the operation by RIAC of the Airport and certain outlying airports to repay $244,967,000 in airport revenue bonds issued on their behalf by RIEDC. Proceeds from the bonds were used for various airport improvement projects. The amount available to pay debt service per the Master Indenture, including pledged passenger facility charges, was approximately $38,691,000 for the year ended June 30, 2013. Principal and interest payments for the year ended June 30, 2013 were approximately $22,521,000. RIAC has pledged facility revenues related to the InterLink Facility, net of specified operating expenses, to repay $47,570,000 in First Lien Special Facility Bonds. Proceeds from the bonds were used for the construction of the InterLink Facility. Facility revenues, including interest income, were $7,419,000 for the year ended June 30, 2013. Principal and interest paid for the year ended June 30, 2013 was approximately $3,005,000. Principal payments commenced on July 1, 2011. The InterLink Facility includes consolidated facilities for Airport rental car operations; a train platform to provide access for commuter rail service south to Wickford, Rhode Island and north to both Providence and Boston; and a parking garage for rental car operators and rail commuters. I-195 Redevelopment District Commission In April 2013, RIEDC issued Economic Development Revenue Bonds, 2013 Series A, in the aggregate principal amount of $37,440,000, for which the I-195 Redevelopment District Commission (I-195 RDC) is the obligor. The 2013 Series A Bonds mature in April 2033. Through April 30, 2013, the 2013 Series A Bonds bore interest at 1.1717%; thereafter, the bonds bear interest at the lesser of the 30-Day London InterBank Offered Rate (LIBOR) (0.20% at June 30, 2013) plus applicable margin, or 7.75 %. Concurrent with the issuance of the 2013 Series A Bonds, RIEDC issued Economic Development Bonds, 2013 Series B (federally taxable), in the aggregate principal amount of $960,000, for which the RI-195 RDC is the obligor. The 2013 Series B Bonds mature in April 2019. Through April 30, 2013, the 2013 Series B Bonds bore interest at 1.3217%; thereafter, the 2013 bonds bear interest at the lesser of the 30-Day LIBOR (0.20% at June 30, 2013) plus applicable taxable margin, or 7.75%.
85

State of Rhode Island and Providence Plantations Notes to Basic Financial Statements Fiscal Year Ended June 30, 2013
Applicable margin and applicable taxable margin is the rate that corresponds to the lesser of the two long-term bond ratings of the State from Moody’s Investors Service (Moody’s) and Standard & Poor’s (S&P) in the following table:
State Bond Rating (S & P/Moody's): AA/Aa2 or Higher AA-/Aa3 A+/A1 A/A2 A-/A3
Applicable Margin, 2013 Series A 1.00% 1.17% 1.37% 1.57% 1.82% Applicable Taxable Margin, 2013 Series B 1.15% 1.32% 1.52% 1.72% 1.97%
The State’s bonds were rated AA- and Aa3 by S&P and Moody’s, respectively, as of March 2013, which is the most recent date for which bond rating information is available. As such, at June 30, 2013, the 2013 Series A bonds bore interest at 1.37%, and the 2013 Series B bonds bore interest at 1.52%. Simultaneously with the issuance of the 2013 Series A and B Bonds, the Commission, RIEDC, and Sovereign Bank (the Bank) entered into a bond purchase agreement under the terms of which the 2013 Series A and B Bonds were purchased by the Bank. The Bank holds a mandatory tender option to sell the bonds to RIEDC on either April 1, 2023 or April 1, 2028. Concurrent with the issuance of the 2013 Series A and B Bonds, the State entered into separate rate cap transaction agreements with the Bank for each bond series (the 2013 Series A and B Rate Cap Agreements). Under the terms of the 2013 Series A Rate Cap Agreement, the State paid the Bank $658,500. In exchange, the Bank agreed to pay the State interest on a monthly basis at 30-Day LIBOR (0.20% at June 30, 2013), to the extent 30-Day LIBOR exceeds the interest rate cap, on the notional amount, which mirrors the scheduled principal balance of the 2013 Series A Bonds through April 1, 2023. The interest rate under the 2013 Series A Rate Cap Agreement is capped at 6.75%. Under the terms of the 2013 Series B Rate Cap Agreement, the Bank agreed to pay the State interest on a monthly basis at 30-Day LIBOR (0.20% at June 30, 2013), to the extent 30-Day LIBOR exceeds the interest rate cap, on the notional amount, which mirrors the scheduled principal balance of the 2013 Series B Bonds, through April 1, 2019. The State made no payment to the Bank under the terms of that agreement. The interest rate under the 2013 Series B Rate Cap Agreement is capped at 6.85%. At June 30, 2013, the fair value of the 2013 Series A and B Rate Cap Agreements was $635,834 and is estimated as the amount the Bank would receive to terminate the Rate Cap Agreement at that date, taking into account current interest rates and the current credit worthiness of the counterparties. Repayment of the 2013 Series A and B Bonds shall be solely from i) appropriated funds, if any, made available and appropriated by the General Assembly for bond payments, but not for payment of administrative expenses and ii) pledged receipts, which are the net proceeds derived from the sale, lease, transfer, conveyance, or other disposition of any interest in all or any portion of the I-195 land owned by the Commission. The Commission has pledged and granted to RIEDC a security interest, which has been assigned to the bond trustee, in all pledged receipts and all deposits in the bond, project, expense, and credit facility funds established with the bond trustee. Proceeds from the 2013 Series A and B Bonds were transferred by the Commission to the State’s Intermodal Surface Transportation Fund. As required by federal regulations, the State must utilize the proceeds for infrastructure projects consistent with those eligible for federal funding under the Highway Planning and Construction Program. R.I. Industrial-Recreational Building Authority The $60,000,000 of authorized bonds that may be issued by the R.I. Industrial-Recreational Building Authority (RIIRBA) are limited by mortgage balances that it has insured which are guaranteed by the State. See Note 12 for details of specific commitments relating to a defaulted project guaranteed by RIIRBA.
86

State of Rhode Island and Providence Plantations Notes to Basic Financial Statements Fiscal Year Ended June 30, 2013
R.I. Resource Recovery Corporation The R.I. Resource Recovery Corporation (RIRRC) issued bonds in 2002 known as Resource Recovery System Revenue Bonds, 2002 Series A, which bore interest at rates ranging from 3.5% to 5% and matured in varying installments through March 2022. In May 2013, RIRRC redeemed the outstanding balance of its 2002 Series A revenue bonds, in the amount of $11,185,000. At the same time, the unamortized bond discount and unamortized bond issuance costs of approximately $180,000 and $144,000, respectively, were fully expensed. In conjunction with the redemption, RIRRC terminated a debt service forward delivery agreement which guaranteed interest of 5% per year on the balance of the debt service fund, and received a payment of $390,000 as the termination payment. In addition, RIRRC was required to pay an arbitrage rebate to the Internal Revenue Service of approximately $220,000. In May 2013, RIRRC issued Resource Recovery System Revenue Bonds, Leachate Pretreatment Facility Project, Series 2013, in the amount of $40,000,000. These bonds bear interest at 2.78% and mature on May 31, 2023. A prepayment option was included in the bond issue which allows prepayment in whole or in part, at a price equal to the principal amount plus accrued interest, plus a yield maintenance fee. This fee is calculated as the difference between the rate on US Treasury securities with a maturity date of May 31, 2023, and the Cost of Funds component of the interest rate on the Series 2013 bonds. Outstanding indebtedness is collateralized by all net revenues of the RIRRC, certain restricted funds created pursuant to the bonds’ issuance, and any revenues and property specifically conveyed, pledged, assigned, or transferred by the RIRRC as additional security for the bonds. R.I. Turnpike and Bridge Authority
At June 30, 2013, the R. I. Turnpike and Bridge Authority (RITBA) had revenue bonds outstanding with principal amounts totaling $64,330,000. These bonds are from the 2003 Series A Taxable Refunding Revenue Bonds and from the 2010 Series A Revenue Bonds, maturing in 2017 and 2039, respectively. The bond proceeds are used to finance the repair, rehabilitation, upgrading, and improvement of the Claiborne Pell Bridge, the Mount Hope Bridge, and other such activities as stated in the Authority Acts which authorized the issuance of the bonds. The State has authorized RITBA to issue approximately $68 million of additional revenue bonds. The terms and expected date for such issuance have not yet been determined. Other Component Units Other nonmajor component units have various bonds outstanding. These revenue bonds were generally issued to fulfill the component unit’s corporate purpose. Additional information on each nonmajor component unit’s debt obligations is available in their audited financial statements.
C. Notes Payable
Primary Government Special Obligation Notes (expressed in thousands) at June 30, 2013 are as follows:
$ 6,675
Note payable to a financial institution -to finance the design, development and implementation of a motor vehiclesinformation management system for the Division of Motor Vehicles – the note is payable with interest of 4.2137% due semi-annually and principal due April 1, 2014-2017
The special obligation note is subject to annual appropriation by the General Assembly. The note payable to a financial institution will be repaid from a $1.50 surcharge on every transaction processed at the Division of Motor Vehicles. This surcharge is pledged to fund debt service on the note. Pledged revenues were sufficient to fund fiscal 2013 debt service payments for this special obligation note. These revenues have been pledged for the term of the note through fiscal 2017.
87

State of Rhode Island and Providence Plantations Notes to Basic Financial Statements Fiscal Year Ended June 30, 2013
Discretely Presented Component Units Notes payable (expressed in thousands) at June 30, 2013 are as follows:
Component Units Rhode Island College note payable to the federal government with interest
at 5.5% payable in semi-annual installments of principal and interest through 2024 $ 1,432R.I. Housing and Mortgage Finance Corporation bank
notes and lines of credit, 0.24% to 6.25% interest, payable through 2030. 91,291R.I. Turnpike and Bridge Authority
Bond Anticipation Note maturing on February 7, 2015 at interest at the thirty-dayLondon InterBank Offered Rate (LIBOR) plus an applicable margin rate based on RITBA'sdebt rating payable monthly. 5,000
R.I. Airport Corporationnote payable at 4.15% interest, payable through 2015 253
97,976Less: current portion (77,799)
$ 20,177
D. Loans Payable
Discretely Presented Component Units In June 2006, the R.I. Airport Corporation (RIAC), RIEDC and the R.I. Department of Transportation (RIDOT) executed a Secured Loan Agreement (Agreement) which provides for borrowings of up to $42,000,000 with the United States Department of Transportation under the Transportation Infrastructure Finance and Innovation Act of 1998 (TIFIA). The purpose of the Agreement is to reimburse RIEDC and RIDOT and to provide funding to RIAC for a portion of eligible project costs related to the InterLink Facility Project. RIAC is permitted under the Agreement to make requisitions of funds for eligible project costs, and it is anticipated that such requisitions will occur through fiscal year 2013. Upon completion of the project, RIAC began making monthly payments of principal and interest, with interest at a rate of 5.26%. Payments are made on behalf of RIEDC (the borrower per the Agreement), and debt service payments commenced in fiscal year 2013 with a final maturity in fiscal year 2042. Such repayments are payable solely from the net revenues derived from the InterLink Facility. As of June 30, 2013, RIAC had $40,059,000 in borrowings under this agreement. The remaining balance consists of loans payable by the University of Rhode Island and the Quonset Development Corporation of approximately $1,071,000 and $847,000, respectively.
E. Obligations Under Capital Leases
Primary Government The State has entered into capital lease agreements, Certificates of Participation (COPS), with financial institutions. These financing arrangements have been used by the State to acquire, construct or renovate facilities and acquire other capital assets. The State’s obligation under capital leases at June 30, 2013 consists of the present value of future minimum lease payments less any funds available in debt service reserve funds. Obligation of the State to make payments under lease agreements is subject to and dependent upon annual appropriations being made by the General Assembly. During the year ended June 30, 2013 the State issued the following Certificates of Participation:
$36,310,000 of Lease Participation Certificates (Kent County Courthouse Project – 2013
Refunding Series A), with interest rates ranging from 2.00% to 5.00%, maturing from 2014 through 2024. The proceeds were used to affect an advance refunding of $39,410,000 of Kent County Courthouse Project lease participation certificates. The net proceeds from the sale of the refunding certificates were used to purchase U.S. Government securities which were deposited in an irrevocable trust with an escrow agent to provide for all future debt service of the refunded certificates. The refunding met the requirements of an in-substance debt defeasance and the refunded certificates were removed from the Statement of Net Position. The refunding decreases total debt service payments over the next 11 years by $3,517,000 and resulted in an economic
88

State of Rhode Island and Providence Plantations Notes to Basic Financial Statements Fiscal Year Ended June 30, 2013
gain (difference between the present values of the debt service payments on the old and new debt) of $3,380,000.
$36,575,000 of Lease Participation Certificates (Training School Project – 2013 Refunding Series
B), with interest rates ranging from 2.00% to 5.00%, maturing from 2014 through 2025. The proceeds were used to affect an advance refunding of $38,030,000 of Training School Project lease participation certificates. The net proceeds from the sale of the refunding certificates were used to purchase U.S. Government securities which were deposited in an irrevocable trust with an escrow agent to provide for all future debt service of the refunded certificates. The refunding met the requirements of an in-substance debt defeasance and the refunded certificates were removed from the Statement of Net Position. The refunding decreases total debt service payments over the next 12 years by $2,267,000 and resulted in an economic gain (difference between the present values of the debt service payments on the old and new debt) of $2,176,000
$17,520,000 of Lease Participation Certificates (Energy Conservation Project – 2013 Series C) with interest rates from 2.00% to 5.00%. The proceeds will be used for a number of energy conservation projects at State facilities. The certificates mature in 2014 through 2023.
$9,170,000 of Lease Participation Certificates (Information Technology Project – 2013 Series D)
with interest rates from 2.00% to 5.00%. The proceeds will be used for a number of information technology projects to benefit the State as well as municipalities. The certificates mature in 2014 through 2023.
$15,290,000 of Lease Participation Certificates (Traffic Tribunal Project – 2013 Refunding Series E), with interest rates ranging from 2.00% to 5.00%, maturing from 2014 through 2025. The proceeds were used to affect an advance refunding of $15,415,000 of Traffic Tribunal Project lease participation certificates. The net proceeds from the sale of the refunding certificates were used to purchase U.S. Government securities which were deposited in an irrevocable trust with an escrow agent to provide for all future debt service of the refunded certificates. The refunding met the requirements of an in-substance debt defeasance and the refunded certificates were removed from the Statement of Net Position. The refunding decreases total debt service payments over the next 12 years by $743,000 and resulted in an economic gain (difference between the present values of the debt service payments on the old and new debt) of $710,000.
The following is a summary of material future minimum lease payments (expressed in thousands) required under capital leases that have initial or remaining noncancelable lease terms in excess of one year as of June 30, 2013:
Total
$ 34,94231,07830,63830,73525,219
2019 - 2023 109,2022024 - 2028 30,9682029 - 2033 2,482
Total future minimum lease payments 295,264
Amount representing interest (62,289)
Present value of future minimum lease payments $ 232,975
201620172018
Fiscal YearEnding June 30
20142015
Each COPS transaction generally covers multiple capital projects supporting multiple functions of the primary government. In general, the amount of capital asset additions funded through COPS is equivalent to the amount of the issuance. The State reports the amortization charge on assets acquired through COPS
89

State of Rhode Island and Providence Plantations Notes to Basic Financial Statements Fiscal Year Ended June 30, 2013
with depreciation expense on the government-wide financial statements and discloses the amounts in Note 6, Capital Assets. When issuances also fund component unit projects, the State records the full lease under the obligation and recognizes the related receivable from the component unit for their portion of debt service in the government-wide financial statements.
F. Defeased Debt
In prior years, the State and its component units defeased certain general obligation bonds and revenue bonds by placing the proceeds of the new bonds or other sources in irrevocable trusts to provide for all future debt service payments on the old bonds. Accordingly, the trust account assets and the liabilities for the defeased bonds are not included in the basic financial statements. At June 30, 2013, the following bonds outstanding (expressed in thousands) are considered defeased:
Primary government:General Obligation Bonds $ 122,545R.I. Convention Center Authority 6,035
Component Units:R.I. Depositors Economic Protection Corporation (ceased operations during FY04) 148,410R.I. Economic Development Corporation 10,765R.I. Turnpike and Bridge Authority 32,300
Amount
G. Conduit Debt
The R.I. Industrial Facilities Corporation and the R.I. Economic Development Corporation issue revenue bonds, equipment acquisition notes, and construction loan notes to finance various capital expenditures for Rhode Island business entities. The bonds and notes issued by the corporations are not general obligations of the corporations and are payable solely from the revenues derived from the related projects. They neither constitute nor give rise to a pecuniary liability for the corporations nor do they represent a charge against their general credit. Under the terms of the various indentures and related loan and lease agreements, the business entities make loan and lease payments directly to the trustees of the related bond and note issues in amounts equal to interest and principal payments due on the respective issues. The payments are not shown as receipts and disbursements of the corporations, nor are the related assets and obligations included in the financial statements. The amount of conduit debt outstanding on June 30, 2013 was $80,000,000 and $903,500,000 respectively, for these component units. Certain issues of conduit debt are moral obligations of the State, and the current amounts outstanding are disclosed in Note 13.
H. Short-Term Borrowing
The R.I. Housing & Mortgage Corporation had outstanding balances of $68,000,000 at June 30, 2013 on two lines of credit that are payable on demand and accrue interest at rates ranging from 1.22% to 1.95%.
I. Pollution Remediation Liabilities
GASB Statement No. 49 establishes guidance to estimate and report potential costs which may be incurred for pollution remediation liabilities. GASB 49 requires the reporting entity to reasonably estimate and report a remediation liability when one of the following obligating events has occurred:
Pollution poses an imminent danger to the public and the reporting entity is compelled to take action.
The reporting entity is in violation of a pollution related permit or license.
The reporting entity is named or has evidence it will be named as a responsible party by a
regulator.
The reporting entity is named or has evidence it will be named in a lawsuit to enforce a cleanup.
The reporting entity commences or legally obligates itself to conduct remediation activities.
90

State of Rhode Island and Providence Plantations Notes to Basic Financial Statements Fiscal Year Ended June 30, 2013
The State and certain component units have remediation activities underway, and these are in stages including site investigation, planning and design, clean up and site monitoring. Several agencies within State government have as part of their mission the responsibility to investigate possible pollution sites and oversee the remediation of those sites. These agencies have the expertise to estimate the remediation obligations presented herein based on prior experience in identifying and funding similar remediation activities. The remediation liabilities reported have been calculated using the expected cash flow technique. Situations posing potential liabilities, for which a reasonable estimate could not be made, have not been included. The remediation obligation estimates presented are subject to change over time. Cost may vary due to price fluctuations, changes in technology, changes in potential responsible parties, results of environmental studies, changes in laws or regulations, and other factors that could result in revision to the estimates. Recoveries from responsible parties may reduce the State’s obligation. As of June 30, 2013, no reasonable estimates of those recoveries can be made. Capital assets may be created when pollution remediation outlays are made under specific circumstances.
J. Due to Other Governments and Agencies
The State has borrowed amounts from the federal government (Unemployment Insurance Trust Fund) to fund employment insurance benefits paid from the Employment Security Fund to eligible unemployed individuals. The amount outstanding was $155,276,000 on June 30, 2013. Interest accrued beginning January 1, 2011 and is payable on October 1 of each year. The interest due on federal loans cannot be paid from employer taxes and federal revenue received by the State to pay unemployment benefits. In recent years, the General Assembly passed legislation increasing the Job Development Fund Assessment on employers by 0.3%, dedicating the additional assessment to pay the principal and interest on the federal loans. Other legislative changes, effective in fiscal year 2012 and 2013, included adjusting the unemployment insurance taxable wage base and reducing individual unemployment benefit amounts. Estimated savings from these changes are designed to reduce the amount owed to the federal government in future years. The State projects that it will need to continue to borrow in fiscal year 2014 as authorized by Federal law in order to meet its cash flow needs to finance the cost of unemployment benefit payments.
K. Compensated Absences
State employees and those of certain component units are granted vacation and sick leave in varying amounts based upon years of service. Additionally, the State has deferred payment of certain compensation to employees. A liability has been calculated for all earned vacation credits subject to certain limitations and vested sick leave credits that are payable at retirement subject to certain limitations. Payment is calculated at the employees’ current rate of pay.
L. Arbitrage Rebate
A liability accrues for income on the investment of debt proceeds determined to be arbitrage earnings in accordance with federal regulations. These amounts are generally payable to the federal government five years after the issuance date of the bonds.
M. Due to the Primary Government
This consists of the repayment of general obligation debt that was issued by the State on behalf of certain component units.
N. Other Long-Term Liabilities
Governmental Activities - the liabilities consist primarily of:
Retainage related to infrastructure construction projects - these amounts are considered long-term liabilities since the related construction projects are not expected to be completed in the subsequent fiscal period.
Tax refunds payable – these amounts are tax carry-forward credits for taxpayers that are not expected to be paid in the subsequent fiscal period
91

State of Rhode Island and Providence Plantations Notes to Basic Financial Statements Fiscal Year Ended June 30, 2013
In addition, certain other long-term payables are included in this category. Historically, long-term liabilities, other than debt, will be paid through certain funds as follows:
Compensated Absences – Assessed Fringe Benefits Fund, an internal service fund and the respective fund to which the underlying employee’s wages and benefits are charged.
Pollution remediation – General, RI Capital Plan, and Intermodal Surface Transportation Funds. Other long-term liabilities – General and Intermodal Surface Transportation Funds.
Component Units – the liabilities consist primarily of landfill closure and post-closure costs and grants refundable. Note 8. Net Position/Fund Balances Governmental Activities Restricted Net Position The Statement of Net Position reflects $657,545,000 of restricted net position, of which $264,180,000 is restricted by enabling legislation. The net position that is restricted by enabling legislation is included in the Temporary Disability Insurance Program and Other categories on the Statement of Net Position. The principal components of the remaining balance of the restricted net position relate to the Budget Reserve and Cash Stabilization Account and unexpended bond proceeds. Governmental Funds – Fund Balances Governmental fund balance categories are detailed below (expressed in thousands):
General IST OtherFund Fund Funds Total
Fund Balances:Nonspendable:
Permanent Fund Principal $ $ $ 174 $ 174
Restricted for:Budget Reserve and Cash Stabilization 171,959 171,959 Purposes specified by enabling legislation 110,177 110,177 Debt Service 18,598 94,113 112,711 Capital Projects 252,776 252,776 Temporary Disability Insurance 154,004 154,004 Historic Tax Credit Redemption 11,285 11,285 Transportation 126,875 126,875 Education 1,865 1,865 Other 682 682
Committed to:Transportation 95 95 Employees' Retirement System Transfer 168 168 Other 3,867 3,867
Assigned to:Subsequent Years Expenditures 101,942 101,942 Other 3,698 255 68 4,021
Unassigned: 9,323 (4,113) 5,210
Totals $ 401,134 $ 141,710 $ 514,967 $ 1,057,811
Major Funds
Article IX of the State Constitution requires the maintenance of a State Budget Reserve and Cash Stabilization Account (“Reserve”) within the State’s General Fund. Section 35-3 of the General Laws specifically establishes the annual minimum balance requirements for the account. For fiscal year 2013, 3.0% of total general revenues and opening surplus are transferred to the Reserve. Amounts in excess of 5.0% of total general revenues and opening surplus are transferred to the RI Capital Plan Fund to be used for capital projects. The Reserve, or any portion thereof, may be appropriated in the event of an
92

State of Rhode Island and Providence Plantations Notes to Basic Financial Statements Fiscal Year Ended June 30, 2013
emergency involving the health, safety or welfare of the citizens of the State or in the event of an unanticipated non-routine deficit in any given year. Such appropriations must be approved by a majority of each chamber of the General Assembly. Since its inception the Reserve has been accessed once in fiscal year 2009 to address an unexpected severe revenue shortfall. At that time the General Assembly appropriated $22 million from the Reserve. The State has not adopted any minimum fund balance requirements for any funds beyond the State Budget Reserve and Cash Stabilization Account within the General Fund. Pursuant to the General Laws upon issuance of the audited financial statements, the State Controller is required to transfer all general revenues received in the fiscal year (net of the transfer to the State Budget Reserve and Cash Stabilization Account) in excess of those estimates adopted for that fiscal year as contained in the final enacted budget, to the Employees’ Retirement System. The amount of such transfer is $169 thousand which is reflected in the committed category of fund balance in the table above. The transfer will be made in fiscal year 2014 upon issuance of the audited financial statements. See Note 1, Section R of these Notes for more information regarding the five categories of fund balance. Note 9. Taxes Tax revenue reported on the Statement of Activities is reported net of the allowance for uncollectible amounts and net of estimated refunds. Tax revenue on the Statement of Revenues, Expenditures and Changes in Fund Balances – Governmental Funds is reported net of estimated refunds, uncollectible amounts and the amount that will not be collected within one year (unavailable). The unavailable amount is reported as unearned revenue. The detail of the general revenue taxes as stated on the Statement of Activities and the Governmental Funds Statement of Revenues, Expenditures and Changes in Fund Balances is presented below (expressed in thousands):
General FundPersonal Income $ 1,083,011 $ 1,082,035
General Business Taxes:Business Corporations 131,828 131,897Public Utilities Gross Earnings 99,641 99,454Financial Institutions 7,500 13,866Insurance Companies 91,599 91,589Bank Deposits 2,877 2,877Health Care Provider Assessment 41,569 41,569
Sub-total - General Business Taxes 375,014 381,252
Sales and Use Taxes:Sales and Use 878,867 876,152Motor Vehicle 49,431 49,429Motor Fuel 438 401Cigarettes 132,516 132,490Alcoholic 12,176 12,176
Sub-total - Sales and Use Taxes 1,073,428 1,070,648
Other Taxes:Inheritance and Gift 28,490 28,474Racing and Athletics 1,171 1,171Realty Transfer 7,399 7,399
Sub-total - Other Taxes 37,060 37,044
Total - General Fund 2,568,513 2,570,979
Intermodal Surface Transportation FundGasoline 134,465 134,465
Other Governmental Funds 165,525 165,525
Total Taxes $ 2,868,503 $ 2,870,969
Statement of
Funds Activities
Governmental
93

State of Rhode Island and Providence Plantations Notes to Basic Financial Statements Fiscal Year Ended June 30, 2013
Note 10. Operating Transfers Operating transfers for the fiscal year ended June 30, 2013 are presented below (expressed in thousands):
Governmental ActivitiesMajor Funds
GeneralMajor Funds
Intermodal Surface Transportation $ 46,029 Debt service and operating assistanceNonmajor Funds
RI Temporary Disability Insurance 1,769 Administrative cost reimbursementHistoric Tax Credit 8,995 Reimbursement for tax credits claimed Bond Capital 188 Interest earnings transfer
Business-Type ActivitiesLottery 379,225 Net income transferEmployment Security 806 Administrative cost reimbursement
Intermodal Surface TransportationGeneral Fund 1,000 Infrastructure fundingBond Capital 23,115 Infrastructure fundingRI Capital Plan 33,398 Infrastructure funding
Nonmajor FundsCOPs
General 1,874 Debt serviceRI Capital Plan
General 84,624 Transfer statutory excess in budget reserveBond Capital 9,993 Premium on new bonds
RI Public Rail CorporationIntermodal Surface Transportation 1,788 Operating assistance
Total Governmental Activities 592,804Business-Type Activities
Lottery FundRI Capital Plan 272 Capital Improvement
Convention CenterGeneral 23,136 Debt serviceRI Capital Plan 287 Capital Improvement
Employment SecurityGeneral 20,704 Administrative cost reimbursementAssessed Fringe Benefits 1,828 Reimbursement for State employees'
unemployment compensationInternal Service Funds
Central Mail 50 Capital assistanceVehicle Replacement Revolving Loan 7,350 Allocation of prior year ending balance
Total operating transfers primary government $ 646,431
DescriptionTransfers
Note 11. Operating Lease Commitments The primary government is committed under numerous operating leases covering real property. Operating lease expenditures totaled approximately $11,825,000 for the fiscal year ended June 30, 2013. Most of the operating leases contain an option allowing the State, at the end of the initial lease term, to renew its lease at the then fair rental value. In most cases, it is expected that these leases will be renewed or replaced by other leases. The following is a summary of material future minimum rental payments (expressed in thousands) required under operating leases that have initial or remaining lease terms in excess of one year as of June 30, 2013:
94

State of Rhode Island and Providence Plantations Notes to Basic Financial Statements Fiscal Year Ended June 30, 2013
Fiscal YearEnding June 30
2014 $ 12,9452015 11,0242016 8,0252017 3,7192018 3,426
2019 - 2023 8,479
Total $ 47,618
The minimum payments shown above have not been reduced by any sublease receipts. Note 12. Commitments Primary Government Commitments arising from encumbrances are listed below (expressed in thousands):
Major fundsGeneral $ 12,624IST 484,734
Total major funds 497,358
Other governmental funds 6,389
Total encumbrances outstanding $ 503,747
The primary government is committed at June 30, 2013 under various contractual obligations for infrastructure construction and other capital projects, which will be principally financed with debt proceeds and federal grants. Encumbrances within the General Fund will be principally financed through appropriations of general revenue and federal and restricted revenue in succeeding fiscal years. The primary government is also committed at June 30, 2013 under contractual obligations with various service providers, which will be funded through appropriations of general revenue and federal and restricted revenue in succeeding fiscal years. Performance-based Agreements The R.I. Economic Development Corporation (RIEDC), on behalf of the State, entered into several agreements with the developer of the Providence Place Mall. The agreements state the terms by which the State shall perform with regard to a shopping mall, parking garage and related offsite improvements. The authority to enter into these agreements was provided in legislation passed by the General Assembly and signed by the Governor. This legislation further provided for payments to the developer through fiscal year 2021 of an amount equal to the lesser of (a) two-thirds of the amount of sales tax generated from retail transactions occurring at or within the mall or (b) $3,680,000 in the first five years and $3,560,000 in years 6 through 20. In the year ended June 30, 2013, $3,560,000 was paid to the developer. The RIEDC has issued economic development revenue bonds whereby the State will assume the debt if the employer reaches and maintains a specified level of full-time equivalent employees. The participating employers have certified that the employment level has been exceeded, thereby triggering credits toward the debt. As a result, the State paid $3,081,000 of the debt on the related economic development revenue bonds in fiscal year 2013. The State has commitments relating to this debt through fiscal year 2027. Rhode Island Lottery – Master Contract Agreements Gaming Systems Provider - GTECH The Lottery in May 2003 entered into a 20-year master contract with its gaming systems provider, GTECH, granting it the right to be the exclusive provider of information technology hardware, software, and related services for all lottery games. This contract is effective from July 1, 2003 through June 30,
95

State of Rhode Island and Providence Plantations Notes to Basic Financial Statements Fiscal Year Ended June 30, 2013
2023, and it amends all previous agreements between the parties. As consideration for this exclusive right, the gaming systems provider paid the Lottery $12.5 million. In the event that the contract term is not fulfilled, the Lottery will be obligated to refund a pro-rata share of this amount to the gaming systems provider. Additionally, GTECH was obligated to invest $100 million in connection with the construction of a new corporate headquarters and expansion of its manufacturing operations in the State. The gaming system contractor is also required to employ no less than 1,000 full time active employees during the term of the agreement. Video Lottery Facilities – UTGR, Inc. During fiscal year 2006, the Lottery entered into a five (5) year Master Video Lottery Terminal Contract with UTGR, Inc., the owners of Twin River, to manage one of the State’s licensed video lottery facilities. The contract entitles UTGR, Inc. to compensation ranging from 26% to 28.85% of video lottery net terminal income at the facility. UTGR and the Lottery extended the contract and signed the first five-year extension term commencing on July 18, 2010. The second term would commence on July 18, 2015. Certain extensions are contingent on UTGR’s compliance with full-time employment mandates. The Master Contract has been amended in recent years to reflect the statutory authorization of the operation of a promotional points program at Twin River. In fiscal year 2013, Twin River was authorized and issued approximately $31.8 million in promotional points to facility patrons. Recently enacted legislation has authorized an additional expansion of Twin River’s promotional play program effective July 1, 2013. The Master Contract has also been amended to reflect the statutory requirement that the Lottery reimburse UTGR for allowable marketing expenses at an amount not to exceed $6 million multiplied by the Lottery’s percentage of net terminal income (61.12% for fiscal year 2013). The reimbursement of marketing expenses by the Lottery occurs only after UTGR has incurred $4 million in qualified marketing expenses (with marketing expenses defined by the Lottery). Video Lottery Facilities – Newport Grand On November 23, 2005, the Lottery entered into a five (5) year Master Video Lottery Terminal Contract with Newport Grand to continue to manage one of the State’s licensed video lottery facilities. Newport Grand and the Lottery extended the contract and signed the first five-year extension term of the contract commencing on November 23, 2010. The second term, which would commence on November 23, 2015, is contingent on Newport Grand’s compliance with full-time employment mandates specified in the 2010 law. The contract, as amended, entitles Newport Grand to compensation equal in percentage of net terminal income to that of Twin River. Recent legislation increased the percentage of net terminal income by 2.25% effective July 1, 2013, and expiring June 30, 2015. The Master Contract has been amended in recent years to reflect the statutory authorization of a promotional points program at Newport Grand. In fiscal year 2013, Newport Grand was authorized and issued approximately $5.8 million in promotional points to facility patrons. Recently enacted legislation has authorized an additional expansion of Newport Grand’s promotional play program effective July 1, 2013. The Master Contract has also been amended to reflect the statutory requirement that the Lottery reimburse Newport Grand for allowable marketing expenses at an amount not to exceed $840,000 multiplied by the Lottery’s percentage of net terminal income (61.67% for fiscal year 2013). The reimbursement of marketing expenses by the State occurs only after Newport Grand has incurred $560,000 in qualified marketing expenses (with marketing expenses to be defined by the Lottery). R. I. Public Rail Corporation The R. I. Public Rail Corporation (RIPRC), a blended component unit, has obtained a letter of credit in the amount of $7,500,000 in favor of AMTRAK to secure the RIPRC’s performance of its obligations arising under any South County Rail Service agreements. The RIPRC has been designated as the entity responsible for securing and maintaining liability insurance coverage to provide funds to pay all or a portion of the liabilities of the State, the MBTA, and AMTRAK for property damage, personal injury, bodily
96

State of Rhode Island and Providence Plantations Notes to Basic Financial Statements Fiscal Year Ended June 30, 2013
injury or death arising out of the South County Commuter Rail Service with policy limits of $200 million subject to a self-insured retention of $7.5 million. Discretely Presented Component Units R.I. Airport Corporation The R.I. Airport Corporation (RIAC) currently has several projects underway that are part of the Green Airport Improvement Program. The lengthening of primary Runway 5-23 to a total of 8,700 feet will allow the airport to accommodate coast-to-coast and international flights, and will enhance the efficiency of the New England Regional Airport System. Included in the project is the construction of a taxiway extension, an Engineered Material Safety Arresting System (EMAS) Runway Safety Area, and an airport service road. Design of the project is expected to commence in February 2014, and construction is expected to be complete by December 2017. In addition, RIAC is constructing a Deicer Management System which will collect glycol impacted stormwater resulting from de-icing aircraft at T.F. Green Airport, and treat the collected material prior to discharging it into storm drains. As of June 30, 2013, field construction is underway with anticipated completion by April 2014, and the system is scheduled to be fully operational by March 2015. RIAC will begin construction on safety improvements on the end of Runway 16 in July 2013, and on the end of Runway 34 in the summer of 2014. Improvements include the construction of EMAS arrestor beds, blast fencing, drainage improvements, and reconstruction of segments of runway and taxi lanes. As of June 30, 2013 RIAC is obligated for the completion of certain airport improvements under commitments of approximately $6 million, which are expected to be funded from current available resources and future operations. R.I. Turnpike and Bridge Authority The R.I. Turnpike and Bridge Authority (RITBA) has entered into contracts for the maintenance of, and improvements to, its bridges and property. In connection with its Series 2010A Bond Issue, RITBA has a contract with a remaining commitment of approximately $1.8 million as of June 30, 2013. In 2013 RITBA entered into contracts for Phase II of steel repairs and painting on the Claiborne Pell Bridge. The total contract value is $40.8 million and will take several years to complete. At June 30, 2013, the remaining commitments on the contracts total approximately $39.3 million. In addition, RITBA has various other maintenance contracts with remaining commitments of approximately $3 million as of June 30, 2013. R.I. Resource Recovery Corporation Landfill closure and post-closure: The EPA established closure and post-closure care requirements for municipal solid waste landfills as a condition for the right to currently operate them. The landfill operated by the RIRRC has been segregated into five distinct phases. Phases I, II and III were closed by the RIRRC in prior years. While Phase IV reached capacity during fiscal year 2013, portions of Phase IV have been capped, with final capping expected during fiscal year 2014. In 2005, the RIRRC began landfilling in Phase V. As of June 30, 2013 the RIRRC has not begun landfilling in phase VI. A liability for closure and post-closure care of $53,190,729 as of June 30, 2013 has been recorded in the accompanying statement of net position, as summarized by Phases below:
Phase I $ 8,357,552 Phase II and III 4,095,437 Phase IV 9,874,448 Phase V 30,863,292
$ 53,190,729
Year ended
June 30, 2013
97

State of Rhode Island and Providence Plantations Notes to Basic Financial Statements Fiscal Year Ended June 30, 2013
The RIRRC has received site approval for Phase VI from the State Planning Council and has been licensed by RIDEM. As of June 30, 2013, the remaining total estimated current cost to be recognized in the future as landfill closure and post-closure care expense, the estimated percent of landfill capacity used and the estimated remaining years for accepting waste are as follows:
Estimated Estimated Estimated
remaining costs capacity remaining years for
to be recognized used accepting w aste
Phase V $ 7,345,813 80.8% 2.5 years
As of June 30, 2013 the RIRRC revised its estimate for future pollution remediation and landfill closure and post-closure care costs. The revised estimate resulted in a $5,582,821 reduction of the corresponding liability from $75,962,402 at June 30, 2012 to $70,379,581 at June 30, 2013 and was primarily attributable to improved leachate flow data and revised capping costs based on pricing from a recently executed contract. Amounts provided for closure and post-closure care are based on current costs. These costs may be adjusted each year due to changes in the closure and post-closure care plan, inflation or deflation, technology, or applicable laws or regulations. It is at least reasonably possible that these estimates and assumptions could change in the near term and that the change could be material. Included in restricted position held in trust in the accompanying statements of net position as of June 30, 2013 is $41,454,829 placed in trust to meet the financial requirements of closure and post-closure care related to Phases II, III, IV and V. The RIRRC plans to make additional trust fund contributions each year to enable it to satisfy these and future costs. Pollution remediation obligations: Amounts provided for pollution remediation obligations are based on current costs. These costs may be adjusted each year due to changes in the remediation plan, inflation or deflation, technology, or applicable laws or regulations. It is at least reasonably possible that these estimates and assumptions could change in the near term and that the change could be material. Future recoveries from responsible parties which may reduce the remediation obligation, while possible, cannot be reasonably estimated. The pollution remediation obligation for the year ended June 30, 2013 is as follows:
Balance, Balance, CurrentJune 30, 2012 Additions Reductions June 30, 2013 Portion
$ 25,501,843 $ 0 $ (8,597,749) $ 16,904,094 $ 986,985
Superfund site: In prior years, the EPA issued administrative orders requiring the RIRRC to conduct environmental studies of the Central Landfill and undertake various plans of action. Additionally, in 1986, the Central Landfill was named to the EPA's Superfund National Priorities List. During 1996, the RIRRC entered into a Consent Decree with the EPA concerning remedial actions taken by the RIRRC for groundwater contamination. The Consent Decree, which was approved by the U.S. District Court on October 2, 1996, required the establishment of a trust fund in the amount of $27,000,000 for remedial purposes. The balance of the trust fund totaled $42,292,593 as of June 30, 2013 and has been included in restricted position held in trust in the accompanying statement of net position. In 2004, the RIRRC began the capping project for the Superfund site and continued to revise its estimates for leachate pretreatment costs and flows. The RIRRC has recorded a liability for future remediation costs of approximately $16,904,000 as of June 30, 2013.
98

State of Rhode Island and Providence Plantations Notes to Basic Financial Statements Fiscal Year Ended June 30, 2013
Other pollution remediation obligations: The RIRRC is the owner of several properties adjacent to its landfill operations. The RIRRC is obligated to remediate one of these parcels. The RIRRC has recorded a liability for future remediation costs of approximately $285,000 as of June 30, 2013. Environmental concerns: In August 1996, the RIRRC entered into a Consent Agreement (the Agreement) with RIDEM concerning action to be taken by the RIRRC regarding the restoration of certain wetlands. Projects included the relocation of Cedar Swamp Brook, creation of a three acre wetland, and the implementation of a soil and erosion plan. The Agreement also called for the establishment of an escrow account for wetlands replacement. Annual deposits of $100,000 were made by the RIRRC during fiscal years 1997 through 2002, as required by RIDEM. During 2004, RIDEM released from the escrow approximately $543,000 to the RIRRC. As of June 30, 2013 the escrow account totaled approximately $156,000. The RIRRC submitted a comprehensive plan to RIDEM which was approved by RIDEM in April 1998. The RIRRC had until 2001 to complete the restoration. Phase I of the Cedar Swamp Brook relocation was substantially completed by November 1998. The wetlands restoration work was completed in the spring of 1999 and is awaiting RIDEM approval. R.I. Public Transit Authority The R.I. Public Transit Authority is committed under construction contracts in the amount of $7,220,480 at June 30, 2013. R.I. Industrial-Recreational Building Authority At June 30, 2013, the Authority had insured contractual principal and interest payments required under first mortgages and first security agreements principally for land and buildings of manufacturing and distribution entities located throughout Rhode Island. Principal balances outstanding under first mortgages and first security agreements insured by the Authority at June 30, 2013 are $16,105,000. The Authority insured a bond issued by Rhode Island Industrial Facilities Corporation (RIIFC) on behalf of a private sector entity. During the year ended June 30, 2013 the private sector entity was in default on its payments to the bond holder and the Authority has assumed responsibility for making the debt payments. These payments will be made by first exhausting the Authority’s available financial resources. The Authority must then request appropriations from the Rhode Island General Assembly for any loss in excess of the insured amount. At June 30, 2013, the Authority has determined that it is likely that it will incur a loss under the insured commitment. The Authority has estimated the range of potential loss to be between $1,749,000 and $6,413,000 and has determined the best estimate within this range to be $2,006,810. Accordingly, the Authority has accrued an insured commitment payable of $2,006,810 equal to the estimated loss at June 30, 2013. The current portion of the insured commitments payable was calculated by estimating the monthly payments due within one year on this bond. Other Component Units Other component units have various commitments arising from the normal course of their operations. These commitments are not significant, overall, to the State’s financial statements. Note 13. Contingencies Primary Government The State, its officers and employees are defendants in numerous lawsuits. For those cases in which it is probable that a loss has or will occur and the amount of the potential judgment can be reasonably estimated
99

State of Rhode Island and Providence Plantations Notes to Basic Financial Statements Fiscal Year Ended June 30, 2013
or a settlement or judgment has been reached but not paid, the State has recognized a liability within its financial statements. Significant specific litigation matters are discussed below. Challenges to the 2009 and 2010 Pension Reform - A number of unions representing state employees and teachers filed a lawsuit in State court in May 2010 initially challenging and attempting to block the 2009 pension reforms enacted by the General Assembly and later amended the suit to include 2010 reforms. The 2005 reforms were not challenged. The State intends to vigorously contest the lawsuit. The defendant State officials filed a Motion for Summary Judgment on the claims set forth in the Amended Complaint, which was heard on July 18, 2011. Prior to the hearing, the parties stipulated that the only issue that would be presented to the Court during the hearing on the Motion would concern whether the statute created a contract between the state and its participants. The parties agreed that in the event that the Court concluded that the statute did create a contract, the remaining issues of whether the contract had been impaired and whether any such impairment was legally justified would be briefed and argued at a later date. On September 13, 2011, the Superior Court issued its decision in which it ruled that pension plan participants have a contractual right based on an implied-in-fact contract theory. Consistent with the parties' stipulation, the Court did not decide whether that contract had been impaired or whether any such impairment was legally justified. The defendant State officials believe the Superior Court's ruling was legally wrong. On October 3, 2011, Defendants filed a Petition for Issuance of a Writ of Certiorari and Supporting Memorandum of Law with the Rhode Island Supreme Court. Defendants also filed a motion through which they requested that the Supreme Court expedite its review of the Petition for Issuance of a Writ of Certiorari. On November 22, 2011, the Supreme Court denied the petition for Writ of Certiorari. The litigation is proceeding through discovery at this time. Challenges to the 2011 Pension Reform - In June 2012, certain retiree groups and unions representing state and municipal employees who maintain they are current beneficiaries of ERSRI commenced five separate lawsuits in State court challenging the Rhode Island Retirement Security Act of 2011 (“RIRSA”) enacted by the General Assembly. In each of the five cases, the plaintiffs alleged that RIRSA violates the Contract Clause, the Takings Clause and the Due Process Clause of the Rhode Island Constitution. In addition, in the Rhode Island Public Employees’ Retirement Coalition v. Chafee, C.A. No. 12-3166 case, the plaintiffs also allege counts for promissory estoppel and breach of contract. The State intends to vigorously contest the lawsuit. On August 17, 2012, the defendants filed a motion to dismiss the Rhode Island Public Employees’ Retirement Coalition v. Chafee, C.A. No. 12-3166 case on the ground that Rhode Island’s pension legislation does not create a contract with ERSRI participants and that general contract principles, such as implied contracts, cannot be used to determine whether a state statute creates a contract. In the remaining four cases, the defendants filed motions for more definite statements in which they argued that it is not clear from the plaintiffs’ pleadings what purported contract or contract(s) plaintiffs allege have been impaired. The defendants also moved in the alternative and asked the Court to dismiss the remaining four cases if the Court concluded that the plaintiffs’ purported contracts derive from Rhode Island’s pension legislation. A hearing on the defendants’ motions was held in December 2012. The parties have not yet received a decision on those motions. On January 2, 2013 Superior Court judge presiding over the cases involving challenges to enacted pension reforms ordered the parties to participate in mediation, which is ongoing. The parties are scheduled to report back to the Court again on January 3, 2014. An adverse judgment to the State rendered in the pension litigation could significantly increase both the unfunded liability under the plans within the ERSRI and the State’s actuarially determined annual required contribution. Other With respect to other litigation, State officials are of the opinion that the lawsuits are not likely to result either individually or in the aggregate in final judgments against the State that would materially affect its financial position.
100

State of Rhode Island and Providence Plantations Notes to Basic Financial Statements Fiscal Year Ended June 30, 2013
Tobacco Settlement Financing Corporation According to the Master Settlement Agreement (“MSA”), for any year in which the Participating Manufacturers (“PMs”) suffer a loss of market share of more than two percent as compared to their collective market share in 1997, there is the potential of a Non-Participating Manufacturer Adjustment (“NPM Adjustment”), which would permit the tobacco manufacturers to reduce their MSA payments for that year. Whether such an adjustment is applicable depends on whether: (1) an economic firm jointly selected by the Settling States and the PMs determines that the disadvantages experienced by the PMs as a result of the provisions of the MSA were a “significant factor” contributing to the market share loss (“Significant factor proceeding”); and (2) the State is found to not have diligently enforced its escrow statute. For calendar years 2003, 2004, 2005 and 2006, there have been four Significant Factor Proceedings in which the firm found in favor of the PMs. There will not be a Significant Factor Proceedings for calendar years 2007, 2008, 2009, 2010, 2011, 2012 and 2013. From April 2005 through April 2013, many of the tobacco manufacturers participating in the MSA either withheld all or portions of their payments due or remitted their payments to an escrow account, disputing the calculations of amounts due under the agreement. These manufacturers assert that the calculations of the amounts due failed to apply the NPM Adjustment. The TSFC’s share of these disputed payments is approximately $37.7 million. There has been a long-standing dispute between the PMs and the MSA Settling States relating to NPM Adjustment Disputes, and up until December 2012, all MSA Settling States and the PMs were engaged in an arbitration proceeding regarding the issue of Diligent Enforcement for the calendar year 2003 (“2003 Dispute”) (Rhode Island’s Diligent Enforcement is no longer being challenged for 2003). In December 2012, the PMs reached a settlement agreement with certain MSA States & Territories (“Term Sheet States”) in connection with certain claims relating to NPM Adjustment Disputes, including the 2003 Dispute. The general terms thereof were memorialized in a Term Sheet (“Term Sheet”) with the PMs. In March of 2013, the Panel, which was convened for the 2003 Dispute, issued a Stipulated Partial Settlement and Award (”Award”) that incorporated certain provisions of the Term Sheet. Also, the award included specific instructions to the Independent Auditor directing it to implement the provisions provided therein, which it did in preparing final calculations for the 2013 MSA payments. Thirty (30) MSA States and Territories (“NSS”) have not accepted the terms of the Term Sheet, so the NPM Adjustment disputes between the NSS and PMs remain unresolved. Future NPM Adjustments could be as large as or exceed the reported potential $1.2 billion calendar year 2003 NPM adjustment. The resolution of the substance of such disputes could take years. Moreover, there is no assurance that these funds will be collected by the TSFC in the future. Due to these uncertainties regarding the ultimate realization of the remaining amount of these disputed payments, they have not been recognized as revenue in the financial statements. The TSFC and the other affected parties are taking actions prescribed in the MSA to arrive at a resolution of these matters. In addition to NPM Adjustment arbitration, litigation has been filed alleging, among other claims, that the MSA violates provisions of the U.S. Constitution, state constitutions, federal antitrust and civil rights laws, and state consumer protection laws. These actions, if ultimately successful, could result in a determination that the MSA is void or unenforceable. The lawsuits seek to prevent the states from collecting any monies under the MSA, and/or a determination that prevents the tobacco manufacturers from collecting MSA payments through price increases to cigarette consumers. In addition, class action lawsuits have been filed in jurisdictions alleging violations of state Medicaid agreements. To date, no such lawsuits have been successful. The enforcement of the terms of the MSA may continue to be challenged in the future. In the event of an adverse court ruling, the TSFC may not have adequate financial resources to service its debt obligations. Lottery The Lottery’s master contracts with its video lottery facility operators contain revenue protection provisions in the event that existing video lottery facility operators incur revenue losses caused by new gaming ventures within the State. The Lottery’s video lottery operations could be adversely impacted by enacted legislation in Massachusetts allowing three casinos and one slot parlor in that State. Massachusetts has developed a
101
State of Rhode Island and Providence Plantations Notes to Basic Financial Statements Fiscal Year Ended June 30, 2013
two-phase application process for potential operators and developers. The Massachusetts Gaming Commission could award casino licenses during fiscal 2014 based on their current timeline. Depending on the resulting location of the facilities within Massachusetts, video lottery revenues in Rhode Island could decrease. The Narragansett Indian Tribe filed a complaint against the State of Rhode Island in the Superior Court on or about September 28, 2011, inter alia, challenging the constitutionality of the casino gaming act on the grounds that it would not be “state-operated” and the act “delegates unconstitutional authority to a private corporation.” On or about June 29, 2012, the Superior Court found that the Narragansett Indian Tribe had not sustained their burden of proof that the act violates the State or United States constitution. The Narragansett Indian Tribe filed a notice of appeal of that decision. The remaining issues in the case which are still pending in the Superior Court relate to whether the state “operates” Twin River and Newport Grand. A significant portion of the Lottery’s revenues are derived from video lottery gaming at two licensed video lottery facilities. Newport Grand, one of those video lottery facilities, is subject to certain financing agreement restrictions. In 2008, Newport Grand entered into a $25,000,000 financing agreement with two banks for expansion and renovation of its video lottery terminal facility. Prior events of default relative to failing to meet earnings levels amended the loan agreement, which required additional partner contributions, quarterly deposits and restricted dividend distributions. During fiscal year 2013, a subsequent loan amendment required continued deposits and a new loan covenant requirement. Federal Grants The State receives significant amounts of federal financial assistance under grant agreements which specify the purpose of the grant and conditions under which the funds may be used. Generally, these grants are subject to audit. The Single Audit for the State of Rhode Island for the fiscal year ended June 30, 2012 was issued in March 2013. That report identified approximately $2.3 million in questioned costs relating to the primary government. In addition, a number of findings had potentially significant but unknown or unquantifiable questioned costs. The ultimate disposition of these findings rests with the federal grantor agencies, and, in most cases, resolution is still in progress. Adjustments are made to the financial statements when costs have been specifically disallowed by the federal government or sanctions have been imposed upon the State and the issue is not being appealed or the right of appeal has been exhausted. The fiscal 2013 Single Audit is in progress. It is anticipated that there will be additional questioned costs identified in that audit. The State’s management believes that any disallowances of federal funding received by the State will not have a material impact on the State’s financial statements. Moral Obligation Bonds Some component units issue bonds with bond indentures requiring capital reserve funds. Monies in a capital reserve fund are to be utilized by the trustee in the event scheduled payments of principal and interest by the component unit are insufficient to pay the bondholders. These bonds are considered “moral obligations” of the State when the General Laws require the executive director to submit to the Governor the amount needed to restore each capital reserve fund to its minimum funding requirement and the Governor is required to include the amount in the annual budget. At June 30, 2013, the following debt was morally obligated by the State: R.I. Housing and Mortgage Finance Corporation (RIHMFC) The R.I. Housing and Mortgage Finance Corporation (RIHMFC) had $164,230,211 outstanding in bonds, which are secured in part by capital reserve funds which have aggregated to $32,206,624 on June 30, 2013. Under the moral obligation provisions detailed in the preceding paragraph, upon request by the Governor, the General Assembly may, but is not obligated to, provide appropriations for any deficiency in such reserve funds. The RIHMFC has never been required to request such appropriations. Such reserve funds relate solely to select multi-family issues of the RIHMFC.
102

State of Rhode Island and Providence Plantations Notes to Basic Financial Statements Fiscal Year Ended June 30, 2013
R.I. Economic Development Corporation (RIEDC) In November 2010, the RIEDC issued $75 million of taxable revenue bonds under the Job Creation Guaranty Program. The bond proceeds were loaned to 38 Studios, LLC (38 Studios) and provided funding for the relocation of the company’s corporate headquarters to the State and establishment and operation of a video gaming studio in the City of Providence. Proceeds also were used to fund a Capital Reserve Fund and Capitalized Interest Fund. Amounts in the Capital Reserve Fund are to be used in the event that 38 Studios fails to make any required loan payments. In accordance with the enabling legislation and the agreement between the RIEDC, the trustee and 38 Studios, should amounts in the Capital Reserve Fund fall below minimum requirements, the RIEDC has agreed to present the Governor with a certificate stating the amounts required to restore any shortfall and the Governor is required to include such amounts in his or her budget request for appropriation by the General Assembly. The General Assembly may, but is not required to, appropriate such amounts. 38 Studios filed for Chapter 7 bankruptcy protection on June 7, 2012 and the RIEDC and the trustee for the bonds have obtained court approval to take custody of the assets pledged by 38 Studios to secure the payment of the bonds. The value of the assets pledged is not certain at this time. It is estimated that the total debt service on the bonds after considering any existing reserves with the trustee may be in the range of $89 million. The maturity dates on the bonds range from 2015 to 2020 with maximum annual debt service of approximately $12.75 million. The FY2014 enacted budget includes an appropriation of $2.5 million, which together with remaining amounts available in the capital reserve fund, will be used to pay principal and interest on the bonds due in fiscal 2014. The State has recorded a liability of $2.5 million relating to the default by 38 Studios at June 30, 2013. This amount represents a current estimate of the amount of probable loss by the State. It is reasonably possible that the State’s loss relating to this contingency could range as high as the remaining debt service principal of $68,000,000 owed to bondholders at June 30, 2014 less amounts potentially recovered through the sale of assets. The General Assembly is expected to reconsider the issue during the 2014 legislative session when $12.75 million in debt service will be requested for appropriation as part of the FY2015 budget request submitted by the Governor. In November 2012, the RIEDC sued various individuals and entities involved with the loan to 38 Studios including principals of 38 Studios, former employees of the RIEDC and various advisors to the RIEDC alleging fraud, negligence, breach of fiduciary duty and other charges. The suit seeks repayment of compensatory and punitive damages associated with the various counts identified in the lawsuit. An additional $6,500,000 in guarantees was issued under the Job Creation Guaranty Program for notes through June 30, 2013. The General Assembly repealed the authority for the RIEDC to guarantee further loans under this program during the 2013 legislative session. Component Units R.I. Higher Education Assistance Authority (RIHEAA) On March 30, 2010, the President of the United States signed into law the Health Care and Education Reconciliation Act of 2010 (the Act), which included the Student Aid and Fiscal Responsibility Act (SAFRA). The Act made sweeping changes in student financial assistance programs, including a provision which eliminated loan originations under the Federal Family Education Loan (FFEL) Program effective July 1, 2010. As a result, new guaranteed student loans now originate under the Federal Direct Loan Program. RIHEAA’s role as a guaranty agency in the FFEL Program constituted its single largest activity, and approximately 85% of the Authority’s employees are allocated to the guaranty agency functions. The elimination of new loan originations has had a significant impact on the Authority’s ongoing operations. The Authority will continue to provide services for loans currently in its portfolio, including claims payments and reinsurance transactions, default prevention and aversion activities, and collections of defaulted student loans. It is difficult, however, to predict the period over which such services would be required, and to what extent those responsibilities will continue to constitute a substantive activity for the Authority. RIHEAA’s senior management believes that a reasonable estimate of that period is in the range of two to four years. RIHEAA’s senior management, in conjunction with its Board, has already taken steps necessary to respond
103

State of Rhode Island and Providence Plantations Notes to Basic Financial Statements Fiscal Year Ended June 30, 2013
to the changes resulting from the Act, and will continue to closely monitor all aspects of the operating environment. In June 2013, the Rhode Island General Assembly passed and the Governor signed into law added language to RIHEAA’s enabling legislation, titled – Reserve Funds: “To assure continued solvency of the authority, the authority’s operating fund shall be used solely for the ordinary operating expenses of the authority. Furthermore, it is the intent of the General Assembly that these funds eventually be used to increase financial assistance to Rhode Island students in the form of scholarships and grants.” The RIHEAA Board has had discussions about the new legislative language and is in the process of developing proposals and programs that are consistent with the legislature’s intent. R.I. Housing and Mortgage Finance Corporation (RIHMFC) As of June 30, 2013, the RIHMFC may borrow up to a maximum of $85,000,000 under various revolving loan agreements expiring between August 2013 and December 2014. Borrowings under the lines of credit are payable on demand and are unsecured. The RIHMFC is a party to financial instruments with off-balance sheet risk in connection with its commitments to provide financing. Such commitments expose the RIHMFC to credit risk in excess of the amounts recognized in the statements of net position. The RIHMFC’s exposure to credit loss in the event of nonperformance by the borrowers is represented by the contractual amount of such instruments. Total credit exposure as a result of loan commitments at June 30, 2013 is $33,386,881. Other Component Units Other component units have various contingent liabilities that have arisen in the normal course of their operations. These contingencies are not significant to the State’s financial statements. Note 14. Employer Pension Plans Defined Benefit Plans Plan Descriptions The State, through the Employees’ Retirement System (ERS), administers five defined benefit pension plans. Four of these plans - the Employees’ Retirement System (ERS), a cost-sharing multiple-employer defined benefit pension plan, and the Judicial Retirement Benefits Trust (JRBT), the Rhode Island Judicial Retirement Fund Trust (RIJRFT), and the State Police Retirement Benefits Trust (SPRBT), which are single-employer defined benefit pension plans, cover most State employees. The State does not contribute to the Municipal Employees’ Retirement System (MERS), an agent multiple-employer defined benefit pension plan. The ERS provides retirement and disability benefits, annual cost-of-living adjustments, and death benefits to plan members and beneficiaries. The level of benefits provided to State employees and teachers, which is subject to amendment by the general assembly, is established by Chapter 36-10 of the General Laws. The ERS issues a publicly available financial report that includes financial statements and required supplementary information for the plans. The report may be obtained by writing to the Employees’ Retirement System, 50 Service Ave., Warwick, RI 02886. Summary of Significant Accounting Policies Basis of Accounting The financial statements of the ERS are prepared on the accrual basis of accounting. Under this method, revenues are recorded when earned and expenses are recorded when incurred. Plan member contributions are recognized in the period in which the wages, subject to required contributions, are earned for the performance of duties for covered employment. Employer contributions to each plan are recognized when due and the employer has made a formal commitment to provide the contributions. Benefits and refunds are recognized when due and payable in accordance with the terms of each plan.
104

State of Rhode Island and Providence Plantations Notes to Basic Financial Statements Fiscal Year Ended June 30, 2013
Methods Used to Value Investments Dividend income is recorded on the ex-dividend date. Investment transactions are recorded on a trade date basis. The gains or losses on foreign currency exchange contracts are included in income consistent with changes in the underlying exchange rates. Investments are recorded in the financial statements at fair value. Fair value is the amount that a plan can reasonably expect to receive for an investment in a current sale between a willing buyer and a willing seller - that is, other than a forced liquidation sale. Short-term investments are generally carried at cost, which approximates fair value. The fair value of fixed income securities and domestic and international equity securities is generally based on published market prices and quotations from national security exchanges and securities pricing services. Commingled funds consist of institutional domestic equity index and international equity index funds. The fair value of these commingled funds is based on the reported net asset value (NAV) of the respective fund based upon the fair value of the underlying securities or assets held in the fund. The determination of fair value for other commingled funds, which include hedge, private equity, and real estate funds is described in the succeeding paragraphs. Futures contracts are valued at the settlement price established each day by the board of trade or exchange on which they are traded. The ERS also trades in foreign exchange contracts to manage exposure to foreign currency risks. Such contracts are used to purchase and sell foreign currency at a guaranteed future price. The change in the estimated fair value of these contracts, which reflects current foreign exchange rates, is included in the determination of the fair value of the ERS investments. Other investments that are not traded on a national security exchange (primarily private equity, real estate investments, and hedge fund investments) are generally valued based on audited December 31 net asset values adjusted for (1) cash flows for the period January 1 to June 30 (which principally include additional investments and partnership distributions), and (2) significant changes in fair value as determined or estimated by the general partners as of June 30. The general partners estimate the fair value of the underlying investments held by the partnership periodically. Publicly traded investments held by the partnerships are valued based on quoted market prices. If not publicly traded, the fair value is determined by the general partner. Financial Accounting Standards Board, ASC Topic 820, Fair Value Measurements and Disclosures, requires private equity and real estate limited partnership general partners to value non-publicly traded assets at current fair value, taking into consideration the financial performance of the issuer, cash flow analysis, recent sales prices, market comparable transactions, a new round of financing, a change in economic conditions, and other pertinent information. ERS management considers the fair values reported by the general partners at June 30 in addition to the audited net asset values at December 31 adjusted for cash flows for the period January 1 to June 30 in determining the fair value of private equity and real estate investments on the financial statements of ERS. Private equity and real estate investments represented 7.4% and 3.2%, respectively, of the total reported fair value of all ERS investments at June 30, 2013. Of the underlying holdings within private equity investments, approximately 19% were valued based on quoted market prices. The remaining underlying assets were valued generally following the objectives outlined above. Because these fair values were not determined based on quoted market prices, the fair values may differ from the values that would have been determined had a ready market for these investments existed. Hedge funds are valued based on information provided by the fund manager and as verified by their respective third party administrator. Of the underlying holdings within the hedge funds approximately 66% were valued based on Tier 1 inputs (unadjusted quoted prices in active markets that are accessible at the measurement date for identical, unrestricted investments) and 28% as Tier 2 inputs (other significant inputs, either directly or indirectly, at the measurement date such as a) quoted prices for similar assets or liabilities in active markets; b) quoted prices for identical or similar assets and liabilities in markets that are not active; c) observable inputs, other than quoted prices, for assets and liabilities; or
105

State of Rhode Island and Providence Plantations Notes to Basic Financial Statements Fiscal Year Ended June 30, 2013
d) inputs that are derived from or corroborated by observable market data by correlation or other means. The remaining underlying holdings within the hedge funds approximating 6% were valued based on Tier 3 inputs (unobservable inputs which are developed based on the best information available in the circumstances which might include the fund’s own data). Investment Expenses Investment management expenses are presented separately as a component of net investment income and include investment consultants’ fees, custodial fees, direct investment expenses allocated by managers, and allocated Office of the General Treasurer expenses associated with oversight of the portfolio. In some instances (hedge funds, private equity, real estate investments, and cash investments), investment related costs are not readily separable from investment income and consequently investment income is recorded net of related expenses. Funding Policy and Annual Pension Cost
The fiscal 2013 contribution rates for the Employees’ Retirement System, the State Police Retirement Benefits Trust, and the Judicial Retirement Benefits Trust were based on the actuarial valuation of those plans performed as of June 30, 2010. The fiscal 2013 contribution rate for the Judicial Retirement Fund Trust, effective July 1, 2012 was based on the actuarial valuation of that plan performed as of June 30, 2012. A summary of the State’s annual pension cost (expressed in thousands) for the fiscal year ended June 30, 2013 and the actuarial assumptions and methods used in the June 30, 2010 valuation of the plans is provided in the table below:
Employ ees'
Retirement
Sy stem
State Police
Retirement
Benefits Trust
Judicial
Retirement
Benefits Trust
RI Judicial
Retirement
Fund Trust
Contribution rate:
State 21.18% 11.07% 19.69% $1,816
Plan members - state employ ees 3.75% 8.75% 8.75% and 12.00% 8.75% and 12.00%
State contribution for teachers 7.15% and 7.88%
Annual pension cost $207,319 $2,103 $1,752 $1,816
Contributions made - state employ ees $136,615 $2,103 $1,752
Contribution made - teachers $70,704
Actuarial v aluation date June 30, 2010 June 30, 2010 June 30, 2010 June 30, 2012
Actuarial cost method Entry Age Normal-Indiv idual Entry Age Normal-Indiv idual Entry Age Normal-Indiv idual Entry Age Normal-Indiv idual
Entry Age Actuarial Entry Age Actuarial Entry Age Actuarial Entry Age Actuarial
Cost Method Cost Method Cost Method Cost Method
Amortization method Lev el Percent of Lev el Percent of Lev el Percent of
Pay roll - Closed Pay roll - Closed Pay roll - Closed Lev el Dollar
Equiv alent Single Remaining
Amortization Period 25 y ears 25 y ears 25 y ears 16 Years
Asset v aluation method 5 Year Smoothed Market 5 Year Smoothed Market 5 Year Smoothed Market 5 Year Smoothed Market
Actuarial Assumptions:
Inv estment rate of return 7.50% 7.50% 7.50% 4.00%
Projected salary increases 4.00% to 7.00% 4.00% to 12.00% 4.00% 4.00%
Inflation 2.75% 2.75% 2.75% 2.75%
Cost-of-living adjustments The COLA is equal to the average five-year fund asset performance (percent) greater than 5.5% up to a
maximum of 4% - the COLA is to be applied to the first $25,000 of benefits, indexed over time.
The COLA is delayed until the later of Social Security eligibility age or 3 years after retirement except for
State Police for which the COLA is delayed until the later of age 55 or 3 years after retirement.
A COLA of 2% is assumed only every five years until the plans achieve an 80% collective funded status
in accordance with the law. It is assumed that the plans will not achieve the targeted 80% funded status
for 15 years.
Level of benefits established by:
General Law(s) 36-8 to 10 42-28-22.1 8-3-16, 8-8-10.1 8-3-16
16-15 to 17 8-8.2-7 and 28-30-18.1
106

State of Rhode Island and Providence Plantations Notes to Basic Financial Statements Fiscal Year Ended June 30, 2013
The assumptions used in the Rhode Island Judicial Retirement Fund Trust are consistent with those used for the Judicial Retirement Benefits Trust except that since the plan is not currently advance funded, a 4% investment return assumption was utilized. This plan is for a closed group of individuals and the amortization payment has been calculated based on level-dollar amortization over 16 years from June 30, 2012. Annual Pension Cost and Net Pension Assets and Obligations For all defined benefit plans, except for the RI Judicial Retirement Fund Trust, the State contributed 100% of the annual pension cost. The net pension obligation relating to the RIJRFT is detailed in the table below (amounts expressed in thousands): Annual Required Contribution $1,816 Interest on net pension obligation - Adjustment to annual required contribution - Annual pension cost 1,816 Contributions made - Increase in net pension obligation 1,816 Net pension obligation, beginning of year - Net pension obligation, end of year $1,816
Annual NetPension Percentage Pension
Year Cost (APC) of APC ObligationEnding (In Thousands) Contributed (In Thousands)
Employees' Retirement System 6/30/11 $ 196,847 100% $ - 6/30/12 233,834 100% - 6/30/13 207,319 100% -
State Police Retirement Benefits Trust 6/30/11 3,787 100% - 6/30/12 5,333 100% - 6/30/13 2,103 100% -
Judicial Retirement Benefits Trust 6/30/11 1,298 100% - 6/30/12 1,718 100% -
6/30/13 1,752 100% -
RI Judicial Retirement Fund Trust 6/30/13 1,816 0% 1,816
Three-Year Trend Information
The RI Judicial Retirement Fund Trust was established on July 1, 2012.
107

State of Rhode Island and Providence Plantations Notes to Basic Financial Statements Fiscal Year Ended June 30, 2013
Funded Status and Funding Progress The table below displays the funded status of each plan as of June 30, 2012, the most recent actuarial valuation date (See Note 19 – Subsequent Events):
Actuarial Actuarial Accrued Unfunded UAAL as a
Value of Liability (AAL) AAL Funded Covered Percentage of
Assets - Entry Age - (UAAL) Ratio Payroll Covered Payroll
(a) (b) (b - a) (a / b) (c) ((b - a) / c)
ERS
State Employees $ 2,421,191,542 $ 4,297,261,311 $ 1,876,069,769 56.30% $ 669,477,539 280.20%
Teachers 3,746,299,871 6,373,081,344 2,626,781,473 58.80% 971,904,991 270.30%
SPRBT 84,293,968 94,031,687 9,737,719 89.60% 23,669,619 41.10%
JRBT 43,428,646 52,085,154 8,656,508 83.40% 8,822,823 98.10%
RIJRFT - 16,387,206 16,387,206 0.00% 1,230,644 1331.60%
The schedules of funding progress, presented as required supplementary information (RSI) following the notes to the financial statements, present multiyear trend information about whether the actuarial values of plan assets are increasing or decreasing over time relative to the Actuarial Accrued Liabilities (AAL) for benefits. Additional information as of the June 30, 2012 actuarial valuation follows:
State Employees Teachers SPRBT JRBT RIJRFT
Valuation Date 6/30/2012 6/30/2012 6/30/2012 6/30/2012 6/30/2012
Actuarial Cost Method Entry Age Normal Entry Age Normal Entry Age Normal Entry Age Normal Entry Age Normal
Amortization Method Level Percent of Level Percent of Level Percent of Level Percent of Level Dollar
Payroll-Closed Payroll-Closed Payroll-Closed Payroll-Closed
Equivalent Single
Remaining Amortization
Period 23 years 23 years 23 years 23 years 16 years
Asset Valuation Method 5 Year 5 Year 5 Year 5 Year 5 Year
Smoothed Market Smoothed Market Smoothed Market Smoothed Market Smoothed Market
Actuarial Assumptions
Investment Rate of
Return 7.50% 7.50% 7.50% 7.50% 4.00%
Projected Salary 4.00% 4.00% 4.00% 4.00% 4.00%
Increases to to to
7.00% 12.75% 12.00%
Inflation 2.75% 2.75% 2.75% 2.75% 2.75%
Cost of Living
Adjustments
Note 1. Within the Entry Age Normal -the Individual Entry Age Actuarial Cost methodology is used.
ERS
The COLA is equal to the average five-year fund asset performance (percent) greater than 5.5% up to a maximum of 4% -
The COLA is to be applied to the first $25,000 of benefits, indexed over time. The COLA is delayed until the later of Social
Security eligibility age or 3 years after retirement except for State Police for which the COLA is delayed until the later of age
55 or three years after retirement.
A COLA of 2% is assumed only every five years until the plans achieve an 80% collective funded status in accordance
with the law. It is assumed that the plans will not achieve the targeted 80% funded status for 15 years.
Supplemental Contributions
The General Laws (Section 36-10-2(a) 1 and 2) also require, in addition to the contributions provided for by the funding policy, for each fiscal year in which the actuarially determined state contribution rate for state employees and teachers is lower than that for the prior fiscal year, the governor shall include an appropriation to that system equivalent to twenty percent (20%) of the rate reduction to be applied to the actuarial accrued liability. The amounts to be appropriated shall be included in the annual appropriation bill
108
State of Rhode Island and Providence Plantations Notes to Basic Financial Statements Fiscal Year Ended June 30, 2013
and shall be paid by the general treasurer into the retirement system. The retirement system's actuary shall not adjust the computation of the annual required contribution for the year in which supplemental contributions are received; such contributions once made may be treated as reducing the actuarial liability remaining for amortization in the next following actuarial valuation to be performed. For fiscal year 2013, $2,312,058 was contributed to the System in accordance with this provision of the General Laws. The General Laws also require that for any fiscal year in which the State’s actual general revenues exceed estimated amounts, the difference shall be paid to the ERS plan upon completion and release of the State’s audited financial statements. The amount paid to the System in fiscal year 2013 related to the State’s fiscal year 2012 actual general revenues exceeding budgeted amounts by $12,943,629. Beginning in fiscal year 2013, the Retirement Security Act provides for additional contributions to the System based on 5.5% of the value of contracts where the services performed by the contractor were previously performed by state employees. A supplemental contribution of $434,677 was paid to the System pursuant to Section 42-149-3.1 of the General Laws. For fiscal year 2013, the General Laws required various supplemental contributions to the ERS defined benefit pension plan as described above. These supplemental contributions are in addition to the annual required contribution amounts to ERS as determined by the actuary. Because ERS is a cost-sharing plan, fiduciary net position, including the effects of the supplemental contributions, is allocated between both state employee and teacher covered groups. Accordingly, no net pension asset has been reflected on the State’s Statement of Net Position as it is not directly attributable to any one participating employer. Defined Contribution Plan The State of Rhode Island Defined Contribution Retirement Plan (the “Plan”) is a defined contribution (money purchase) plan that operates under Section 401(a) of the Internal Revenue Code. The Plan was established under Rhode Island General Law section 36-10.3-2 and was placed under the management of the Retirement Board. The Retirement Board is the Plan administrator and Plan trustee. The law authorizes the State Investment Commission to select the appropriate third-party administrator for the Plan and to adopt Plan, trust, and/or custodial documents subject to certain guidelines outlined in the statute. The State Investment Commission is responsible for implementing the investment policy of the Plan and selecting the investment options available to members. TIAA-CREF serves as record keeper for the Plan and Plan assets are held by J.P. Morgan as investment custodian. Plan members – The plan covers members of the Employees’ Retirement System of Rhode Island (ERS), excluding legislators, correction officers and MERS general police and fire employees who participate in Social Security. For covered employees, participation in the defined contribution plan is mandatory. Judges and state police officers are also excluded from the Plan. Plan vesting provisions – The total amount contributed by the member, including associated investment gains and losses, shall immediately vest in the member‘s account and is non-forfeitable. The total amount contributed by the employer, including associated investment gains and losses, vests with the member and is non-forfeitable upon completion of three (3) years of contributory service. Service credit under ERS or MERS prior to July 1, 2012 is credited to the member for vesting purposes. Member accounts – Each member’s account is credited with the member and employer’s contribution and an allocation of the plan’s earnings. Allocations are based on a relationship of the member’s account balance in each investment fund to the total of all account balances in that fund. The retirement benefit to which a member is entitled is the benefit that can be provided from the member’s account. Forfeitures – Non-vested employer contributions are forfeited upon termination of employment. Such forfeitures can be used by employers to offset future remittances to the plan. Contributions – the plan’s benefits are funded by contributions from the participants and the employer, as specified in Rhode Island General Law 36-10.3-4 and 36-10.3-5. Eligible state employees and teachers and MERS general employees that participate in Social Security contribute 5% of the member’s compensation. Employers contribute to these member’s individual accounts an amount equal to 1% of the member’s compensation.
109

State of Rhode Island and Providence Plantations Notes to Basic Financial Statements Fiscal Year Ended June 30, 2013
Teachers and MERS general employees not covered by social security must contribute 7% of their compensation; employers contribute to these member’s individual accounts an amount equal to 3% of the member’s compensation. MERS police and fire employees not covered by social security must contribute 3%; employers contribute to these member’s individual accounts an amount equal to 3% of the member’s compensation. Investment options – Member and employer contributions may be invested in a variety of investment options broadly diversified with distinct risk and return characteristics. The investment options provide opportunities to diversify across the risk-return spectrum with a range of investment choices within varied asset classes. The investment programs are managed by TIAA-CREF and have various investment strategies. Retirement benefits – Benefits may be paid to a member after severance from employment, death, Plan termination, or upon a deemed severance from employment for participants performing qualified military service. At a minimum, retirement benefits must begin no later than April 1 of the calendar year following the year in which you attain age 70 ½ or terminate employment, if later. Members have the option to receive benefit payments in the form of a Single Life Annuity, Two Life Annuity, Lump Sum Benefit, or Installments. These payments are subject to any restrictions in the investment vehicles. Other Certain employees of the University of Rhode Island, Rhode Island College and the Community College of Rhode Island (principally faculty and administrative personnel) are covered by individual annuity contracts under a defined contribution retirement plan. Eligible employees who have reached the age of 30, and who have two (2) years of service are required to participate in either the Teachers Insurance and Annuity Association, the Metropolitan Life Insurance Company, or Variable Annuity Life Insurance Company retirement plan. Eligible employees must contribute at least 5% of their gross biweekly earnings. The University and Colleges contribute 9% of the employees’ gross biweekly earnings. Total expenses by the institutions for such annuity contracts amounted to approximately $16,136,000 during the year ended June 30, 2013. The Rhode Island Public Transit Authority has a defined benefit pension plan for all employees, for which eligibility to participate begins immediately upon employment. Benefits vest upon completion of ten years of service. Authority employees are eligible to retire upon attainment of age 62 and 5 years of continuous service. Retired employees are entitled to a monthly benefit for life as stipulated in the plan provisions. The plan also provides death and disability benefits. Employees are required to contribute 3% of their base salary to the plan. The remaining contributions to the plan are made by the Authority. At January 1, 2013, the most recent valuation date, the total actuarial accrued liability was $121,499,238 and the actuarial value of assets was $84,503,097. The Authority contributed 100% of its annual pension cost, totaling $7,772,257, for fiscal year 2013 and had a net pension obligation of $1,726,343 at June 30, 2013. Certain other component units have defined contribution pension and savings plans. For information regarding these pension and savings plans, please refer to the component units' separately issued financial reports. Note 15. Other Post-Employment Benefits
A. Plan Descriptions
The Rhode Island State Employees’ and Electing Teachers OPEB System (the “System”) acts as a common investment and administrative agent for other post-employment benefits provided for the six groups/plans listed below:
Certain state employees and employees of the following component units or related organizations:
Narragansett Bay Commission, RI Airport Corporation and RI Economic Development Corporation Certain certified public school teachers Judges State police officers
110

State of Rhode Island and Providence Plantations Notes to Basic Financial Statements Fiscal Year Ended June 30, 2013
Legislators Certain employees of the Board of Education (BOE) Members of the System must meet the eligibility and services requirements set forth in the RI General Laws or other governing documents.
Although the assets of the six plans are commingled for investment purposes, each plan’s assets are accounted for separately and may be used only for the payment of benefits to the members of that plan, in accordance with the terms of that plan.
The System’s financial statements are included as Trust Funds within the Fiduciary Funds. The System is administered by the State of Rhode Island OPEB Board and was authorized, created and established under Chapter 36-12.1 of the RI General Laws. The Board was established under Chapter 36-12.1 as an independent board to hold and administer, in trust, the funds of the OPEB system. The Board began operations and the Trust was established effective July 1, 2010.
The System issues a publicly available financial report that includes financial statements and required supplementary information for the plans and a description of the benefit structures. The report may be obtained by writing to the State Controller’s Office, 1 Capitol Hill Providence, RI 02903.
A summary of the principal provisions of the plans follow:
BOE
State Employees Judicial State Police Legislators Plan
Plan type Cost Sharing Multiple Employer Single employer Single employer Single employer
Cost Sharing Multiple Employer
EligibilityMembers of ERS meeting eligibility criteria. Retired judges.
Retired members of the State Police.
Retired legislators.
Members of the BOE Alternative Retirement Plan as defined in RI G.L. 16-17.1-1 and 2 meeting eligibility criteria.
Plan benefits
Retiree plan for members and dependents until Medicare eligible; subsequently eligible for Medicare supplement.
May purchase active employee plan for member and dependents until age 65. At 65 must enroll in Medicare supplement.
Active employee plan for member and dependents until age 65; at that age coverage ceases if Medicare eligible.
May purchase active employee plan for member and dependents until age 65. At 65 must enroll in Medicare supplement.
For employees retiring after June 21, 1998 the Board pays a portion of the post 65 Tier II benefits depending on the years of service and the retiree’s age. Those employees who retired previously have different benefits.
111

State of Rhode Island and Providence Plantations Notes to Basic Financial Statements Fiscal Year Ended June 30, 2013
Note - Retired teachers can purchase coverage for themselves and dependents at the active or early retiree rate, as applicable until age 65, when they must enroll in a Medicare supplement plan. RIGL Sections 16-17.1-1 and 2, 36-10-2, 36-12.1, 36-12-2.2 and 36-12-4 govern the provisions of the System, and they may be amended in the future by action of the General Assembly.
B. Funding Policy, Funding Status and Funding Progress
The contribution requirements of plan members, the State, and other participating employers are established and may be amended by the General Assembly. Beginning in fiscal year 2011, the State and other participating employers were required by law to fund the plans on an actuarially determined basis. For the fiscal year ended June 30, 2013, the State and other participating employers paid $58,223,000 into the plans.
C. Annual OPEB Cost and Net OPEB Obligation
The participating employers recognized an expense equal to a) the annual required contribution of the employer (ARC), which was actuarially determined, plus b) interest on the net OPEB obligation at the beginning of the fiscal year, where applicable, less c) the ARC adjustment, where applicable (discounted present value of the OPEB liability at the beginning of the fiscal year). The ARC represents a level of funding that, if paid on an ongoing basis, is projected to cover normal costs each year and amortize any unfunded actuarial liabilities (or funding excess) over a period not to exceed thirty years. The annual OPEB cost for the year, the amount actually paid on behalf of the plans and the changes in the net OPEB obligation are as follows (dollar amounts expressed in thousands):
State StateEmployees Teachers Judicial Police Legislators BOE
Date of Actuarial Valuation 06/30/09 06/30/09 06/30/09 06/30/09 06/30/09 06/30/09
Annual required contribution as a percent of payroll 6.86% N/A 7.19% 33.18% 0.00% 2.69%
Annual required contribution $ 45,800 $ 2,321 $ 778 $ 6,218 $ 0 $ 3,106
Plus: Interest on net OPEB obligation at beginning of year 0 N/A 144 419 0 0
Less: Adjustment to ARC 0 N/A 120 350 0 0
Annual OPEB cost 45,800 2,321 802 6,287 0 3,106
Participating State and/or other employer contributions 45,800 2,321 778 6,218 0 3,106
Increase in OPEB obligation 0 0 24 69 0 0
Net OPEB obligation at beginning of year, as restated 0 0 2,867 8,381 0 0
Net OPEB obligation at end of year $ 0 $ 0 $ 2,891 $ 8,450 $ 0 $ 0
112

State of Rhode Island and Providence Plantations Notes to Basic Financial Statements Fiscal Year Ended June 30, 2013
The State’s annual OPEB cost, the percentage of annual OPEB cost contributed to the plans, and the net OPEB obligation were as follows (dollar amounts expressed in thousands):
Percentage ofFiscal Annual OPEB
Plan Year Cost Contributed
State Employees 2011 41,120 100.00% -2012 44,235 100.00% -2013 45,800 100.00% -
Teachers 2011 2,333 100.00% -2012 2,321 100.00% -2013 2,321 100.00% -
Judicial 2011 1,014 97.23% 2,8392012 810 96.53% 2,8672013 802 97.01% 2,891
State Police 2011 4,295 98.13% 8,3022012 5,920 98.66% 8,3812013 6,287 98.91% 8,450
Legislators 2011 1,541 98.62% *2012 799 97.34% *2013 0 NA -
BOE 2011 2,869 100.00% -2012 2,884 100.00% -2013 3,106 100.00% -
* - Restated, see Note 18F.
NetAnnual OPEB
OPEB Cost Obligation
The table below displays the funded status of each plan at June 30, 2011, the most recent actuarial valuation date (dollar amounts expressed in thousands):
UAAL as a
Funded Percentage of
Ratio Covered Payroll
(a / b) ((b - a) / c)
State Employees $ 11,545 $ 728,207 $ 716,662 1.6% $ 600,273 119.4%Teachers 2,040 11,512 9,472 17.7% n/a n/aJudicial 841 2,610 1,769 32.2% 10,813 16.4%State Police 1,488 81,759 80,271 1.8% 17,384 461.8%Legislators 1,442 1,443 1 99.9% 1,615 0.1%BOE 3,189 53,751 50,562 5.9% 125,340 40.3%
Actuarial Actuarial Accrued Unfunded
Value of
(b) (b - a)
Assets - Entry Age - (UAAL)
(a) (c)
Payroll
Liability (AAL) AAL Covered
Covered payroll and the UAAL as a percentage of covered payroll are not presented for teachers since the required contribution by the State is for the Tier I subsidy for teachers who have elected to participate in the State’s Retiree Health Care Benefit Plan.
D. Actuarial Methods and Assumptions
Projections of benefits for financial reporting purposes are based on the substantive plan (the plan as understood by the employer and plan members) and include the types of benefits provided at the time of each valuation and the historical pattern of sharing of benefit costs between the employer and plan members to that point. The actuarial methods and assumptions used include techniques that are designed to reduce the effects of short-term volatility in the actuarial accrued liabilities and the actuarial value of assets, consistent with the long-term perspective of the calculations. Actuarial valuations of an ongoing plan involve estimates of the value of reported amounts and assumptions about the probability of occurrence of events far into the future. Examples include assumptions about future employment, mortality, and the healthcare cost trend. Amounts determined regarding the funded status of the plan and the annual required contributions of the employer are subject to continual revision as actual results are compared with past expectations and new estimates are made
113

State of Rhode Island and Providence Plantations Notes to Basic Financial Statements Fiscal Year Ended June 30, 2013
about the future. The schedules of funding progress, presented as required supplementary information following the notes to the financial statements, show whether the actuarial value of plan assets is increasing or decreasing over time relative to the actuarial accrued liabilities for benefits. The accompanying schedules of employer contributions present trend information about the amounts contributed to the plans by employers in comparison to the ARC, an amount that is actuarially determined in accordance with the parameters of GASB Statement 43. The ARC represents a level of funding that, if paid on an ongoing basis, is projected to cover normal cost for each year and amortize any unfunded actuarial liabilities (or funding excess) over a period not exceeding thirty years. The Annual Required Contributions for fiscal year 2013 were determined based on the June 30, 2009 valuations for all plans. As of the June 30, 2009 actuarial valuation, the Unfunded Actuarial Accrued Liability (UAAL) was amortized by a level (principal and interest combined) percent of payroll contribution for each component unit employer. The UAAL was determined using the actuarial value of assets and actuarial accrued liability calculated as of the valuation date. The UAAL for all plans, except teachers, is being amortized over the remainder of a closed 30-year (or shorter) period from June 30, 2006. The remaining amortization period at June 30, 2009 is 27 years. The UAAL for teachers is being amortized as a level dollar amount over an 8-year period from June 30, 2007. For the June 30, 2009 valuation the actuarial assumptions include a 5.0% discount rate, a health care cost trend assumption of 9% progressively declining to 4.5% after 10 years, and salary growth assumption rates ranging between 4.5% and 13.25%. Other assumptions, including those relating to rates of termination, rates of retirement, percent married, and retiree health care election rates, were based on the most recent experience study for the Employees’ Retirement System of Rhode Island as well as on anticipated experience changes in conjunction with the adopted retirement plan changes enacted through legislation. The most recent actuarial valuations of the plans were performed as of June 30, 2011. A number of changes in OPEB specific actuarial assumptions were made between the June 30, 2009 and June 30, 2011 valuations. These changes include reflecting new assumptions adopted by the Employees Retirement System of Rhode Island (ERSRI), and the State Police Retirement Benefits Trust of Rhode Island (SPRBT), changes to the OPEB specific assumptions, and changes to reflect the potential excise tax under the Patient Protection and Affordable Care Act. Changes from the ERSRI and SPRBT experience studies include changes to the retirement and disability rates for ERSRI and changes to salary expectations and mortality for both ERSRI and SPRBT. Changes to the OPEB specific assumptions include a change in the medical trend assumption of 9% decreasing to 4.5% in 8 years to 9% decreasing to 4.0% in 10 years, a change in the Medicare election rate for Legislators from 75% electing Medicare to 100% electing Medicare and the addition of the assumption that current retired Teachers over age 65 in the Early Retiree Plan are assumed to not be eligible for Medicare. The Patient Protection and Affordable Care Act includes an excise tax on high cost health plans beginning in 2018. The excise tax is 40% of costs above a threshold. The actual actuarial assumptions used in the most recent valuation assume that the plans will be subject to the excise tax as early as 2018. The General Laws were amended in the 2013 session of the General Assembly to modify the manner in which health insurance is provided to Medicare eligible retirees covered under the System’s plan covering state employees. During fiscal year 2014, the State will establish a health reimbursement account (HRA) for each Medicare eligible retiree who elects to receive health insurance coverage through the state sponsored program. The System’s actuary has updated the June 30, 2011 actuarial valuation to reflect the effect on the Actuarial Accrued Liability resulting from this change and the updated amounts are reflected in the valuation table on the preceding page.
114

State of Rhode Island and Providence Plantations Notes to Basic Financial Statements Fiscal Year Ended June 30, 2013
The following table summarizes the actuarial methods and assumptions used in the most recent actuarial valuation:
Certain other component units have other post-employment benefit plans. For information regarding these plans, please refer to the component units' separately issued financial reports.
Summary of Actuarial Methods and Assumptions as of June 30, 2011 valuation
Plan State
Employees
Teachers
Judicial State Police
Legislators
Board of Education
Valuation Date
June 30, 2011
June 30, 2011
June 30, 2011
June 30, 2011
June 30, 2011
June 30, 2011
Plan Type
Cost sharing
multiple employer
Single
Employer (1)
Single
Employer
Single
Employer
Single
Employer
Cost sharing
multiple employer
Actuarial Cost Method
Individual Entry Age
Individual Entry Age
Individual Entry Age
Individual Entry Age
Individual Entry Age
Individual Entry Age
Amortization Method
Level Percent
of Payroll – Closed
Level Dollar
Level Dollar
Level Percent of Payroll – Closed
Level Dollar
Level Percent
of Payroll – Closed
Equivalent Single Remaining Amortization Period
25 years
4 years
25 years
25 years
25 years
25 years
Asset Valuation Method
Four year smoothed
market
Four year smoothed
market
Four year smoothed
market
Four year smoothed
market
Four year smoothed
market
Four year smoothed
market
Actuarial Assumptions
Investment Rate of Return 5.00% 5.00% 5.00% 5.00% 5.00% 5.00%
Projected Salary Increases
4.00%
to
7.0%
N/A 4.00%
4.00%
to
12.0%
4.25%
to
8.50%
4.00%
to
7.00%
Valuation Health Care Cost Trend Rate
9% in 2012, grading to 4.0%
in 2021
9% in 2012, grading to 4.0%
in 2021
9% in 2012, grading to 4.0%
in 2021
9% in 2012, grading to 4.0% in
2021
9% in 2012, grading to 4.0%
in 2021
9% in 2012, grading to
4.0% in 2021
Note 1 – The Teachers plan accounts for the Tier I subsidy funded by the State for Teachers electing to participate and retiring before October 1, 2008. Note 2 – The actuarial assumptions do not include a separate general inflation rate assumption.
115

State of Rhode Island and Providence Plantations Notes to Basic Financial Statements Fiscal Year Ended June 30, 2013
Note 16. Deferred Compensation The State offers its employees a deferred compensation plan created in accordance with Internal Revenue Code Section 457. The Department of Administration, pursuant to Chapter 36-13 of the General Laws, administers the plan. The Department of Administration contracts with private corporations to provide investment products related to the management of the deferred compensation plan. Plan distributions are normally available to employees at the later of age 59 or retirement and mandatory distributions must commence once the individual reaches age 70½. The plan also allows for distributions for qualifying events such as termination, death or “unforeseeable emergency.” Current Internal Revenue Service regulations require that amounts deferred under a Section 457 plan be held in trust for the exclusive benefit of participating employees and not be accessible by the government or its creditors. The plan assets also may be held in annuity contracts or custodial accounts, which are treated as trusts. The State does not serve in a trustee capacity. Accordingly, the plan assets are not included in the State’s financial statements. Note 17. Risk Management The State is exposed to various risks of loss related to torts; theft of, damage to, and destruction of assets; errors and omissions; employee injury; and natural disasters. The State has entered into agreements with commercial insurance companies for comprehensive insurance coverage on State property to protect the State against loss from fire and other risks. Furthermore, the State is required by the General Laws to provide insurance coverage on all motor vehicles owned by the State and operated by State employees in the sum of $100,000 per person and $300,000 per accident for personal injury and $20,000 for property damage. During fiscal year 2013, and the two preceding fiscal years, no settlements exceeded insured coverage limits. The State also has a contract with an insurance company to provide health care benefits to active and retired employees. For coverage provided to active employees, the State retains the risk of loss. Retirees that are Medicare eligible may choose Medicare supplement coverage that is either premium based (State retains no risk of loss) or a self-insured plan option. Except for the premium based coverage provided to certain Medicare eligible retirees, the State reimburses the company for the costs of all claims paid plus administrative fees. The estimated liability for incurred but not reported (IBNR) claims at June 30, 2013 was calculated based on historical claims data. The change in claims liability (expressed in thousands) is as follows:
Health Insurance FundsUnpaid claims $ 13,780 $ 204,161 $ 202,505 $ 15,436
Current YearClaim
PaymentsLiability atJune 30
Liability atJuly 1
Claims andIBNR Estimate
The State is self-insured for risks of loss related to torts. Tort claims are defended by the State's Attorney General and, when necessary, appropriations are provided to pay claims. The State is self-insured for various risks of loss related to work-related injuries of State employees. The State maintains the Assessed Fringe Benefits Fund, an internal service fund that services, among other things, workers' compensation claims. Funding is provided through a fringe benefit rate applied to State payrolls on a pay-as-you-go basis.
116

State of Rhode Island and Providence Plantations Notes to Basic Financial Statements Fiscal Year Ended June 30, 2013
Note 18. Other Information
A. Elimination Entries
When the governmental fund statements and the internal service fund statements are combined into one column for governmental activity on the government-wide financial statements, interfund balances and activity should be eliminated. The following are the eliminations (expressed in thousands) that were made:
AssetsDue from other funds $ 9,953 $ 1,437 $ 11,390 $ (16,015) $ (4,625)Loans to other funds 100,114 100,114 (100,114)
Total assets $ 110,067 $ 1,437 $ 111,504 $ (116,129) $ (4,625)
LiabilitiesDue to other funds $ 15,714 $ 301 $ 16,015 $ (16,015) $Loans from other funds 94,153 5,961 100,114 (100,114)
Total liabilities $ 109,867 $ 6,262 $ 116,129 $ (116,129) $
Program revenueGeneral government $ $ 273,183 $ 273,183 $ (273,183)Public safety 11,264 11,264 (11,264)
ExpensesGeneral government (273,012) (273,012) 273,012Public safety (11,435) (11,435) 11,435
Net revenue (expenses) $ $ $ $ $
TransfersOperating transfers in $ 592,804 $ 7,400 $ 600,204 $ (266,400) $ 333,804Operating transfers out (264,571) (1,829) (266,400) 266,400
Net transfers $ 328,233 $ 5,571 $ 333,804 $ $ 333,804
AssetsDue from other funds $ 5,826 $ $ 5,826 $ (1,201) $ 4,625
Total assets $ 5,826 $ $ 5,826 $ (1,201) $ 4,625
LiabilitiesDue to other funds $ 1,201 $ $ 1,201 $ (1,201) $
Total liabilities $ 1,201 $ $ 1,201 $ (1,201) $
TransfersOperating transfers in $ 46,227 $ $ 46,227 $ (46,227) $Operating transfers out (380,031) (380,031) 46,227 (333,804)
Net transfers $ (333,804) $ $ (333,804) $ $ (333,804)
BalancesGovernmental Service
Funds FundsInternal
Total
Total
Total
Internal
Eliminations
InternalTotal Eliminations Balances
Business-typeActivities
B. Related Party Transactions
On April 25, 2013, the State transferred custody, control and supervision of the Jamestown and the Sakonnet River Bridges and related land and improvements from the Department of Transportation to the R.I. Turnpike and Bridge Authority. Ownership and title of the two bridges remains with the State. The R.I. Industrial-Recreational Building Authority is authorized to insure mortgages and first security agreements granted by financial institutions and the R.I. Industrial Facilities Corporation for companies conducting business in the State. The State entered into a lease and operating agreement (the agreement) with the R.I. Airport Corporation (RIAC) whereby the State has agreed to lease various assets to RIAC. The agreement requires RIAC to reimburse the State for principal and interest payments for certain airport related General Obligation Bonds. The term of the agreement is 30 years beginning July 1, 1993, with annual rent of $1.00. In the event RIAC does not have sufficient funds to make the required lease payments when due, the amount is payable in the next succeeding fiscal year and remains an obligation of RIAC until paid in full. The State has no rights to terminate the agreement as long as there are bonds and subordinate indebtedness outstanding.
117

State of Rhode Island and Providence Plantations Notes to Basic Financial Statements Fiscal Year Ended June 30, 2013
During fiscal year 2013, the State transferred land reclaimed from the Interstate 195 relocation project and the Washington Bridge project to the I-195 Redevelopment District Commission (I-195 RDC). The value of the land was reported in the State’s financial statements as a capital contribution at the historical cost of $343 per acre, for a total of $7,203. Significant improvements to the land are being funded by the state to complete redevelopment of the land for sale. In April 2013, the R.I. Economic Development Corporation (RIEDC) issued conduit debt obligations on behalf of the I-195 RDC totaling $38,400,000. In connection with this issuance there were financing fees of approximately $1.494 million, which were paid principally by the State. This payment is reported as a transfer out to the I-195 RDC in the State’s financial statements. In November 2004, the voters of Rhode Island authorized the issuance of $30 million in general obligation debt for the construction of a new residence hall at Rhode Island College (RIC). Of this amount, $20 million will be repaid to the State. The residence hall was finished and in service by September 2007, at which time RIC began collecting revenues to pay for its share of the debt service. Debt service obligation is to be split two-thirds to RIC and one-third to the State for all payments after September 2007. RIC will repay the State for the debt service paid on its behalf on a straight-line basis, amortized over the remaining life of the bonds, which carry rates ranging from 3-5% and a life of nineteen years beginning in fiscal year 2009.
C. Budgeting, Budgetary Control, and Legal Compliance
Budget Preparation An annual budget is adopted on a basis consistent with generally accepted accounting principles. The budget encompasses the General, Intermodal Surface Transportation and Temporary Disability Insurance Funds as well as selective portions of certain other funds. Preparation and submission of the budget is governed by the State Constitution and the Rhode Island General Laws. The budget, as enacted, contains a complete plan of proposed expenditures from all sources of funds (general, federal, restricted, and transfers in). Revenues upon which the budget plan is based are determined as part of the State’s Revenue Estimating Conference. The Conference, held twice each year, results in a consensus estimate of revenues for the next fiscal year and an update of prior revenue estimates for the current fiscal year. As required by the Constitution and the Rhode Island General Laws, annual appropriations are limited to 97.0 percent of estimated general revenues. The remaining 3.0 percent is contributed to the Budget Reserve Account until such account equals 5.0 percent of total general revenues and opening surplus. Excess contributions to the Budget Reserve Account are transferred to the Rhode Island Capital Plan Fund to be used for capital projects. The annual budget is adopted on a comprehensive basis and includes activity that, for financial reporting purposes, is recorded in multiple funds. Consequently, the budgetary comparison schedules for an individual fund include amounts in the “actual” column that have no corresponding budget amount. These amounts are principally interfund transfers which are not included in the comprehensive budget to avoid duplication but are appropriately reflected in the individual fund financial statements. Budgetary Controls The legal level of budgetary control, i.e., the lowest level at which management (executive branch) may not reassign resources without special approval (legislative branch) is the line item within the appropriation act. Management cannot reallocate any appropriations without special approval from the legislative branch. Budgetary controls utilized by the State consist principally of statutory restrictions on the expenditure of funds in excess of appropriations, accounting system controls to limit expenditures in excess of authorized amounts, and budgetary monitoring controls.
118

State of Rhode Island and Providence Plantations Notes to Basic Financial Statements Fiscal Year Ended June 30, 2013
D. Significant Transactions with Component Units
The significant transactions with the discretely presented component units are presented (expressed in thousands) below:
Description
Governmental activitiesGeneral
R.I. Higher Education Assistance Authority $ 5,693 Operating assistance
R.I. Economic Development Corporation 15,075 Operating and capital assistance
University of Rhode Island 58,186 Operating assistance
Rhode Island College 38,541 Operating assistance
Community College of Rhode Island 44,517 Operating assistance
Central Falls School District 46,399 Operating assistance
R.I. Public Transit Authority 5,442 Operating assistance
IST
R.I. Public Transit Authority 40,860 Operating assistance
I-195 Redistricting Commision (38,400) Purchase of land
Bond Capital
Rhode Island College 10,159 Construction, improvement or purchase of assets
R. I. Capital Plan
University of Rhode Island 11,666 Construction, improvement or purchase of assets
Total Governmental Activities $ 238,138
Significant transactions between primary government and component units
(Revenue)
Expense
E. Individual Fund Deficits
The following Internal Service Funds had cumulative fund deficits at June 30, 2013:
Assessed Fringe Benefits ($3,163,000) Central Utilities ($250,000) State Telecommunications ($148,000) Records Center ($111,000) Capitol Police ($88,000)
The deficits will be eliminated through charges for services in fiscal year 2014.
F. Restatements – Net Position and Fund Balances
Restatements of June 30, 2012 net position/fund balances (expressed in thousands) are in the table below:
Balances previously reported at June 30, 2012Net position $ 1,418,495 $ 2,811,840Fund balance $ 966,946
Restatement due to:(1) GASB 61 implementation - changes in financial reporting entity (975,699)(2) Correction of errors 26,545 (17,804)(3) Restatement of Net OPEB Obligation 2,137(4) Recognition of Tobacco Settlement Revenues (TSRs) 23,524 23,524(5) Adjustments to Carrying Value of Capital Assets 70,247
June 30, 2012 net position/fund balance, as restated $ 1,540,948 $ 1,818,337 $ 990,470
Discretely
Governmental ComponentPresented
GovernmentalFundsActivities Units
(1) GASB 61 implementation - changes in financial reporting entity - As discussed in Note 1 in fiscal
year 2013 the State implemented GASB Statement No. 61 – The Financial Reporting Entity: Omnibus an amendment of GASB Statements No. 14 and No. 34. The following entities are no
119

State of Rhode Island and Providence Plantations Notes to Basic Financial Statements Fiscal Year Ended June 30, 2013
longer considered component units as they do not present the potential to provide a financial benefit or impose a financial burden on the State: Rhode Island Student Loan Authority Narragansett Bay Commission Rhode Island Health and Educational Building Corporation Rhode Island Clean Water Finance Agency The College Crusade of Rhode Island
In addition, the Rhode Island Public Telecommunications Authority is no longer a component unit as its operations have been assumed by the Rhode Island PBS Foundation.
(2) Correction of errors - The State issued certain capital lease obligations for energy conservation
projects on behalf of the University of Rhode Island (URI) and the Community College of Rhode Island (CCRI). URI and CCRI are required to repay the State for debt service from the energy cost savings related to the projects. The State did not recognize the asset in its financial statements until fiscal year 2013. The beginning net position of the discretely presented component units was restated by ($17,804,000). URI did not recognize the liability in its financial statements until fiscal year 2013.
(3) Restatement of Net OPEB Obligation – The beginning net position of the governmental activities
was increased by $2,137,000 due to the elimination of the net OPEB obligation reported for legislators’ OPEB plan at June 30, 2012. The obligation was eliminated after corrections and changes in assumptions by the actuary in a more current valuation showed the plan to be fully funded with no annual required contribution amount.
(4) Recognition of Tobacco Settlement Revenues (TSRs) - The Tobacco Settlement Financing
Corporation revised its recognition of amounts due for TSRs based on the shipment of cigarettes instead when cash was received. The TSFC’s beginning net position was restated for this change.
(5) Adjustments to Carrying Value of Capital Assets - During fiscal year 2013, $70,247,000 was
recorded as a prior period adjustment related to capital assets. Approximately $185,000 was attributable to the cost of software development projects that was not recorded in prior fiscal years. $1,374,000 was adjusted due to construction in progress projects that, upon completion, fell below the State’s capitalization threshold. The balance of $71,436,000 represents additions to infrastructure assets for elements of project costs that were not previously recognized.
Note 19. Subsequent Events Primary Government In October 2013 the State issued $53,150,000 of General Obligation Bonds. The bonds mature in 2014 through 2033 and will be used for a variety of purposes including transportation infrastructure projects and affordable housing initiatives.
On December 17, 2013, the ERSRI Board approved actuarial valuations as of June 30, 2013 for the ERS plan. The valuations develop the employer contribution rates for fiscal year 2016. The funded status of the ERS plan as of June 30, 2013 compared to June 30, 2012 valuations is detailed in the table below:
Funded ratios based on actuarial valuation performed as of: June 30, 2012 June 30, 2013 ERS - state employees 56.3% 56.2% ERS - teachers 58.8% 58.1%
The actuary made no significant changes in actuarial assumptions for the 2013 valuation.
120

State of Rhode Island and Providence Plantations Notes to Basic Financial Statements Fiscal Year Ended June 30, 2013
The General Laws were amended in the 2013 session of the General Assembly to modify the manner in which health insurance is provided to Medicare eligible retirees covered under the System’s plan covering state employees. During fiscal 2014, the State will establish a health reimbursement account (HRA) for each Medicare eligible retiree who elects to receive health insurance coverage through the state sponsored program. The System’s actuary has modified the actuarially required contributions for fiscal 2014 developed as of the June 30, 2011 valuation to reflect these changes. Component Units On July 18, 2013, R. I. Resource Recovery Corporation (RIRRC) received notification from a third-party of its intent to sue for alleged violations of the Clean Air Act (“CAA”). The notification alleges, inter alia, that quantities of landfill gas have been escaping from the Central Landfill for years and also names the owner/operator of the gas collection system as part of the intended suit. Under the CAA citizens can bring suit to enjoin violations of the emissions standards and can seek redress and civil penalties for such violations. On December 16, 2013, the complaint was filed in U.S. District Court. The complaint requests that the Court order the defendants to comply with the Clean Air Act, remedy the alleged violations and pay civil penalties. RIRRC has notified its pollution liability insurance carrier of the potential for the lawsuit; RIRRC, as named additional insured, has also notified the owner/operator of the gas collection system’s pollution liability insurance carrier of the potential for a claim. On August 19, 2013, the R.I. Turnpike and Bridge Authority began collecting tolls on the Sakonnet River Bridge in accordance with the FY2014 Rhode Island State Budget, which includes an article that states the toll will be temporarily set at $0.10 through April 1, 2014. The status of tolling on the Sakonnet River Bridge will be finalized in fiscal year 2014 by the General Assembly. On October 1, 2013, the R.I. Housing and Mortgage Finance Corporation redeemed or refunded the following bonds: Homeownership Opportunity Bonds in the amount of $42,560,000 and Home Funding Bonds in the amount of $5,660,000. Subsequent to June 30, 2013 legislation was enacted that increased the percentage of net terminal income payable to Newport Grand LLC under the Newport Grand Master Contract. The commission payable to Newport Grand was increased by 2.25% for the period July 1, 2013 through June 30, 2015. On November 19, 2013, the R.I. Economic Development Corporation (RIEDC) issued bonds in the amount of $32,755,000 with maturity dates of July 1, 2014 through July 1, 2028 with various interest rates. These consist of Airport Revenue Refunding Bonds, 2013 Series B (Non-AMT) in the amount of $30,700,000, and Airport Revenue Refunding Bonds, 2013 Series C (AMT) in the amount of $2,055,000. Also on November 19, 2013, the RIEDC refunded the following bonds: Airport Revenue Bonds, 1998 Series B in the amount of $32,060,000 and Airport Revenue Bonds, 2003 Series A in the amount of $6,020,000.
121

Required Supplementary
Information
State of Rhode Island Fiscal Year Ended June 30, 2013

Revenues:General Revenues:
Personal Income Tax $ 1,080,857 $ 1,075,300 $ 1,085,765 $ 10,465General Business Taxes: Business Corporations 133,251 137,000 131,828 (5,172) Public Utilities Gross Earnings 100,100 98,300 99,641 1,341 Financial Institutions 1,700 12,800 12,595 (205) Insurance Companies 89,825 93,600 92,745 (855) Bank Deposits 2,100 2,500 2,877 377 Health Care Provider Assessment 42,207 41,400 41,569 169Sales and Use Taxes: Sales and Use 886,720 872,500 878,866 6,366 Motor Vehicle 47,759 51,100 49,431 (1,669) Motor Fuel 1,100 800 438 (362) Cigarettes 138,054 131,800 132,516 716 Alcohol 12,200 12,000 12,176 176Other Taxes: Inheritance and Gift 35,149 30,200 28,489 (1,711) Racing and Athletics 1,200 1,200 1,171 (29) Realty Transfer Tax 5,900 7,100 7,399 299
Total Taxes (1) 2,578,122 2,567,600 2,577,506 9,906
Departmental Revenue 342,874 363,400 356,832 (6,568)
Total Taxes and Departmental Revenue 2,920,996 2,931,000 2,934,338 3,338
Other Sources: Other Miscellaneous 4,440 5,665 4,166 (1,499) Lottery 387,553 380,160 379,225 (935) Unclaimed Property 7,900 7,000 6,269 (731)
Total Other Sources 399,893 392,825 389,660 (3,165)
Total General Revenues 3,320,889 3,323,825 3,323,998 173Federal Revenues 2,228,396 2,280,602 2,129,847 (150,755)Restricted Revenues 230,810 267,604 220,983 (46,621)Other Revenues 67,431 70,531 62,372 (8,159)
Total Revenues (2) 5,847,526 5,942,562 5,737,200 (205,362)Expenditures (4):
General government 685,522 748,219 667,461 80,758Human services 3,172,288 3,106,870 3,042,755 64,115Education 1,387,751 1,390,392 1,360,183 30,209Public safety 484,846 509,058 463,758 45,300Natural resources 92,067 98,009 70,145 27,864
Total Expenditures (2) 5,822,474 5,852,548 5,604,302 $ 248,246
Transfer to Vehicle Replacement Revolving Fund 7,350Transfer of Excess Budget Reserve to RI Capital Fund 84,624Transfer of Excess Revenue to Employees' Retirement System 12,944
Total Expenditures and Transfers $ 5,822,474 $ 5,852,548 5,709,220
Change in Fund Balance 27,980
Fund balance - beginning 373,154
Fund balance - ending $ 401,134
(continued)
Budget Budget Actual Budget
Variance
State of Rhode Island and Providence PlantationsSchedule of Revenues, Expenditures and Changes in Fund Balance
For the Fiscal Year Ended June 30, 2013
Budget and ActualGeneral Fund
with Final
(Expressed in Thousands)
Original Final
122

Budget Budget Actual Budget
Variance
State of Rhode Island and Providence PlantationsSchedule of Revenues, Expenditures and Changes in Fund Balance
For the Fiscal Year Ended June 30, 2013
Budget and ActualGeneral Fund
with Final
(Expressed in Thousands)
Original Final
Expenditures by Source:General Revenues $ 3,295,836 $ 3,233,811 $ 3,216,046 $ 17,765Federal Funds 2,228,395 2,280,602 2,132,188 148,414Restricted Receipts 230,812 267,604 196,799 70,805Other Funds 67,431 70,531 59,269 11,262
$ 5,822,474 $ 5,852,548 $ 5,604,302 $ 248,246
General Fund - Reconciliation of Budget Results to Changes in Fund Balance:
Budgeted Surplus:
Total Revenue - Final Budget $ 5,942,562Total Expenditures - Final Budget 5,852,548
Final Budget - Projected Surplus (3) $ 90,014
Final Budget and Actual - Results
Total Revenues - Variance (Actual Revenue less than Budget) $ (205,362)Total Expenditures - Variance (Actual Expenditures less than Budget) 248,246
Surplus resulting from operations compared to final budget $ 42,884
Total General Fund Surplus - Fiscal Year Ended June 30, 2013 $ 132,898Transfer to Vehicle Replacement Revolving Fund (7,350)Transfer of Excess Revenue to Employees' Retirement System (12,944)Transfer of Excess Budget Reserve to RICAP Fund (84,624)
Net Change in General Fund - Fund Balance $ 27,980
Fund Balance, Beginning 373,154
Fund Balance, Ending $ 401,134
Notes:
(4) Debt service expenditures are included in the above respective categories:
General government $ 163,365Education 30,054Public safety 24
$ 193,443
(continued)
(2) Certain revenue and expenditure amounts classified as "Other Financing Sources (Uses)" have been reclassified within the budgetary comparison schedule to align with the State's legally adopted budgetary format.
(3) RI General Law section 35-3-20.1, titled "Limitation on state spending", mandates that expenditure appropriations shall not be greater than 97.0% of estimated general revenue for the fiscal year ending June 30, 2013.
(1) Transfers from the Historic Tax Credit Special Revenue Fund reported as "Other Financing Sources" on the General Fund have been allocated to General Revenue Tax Categories on this schedule to align with the State's legally adopted budget format.
123

Restricted $ 282,137 $ 282,137 $Committed 4,035 4,035 Assigned 105,639 10,842 (a) 94,797 (b)Unassigned 9,323 9,323 (c)
Total Fund Balance $ 401,134 $ 297,014 $ 104,120
See Notes to Required Supplementary Information.(concluded)
Fund BalanceAvailable for
Appropriation inFiscal 2014
(a) Assigned fund balance not available for appropriation in fiscal 2014 includes (1) centralized cost allocation surplus that requires offset through fiscal 2014 centralized charges and (2) general revenue appropriations carried forward by the Governor, Judiciary, and Legislature.
(b) Assigned fund balance available for appropriation in fiscal 2014 includes fiscal 2013 ending surplus amounts of $93.4 million appropriated as resources in the 2014 enacted budget, and fund balance amounts encumbered at June 30, 2013.
(c) Remaining fund balance available for appropriation.
Fund Balance NotAvailable for
Statements
Fund BalanceReported in the
State of Rhode Island and Providence PlantationsSchedule of Revenues, Expenditures and Changes in Fund Balance
Budget and ActualGeneral Fund
Fiscal 2014
For the Fiscal Year Ended June 30, 2013(Expressed in Thousands)
Reconciliation of Fund Balance - Financial Reporting Perspective to Budgetary Perspective
Budgetary Perspective
Appropriation inFinancial
124

Revenues:Taxes $ 137,286 $ 135,038 $ 134,465 $ (573)Departmental restricted revenue 999 1,010 1,044 34Federal grants 362,341 316,970 272,597 (44,373)Other revenues 110 175 174 (1)
Total revenues 500,736 453,193 408,280 (44,913)
Revenues and other Financing Sources (unbudgeted):Miscellaneous revenue 5,476Transfer from I-195 Redevelopment Commission 38,400
Total revenues 452,156
Other Financing Sources:Transfers from RI Capital Plan and Bond
Capital Funds (State FHWA Match) 56,513Other transfers 1,000
Total Other Financing Sources 57,513
Total Revenues and Other Financing Sources 509,669
Expenditures (budgeted):Central Management
Federal Funds 10,515 12,008 5,305 6,703Gasoline Tax 1,353 1,501 1,605 (104)
Total - Central Management 11,868 13,509 6,910 6,599Management and Budget
Gasoline Tax 1,938 1,439 1,662 (223)
Total - Management and Budget 1,938 1,439 1,662 (223)Infrastructure-Engineering-GARVEE/
Motor Fuel Tax BondsFederal Funds 342,945 297,440 263,891 33,549Federal Funds-Stimulus 8,881 7,522 3,311 4,211Restricted Receipts 999 1,010 973 37Gasoline Tax 54,201 52,725 53,655 (930)Motor Fuel Tax Residuals 4,076 2,659 2,659Land Sale Revenue 22,354 24,224 5,039 19,185
Total - Infrastructure - Engineering 433,456 385,580 326,869 58,711Infrastructure - Maintenance
Gasoline Tax 39,567 40,354 38,340 2,014Non-Land Surplus Property 10 50 50Outdoor Advertising 100 125 125
Total - Infrastructure - Maintenance 39,677 40,529 38,340 2,189
Total Expenditures (budgeted) $ 486,939 $ 441,057 $ 373,781 $ 67,276
Expenditures and Financing Uses (unbudgeted):Infrastructure Expenditures - State Match funded
by RI Capital Plan and Bond Capital Funds 56,513Infrastructure Expenditures - GARVEE 5,527Transfers to General Fund - Gas Tax 40,817
Total Expenditures and Financing Uses (unbudgeted) 102,857
Total Expenditures and Other Financing Uses 476,638
Net change in fund balance 33,031
Fund balance, beginning 108,679
Fund balance, ending $ 141,710
See Notes to Required Supplementary Information.
Actual
State of Rhode Island and Providence PlantationsSchedule of Revenues, Expenditures, and Changes in Fund Balance
Budget and Actual (Expressed in Thousands)Intermodal Surface Transportation Fund
Variance
For the Fiscal Year Ended June 30, 2013
with FinalFinalOriginalBudget Amounts BudgetBudget
125

UAAL as aActuarial Funded Percentage ofValuation Ratio Covered Payroll
Date ( a / b ) (( b - a ) / c)
06/30/2012 $ 6,167,491 $ 10,670,343 $ 4,502,851 57.8% $ 1,641,383 274.3%
06/30/2011 6,220,099 10,581,304 4,361,206 58.8% 1,635,802 266.6%
06/30/2010 * 6,405,209 10,499,318 4,094,109 61.0% 1,619,484 252.8%
UAAL as aActuarial Funded Percentage ofValuation Ratio Covered Payroll
Date ( a / b ) (( b - a ) / c)
06/30/2012 $ 84,294 $ 94,032 $ 9,738 89.6% $ 23,670 41.1%
06/30/2011 73,152 74,186 1,034 98.6% 19,712 5.2%
06/30/2010 * 65,760 73,049 7,288 90.0% 19,715 37.0%
UAAL as aActuarial Funded Percentage ofValuation Ratio Covered Payroll
Date ( b ) ( a / b ) (( b - a ) / c)
06/30/2012 $ 43,429 $ 52,085 $ 8,657 83.4% $ 8,823 98.1%
06/30/2011 40,106 46,594 6,488 86.1% 8,475 76.6%
06/30/2010 * 38,074 46,642 8,567 81.6% 7,461 114.8%
* Restated to reflect pension reform legislation enacted on November 18, 2011.
UAAL as aActuarial Funded Percentage ofValuation Ratio Covered Payroll
Date ( b ) ( a / b ) (( b - a ) / c)
06/30/2012 ** $ - $ 16,387 $ 16,387 0.0% $ 1,231 1331.6%
See Notes to Required Supplementary Information.
( a ) ( b - a ) ( c )
Rhode Island Judicial Retirement Fund Trust
Actuarial Actuarial Accrued UnfundedValue of Liability (AAL) AAL CoveredAssets - Entry Age - (UAAL) Payroll
Pension Trusts
Covered
State Police Retirement Benefits Trust
Judicial Retirement Benefits Trust
- Entry Age -( b )
(UAAL)( b - a )
Payroll( c )
(UAAL)( b - a )
CoveredPayroll
( c )
Actuarial
Assets( a )
Actuarial Accrued Unfunded
State of Rhode Island and Providence Plantations
Employees' Retirement System
June 30, 2013
(Expressed in Thousands)
Required Supplementary Information
Schedules of Funding Progress
ActuarialValue of
UnfundedAAL
ActuarialValue ofAssets
( a )
Actuarial Accrued
Actuarial AccruedLiability (AAL)
UnfundedAAL
Payroll( c )
(UAAL)Liability (AAL)- Entry Age -
( b ) ( b - a )
Value ofAssets
( a )
Liability (AAL)- Entry Age -
CoveredAAL
** Plan was effective July 1, 2012.
126

UAAL as aActuarial Funded Percentage ofValuation Ratio Covered Payroll
Date ( a / b ) (( b - a ) / c)
06/30/2011 $ 11,545 $ 728,207 $ 716,662 1.6% $ 600,273 119.4%06/30/2009 0 673,640 673,640 0.0% 574,569 117.2%06/30/2007 0 679,538 679,538 0.0% 626,145 108.5%
UAAL as aActuarial Funded Percentage ofValuation Ratio Covered Payroll
Date ( a / b ) (( b - a ) / c)
06/30/2011 $ 2,040 $ 11,512 $ 9,472 17.7% NA NA06/30/2009 0 13,529 13,529 0.0% NA NA06/30/2007 0 10,243 10,243 0.0% NA NA
UAAL as aActuarial Funded Percentage ofValuation Ratio Covered Payroll
Date ( a / b ) (( b - a ) / c)
06/30/2011 $ 841 $ 2,610 $ 1,769 32.2% $ 10,813 16.4%06/30/2009 0 8,665 8,665 0.0% 9,395 92.2%06/30/2007 0 14,024 14,024 0.0% 9,888 141.8%
UAAL as aActuarial Funded Percentage ofValuation Ratio Covered Payroll
Date ( a / b ) (( b - a ) / c)
06/30/2011 $ 1,488 $ 81,759 $ 80,271 1.8% $ 17,384 461.8%06/30/2009 0 67,079 67,079 0.0% 16,725 401.1%06/30/2007 0 54,620 54,620 0.0% 15,977 341.9%
UAAL as aActuarial Funded Percentage ofValuation Ratio Covered Payroll
Date ( a / b ) (( b - a ) / c)
06/30/2011 $ 1,442 $ 1,443 $ 1 99.9% $ 1,615 0.1%06/30/2009 0 11,752 11,752 0.0% 1,612 729.0%06/30/2007 0 29,764 29,764 0.0% 1,592 1869.6%
UAAL as aActuarial Funded Percentage ofValuation Ratio Covered Payroll
Date ( a / b ) (( b - a ) / c)
06/30/2011 $ 3,189 $ 53,751 $ 50,562 5.9% $ 125,340 40.3%06/30/2009 0 58,476 58,476 0.0% 106,665 54.8%06/30/2007 0 57,881 57,881 0.0% 110,092 52.6%
See Notes to Required Supplementary Information.
Liability (AAL) AAL Covered
Board of Education Health Care Insurance Retirement Plan
Actuarial Actuarial Accrued Unfunded
( a ) ( b ) ( b - a ) ( c )Assets (UAAL) Payroll
Value of
Actuarial
Value ofAssets
Legislators Plan
Value ofAssets
( a )
Actuarial AccruedLiability (AAL)
( b )
CoveredPayroll
( c )
UnfundedAAL
(UAAL)( b - a )
Actuarial
Assets
State Police Plan
CoveredPayroll
( a )
Actuarial AccruedLiability (AAL)
( b ) ( c )
UnfundedAAL
(UAAL)( b - a )
UnfundedAAL
(UAAL)
Judicial Plan
( a )
Actuarial AccruedLiability (AAL)
( b )
Value of
( b - a )
CoveredPayroll
( c )
( b - a )Payroll
( c )
Actuarial
State Employees Plan
( b )(UAAL)( b - a )
State of Rhode Island and Providence Plantations
Value of Liability (AAL) AALAssets
( a ) ( b )(UAAL)
Payroll
Required Supplementary InformationSchedules of Funding Progress
June 30, 2013(Expressed in Thousands)
Other Postemployment Benefits
Covered
ActuarialValue ofAssets
( c )
Actuarial Actuarial Accrued Unfunded
( a )
Teachers Plan
Actuarial AccruedLiability (AAL)
UnfundedAAL Covered
127

State of Rhode Island and Providence Plantations Notes to Required Supplementary Information Fiscal Year Ended June 30, 2013
Budget and Actual An annual budget is adopted on a basis consistent with generally accepted accounting principles for the General Fund and certain special revenue funds. The annual budget is prepared on a comprehensive basis and includes activity that, for financial reporting purposes, is recorded in multiple funds. Consequently, the budgetary comparison schedules for an individual fund include amounts in the "actual" column that have no corresponding original or final budget amount. These amounts are principally interfund transfers which are not included in the comprehensive budget to avoid duplication but are appropriately reflected in the individual fund financial statements. The budget to actual comparison for the General Fund on pages 122 through 124 is summarized and does not present budget and actual amounts detailed at the legal level of budgetary control. The legal level of budgetary control, i.e., the lowest level at which management (executive branch) may not reassign resources without special approval (legislative branch) is the line item within the appropriation act. Management cannot reallocate any appropriations without special approval from the legislative branch. A separate schedule presenting such amounts at the detailed legal level of budgetary control is available on the State Controller’s website, http://controller.admin.ri.gov/index.php. The comprehensive annual budget includes transportation function expenditures, the majority of which are reflected in the IST Fund for financial reporting purposes. The IST Fund major fund financial statements include transportation related activity of the various transportation funding sources including gas tax revenues, federal funds, GARVEE and Motor Fuel Bonds, and the proceeds of bonds issued by the I-195 Redevelopment District which were transferred to the IST fund to be utilized for infrastructure projects. The budget to actual comparison schedule for the IST fund on page 125 is presented at the legal level of budgetary control consistent with the legally adopted budget. Not all the activity reported within the IST fund financial statements is budgeted. Unbudgeted activity has been separately identified in the budget to actual comparison schedule to facilitate reconciliation to the IST fund financial statements. The original budget includes the amounts in the applicable appropriation act, general revenue appropriations carried forward by the Governor, and any unexpended balances designated by the General Assembly.
Schedules of Funding Progress - Pensions 1. Actuarial Assumptions and Methods
The information presented in the required supplementary information schedules was determined as part of the actuarial valuations at the dates indicated. Additional information as of the latest actuarial valuation, June 30, 2012 follows (Also, see Note 19 – Subsequent Events):
128

State of Rhode Island and Providence Plantations Notes to Required Supplementary Information Fiscal Year Ended June 30, 2013
Summary of Actuarial Assumptions Used in the June 30, 2012 Valuations ERS SPRBT JRBT RIJRFT
State Employees Teachers
Actuarial Cost Method Entry Age Normal - the Individual Entry Age Actuarial Cost methodology is used.
Amortization Method Level Percent of Payroll – Closed Level Dollar
Equivalent Single Remaining Amortization Period
23 years 16 years
Asset Valuation Method 5 Year Smoothed Market
Actuarial Assumptions
Investment Rate of Return 7.50% 7.50% 7.50% 7.50% 4.00%
Projected Salary Increases 4.00% to 7.00% 4.00% to 12.75% 4.00% to
12.00% 4.00% 4.00%
Inflation 2.75% 2.75% 2.75% 2.75% 2.75%
Cost of Living Adjustments: COLA is equal to the average five-year fund asset performance (percent) greater than 5.5% up to a maximum of 4% - the COLA is to be applied to the first $25,000 of benefits, indexed over time. COLA is delayed until the later of Social Security eligibility age or 3 years after retirement except for State Police, for which, the COLA is delayed until the later of age 55 or 3 years after retirement. A COLA of 2% is assumed only every five years until the plans achieve an 80% collective funded status in accordance with the law. It is assumed that the plans will not achieve the targeted 80% funded status for 15 years.
2. Schedules of Funding Progress Changes affecting the June 30, 2012 actuarial valuation: The assumptions for the Employees’ Retirement System, Judicial Retirement Benefits Trust, and the State Police Retirement Benefits Trust are consistent with the 2011 valuation, with the exception of certain assumption changes that resulted from the enactment of the Rhode Island Retirement Security Act of 2011. The method used to determine the actuarial value of assets is the five-year smoothed market method. A small adjustment was made to the method used to smooth investment gains and losses to allow gains and losses to offset each other immediately. This modification will reduce future volatility in the actuarial value of assets while ensuring that the actuarial value always trends directly towards the market value of assets. In addition, a minor modification to the retirement rate assumption was also made for the plans. The assumptions used in the Rhode Island Judicial Retirement Fund Trust are consistent with those listed in the Judicial Retirement Benefits Trust; however, the investment return assumption used within this valuation is 4.00%. This rate was selected because the plan is not currently advance funded. Consistent with generally accepted accounting principles, a plan that is not prefunded should use a lower investment assumption than a prefunded plan. The investment return assumption should reflect the expected return on assets that will be used to pay benefits. This plan is for a closed group of individuals and the amortization payment has been calculated based on level-dollar amortization with a 16-year amortization period.
129

State of Rhode Island and Providence Plantations Notes to Required Supplementary Information Fiscal Year Ended June 30, 2013
Changes affecting the June 30, 2011 actuarial valuation: The retirement rates were modified to be consistent with the retirement eligibility changes instituted by the Rhode Island Retirement Security Act of 2011. Members that were assumed to retire prior to the Act, but before the earliest allowable age under the Act, are assumed to retire once eligible. For future cost of living benefit adjustments, the benefit adjustments are assumed to be suspended for approximately 16 years, except for the intermittent adjustment every fifth year.
Changes affecting the June 30, 2010 actuarial valuation (as restated to reflect the provisions of pension reform legislation enacted on November 18, 2011): The June 30, 2010 valuations (as restated to reflect the provisions of pension reform legislation enacted on November 18, 2011) reflect comprehensive changes to plan member benefit provisions which are effective beginning July 1, 2012. The June 30, 2010 valuations also reflect material changes to certain actuarial assumptions. The revised member benefit provisions become effective on July 1, 2012. These include changes in service period accrual rates, retirement eligibility age, and future cost of living adjustments. Additionally, the unfunded accrued liability is now amortized over a twenty-five year period from June 30, 2010 compared to the 30 year period from June 30, 1999 employed in prior actuarial valuations. The Individual Entry Age Cost Method is used in the June 30, 2010 actuarial valuations. Prior valuations utilized the Ultimate Normal Cost methodology where normal cost was determined based on the benefits applicable to new hires under the replacement benefit structure resulting from prior pension reform measures. The annual investment rate of return was lowered from 8.25% to 7.5%. The post-termination mortality rates for non-disabled state employees and members of the MERS, State Police and Judicial plans were previously based on the 1994 Group Annuity Mortality Tables. New mortality tables have been constructed and adopted with adjustments for these employees using the RP-2000 Combined Healthy for Males and Females with White Collar adjustments, projected with Scale AA from 2000 for non-disabled individuals. The post-termination mortality rates used for non-disabled teachers in the June 30, 2009 and June 30, 2010 valuations were both based on tables developed by ERSRI’s actuary based on teacher experience. The rates used in the June 30, 2010 valuation for male teachers were lowered to 97% of the rates in these tables based on male teacher experience, projected with Scale AA from 2000 from 100% of the actuary’s table based on male teacher experience used in the June 30, 2009 valuation. The rates used in the June 30, 2010 valuation for female teachers were lowered to 92% of the rates used in the actuary’s tables based on female teacher experience, projected with Scale AA from 2000 from 95% of the actuary’s table based on female teacher experience used in the June 30, 2009 valuation. The post-termination mortality rates for disabled members of all ERSRI plans are based on the PBGC table Va for males and table VIa for females. The rates used in the June 30, 2010 valuation for disabled males eligible for social security disability benefits were lowered to 60% of PBGC table Va from 65% of this table in the June 30, 2009 valuation. The rates used in the June 30, 2010 valuation for disabled females eligible for social security disability benefits were lowered to 60% of PBGC table VIa from 100% of this table in the June 30, 2009 valuation. The pre-retirement mortality rates for all members of the ERSRI plans were previously based on the 1994 Group Annuity Mortality Tables. The rates used in the June 30, 2010 valuation for these employees were based on the RP-2000 Combined Tables with white collar adjustment for males and females. The tables were adjusted for each individual plan. The inflation assumption rate was decreased from 3% to 2.75% and the projected salary increase assumptions were also decreased compared to the prior valuation. The assumption for cost of living adjustments subject to the Consumer Price Index (for those not eligible to retire on September 30, 2009) was decreased from 2.5% to 2.35%.
130

State of Rhode Island and Providence Plantations Notes to Required Supplementary Information Fiscal Year Ended June 30, 2013
Schedules of Funding Progress - Other Postemployment Benefits 1. Actuarial Assumptions and Methods
The information presented in the required supplementary information schedules was determined as part of the actuarial valuations at the dates indicated. Additional information as of the latest actuarial valuation, June 30, 2011, follows (Also, see Note 19 – Subsequent Events):
Summary of Actuarial Methods and Assumptions as of June 30, 2011 Valuations
Plan State
Employees
Teachers
Judicial State Police
Legislators
Board of Education
Valuation Date
June 30, 2011
June 30, 2011
June 30, 2011
June 30, 2011
June 30, 2011
June 30, 2011
Plan Type
Cost sharing
multiple employer
Single
Employer (1)
Single
Employer
Single
Employer
Single
Employer
Cost sharing
multiple employer
Actuarial Cost Method
Individual Entry Age
Individual Entry Age
Individual Entry Age
Individual Entry Age
Individual Entry Age
Individual Entry Age
Amortization Method
Level Percent of Payroll – Closed
Level Dollar
Level Dollar
Level Percent of Payroll –
Closed
Level Dollar
Level Percent of Payroll –
Closed Equivalent Single Remaining Amortization Period
25 years
4 years
25 years
25 years
25 years
25 years
Asset Valuation Method
4 Year
Smoothed Market
4 Year
Smoothed Market
4 Year
Smoothed Market
4 Year
Smoothed Market
4 Year
Smoothed Market
4 Year
Smoothed Market
Actuarial Assumptions
Investment Rate of Return 5.00% 5.00% 5.00% 5.00% 5.00% 5.00%
Projected Salary Increases
4.00%
To
7.00%
N/A 4.00%
4.00%
To
12.00%
4.25%
To
8.50%
4.00%
To
7.00%
Valuation Health Care Cost Trend Rate
9% in 2012, grading to 4.0%
in 2021
9% in 2012, grading to 4.0%
in 2021
9% in 2012, grading to 4.0%
in 2021
9% in 2012, grading to 4.0%
in 2021
9% in 2012, grading to 4.0%
in 2021
9% in 2012, grading to 4.0%
in 2021
Note 1 – The Teachers plan accounts for the Tier I subsidy funded by the State for Teachers electing to participate and retiring before October 1, 2008.
131

State of Rhode Island and Providence Plantations Notes to Required Supplementary Information Fiscal Year Ended June 30, 2013
2. Schedules of Funding Progress Changes affecting the June 30, 2011 Actuarial Valuation: A number of changes in actuarial assumptions were made between the June 30, 2009 and June 30, 2011 valuations. These changes include reflecting new assumptions adopted by the Employees Retirement System of Rhode Island (ERSRI) and the State Police Retirement Benefits Trust of Rhode Island (SPRBT), changes to the OPEB specific assumptions as well as the provisions of the Retirement Security Act, which was enacted on November 18, 2011 and included comprehensive pension reform measures. The June 30, 2011 valuation also reflects the potential excise tax under the Patient Protection and Affordable Care Act. Changes from the ERSRI and SPRBT experience studies include changes to the retirement and disability rates and salary expectations. In addition, new mortality assumptions were adopted for all plans which provide for future mortality improvement by using generational mortality. The significant decrease in the unfunded actuarial accrued liability for the Judicial and Legislator plans is primarily due to retirement eligibility changes resulting from enactment of the Retirement Security Act and an increase in the Medicare election rate. Changes to the OPEB specific assumptions include a change in the medical trend assumption from 9% decreasing to 4.5% in 8 years to 9% decreasing to 4.0% in 10 years, a change in the Medicare election rate for Legislators from 75% electing Medicare to 100% electing Medicare and the addition of the assumption that current retired Teachers over age 65 in the Early Retiree Plan are assumed to not be eligible for Medicare. The June 30, 2011 actuarial valuation employs a four-year smoothed market methodology for the determination of the actuarial value of assets. In addition, the Judicial and Legislator plans changed from a level percent of payroll amortization method to the level dollar method. The Patient Protection and Affordable Care Act includes an excise tax on high cost health plans beginning in 2018. The excise tax is 40% of costs above a threshold. The actuarial assumptions used in the most recent valuation assume that the plans will be subject to the excise tax as early as 2018. The General Laws were amended in the 2013 session of the General Assembly to modify the manner in which health insurance is provided to Medicare eligible retirees covered under the System’s plan covering state employees. During fiscal year 2014, the State will establish a health reimbursement account (HRA) for each Medicare eligible retiree who elects to receive health insurance coverage through the state sponsored program. The System’s actuary has updated the June 30, 2011 actuarial valuation to reflect the effect on the Actuarial Accrued Liability resulting from this change and the updated amounts are reflected in the table above. Changes affecting the June 30, 2009 Actuarial Valuation:
With the creation of the trust effective July 1, 2010, the State Employees and Board of Education plans met the requirements of cost-sharing multiple employer plans. These plans were previously considered agent multiple-employer plans absent the creation of the trust. The following changes in actuarial assumptions were made between the June 30, 2007 and June 30, 2009 valuations. These changes include an increase in the investment return assumption from 3.566% to 5.00%, a change in the medical trend assumption from 10% decreasing to 4.5% in 7 years to 9% decreasing to 4.5% in 9 years except for the Board of Education Plan. For the Board of Education Plan, the medical trend assumption changed from 9% decreasing to 4.5% in ten years to 9% decreasing to 4% in ten years. In addition, the wage inflation assumption was changed to 0% for two years before reverting to 4.5% to reflect the current economic environment.
132

Combining Financial
Statements
State of Rhode Island
Fiscal Year Ended June 30, 2013

Nonmajor Governmental Funds
Coastal Resources Management Council Dredge Fund – accounts for fees in excess of the base rateper cubic yard for the disposal of dredge materials. These funds must be used to create additional dredgingand disposal options.
R.I. Temporary Disability Insurance Fund – accounts for the employee tax on wages that is levied to paybenefits to covered employees who are out of work for an extended period of time due to a non-job-relatedillness.
Historic Tax Credit - accounts for application fees relating to historic tax credit eligible projects, proceedsfrom the issuance of Revenue Bonds under the Historic Structures Tax Credit Financing Program as well asrelated expenditures and transfers.
R.I. Public Rail Corporation - accounts for activity of this entity which includes state appropriations,insurance and other administrative expenses and property rental related activities.
Bond Capital – accounts for the proceeds of the bonds issued and the related capital expenditures notrequired to be accounted for in another capital projects fund.
R.I. Capital Plan – accounts for the portion of the payment into the budget reserve account that causes thebalance in the budget reserve account to be in excess of the legal requirement and proceeds as designatedby statute. The fund is to be used solely for funding capital projects.
R.I. Clean Water Act Environmental Trust – accounts for the proceeds of certain bonds issued of whichthe proceeds are restricted to providing grants and loans to local governmental entities and the requiredState share or related expenses for the Narragansett Bay study.
Certificates of Participation – accounts for the proceeds of the sale of certificates of participation whichprovide funding for the acquisition, construction or improvement of public facilities and equipment.
Tobacco Settlement Financing Corporation (TFSC) - created to securitize the tobacco settlementrevenues from the State, and reflected as a blended component unit.
Permanent School – accounts for certain appropriations of the General Assembly and the earningsthereon, which are to be used for the promotion and support of public education.
Special Revenue Funds - account for the proceeds of specific revenue sources that are legally restricted toexpenditure for specified purposes and where a separate fund is mandated.
Capital Project Funds - account for resources obtained and used for the acquisition, construction orimprovement of capital facilities not reported in other governmental or proprietary funds.
Permanent Funds – are used to report resources that are legally restricted to the extent that only earnings, andnot principal, may be used for the purposes that support the State’s programs.
Debt Service Funds – are used to account for and report financial resources that are restricted, committed, orassigned to expenditure for principal and interest. Debt service funds are used to report resources if legallymandated or when financial resources are being accumulated for principal and interest maturing in future years.
133

State of Rhode Island and Providence PlantationsCombining Balance Sheet
Nonmajor Governmental FundsJune 30, 2013
(Expressed in Thousands)
AssetsCash and cash equivalents $ 682 $ 111,000 $ 171 $ 44 $ 111,897Funds on deposit with fiscal agent 11,114 11,114Restricted investmentsReceivables (net) 43,811 24 43,835Due from other fundsLoans to other funds
Total assets 682 $ 154,811 $ 11,285 $ 68 $ 166,846
Liabilities and Fund BalancesLiabilities
Accounts payable 202 202Due to other funds 605 605Due to component unitsLoans from other fundsOther liabilities
Total liabilities 807 807
Fund balancesNonspendableRestricted 682 154,004 11,285 165,971Unrestricted
Committed 68 68
Total fund balances 682 154,004 11,285 68 166,039
Total Liabilities and fund balances $ 682 $ 154,811 $ 11,285 $ 68 $ 166,846
(Continued)
CoastalResources
ManagementFundsCorporationDisability Financing
Revenue
TotalR.I.
RailSpecial
Council DredgeTemporary
HistoricTax
CreditPublicR.I.
Special Revenue
134

State of Rhode Island and Providence PlantationsCombining Balance Sheet
Nonmajor Governmental FundsJune 30, 2013
(Expressed in Thousands)
AssetsCash and cash equivalentsFunds on deposit with fiscal agentRestricted investmentsReceivables (net)Due from other fundsLoans to other funds
Total assets
Liabilities and Fund BalancesLiabilities
Accounts payableDue to other fundsDue to component unitsLoans from other fundsOther liabilities
Total liabilities
Fund balancesNonspendableRestrictedUnrestricted
Committed
Total fund balances
Total Liabilities and fund balances
$ 112,861 $ 78,841 $ 5,304 $ $ 197,006 $ 1,592 $ 2,139 $ 312,63433,824 33,824 44,938
69,319 69,31923,202 67,037
291 291 29183,829 717 84,546 84,546
$ 112,861 $ 162,670 $ 5,304 $ 34,832 $ 315,667 $ 94,113 $ 2,139 $ 578,765
1,955 12,835 14,396 29,186 100 29,48841 15,068 15,109 15,714
670 7,992 8,662 8,6629,600 8 9,608 9,608
67 259 326 326
12,333 36,154 14,404 62,891 100 63,798
174 174100,528 126,516 5,304 20,428 252,776 94,113 1,865 514,725
68
100,528 126,516 5,304 20,428 252,776 94,113 2,039 514,967
$ 112,861 $ 162,670 $ 5,304 $ 34,832 $ 315,667 $ 94,113 $ 2,139 $ 578,765
(Concluded)
TobaccoSettlement
Capital Plan
Certificatesof
Participation
R.I.
SchoolCorporation
CapitalProjectFunds
Water ActCapital
TrustBond
Funds
Total TotalNonmajor
GovernmentalFinancing Permanent
R.I. Clean
PermanentDebt Service
Environmental
Capital Project
135

State of Rhode Island and Providence PlantationsCombining Statement of Revenues, Expenditures, and Changes in Fund Balances
Nonmajor Governmental FundsFor the Fiscal Year Ended June 30, 2013
(Expressed in Thousands)
Revenues:Taxes $ $ 165,525 $ $ $ 165,525Licenses, fines, sales, and services 358 (3,213) 32 (2,823)Income from investments 201 3 204Other revenues
Total revenues 358 165,726 (3,210) 32 162,906Expenditures:
Current:General government 163,649 163,649EducationNatural resources 57 57Transportation 1,804 1,804
Capital outlaysPrincipalInterest and other charges
Total expenditures 57 163,649 1,804 165,510
Excess (deficiency) of revenuesover (under) expenditures 301 2,077 (3,210) (1,772) (2,604)
Other financing sources (uses)Bonds and notes issuedProceeds from refundingsProceeds from the sale of Certificates
of ParticipationPremiumTransfers in 1,788 1,788Payment to refunded bonds escrow agentTransfers out (1,769) (8,995) (10,764)
Total other financing sources (uses) (1,769) (8,995) 1,788 (8,976)
Net change in fund balances 301 308 (12,205) 16 (11,580)
Fund balances - beginning as restated 381 153,696 23,490 52 177,619
Fund balances - ending $ 682 $ 154,004 $ 11,285 $ 68 $ 166,039
(Continued)
Special Revenue
R.I. TotalCoastalSpecial
TemporaryDisability
HistoricTax
Credit
ResourcesRevenue
FundsManagement
Council Dredge
R.I.Rail
Corporation
Public
136

State of Rhode Island and Providence PlantationsCombining Statement of Revenues, Expenditures, and Changes in Fund Balances
Nonmajor Governmental FundsFor the Fiscal Year Ended June 30, 2013
(Expressed in Thousands)
Revenues:TaxesLicenses, fines, sales, and servicesIncome from investmentsOther revenues
Total revenuesExpenditures:
Current:General governmentEducationNatural resourcesTransportation
Capital outlaysPrincipalInterest and other charges
Total expenditures
Excess (deficiency) of revenuesover (under) expenditures
Other financing sources (uses)Bonds and notes issuedProceeds from refundingsProceeds from the sale of Certificates
of ParticipationPremiumTransfers inPayment to refunded bonds escrow agentTransfers out
Total other financing sources (uses)
Net change in fund balances
Fund balances - beginning as restated
Fund balances - ending
$ $ $ $ $ $ $ $ 165,525282 (2,541)
165 218 7 1 391 3,376 2 3,97346,370 46,370
165 218 7 1 391 49,746 284 213,327
33 163,682260 260
571,804
37,826 59,904 49 32,636 130,415 130,4151,500 1,500 14,265 15,765
590 1,199 1,789 36,085 37,874
38,416 59,904 49 35,335 133,704 50,383 260 349,857
(38,251) (59,686) (42) (35,334) (133,313) (637) 24 (136,530)
81,400 81,400 81,40088,175 88,175 88,175
26,690 26,690 26,69010,410 17,097 27,507 27,507
94,617 1,874 96,491 98,279(101,172) (101,172) (101,172)
(33,293) (33,962) (67,255) (78,019)
58,517 60,655 32,664 151,836 142,860
20,266 969 (42) (2,670) 18,523 (637) 24 6,330
80,262 125,547 5,346 23,098 234,253 94,750 2,015 508,637
$ 100,528 $ 126,516 $ 5,304 $ 20,428 $ 252,776 $ 94,113 $ 2,039 $ 514,967
(Concluded)
Debt Service
Water ActR.I.
FundsParticipation
Permanent
Tobacco
Capital Projects
R.I. Clean
FundsPermanent
SchoolCorporation
SettlementFinancing
TotalNonmajor
GovernmentalProjectEnvironmental of
TotalCapitalCertificates
TrustBond
CapitalCapital
Plan
137

* Revenues:Taxes $ 165,525 $ 165,525 $ 165,525 $Other Revenues 201 201 201
Total Revenues 165,726 165,726 165,726
Expenditures:
Department of Labor and TrainingIncome Support 181,948 171,688 165,247 6,441
Treasury Department 252 217 171 46
Total Expenditures 182,200 171,905 165,418 6,487
Net change in fund balance 308
* Fund balance - beginning 153,696
Fund balance - ending $ 154,004
*are assumed to equal actual amounts.
VarianceWith FinalFinal
Budget AmountsActual
Revenues are not legislatively adopted, budgeted revenues and opening surplus
State of Rhode Island and Providence PlantationsSchedule of Revenues, Expenditures, and Changes in Fund Balance
Budget and ActualRhode Island Temporary Disability Insurance Fund
Budget
For the Fiscal Year Ended June 30, 2013
OriginalBudget
(Expressed in Thousands)
138

Internal Service Funds
Assessed Fringe Benefits – accounts for the biweekly assessment of a percentage applied to salariesand wages to pay for certain fringe benefits, including workers’ compensation to State employees injuredon the job.
Central Utilities – processes all electric bills for the State and charges the expendingdepartment/agency.
Central Mail – provides for the delivery of mail services for the State.
State Telecommunications – provides the telecommunication services for the State and processes allof the telephone bills for the State and charges the expending department/agency. (Formerly Centrexand Pastore Communications).
Automotive Maintenance – approves work orders, pays the corresponding bills for the State fleet andbills the user department/agency.
Central Warehouse – provides a low-cost centralized distribution center for food for State institutionsand local public school districts.
Correctional Industries – provides job training for inmates through prison industries.
Surplus Property – accounts for the revenues received and expenses incurred from the disposition ofState surplus property.
Records Center – provides a centralized location for the archival of State documents.
Health Insurance-Active – pays active employee health benefits.
Vehicle Replacement Revolving Loan – this fund was created with an appropriation from the GeneralFund, to facilitate the purchase of new State vehicles.
Capitol Police – provides security for certain State buildings.
Internal Service Funds are used to account for the financing and providing of specified goods and services, ona centralized basis, for other departments and agencies.
139

State of Rhode Island and Providence PlantationsCombining Statement of Net Position
Internal Service FundsJune 30, 2013
(Expressed in Thousands)
Assets:Current assets:
Cash and cash equivalents $ 453 $ 1,295 $ $ $ 820 $ 1,992 $ 342Receivables (net) 1,235 933 362 119 384 41 1,405Due from other funds 343 5 22 183 144Inventories 178 430 502 582Other assets
Total current assets 1,688 2,571 545 141 1,634 2,718 2,473
Noncurrent assets: Capital assets (net) 74 2,122 121
Total noncurrent assets 74 2,122 121
Total assets 1,688 2,571 545 141 1,708 4,840 2,594
Liabilities:Current liabilities:
Accounts payable 6 934 59 31 359 316 471Due to other funds 198 96Loans from other funds 3,050 1,880 304 143 200Other liabilities 1,597 7 156 115 80 118 248
Total current liabilities 4,851 2,821 519 289 735 434 719
Net Position (Deficit):Net investment in capital assets 74 2,122 121Unrestricted (3,163) (250) 26 (148) 899 2,284 1,754
Total net position (deficit) $ (3,163) $ (250) $ 26 $ (148) $ 973 $ 4,406 $ 1,875
(Continued)
Assessed StateTele- Automotive Central
communications Maintenance WarehouseFringe Central Central
MailBenefits Utilities IndustriesCorrectional
140

State of Rhode Island and Providence PlantationsCombining Statement of Net Position
Internal Service FundsJune 30, 2013
(Expressed in Thousands)
Assets:Current assets:
Cash and cash equivalentsReceivables (net)Due from other fundsInventoriesOther assets
Total current assets
Noncurrent assets: Capital assets (net)
Total noncurrent assets
Total assets
Liabilities:Current liabilities:
Accounts payableDue to other fundsLoans from other fundsOther liabilities
Total current liabilities
Net Position (Deficit):Net investment in capital assetsUnrestricted
Total net position (deficit)
Total
$ 71 $ 197 $ 25,622 $ 7,945 $ $ 38,73789 1,920 6,488
675 65 1,4371,692
6,610 6,610
71 286 32,232 10,540 65 54,964
2,317
2,317
71 286 32,232 10,540 65 57,281
29 15,436 1 17,6427 301
300 84 5,96161 68 2,450
397 15,436 153 26,354
2,31771 (111) 16,796 10,540 (88) 28,610
$ 71 $ (111) $ 16,796 $ 10,540 $ (88) $ 30,927
(Concluded)
Center
Health
PropertyInsurance
ActiveRecordsSurplus Capitol
Police
VehicleReplacement
Revolving Loan
141

State of Rhode Island and Providence PlantationsCombining Statement of Revenues, Expenses, and Changes in Net Position
Internal Service FundsFor the Fiscal Year Ended June 30, 2013
(Expressed in Thousands)
Operating revenues:Charges for services
Total operating revenues
Operating expenses:Personal servicesSupplies, materials, and servicesDepreciation
Total operating expenses
Operating income (loss)
Nonoperating revenues (expenses):Interest revenueOther nonoperating revenues
and (expenses)
Income (loss) before transfers
Operating transfers inTransfers (out)
Change in net position
Net position (deficit) - beginning
Net position (deficit) - ending
$ 32,911 $ 12,215 $ 5,002 $ 2,582 $ 12,046 $ 5,454 $ 5,055
32,911 12,215 5,002 2,582 12,046 5,454 5,055
5,997 835 736 667 868 1,54826,589 12,215 4,351 1,806 11,342 4,641 3,225
52 50 94 38
32,586 12,215 5,238 2,542 12,059 5,603 4,811
325 (236) 40 (13) (149) 244
14
339 (236) 40 (13) (149) 244
50(1,829)
(1,490) (186) 40 (13) (149) 244
(1,673) (250) 212 (188) 986 4,555 1,631
$ (3,163) $ (250) $ 26 $ (148) $ 973 $ 4,406 $ 1,875
(Continued)
CorrectionalWarehouse
CentralBenefits Utilities
Tele-Assessed State
MaintenanceFringe Central AutomotiveCentral
Mail communications Industries
142

State of Rhode Island and Providence PlantationsCombining Statement of Revenues, Expenses, and Changes in Net Position
Internal Service FundsFor the Fiscal Year Ended June 30, 2013
(Expressed in Thousands)
Operating revenues:Charges for services
Total operating revenues
Operating expenses:Personal servicesSupplies, materials, and servicesDepreciation
Total operating expenses
Operating income (loss)
Nonoperating revenues (expenses):Interest revenueOther nonoperating revenues
and (expenses)
Income (loss) before transfers
Operating transfers inTransfers (out)
Change in net position
Net position (deficit) - beginning
Net position (deficit) - ending
Total
$ $ 859 $ 207,556 $ 14 $ 753 $ 284,447
859 207,556 14 753 284,447
463 869 11,9833 391 204,161 268,724
234
3 854 204,161 869 280,941
(3) 5 3,395 14 (116) 3,506
38 14 52
14
(3) 5 3,433 28 (116) 3,572
7,350 7,400(1,829)
(3) 5 3,433 7,378 (116) 9,143
74 (116) 13,363 3,162 28 21,784
$ 71 $ (111) $ 16,796 $ 10,540 $ (88) $ 30,927
(Concluded)
SurplusActiveProperty
CapitolPolice
RecordsVehicle
ReplacementInsuranceHealth
Center Revolving Loan
143

State of Rhode Island and Providence PlantationsCombining Statement of Cash Flows
Internal Service FundsFor the Fiscal Year Ended June 30, 2013
(Expressed in Thousands)
Cash flows from operating activities:Cash received from customers $ 31,431 $ 11,088 $ 5,157 $ 1,353 $ 11,984 $ 5,310 $ 4,751Cash payments to suppliers for goods and services (26,834) (11,282) (4,167) (1,815) (11,349) (4,870) (3,430)Cash payments to employees (7,106) 5 (813) (703) (638) (827) (1,501)Other operating revenue (expense) 14
Net cash provided by (used for) operating activities (2,495) (189) 177 (1,165) (3) (387) (180)
Cash flows from noncapital financing activities:Loans from other funds 3,050 831 304 143Loans to other fundsRepayment of loans to other fundsRepayment of loans from other funds (630) (481)Operating transfers in 50Operating transfers out (1,829)
Net cash provided by (used for) noncapital financing activities 1,221 201 (127) 143
Cash flows from capital and related financing activities:Acquisition of capital assets (50) (25) (7)
Net cash provided by (used for) capital and related financingactivities (50) (25) (7)
Cash flows from investing activities:Interest on investments
Net cash provided by (used for) investing activities
Net increase (decrease) in cash and cash equivalents (1,274) 12 (1,022) (3) (412) (187)Cash and cash equivalents - July 1 1,727 1,283 1,022 823 2,404 529
Cash and cash equivalents - June 30 $ 453 $ 1,295 $ $ $ 820 $ 1,992 $ 342
(Continued)
communicationsUtilities
AssessedFringe
BenefitsCentralTele-
State
MaintenanceAutomotiveCentral
Warehouse IndustriesCentral
MailCorrectional
144

State of Rhode Island and Providence PlantationsCombining Statement of Cash Flows
Internal Service FundsFor the Fiscal Year Ended June 30, 2013
(Expressed in Thousands)
communicationsUtilities
AssessedFringe
BenefitsCentralTele-
State
MaintenanceAutomotiveCentral
Warehouse IndustriesCentral
MailCorrectional
Reconciliation of operating income (loss) to net cashprovided by (used for) operating activities:Operating income (loss) $ 325 $ $ (236) $ 40 $ (13) $ (149) $ 244
Adjustments to reconcile operating income (loss)to net cash provided by (used for) operatingactivities:
Depreciation $ $ $ 52 $ $ 50 $ 94 $ 38Other revenue (expense) and operating transfer in (out) 14(Increase) decrease in assets:
Receivables (1,234) (1,123) 155 (12) 11 (145) (303)Inventory 148 (20) (70) (40)Prepaid items
Increase (decrease) in liabilities:Accounts payable (491) 929 36 (1,225) (60) (158) (166)Accrued expenses (1,109) 5 22 32 29 41 47
Total adjustments (2,820) (189) 413 (1,205) 10 (238) (424)
Net cash provided by (used for) operating activities $ (2,495) $ (189) 177 $ (1,165) $ (3) $ (387) $ (180)
(Continued)
145

State of Rhode Island and Providence PlantationsCombining Statement of Cash Flows
Internal Service FundsFor the Fiscal Year Ended June 30, 2013
(Expressed in Thousands)
Cash flows from operating activities:Cash received from customersCash payments to suppliers for goods and servicesCash payments to employeesOther operating revenue (expense)
Net cash provided by (used for) operating activities
Cash flows from noncapital financing activities:Loans from other fundsLoans to other fundsRepayment of loans to other fundsRepayment of loans from other fundsOperating transfers inOperating transfers out
Net cash provided by (used for) noncapital financing activities
Cash flows from capital and related financing activities:Acquisition of capital assets
Net cash provided by (used for) capital and related financingactivities
Cash flows from investing activities:Interest on investments
Net cash provided by (used for) investing activities
Net increase (decrease) in cash and cash equivalentsCash and cash equivalents - July 1
Cash and cash equivalents - June 30
$ $ 835 $ 207,556 $ (662) $ 717 $ 279,520(3) (386) (203,291) (267,427)
(446) (841) (12,870)14
(3) 3 4,265 (662) (124) (763)
84 4,412(868) (868)849 849
(1,111)7,350 7,400
(1,829)
7,331 84 8,853
(82)
(82)
38 14 52
38 14 52
(3) 3 4,303 6,683 (40) 8,06074 194 21,319 1,262 40 30,677
$ 71 $ 197 $ 25,622 $ 7,945 $ $ 38,737
(Continued)
Active TotalRevolving LoanRecords Capitol
PoliceSurplusProperty
VehicleReplacement
HealthInsurance
Center
146

State of Rhode Island and Providence PlantationsCombining Statement of Cash Flows
Internal Service FundsFor the Fiscal Year Ended June 30, 2013
(Expressed in Thousands)
Reconciliation of operating income (loss) to net cashprovided by (used for) operating activities:Operating income (loss)
Adjustments to reconcile operating income (loss)to net cash provided by (used for) operatingactivities:
DepreciationOther revenue (expense) and operating transfer in (out)(Increase) decrease in assets:
ReceivablesInventoryPrepaid items
Increase (decrease) in liabilities:Accounts payableAccrued expenses
Total adjustments
Net cash provided by (used for) operating activities
Active TotalRevolving LoanRecords Capitol
PoliceSurplusProperty
VehicleReplacement
HealthInsurance
Center
$ (3) $ 5 $ 3,395 $ 14 $ (116) $ 3,506
$ $ $ $ $ $ 23414
(16) (300) (676) (38) (3,681)18
(486) (486)
(3) 1,656 1 51917 29 (887)
(2) 870 (676) (8) (4,269)
$ (3) $ 3 $ 4,265 $ (662) $ (124) $ (763)
(Concluded)
147

Trust Funds
Employees’ Retirement System – a multiple-employer, cost-sharing, public employee retirement plan forState employees, teachers and certain employees of local school districts.
Municipal Employees’ Retirement System – an agent multiple-employer public employee retirement planfor municipal police, firemen and employees of municipalities, housing authorities and water and sewerdistricts that have elected to participate.
State Police Retirement Benefits Trust – a single-employer public employee retirement plan for Statepolice hired after July 1, 1987.
Judicial Retirement Benefits Trust – a single-employer public employee retirement plan for State judgesappointed after December 31, 1989.
Judicial Retirement Fund Trust – a single-employer public employee retirement plan for judges appointedbefore January 1, 1990.
Defined Contribution Plan – a money purchase plan that operates under Section 401 (a) of the InternalRevenue Code. The plan covers members of the Employees' Retirement System, excluding legislators,correction officers and Municipal Employees' Retirement System police and fire employees who participatein Social Security. Judges and state police officers are also excluded from the plan.
OPEB Trust Funds
State Employees - covers State employees and certain employees of the Narragansett Bay Commission,RI Airport Corporation, and RI Economic Development Corporation.
Teachers - covers certified public school teachers electing to participate.
Judicial - covers judges and magistrates.
State Police - covers retired State police officers.
Legislators - covers retired and former members of the General Assembly.
Board of Education - covers certain members of the University and Colleges, primarily faculty.
Pension Trust Funds
Pension Trust Funds – used to report resources that are required to be held in trust for the members andbeneficiaries of the State sponsored pension plans.
OPEB Trust Funds - established for the purpose of providing and administering OPEB benefits for retired employees of the State of Rhode Island and their dependents for the classes listed below.
148

Assets
Cash and cash equivalents $ 2,350 $ 3,581 $ 5,931
Advance held by claims processing agent 1,248 1,248
ReceivablesContributions 28,573 2,092 30,665Due from state for teachers 14,549 14,549Miscellaneous 16,340 77 16,417
Total receivables 59,462 2,169 61,631
Investments, at fair valueEquity in Pooled Trust 7,530,857 68,587 7,599,444Other 122,405 122,405
Total investments 7,653,262 68,587 7,721,849
Total assets 7,715,074 75,585 7,790,659
Liabilities
Accounts payable 4,516 616 5,132Incurred but not reported claims 2,785 2,785Unearned revenue 6,064 6,064
Total liabilities 4,516 9,465 13,981
Net position held in trust for pensionand other postemployment benefits $ 7,710,558 $ 66,120 $ 7,776,678
State of Rhode Island and Providence Plantations
Combining Statement of Fiduciary Net Position
Pension and Other Postemployment Benefits Trust Funds
June 30, 2013
(Expressed in Thousands)
Other
Trust Benefits Trust TotalsPension Postemployment
149

AdditionsContributions
Member contributions $ 170,995 $ 19,360 $ 190,355Employer contributions 312,275 58,223 370,498Supplemental employer contributions 15,690 15,690State contributions for teachers 70,703 70,703Interest on service credits purchased 1,002 1,002Service credit transfer payments 593 593
Total contributions 571,258 77,583 648,841
Other income 1,256 1,256
Investment incomeNet appreciation in
fair value of investments 708,052 3,545 711,597Interest 59,309 785 60,094Dividends 17,182 17,182Other investment income 7,877 7,877
792,420 4,330 796,750
Less investment expense 14,508 75 14,583
Net income from investing activities 777,912 4,255 782,167
Total additions 1,349,170 83,094 1,432,264
DeductionsRetirement benefits 899,223 899,223Death benefits 3,518 3,518Distributions 338 338Refund of contributions 11,941 11,941Administrative expense 7,474 33 7,507Service credit transfers 593 593OPEB benefits 53,803 53,803
Total deductions 923,087 53,836 976,923
Change in net position 426,083 29,258 455,341
Net position held in trust for pensionand other postemployment benefits
Net position - beginning 7,284,475 36,862 7,321,337
Net position - ending $ 7,710,558 $ 66,120 $ 7,776,678
State of Rhode Island and Providence Plantations
Combining Statement of Changes in Fiduciary Net Position
Pension and Other Post Employment Benefits Trust Funds
For the Fiscal Year Ended June 30, 2013
Other
(Expressed in Thousands)
Trust Benefits Trust TotalsPension Postemployment
150

Assets
Cash and cash equivalents $ 1,483 $ 465 $ 167 $ 88 $ 147 $ $ 2,350
ReceivablesContributions 23,786 4,540 135 106 6 28,573Due from state for teachers 14,549 14,549Miscellaneous 16,301 39 16,340
Total receivables 54,636 4,579 135 106 6 59,462
Investments, at fair valueEquity in Pooled Trust 6,147,472 1,244,810 91,764 46,811 7,530,857Other-Defined Contribution Plan 122,405 122,405
Total investments 6,147,472 1,244,810 91,764 46,811 122,405 7,653,262
Total assets 6,203,591 1,249,854 92,066 47,005 153 122,405 7,715,074
Liabilities
Accounts payable 3,910 559 31 16 4,516
Total liabilities 3,910 559 31 16 4,516
Net position held in trust for pension benefits $ 6,199,681 $ 1,249,295 $ 92,035 $ 46,989 $ 153 $ 122,405 $ 7,710,558
BenefitsTotalsSystem Retirement Trust Trust
Employees'Retirement BenefitsMunicipal
State of Rhode Island and Providence Plantations
Combining Statement of Fiduciary Net Position
June 30, 2013
Pension Trust Funds
(Expressed in Thousands)
JudicialRetirement
StatePolice
RetirementEmployees'Judicial
RetirementFundTrust
DefinedContribution
Plan
151

AdditionsContributions
Member contributions $ 63,888 $ 11,233 $ 1,706 $ 1,042 $ 153 $ 92,973 $ 170,995Employer contributions 246,795 35,554 2,103 1,752 26,071 312,275Supplemental employer contributions 15,690 15,690State contributions for teachers 70,703 70,703Interest on service credits purchased 617 379 6 1,002Service credit transfer payments 593 593
Total contributions 397,693 47,759 3,815 2,794 153 119,044 571,258
Investment incomeNet appreciation in
fair value of investments 578,184 114,147 8,049 4,122 3,550 708,052Interest 48,629 9,643 686 351 59,309Dividends 13,164 2,621 188 96 1,113 17,182Other investment income 6,466 1,275 90 46 7,877
646,443 127,686 9,013 4,615 4,663 792,420
Less investment expense 11,890 2,363 169 86 14,508
Net income from investing activities 634,553 125,323 8,844 4,529 4,663 777,912
Total additions 1,032,246 173,082 12,659 7,323 153 123,707 1,349,170
DeductionsRetirement benefits 811,958 84,724 1,037 1,504 899,223Death benefits 2,823 695 3,518Distributions 338 338Refund of contributions 9,761 2,180 11,941Administrative expense 5,412 1,005 60 33 964 7,474Service credit transfers 593 593
Total deductions 830,547 88,604 1,097 1,537 1,302 923,087
Change in net position 201,699 84,478 11,562 5,786 153 122,405 426,083
Net position held in trust for pension benefits
Net position - beginning 5,997,982 1,164,817 80,473 41,203 7,284,475
Net position - ending $ 6,199,681 $ 1,249,295 $ 92,035 $ 46,989 $ 153 $ 122,405 $ 7,710,558
State of Rhode Island and Providence PlantationsCombining Statement of Changes in Fiduciary Net Position
For the Fiscal Year Ended June 30, 2013Pension Trust Funds
(Expressed in Thousands)
Employees' Municipal Retirement RetirementState Police Judicial
System Retirement Trust Trust TotalsRetirement Employees' Benefits Benefits
JudicialRetirement
FundTrust
DefinedContribution
Plan
152

Assets
Cash and cash equivalents $ 1,962 $ 312 $ 238 $ 574 $ 52 $ 443 $ 3,581
Advance held by claims processing agent 1,248 1,248
ReceivablesDue from other funds 77 77Contributions receivable 1,693 29 226 144 2,092
Total receivables 1,770 29 226 144 2,169
Investments at fair value - equity in pooled trust 42,482 4,430 1,974 9,267 2,254 8,180 68,587
Total assets 47,462 4,742 2,241 10,067 2,306 8,767 75,585
Liabilities
Accounts payable 440 102 8 38 4 17 609Incurred but not reported claims 2,155 353 16 152 33 76 2,785Due to other funds 4 1 1 1 7Unearned revenue 4,148 955 961 6,064
Total liabilities 6,743 1,414 25 191 37 1,055 9,465
Net position held in trust for otherpostemployment benefits $ 40,719 $ 3,328 $ 2,216 $ 9,876 $ 2,269 $ 7,712 $ 66,120
LegislatorsPoliceJudicial
State of Rhode Island and Providence Plantations
Combining Statement of Fiduciary Net Position
Other Postemployment Benefits Trust Funds
June 30, 2013(Expressed in Thousands)
State Board ofStateTotalsEmployees EducationTeachers
153

AdditionsContributions
Member contributions $ 11,046 $ 5,529 $ 467 $ 365 $ 493 $ 1,460 $ 19,360 Employer contributions 45,800 2,321 778 6,218 3,106 58,223
Total contributions 56,846 7,850 1,245 6,583 493 4,566 77,583
Other income 1,123 50 6 29 34 14 1,256
Investment incomeNet appreciation in in fair value of investments 2,143 232 93 477 150 450 3,545 Interest and dividends 475 55 21 104 32 98 785
2,618 287 114 581 182 548 4,330
Less investment expense 46 5 2 10 3 9 75
Net investment income 2,572 282 112 571 179 539 4,255
Total additions 60,541 8,182 1,363 7,183 706 5,119 83,094
DeductionsBenefits 41,414 7,095 304 2,583 569 1,838 53,803 Administrative expense 27 4 1 1 33
Total deductions 41,441 7,099 304 2,584 569 1,839 53,836
Net increase 19,100 1,083 1,059 4,599 137 3,280 29,258
Net position held in trust for otherpostemployment benefits
Net position - beginning 21,619 2,245 1,157 5,277 2,132 4,432 36,862
Net position - ending $ 40,719 $ 3,328 $ 2,216 $ 9,876 $ 2,269 $ 7,712 $ 66,120
PoliceJudicial TotalsEmployees EducationTeachers LegislatorsState Board of
State of Rhode Island and Providence Plantations
Combining Statement of Changes in Fiduciary Net Position
Other Postemployment Benefits Trust Funds
For the Fiscal Year Ended June 30, 2013(Expressed in Thousands)
State
154

RIPTA Health – accounts for the contributions on behalf of the employees and retirees from theRhode Island Public Transit Authority.
Statutory Deposits – accounts for deposits required from financial institutions, principally insurancecompanies, doing business within the State.
Court Deposits – accounts for deposits held by various state courts pending resolution of litigationbetween two or more parties.
Agency Funds
Agency Funds – used to report resources held by the State in a purely custodial capacity (assets equalliabilities).
155

RIPTA Health Fund
Cash and cash equivalents $ 1,213 $ 17,189 $ 16,908 $ 1,494Receivables 1,631 2,307 2,047 1,891
Total assets $ 2,844 $ 19,496 $ 18,955 $ 3,385
Deposits held for others $ 324 $ 131 $ $ 455Accounts payable 2,520 17,582 17,172 2,930
Total liabilities $ 2,844 $ 17,713 $ 17,172 $ 3,385
Statutory Deposits
Deposits held as security for entitiesdoing business in the State $ 86,273 $ 31,096 $ 47,247 $ 70,122
Total assets $ 86,273 $ 31,096 $ 47,247 $ 70,122
Deposits held for others $ 86,273 $ 31,096 $ 47,247 $ 70,122
Total liabilities $ 86,273 $ 31,096 $ 47,247 $ 70,122
Court Deposits
Cash and cash equivalents $ 16,055 $ 7,115 $ 10,177 $ 12,993Receivables 89 89
Total assets $ 16,055 $ 7,204 $ 10,177 $ 13,082
Deposits held for others $ 16,055 $ 1,691 $ 4,664 $ 13,082
Total liabilities $ 16,055 $ 1,691 $ 4,664 $ 13,082
Total - All Agency Funds
Cash and cash equivalents $ 17,268 $ 24,304 $ 27,085 $ 14,487Deposits held as security for entities
doing business in the State 86,273 31,185 47,247 70,211Receivables 1,631 2,307 2,047 1,891
Total assets $ 105,172 $ 57,796 $ 76,379 $ 86,589
Deposits held for others $ 102,652 $ 32,918 $ 51,911 $ 83,659Accounts payable 2,520 17,582 17,172 2,930
Total liabilities $ 105,172 $ 50,500 $ 69,083 $ 86,589
Balance
Assets
Liabilities
Assets
Liabilities
July 1, 2012 Additions Deductions June 30, 2013
July 1, 2012 Additions Deductions June 30, 2013Balance
Liabilities
Assets July 1, 2012 Additions Deductions June 30, 2013
Balance Balance
State of Rhode Island and Providence PlantationsCombining Statement of Changes in Fiduciary Assets and Liabilities
Agency Funds
Balance Balance
For the Fiscal Year Ended June 30, 2013(Expressed in Thousands)
Balance BalanceJune 30, 2013
Liabilities
Assets July 1, 2012 Additions Deductions
156

State of Rhode IslandCombining Statement of Net Position
Nonmajor Component UnitsJune 30, 2013
(Expressed in Thousands)
AssetsCurrent Assets:
Cash and cash equivalents $ 3,974 $ 22,682 $ 1,499 $ 139 $ 3,629 $ 23,728 $ 604 $ 972 $ 57,227Investments 12,517 12,517Receivables (net) 608 2,108 1,212 6 7 7,131 302 1,317 12,691Restricted assets:
Cash and cash equivalents 774 230,350 231,124Investments 13,030 53 13,083Other assets 39,163 39,163
Due from primary government 1,567 570 2,137Due from other governments 202 753 955Due from other component units 326 326Inventories 3,661 3,661Other assets 7 185 3,062 12 3 540 16 390 4,215
Total current assets 6,358 39,019 288,316 483 3,639 35,060 922 3,302 377,099
Noncurrent Assets:Investments 1,139 1,139Receivables (net) 20 10,629 396 11,045Restricted assets:
Cash and cash equivalents 627 697 38,279 39,603Investments 257,801 83,747 341,548Other assets 1,525,739 1,525,739
Capital assets - nondepreciable 665 17,147 87,515 105,327Capital assets - depreciable (net) 3,500 405 25,813 81,287 111,005Due from other component units 697 697Other assets, net of amortization 154,687 10,008 35 752 165,482
Total noncurrent assets 3,500 1,717 1,948,856 697 697 174,994 1,174 169,950 2,301,585
Total assets 9,858 40,736 2,237,172 1,180 4,336 210,054 2,096 173,252 2,678,684
Liabilities Current liabilities:
Accounts payable 3,894 1,273 359 38 16,324 7 821 22,716Due to other component units 59 362 131 552Due to other governments 114 114Accrued liabilities 30 30Other liabilities 165,500 165,500Current portion of long-term debt 136 509 120,620 9 498 9,491 1,655 1,451 134,369
Total current liabilities 4,030 1,896 286,479 68 898 25,815 1,692 2,403 323,281
Noncurrent liabilities:Due to other component units 697 697 1,394Unearned revenue 446 62 101 209 818Notes payable 13,692 13,692Loans payable 482 482Obligations under capital leases 5 361 366Net OPEB obligation 5,520 3,443 518 9,481Other liabilities 1,275 208,372 1,520 64,797 857 276,821Compensated absences 1,185 138 1,408 2,731Bonds payable 1,431,902 36,483 604 5,911 1,474,900
Total noncurrent liabilities 6,710 1,859 1,658,817 759 2,318 101,798 604 7,820 1,780,685
Total liabilities 10,740 3,755 1,945,296 827 3,216 127,613 2,296 10,223 2,103,966
Net position (deficit)Net investment in capital assets 3,465 1,070 8,347 160,954 173,836Restricted for:
Debt 219,200 48,214 267,414Other 932 35,911 2,448 17,031 56,322
Unrestricted (5,279) 61,881 353 1,120 17,196 (200) 2,075 77,146
Net position (deficit) $ (882) $ 36,981 $ 291,876 $ 353 $ 1,120 $ 82,441 $ (200) $ 163,029 $ 574,718
RIHMFC RIIFCCFSD RIHEAA TotalsRIWRBC QDCRIIRBA RIRRC
157

State of Rhode Island and Providence PlantationsCombining Statement of Activities
Nonmajor Component UnitsFor the Fiscal Year Ended June 30, 2013
(Expressed in Thousands)
Expenses $ 50,495 $ 25,454 $ 96,020 $ 58 $ 735 $ 42,276 $ 140 $ 9,840 $ 225,018
Program revenues:Charges for services 1,042 23,294 7,949 61 112 45,042 942 10,899 89,341Operating grants and contributions 49,727 49,727Capital grants and contributions 6,877 6,877
Total program revenues 50,769 23,294 7,949 61 112 45,042 942 17,776 145,945
Net (Expenses) Revenues 274 (2,160) (88,071) 3 (623) 2,766 802 7,936 (79,073)
General revenues:Interest and investment earnings 2 233 83,030 5 306 54 24 83,654Miscellaneous revenues 72 6,548 1 1 989 7,611
Total general revenues 74 6,781 83,030 1 6 1,295 54 24 91,265
Change in net position 348 4,621 (5,041) 4 (617) 4,061 856 7,960 12,192
Net position (deficit) - beginning as restated (1,230) 32,360 296,917 349 1,737 78,380 (1,056) 155,069 562,526
Net position (deficit) - ending $ (882) $ 36,981 $ 291,876 $ 353 $ 1,120 $ 82,441 $ (200) $ 163,029 $ 574,718
TotalsRIWRBC QDCCFSD RIHEAA RIIRBA RIRRCRIHMFC RIIFC
158

Comprehensive Annual Financial Report State of Rhode Island Fiscal Year Ended June 30, 2013
Benefit Street - Providence – photo Kevin M. Bernard
2013 STATISTICAL SECTION

State of Rhode Island and Providence Plantations Comprehensive Annual Financial Report
Statistical Section
Index
This part of the State’s comprehensive annual financial report presents detailed information as to the context for understanding what the information in the financial statements, note disclosures, and required supplementary information says about the State’s overall financial health.
Page Financial Trends Information
160
These schedules contain trend information to help the reader understand how the State’s financial performance and well-being have changed over time.
Revenue Capacity Information 166
These schedules contain information to help the reader assess the State’s most significant taxes, income and sales.
Debt Capacity Information 173
These schedules present information to help the reader assess the affordability of the State’s current levels of outstanding debt and the State’s ability to issue additional debt in the future.
Demographic and Economic Information 175
These schedules offer demographic and economic indicators to help the reader understand the environment within which the State’s financial activities take place.
Operating Information 177
These schedules contain service and infrastructure data to help the reader understand how the information in the State’s financial report relates to the services the State provides and the activities it performs.
Sources: Unless otherwise noted, the information in these schedules is derived from the comprehensive annual financial reports of the relevant year. The State implemented GASB Statement 34 in 2002.
Note: When applicable, financial data has been reported at restated amounts in the Statistical Section.
159

Governmental activitiesNet investment in capital assets $ 2,488,755 $ 2,302,368 $ 2,115,001 $ 2,064,231 $ 1,958,718 $ 1,877,872 $ 1,691,793 $ 1,591,074 $ 816,578 $ 675,696Restricted 652,126 576,387 462,751 483,931 420,215 427,588 373,788 369,137 315,370 301,346Unrestricted (1,298,579) (1,337,807) (1,439,322) (1,590,106) (1,534,512) (1,429,272) (1,082,664) (929,476) (936,437) (981,605)
Total governmental activities net position $ 1,842,302 $ 1,540,948 $ 1,138,430 $ 958,056 $ 844,421 $ 876,188 $ 982,917 $ 1,030,735 $ 195,511 $ (4,563)
Business-type activitiesNet investment in capital assets $ (65,283) $ (64,492) $ (63,156) $ (61,806) $ (59,453) $ (60,902) $ (109,435) $ (131,941) $ (71,413) $ (84,910)Restricted 8,340 9,308 11,036 13,161 20,130 198,928 294,395 302,689 233,476 251,596Unrestricted (86,571) (157,396) (159,388) (122,955) (7,251) (15,345) (16,616) (10,691) (10,183) (14,351)
Total business-type activities net position $ (143,514) $ (212,580) $ (211,508) $ (171,600) $ (46,574) $ 122,681 $ 168,344 $ 160,057 $ 151,880 $ 152,335
Primary governmentNet investment in capital assets $ 2,423,472 $ 2,237,876 $ 2,051,845 $ 2,002,425 $ 1,899,265 $ 1,816,970 $ 1,582,358 $ 1,459,133 $ 745,165 $ 590,786Restricted 660,466 585,695 473,787 497,092 440,345 626,516 668,183 671,826 548,846 552,942Unrestricted (1,385,150) (1,495,203) (1,598,710) (1,713,061) (1,541,763) (1,444,617) (1,099,280) (940,167) (946,620) (995,956)
Total primary government net position $ 1,698,788 $ 1,328,368 $ 926,922 $ 786,456 $ 797,847 $ 998,869 $ 1,151,261 $ 1,190,792 $ 347,391 $ 147,772
( a )
*
The increase in total primary government net position between fiscal years 2005 and 2006 is attributable to the recording of retroactive infrastructure assets for
(expressed in thousands)
The 2012 governmental activities were restated as fully explained in Note 18 (F).fiscal years 1981 – 2001 in accordance with GASB Statement No. 34.
2011 20102012* 2009
(accrual basis of accounting)
State of Rhode Island and Providence Plantations
20042008 2007 2006 2005
Fiscal Year
2013
Last Ten Fiscal YearsSchedule of Net Position by Components
160

Expenses
Governmental activities:General government $ 625,081 $ 653,003 $ 644,194 $ 741,329 $ 754,386 $ 894,766 $ 858,729 $ 527,841 $ 503,659 $ 474,640Human services 3,038,841 2,970,269 3,013,081 2,900,673 2,719,346 2,736,956 2,519,745 2,622,935 2,512,628 2,420,998Education 1,364,575 1,334,355 1,332,453 1,273,985 1,278,391 1,361,310 1,320,384 287,119 264,385 75,654Public safety 473,580 468,098 436,940 418,485 414,830 428,351 391,354 370,706 336,069 321,015Natural resources 76,730 85,039 80,360 73,551 75,103 90,087 91,758 74,695 65,913 61,839Transportation 300,639 268,523 300,366 305,460 324,007 240,644 281,518 323,517 226,529 173,935Intergovernmental 1,213,050 1,127,496 1,047,537Grants 299,381Interest and other charges 129,714 145,964 148,850 142,924 136,737 133,298 107,211 92,121 116,171 104,760
Total governmental activities 6,009,160 5,925,251 5,956,244 5,856,407 5,702,800 5,885,412 5,570,699 5,511,984 5,152,850 4,979,759
Business-type activities:Lottery 397,625 399,421 368,870 358,127 356,046 365,333 342,662 355,444 334,732 327,703Convention Center 48,437 49,439 32,986 50,732 48,764 41,007 42,859 37,862 35,746 62,622Employment insurance 396,909 559,440 645,979 783,878 573,288 259,246 210,060 197,724 209,018 238,220
Total business-type activities 842,971 1,008,300 1,047,835 1,192,737 978,098 665,586 595,581 591,030 579,496 628,545
Total primary government expenses $ 6,852,131 $ 6,933,551 $ 7,004,079 $ 7,049,144 $ 6,680,898 $ 6,550,998 $ 6,166,280 $ 6,103,014 $ 5,732,346 $ 5,608,304
Program Revenues
Governmental activities:Charges for services:
General government $ 220,376 $ 212,750 $ 185,918 $ 179,646 $ 168,210 $ 178,590 $ 132,152 $ 146,575 $ 141,290 $ 137,913Human services 227,158 204,287 210,905 198,555 187,973 167,241 125,901 127,738 122,212 124,716Education 26,840 26,044 22,022 18,263 8,335 36,241 11,180 5,638 3,469 3,320Public safety 47,075 37,339 34,389 35,272 32,770 36,194 49,821 53,851 46,216 43,487Natural resources 28,975 26,060 29,046 29,746 31,385 31,753 31,932 27,487 30,340 31,191Transportation 1,076 1,660 372 744 181 (207) 875 (561) 8,257 1,739
Operating grants and contributions 2,211,800 2,194,892 2,387,540 2,361,446 2,114,821 1,827,704 1,716,318 1,821,134 1,794,965 1,703,526Capital grants and contributions 190,551 210,720 162,032 162,090 103,515 112,712 151,528 156,828 97,681 156,372
Total governmental activitiesprogram revenues 2,953,851 2,913,752 3,032,224 2,985,762 2,647,190 2,390,228 2,219,707 2,338,690 2,244,430 2,202,264
Business-type activities:Charges for services 1,055,070 1,056,285 985,556 947,825 913,333 923,694 883,893 894,042 839,945 812,229Operating grants and contributions 166,164 278,671 358,932 418,270 194,857 3,285 4,607 2,342 2,633 29,492
Total business-type activities
program revenues 1,221,234 1,334,956 1,344,488 1,366,095 1,108,190 926,979 888,500 896,384 842,578 841,721
Total primary governmentprogram revenues $ 4,175,085 $ 4,248,708 $ 4,376,712 $ 4,351,857 $ 3,755,380 $ 3,317,207 $ 3,108,207 $ 3,235,074 $ 3,087,008 $ 3,043,985
Net (Expenses)/Revenues
Governmental activities (3,055,309) (3,011,499) (2,924,020) (2,870,645) (3,055,610) (3,495,184) (3,350,992) (3,173,294) (2,908,420) (2,777,495)Business-type activities 378,263 326,656 296,653 173,358 130,092 261,393 292,919 305,354 263,082 213,176
Total primary government net expenses $ (2,677,046) $ (2,684,843) $ (2,627,367) $ (2,697,287) $ (2,925,518) $ (3,233,791) $ (3,058,073) $ (2,867,940) $ (2,645,338) $ (2,564,319)
(continued)
Fiscal Year
20042008
State of Rhode Island and Providence PlantationsSchedule of Changes in Net Position
Last Ten Fiscal Years(accrual basis of accounting)
(expressed in thousands)
2013 2012 200520092011 2010 2007 2006
161
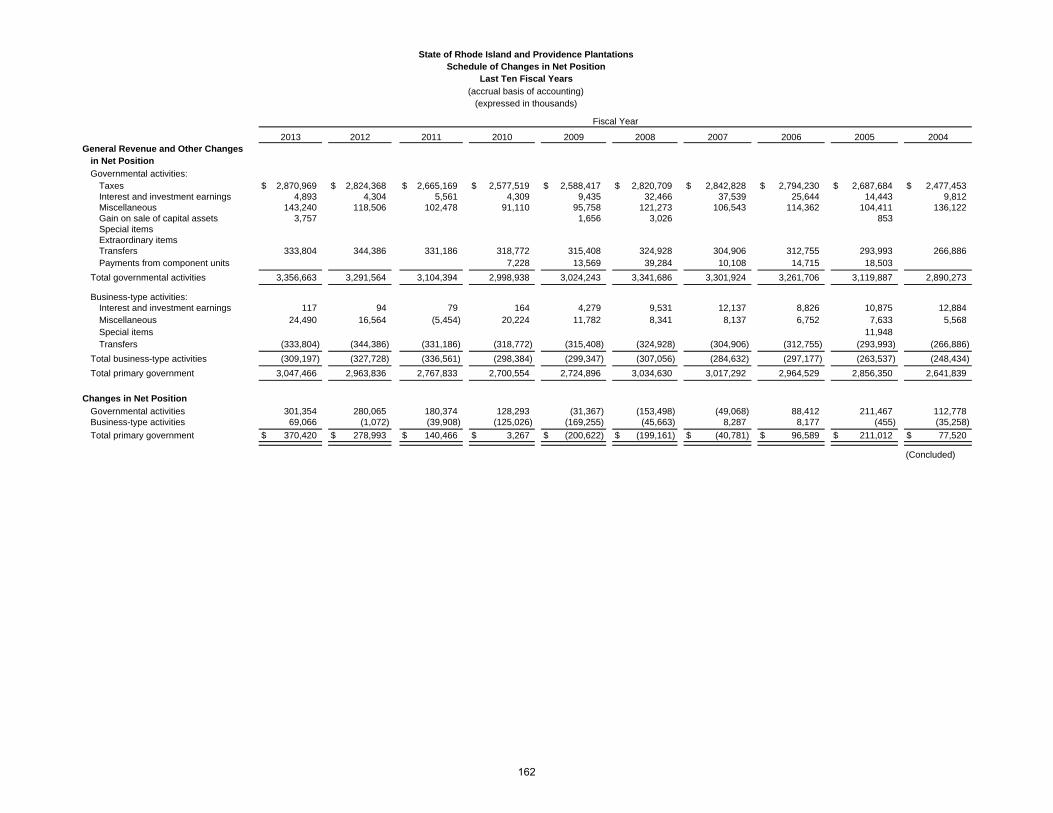
Fiscal Year
20042008
State of Rhode Island and Providence PlantationsSchedule of Changes in Net Position
Last Ten Fiscal Years(accrual basis of accounting)
(expressed in thousands)
2013 2012 200520092011 2010 2007 2006General Revenue and Other Changes
in Net Position
Governmental activities:Taxes $ 2,870,969 $ 2,824,368 $ 2,665,169 $ 2,577,519 $ 2,588,417 $ 2,820,709 $ 2,842,828 $ 2,794,230 $ 2,687,684 $ 2,477,453Interest and investment earnings 4,893 4,304 5,561 4,309 9,435 32,466 37,539 25,644 14,443 9,812Miscellaneous 143,240 118,506 102,478 91,110 95,758 121,273 106,543 114,362 104,411 136,122Gain on sale of capital assets 3,757 1,656 3,026 853Special itemsExtraordinary itemsTransfers 333,804 344,386 331,186 318,772 315,408 324,928 304,906 312,755 293,993 266,886Payments from component units 7,228 13,569 39,284 10,108 14,715 18,503
Total governmental activities 3,356,663 3,291,564 3,104,394 2,998,938 3,024,243 3,341,686 3,301,924 3,261,706 3,119,887 2,890,273
Business-type activities:Interest and investment earnings 117 94 79 164 4,279 9,531 12,137 8,826 10,875 12,884Miscellaneous 24,490 16,564 (5,454) 20,224 11,782 8,341 8,137 6,752 7,633 5,568Special items 11,948Transfers (333,804) (344,386) (331,186) (318,772) (315,408) (324,928) (304,906) (312,755) (293,993) (266,886)
Total business-type activities (309,197) (327,728) (336,561) (298,384) (299,347) (307,056) (284,632) (297,177) (263,537) (248,434)
Total primary government 3,047,466 2,963,836 2,767,833 2,700,554 2,724,896 3,034,630 3,017,292 2,964,529 2,856,350 2,641,839
Changes in Net Position
Governmental activities 301,354 280,065 180,374 128,293 (31,367) (153,498) (49,068) 88,412 211,467 112,778Business-type activities 69,066 (1,072) (39,908) (125,026) (169,255) (45,663) 8,287 8,177 (455) (35,258)
Total primary government $ 370,420 $ 278,993 $ 140,466 $ 3,267 $ (200,622) $ (199,161) $ (40,781) $ 96,589 $ 211,012 $ 77,520
(Concluded)
162

General FundNonspendable $ $ $ 53,353 $ 49,302Restricted 282,137 232,348 197,885 161,904Unrestricted
Committed 4,035 22,793 5,956 4,285Assigned 105,639 97,639 8,425Unassigned 9,323 20,374 5,281 (30,041)
Total General Fund $ 401,134 $ 373,154 $ 270,900 $ 185,450
All Other Governmental FundsNonspendable $ 174 $ 174 $ 174 $ 174Restricted 660,198 619,799 528,251 681,782Unrestricted
Committed 163 1,742 1,448 3,366Assigned 255 318 284 19,704Unassigned (4,113) (4,717) (5,043) (6,160)
Total All Other Governmental Funds $ 656,677 $ 617,316 $ 525,114 $ 698,866
General FundReserved $ 132,245 $ 149,605 $ 144,166 $ 164,866 $ 146,103 $ 131,843Unreserved (62,286) (42,950) 38,331 38,699 24,451
Total General Fund $ 69,959 $ 106,655 $ 144,166 $ 203,197 $ 184,802 $ 156,294
All Other Governmental FundsReserved $ 274,180 $ 264,727 $ 260,607 $ 220,612 $ 224,483 $ 217,048Unreserved, reported in:
Special Revenue Funds 93,498 7,805 155,482 22,759 32,588 36,458Permanent Funds 1,368 2,173 1,186 988 917 875Capital Projects Funds 459,489 303,965 360,026 469,018 388,829 298,920
Total All Other Governmental Funds $ 828,535 $ 578,670 $ 777,301 $ 713,377 $ 646,817 $ 553,301
*Beginning in fiscal year 2010, the fund balance categories were reclassified as a result of implementingGASB Statement 54. Fund Balance has not been reclassified for prior years.
The 2012 other governmental funds were restated as fully explained in Note 18 (F).
Fiscal Year
Fiscal Year
2013 2012* 2011 2010
2008 20042009 2007 2006 2005
(expressed in thousands)
State of Rhode Island and Providence PlantationsSchedule of Fund Balances of Governmental Funds
Last Ten Fiscal Years(modified accrual basis of accounting)
163

Revenues:Taxes $ 2,868,503 $ 2,814,331 $ 2,664,420 $ 2,577,406 $ 2,589,751 $ 2,818,085 $ 2,848,284 $ 2,792,961 $ 2,687,482 $ 2,477,878Licenses, fines, sales, and services 320,767 313,724 308,564 311,040 295,662 323,329 242,743 253,857 238,344 242,280Departmental restricted revenue 222,027 194,279 174,563 150,357 134,029 125,883 110,059 105,181 113,589 107,407Federal grants 2,402,444 2,411,262 2,541,335 2,518,048 2,218,816 1,936,610 1,869,336 1,962,375 1,884,104 1,847,200Income from investments 4,840 4,280 5,537 4,207 9,014 31,522 36,068 24,941 13,770 10,310Other revenues 147,090 121,202 100,164 93,687 104,665 122,723 103,099 107,475 115,955 118,442
Total operating revenues 5,965,671 5,859,078 5,794,583 5,654,745 5,351,937 5,358,152 5,209,589 5,246,790 5,053,244 4,803,517Expenditures:
Current:General government 634,010 635,554 620,110 714,861 755,366 803,561 806,865 515,677 512,896 461,741Human services 3,042,705 2,969,166 3,009,097 2,884,419 2,711,167 2,727,534 2,512,286 2,616,608 2,506,929 2,409,774Education 1,330,388 1,282,063 1,287,733 1,239,258 1,216,208 1,289,687 1,267,255 284,294 265,001 72,838Public safety 463,734 459,114 428,687 394,860 401,976 410,605 396,029 361,647 328,839 311,701Natural resources 70,202 75,156 71,818 67,435 68,941 72,984 81,518 71,539 64,138 59,678Transportation 373,887 399,512 367,496 306,730 299,881 244,638 310,019 247,248 209,470 161,974
Capital outlays 130,415 111,044 138,843 250,653 215,600 264,713 269,550 300,404 241,306 200,880Intergovernmental 1,213,050 1,127,496 1,047,537Grants 6,145Debt service:
Principal 176,970 164,245 154,475 163,063 157,817 143,368 115,752 117,663 116,322 75,892Interest and other charges 126,852 135,806 138,066 139,723 132,813 131,575 128,527 105,264 110,243 107,720
Total operating expenditures 6,349,163 6,231,660 6,216,325 6,161,002 5,959,769 6,088,665 5,887,801 5,833,394 5,482,640 4,915,880
Excess (deficiency) of revenuesover (under) expenditures (383,492) (372,582) (421,742) (506,257) (607,832) (730,513) (678,212) (586,604) (429,396) (112,363)
(Continued)
2008 2007 2006 2005
Fiscal Year
2013 2012 2011 2010 2009 2004
(expressed in thousands)
State of Rhode Island and Providence Plantations
Schedule of Changes in Fund Balances of Governmental Funds
Last Ten Fiscal Years
(modified accrual basis of accounting)
164

(expressed in thousands)
State of Rhode Island and Providence Plantations
Schedule of Changes in Fund Balances of Governmental Funds
Last Ten Fiscal Years
(modified accrual basis of accounting)
Fiscal Year
2013 2012 2011 2010 2009 20042008 2007 2006 2005
Other financing sources (uses):Bonds and notes issued 81,400 145,035 155,665 427,180 131,755 314,852 320,820 87,095 415,435Refunding bonds issued 88,175 146,730 78,960 12,445 46,570 74,835 117,010Proceeds from the sale of Certificates
of Participation 26,690 31,980 54,610 59,185 45,325 6,000 139,410Premium and accrued interest 27,507 45,437 9,839 8,100 7,241 9,930 16,298 17,602 30,097Transfers in 592,804 581,679 545,229 586,025 622,212 724,428 828,885 593,902 537,618 513,356Payments from component units 7,228 13,568 39,284 10,108 14,715 18,503 15,568Payment to refunded bonds escrow agent (101,172) (172,094) (84,769) (12,697) (111,253) (78,198) (123,300) (72,160)Discount on issuance of debt (66) (4)Transfers out (264,571) (235,253) (211,789) (261,473) (304,351) (403,012) (522,631) (280,176) (242,515) (245,246)Transfers out to component units (293,236)
Total other financing sources (uses) 450,833 543,514 333,440 491,475 821,001 494,194 683,106 671,559 551,423 363,814
Net change in fund balances $ 67,341 $ 170,932 $ (88,302) $ (14,782) $ 213,169 $ (236,319) $ 4,894 $ 84,955 $ 122,027 $ 251,451
Debt Service as a Percentage of Noncapital Expenditures 5.0% 5.0% 4.9% 5.2% 4.9% 4.6% 4.4% 4.0% 4.3% 3.9%
The capital outlay amount used to calculate the percentage is from the Reconciliation of the Statement of Revenues, Expenditures,
Capital outlay 315,644 264,770 230,746 319,509 185,636 227,169 318,076 308,051 269,228 207,520
A separate calculation has been done to obtain the interest expense.
Interest expense 125,457 131,793 137,768 138,285 126,935 127,987 126,918 NA NA NA
(Concluded)
and Changes in Fund Balances of the Governmental Funds to the Statement of Activities.
Certain prior year amounts have been reclassified to conform to the current year presentation.
165

Taxable Sales By Industry
Grocery, Food Stores, Delis, Bakeries $ 1,097.36 $ 1,091.81 $ 1,093.34 $ 1,084.78 $ 1,080.13 $ 1,073.75 $ 1,052.45 $ 1,065.10 $ 879.14 $ 818.60 Restaurants and Bars 2,113.00 1,983.05 1,939.09 1,874.93 1,860.96 1,912.54 1,803.19 1,651.39 1,616.72 1,425.54 Room Rentals - Motels, Hotels 530.74 388.82 407.15 491.30 587.55 574.25 450.46 412.93 345.85 280.21 Utilities - Telephone, Electric, Gas, Water 617.53 583.28 588.48 589.94 641.09 636.72 668.28 549.40 582.11 570.53
Total $ 4,358.63 $ 4,046.96 $ 4,028.06 $ 4,040.95 $ 4,169.73 $ 4,197.26 $ 3,974.37 $ 3,678.82 $ 3,423.82 $ 3,094.89
Direct sales tax rate 7% 7% 7% 7% 7% 7% 7% 7% 7% 7%
Data is presented only for taxable sales of industries tracked by the Division of Taxation.
State of Rhode Island and Providence PlantationsSchedule of Taxable Sales by Selected Industry
Prior Ten Calendar Years(expressed in millions)
2004 20032008 2007 2006 20052012 2011 2010 2009
Calendar Year
166
Farm Earnings $ 18 $ 15 $ 18 $ 17 $ 18 $ 23 $ 23 $ 23 $ 25 $ 24 Private Earnings Forestry, Fishing and Other (D) (D) (D) 41 41 42 43 40 42 39Mining (D) (D) (D) 13 18 24 24 20 16 14Utilities 162 165 160 151 165 155 171 133 138 143Construction 1,653 1,575 1,568 1,562 1,732 1,851 1,905 1,787 1,704 1,625Manufacturing 2,826 2,822 2,706 2,701 3,038 3,185 3,154 3,167 3,182 3,122Wholesale Trade 1,476 1,394 1,343 1,310 1,404 1,420 1,312 1,268 1,198 1,149Retail Trade 1,841 1,786 1,782 1,717 1,792 1,902 1,839 1,843 1,824 1,778Transportation and Warehousing 569 558 525 504 521 510 509 491 476 463Information 1,070 1,087 1,024 926 947 867 911 930 908 827Finance and Insurance 2,673 2,702 2,588 2,357 2,313 2,266 2,233 2,087 2,014 1,937Real Estate and Rental and Leasing 383 380 371 363 390 417 475 492 481 425Professional, scientific, and technical services 2,418 2,305 2,251 2,189 2,408 2,297 2,282 1,986 1,893 1,725Management of companies and enterprises 1,345 1,247 1,164 1,052 1,196 1,131 1,068 939 862 854Administrative and waste services 1,090 1,046 1,000 944 980 971 955 914 856 757Educational services 1,232 1,239 1,203 1,201 1,134 1,068 1,003 935 897 818Health care and social assistance 4,605 4,594 4,532 4,339 4,207 4,015 3,895 3,707 3,559 3,339Arts, entertainment, and recreation 304 296 286 278 286 319 292 269 252 245Accommodation and food services 1,038 995 951 901 942 960 913 906 892 845Other services, except public administration 1,078 1,060 1,027 1,000 1,030 1,070 1,054 1,040 978 932Government and Government Enterprises Federal/Civilian 1,203 1,200 1,193 1,126 1,067 1,044 1,013 959 941 870Military 645 636 633 609 578 541 497 505 486 469State and Local 3,957 3,931 3,856 3,829 3,869 3,730 3,586 3,413 3,268 3,204
Total Personal Income by Industry* $ 31,636 $ 31,097 $ 30,242 $ 29,131 $ 30,075 $ 29,807 $ 29,157 $ 27,853 $ 26,893 $ 25,604
* Total Personal Income by Industry may not sum due to inclusion of non-disclosed data in total amount.
Various calendar years may differ from the amounts presented in the same tables in the June 30, 2012 CAFR, as a result of revised data.
Source: US Bureau of Economic Analysis (D) Not shown to avoid disclosure of confidential information.
2006 20052008 20072012 2010 20092011 2004 2003
Calendar Year
State of Rhode Island and Providence PlantationsSchedule of Personal Income by Industry
Prior Ten Calendar Years(expressed in millions)
167

Personal Income Tax (PIT) Revenue $ 1,060 $ 1,021 $ 898 $ 941 $ 1,074 $ 1,065 $ 997 $ 979 $ 870 $ 813Personal Income 47,253 46,125 44,207 42,631 44,122 42,661 40,664 38,570 37,585 35,866PIT Revenue as a Percent of Personal Income 2.24% 2.21% 2.03% 2.21% 2.43% 2.50% 2.45% 2.54% 2.31% 2.27%
Amounts may differ from the amounts presented in the same tables in the June 30, 2012 CAFR, as a result of revised data.
Source: Office of Revenue AnalysisIncludes wages, interest, dividends, rents,pensions and transfer payments.
2004 20032009 2008 2007 20062012 2011 2010 2005Fiscal Year
Schedule of Personal Income Tax Revenue as a Percent of Personal IncomePrior Ten Fiscal Years(expressed in millions)
168

Tax Year 2012All Filing Status Types Tax Rate 3.75% 4.75% 5.99%
Income Bracket $ 0 - 57,150 $57,150 - $129,900 over $129,900
Tax Year 2011All Filing Status Types Tax Rate 3.75% 4.75% 5.99%
Income Bracket $ 0 - 55,000 $ 55,000 - 125,000 over $125,000
Alternative Flat Tax Repealed for tax years beginning after December 31, 2010.
Tax Year 2010Single Filing Status Tax Rate 3.75% 7.00% 7.75% 9.00% 9.90%
Income Bracket $ 0 - 34,000 $34,000 - 82,400 $82,400 - 171,850 $171,850 - 373,650 over $ 373,650
Married Filing Joint Filing Status Tax Rate 3.75% 7.00% 7.75% 9.00% 9.90%Income Bracket $ 0 - 56,800 $ 56,800 - 137,300 $ 137,300 - 209,250 $ 209,250 - 373,650 over $ 373,650
Married Filing Separate Filing Status Tax Rate 3.75% 7.00% 7.75% 9.00% 9.90%Income Bracket $ 0 - 28,400 $ 28,400 - 68,650 $ 68,650 - 104,625 $104,625 - 186,825 over $ 186,825
Head of Household Filing Status Tax Rate 3.75% 7.00% 7.75% 9.00% 9.90%Income Bracket $ 0 - 45,550 $ 45,550 - 117,650 $ 117,650 - 190,550 $ 190,550 - 373,650 over $373,650
Alternative Flat Tax Tax Rate 6.00% on modified federal adjusted gross income over $ 0
Tax Year 2009Single Filing Status Tax Rate 3.75% 7.00% 7.75% 9.00% 9.90%
Income Bracket $ 0 - 33,950 $ 33,950 - 82,250 $ 82,250 - 171,550 $ 171,550 - 372,950 over $ 372,950
Married Filing Joint Filing Status Tax Rate 3.75% 7.00% 7.75% 9.00% 9.90%Income Bracket $ 0 - 56,700 $ 56,700 - 137,050 $ 137,050 - 208,850 $ 208,850 - 372,950 over $ 372,950
Married Filing Separate Filing Status Tax Rate 3.75% 7.00% 7.75% 9.00% 9.90%Income Bracket $ 0 - 28,350 $ 28,350 - 68,525 $ 68,525 - 104,425 $104,425 - 186,475 over $ 186,475
Head of Household Filing Status Tax Rate 3.75% 7.00% 7.75% 9.00% 9.90%Income Bracket $ 0 - 45,500 $ 45,500 - 117,450 $ 117,450 - 190,200 $ 190,200 - 372,950 over $372,950
Alternative Flat Tax Tax Rate 6.50% on modified federal adjusted gross income over $ 0
Tax Year 2008Single Filing Status Tax Rate 3.75% 7.00% 7.75% 9.00% 9.90%
Income Bracket $ 0 - 32,550 $32,500 - 78,850 $ 78,850 - 164,550 $ 164,550 - 357,700 over $ 357,700
Married Filing Joint Filing Status Tax Rate 3.75% 7.00% 7.75% 9.00% 9.90%Income Bracket $ 0 - 54,400 $ 54,400 - 131,450 $ 131,450 - 200,300 $ 200,300 - 357,700 over $ 357,700
Married Filing Separate Filing Status Tax Rate 3.75% 7.00% 7.75% 9.00% 9.90%Income Bracket $ 0 - 27,200 $ 27,200 - 65,725 $ 65,725 - 100,150 $100,150 - 178,850 over $ 178,850
Head of Household Filing Status Tax Rate 3.75% 7.00% 7.75% 9.00% 9.90%Income Bracket $ 0 - 43,650 $ 43,650 - 112,650 $ 112,650 - 182,400 $ 182,400 - 357,700 over $357,700
Alternative Flat Tax Tax Rate 7.00% on modified federal adjusted gross income over $ 0
Tax Year 2007Single Filing Status Tax Rate 3.75% 7.00% 7.75% 9.00% 9.90%
Income Bracket $ 0 - 31,850 $31,850 - 77,100 $ 77,100 - 160,850 $ 160,850 - 349,700 over $ 349,700
Married Filing Joint Filing Status Tax Rate 3.75% 7.00% 7.75% 9.00% 9.90%Income Bracket $ 0 - 53,150 $ 53,150 - 128,500 $ 128,500 - 195,850 $ 195,850 - 349,700 over $ 349,700
Married Filing Separate Filing Status Tax Rate 3.75% 7.00% 7.75% 9.00% 9.90%Income Bracket $ 0 - 26,575 $ 26,575 - 64,250 $ 64,250 - 97,925 $ 97,925 - 174,850 over $ 174,850
Head of Household Filing Status Tax Rate 3.75% 7.00% 7.75% 9.00% 9.90%Income Bracket $ 0 - 42,650 $ 42,650 - 110,100 $ 110,100 - 178,350 $ 178,350 - 349,700 over $ 349,700
Alternative Flat Tax Tax Rate 7.50% on modified federal adjusted gross income over $ 0(continued)
State of Rhode Island and Providence PlantationsSchedule of Personal Income Tax Rates
Prior Ten Calendar Years
Tax Rates on the Portion of Taxable Income in Ranges
169

State of Rhode Island and Providence PlantationsSchedule of Personal Income Tax Rates
Prior Ten Calendar Years
Tax Rates on the Portion of Taxable Income in RangesTax Year 2006Single Filing Status Tax Rate 3.75% 7.00% 7.75% 9.00% 9.90%
Income Bracket $ 0 - 30,650 $30,650 - 74,200 $ 74,200 - 154,800 $ 154,800 - 336,550 over $ 336,550
Married Filing Joint Filing Status Tax Rate 3.75% 7.00% 7.75% 9.00% 9.90%Income Bracket $ 0 - 51,200 $ 51,200 - 123,700 $ 123,700 - 188,450 $ 188,450 - 336,550 over $ 336,550
Married Filing Separate Filing Status Tax Rate 3.75% 7.00% 7.75% 9.00% 9.90%Income Bracket $ 0 - 25,600 $ 25,600 - 61,850 $ 61,850 - 94,225 $ 94,225 - 168,275 over $ 168,275
Head of Household Filing Status Tax Rate 3.75% 7.00% 7.75% 9.00% 9.90%Income Bracket $ 0 - 41,050 $ 41,050 - 106,000 $ 106,000 - 171,650 $ 171,650 - 336,550 over $ 336,550
Alternative Flat Tax Tax Rate 8.00% on modified federal adjusted gross income over $ 0
Tax Year 2005Single Filing Status Tax Rate 3.75% 7.00% 7.75% 9.00% 9.90%
Income Bracket $ 0 - 29,700 $ 29,700 - 71,950 $ 71,950 - 150,150 $ 150,150 -326,450 over $ 326,450
Married Filing Joint Filing Status Tax Rate 3.75% 7.00% 7.75% 9.00% 9.90%Income Bracket $ 0 - 49,650 $ 49,650 - 119,950 $ 119,950 - 182,800 $ 182,800 - 326,450 over $ 326,450
Married Filing Separate Filing Status Tax Rate 3.75% 7.00% 7.75% 9.00% 9.90%Income Bracket $ 0 - 24,825 $ 24,825 - 59,975 $ 59,975 - 91,400 $ 91,400 - 163,225 over $ 163,225
Head of Household Filing Status Tax Rate 3.75% 7.00% 7.75% 9.00% 9.90%Income Bracket $ 0 - 39,800 $ 39,800 - 102,800 $ 102,800 - 166,450 $ 166,450 - 326,450 over $ 326,450
Tax Year 2004Single Filing Status Tax Rate 3.75% 7.00% 7.75% 9.00% 9.90%
Income Bracket $ 0 - 29,050 $ 29,050 - 70,350 $ 70,350 - 146,750 $ 146,750 - 319,100 over $ 319,100
Married Filing Joint Filing Status Tax Rate 3.75% 7.00% 7.75% 9.00% 9.90%Income Bracket $ 0 - 48,500 $ 48,500 - 117,250 $ 117,250 - 178,650 $ 178,650 - 319,100 over $ 319,100
Married Filing Separate Filing Status Tax Rate 3.75% 7.00% 7.75% 9.00% 9.90%Income Bracket $ 0 - 24,250 $ 24,250 - 58,625 $ 58,625 - 89,325 $ 89,325 - 159,550 over $ 159,550
Head of Household Filing Status Tax Rate 3.75% 7.00% 7.75% 9.00% 9.90%Income Bracket $ 0 - 38,900 $ 38,900 - 100,500 $ 100,500 - 162,700 $ 162,700 - 319,100 over $ 319,100
Tax Year 2003Single Filing Status Tax Rate 3.75% 7.00% 7.75% 9.00% 9.90%
Income Bracket $ 0 - 28,400 $ 28,400 - 68,800 $ 68,800 - 143,500 $ 143,500 - 311,950 over $ 311,950
Married Filing Joint Filing Status Tax Rate 3.75% 7.00% 7.75% 9.00% 9.90%Income Bracket $ 0 - 47,450 $ 47,450 - 114,650 $ 114,650 - 174,700 $ 174,700 - 311,950 over $ 311,950
Married Filing Separate Filing Status Tax Rate 3.75% 7.00% 7.75% 9.00% 9.90%Income Bracket $ 0 -23,725 $ 23,725 - 57,325 $ 57,325 - 87,350 $ 87,350 - 155,975 over $ 155,975
Head of Household Filing Status Tax Rate 3.75% 7.00% 7.75% 9.00% 9.90%Income Bracket $ 0 - 38,050 $ 38,050 - 98,250 $ 98,250 - 159,100 $ 159,100 - 311,950 over $ 311,950
Source: Department of Revenue - Division of Taxation (concluded)
170

State of Rhode Island and Providence PlantationsSchedule of Resident Personal Income Tax Filers & Liability by AGI
Tax Years 2003 through 2011Tax Year 2011
Number of Percentage of Personal Income PercentageFederal AGI Filers Total Tax Liability of Total
$0 - $25,000 187,194 38.93% 16,926,831 1.75%$25,001 - $50,000 113,669 23.64% 85,575,958 8.82%$50,001 - $75,000 67,075 13.95% 108,935,845 11.23%$75,001 - $100,000 42,991 8.94% 109,489,374 11.29%$100,001 - $200,000 56,062 11.66% 270,444,262 27.88%$200,001 - $500,000 11,501 2.39% 171,575,565 17.69%$500,001 - $1,000,000 1,582 0.33% 61,270,009 6.32%$1,000,001 and greater 714 0.15% 145,706,695 15.02%
480,788 100.00% $ 969,924,538 100.00%
Tax Year 2010
Number of Percentage of Personal Income PercentageFederal AGI Filers Total Tax Liability of Total
$0 - $25,000 179,885 38.65% $ 20,705,060 2.32%$25,001 - $50,000 112,371 24.14% 86,321,200 9.65%$50,001 - $75,000 66,255 14.24% 111,244,636 12.44%$75,001 - $100,000 41,956 9.01% 109,185,357 12.21%$100,001 - $200,000 52,857 11.36% 271,103,111 30.32%$200,001 - $500,000 10,147 2.18% 146,038,132 16.33%$500,001 - $1,000,000 1,337 0.29% 46,337,234 5.18%$1,000,001 and greater 626 0.13% 103,258,427 11.55%
465,434 100.00% $ 894,193,156 100.00%
Tax Year 2009
Number of Percentage of Personal Income PercentageFederal AGI Filers Total Tax Liability of Total
$0 - $25,000 183,393 38.55% $ 21,961,360 2.34%$25,001 - $50,000 115,125 24.20% 90,541,402 9.63%$50,001 - $75,000 68,636 14.43% 114,674,809 12.20%$75,001 - $100,000 43,504 9.14% 113,195,561 12.05%$100,001 - $200,000 52,290 10.99% 265,674,573 28.28%$200,001 - $500,000 10,588 2.23% 160,823,729 17.11%$500,001 - $1,000,000 1,541 0.32% 63,650,231 6.77%$1,000,001 and greater 682 0.14% 109,196,985 11.62%
475,759 100.00% $ 939,718,650 100.00%
Tax Year 2008
Number of Percentage of Personal Income PercentageFederal AGI Filers Total Tax Liability of Total
$0 - $25,000 181,203 38.51% $ 21,745,670 2.36%$25,001 - $50,000 113,942 24.22% 89,681,972 9.73%$50,001 - $75,000 67,994 14.45% 113,636,913 12.33%$75,001 - $100,000 43,135 9.17% 112,257,494 12.18%$100,001 - $200,000 51,738 11.00% 262,885,354 28.55%$200,001 - $500,000 10,362 2.20% 157,222,123 17.06%$500,001 - $1,000,000 1,471 0.31% 60,830,316 6.60%$1,000,001 and greater 639 0.14% 103,054,792 11.19%
470,484 100.00% $ 921,314,634 100.00%
(continued)
171

State of Rhode Island and Providence PlantationsSchedule of Resident Personal Income Tax Filers & Liability by AGI
Tax Years 2003 through 2011Tax Year 2007
Number of Percentage of Personal Income PercentageFederal AGI Filers Total Tax Liability of Total
$0 - $25,000 188,813 39.06% $ 23,474,554 2.31%$25,001 - $50,000 117,159 24.23% 93,066,232 9.14%$50,001 - $75,000 69,086 14.29% 115,072,079 11.30%$75,001 - $100,000 43,392 8.98% 113,148,145 11.11%$100,001 - $200,000 51,045 10.56% 257,934,287 25.33%$200,001 - $500,000 11,187 2.31% 169,393,520 16.64%$500,001 - $1,000,000 1,769 0.37% 72,958,570 7.17%$1,000,001 and greater 981 0.20% 173,123,590 17.00%
483,432 100.00% $ 1,018,170,977 100.00%
Tax Year 2006
Number of Percentage of Personal Income PercentageFederal AGI Filers Total Tax Liability of Total
$0 - $25,000 186,777 39.29% $ 24,824,956 2.41%$25,001 - $50,000 117,943 24.81% 95,815,612 9.30%$50,001 - $75,000 68,647 14.45% 115,882,393 11.25%$75,001 - $100,000 42,285 8.90% 112,897,362 10.96%$100,001 - $200,000 46,714 9.83% 242,469,428 23.55%$200,001 - $500,000 10,339 2.17% 163,620,232 15.89%$500,001 - $1,000,000 1,735 0.36% 77,989,258 7.57%$1,000,001 and greater 917 0.19% 196,446,444 19.07%
475,357 100.00% $ 1,029,945,685 100.00%
Tax Year 2005
Number of Percentage of Personal Income PercentageFederal AGI Filers Total Tax Liability of Total
$0 - $25,000 191,229 40.42% $ 26,586,050 2.73%$25,001 - $50,000 117,944 24.92% 97,782,614 10.05%$50,001 - $75,000 68,732 14.53% 117,073,474 12.03%$75,001 - $100,000 40,758 8.62% 111,028,948 11.41%$100,001 - $200,000 42,311 8.94% 222,774,255 22.88%$200,001 - $500,000 9,644 2.04% 157,005,466 16.13%$500,001 - $1,000,000 1,655 0.35% 76,436,571 7.85%$1,000,001 and greater 828 0.18% 164,689,396 16.92%
473,101 100.00% $ 973,376,774 100.00%
Tax Year 2004
Number of Percentage of Personal Income PercentageFederal AGI Filers Total Tax Liability of Total
$0 - $25,000 189,685 40.73% $ 27,587,679 2.95%$25,001 - $50,000 117,704 25.28% 99,789,134 10.66%$50,001 - $75,000 68,652 14.74% 119,176,017 12.73%$75,001 - $100,000 39,892 8.57% 111,753,322 11.94%$100,001 - $200,000 39,187 8.42% 211,965,822 22.65%$200,001 - $500,000 8,440 1.81% 140,618,508 15.02%$500,001 - $1,000,000 1,397 0.30% 66,373,763 7.09%$1,000,001 and greater 695 0.15% 158,789,344 16.96%
465,652 100.00% $ 936,053,589 100.00%
Tax Year 2003
Number of Percentage of Personal Income PercentageFederal AGI Filers Total Tax Liability of Total
$0 - $25,000 194,616 41.66% $ 29,266,575 3.46%$25,001 - $50,000 120,459 25.80% 103,175,468 12.21%$50,001 - $75,000 68,669 14.71% 119,334,886 14.13%$75,001 - $100,000 38,272 8.20% 107,970,871 12.78%$100,001 - $200,000 35,845 7.68% 194,686,587 23.05%$200,001 - $500,000 7,390 1.58% 125,658,653 14.88%$500,001 - $1,000,000 1,169 0.25% 55,571,047 6.58%$1,000,001 and greater 543 0.12% 109,019,775 12.91%
466,963 100.00% $ 844,683,862 100.00%
This information was not available prior to 2003. (concluded)
172

Governmental ActivitiesGeneral obligation bonds $ 1,103,945 $ 1,110,585 $ 1,049,400 $ 1,118,030 $ 1,036,189 $ 997,398 $ 916,531 $ 848,666 $ 810,485 $ 770,070Revenue bonds (blended component units) 765,161 779,426 795,161 807,731 828,481 867,776 902,871 729,695 749,445 766,410Capital leases 232,975 233,800 224,045 244,805 269,340 236,060 256,865 226,755 232,464 102,885Special purpose bonds (a) 468,730 519,060 567,190 613,355 658,550 358,065 390,110 418,300 228,305 264,210
Total governmental activities 2,570,811 2,642,871 2,635,796 2,783,921 2,792,560 2,459,299 2,466,377 2,223,416 2,020,699 1,903,575
Business-type ActivitiesRevenue bonds 236,960 250,510 259,620 268,280 275,810 270,960 279,935 287,185 202,855 302,320Other debt 153
Total business-type activities 236,960 250,510 259,620 268,280 275,810 270,960 279,935 287,185 202,855 302,473
Total primary government $ 2,807,771 $ 2,893,381 $ 2,895,416 $ 3,052,201 $ 3,068,370 $ 2,730,259 $ 2,746,312 $ 2,510,601 $ 2,223,554 $ 2,206,048
Debt as a Percentage of Personal Income 5.9% 6.1% 6.3% 7.1% 7.1% 6.9% 6.2% 6.3% 5.9% 6.0%Amount of Debt Per Capita $ 3 $ 3 $ 3 $ 3 $ 3 $ 3 $ 3 $ 2 $ 2 $ 2
(a) Special purpose bonds were first sold in 2004.
2013 2008
Fiscal Year
State of Rhode Island and Providence PlantationsSchedule of Ratios of Outstanding Debt by Type
Last Ten Fiscal Years(expressed in thousands)
2004200520112012 2006200720092010
173

Revenue Bonds-Tobacco Settlement Finance CorporationRevenue - Tobacco Settlement Revenue $ 46,692 $ 49,944 $ 50,166 $ 48,620 $ 58,039 $ 53,247 $ 44,025 $ 41,546 $ 45,831 $ 45,644Less: operating expenses 33 74 74 69 99 33 54 40 65 80
Net available revenue $ 46,659 $ 49,870 $ 50,092 $ 48,551 $ 57,940 $ 53,214 $ 43,971 $ 41,506 $ 45,766 $ 45,564
Debt servicePrincipal (b) $ 14,265 $ 15,735 $ 12,570 $ 14,710 $ 16,620 $ 16,620 $ $ $ $Interest 36,085 37,029 37,783 38,614 40,918 40,918 41,287 41,609 42,015 42,234
Coverage (a) 92.67% 94.52% 99.48% 91.05% 100.70% 92.48% 106.50% 99.75% 108.93% 107.88%
Revenue Bonds-GARVEE (Federal Highway)Revenue - FHWA participation $ 48,382 $ 48,382 $ 48,389 $ 48,391 $ 43,646 $ 44,147 $ 44,182 $ 41,801 $ 41,809 $
Net available revenue $ 48,382 $ 48,382 $ 48,389 $ 48,391 $ 43,646 $ 44,147 $ 44,182 $ 41,801 $ 41,809 $ 0
Debt servicePrincipal $ 31,075 $ 29,590 $ 28,205 $ 26,910 $ 28,315 $ 28,315 $ 24,560 $ 32,290 $ 30,755 $Interest 17,308 18,792 20,184 21,481 15,895 15,895 19,650 9,517 11,054 6,141
Coverage (a) 100.00% 100.00% 100.00% 100.00% 98.72% 99.86% 99.94% 99.99% 100.00% 0.00%
Revenue Bonds-GARVEE (Gas Tax)Revenue - 2 cents per gallon of the gasoline tax $ 8,275 $ 8,412 $ 8,421 $ 8,579 $ 8,656 $ 9,028 $ 9,409 $ 9,496 $ 9,513 $ 9,499
Net available revenue $ 8,275 $ 8,412 $ 8,421 $ 8,579 $ 8,656 $ 9,028 $ 9,409 $ 9,496 $ 9,513 $ 9,499
Debt servicePrincipal $ 3,840 $ 3,710 $ 3,585 $ 3,480 $ 3,730 $ 3,730 $ 3,630 $ 5,150 $ 5,150 $ 5,625Interest 3,304 3,439 3,561 3,667 3,241 3,241 3,335 2,105 1,653 981
Coverage (a) 115.83% 117.67% 117.84% 120.04% 124.17% 129.51% 135.09% 130.89% 139.84% 143.79%
Division of Motor Vehicles Capital LeaseRevenue - $1.50 surcharge per transaction $ 1,889 $ 2,181 $ 2,098 $ 2,602
Net available revenue $ 1,889 $ 2,181 $ 2,098 $ 2,602
Debt servicePrincipal $ 1,500 1,440 1,385Interest 344 405 409
Coverage (a) 102.44% 118.21% 116.95% NA
(a) Coverage equals net available revenue divided by debt service.(b) Debt service principal represents "Turbo Maturity" redemptions, whereby TSFC is required to apply 100% of all collections that are in excess of current funding requirements to the early
redemption of the bonds. Annual revenues have been sufficient to meet scheduled debt service requirements.
Source: Department of Administration
State of Rhode Island and Providence PlantationsSchedule of Pledged Revenue Coverage
Last Ten Fiscal Years(expressed in thousands)
Current Debt Service as Reported in the Prior Year Financial Statements
2008 2007 2006 20052013 2012 2010 20092011 2004
174

(in billions)
Percent Percent Percent Percent Percent PercentChange Change Change Change Population Change Population Change
2013 $ 14,142.8 3.0% $ 49.5 2.8% $ 44,746 2.3% $ 43,848 -4.4% 316,100 0.7% 1,052 0.1%2012 13,401.9 3.5% 47.3 2.4% 42,693 2.7% 44,990 2.5% 313,914 0.7% 1,050 -0.1%
2011 12,949.9 5.2% 46.1 4.3% 41,560 4.4% 43,875 4.5% 311,592 0.7% 1,051 -0.2%2010 12,308.5 3.8% 44.2 3.7% 39,791 3.0% 42,001 3.8% 309,330 0.8% 1,053 -0.1%2009 11,852.7 -4.8% 42.6 -3.4% 38,637 -5.6% 40,460 -3.3% 306,772 0.9% 1,054 -0.1%2008 12,451.7 4.6% 44.1 3.4% 40,947 3.6% 41,822 3.7% 304,094 1.0% 1,055 -0.2%2007 11,900.6 5.7% 42.7 4.9% 39,506 4.7% 40,349 5.5% 301,231 1.0% 1,057 -0.5%2006 11,256.5 7.4% 40.7 5.4% 37,725 6.4% 38,251 5.9% 298,380 1.0% 1,063 -0.5%2005 10,476.7 5.5% 38.6 2.6% 35,452 4.6% 36,117 3.3% 295,517 0.9% 1,068 -0.6%2004 9,928.8 6.0% 37.6 4.8% 33,909 5.0% 34,976 4.5% 292,805 0.9% 1,075 0.4%
Source: United States Bureau of Economic Analysis The 2013 information is estimated by Moody's Analytics.
Number in Percent Percent Number Percent
Labor Force Change Rate Change of Sales Change
2013 556 -0.9% 9.1% -12.5% 10,528 16.8%2012 560 -0.5% 10.4% -7.1% 8,727 -9.0%
2011 563 -1.7% 11.2% -3.4% 9,594 -3.6%
2010 572 0.9% 11.7% 7.3% 9,954 -10.6%
2009 567 -1.0% 10.9% 41.4% 11,128 14.5%
2008 572 -0.5% 7.7% 47.8% 9,716 -17.9%
2007 574 0.1% 5.2% 4.0% 11,837 -11.8%
2006 573 1.9% 5.0% 0.0% 13,422 -5.5%
2005 561 1.3% 5.1% -3.8% 14,205 1.2%
2004 554 -1.3% 5.2% -3.7% 14,031 10.4%
Source: This information is provided by the State's revenue estimating conference.
The 2013 information is estimated.
Amounts for various calendar years may differ from the amounts presented in the same tables in the June 30, 2012 CAFR, as a result of revised data.
Resident Population (expressed in thousands)Prior Ten Fiscal Years
United States Rhode Island
Change in Population
Civilian Labor Force Unemployment Rate Family Home Sales
Amount Amount
(in dollars)
United States Rhode Island
(in thousands)
State of Rhode Island and Providence Plantations
United States
Amount Amount
Existing Single
Rhode Island
State of Rhode Island and Providence Plantations
Schedule of Economic Indicators
Prior Ten Calendar Years
Personal Income Per Capita Personal Income
Schedule of Nominal Personal Income and Per Capita Personal IncomePrior Ten Calendar Years
175

Rank Employer Employed Percentage Rank Employer Employed Percentage
1 Lifespan 9,984 1.78% 1 Lifespan 10,082 1.80%2 CVS Corporation 6,200 1.11% 2 CVS Corporation 5,622 1.00%3 Citizens Financial Group (Royal Bank of Scotland) 5,350 0.95% 3 Care New England 5,608 1.01%4 Care New England 5,150 0.92% 4 Stop and Shop Supermarket Co., Inc. 4,555 0.80%5 Brown University 4,525 0.81% 5 Brown University 4,450 0.79%6 Roman Catholic Diocese of Providence 3,600 0.64% 6 Citizens Financial Group (Royal Bank of Scotland) 4,100 0.73%7 CharterCare Health Partners 3,091 0.55% 7 Fleet Financial Corp 3,967 0.71%8 Bank of America 3,000 0.54% 8 The Jan Companies 3,465 0.62%9 Fidelity Investments 3,000 0.54% 9 Shaw's Super Market 2,100 0.37%
10 Naval Undersea Warfare Center 2,752 0.49% 10 General Dynamics 2,075 0.37%
Total employment 560,428 Total employment 561,000
Source:Rhode Island Economic Development Corporation. Some employers are not listed because they did not wish to participate.
Source:2012 information is provided by Providence Business News Book of Lists.
State of Rhode Island and Providence PlantationsPrincipal Employers
2012 and 2003
20032012
176

State of Rhode Island and Providence PlantationsFull Time State Employees by Function
Last Ten Fiscal Years
2013 2012 2011 2010 2009 2008 2007 2006 2005 2004
Full-time Employees`
General Government 2,414 2,337 2,561 2,533 2,474 2,508 2,479 2,480 2,531 2,528Human Services 3,273 3,118 3,247 3,125 3,164 3,671 4,144 4,370 4,176 4,269Education 370 354 358 352 343 365 373 373 364 364Public Safety 3,023 3,002 2,685 2,693 2,684 2,865 2,952 2,939 2,953 2,851Natural Resources 898 887 865 863 890 905 978 1,015 963 957Transportation 781 797 802 763 708 719 767 828 813 826
State Total 10,759 10,495 10,518 10,329 10,263 11,033 11,693 12,005 11,800 11,795
Source: Department of Administration
Full Time State Employees as of June 30
177

2012 2011 2010 2009 2008 2007 2006 2005 2004 2003General Government
Division of TaxationDollars received electronically (expressed in thousands) $2,422,640 $2,330,068 $2,242,867 $2,135,981 $2,049,159 $2,047,671 $1,920,770 $1,810,045 $1,672,875 $1,523,094Number of business transactions electronically 988,669 970,394 917,982 857,553 782,659 767,971 719,800 661,209 622,115 548,073Personal Income Tax returns filed electronically -Tax Year 463,900 451,406 442,383 379,495 349,211 289,346 246,230 217,524 185,154 128,763
Department of Labor and TrainingLabor force total (expressed in thousands) 560 566 569 567 568 577 575 565 533 538Unemployment rate (percentage) 11.1% 11.4% 11.6% 11.2% 7.8% 5.0% 5.1% 5.1% 5.2% 5.4%
Human ServicesDepartment of Children, Youth and Families
Average Number of Children in Out of Home Placement 2,116 2,249 2,201 2,410 2,729 2,436 2,517 2,346 2,331 2,227Health Department
Diagnosed AIDS cases 39 51 36 62 56 69 89 105 139 98Number of births (expressed in thousands) 12 12 12 12 13 14 13 13 14 14
EducationEnrollment - Higher Education 44,504 43,254 43,224 43,409 42,601 41,503 40,374 40,008 39,920 39,937Number of certificates and degrees awarded - Higher Education 6,804 6,500 6,516 6,255 5,754 5,518 5,418 5,404 5,567 5,330
Public SafetyDepartment of Corrections
Incarcerated offenders (male) 3,022 3,084 3,154 3,499 3,567 3,542 3,518 3,175 3,354 3,329Incarcerated offenders (female) 169 189 187 190 204 231 242 186 200 208
Natural ResourcesDepartment of Environmental Management
Hatchery fish raised and restocked (approximated in thousands) 131 114 119 136 148 140 140 140 140 140Park visitations (expressed in thousands) 3,449 5,213 5,386 5,374 5,174 5,928 6,135 6,010 5,861 5,976Recreational registrations (boats) 38,583 40,525 41,158 42,301 42,999 44,000 41,933 41,366 42,759 41,696
TransportationDepartment of Transportation
Vehicle miles traveled (expressed in millions) 7,786 7,901 8,280 8,279 8,188 8,679 8,300 8,299 8,472 8,365
Amounts for various calendar years may differ from the amounts presented in the same tables in the June 30, 2012 CAFR, as a result of revised data.
Source: Various Agencies
Fiscal Year
State of Rhode Island and Providence PlantationsSchedule of Operating Indicators by Function
Prior Ten Fiscal Years
178

2013 2012 2011 2010 2009 2008 2007 2006 2005 2004General Government
Buildings 16 16 15 14 14 15 15 17 17 17Vehicles 257 251 258 260 271 263 238 104 95 88
Human ServicesBuildings 199 196 197 201 200 199 198 197 197 197Vehicles 286 304 337 339 365 360 353 335 320 326
EducationBuildings 9 10 10 9 10 12 12 13 13 13Vehicles 13 14 19 20 20 20 19 23 26 31
Public SafetyBuildings 64 62 59 53 52 52 53 54 54 54Vehicles 643 561 604 586 614 644 580 604 586 574
Natural ResourcesBuildings 80 67 49 47 45 44 44 43 41 37Vehicles 419 426 428 420 423 414 417 431 398 412Number of state parks, beaches, bike paths 21 21 21 21 21 21 21 21 21 21Area of state parks, beaches (acres) 13,289 13,289 13,289 13,289 13,289 13,289 13,289 13,289 13,289 13,289
TransportationBuildings 23 21 19 19 19 19 19 23 22 21Vehicles 547 555 621 611 628 635 708 676 733 742Miles of state highway 1,100 1,100 1,100 1,100 1,100 1,100 1,100 1,100 1,100 1,100
Source: Department of Administration
Fiscal Year
State of Rhode Island and Providence PlantationsSchedule of Capital Asset Statistics by Function
Last Ten Fiscal Years
179

Scenes from Providence
Cover – Roger Williams monument from Prospect Park and Providence skyline
photo – Kevin M. Bernard
The Rhode Island Council on the Arts assisted in providing photos for the State of Rhode Island’s 2013 Comprehensive Annual Financial Report