Embed Size (px)
Citation preview

State of Palestine
Palestinian Central Bureau of Statistics
Labour Force Survey
(January- March, 2013) Round
(Q1/2013)
Press Report on the
Labour Force Survey Results
3112/10/11

PCBS: labour Force Survey, Q1- 2013
PAGE NUMBERS OF ENGLISH TEXT ARE PRINTED IN SQUARE BRACKETS.
TABLES ARE PRINTED IN THE ARABIC ORDER (FROM RIGHT TO LEFT).
May, 2013
All Rights Reserved.
Suggested Citation:
Palestinian Central Bureau of Statistics, 2013. Labour Force Survey: (January-
March, 2013) Round, (Q1/2013). Press Report on the Labour Force Survey Results.
Ramallah - Palestine.
All correspondence should be directed to:
Palestinian Central Bureau of Statistics
P.O.Box 1647, Ramallah, Palestine.
Tel: (972/970) 2 298 2700
Fax: (972/970) 2 298 2710
Toll free: 1800300300
E-Mail [email protected]
Web-Site: http://www.pcbs.gov.ps
This document is prepared in accordance with the standard
procedures stated in the Code of Practice for Palestine Official
Statistics 2006

PCBS: labour Force Survey, Q1- 2013
Table of contents
Page Subject
[5] Main Results
]9[Concepts and Definitions
11 Tables

PCBS: labour Force Survey, Q1- 2013
5
Main Results
The labour force participation rate of
persons aged 15 years and above was 43.4%
The number of persons participating in the
labour force in Palestine was about 1.134
million in the 1st
quarter 2013: about 750
thousand in the West Bank and about 384
thousand in Gaza Strip.
The labour force participation rate in the
West Bank was 45.0% and 40.5% in Gaza
Strip, the gap in the participation rate
between males and females still very big it
reached 69.0% for males compared with
17.1% for females.
Labour Force Participation Rate by Sex,
Q1-2011- Q1-2013
23.9% the unemployment rate among
labour force participants
Using ILO standards, the number of
unemployed was about 271 thousand in the
1st
quarter 2013: about 152 thousand in the
West Bank and about 119 thousand in Gaza
Strip.
The unemployment rate in Gaza Strip was
31.0% compared with 20.3% in the West
Bank, and the unemployment rate for males
in Palestine was 21.2% compared with 35.3%
for females.
Unemployment Rate by Region,
Q1-2011- Q1-2013
The highest unemployment rate in the
1st quarter 2013 was 41.1% among youth aged
20-24 years. For years of schooling, the
unemployment rate among females with 13
years of schooling or more was 46.7%.
The highest unemployment rates in the West
Bank governorates was in Hebron with 26.1%.
In Gaza Strip, the highest unemployment rate
were in Khan Younis and Rafah with 36.4% for
each one.
According to the relaxed definition of
unemployment in Palestine, the unemployment
rate increased from 26.7% in the 4th
quarter
2012 to 27.5% in the 1st quarter 2013.
Decreased the number of employment in
local market between the 4th
quarter 2012
and 1st quarter 2013
The number of employed in the local market
decreased from 790 thousand in the 4th
quarter
2012 to 768 thousand in the 1st
quarter 2013.
The number of employed persons in the West
Bank decreased by 31 thousand, while the
number of employed persons in Gaza Strip
increased by 10 thousands.
The services sector was the biggest employer in
the local market with 34.4% in the West Bank
and 52.5% in Gaza Strip.
66.7 69.0
14.7 17.1
0
10
20
30
40
50
60
70
80
90
Pe
rce
nta
ge
Quarter
males females
17.4
20.3
30.8 31.0
10
15
20
25
30
35
40
45
50
pe
rce
nta
ge
Quarter
PCBS: labour Force Survey, Q1- 2013
6
The public sector employed 6..6% of those
in employment: 39.3% in Gaza Strip and
66.6% in the West Bank.
The average daily wage for waged
employees in the West Bank was 88.8 NIS
compared with 65.2 NIS in Gaza Strip.
The average number of hours worked by
waged employees in the West Bank was 43.1
per week in the 4th
quarter 2012 compared
with 43.5 in the 1st quarter 2013. The average
number of days worked per month increased
from 22.0 to 22.2 over the same period. The
average number of hours worked per week in
Gaza Strip was 35.9 hours per week in the 4th
quarter 2012 compared with 36.6 in the 1st
quarter 2013, while the average number of
days worked per month increased from
23.1to 23.3 days over the same period.
Number of employed in Israel and Israeli
settlements about 93 thousand in the 1st
quarter 2012
The number of employed persons from the
West Bank employed in Israel and Israeli
settlements increased from 87 thousand in
the 4th
quarter 2012 to 93 thousand in the 1st
quarter 2013. Of these, 45 thousand had a
permit, 30 thousand worked without a permit
and 18 thousand employed persons have an
Israeli identity card or foreign passport.
The number of employees in Israeli
settlements remained at the same level
between 4th
2012 and 1st
quarter 2013 by 16
thousand workers from West Bank.
61.0% of employed in Israel and Israeli
settlements work in the construction sector.
The average daily wage for persons
employed in Israel and Israeli settlements
increased from 163.4 NIS in the 4th
quarter
2012 to 167.6 NIS in the 1st
quarter 2013.
The average number of hours worked per
week increased from 41.1 in the 4th
quarter
2012 to 43.5 in the 1st
quarter 2013. The
average number of days worked per month
decrease from 20.3 in the 4th
quarter 2012 to
20.0 in the 1st quarter 2013.
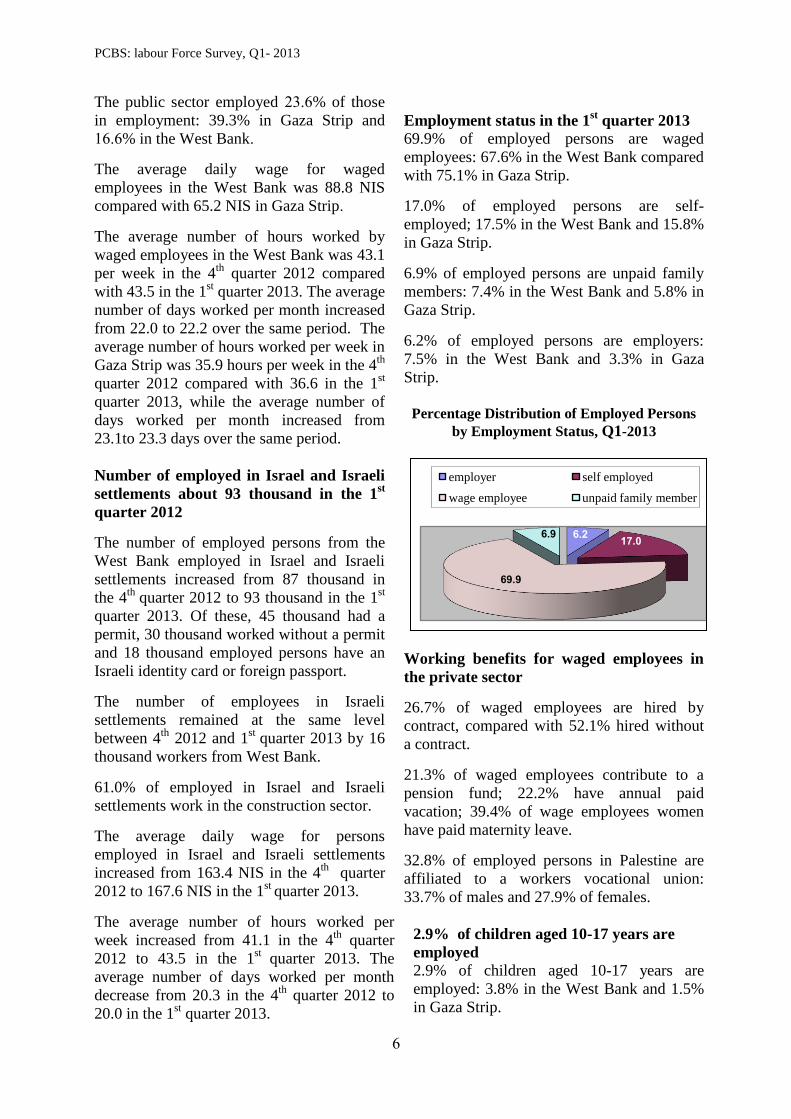
Employment status in the 1st quarter 2013
69.9% of employed persons are waged
employees: 67.6% in the West Bank compared
with 75.1% in Gaza Strip.
17.0% of employed persons are self-
employed; 17.5% in the West Bank and 15.8%
in Gaza Strip.
6.9% of employed persons are unpaid family
members: 7.4% in the West Bank and 5.8% in
Gaza Strip.
6.2% of employed persons are employers:
7.5% in the West Bank and 3.3% in Gaza
Strip.
Percentage Distribution of Employed Persons
by Employment Status, Q1-2013
Working benefits for waged employees in
the private sector
26.7% of waged employees are hired by
contract, compared with 52.1% hired without
a contract.
21.3% of waged employees contribute to a
pension fund; 22.2% have annual paid
vacation; 39.4% of wage employees women
have paid maternity leave.
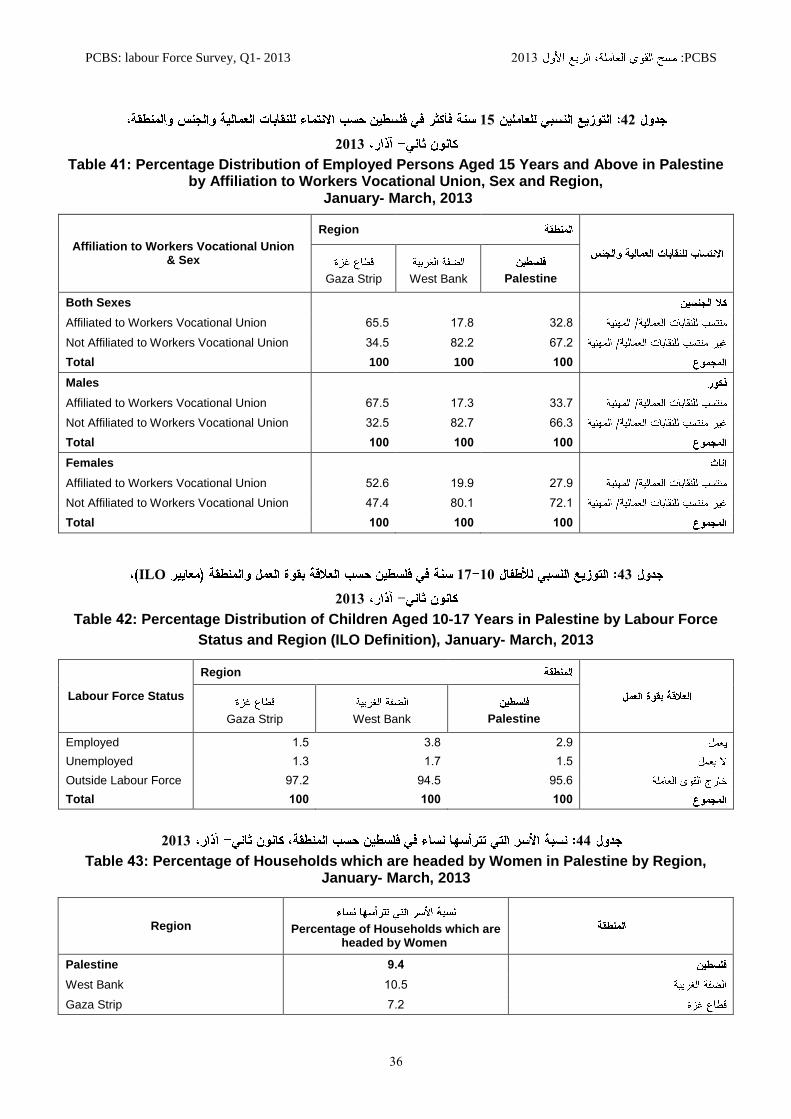
32.8% of employed persons in Palestine are
affiliated to a workers vocational union:
33.7% of males and 27.9% of females.
2.9% of children aged 10-17 years are
employed 2.9% of children aged 10-17 years are
employed: 3.8% in the West Bank and 1.5%
in Gaza Strip.
6.2 17.0
69.9
6.9
employer self employed
wage employee unpaid family member

PCBS: labour Force Survey, Q1- 2013
7
43% of wage employees in the private
sector receive less than minimum wage in
Palestine.
In the West Bank about 30.1% of wage
employees in the private sector receive less
than the minimum monthly wage. the large
number of those who receive less the
minimum monthly wage are in the north
West Bank about 31,300 person with average
monthly wage 1,062 NIS, followed by south
West Bank about 17,900 with 1,042 NIS.
In Gaza Strip the percentage of wage
employees in the private sector was 71.8%
about 63,100 wage employees with average
monthly wage 791 NIS.
All correspondence should be directed to:
Palestinian Central Bureau of Statistics
P.O.Box 1647, Ramallah, Palestine.
Tel: (972/970) 2 298 2700
Fax: (972/970) 2 298 2710
Toll free: 1800300300
E-Mail :[email protected]
Web-Site: http://www.pcbs.gov.ps

PCBS: labour Force Survey, Q1- 2013
[9]
Concepts and Definitions
Population of Working Age:
All persons aged 15 years and above. Reference Week: The week ending on Friday preceding the interviewer’s visit to the household. Labour Force:
All persons aged 15 years and above who are either employed or unemployed.
Employed: Persons aged 15 years and over who were at work at least one hour during the reference
period, or who were not at work during the reference period, but held a job or owned business
from which they were temporarily absent (because of illness, vacation, temporarily stoppage,
or any other reason) he\ she was employed, unpaid family member or other. The employed
person is normally classified in one of two categories according to the number of weekly
work hours, i.e. 1-14 work hours and 15 work hours and above. Also the absence due to sick
leave, vacation, temporarily stoppage, or any other reason considered employed from 1-14
hours. Employed persons are classified according to employment status as follows:
1. Employer 2.Self-employed 3.Employee 4.Unpaid family member Unemployed (According to the ILO Standards):
Unemployed persons are those individuals aged 15 years and above who did not work at all
during the reference period, who were not absent from a job, were available for work and
actively seeking a job during the reference period by one of the following methods news
paper, registered at employment office, ask friends or relatives or any other method.
Unemployed (According to the Relaxed Definition):
The Number Of Unemployed Persons was calculated under the definition by adding to
unemployed Persons according to the ILO Standards, those Persons outside labour force
because they were frustrated.
Underemployment:
Underemployment exists when a person’s employment is inadequate in relation to alternative
employment, account being taken of his\her occupational skills. The underemployed persons
are classified into two groups:1. Visible Underemployment: which refers to insufficient
volume of employment :Persons worked less than 35 hours during the reference week or
worked less than the normal hours of work in their occupation were considered as visibly
underemployed.2. Invisible Underemployment: refers to a misapplication of labour resources
or fundamental imbalance as between labour and other factors of production, such as
insufficient income.
Persons Outside Labour Force:
The population not economically active comprises all persons 15 years and above, who were
neither employed nor unemployed accordingly to the definitions over. Because they don’t
have any desire to work or because of the availability of another source of income.

:PCBS3102PCBS: labour Force Survey, Q1- 2013
00
111
3112
Table 1: Percentage Distribution of Persons Aged 15 Years and Above in Palestine by Labour Force Status and Region (Relaxed Definition), January- March, 2013
Region
Labour Force Status
Total Outside Labour Force In Labour Force
(%) Number (%)
ددالعNumber (%) Number
Palestine 100 2,614,800 5.45 1,425,000 45.5 1,189,200
West Bank 100 1,666,400 9.25 881,200 47.1 785,200
Gaza Strip 100 948,400 9.25 544,500 42.6 404,000
311
3112
Table 2:Percentage Distribution of Labour Force Participants Aged 15 Years and Above in Palestine by Labour Force Components and Region (Relaxed Definition),
January- March, 2013
Region
Labour Force Components
Total Unemployment Employment
(%) Number (%)
ددالعNumber (%) Number
Palestine 100 1,181,200 27.5 320,100 72.5 862,000
West Bank 100 .89,.00 23.9 187,600 76.1 597,000
Gaza Strip 100 505,000 34.5 139,300 65.5 264,.00

:PCBS3102PCBS: labour Force Survey, Q1- 2013
03
211ILO
3112
Table 3: Percentage Distribution of Persons Aged 15 Years and Above in Palestine by Labour Force Status, Region and Sex(ILO Standards), January- March, 2013
Region and Sex
Labour Force Status
Total Outside Labour Force In Labour Force
(%) Number (%)
ددالعNumber (%) Number
Palestine
Males 100 1,3.3,300 3120 510,300 0520 513,000
Females 100 1,.51,900 8.25 1,0.0,500 1.21 ..0,000
Total 100 2,01.,800 5040 1,.81,200 .04. 1,100,000
West Bank
Males 100 855,000 .82. .5.,500 .123 001,000
Females 100 8..,500 8.20 0.5,100 1820 158,300
Total 100 1,000,.00 5540 110,500 .540 9.1,100
Gaza Strip
Males 100 5.5,300 3920 10.,500 0920 311,500
Females 100 505,100 8520 350,800 1925 ..,300
Total 100 1.8,.00 5145 50.,900 .045 080,900
411ILO
3112
Table 4: Percentage Distribution of Labour Force Participants Aged 15 Years and Above in Palestine by Labour Force Components, Region and Sex (ILO Standards),
January- March, 2013
Region and Sex
Labour Force Components
Total
Unemployment
ة
Underemployment Full Employment
(%) Number (%)
ددالعNumber (%) Number (%) Number
Palestine
Males 100 513,000 .12. 153,500 028 01,.00 ..20 09.,500
Females 100 ..0,000 3923 ..,500 .20 9,000 0.21 13.,100
Total 100 1,100,000 2041 291,000 541 09,000 9042 915,000
West Bank
Males 100 001,000 1820 111,.00 021 30,.00 .923 593,.00
Females 100 158,300 ..25 50,000 .23 3,500 .023 105,300
Total 100 9.1,100 2040 152,000 540 .0,100 9.4. 559,500
Gaza Strip
Males 100 311,500 .023 81,.00 820 .9,000 092. .05,.00
Females 100 ..,300 9120 3.,300 321 .,.00 5923 3.,800
Total 100 080,900 0140 111,000 941 29,200 0141 209,500

:PCBS2013PCBS: labour Force Survey, Q1- 2013
31
5ILO
3102
Table 5: Labour Force Participation Rate and Unemployment Rate for Graduates who hold Associate Diploma Certificate and Above in Palestine by Specialization and Region (ILO Standards), January- March, 2013
Specialization
Unemployment Rate Labour Force participation Rate
Gaza StripWest
Bank Palestine
Gaza Strip
West Bank Palestine
Teacher Training and Education Science ..55 8.53 2.14 3.58 ..58 1.1.
Humanities 8353 0.58 3413 ..53 ..5. 1.14
Social and Behavioral Science 5.5. 8855 3113 3355 .35. .41.
Journalism and Information 835. - 3411 3.5. 3850 ..1.
Business and Administration 8853 0053 4.12 3850 .353 1112
Law - .58 .1. 355. .055 1.12
Life Sciences 8353 0.55 3412 385. 3.58 .311
Mathematics and Statistics 0058 0855 4.12 ..5. .358 111.
Computer Science 5050 0358 341. 385. 335. ..1.
Engineering and Engineering Occupations 805. ..58 4.12 3353 3358 ..14
Architectural and Construction 0.58 0.5. 4213 3553 3058 .314
Health 8050 .85. 4.1. 3855 ..50 ..13
Personal Services - - - - - ..1.
Other Specialization 8.5. 0055 331. 3358 ..53 1413
Total 3113 4211 3313 121. 1.1. 1214
(-): means there are no enough observations in this section

:PCBS3102PCBS: labour Force Survey, Q1- 2013
01
611ILO
3112
Table 6: Labour Force participation Rate of Persons Aged 15 Years and Above in Palestine by Age Group and Sex (ILO Standards), January- March, 2013
Age Group
Total
Sex
Females
Males
)(
15-19 1042 020 3121 19-15
20-24 .040 1.25 0823 .0-.5
25-29 5140 302. 8020 .9-.5
30-34 0040 ..23 5.20 30-35
35-39 5140 .528 5325 39-35
40-44 5841 .320 5.2. 50-55
45-49 5541 .128 8.28 59-55
50+ 004. 528 9.25 90+
Total .04. 1941 0140
711ILO
3112
Table 7: Labour Force Participation Rate of Persons Aged 15 Years and Above in Palestine by Age and Region (ILO Standards), January- March, 2013
Age Group
Region
Gaza Strip
West Bank
Palestine
15-19 1123 1523 1042 19-15
20-24 5120 592. .040 .0-.5
25-29 9.2. 0021 5140 .9-.5
30-34 0025 0020 0040 30-35
35-39 982. 0023 5140 39-35
40-44 902. 9521 5841 50-55
45-49 9128 9820 5541 59-55
50+ ..2. 3128 004. 90+
Total .045 .540 .04.
811ILO
3112
Table 8: Labour Force Participation Rate of Persons Aged 15 Years and Above in Palestine by Years of Schooling and Sex (ILO Standards), January- March, 2013
Years of Schooling
Total
Sex
Females Males
0 142 925 .12. 0
1-6 .241 1.20 052. 1- 0
7-9 .048 028 0525 .- 5
10-12 0842 023 0521 10-1.
13+ 5948 5520 .020 13+
Total .04. 1941 0140

:PCBS3102PCBS: labour Force Survey, Q1- 2013
01
911ILO
3112
Table 9: Labour Force Participation Rate of Persons Aged 15 Years and Above in Palestine by Years of Schooling and Region (ILO Standards), January- March, 2013
Years of Schooling
Region
Gaza Strip West Bank Palestine
0 525 825 142 0
1-6 5528 5.20 .241 1-0
7-9 3520 5520 .048 .-5
10-12 3121 5.23 0842 10-1.
13+ 9825 9.25 5948 13+
Total .045 .540 .04.
1111
ILO3112
Table 10: Labour Force Participation Rate and Unemployment Rate of Persons Aged 15 Years and Above in Palestine by Region, Sex and Refugee Status (ILO Standards),
January- March, 2013
Refugee Status and Region
Unemployment Rate Participation Rate
Total Females
Males
Total Females
Males
Palestine
Refugee 2140 5520 .92. .240 1028 0.2.
Non-Refugee 2040 .520 1820 ..40 1.23 0525
Total 2041 0540 2142 .04. 1941 0140
West Bank
Refugee 2.40 312. ..20 .549 1.25 .323
Non-Refugee 1841 .925 1.2. ..48 1823 .020
Total 2040 294. 1840 .540 1840 9140
Gaza Strip
Refugee 0240 9329 ..2. .041 1025 0520
Non-Refugee 2941 5025 .525 .141 1323 0.20
Total 0140 5140 2040 .045 154. 0540

:PCBS3102PCBS: labour Force Survey, Q1- 2013
01
1111
ILO3112
Table 11: Labour Force Participation Rate and Unemployment Rate of Persons Aged 15 Years and Above in Palestine by Marital Status, Region and Sex (ILO Standards),
January- March, 2013
Marital Status and Region
Unemployment Rate Participation Rate
Total Females
Males
Total Females
Males Palestine
Never Married 38.0 44.0 36.5 0045 102. 912.
Currently Married 17.2 31.9 13.9 .141 1.28 8.29
Other 21.0 20.3 22.8 1542 1.29 3823
Total 23.9 35.3 21.2 .04. 1941 0140
West Bank
Never Married 30.7 34.3 29.9 40.3 18.6 56.8
Currently Married 14.9 24.5 12.7 50.3 18.4 82.8
Other 15.1 15.1 15.2 16.3 12.9 44.2
Total 20.3 27.4 18.6 45.0 18.0 71.3
Gaza Strip
Never Married 55.5 67.5 52.5 29.9 13.5 42.6
Currently Married 21.3 45.9 16.1 49.1 16.9 81.9
Other 36.0 31.7 57.0 12.9 11.8 23.8
Total 31.0 51.6 26.3 40.5 15.4 65.0
1311
ILO3112
Table 12: Labour Force Participation Rate and Unemployment Rate for Persons Aged 15 Years and Above in Palestine by Region, Type of locality and Sex (ILO Standards),
January- March, 2013
Type of locality and Region
Unemployment Rate Participation Rate
Total Females
Males
Total Females
Males Palestine
Urban 24.1 35.9 21.2 42.9 16.7 68.7
Rural 19.2 26.5 17.4 45.8 18.7 71.4
Camps 33.2 49.1 29.1 41.8 17.1 66.3
Total 23.9 35.3 21.2 43.4 17.1 69.0
West Bank
Urban 20.3 27.9 18.5 44.5 17.7 71.0
Rural 19.2 26.3 17.4 46.2 19.0 71.8
Camps 25.9 27.1 25.6 45.1 17.7 71.9
Total 20.3 27.4 18.6 45.0 18.0 71.3
Gaza Strip
Urban 29.9 49.5 25.5 40.7 15.2 65.5
Rural 20.7 32.5 18.0 38.5 14.0 63.6
Camps 38.5 63.7 31.8 39.6 16.7 62.7
Total 31.0 51.6 26.3 40.5 15.4 65.0

:PCBS3102PCBS: labour Force Survey, Q1- 2013
01
121139ILO
3112
Table 13: Percentage Distribution of Youth Aged (15-29) Years in Palestine by Labour Force
Status, Region and Sex (ILO Standards), January- March, 2013
Labour Force Status Gaza Strip West Bank Palestine
Total Females
Males
Total Females
Males
Total Females
Males
In Labour Force 0045 1329 9.28 0142 1920 0.23 0940 1525 982.
Outside Labour Force 0045 8029 5.2. 0048 8920 3.2. 0040 8920 5123
Total 100 100 100 100 100 100 100 100 100
Full Employment .040 1825 5528 0242 5925 0021 5548 3020 0029
Underemployment 842 520 521 049 .25 .29 942 329 820
Unemployment .842 ..20 5121 0141 912. .025 0940 0029 3129
Total 100 100 100 100 100 100 100 100 100
1411ILO
3112
Table 14: Unemployment Rate of Participants in the Labour Force Aged 15 Years and Above in Palestine by Age Group and Sex (ILO Standards), January- March, 2013
Age Group Total
Sex
Females
Males
)( 15-19 .040 021 512. 19-15
20-24 .141 0020 3520 .0-.5
25-29 0148 9.29 .32. .9-.5
30-34 1942 3921 1.21 30-35
35-39 104. 192. 1.28 39-35
40-44 1248 1.20 1.28 50-55
45-49 1048 .28 1025 59-55
50+ 1248 523 1529 90+
Total 2041 0540 2142

:PCBS3102PCBS: labour Force Survey, Q1- 2013
01
1111
ILO3112
Table 15: Unemployment Rate of Participants in the Labour Force Aged 15 Years and Above in Palestine by Age and Region (ILO Standards), January- March, 2013
Age Group
Region
Gaza Strip
West Bank
Palestine
15-19 5.2. 3820 .040 19-15
20-24 9820 3120 .141 .0-.5
25-29 3525 ..25 0148 .9-.5
30-34 ..29 1520 1942 30-35
35-39 1921 1.20 104. 39-35
40-44 1920 112. 1248 50-55
45-49 1.20 1.21 1048 59-55
50+ 192. 1129 1248 90+
Total 0140 2040 2041
1611
ILO3112
Table 16: Unemployment Rate of Participants in the Labour Force Aged 15 Years and Above in Palestine by Years of Schooling and Sex (ILO Standards),
January- March, 2013
Years of Schooling Total
Sex
Females Males
0 1845 1025 .02. 0
1-6 2140 .20 .523 1-0
7-9 2148 921 .32. .-5
10-12 2140 1025 ..20 10-1.
13+ 2840 502. 1.21 13+
Total 2041 0540 2142
1711
ILO3112
Table 17: Unemployment Rate of Participants in the Labour Force Aged 15 Years and Above in Palestine by Years of Schooling and Region (ILO Standards), January- March, 2013
Years of Schooling
Region
Gaza Strip
West Bank
Palestine
0 .528 1929 1845 0
1-6 3028 1020 2140 1-0
7-9 .02. 1528 2148 .-5
10-12 ..20 1523 2140 10-1.
13+ 392. .321 2840 13+
Total 0140 2040 2041
:PCBS3102PCBS: labour Force Survey, Q1- 2013
01
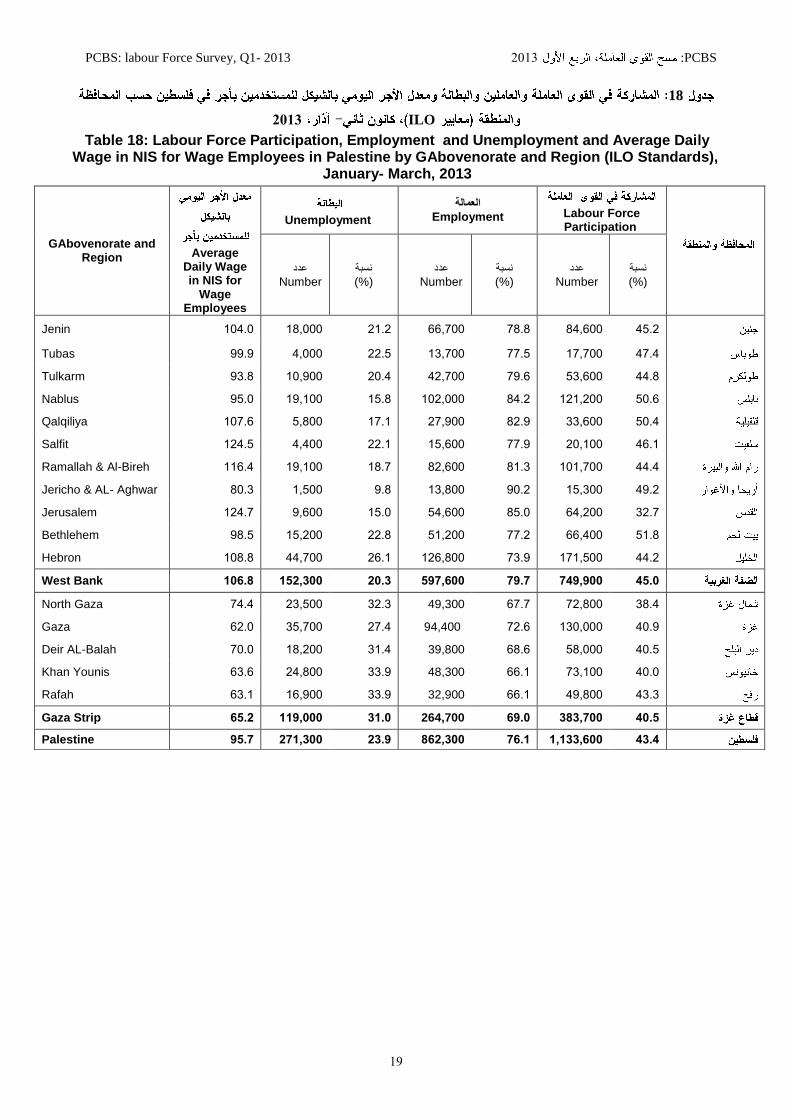
18
ILO3112
Table 18: Labour Force Participation, Employment and Unemployment and Average Daily Wage in NIS for Wage Employees in Palestine by GAbovenorate and Region (ILO Standards),
January- March, 2013
Labour Force Participation
العمالةEmployment Unemployment
Average Daily Wage in NIS for
Wage Employees
GAbovenorate and Region
نسبة(%)
عددNumber
نسبة(%)
عددNumber
نسبة(%)
عددNumber
592. 85,000 .828 00,.00 .12. 18,000 10520 Jenin
5.25 1.,.00 ..29 13,.00 ..29 5,000 5525 Tubas
5528 93,000 .520 5.,.00 .025 10,500 5328 Tulkarm
9020 1.1,.00 852. 10.,000 1928 15,100 5920 Nablus
9025 33,000 8.25 ..,500 1.21 9,800 10.20 Qalqiliya
5021 .0,100 ..25 19,000 ..21 5,500 1.529 Salfit
5525 101,.00 8123 8.,000 182. 15,100 11025 Ramallah & Al-Bireh
552. 19,300 502. 13,800 528 1,900 8023 Jericho & AL- Aghwar
3.2. 05,.00 8920 95,000 1920 5,000 1.52. Jerusalem
9128 00,500 ..2. 91,.00 ..28 19,.00 5829 Bethlehem
552. 1.1,900 .325 1.0,800 .021 55,.00 10828 Hebron
.540 9.1,100 9149 519,000 2040 152,000 10048 West Bank
3825 ..,800 0.2. 49,300 3.23 .3,900 .525 North Gaza
5025 130,000 ..20 94,400 ..25 39,.00 0.20 Gaza
5029 98,000 0820 39,800 3125 18,.00 .020 Deir AL-Balah
5020 .3,100 0021 48,300 3325 .5,800 0320 Khan Younis
5323 55,800 0021 32,900 3325 10,500 0321 Rafah
.045 080,900 0140 264,700 0140 111,000 0542 Gaza Strip
.04. 1,100,000 9041 802,000 2041 291,000 1549 Palestine
:PCBS3102PCBS: labour Force Survey, Q1- 2013
31
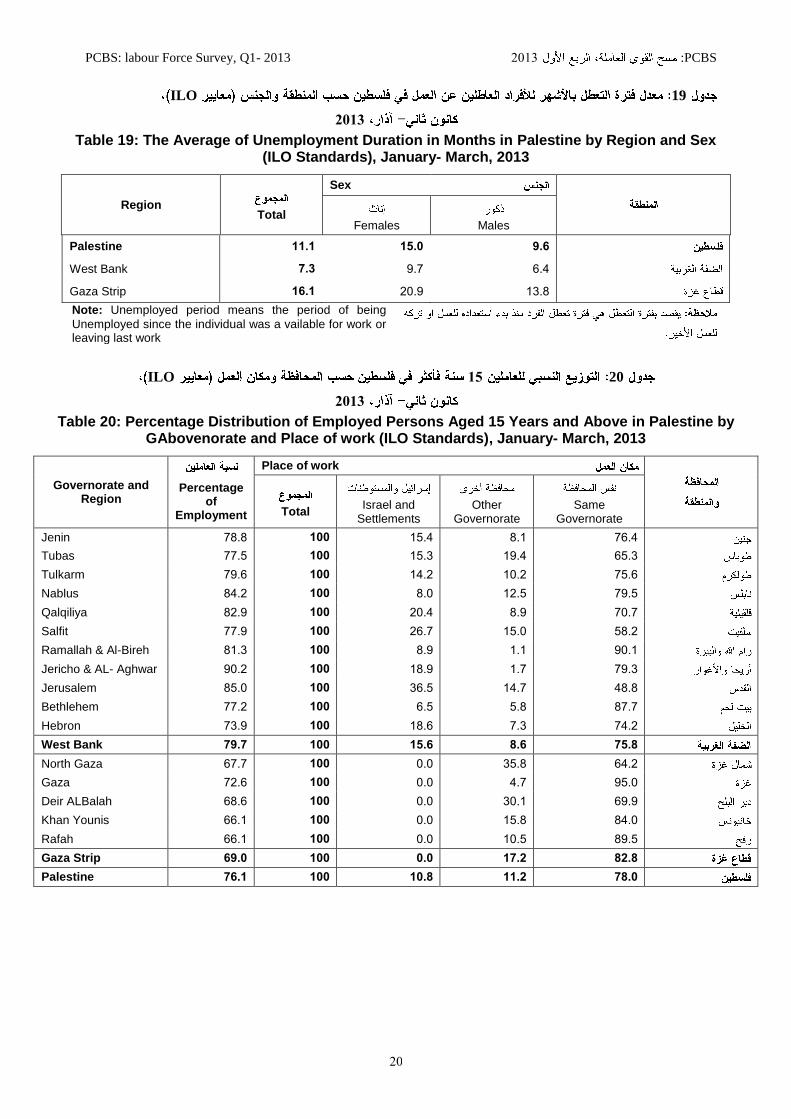
19ILO
3112
Table 19: The Average of Unemployment Duration in Months in Palestine by Region and Sex (ILO Standards), January- March, 2013
Region Total
Sex
Females
Males
Palestine 1141 1540 140
West Bank 940 52. 025
Gaza Strip 1041 .025 1328
Note: Unemployed period means the period of being
Unemployed since the individual was a vailable for work or leaving last work
2011ILO
3112
Table 20: Percentage Distribution of Employed Persons Aged 15 Years and Above in Palestine by GAbovenorate and Place of work (ILO Standards), January- March, 2013
Place of work
Governorate and Region
Same Governorate
Other Governorate
Israel and Settlements
Total
Percentage of
Employment
.025 821 1925 100 .828 Jenin
0923 1525 1923 100 ..29 Tubas
.920 102. 152. 100 .520 Tulkarm
.529 1.29 820 100 852. Nablus
.02. 825 .025 100 8.25 Qalqiliya
982. 1920 .02. 100 ..25 Salfit
5021 121 825 100 8123 Ramallah & Al-Bireh
.523 12. 1825 100 502. Jericho & AL- Aghwar
5828 152. 3029 100 8920 Jerusalem
8.2. 928 029 100 ..2. Bethlehem
.52. .23 1820 100 .325 Hebron
9548 840 1540 100 9149 West Bank
052. 3928 020 100 0.2. North Gaza
5920 52. 020 100 ..20 Gaza
0525 3021 020 100 0820 Deir ALBalah
8520 1928 020 100 0021 Khan Younis
8529 1029 020 100 0021 Rafah
8248 1942 040 100 0140 Gaza Strip
9840 1142 1048 100 9041 Palestine

:PCBS3102PCBS: labour Force Survey, Q1- 2013
30
2111ILO
3112
Table 21: Percentage Distribution of Employed Persons Aged 15 Years and Above in Palestine by Economic Activity and Place of work (ILO Standards), January- March, 2013
Place of work
Total Economic Activity
West Bank
Gaza Strip
Israel and
Settlements
102. 82. .25 140 Agriculture, fishing and forestry
1.20 02. 1.21 1045 Mining, quarrying and manufacturing
102. 025 0120 1540 Construction
.028 1.23 521 1845 Commerce, restaurants and hotels
928 825 92. 049 Transportation, storage and communication
3525 9.29 52. 0049 Services and other branches
100 100 100 100 Total
2211ILO
3112
Table 22: Number of Employed Persons Aged 15 Years and Above in Palestine by Place of work and Region (ILO Standards), January- March, 2013
Region
Place of work
Palestine West Bank Gaza Strip
500,800 903,500 300 West Bank
20.,.00 0 .05,500 Gaza Strip
90,100 .0,500 0 Israel
10,100 16,100 0 Settlements
*1,100 1,100 0 Abroad*
802,000 519,000 20.,900 Total
*(* ): Represents only head of households who are working abroad and
they back annually to their households in Palestine, and do not include household member who are living and working abroad.

:PCBS3102PCBS: labour Force Survey, Q1- 2013
33
2311ILO
3112
Table 23: Percentage Distribution of Employed Persons Aged 15 Years and Above in Palestine by Economic Activity, Sex and Rٌegion (ILO Standards), January- March, 2013
Region
Economic Activity and Sex
Palestine West Bank
Gaza Strip
Both Sexes
140 1023 82. Agriculture, fishing and forestry
1045 1028 02. Mining, quarrying and manufacturing
1540 1820 025 Construction
1845 1520 1.23 Commerce, restaurants and hotels
049 92. 825 Transportation, storage and communication
0049 .520 9.29 Services and other branches
100 100 100 Total
Males ذكور
941 823 .23 Agriculture, fishing and forestry
1.42 1.2. 028 Mining, quarrying and manufacturing
1941 ..20 .25 Construction
2040 .121 1525 Commerce, restaurants and hotels
949 020 1021 Transportation, storage and communication
0149 .32. 5829 Services and other branches
100 100 100 Total
Females
1840 1523 1520 Agriculture, fishing and forestry
1042 1.25 128 Mining, quarrying and manufacturing
041 02. 0220 Construction
840 525 328 Commerce, restaurants and hotels
140 12. 12. Transportation, storage and communication
0241 9029 .52. Services and other branches
100 100 100 Total

:PCBS3102PCBS: labour Force Survey, Q1- 2013
32
4251ILO4152
Table 24: Percentage Distribution of Employed Persons Aged 15 Years and Over in Palestine by Governorate, Region and Economic Activity (ILO Standards), January- March, 2013
Economic Activity
Governorate And Region
Agriculture, fishing and
forestry
Mining, quarrying and manufacturing
Construction Commerce, restaurants and hotels
Transportation, storage and
communication Education Health
Services and other branches
Total
..11 ..11 611 4112 116 611 416 .11. 100 Jenin
6216 618 612 .211 614 ..16 11. .211 100 Tubas
421. 111 111 ..12 116 .81. .1. 4.16 100 Tulkarm
.811 4.11 .412 .111 114 .812 611 ..16 100 Nablus
.111 614 .11 481. 211 ..16 616 4211 100 Qalqiliya
.412 .118 .211 ..1. 211 .41. 416 4418 100 Salfit
411 .11. ..16 441. .11 .811 614 4.12 100 Ramallah & Al-Bireh
4211 11. .1. .211 116 ..16 .1. 4118 100 Jericho & AL- Aghwar
.14 .611 .611 .618 .816 .411 .18 .611 100 Jerusalem
.16 4814 .818 4.16 611 .416 111 .114 100 Bethlehem
111 4612 118 4114 21. ..11 611 .616 100 Hebron
7.01 7101 7.01 8.02 802 7707 701 7.08 100 West Bank
116 211 616 .111 .11 .612 118 6.11 100 North Gaza
.1. .816 116 .114 611 ..16 11. 6116 100 Gaza
..11 116 118 .21. .411 .211 616 6418 100 Deir ALBalah
..12 16 611 .116 .11 .118 611 6.16 100 Khan Younis
.411 61. 211 .111 616 .116 11. 4111 100 Rafah
208 208 20. 7107 20. 7702 80. 770. 100 Gaza Strip
.02 7701 .09 7.02 20. 770. 908 8908 100 Palestine
Note: Workers in Israel and Settlements are excluded

:PCBS3102PCBS: labour Force Survey, Q1- 2013
31
2511ILO
3112
Table 25: Percentage Distribution of Employed Persons Aged 15 Years and Above in Palestine by Economic Activity, Employment Status and Rٌegion (ILO Standards), January- March, 2013
Employment Status
Economic Activity and Region
Employer
Self Employed
Wage Employee
Unpaid Family
Member
Total
Palestine
920 1921 520 9020 140 Agriculture, fishing and forestry
.525 1.21 1323 529 1045 Mining, quarrying and manufacturing
1528 02. 1.20 325 1540 Construction
3523 3328 1.20 .023 1845 Commerce, restaurants and hotels
125 1523 52. 020 049 Transportation, storage and communication
1520 1320 5.28 321 0049 Services and other branches
100 100 100 100 100 Total
West Bank
520 1.2. 320 0028 1040 Agriculture, fishing and forestry
.928 1520 1.2. 52. 1048 Mining, quarrying and manufacturing
.020 .25 .320 32. 1840 Construction
3128 3020 1521 .329 1140 Commerce, restaurants and hotels
.2. 1023 520 020 549 Transportation, storage and communication
1920 1325 3821 .28 2140 Services and other branches
100 100 100 100 100 Total
Gaza Strip
102. 1020 528 5525 842 Agriculture, fishing and forestry
1.21 020 929 828 042 Mining, quarrying and manufacturing
1828 92. 028 020 041 Construction
5.29 5128 520 352. 1940 Commerce, restaurants and hotels
020 .025 020 .2. 841 Transportation, storage and communication
925 1021 0.23 325 5245 Services and other branches
100 100 100 100 100 Total

:PCBS3102PCBS: labour Force Survey, Q1- 2013
31
2611
ILO3112
Table 26: Percentage Distribution of Employed Persons From Palestine by Economic Activity and Weekly Work Hours (ILO Standards), January- March, 2013
Total Economic Activity
Weekly Work Hours
115193539
5520 .028 920 104. Agriculture, Hunting & Fishing
1.23 1128 1528 1.42 Mining, Quarrying & Manufacturing
52. 1.25 1021 1541 Construction
.2. 1029 ..28 2040 Commerce, Hotels & Restaurants
52. 325 820 941 Transportation, Storage & Communication
1020 3920 3.2. 024. Services & Other Branches
100 100 100 100 Total
Note: Excluding abcent persons
2711ILO
3112
Table 27: Percentage Distribution of Employed Persons Aged 15 Years and Above in Palestine by Occupation and Region (ILO Standards), January- March, 2013
Occupation
Region
Gaza Strip
West Bank
Palestine
Legislators, Senior Officials & Managers .2. 52. .41
Professionals, Technicians, Associates and Clerks 3520 .325 2842
Service, Shop & Market Workers .025 1528 1040
Skilled Agricultural & Fishery Workers 529 020 545
Craft and Related Trade Workers 1025 .125 1842
Plant & Machine Operators & Assemblers 820 1028 141
Elementary Occupations 1520 1825 1945
Total 100 100 100

:PCBS3102PCBS: labour Force Survey, Q1- 2013
31
2811ILO
3112
Table 28: Percentage Distribution of Employed Persons Aged 15 Years and Above in Palestine by Occupation, Educational Qualification and Region (ILO Standards), January- March, 2013
Occupation and Region
Educational Qualification
Total Bachelor
and above
Associate diploma
Secondary certificate
Preparatory & less
Palestine
Legislators, Senior Officials & Managers
100 912. 1129 1.2. 1520
Professionals, Technicians, Associates and Clerks
100 9020 1920 1525 1520
Service, Shop & Market Workers 100 52. 920 .328 0025
Skilled Agricultural & Fishery Workers 100 .25 320 1025 832.
Craft and Related Trade Workers 100 .2. 325 102. ..2.
Plant & Machine Operators & Assemblers
100 328 520 1.23 .525
Elementary Occupations 100 125 .25 1521 8121
Total 100 2048 94. 1045 5540
West Bank
Legislators, Senior Officials & Managers
100 5828 1025 152. .120
Professionals, Technicians, Associates and Clerks
100 9.28 1928 1.29 1325
Service, Shop & Market Workers 100 .25 92. ..2. 052.
Skilled Agricultural & Fishery Workers 100 320 .20 1021 8523
Craft and Related Trade Workers 100 .29 32. 1020 ..2.
Plant & Machine Operators & Assemblers
100 .28 525 1020 .02.
Elementary Occupations 100 12. .2. 1528 8028
Total 100 1840 048 1541 5140
Gaza Strip
Legislators, Senior Officials & Managers
100 0.21 1021 525 1125
Professionals, Technicians, Associates and Clerks
100 9325 1328 1025 1925
Service, Shop & Market Workers 100 1.23 023 .92. 992.
Skilled Agricultural & Fishery Workers 100 32. 520 132. .520
Craft and Related Trade Workers 100 329 02. 152. .921
Plant & Machine Operators & Assemblers
100 .21 .20 1525 .025
Elementary Occupations 100 .29 329 1.20 8.20
Total 100 2048 849 1940 .041

:PCBS3102PCBS: labour Force Survey, Q1- 2013
31
2911ILO
3112
Table 29: Percentage Distribution of Employed Persons Aged 15 Years and Above in Palestine by Employment Status, Sex and Rٌegion (ILO Standards), January- March, 2013
Employment Status and Sex
Region
Gaza Strip West Bank Palestine
Both Sexes
Employer 323 .29 042
Self Employed 1928 1.29 1940
Wage Employee .921 0.20 0141
Unpaid Family Member 928 .25 041
Total 100 100 100
Males ذكور
Employer 32. 82. 941
Self Employed 1.29 1521 1840
Wage Employee .52. 0.28 0148
Unpaid Family Member 520 525 .45
Total 100 100 100
Females
Employer 020 .21 140
Self Employed 523 1025 841
Wage Employee 8120 0025 904.
Unpaid Family Member 152. .020 1141
Total 100 100 100
3011ILO
3112
Table 30: Distribution of Employed Persons Aged 15 Years and Above in Palestine by Place of Work and Region (ILO Standards), January- March, 2013
Place of Work
Region
Gaza Strip West Bank Palestine
(%) Number (%) Number (%) Number
Palestine 100 .05,.00 852. 903,900 8141 908,200
Israel and Settlements (Persons who have Permit)
0 0 .29 59,000 542 .5,000
Israel and Settlements (Persons who not have Permit)
0 0 920 .5,000 045 21,000
Israel and Settlements (Persons who have Israeli Identity or foreign passport)
0 0 321 18,500 241 18,.00
Abroad* 0 0 02. 1,100 041 1,100
Total 100 264,700 100 519,000 100 802,000
*
(* ): Represents only head of households who are working abroad and
they back annually to their households in Palestine, and do not include household member who are living and working abroad.

:PCBS3102PCBS: labour Force Survey, Q1- 2013
31
3111ILO
3112
Table 31: Percentage Distribution of Employed Persons Aged 15 Years and Above in Palestine by Gavernorate, Region and Employment Status (ILO Standards),January- March, 2013
Governorate and Region
Total
Employment Status
Unpaid Family Member
Wage Employee Self Employed
Employer
Jenin 100 1123 0025 ..20 928
Tubas 100 1028 982. 192. 828
Tulkarm 100 1.20 0325 .020 520
Nablus 100 829 0925 1025 82.
Qalqiliya 100 1.21 0325 1521 525
Salfit 100 02. .325 1128 820
Ramallah & Al-Bireh 100 .29 .323 1820 920
Jericho & AL- Aghwar 100 025 .02. 1.25 529
Jerusalem 100 02. .523 1320 .20
Bethlehem 100 023 0.23 1025 1020
Hebron 100 .25 0929 1.23 528
West Bank 100 94. 0940 1945 945
North Gaza 100 925 ..20 1823 523
Gaza 100 520 .829 1520 .25
Deir ALBalah 100 020 .12. .023 .20
Khan Younis 100 529 ..20 152. 328
Rafah 100 023 .820 112. 325
Gaza Strip 100 548 9541 1548 040
Palestine 100 041 0141 1940 042

:PCBS3102PCBS: labour Force Survey, Q1- 2013
31
3211 ILO
3112
Table 32: Percentage Distribution of Employed Persons Aged 15 Years and Above in Palestine by Governorate, Region and Sector (ILO Standards), January- March, 2013
Governorate and Region
جموعملا Total
Sector القطاع
المحافظة والمنطقة
ائيل والمستوطناتاسرIsrael and
Settlements
قطاعات أخرىOther
Sectors
قطاع خاصPrivate Sector
ع عامقطاPublic Sector
Jenin 100 1925 125 0325 1828 جنين
Tubas 100 1923 120 032. 1525 طوباس
Tulkarm 100 152. .21 0920 1821 طولكرم
Nablus 100 820 .20 .328 102. نابلس
Qalqiliya 100 .029 025 9029 ..21 قلقيلية
Salfit 100 .02. 029 932. 1520 سلفيت
Ramallah & Al-Bireh 100 825 323 0.23 .029 رام اهلل والبيرة
Jericho & AL- Aghwar 100 1520 529 9525 ..21 أريحا واألغوار
Jerusalem 100 3029 020 9325 529 القدس
Bethlehem 100 029 125 .520 1.20 بيت لحم
Hebron 100 1820 028 0920 1920 الخليل
West Bank 100 1540 149 0041 1040 الضفة الغربية
North Gaza 100 020 821 9.21 3528 شمال غزة
Gaza 100 020 920 9920 3828 غزة
Deir ALBalah 100 020 020 9125 5.21 دير البلح
Khan Younis 100 020 029 9921 3825 خانيونس
Rafah 100 020 .2. 9520 3.2. رفح
Gaza Strip 100 040 045 5.42 0140 ع غزةقطا
Palestine 100 1048 042 024. 2040 فلسطين

:PCBS3102PCBS: labour Force Survey, Q1- 2013
21
22
ILO3112
Table 33: Average Weekly Work Hours, Monthly Work Days and Daily Wage in NIS for Wage Employees Aged 15 Years and Above by Place of Work (ILO Standards), January- March, 2013
Indicator Total
Place of work
Israel and Settlements
Gaza Strip
West Bank
Average weekly work hours .140 5329 3020 5329
Average monthly work days* 2241 .020 .323 ..2.
Median daily net wage in NIS 8040 19328 9020 .025
Average daily net wage in NIS 1549 10.20 092. 8828
*: Includes usual or paid work days
34ILO
3112
Table 34: Average Daily Wage in NIS for Wage Employees in Palestine by Region and Sector (ILO Standards), January- March, 2013
Region Total
Sector
Israel and Settlements
Other Sector Private Sector
*
Public Sector*
Palestine 1549 10940 11540 0149 1040
West Bank 10048 020 1.52. 8029 10028
Gaza Strip 0545 10.20 1002. 5.23 8025
* *: Palestinian goverment sector
35ILO
3112
Table 35: Average Daily Wage in NIS for Wage Employees in Palestine by Region and Sex (ILO Standards), January- March, 2013
Region Total
Sex
Females
Males )(
Palestine 8142 8042 8049
West Bank 8848 8921 8520
Gaza Strip 0542 ..20 0325
Note: Workers in Israel and Settlements are excluded

:PCBS3102PCBS: labour Force Survey, Q1- 2013
20
36ILO
3112
Table 36: Average Daily Wage in NIS for Wage Employees in Palestine by Economic Activity and Place of work (ILO Standards), January- March, 2013
Economic Activity Total
Place of work
Israel and Settlements
Gaza Strip
West Bank
Agriculture, fishing and forestry 5042 5021 .120 0020
Mining, quarrying and manufacturing 9840 1552. 3525 ..2.
Construction 1004. 1892. 592. 8025
Commerce, restaurants and hotels 0148 15523 3121 .121
Transportation, Storage & Communication 1042 - 5529 10020
Services and other branches 1940 - 8.25 10128
Total 1549 10940 0542 8848
(-): means there are no enough observations in this section
37ILO
3112
Table 37: Average Monthly Wage in NIS for Wage Employees in Palestine by Occupation, and Educational Qualification (ILO Standards), January- March, 2013
Occupation
Educational Qualification
Total Bachelor
and above Associate diploma
Secondary certificate
Preparatory & less
Legislators, Senior Officials & Managers
0,8.8 5,098 - - -
Professionals, Technicians, Associates and Clerks
2,019 .,5.. .,353 .,150 1,585
Service, Shop & Market Workers 1,095 .,1.. - 1,000 1,0.5
Skilled Agricultural & Fishery Workers
2,212 - - - -
Craft and Related Trade Workers 0,298 - .,.5. 3,081 3,350
Plant & Machine Operators & Assemblers
2,11. - - .,.09 .,109
Elementary Occupations 2,015 - - .,105 1,505
Total 2,.89 2,115 2,018 2,205 2,020
(-): means there are no enough observations in this section

:PCBS3102PCBS: labour Force Survey, Q1- 2013
23
38ILO
3112
Table 38: Average Monthly Wage in NIS for Wage Employees in Palestine by Length of Services in Years, Educational Qualification and Region (ILO Standards), January- March, 2013
Length of Services in years and Region
Educational Qualification
Total Bachelor and
above Associate diploma
Secondary certificate
Preparatory & less
Palestine
0-1 1,980 .,030 1,8.0 1,89. 1,0.0 01
2-3 2,0.0 .,9.. 1,8.. .,010 1,893 .3
4-6 2,081 .,.18 .,19. 1,555 .,389 50
7-9 0,081 3,050 - .,.03 .,05. .5
10+ 0,191 3,033 .,50. .,835 3,005 10
Total 2,.89 2,115 2,018 2,205 2,020
West Bank
0-1 2,109 .,31. .,589 .,185 .,035 01
2-3 2,081 .,.50 .,181 .,3.9 .,..1 .3
4-6 2,001 .,89. - .,1.0 .,.00 50
7-9 0,002 5,1.8 - .,503 .,858 .5
10+ 0,051 3,.3. 3,013 3,0.5 3,3.8 10
Total 2,990 0,1.1 2,909 2,50. 2,018
Gaza Strip
0-1 1,020 1,980 - 8.3 839 01
2-3 1,200 .,189 - 1,..5 8.3 .3
4-6 1,080 .,58. - 1,355 1,.10 50
7-9 2,501 3,080 - - - .5
10+ 2,51. 3,59. .,9.5 1,519 1,30. 10
Total 1,90. 2,910 1,9.2 1,005 1,00.
(-): means there are no enough observations in this section

:PCBS3102PCBS: labour Force Survey, Q1- 2013
22
291411
3112
Table 44: Average Monthly Wage in NIS and Number of Wage Employees Who Receive Less Than 1450 NIS (Minimum Wage in the Private Sector in Palestine) by Region,
January- March, 2013
Monthly Wage in NIS
Region* العدد Number
معدل األجر الشهريAverage Monthly Wage
31,300 1,00. North West Bank
5,400 1,113 Middle West Bank
1.,900 1,05. South West Bank
58,600 1,00. West Bank
36,000 818 North Gaza Strip
18,500 ..0 Middle Gaza Strip
8,700 .10 South Gaza Strip
00,100 911 Gaza Strip
121,900 122 Palestine
Workers in Israel and Settlements and Abroad are
excluded
North West Bank: Jenin, Tubas, Tulkarm, Nablus, Salfit.
Middle West Bank: Ramallah & Al-Bireh, Jericho &
Al-ghwar, Jerusalem.
South West Bank: Bethlehem, Hebron
North Gaza Strip: North Gaza, Gaza.
Middle Gaza Strip: Deir AlBalah, Khan Younis
South Gaza Strip: Rafah.

:PCBS3102PCBS: labour Force Survey, Q1- 2013
21
4111
ILO3112
Table 39: Percentage Distribution of Persons Aged 15 Years and Above Outside the Labour Force in Palestine by Reason, Sex and Region (ILO Standards), January- March, 2013
Reason and Sex
Region
Gaza Strip West Bank Palestine
Both Sexes
Old/illness 1020 132. 1242
Housekeeping 5829 5828 .849
Studying or training 3.23 3521 0540
Others 320 325 048
Total 100 100 100
Males
Old/illness .52. 3521 0240
Housekeeping 021 020 040
Studying or training 0123 932. 5045
Others 825 1.2. 1142
Total 100 100 100
Females
Old/illness .25 92. .45
Housekeeping 0520 0025 0940
Studying or training ..2. ..2. 2942
Others 125 02. 140
Total 100 100 100

:PCBS3102PCBS: labour Force Survey, Q1- 2013
21
41
3112
Table .0: Percentage Distribution for Wage Employees in Private Sector in Palestine by Some Indicators and Work Advantages and Region, January- March, 2013
Indicator
Region
Gaza Strip West Bank Palestine
Distribution of Wage Employees by Nature of Work:
Permanently / full time .523 582. 124.
Temporarily / Part time 128 028 141
seasonal / casual 1825 120 045
Total 100 100 100
Distribution of Wage Employees by Contract Availability:
With written Contract/ Limited period
52. 828 945
With written Contract/ Unlimited period
.120 182. 1142
Collective Agreement 029 12. 140
Oral Agreement 020 .825 2042
Without Contract ..20 5.25 5241
Total 100 100 100
Wage Employees by Advantages provided by Employers:
Contributions to the pension fund 1.25 ..2. 2140
Annual paid Vacations 152. .320 2242
Sick Paid Vacations 152. .325 2240
Maternity Paid Vacations from Women
912. 3928 014.
:PCBS3102PCBS: labour Force Survey, Q1- 2013
21
4311
3112
Table .1: Percentage Distribution of Employed Persons Aged 15 Years and Above in Palestine by Affiliation to Workers Vocational Union, Sex and Region,
January- March, 2013
Affiliation to Workers Vocational Union & Sex
Region
Gaza Strip West Bank Palestine
Both Sexes
Affiliated to Workers Vocational Union 0929 1.28 3.28
Not Affiliated to Workers Vocational Union 3529 8.2. 0.2.
Total 100 100 100
Males
Affiliated to Workers Vocational Union 0.29 1.23 332.
Not Affiliated to Workers Vocational Union 3.29 8.2. 0023
Total 100 100 100
Females
Affiliated to Workers Vocational Union 9.20 1525 ..25
Not Affiliated to Workers Vocational Union 5.25 8021 ..21
Total 100 100 100
421117ILO
3112
Table .2: Percentage Distribution of Children Aged 10-17 Years in Palestine by Labour Force
Status and Region (ILO Definition), January- March, 2013
Labour Force Status
Region
Gaza Strip West Bank Palestine
Employed 129 328 .25
Unemployed 123 12. 129
Outside Labour Force 5.2. 5529 5920
Total 100 100 100
443112
Table .0: Percentage of Households which are headed by Women in Palestine by Region, January- March, 2013
Percentage of Households which are headed by Women
Region
14. Palestine
1029 West Bank
.2. Gaza Strip

PCBS: labour Force Survey, Q1- 2013 نPCBS : 2013مسح القوى العاملة، الربع األول
68دورة 67دورة 66دورة 65دورة 64دورة 63دورة 62دورة 61دورة 60دورة 59دورة 58دورة 57دورة56دورة 55دورة 54دورة 53دورة 52دورة 51دورة 50دورة 49دورة 48دورة 47دورة 46دورة 45دورة 44دورة 43دورة 42دورة 41دورة 40دورة 39دورة 38دورة 37دورة 36دورة 19دورة
Q4-
2000
Q1-
2005
Q2-
2005
Q3-
2005
Q4-
2005
Q1-
2006
Q2-
2006
Q3-
2006
Q4-
2006
Q1-
2007
Q2-
2007
Q3-
2007
Q4-
2007
Q1-
2008
Q2-
2008
Q3-
2008
Q4-
2008
Q1-
2009
Q2-
2009
Q3-
2009
Q4-
2009
Q1-
2010
Q2-
2010
Q3-
2010
Q4-
2010
Q1-
2011
Q2-
2011
Q3-
2011
Q4-
2011
Q1-
2012
Q2-
2012
Q3-
2012
Q4-
2012
Q1-
2013
39.439.440.941.440.039.640.641.142.840.942.242.441.140.341.341.741.541.441.841.641.540.741.540.541.541.042.743.644.443.443.643.443.943.4Labour Force Participation Rateنسبة القوى العاملة المشاركة
66.767.872.670.068.967.468.467.469.671.270.068.27271.265.266.065.668.771.469.168.671.268.767.069.669.573.271.271.368.470.869.871.470.2Full Employment Rateنسبة العمالة التامة
4.95.96.27.27.27.28.58.18.37.010.78.55.66.18.55.06.65.96.25.16.66.88.46.47.08.88.16.47.77.78.35.95.75.9Underemployment Rateنسبة العمالة المحدودة
28.426.321.222.823.925.423.124.522.121.819.323.322.422.726.328.027.825.422.425.824.822.022.926.623.421.718.722.421.023.920.924.322.923.9Unemployment Rateنسبة البطالة
17.413.716.115.314.913.715.914.322.415.317.915.315.713.015.913.313.811.712.410.712.411.812.710.212.510.611.510.914.410.512.710.312.39.6Employed in Agricultureنسبة العاملين في الزراعة
10.413.312.912.912.212.111.411.39.310.711.011.610.39.310.512.410.611.112.212.211.412.713.413.812.713.814.513.913.313.514.715.313.915.0Employed in Constructionنسبة العاملين في البناء والتشييد
12.712.413.112.913.111.612.213.412.012.512.612.712.312.912.412.511.412.611.311.812.612.610.911.410.711.512.312.111.312.211.711.312.513.5Employed in Manufacturingنسبة العاملين في الصناعة
35.735.933.433.734.836.336.035.234.136.434.635.236.338.537.837.039.540.540.639.437.937.738.438.938.737.735.236.135.437.134.936.436.336.7Employed in Servicesنسبة العاملين في الخدمات
13.315.615.114.416.416.015.715.013.013.813.114.714.314.715.215.616.615.814.415.616.518.318.018.817.318.318.118.817.816.218.318.117.517.5Elementary Occupation Workersنسبة العاملين في المهن األولية
16.017.117.218.416.616.315.616.914.916.417.115.814.716.215.016.613.815.716.215.115.516.815.716.015.115.617.516.214.615.916.416.316.118.2Craft and Related Trade Workersنسبة العاملين في الحرف والمهن
8.29.69.29.28.99.87.89.38.49.07.99.19.511.19.510.910.310.09.810.79.911.110.110.510.310.09.910.49.69.29.210.49.910.8Employed in Israel & Settlementsنسبة العاملين في إسرائيل المستوطنات
4.84.04.64.64.14.24.34.75.23.74.14.34.33.84.24.64.85.86.26.56.66.46.66.46.06.66.36.95.76.26.06.76.76.2Employersنسبة أرباب العمل
23.727.226.825.726.427.027.025.522.725.225.123.523.524.322.621.416.319.118.219.020.520.218.818.617.618.819.417.918.118.818.018.116.617.0Self - Employedنسبة العاملين في مصالحهم
58.560.557.457.660.160.558.858.856.360.357.459.460.062.361.964.169.167.266.667.065.166.566.868.668.668.866.466.465.266.566.566.867.969.9Wage Employeesنسبة المستخدمين بأجر
13.08.311.212.19.48.39.911.015.810.813.412.812.29.611.39.99.87.99.07.57.76.97.86.47.85.87.98.811.08.59.58.48.86.9Unpaid Family Membersنسبة أعضاء األسرة بدون أجر
* 23.823.623.923.923.623.323.923.922.622.722.722.122.622.722.723.123.121.923.223.022.622.322.622.622.522.422.822.822.722.722.722.922.422.5Average Monthly Work Days*معدل أيام العمل الشهرية
* 40.541.542.843.340.541.141.842.440.041.441.741.839.441.041.842.942.041.241.842.741.141.742.342.441.641.641.241.741.641.041.941.440.841.2Average Weekly Work Hours*معدل ساعات العمل األسبوعية
* 57.757.760.060.065.469.269.267.365.468.565.468.569.270.069.266.770.070.070.070.070.070.070.069.270.070.070.069.270.070.070.070.070.071.2Median Daily Net Wage (NIS)*األجر اليومي الوسيط بالشيكل
* 65.366.468.668.571.374.573.173.773.473.671.174.174.479.677.273.677.178.879.880.779.277.376.978.778.978.977.876.477.978.680.080.780.081.2Average Daily Net Wage (NIS)*معدل األجر اليومي بالشيكل
:Note:مالحظة
*: Workers in Israel and Settlements are excluded
Q: Quarter, Example: Q4-2000 means: Forth Quarter of 2000
المعدل العام أليام العمل الشهرية وساعات العمل األسبوعية واألجر اليومي الوسيط ال يشمل العاملين من فلسطين في إسرائيل والمستوطنات *:
Q :تعني الربع من السنة، فمثاًل :Q4-2000 2000 تعني الربع الرابع من عام
(ILOمعايير ) 2013-2000 التغيرات األساسية التي طرأت على القوى العاملة في فلسطين خالل الفترة
المؤشر
Basic Changes in the Labour Force Indicators in Palestine During 2000 - 2013 (ILO Standards)
Indicator
37

PCBS: labour Force Survey, Q1- 2013 نPCBS : 2013مسح القوى العاملة، الربع األول
1936373839 4041424344454647 484950515253545556575859606162636465666768
Q4-
2000
Q1-
2005
Q2-
2005
Q3-
2005
Q4-
2005
Q1-
2006
Q2-
2006
Q3-
2006
Q4-
2006
Q1-
2007
Q2-
2007
Q3-
2007
Q4-
2007
Q1-
2008
Q2-
2008
Q3-
2008
Q4-
2008
Q1-
2009
Q2-
2009
Q3-
2009
Q4-
2009
Q1-
2010
Q2-
2010
Q3-
2010
Q4-
2010
Q1-
2011
Q2-
2011
Q3-
2011
Q4-
2011
Q1-
2012
Q2-
2012
Q3-
2012
Q4-
2012
Q1-
2013
43.341.043.443.842.042.043.344.345.542.444.644.243.641.843.243.743.142.844.643.744.143.243.943.044.543.245.346.247.345.445.445.246.145.0Labour Force Participation Rate
67.969.574.870.768.869.471.270.575.174.971.870.573.274.074.672.272.674.477.976.974.877.475.973.074.072.575.873.575.571.873.873.076.774.4Full Employment Rate
5.77.88.09.39.49.110.610.18.67.512.210.97.46.98.36.56.56.16.15.37.16.19.06.99.110.18.86.87.98.19.16.65.05.3Underemployment Rate
26.422.717.220.021.821.518.219.416.317.616.018.619.419.117.121.320.919.516.017.818.116.515.220.116.917.415.419.716.620.117.120.418.320.3Unemployment Rate
17.914.017.717.316.315.017.816.025.416.120.016.316.413.217.014.316.113.115.112.614.212.514.410.915.110.612.311.516.411.414.411.413.910.3Employed in Agriculture
12.914.914.414.713.213.613.413.610.912.812.914.713.912.713.716.514.015.116.416.015.117.017.117.215.817.418.017.315.816.417.418.017.018.6Employed in Construction
14.614.614.614.915.113.214.616.114.114.814.515.515.116.114.915.214.415.313.913.815.015.113.213.612.914.115.014.713.614.914.414.115.416.8Employed in Manufacturing
29.129.927.626.928.830.529.327.927.330.628.828.429.832.630.428.629.631.730.931.530.029.930.131.630.830.728.229.228.930.327.529.929.029.6Employed in Services
14.516.115.815.316.216.015.716.313.815.414.116.516.517.016.716.918.317.515.817.217.419.318.919.617.919.519.919.717.716.619.119.318.818.9Elementary Occupation Workers
18.019.118.119.618.018.117.719.316.617.918.017.817.218.417.720.016.719.019.617.817.819.518.618.917.518.120.118.816.718.418.818.618.421.4Craft and Related Trade Workers
10.113.512.712.812.712.410.612.511.412.711.212.813.415.812.514.813.914.013.314.313.415.313.614.213.814.014.014.813.413.113.114.914.015.6Employed in Israel & Settlements
5.14.85.35.34.84.94.85.14.53.54.34.85.14.24.54.65.26.07.07.57.37.17.37.07.08.07.67.46.57.67.27.58.07.5Employers
25.528.928.127.228.429.029.227.425.227.426.624.723.823.024.323.417.820.820.020.222.021.420.620.219.318.919.018.818.819.719.018.217.717.5Self - Employed
55.857.854.454.056.256.554.854.752.458.154.657.359.063.959.060.965.664.662.063.162.063.362.364.964.066.764.764.061.363.263.165.064.267.6Wage Employees
13.68.512.213.510.69.611.212.817.911.014.513.212.18.912.211.111.48.611.09.28.78.29.87.99.76.48.79.813.49.510.79.310.17.4Unpaid Family Members
23.223.423.723.623.423.223.723.522.122.222.322.022.222.122.322.522.422.122.522.722.322.022.222.422.122.022.522.622.522.422.322.222.022.2Average Monthly Work Days *
40.342.243.343.740.841.642.742.941.741.842.442.539.941.242.442.842.842.042.743.342.342.843.643.443.242.642.843.443.743.043.843.143.143.5Average Weekly Work Hours *
61.560.065.465.469.269.269.269.265.470.069.270.070.076.970.070.076.976.976.976.976.976.976.976.976.976.976.976.976.976.976.976.976.976.9Median Daily Net Wage (NIS) *
70.270.473.373.974.777.275.076.677.577.775.477.578.184.982.179.583.483.886.187.585.685.784.186.686.885.084.884.385.785.487.487.588.088.8Average Daily Net Wage (NIS) *
Note:
*: Workers in Israel and Settlements are excluded
Q: Quarter, Example: Q4-2000 means: Forth Quarter of 2000 QQ4-20002000
2000-2013 (ILO)
Indicator
Basic Changes in the Labour Force Indicators in West Bank During 2000 -2013 (ILO Standards)
38

PCBS: labour Force Survey, Q1- 2013 نPCBS : 2013مسح القوى العاملة، الربع األول
1936373839 4041424344454647 484950515253545556575859606162636465666768
Q4-
2000
Q1-
2005Q2-2005
Q3-
2005
Q4-
2005
Q1-
2006
Q2-
2006
Q3-
2006
Q4-
2006
Q1-
2007
Q2-
2007
Q3-
2007
Q4-
2007
Q1-
2008
Q2-
2008
Q3-
2008
Q4-
2008
Q1-
2009
Q2-
2009
Q3-
2009
Q4-
2009
Q1-
2010
Q2-
2010
Q3-
2010
Q4-
2010
Q1-
2011
Q2-
2011
Q3-
2011
Q4-
2011
Q1-
2012
Q2-
2012
Q3-
2012
Q4-
2012
Q1-
2013
32.036.436.436.936.235.135.635.237.938.237.938.936.637.537.938.238.838.936.937.736.936.337.036.036.337.038.139.039.539.940.340.440.040.5Labour Force Participation Rate
63.964.067.768.569.362.962.160.357.763.866.263.369.265.645.753.048.257.557.753.155.358.053.654.160.363.067.866.462.461.764.863.660.761.9Full Employment Rate
2.82.02.22.62.53.14.03.47.55.87.43.71.84.58.85.17.05.56.34.65.48.17.15.42.36.26.65.67.36.86.84.57.17.1Underemployment Rate
33.334.030.128.928.234.033.936.334.830.426.433.029.029.945.441.944.837.036.042.339.333.939.340.537.430.825.628.030.331.528.431.932.231.0Unemployment Rate
16.113.212.010.511.410.110.89.214.113.312.712.713.912.512.310.67.18.44.84.97.39.97.88.05.110.59.59.39.18.48.97.88.38.2Employed in Agriculture
3.49.29.38.69.88.26.14.64.95.66.23.71.61.60.40.70.81.00.70.91.01.32.54.04.04.96.26.06.86.78.79.06.36.9Employed in Construction
7.47.39.28.08.67.35.75.76.37.18.05.95.55.54.64.82.75.64.26.05.76.03.85.14.35.05.75.85.55.95.44.65.56.2Employed in Manufacturing
53.950.248.049.849.151.853.956.253.350.648.952.152.052.061.460.668.163.067.063.260.158.263.159.961.355.252.052.852.053.251.651.754.352.5Employed in Services
9.814.113.512.816.915.515.511.110.69.910.610.49.110.011.112.212.110.810.510.313.915.515.116.815.515.714.216.817.914.616.715.614.114.0Elementary Occupation Workers
10.412.214.815.413.411.610.39.910.012.614.810.78.411.16.57.05.77.66.87.48.79.47.17.88.49.411.310.09.110.210.911.010.610.9Craft and Related Trade Workers
2.70.11.00.50.10.50.00.00.00.00.00.00.00.00.00.00.00.00.00.00.00.00.00.00.00.00.00.00.00.00.00.00.00.0Employed in Israel & Settlements
4.12.12.82.92.42.53.03.67.34.13.53.02.42.93.34.63.55.33.93.64.84.34.74.73.23.03.05.73.72.93.25.03.53.3Employers
18.823.223.422.221.921.621.219.915.720.021.520.522.827.417.015.812.014.913.215.416.317.113.614.012.418.720.315.816.316.515.517.914.115.8Self - Employed
66.067.065.166.469.270.969.670.667.265.864.364.862.458.571.273.279.073.779.578.274.275.080.079.181.873.970.371.875.174.474.270.777.075.1Wage Employees
11.17.78.78.56.55.06.25.99.810.110.711.712.411.28.56.45.56.13.42.84.73.61.72.22.64.46.46.74.96.27.16.45.45.8Unpaid Family Members
24.923.824.224.324.023.524.324.523.523.523.522.423.824.724.224.925.021.324.923.923.723.123.723.223.723.323.723.423.323.523.624.323.123.3Average Monthly Work Days *
41.040.542.042.540.040.440.341.537.740.640.439.738.240.240.043.439.938.839.541.238.139.138.839.937.839.237.538.236.936.937.837.835.936.6Average Weekly Work Hours *
50.055.855.853.861.565.467.365.461.561.557.757.760.757.757.750.057.757.757.757.754.746.250.050.050.050.048.146.250.050.050.053.850.050.0Median Daily Net Wage (NIS) *
56.259.960.860.066.570.369.968.867.066.963.765.164.263.561.657.261.162.264.062.162.356.958.158.259.564.661.859.360.663.964.366.163.165.2Average Daily Net Wage (NIS) *
Note:
*: Workers in Israel and Settlements are excluded
QQ4-20002000Q: Quarter, Example: Q4-2000 means: Forth Quarter of 2000
(-) means there are no enough observations in this section.
ال يشمل العاملين من فلسطين في إسرائيل والمستوطنات*:
2000-2013 (ILO)
Indicator
Basic Changes in the Labour Force Indicators in Gaza Strip During 2000 - 2013 (ILO Standards)
39

PCBS: labour Force Survey, Q1- 2013 نPCBS : 2013مسح القوى العاملة الربع األول
39.040.040.541.441.641.638.537.940.040.140.441.041.741.241.641.143.043.6Labour Force Participation Rate
11.211.011.511.312.312.910.410.512.813.513.514.615.715.315.514.716.617.4Wًoman Labour Force Participation Rate
60.764.370.479.182.880.670.764.468.166.869.968.370.366.569.669.271.470.1Full Employment Rate
21.111.99.36.55.45.14.04.46.46.46.68.08.06.95.97.17.76.9Underemployment Rate
18.223.820.314.411.814.325.331.225.526.823.523.721.726.624.523.720.923.0Unemployment Rate
16.219.520.115.213.012.413.817.018.220.022.220.519.124.226.426.828.432.9Unemployment Rate among women
12.714.213.112.112.614.112.215.316.216.415.016.716.114.111.811.811.911.5Employed in Agriculture
19.216.818.422.022.119.414.210.712.911.512.811.010.910.711.713.213.914.4Employed in Construction
18.016.816.415.915.514.213.812.712.512.612.912.312.512.312.111.411.811.9Employed in Manufacturing
25.629.228.227.128.130.134.836.032.834.834.535.435.638.239.638.336.036.1Employed in Services
18.328.728.931.029.720.815.414.214.114.215.514.813.915.615.718.118.217.5Elementary Occupation Workers
27.524.024.624.722.721.818.717.118.416.917.415.916.015.315.615.916.016.2Craft and Related Trade Workers
16.214.117.121.722.918.812.59.38.78.09.38.68.910.110.210.510.09.7Employed in Israel & Settlements
6.95.55.35.85.54.74.93.83.64.24.44.64.14.46.36.46.46.4Employers
21.222.322.921.018.720.324.827.428.527.026.525.524.321.319.218.818.617.9Self - Employed
61.761.462.065.367.865.461.158.556.457.659.958.559.364.166.567.666.666.9Wage Employees
10.210.89.87.98.09.69.210.311.511.210.211.412.310.28.07.28.48.8Unpaid Family Members
21.022.022.023.022.623.823.923.323.223.723.723.422.622.922.722.522.722.7Average Monthly Work Days *
42.143.544.045.044.242.842.140.541.742.542.041.441.142.241.742.041.541.3Average Weekly Work Hours *
40.041.642.346.254.957.757.757.454.657.760.066.567.369.270.070.070.070.0Median Daily Net Wage (NIS) *
50.646.849.353.460.663.664.064.964.566.868.873.773.276.479.777.977.879.8Average Daily Wage*
Note:
*: Workers in Israel and Settlements are excluded
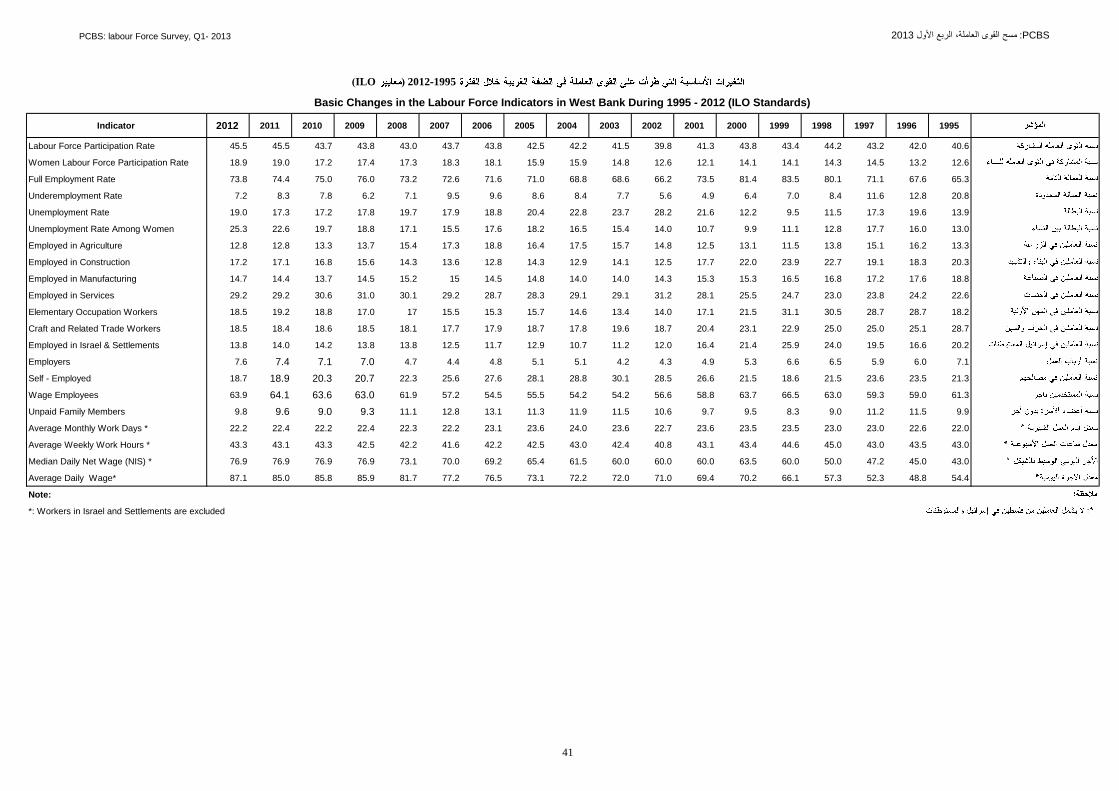
1995-2012 (ILO)
1995199619972006 1999
Basic Changes in the Labour Force Indicators in Palestine During 1995 - 2012 (ILO Standards)
19982011 200020042009Indicator 2008 20022012 2005 20032007 20012010
40
PCBS: labour Force Survey, Q1- 2013 نPCBS : 2013مسح القوى العاملة، الربع األول
199519961997199819992000200120022003200420052006200720082009201020112012Indicator
40.642.043.244.243.443.841.339.841.542.242.543.843.743.043.843.745.545.5Labour Force Participation Rate
12.613.214.514.314.114.112.112.614.815.915.918.118.317.317.417.219.018.9Women Labour Force Participation Rate
65.367.671.180.183.581.473.566.268.668.871.071.672.673.276.075.074.473.8Full Employment Rate
20.812.811.68.47.06.44.95.67.78.48.69.69.57.16.27.88.37.2Underemployment Rate
13.919.617.311.59.512.221.628.223.722.820.418.817.919.717.817.217.319.0Unemployment Rate
13.016.017.712.811.19.910.714.015.416.518.217.615.517.118.819.722.625.3Unemployment Rate Among Women
13.316.215.113.811.513.112.514.815.717.516.418.817.315.413.713.312.812.8Employed in Agriculture
20.318.319.122.723.922.017.712.514.112.914.312.813.614.315.616.817.117.2Employed in Construction
18.817.617.216.816.515.315.314.314.014.014.814.51515.214.513.714.414.7Employed in Manufacturing
22.624.223.823.024.725.528.131.229.129.128.328.729.230.131.030.629.229.2Employed in Services
18.228.728.730.531.121.517.114.013.414.615.715.315.51717.018.819.218.5Elementary Occupation Workers
28.725.125.025.022.923.120.418.719.617.818.717.917.718.118.518.618.418.5Craft and Related Trade Workers
20.216.619.524.025.921.416.412.011.210.712.911.712.513.813.814.214.013.8Employed in Israel & Settlements
7.16.05.96.56.65.34.94.34.25.15.14.84.44.77.07.17.47.6Employers
21.323.523.621.518.621.526.628.530.128.828.127.625.622.320.720.318.918.7Self - Employed
61.359.059.363.066.563.758.856.654.254.255.554.557.261.963.063.664.163.9Wage Employees
9.911.511.29.08.39.59.710.611.511.911.313.112.811.19.39.09.69.8Unpaid Family Members
22.022.623.023.023.523.523.622.723.624.023.623.122.222.322.422.222.422.2Average Monthly Work Days *
43.043.543.045.044.643.443.140.842.443.042.542.241.642.242.543.343.143.3Average Weekly Work Hours *
43.045.047.250.060.063.560.060.060.061.565.469.270.073.176.976.976.976.9Median Daily Net Wage (NIS) *
54.448.852.357.366.170.269.471.072.072.273.176.577.281.785.985.885.087.1Average Daily Wage*
Note:
*: Workers in Israel and Settlements are excluded
1995-2012 (ILO)
Basic Changes in the Labour Force Indicators in West Bank During 1995 - 2012 (ILO Standards)
41

PCBS: labour Force Survey, Q1- 2013 نPCBC : 2013مسح القوى العاملة، الربع األول
199519961997199819992000200120022003200420052006200720082009201020112012Indicator
35.436.435.736.438.037.433.234.237.336.236.536.037.938.137.636.438.440.1Labour Force Participation Rate
7.37.06.35.98.810.67.06.49.29.19.18.111.011.712.210.212.414.7Women Labour Force Participation
48.657.568.876.881.278.864.160.367.362.667.460.665.653.055.956.564.962.7Full Employment Rate
22.010.04.42.31.92.31.91.83.62.12.34.64.76.45.55.76.46.3Underemployment Rate
29.432.526.820.916.918.734.037.929.135.330.334.829.740.638.637.828.731.0Unemployment Rate
28.631.429.825.219.318.723.828.026.631.435.232.229.742.845.847.844.050.1Unemployment Rate among Women
10.89.18.08.015.216.311.416.717.513.511.811.113.110.76.47.79.68.4Employed in Agriculture
15.413.116.520.517.813.34.46.310.48.19.25.94.30.90.93.06.07.7Employed in Construction
15.214.914.513.613.111.49.68.89.29.18.36.36.64.55.44.85.55.4Employed in Manufacturing
35.241.438.937.036.541.453.447.540.749.049.453.950.960.163.360.652.952.6Employed in Services
18.429.329.530.926.418.710.814.215.713.014.413.19.911.311.415.816.115.3Elementary Occupation Workers
23.521.223.623.822.218.714.113.315.814.714.010.411.77.77.68.29.910.7Craft and Related Trade Workers
3.38.111.016.215.712.61.82.53.11.10.4-------Employed in Israel & Settlements
6.14.43.74.02.83.35.12.72.31.92.64.23.23.54.44.23.93.7Employers
20.419.421.019.719.117.319.724.524.722.322.619.521.218.514.914.317.716.0Self - Employed
62.667.368.471.071.169.567.563.461.566.467.069.564.369.976.478.972.774.1Wage Employees
10.88.96.95.37.09.97.79.411.59.47.86.811.38.14.32.65.76.2Unpaid Family Members
21.723.324.024.024.024.424.624.122.623.324.024.023.324.723.623.423.423.6Average Monthly Work Days *
43.244.043.043.043.241.840.240.040.641.641.239.939.940.839.438.837.937.1Average Weekly Work Hours *
34.635.038.540.046.247.050.050.050.052.557.765.457.757.757.746.250.050.0Median Daily Net Wage (NIS) *
42.542.444.046.951.052.554.255.053.458.362.069.065.160.962.758.261.664.3Average Daily Wage*
Note:
*: Workers in Israel and Settlements are excluded
(-) means there are no enough observations in this section.
Basic Changes in the Labour Force Indicators in Gaza Strip During 1995 - 2012 (ILO Standards)
1995-2012 (ILO)
42

:PCBS3102PCBS: labour Force Survey, Q1- 2013
The date of field work for every round
Round Number The Round
Round (37) April - June, 3112 3112 77
Round (38) July - September, 3112 3112 73
Round (39) October -December, 2005 3112 73
Round (40) January - March, 3112 3112 04
Round (04) April - June, 3112 3112 04
Round (42) July - September, 3112 3112 04
Round (43) October -December, 2006 3112 07
Round (00) January - March, 3112 3112 00
Round (05) April - June, 3112 3112 05
Round (46) July - September, 3112 3112 04
Round (47) October -December, 2007 3112 07
Round (03) January - March, 3112 3112 03
Round (03) April - June, 3112 3112 03
Round (50) July - September, 3112 3112 54
Round (51) October –December, 2008 3112 54
Round (54) January - March, 3112 3112 54
Round (57) April - June, 3112 3112 57
Round (54) July - September, 3112 3112 50
Round (55) October –December, 2009 3112 55
Round (56) January – March, 2010 3101 54
Round (57) April –June, 2010 3101 57
Round (58) July - September, 3101 3101 53
Round (59) October –December, 2010 3101 53
Round (60) January – March, 2011 3100 44
Round (61) April –June, 2011 3100 44
Round (62) July - September, 3100 3100 44
Round (63) October –December, 2011 3100 47
Round (64) January – March, 2012 3103 40
Round (45) April - June, 3103 3103 45
Round (46) July - September, 3103 3103 44
Round (47) October –December, 2012 3103 47
Round (68) January – March, 2013 3102 43