Embed Size (px)
Citation preview

1 State of Municipal Education in Mumbai
WHITE PAPER
State of Municipal Education
in Mumbai
December 2015

2 State of Municipal Education in Mumbai
Table of Contents
Sr. No. Title Page No.
I I. Foreword 5
II II. Acknowledgement 4
III Section I. Summary of RTI Data 7
IV A. Outcome Indicators 7
V B. Annual Municipal Budget for Education 13
VI C. Monitoring and Evaluation 16
VII a) Teacher Inspection Reports 19
VIII b) Enquiries conducted against Teaching staff (Teachers/HMs) and suspensions 20
IX c) Continuous Comprehensive Evaluation 20
X D. Compliance with norms laid down under Right to Education Act 23
XI Section II. Deliberation by Municipal Councillors and MLAs 28
XII Section III. Data from Household Survey 34
XIII IV. Ward-wise Data 37
XIV Annexure 1 – Survey Methodology 43
XV Annexure 2 – Socio Economic Classification (SEC) Note 44
XVI Annexure 3 – Inspection Report Form 43
Chart
1 Chart 1: Reasons for not being happy with Municipal School (%) 36
Tables
1 Table 1: Total Enrolments in Mumbai’s Municipal Schools 2010 - 2015 7
2 Table 2: Total Dropouts in Mumbai’s Municipal Schools 2010 - 2015 8
3 Table 3: Transition Rate of Students from Class 7 to Class 8 in 2014-15 9
4 Table 4: Retention Rate in Municipal Schools- Class 1 to Class 7 9
5 Table 5: Change in Class I Enrolments 2008 to 2015 10
6 Table 6: Medium-wise Class I Enrolments 2009 to 2015 11
7 Table 7: Comparison between MCGM and Private Schools: SSC Results 12
8 Table 8: Comparison between Private and MCGM Schools: Scholarships for 4th and 7th Standard
12
9 Table 9: Annual Municipal Budget and Per-capita allocation for Students 13
10 Table 10: Per-child Allocation and Expenditure (In Rs. Crore) 14
11 Table 11: Budgeted vs. Actual Expenditure Summary 2014-16 for Primary Education (In Rs. Crore)
15
12 Table 12: Strength of the School Inspection Unit 2012-15 17
13 Table 13: Inspection norms for School Inspectors 17
14 Table 14: Medium-wise Inspectors 2014-15 18

3 State of Municipal Education in Mumbai
15 Table 15: L, M/East and P/North ward Teacher Inspection Data 19
16 Table 16: CCE data for Wards L, M/E and P/N for 2014-15 21
17 Table 17: Percentage of Students graded ‘E2’ i.e. continuously absent in wards L, M/E and P/N in 2014-15
21
18 Table 18: Compliance with Infrastructure and other norms under RTE 23
19 Table 19: Infrastructure of MCGM schools 24
20 Table 20: Student Classroom Ratio (SCR)/Pupil Teacher Ratio (PTR) and Teacher Classroom Ratio in Mumbai
25
21 Table 21: Medium Wise Pupil (Student) Teacher Ratio in 2014-15 26
22 Table 22: Schools with School Management Committees in 2014-15 27
23 Table 23: Number of questions asked and Number of meetings by Councillors on Education in all Committees
28
24 Table 24: Category wise number of Questions asked by Councillors on Education 28
25 Table 25: Questions asked by Education Committee Members in 2012-13 and 2014-15
29
26 Table 26: Ward-wise questions asked by councillors on Education in the year April’14 to March’15
30
27 Table 27: Issues raised/Questions asked by Councillors in the year April’14 to March’15
31
28 Table 28: Questions asked by MLAs on Education 32
29 Table 29: Issue-wise questions asked by MLAs on Education 33
30 Table 30: Current Medium of Education (%) 34
31 Table 31: Respondents from Table 1 whose current medium of education is other than English and would want to change to English medium (%)
35
32 Table 32: Respondents taking private tuitions/coaching classes (%) 35
33 Table 33: Details on source of Tuitions (%) 35
34 Table 34: Percentage happy with the School 36
35 Table 35: Ward-wise Total Number of Students in Municipal Schools in Mumbai 37
36 Table 36: Ward-wise drop in Enrolments between 2010-11 and 2014-15 38
37 Table 37: Ward-wise Total Number of Dropout in Municipal Schools in Mumbai 39
38 Table 38: Ward-wise Total Number of Teachers in Municipal Schools in Mumbai 40
39 Table 39: Ward-wise Total Number of Passouts in Municipal Schools in Mumbai 41
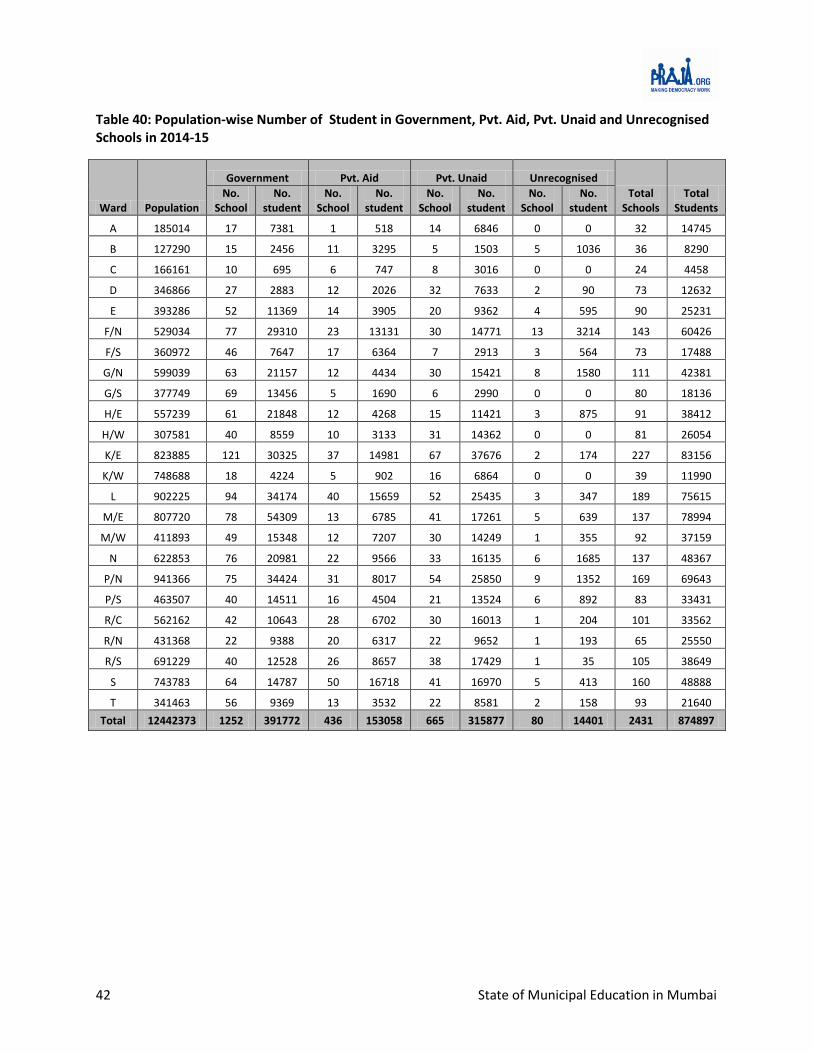
40 Table 40: Population-wise Number of Student in Government, Pvt. Aid, Pvt. Unaid and Unrecognised Schools in 2014-15
42
4 State of Municipal Education in Mumbai
I. Acknowledgement
Praja has obtained the data used in compiling this report card through Right to Information Act, 2005.
Hence it is very important to acknowledge the RTI Act and everyone involved, especially from the
officials who have provided us this information diligently.
We are also most grateful to – our Elected Representatives, the Civil Society Organisations (CSOs) and
journalists who utilise and publicise our data and, by doing so, ensure that awareness regarding various
issues we discuss is distributed to a wide ranging population. We would also like to extend our gratitude
to all government officials for their cooperation and support.
This report has been made possible by the support provided to us by our friends, supporters, volunteers
and interns. We would particularly like to appreciate the help provided by Prasad Baliga, who
volunteered with us and helped us to analyse some of the key data points in this report. It’s important
here to acknowledge Hansa Research for conducting the opinion poll. We would like to take this
opportunity to express our sincere gratitude to all.
Praja Foundation also appreciates the support given by our supporters and donors, namely Dasra, TATA
Trusts, Friedrich Naumann Foundation, Narotam Sekhsaria Foundation and Madhu Mehta Foundation.
We would like to thank our group of Advisors & Trustees and lastly but not the least, we would like to
acknowledge the contributions of all members of Praja’s team, who worked to make this report a
reality.
Madhu Mehta Foundation
Tata Trusts have supported Praja Foundation in this project. The Trusts believe in a society of well-informed citizens and it is to this effect that Tata Trusts supports Praja’s efforts to communicate with and enable citizens to interact with their administration through
innovative and effective methods.
5 State of Municipal Education in Mumbai
II. Foreword
Our Prime Minister believes in the power of the youth and wants to make our nation a knowledge super
power with the programmes like Digital India, Smart Cities and Skill India. The goal of such programs
being that youth of our country be skilled and is prepared to face the challenges of the country in the
21st century. The education system, especially the primary education forms the base of any country
which hopes to be a knowledge economy. But the picture is blurry going by the state of education in the
public (municipal) schools in country’s economic capital, Mumbai.
In the last five years, enrolment in schools run by MCGM (Municipal Corporation of Greater Mumbai)
has dropped by around 40,778 students, an aggregate drop of 9%. The class 1 enrolment is decreasing at
a more alarming rate than ever. In fact by using a time series-regression we have estimated the year
when in 2008-09, 63,392 students entered class 1 and for 2014-15 39,214 students entered, this figure is
estimated to drop to 31,096 for academic year 2018-19. At this rate, the day is not far when the
municipal schools will probably have more teachers and other employees than students.
The reason for such a mass exodus from municipal schools is simple – lack of quality education and
quality of teacher; as per our citizen survey 2015 of 22,850 households the above two are amongst the
top reasons for dissatisfaction amongst parents of municipal schools students, with 44% and 42%
respondents sighting the two reasons respectively.
Why does the quality of Municipal Education suffer? Why are the parents shifting their children to
private schools?
- When MCGM plans to spend Rs. 50,534 per child as per their budget estimates for 2015-16?
- When the students are not only given free education but also 27 free items (including school
uniforms, books, raincoats, etc)?
- When the School Inspectors are ranking the quality of their teachers as good or excellent?
- When in the internal CCE (Continuous Comprehensive Evaluation) under the RTE (Right to
Education) Act, most of the students is getting more the 60% marks?
- When the infrastructure compliance under RTE is of almost 100%?
A cursory comparison between private schools and MCGM schools shows the gap between the quality
of education on comparable outcome indicators: the data on scholarship clearly highlights this fact, only
1.6% of 4th standard students and 0.3% of 7th Standard students who appeared for scholarship exam
from MCGM schools received scholarship in comparison to 9.8 % and 8.8% in private schools
respectively; while the gap between MCGM SSC passout and private schools is 13%.
Under the Sixth pay commission, municipal employees are getting Rs. 6000 for school education – why
do the tax payers have to bear this expense when we run upto 1200 schools across the city, can’t our
employees send their children to the schools run and managed by them? Under this scheme MCGM
spent about Rs. 1,68,11000/- in 2014-15.

6 State of Municipal Education in Mumbai
Further adding to the existing issues faced by the education department is the lack of interest on the
part of our elected representatives, which is highlighted by the number of questions raised on education
by them in the designated forums. Over 166 councillors have not asked a single question on the issue of
education during the period of April 2014-March 2015. Whereas if we look at number of questions
raised by the education committees members, it is abysmally low at 58 in 2014-15. Out of the total 227
councillors of MCGM only 61 have asked question on the issue of education. In spite of the high dropout
rates in MCGM schools councillors have asked only three questions. While MLAs of Mumbai has asked
213 question on education. There were 4 MLAs who have not asked any question on education.
The lack of interest of our political and administrative leadership shows that they are least concerned
about providing education.
Talk to make Mumbai a global leader, Make India, Skill India and so on will remain empty promises until
we get our act together and bring accountability in the education system.
NITAI MEHTA
Managing Trustee, Praja Foundation
7 State of Municipal Education in Mumbai
Section I. Summary of RTI Data
A. Outcome Indicators
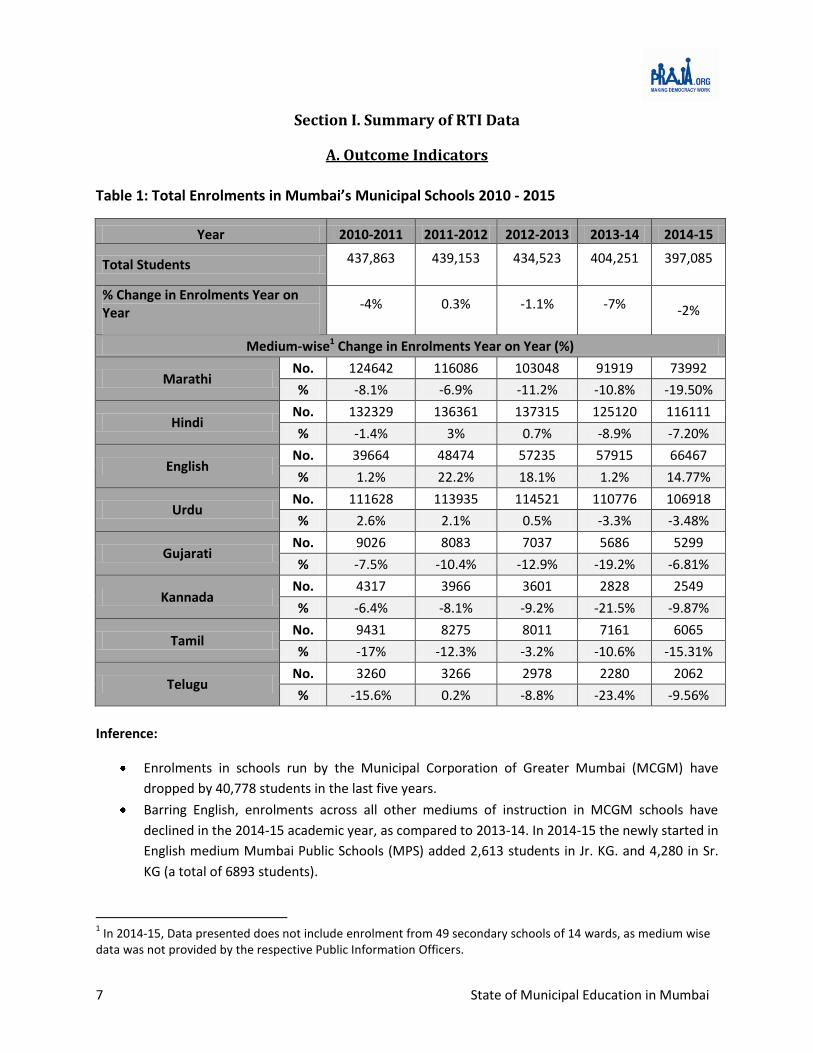
Table 1: Total Enrolments in Mumbai’s Municipal Schools 2010 - 2015
Year 2010-2011 2011-2012 2012-2013 2013-14 2014-15
Total Students 437,863 439,153 434,523 404,251 397,085
% Change in Enrolments Year on Year
-4% 0.3% -1.1% -7% -2%
Medium-wise1 Change in Enrolments Year on Year (%)
Marathi No. 124642 116086 103048 91919 73992
% -8.1% -6.9% -11.2% -10.8% -19.50%
Hindi No. 132329 136361 137315 125120 116111
% -1.4% 3% 0.7% -8.9% -7.20%
English No. 39664 48474 57235 57915 66467
% 1.2% 22.2% 18.1% 1.2% 14.77%
Urdu No. 111628 113935 114521 110776 106918
% 2.6% 2.1% 0.5% -3.3% -3.48%
Gujarati No. 9026 8083 7037 5686 5299
% -7.5% -10.4% -12.9% -19.2% -6.81%
Kannada No. 4317 3966 3601 2828 2549
% -6.4% -8.1% -9.2% -21.5% -9.87%
Tamil No. 9431 8275 8011 7161 6065
% -17% -12.3% -3.2% -10.6% -15.31%
Telugu No. 3260 3266 2978 2280 2062
% -15.6% 0.2% -8.8% -23.4% -9.56%
Inference:
Enrolments in schools run by the Municipal Corporation of Greater Mumbai (MCGM) have
dropped by 40,778 students in the last five years.
Barring English, enrolments across all other mediums of instruction in MCGM schools have
declined in the 2014-15 academic year, as compared to 2013-14. In 2014-15 the newly started in
English medium Mumbai Public Schools (MPS) added 2,613 students in Jr. KG. and 4,280 in Sr.
KG (a total of 6893 students).
1 In 2014-15, Data presented does not include enrolment from 49 secondary schools of 14 wards, as medium wise
data was not provided by the respective Public Information Officers.
8 State of Municipal Education in Mumbai
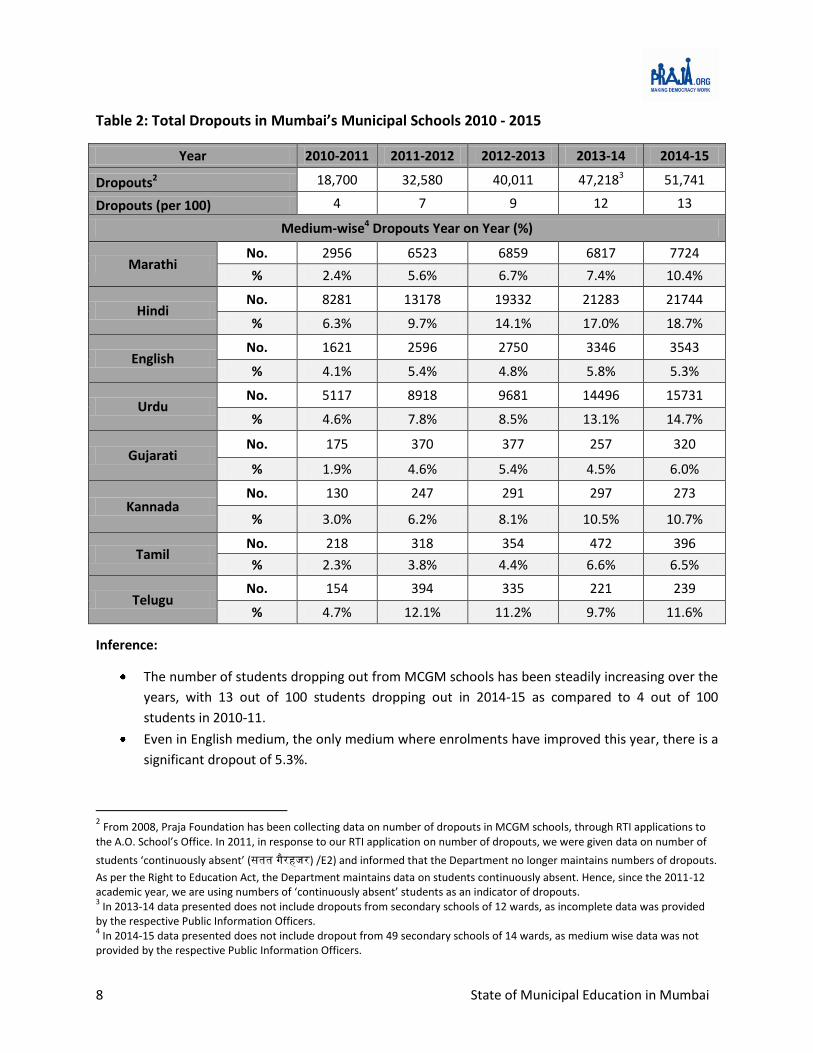
Table 2: Total Dropouts in Mumbai’s Municipal Schools 2010 - 2015
Year 2010-2011 2011-2012 2012-2013 2013-14 2014-15
Dropouts2 18,700 32,580 40,011 47,2183 51,741
Dropouts (per 100) 4 7 9 12 13
Medium-wise4 Dropouts Year on Year (%)
Marathi No. 2956 6523 6859 6817 7724
% 2.4% 5.6% 6.7% 7.4% 10.4%
Hindi No. 8281 13178 19332 21283 21744
% 6.3% 9.7% 14.1% 17.0% 18.7%
English No. 1621 2596 2750 3346 3543
% 4.1% 5.4% 4.8% 5.8% 5.3%
Urdu No. 5117 8918 9681 14496 15731
% 4.6% 7.8% 8.5% 13.1% 14.7%
Gujarati No. 175 370 377 257 320
% 1.9% 4.6% 5.4% 4.5% 6.0%
Kannada No. 130 247 291 297 273
% 3.0% 6.2% 8.1% 10.5% 10.7%
Tamil No. 218 318 354 472 396
% 2.3% 3.8% 4.4% 6.6% 6.5%
Telugu No. 154 394 335 221 239
% 4.7% 12.1% 11.2% 9.7% 11.6%
Inference:
The number of students dropping out from MCGM schools has been steadily increasing over the
years, with 13 out of 100 students dropping out in 2014-15 as compared to 4 out of 100
students in 2010-11.
Even in English medium, the only medium where enrolments have improved this year, there is a
significant dropout of 5.3%.
2 From 2008, Praja Foundation has been collecting data on number of dropouts in MCGM schools, through RTI applications to
the A.O. School’s Office. In 2011, in response to our RTI application on number of dropouts, we were given data on number of
students ‘continuously absent’ (सतत ) /E2) and informed that the Department no longer maintains numbers of dropouts.
As per the Right to Education Act, the Department maintains data on students continuously absent. Hence, since the 2011-12 academic year, we are using numbers of ‘continuously absent’ students as an indicator of dropouts. 3 In 2013-14 data presented does not include dropouts from secondary schools of 12 wards, as incomplete data was provided
by the respective Public Information Officers. 4 In 2014-15 data presented does not include dropout from 49 secondary schools of 14 wards, as medium wise data was not
provided by the respective Public Information Officers.
9 State of Municipal Education in Mumbai
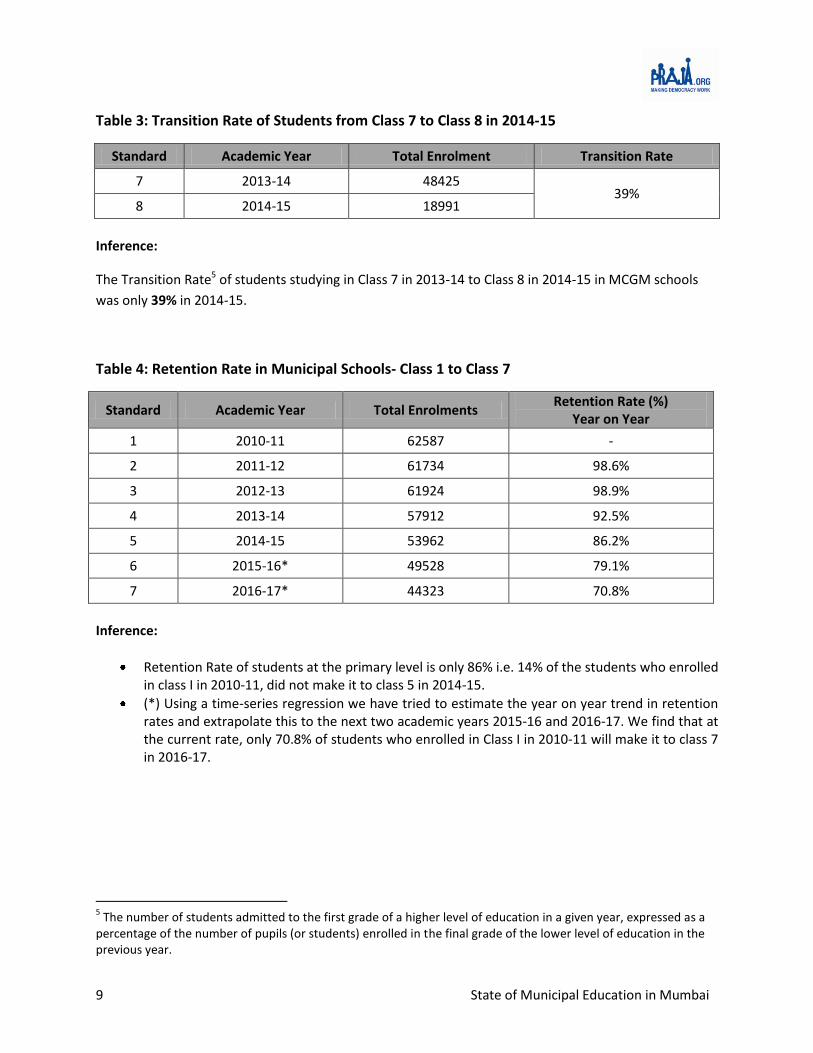
Table 3: Transition Rate of Students from Class 7 to Class 8 in 2014-15
Standard Academic Year Total Enrolment Transition Rate
7 2013-14 48425 39%
8 2014-15 18991
Inference:
The Transition Rate5 of students studying in Class 7 in 2013-14 to Class 8 in 2014-15 in MCGM schools
was only 39% in 2014-15.
Table 4: Retention Rate in Municipal Schools- Class 1 to Class 7
Standard Academic Year Total Enrolments Retention Rate (%)
Year on Year
1 2010-11 62587 -
2 2011-12 61734 98.6%
3 2012-13 61924 98.9%
4 2013-14 57912 92.5%
5 2014-15 53962 86.2%
6 2015-16* 49528 79.1%
7 2016-17* 44323 70.8%
Inference:
Retention Rate of students at the primary level is only 86% i.e. 14% of the students who enrolled in class I in 2010-11, did not make it to class 5 in 2014-15.
(*) Using a time-series regression we have tried to estimate the year on year trend in retention rates and extrapolate this to the next two academic years 2015-16 and 2016-17. We find that at the current rate, only 70.8% of students who enrolled in Class I in 2010-11 will make it to class 7 in 2016-17.
5 The number of students admitted to the first grade of a higher level of education in a given year, expressed as a
percentage of the number of pupils (or students) enrolled in the final grade of the lower level of education in the previous year.
10 State of Municipal Education in Mumbai
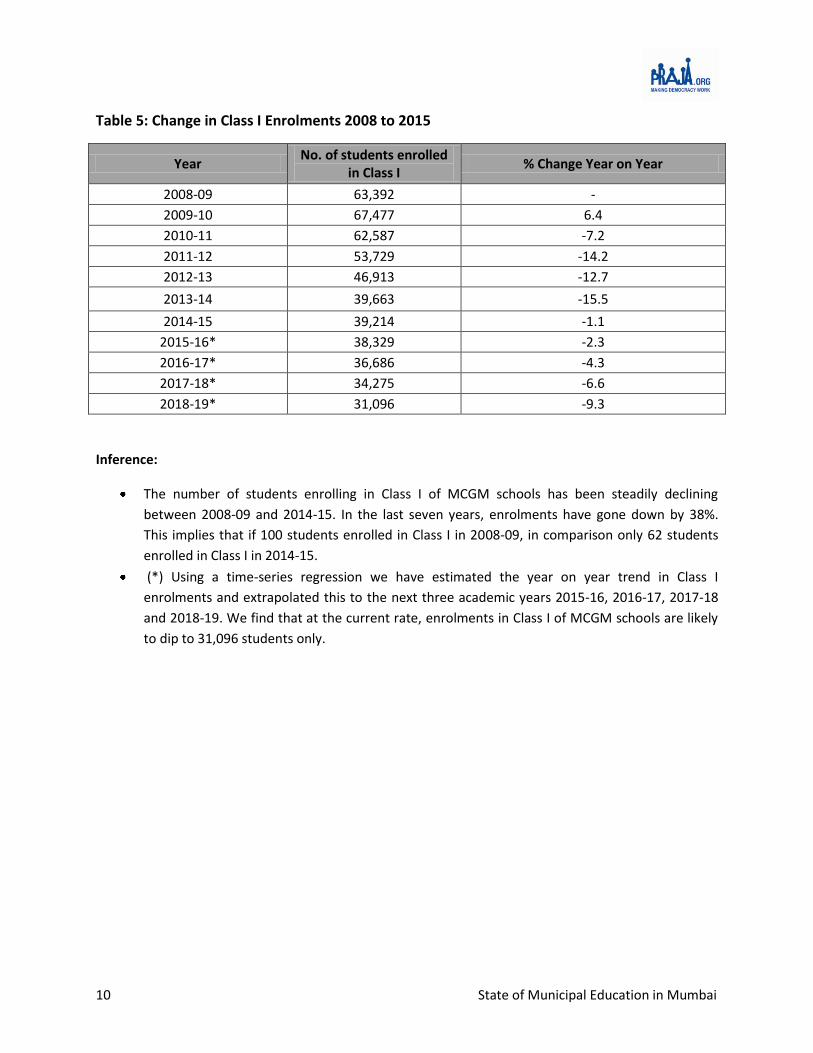
Table 5: Change in Class I Enrolments 2008 to 2015
Year No. of students enrolled
in Class I % Change Year on Year
2008-09 63,392 -
2009-10 67,477 6.4
2010-11 62,587 -7.2
2011-12 53,729 -14.2
2012-13 46,913 -12.7
2013-14 39,663 -15.5
2014-15 39,214 -1.1
2015-16* 38,329 -2.3
2016-17* 36,686 -4.3
2017-18* 34,275 -6.6
2018-19* 31,096 -9.3
Inference:
The number of students enrolling in Class I of MCGM schools has been steadily declining
between 2008-09 and 2014-15. In the last seven years, enrolments have gone down by 38%.
This implies that if 100 students enrolled in Class I in 2008-09, in comparison only 62 students
enrolled in Class I in 2014-15.
(*) Using a time-series regression we have estimated the year on year trend in Class I
enrolments and extrapolated this to the next three academic years 2015-16, 2016-17, 2017-18
and 2018-19. We find that at the current rate, enrolments in Class I of MCGM schools are likely
to dip to 31,096 students only.
11 State of Municipal Education in Mumbai
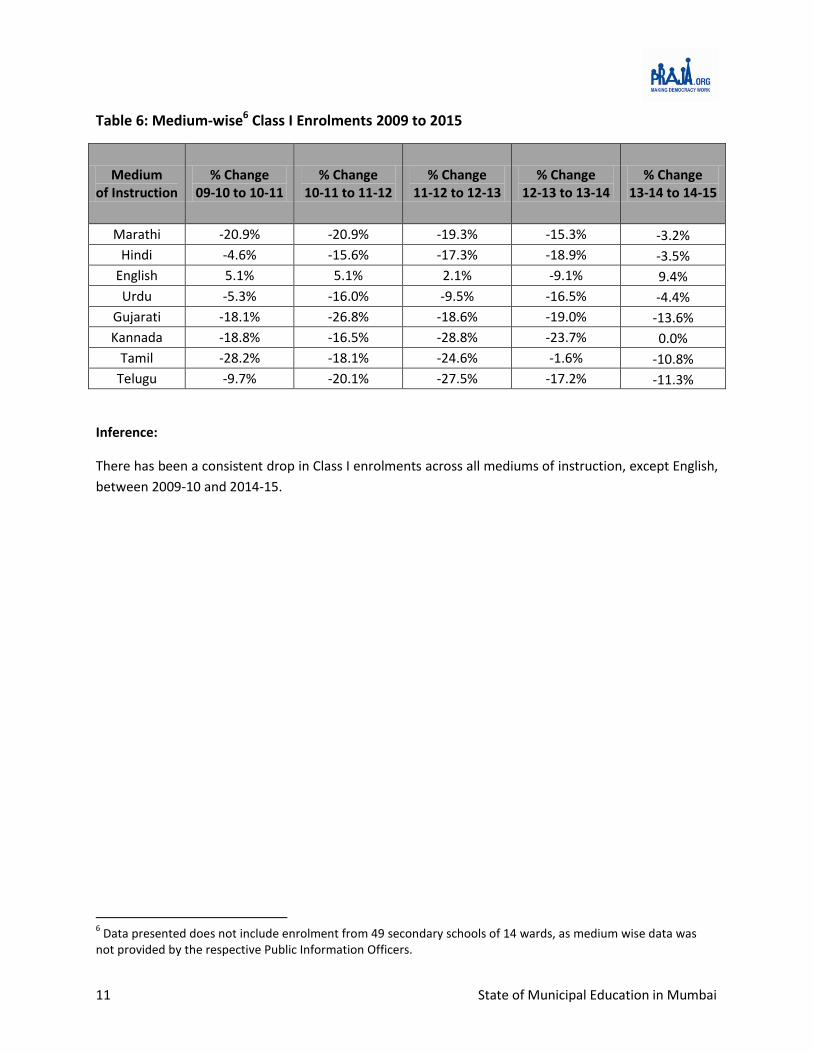
Table 6: Medium-wise6 Class I Enrolments 2009 to 2015
Medium of Instruction
% Change 09-10 to 10-11
% Change 10-11 to 11-12
% Change 11-12 to 12-13
% Change 12-13 to 13-14
% Change 13-14 to 14-15
Marathi -20.9% -20.9% -19.3% -15.3% -3.2%
Hindi -4.6% -15.6% -17.3% -18.9% -3.5%
English 5.1% 5.1% 2.1% -9.1% 9.4%
Urdu -5.3% -16.0% -9.5% -16.5% -4.4%
Gujarati -18.1% -26.8% -18.6% -19.0% -13.6%
Kannada -18.8% -16.5% -28.8% -23.7% 0.0%
Tamil -28.2% -18.1% -24.6% -1.6% -10.8%
Telugu -9.7% -20.1% -27.5% -17.2% -11.3%
Inference:
There has been a consistent drop in Class I enrolments across all mediums of instruction, except English,
between 2009-10 and 2014-15.
6 Data presented does not include enrolment from 49 secondary schools of 14 wards, as medium wise data was
not provided by the respective Public Information Officers.

12 State of Municipal Education in Mumbai
Table 7: Comparison between MCGM and Private Schools: SSC Results
Year
No. of Candidates Appeared Total Pass Pass in (%)
MCGM School
Private School
MCGM School
Private School
MCGM School
Private School
Mar-11 11,515 159,572 6,806 131,230 59 82
Mar-12 12,466 164,526 7,623 136,187 61 83
Mar-13 12,856 164,010 7,658 131,785 60 80
Mar-14 12,379 159,621 8,267 132,626 67 83
Mar-15 10,779 159,913 7,809 136,686 72 85
Inference:
The percentage of MCGM students passing SSC exams was 72% in 2014-15 and that of Private schools
was 85%. While the percentage of MCGM students passing SSC exams this year has improved
significantly over last year’s 67%, it is still not at par with that of private schools.
Table 8: Comparison between Private and MCGM Schools: Scholarships7for 4th and 7th Standard
Middle School Scholarship Examination (4th Standard)
Year Candidates Appeared Scholarship Holders Scholarship Holders in %
MCGM School
Private School
MCGM School
Private School
MCGM School
Private School
2011-12 9,637 21,998 43 2,044 0.4% 9.3%
2012-13 5,426 21,223 23 1,954 0.4% 9.2%
2013-14 2,621 20,660 33 1,944 1.3% 9.4%
2014-15 5,634 19,351 88 1,889 1.6% 9.8%
High School Scholarship Examination (7th Standard)
2011-12 7,160 19,227 8 1,758 0.1% 9.1%
2012-13 4,283 20,190 6 1,611 0.1% 8.0%
2013-14 1,727 19,982 2 1,615 0.1% 8.1%
2014-15 3,799 18,284 12 1,605 0.3% 8.8%
Inference:
Compared to last years, scholarship holders in MCGM schools in 4th Standard have improved significantly. However, compared to 9.8% in private schools only 1.6% of 4th Std students who appeared for the Middle School Scholarship exam received the scholarship in 2014-15 from MCGM schools; while compared to 8.8% in private schools, only 0.3% of 7th Std students who appeared for the High School Scholarship exam from MCGM schools received the scholarship in 2014-15.
7The scholarship exams are conducted by the Maharashtra State Council of Examinations: 1.To undertake talent search
at the end of Primary Schooling i.e. at the end of 4th or 7th Standard. 2. To nurture and encourage the talented and deserving students by recognising and provide them financial support. (Source: MAHARASHTRA STATE COUNCIL OF EXAMINATIONS - http://msce.mah.nic.in/home.htm)

13 State of Municipal Education in Mumbai
B. Annual Municipal Budget for Education
Table 9: Annual Municipal Budget and Per-capita allocation for Students
Year Total Annual Budget
(Rs. in crores) Total Students
2010-11 1,761 437,863
2011-12 1,800 439,153
2012-13 2,388 434,523
2013-14 2,613 404,251
2014-15 2,773 397,085
2015-16 2,630 397,085
Inference:
According to the 2015-16 budget estimates, the annual MCGM Budget for Education (primary and secondary) has remained somewhat same from last three years.
The Budget Allocation has almost doubled between 2010-11 and 2015-16.
14 State of Municipal Education in Mumbai
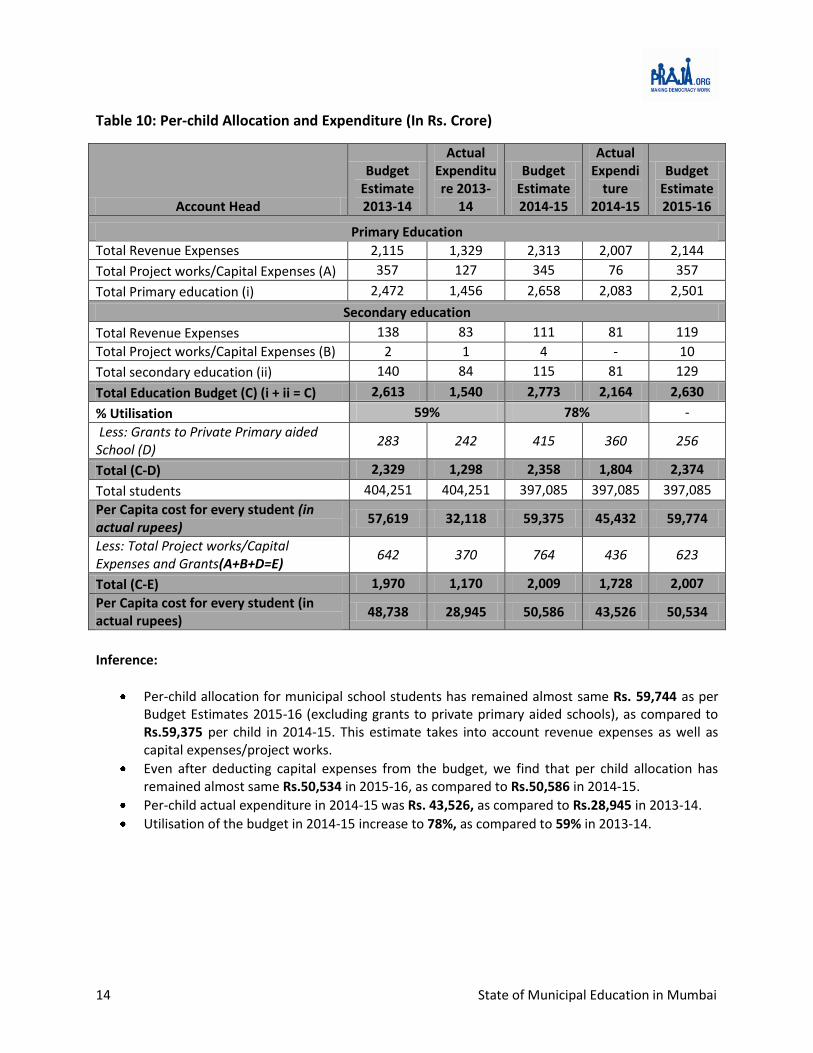
Table 10: Per-child Allocation and Expenditure (In Rs. Crore)
Account Head
Budget Estimate 2013-14
Actual Expenditure 2013-
14
Budget Estimate 2014-15
Actual Expendi
ture 2014-15
Budget Estimate 2015-16
Primary Education
Total Revenue Expenses 2,115 1,329 2,313 2,007 2,144
Total Project works/Capital Expenses (A) 357 127 345 76 357
Total Primary education (i) 2,472 1,456 2,658 2,083 2,501
Secondary education
Total Revenue Expenses 138 83 111 81 119
Total Project works/Capital Expenses (B) 2 1 4 - 10
Total secondary education (ii) 140 84 115 81 129
Total Education Budget (C) (i + ii = C) 2,613 1,540 2,773 2,164 2,630
% Utilisation 59% 78% -
Less: Grants to Private Primary aided School (D)
283 242 415 360 256
Total (C-D) 2,329 1,298 2,358 1,804 2,374
Total students 404,251 404,251 397,085 397,085 397,085
Per Capita cost for every student (in actual rupees)
57,619 32,118 59,375 45,432 59,774
Less: Total Project works/Capital Expenses and Grants(A+B+D=E)
642 370 764 436 623
Total (C-E) 1,970 1,170 2,009 1,728 2,007
Per Capita cost for every student (in actual rupees)
48,738 28,945 50,586 43,526 50,534
Inference:
Per-child allocation for municipal school students has remained almost same Rs. 59,744 as per Budget Estimates 2015-16 (excluding grants to private primary aided schools), as compared to Rs.59,375 per child in 2014-15. This estimate takes into account revenue expenses as well as capital expenses/project works.
Even after deducting capital expenses from the budget, we find that per child allocation has remained almost same Rs.50,534 in 2015-16, as compared to Rs.50,586 in 2014-15.
Per-child actual expenditure in 2014-15 was Rs. 43,526, as compared to Rs.28,945 in 2013-14.
Utilisation of the budget in 2014-15 increase to 78%, as compared to 59% in 2013-14.
15 State of Municipal Education in Mumbai
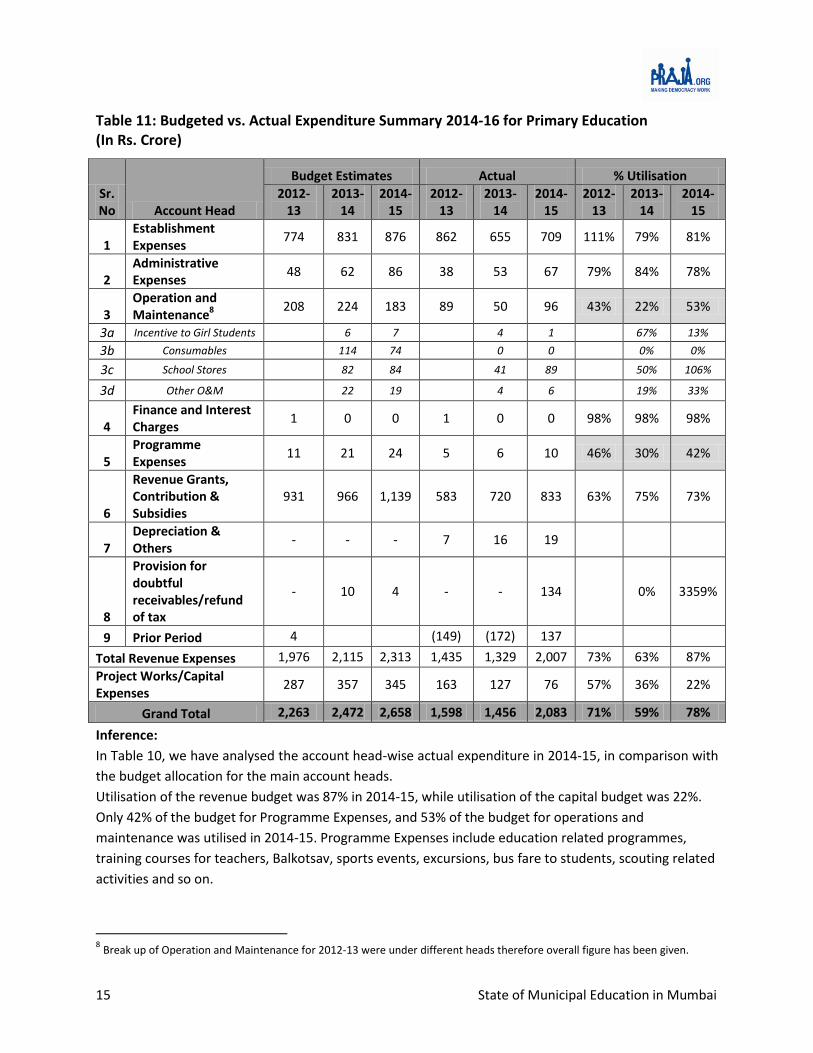
Table 11: Budgeted vs. Actual Expenditure Summary 2014-16 for Primary Education (In Rs. Crore)
Sr. No Account Head
Budget Estimates Actual % Utilisation
2012-13
2013-14
2014-15
2012-13
2013-14
2014-15
2012-13
2013-14
2014-15
1 Establishment Expenses
774 831 876 862 655 709 111% 79% 81%
2 Administrative Expenses
48 62 86 38 53 67 79% 84% 78%
3 Operation and Maintenance8
208 224 183 89 50 96 43% 22% 53%
3a Incentive to Girl Students
6 7
4 1
67% 13%
3b Consumables
114 74
0 0
0% 0%
3c School Stores
82 84
41 89
50% 106%
3d Other O&M
22 19
4 6
19% 33%
4 Finance and Interest Charges
1 0 0 1 0 0 98% 98% 98%
5 Programme Expenses
11 21 24 5 6 10 46% 30% 42%
6
Revenue Grants, Contribution & Subsidies
931 966 1,139 583 720 833 63% 75% 73%
7 Depreciation & Others
- - - 7 16 19
8
Provision for doubtful receivables/refund of tax
- 10 4 - - 134
0% 3359%
9 Prior Period 4
(149) (172) 137
Total Revenue Expenses 1,976 2,115 2,313 1,435 1,329 2,007 73% 63% 87%
Project Works/Capital Expenses
287 357 345 163 127 76 57% 36% 22%
Grand Total 2,263 2,472 2,658 1,598 1,456 2,083 71% 59% 78%
Inference:
In Table 10, we have analysed the account head-wise actual expenditure in 2014-15, in comparison with
the budget allocation for the main account heads.
Utilisation of the revenue budget was 87% in 2014-15, while utilisation of the capital budget was 22%.
Only 42% of the budget for Programme Expenses, and 53% of the budget for operations and
maintenance was utilised in 2014-15. Programme Expenses include education related programmes,
training courses for teachers, Balkotsav, sports events, excursions, bus fare to students, scouting related
activities and so on.
8 Break up of Operation and Maintenance for 2012-13 were under different heads therefore overall figure has been given.
16 State of Municipal Education in Mumbai
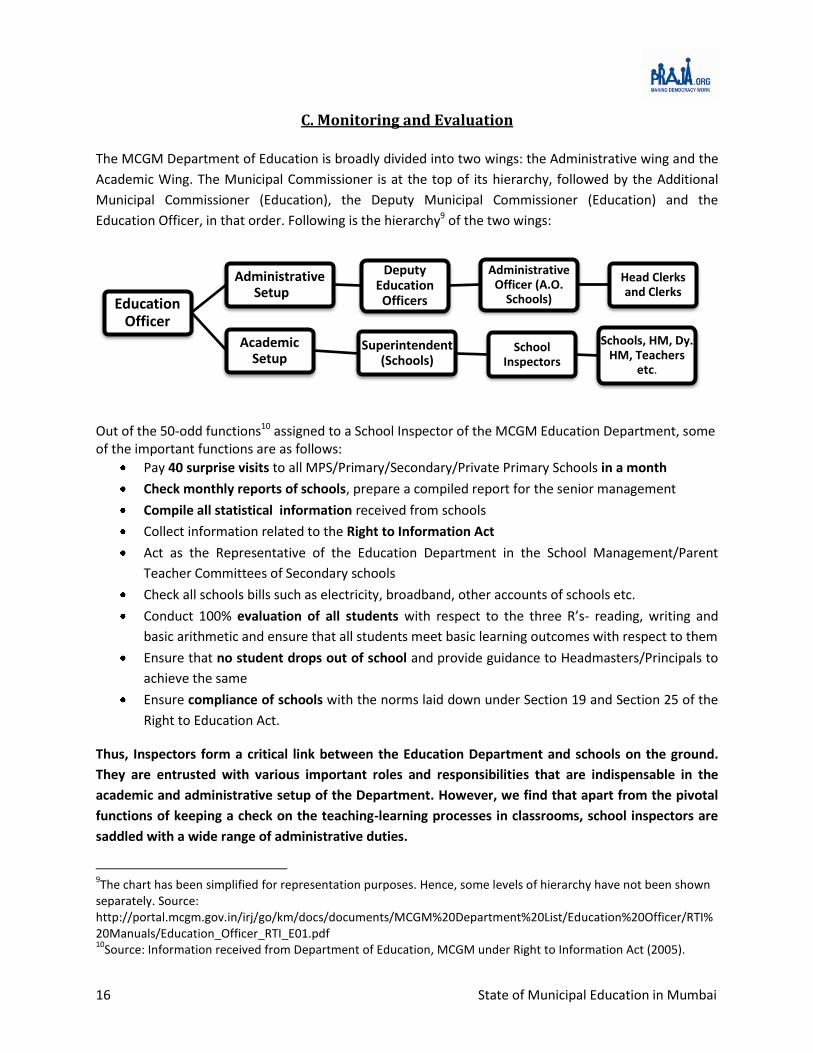
EducationOfficer
Administrative Setup
Deputy Education Officers
Administrative Officer (A.O.
Schools)
Head Clerks and Clerks
Academic Setup
Superintendent (Schools)
School Inspectors
Schools, HM, Dy. HM, Teachers
etc.
C. Monitoring and Evaluation
The MCGM Department of Education is broadly divided into two wings: the Administrative wing and the
Academic Wing. The Municipal Commissioner is at the top of its hierarchy, followed by the Additional
Municipal Commissioner (Education), the Deputy Municipal Commissioner (Education) and the
Education Officer, in that order. Following is the hierarchy9 of the two wings:
Out of the 50-odd functions10 assigned to a School Inspector of the MCGM Education Department, some of the important functions are as follows:
Pay 40 surprise visits to all MPS/Primary/Secondary/Private Primary Schools in a month
Check monthly reports of schools, prepare a compiled report for the senior management
Compile all statistical information received from schools
Collect information related to the Right to Information Act
Act as the Representative of the Education Department in the School Management/Parent
Teacher Committees of Secondary schools
Check all schools bills such as electricity, broadband, other accounts of schools etc.
Conduct 100% evaluation of all students with respect to the three R’s- reading, writing and
basic arithmetic and ensure that all students meet basic learning outcomes with respect to them
Ensure that no student drops out of school and provide guidance to Headmasters/Principals to
achieve the same
Ensure compliance of schools with the norms laid down under Section 19 and Section 25 of the
Right to Education Act.
Thus, Inspectors form a critical link between the Education Department and schools on the ground.
They are entrusted with various important roles and responsibilities that are indispensable in the
academic and administrative setup of the Department. However, we find that apart from the pivotal
functions of keeping a check on the teaching-learning processes in classrooms, school inspectors are
saddled with a wide range of administrative duties.
9The chart has been simplified for representation purposes. Hence, some levels of hierarchy have not been shown
separately. Source: http://portal.mcgm.gov.in/irj/go/km/docs/documents/MCGM%20Department%20List/Education%20Officer/RTI%20Manuals/Education_Officer_RTI_E01.pdf 10
Source: Information received from Department of Education, MCGM under Right to Information Act (2005).
17 State of Municipal Education in Mumbai
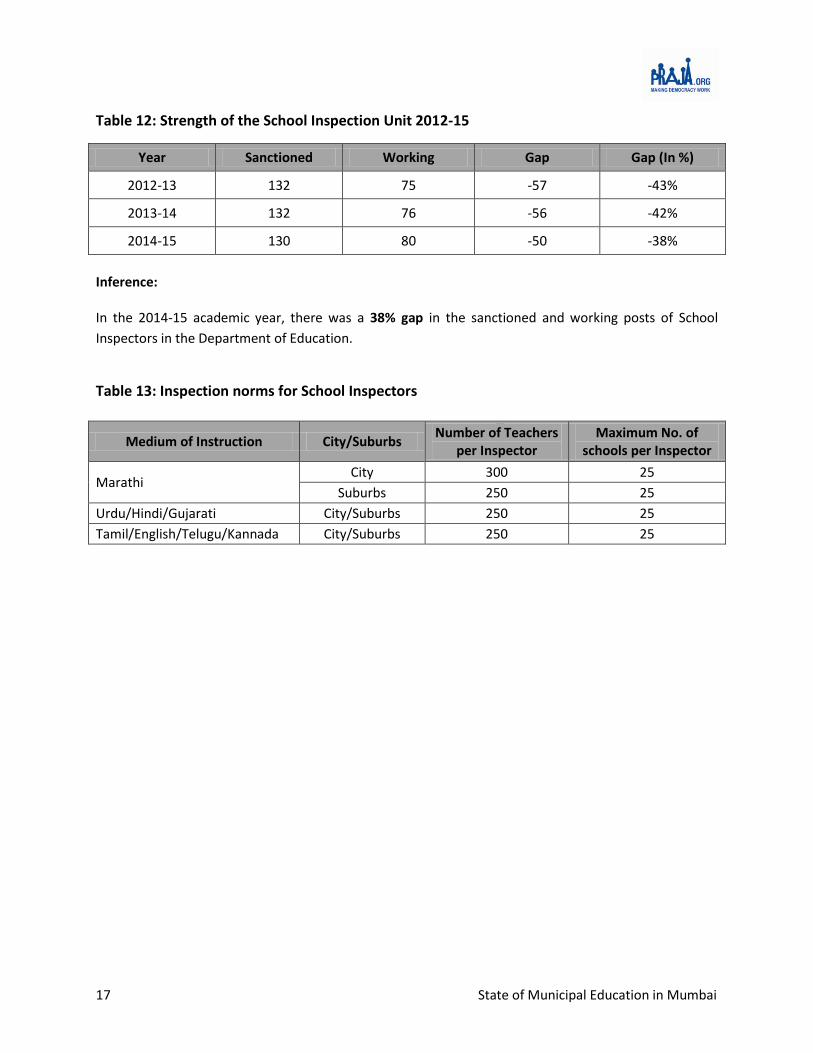
Table 12: Strength of the School Inspection Unit 2012-15
Year Sanctioned Working Gap Gap (In %)
2012-13 132 75 -57 -43%
2013-14 132 76 -56 -42%
2014-15 130 80 -50 -38%
Inference: In the 2014-15 academic year, there was a 38% gap in the sanctioned and working posts of School
Inspectors in the Department of Education.
Table 13: Inspection norms for School Inspectors
Medium of Instruction City/Suburbs Number of Teachers
per Inspector Maximum No. of
schools per Inspector
Marathi City 300 25
Suburbs 250 25
Urdu/Hindi/Gujarati City/Suburbs 250 25
Tamil/English/Telugu/Kannada City/Suburbs 250 25

18 State of Municipal Education in Mumbai
Table 14: Medium-wise Inspectors 2014-15
Medium of Instruction
Teacher11 Available Inspectors Teachers per Inspector
2012-13
2013-14
2014-15
2012-13
2013-
14
2014-
15
2012-13
2013-14
2014-15
Marathi 4829 4,196 3900 26 32 31 186 131 126
Hindi 3360 3,405 3351 19 20 21 177 170 160
English 1196 1,227 1413 10 12 15 120 102 94
Urdu 3087 2,986 2998 9 11 11 343 271 273
Gujarati 398 363 349 1 1 2 398 363 175
Kannada 142 125 116 1 0 0 142 NA NA
Tamil 327 295 280 0 0 0 NA NA NA
Telugu 108 96 89 0 0 0 NA NA NA
Other Department12
9 0 0 NA NA NA
Total 13,447 12,693 12,496 75 76 80 179 167 156
Inference:
As per Department of Education norms13, one school inspector is allocated upto 250 to 300
teachers and a maximum of 25 schools.
The Inspector is expected to carry out inspections of all teachers and schools allocated to
him/her in a given academic year.
In reality, on an average, a school inspector is in charge of 156 teachers. However, the numbers
vary across different mediums of instruction. There are no inspectors for Kannada, Tamil and
Telugu medium schools. For Gujarati medium schools, there are only 2 inspectors for 175
teachers.
11
Source: Information received from Sarva Shiksha Abhiyan, MCGM Department of Education under Right to Information Act (2005) 12
In 2012-13, the inspectors were also give work of other department like Sarv Shiksha Abhiyan, District tanning centre, Virtual Class room and so on than the Medium inspections. 13
Source: Information received from MCGM Department of Education under Right to Information Act (2005)

19 State of Municipal Education in Mumbai
a) Teacher Inspection Reports14
Table 15: L, M/East and P/North ward Teacher Inspection Data
Particulars of Inspection Form L M/East P/North
Dropout (Per 100) 2014-15 17 22 14
Pass out (In %) 2014-15 76 63 73
No. Of Teachers 877 1194 826
No. Of Teachers whose inspection reports provided 406 522 403
% 46 44 49
Usage of examples, case study while teaching Usage 98 95 97
Teaching Aids Use Yes 93 61 99
Student Involvement Good 68 74 79
Formative15 Evaluation Technique Used Yes 97 96 93
Teacher Student Interaction Proper 70 58 67
Entries in the daily lesson plan and actual teaching Complete 98 89 97
Self evaluation by the teacher Good 48 30 69
Prepared test papered or question paper Prepared 90 82 94
Teacher’s Portfolio Good 38 66 63
Subject wise student’s response Good 61 64 72
Inference:
While every teacher is supposed to be evaluated in a given academic year, we received inspection forms for only 46% teachers in L ward, 44% teachers in M/E ward and 49% in P/N ward.
With regards to particulars of inspection, majority of the teachers were rated ‘Good’ on most parameters such as usage of examples/case studies and teaching aids, entries in the daily lesson plan and actual teaching. [[
Teacher Inspection Reports are filled out by school inspectors after evaluation of teachers in Municipal
Schools. Annexure 3 has the detailed questionnaire that the school inspector fills in his/her report. We
studied a sample of Teacher Inspection reports filled out in the academic year 2014-15, to understand
the inspection process followed in MCGM schools, and assess the rigor with which the inspections are
carried out. For the purpose of our analysis, we selected one ward each from the eastern suburbs,
western suburbs and the island city16: M/E, L and P/N, based on the high dropout and low passout rates
of these wards in the 2014-15 academic year as compared to other wards in the region.
14
The Teacher Inspection Form used in the Academic Year 2014-15 is attached in Annexure 3. 15
Evaluation is taken at varying intervals throughout a course to provide information and feedback that will help improve the quality of student learning and the quality of the course itself. Example: Asking students to submit 1 or 2 sentences identifying the main point of a lecture. 16
The analysis has been done on all forms provided by the Respective wards.

20 State of Municipal Education in Mumbai
b) Enquiries conducted against Teaching staff (Teachers/HMs) and suspensions
We filed an RTI application with the Education Department regarding enquiries conducted against
teaching staff and the reasons for the same. We also asked for information on whether any staff
member’s services were terminated and the reasons for the same. Our objective was to get a better
understanding of the accountability mechanisms in place in the Education Department; whether
teaching staff is held accountable for not performing their duties. We found that in the academic years
2011-12, 2012-13, 2013-14 and 2014-15:
Enquiries were conducted against 58 staff members (headmasters, Dy. Headmasters and
teacher/trainers)
12 staff members were terminated from services for various reasons.
c) Continuous Comprehensive Evaluation
Continuous and Comprehensive Evaluation (CCE) refers to a system of school-based assessment of students that is designed to cover all aspects of students' development. The new evaluation system was introduced under the Right to Education Act (2009). It is a developmental process of assessment which emphasizes on two fold objectives, continuity in evaluation, and assessment of broad based learning and behavioural outcomes. The scheme is thus a curricular initiative, attempting to shift emphasis from memorizing to holistic learning. It aims at creating citizens possessing sound values, appropriate skills and desirable qualities besides academic excellence. It is hoped that this will equip the learners to meet the challenges of life with confidence and success. It is the task of school based co-scholastic assessment to focus on holistic development that will lead to lifelong learning. As per the guidelines for evaluation, teachers should aim at helping the child to obtain minimum C2 grade. It will be compulsory for a teacher and school to provide extra guidance and coaching to children who score grade D or below, and help them attain minimum C2 grade. Under any circumstances, no child should be detained in the same class.
We studied CCE forms of students studying in the 4th
and 7th
Std of MCGM schools in the following three wards: L,
M/E and P/N Following is the marking scheme used under CCE:
A1 and A2 as A(marks between 100% to 81%),
B1and B2 as B(marks between 80% to 61%)
C1 and C2 as C (marks between 60% to 40%),
Less than C2 is below 40%.
‘Less than C2’ in turn includes three grades: D, E1 and E2
D:33% to 40%
E1:Students that have never been enrolled in a school. This is an indicator of out of school children.
E2: As per RTE norms, students continuously absent for a month or more are graded as E2 under the
CCE system. This is an indicator of students who are irregular in their attendance.

21 State of Municipal Education in Mumbai
Table 16: CCE data for Wards L, M/E and P/N for 2014-15
Std. A 1 A2 B 1 B 2 C 1 C 2 Less than C 2
1st Language
4th 5.5% 11.7% 16.9% 18.6% 12.3% 4.4% 30.7%
7th 6.6% 15.8% 19.6% 19.7% 13.5% 5.6% 19.2%
2nd Language
4th 2.8% 9.7% 18.7% 24.2% 13.7% 3.8% 27.1%
7th 5.4% 16.0% 19.9% 19.6% 14.7% 5.2% 19.1%
3rd Language
4th 4.9% 10.7% 16.4% 19.3% 12.6% 4.3% 31.8%
7th 5.3% 14.0% 19.9% 21.0% 15.0% 5.6% 19.2%
Maths
4th 5.3% 11.3% 17.2% 19.8% 11.9% 3.8% 30.7%
7th 5.6% 14.3% 20.2% 21.3% 14.5% 5.1% 19.0%
Science
4th 4.7% 10.9% 17.0% 19.6% 12.9% 4.1% 30.8%
7th 6.6% 16.6% 20.4% 19.4% 13.6% 4.3% 19.1%
Social Science
4th 4.7% 12.6% 18.4% 26.0% 10.7% 2.3% 25.3%
7th 6.6% 16.7% 21.0% 18.9% 12.9% 4.6% 19.2%
Table 17: Percentage of Students graded ‘E2’ i.e. continuously absent in wards L, M/E and P/N in 2014-15
Std. E2
4th 25%
7th 17%
Inference:
25% of students studying in Std. 4 in wards L, M/E and P/N remained continuously absent (E2) in the academic year 2014-15
17% of studying in Std. 7 in wards L, M/E and P/N remained continuously absent (E2) in the academic year 2014-15

22 State of Municipal Education in Mumbai
Notes on Data: The data presented in Tables 15 and 16 has been compiled from two applications to the Administrative Officer of Schools of wards L, M/E and P/N under the Right to Information Act:
We had applied to the Administrative Officer (A.O.) of Schools for copies of the Continuous Comprehensive Evaluation (CCE) reports of students of std. 4 and std. 7 of all schools in their wards. In our application, we had also specifically asked for number of students graded as ‘E2’ i.e. students continuously absent as per RTE norms. However, incomplete data was provided to us, as CCE reports for all schools were not furnished. Only the summary tables were provided for most schools (i.e. Grades A1 to Less than C2); the number of ‘E2’ students was not provided by all schools. The data presented in Table 20 for grades ‘A1, A2, B1, B2, C1, C2 and Less than C2’ has been compiled from the above source.
The compiled data for all schools about the progress reports of children as per CCE was not available with the A.O. Schools office. Moreover, even in case of data collected from schools, 100% data has not been provided. Data on the number of students graded as ’E2’ in Table 20 was collected also collected from the A.O.s, under a separate application asking for continuously absent students.
This is a telling comment on the quality of monitoring and evaluation at the administrative level, as the data recording, collation and management systems are found to be weak
23 State of Municipal Education in Mumbai
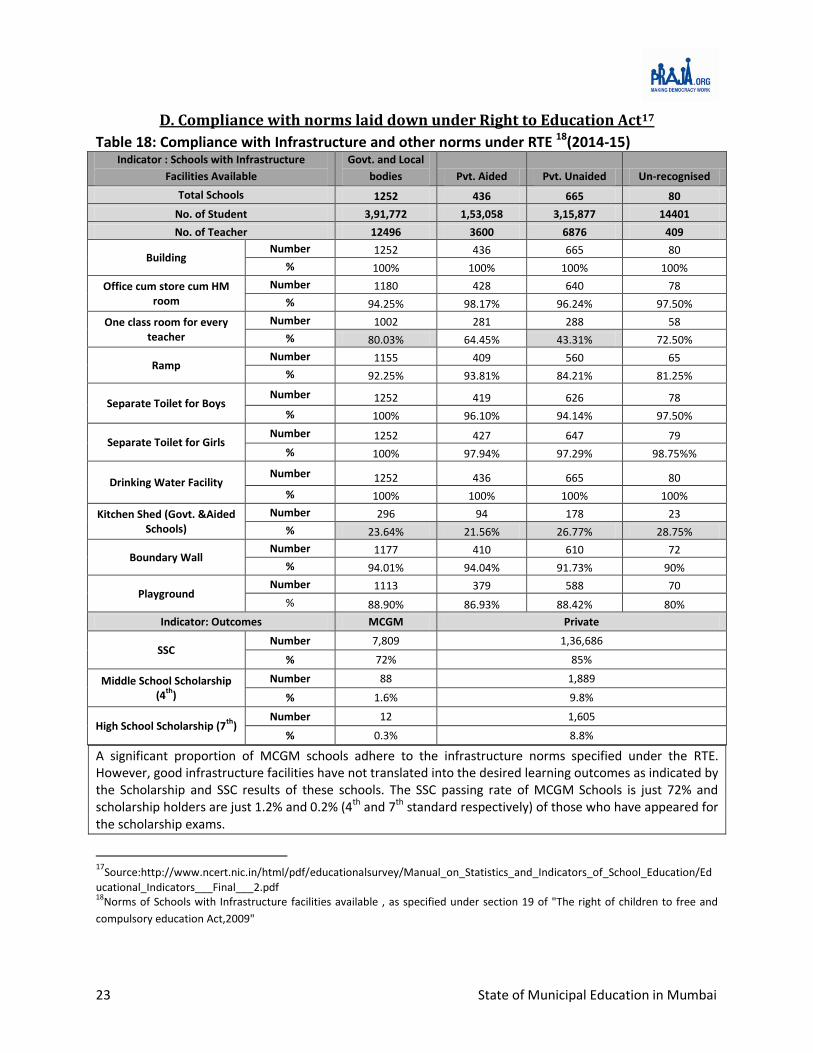
D. Compliance with norms laid down under Right to Education Act17
Table 18: Compliance with Infrastructure and other norms under RTE 18(2014-15) Indicator : Schools with Infrastructure
Facilities Available
Govt. and Local
bodies Pvt. Aided Pvt. Unaided Un-recognised
Total Schools 1252 436 665 80
No. of Student 3,91,772 1,53,058 3,15,877 14401
No. of Teacher 12496 3600 6876 409
Building Number 1252 436 665 80
% 100% 100% 100% 100%
Office cum store cum HM room
Number 1180 428 640 78
% 94.25% 98.17% 96.24% 97.50%
One class room for every teacher
Number 1002 281 288 58
% 80.03% 64.45% 43.31% 72.50%
Ramp Number 1155 409 560 65
% 92.25% 93.81% 84.21% 81.25%
Separate Toilet for Boys Number 1252 419 626 78
% 100% 96.10% 94.14% 97.50%
Separate Toilet for Girls Number 1252 427 647 79
% 100% 97.94% 97.29% 98.75%%
Drinking Water Facility Number 1252 436 665 80
% 100% 100% 100% 100%
Kitchen Shed (Govt. &Aided Schools)
Number 296 94 178 23
% 23.64% 21.56% 26.77% 28.75%
Boundary Wall Number 1177 410 610 72
% 94.01% 94.04% 91.73% 90%
Playground Number 1113 379 588 70
% 88.90% 86.93% 88.42% 80%
Indicator: Outcomes MCGM Private
SSC Number 7,809 1,36,686
% 72% 85%
Middle School Scholarship (4
th)
Number 88 1,889
% 1.6% 9.8%
High School Scholarship (7th
) Number 12 1,605
% 0.3% 8.8%
A significant proportion of MCGM schools adhere to the infrastructure norms specified under the RTE. However, good infrastructure facilities have not translated into the desired learning outcomes as indicated by the Scholarship and SSC results of these schools. The SSC passing rate of MCGM Schools is just 72% and scholarship holders are just 1.2% and 0.2% (4th and 7th standard respectively) of those who have appeared for the scholarship exams.
17
Source:http://www.ncert.nic.in/html/pdf/educationalsurvey/Manual_on_Statistics_and_Indicators_of_School_Education/Ed
ucational_Indicators___Final___2.pdf 18
Norms of Schools with Infrastructure facilities available , as specified under section 19 of "The right of children to free and
compulsory education Act,2009"
24 State of Municipal Education in Mumbai
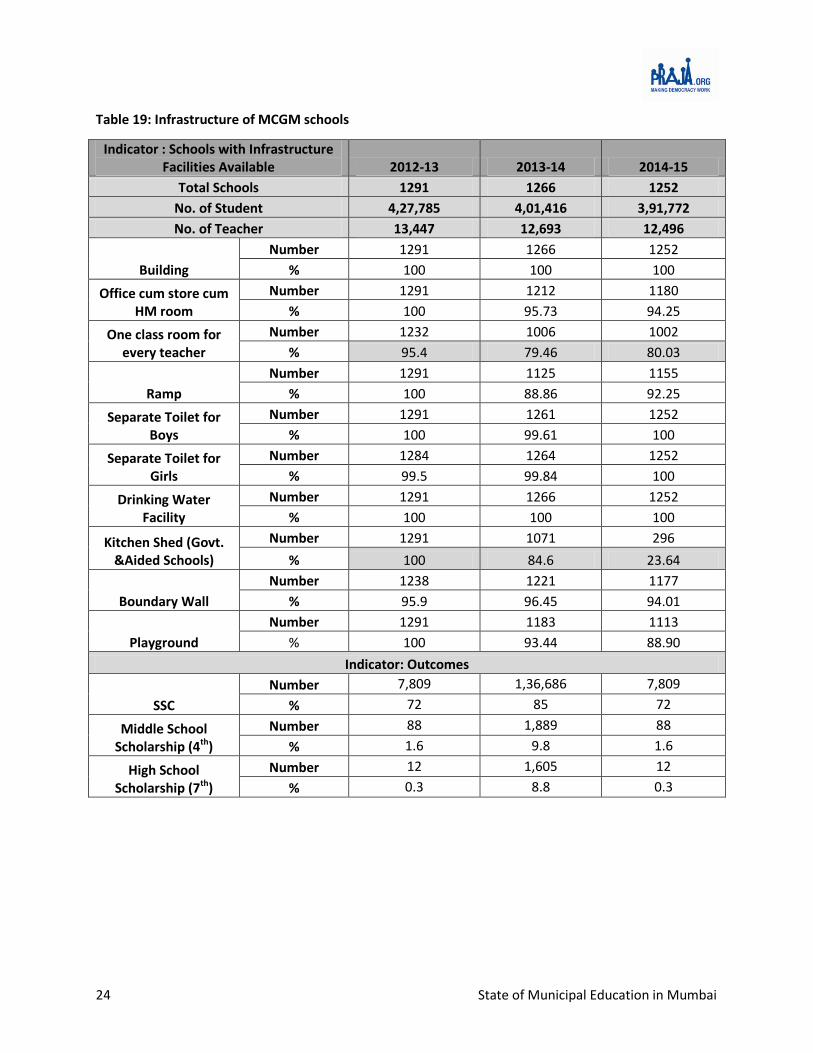
Table 19: Infrastructure of MCGM schools
Indicator : Schools with Infrastructure Facilities Available 2012-13 2013-14 2014-15
Total Schools 1291 1266 1252
No. of Student 4,27,785 4,01,416 3,91,772
No. of Teacher 13,447 12,693 12,496
Building
Number 1291 1266 1252
% 100 100 100
Office cum store cum HM room
Number 1291 1212 1180
% 100 95.73 94.25
One class room for every teacher
Number 1232 1006 1002
% 95.4 79.46 80.03
Ramp
Number 1291 1125 1155
% 100 88.86 92.25
Separate Toilet for Boys
Number 1291 1261 1252
% 100 99.61 100
Separate Toilet for Girls
Number 1284 1264 1252
% 99.5 99.84 100
Drinking Water Facility
Number 1291 1266 1252
% 100 100 100
Kitchen Shed (Govt. &Aided Schools)
Number 1291 1071 296
% 100 84.6 23.64
Boundary Wall
Number 1238 1221 1177
% 95.9 96.45 94.01
Playground
Number 1291 1183 1113
% 100 93.44 88.90
Indicator: Outcomes
SSC
Number 7,809 1,36,686 7,809
% 72 85 72
Middle School Scholarship (4th)
Number 88 1,889 88
% 1.6 9.8 1.6
High School Scholarship (7th)
Number 12 1,605 12
% 0.3 8.8 0.3
25 State of Municipal Education in Mumbai
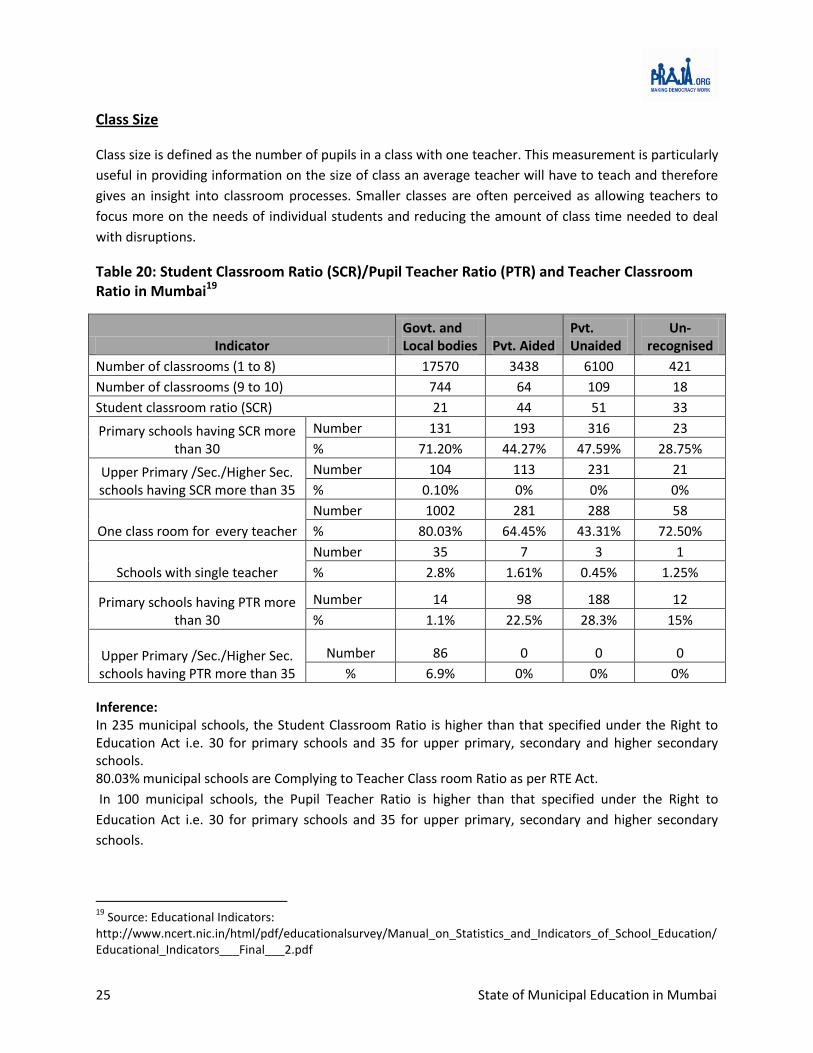
Class Size Class size is defined as the number of pupils in a class with one teacher. This measurement is particularly
useful in providing information on the size of class an average teacher will have to teach and therefore
gives an insight into classroom processes. Smaller classes are often perceived as allowing teachers to
focus more on the needs of individual students and reducing the amount of class time needed to deal
with disruptions.
Table 20: Student Classroom Ratio (SCR)/Pupil Teacher Ratio (PTR) and Teacher Classroom Ratio in Mumbai19
Indicator Govt. and Local bodies Pvt. Aided
Pvt. Unaided
Un- recognised
Number of classrooms (1 to 8) 17570 3438 6100 421
Number of classrooms (9 to 10) 744 64 109 18
Student classroom ratio (SCR) 21 44 51 33
Primary schools having SCR more than 30
Number 131 193 316 23
% 71.20% 44.27% 47.59% 28.75%
Upper Primary /Sec./Higher Sec. schools having SCR more than 35
Number 104 113 231 21
% 0.10% 0% 0% 0%
One class room for every teacher
Number 1002 281 288 58
% 80.03% 64.45% 43.31% 72.50%
Schools with single teacher
Number 35 7 3 1
% 2.8% 1.61% 0.45% 1.25%
Primary schools having PTR more than 30
Number 14 98 188 12
% 1.1% 22.5% 28.3% 15%
Upper Primary /Sec./Higher Sec. schools having PTR more than 35
Number 86 0 0 0
% 6.9% 0% 0% 0%
Inference: In 235 municipal schools, the Student Classroom Ratio is higher than that specified under the Right to Education Act i.e. 30 for primary schools and 35 for upper primary, secondary and higher secondary schools. 80.03% municipal schools are Complying to Teacher Class room Ratio as per RTE Act.
In 100 municipal schools, the Pupil Teacher Ratio is higher than that specified under the Right to
Education Act i.e. 30 for primary schools and 35 for upper primary, secondary and higher secondary
schools.
19
Source: Educational Indicators: http://www.ncert.nic.in/html/pdf/educationalsurvey/Manual_on_Statistics_and_Indicators_of_School_Education/Educational_Indicators___Final___2.pdf
26 State of Municipal Education in Mumbai
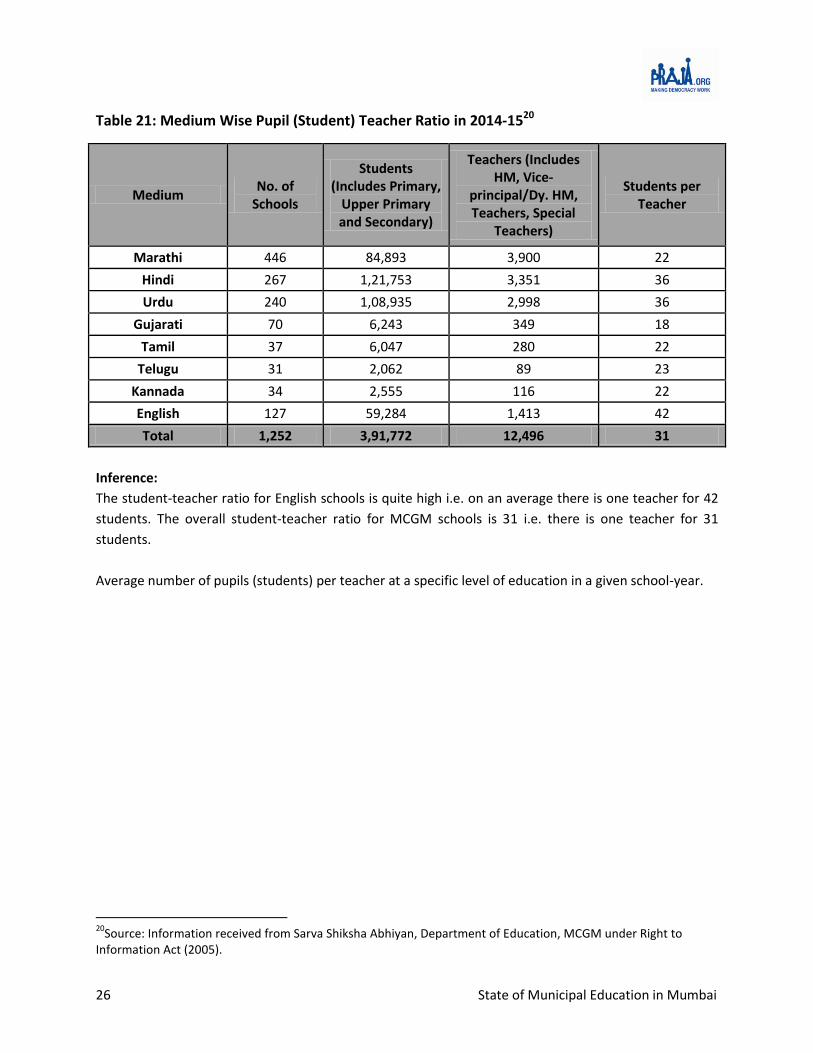
Table 21: Medium Wise Pupil (Student) Teacher Ratio in 2014-1520
Medium No. of
Schools
Students (Includes Primary,
Upper Primary and Secondary)
Teachers (Includes HM, Vice-
principal/Dy. HM, Teachers, Special
Teachers)
Students per Teacher
Marathi 446 84,893 3,900 22
Hindi 267 1,21,753 3,351 36
Urdu 240 1,08,935 2,998 36
Gujarati 70 6,243 349 18
Tamil 37 6,047 280 22
Telugu 31 2,062 89 23
Kannada 34 2,555 116 22
English 127 59,284 1,413 42
Total 1,252 3,91,772 12,496 31
Inference:
The student-teacher ratio for English schools is quite high i.e. on an average there is one teacher for 42
students. The overall student-teacher ratio for MCGM schools is 31 i.e. there is one teacher for 31
students.
Average number of pupils (students) per teacher at a specific level of education in a given school-year.
20
Source: Information received from Sarva Shiksha Abhiyan, Department of Education, MCGM under Right to Information Act (2005).

27 State of Municipal Education in Mumbai
School Management Committees
Section 21 of the Right to Free and Compulsory Education Act 2009 (RTE), mandates the formation of
School Management Committees (SMCs) in all elementary government, government-aided schools and
special category schools in the country. The SMC is the basic unit of a decentralised model of
governance with active involvement of parents in the school’s functioning. SMCs are primarily
composed of parents, teachers, head masters and local authorities.
Table 22: Schools with School Management Committees in 2014-15
MNC Pvt. Aided Pvt. Unaided Un- recognised
Number % Number % Number % Number %
Not Applicable21 57 4.5 4 0.9 476 72.9 100 90.9
Yes 1209 95.5 439 99.1 177 27.1 10 9.1
Total 1267
443
653
110
Inference:
School Management Committees have been set up in 95.5% of MCGM schools as of 2014-15.
21
SMC is not applicable to Secondary schools (in MCGM schools) as School Management and Development Committee is formed in these schools. SMC is also not applicable if there is a infrastructure issue which is with the Private schools.
28 State of Municipal Education in Mumbai
Section II. Deliberation by Municipal Councillors and MLAs
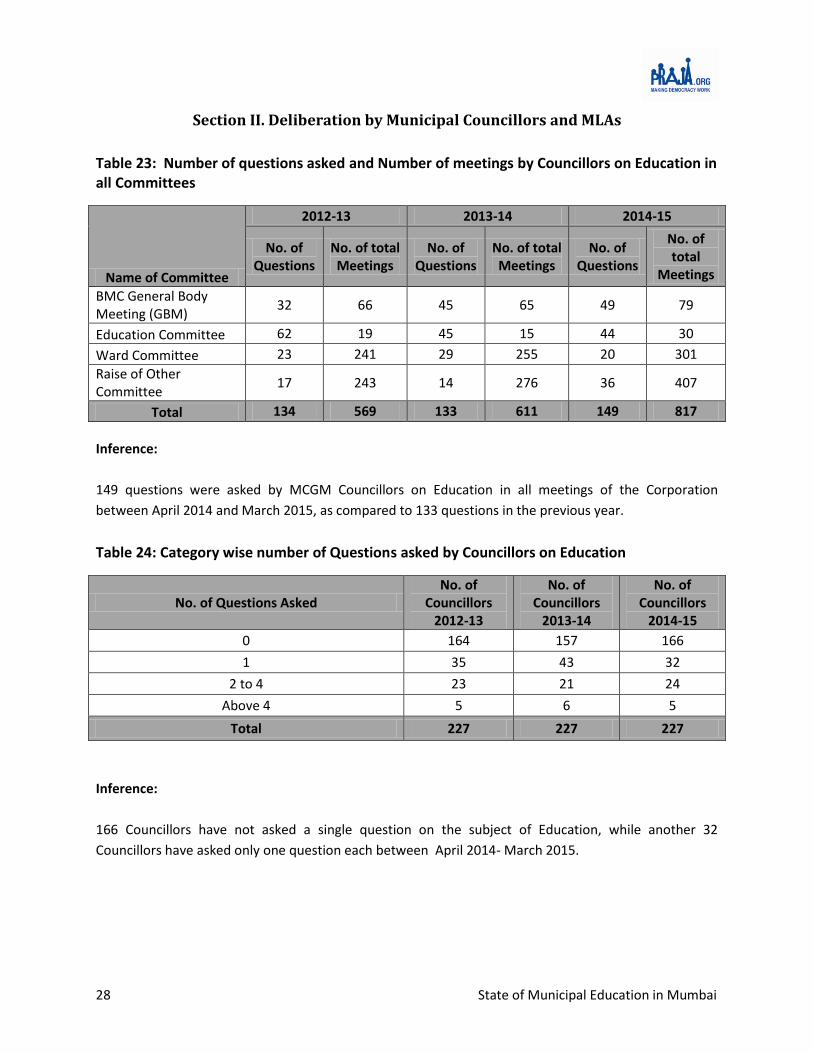
Table 23: Number of questions asked and Number of meetings by Councillors on Education in all Committees
Name of Committee
2012-13 2013-14 2014-15
No. of Questions
No. of total Meetings
No. of Questions
No. of total Meetings
No. of Questions
No. of total
Meetings
BMC General Body Meeting (GBM)
32 66 45 65 49 79
Education Committee 62 19 45 15 44 30
Ward Committee 23 241 29 255 20 301
Raise of Other Committee
17 243 14 276 36 407
Total 134 569 133 611 149 817
Inference:
149 questions were asked by MCGM Councillors on Education in all meetings of the Corporation
between April 2014 and March 2015, as compared to 133 questions in the previous year.
Table 24: Category wise number of Questions asked by Councillors on Education
No. of Questions Asked No. of
Councillors 2012-13
No. of Councillors
2013-14
No. of Councillors
2014-15
0 164 157 166
1 35 43 32
2 to 4 23 21 24
Above 4 5 6 5
Total 227 227 227
Inference:
166 Councillors have not asked a single question on the subject of Education, while another 32
Councillors have asked only one question each between April 2014- March 2015.
29 State of Municipal Education in Mumbai
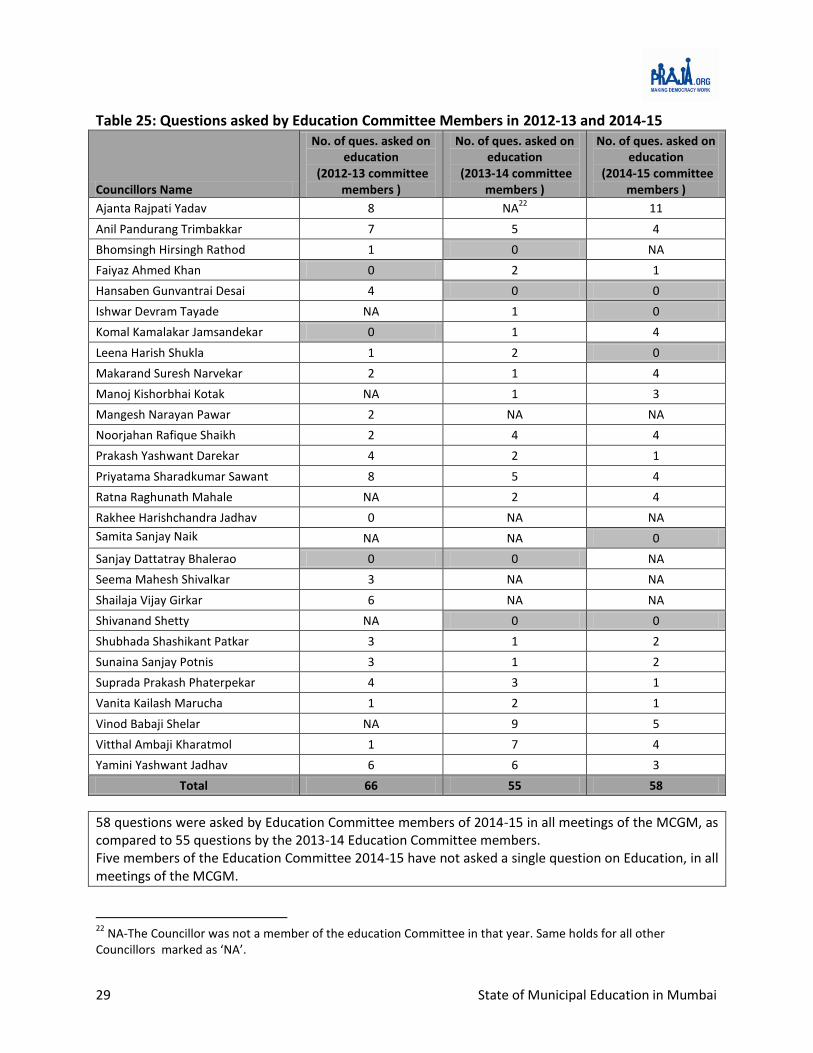
Table 25: Questions asked by Education Committee Members in 2012-13 and 2014-15
Councillors Name
No. of ques. asked on education
(2012-13 committee members )
No. of ques. asked on education
(2013-14 committee members )
No. of ques. asked on education
(2014-15 committee members )
Ajanta Rajpati Yadav 8 NA22
11
Anil Pandurang Trimbakkar 7 5 4
Bhomsingh Hirsingh Rathod 1 0 NA
Faiyaz Ahmed Khan 0 2 1
Hansaben Gunvantrai Desai 4 0 0
Ishwar Devram Tayade NA 1 0
Komal Kamalakar Jamsandekar 0 1 4
Leena Harish Shukla 1 2 0
Makarand Suresh Narvekar 2 1 4
Manoj Kishorbhai Kotak NA 1 3
Mangesh Narayan Pawar 2 NA NA
Noorjahan Rafique Shaikh 2 4 4
Prakash Yashwant Darekar 4 2 1
Priyatama Sharadkumar Sawant 8 5 4
Ratna Raghunath Mahale NA 2 4
Rakhee Harishchandra Jadhav 0 NA NA
Samita Sanjay Naik NA NA 0
Sanjay Dattatray Bhalerao 0 0 NA
Seema Mahesh Shivalkar 3 NA NA
Shailaja Vijay Girkar 6 NA NA
Shivanand Shetty NA 0 0
Shubhada Shashikant Patkar 3 1 2
Sunaina Sanjay Potnis 3 1 2
Suprada Prakash Phaterpekar 4 3 1
Vanita Kailash Marucha 1 2 1
Vinod Babaji Shelar NA 9 5
Vitthal Ambaji Kharatmol 1 7 4
Yamini Yashwant Jadhav 6 6 3
Total 66 55 58
58 questions were asked by Education Committee members of 2014-15 in all meetings of the MCGM, as compared to 55 questions by the 2013-14 Education Committee members. Five members of the Education Committee 2014-15 have not asked a single question on Education, in all meetings of the MCGM.
22
NA-The Councillor was not a member of the education Committee in that year. Same holds for all other Councillors marked as ‘NA’.

30 State of Municipal Education in Mumbai
Table 26: Ward-wise questions asked by councillors on Education in the year April’14 to March’15
Ward No. of
students No. of
councillors
No. of councillor
question asked on education
Total questions asked on
education
A 7548 4 1 4
B 2626 3 1 1
C 695 4 1 1
D 3116 7 2 3
E 11340 8 2 4
F/N 29713 10 3 4
F/S 8178 7 2 2
G/N 20851 11 2 3
G/S 13880 9 3 6
H/E 22043 11 4 11
H/W 8844 6 0 0
K/E 17729 15 2 3
K/W 16962 13 6 6
L 34584 15 6 21
M/E 54372 13 6 16
M/W 15564 8 2 3
N 21086 12 2 5
P/N 34917 16 4 14
P/S 15253 8 1 1
R/C 10632 10 1 3
R/N 9389 7 3 14
R/S 12757 11 4 18
S 14715 13 2 3
T 9830 6 1 3
Total 396624 227 61 149
Inference:
Out of 227 councillors, only 61 councillors have asked questions on the subject of Education between
April’14 to March’15.Overall, 149 questions were asked by the 61 councillors.

31 State of Municipal Education in Mumbai
Table 27: Issues raised/Questions asked by Councillors in the year April’14 to March’15
Issues Question asked
Closure of the schools 1
Dropout rate 3
Human Resources Related 6
Higher/Technical Education 15
Infrastructure 2
Municipal School Related 39
New schools 21
Primary education 4
Private and Trust school related 1
Sports/Educational trip/workshops related 1
Schemes/Policies in Education Related 9
Secondary education 3
Student issues related 30
Upgradation/reduction of Standards and section of school 1
Total 149
Inference:
In spite of the high dropout rates of students in MCGM schools, only three questions were raised on the
issue during April’14 to March’15.
32 State of Municipal Education in Mumbai
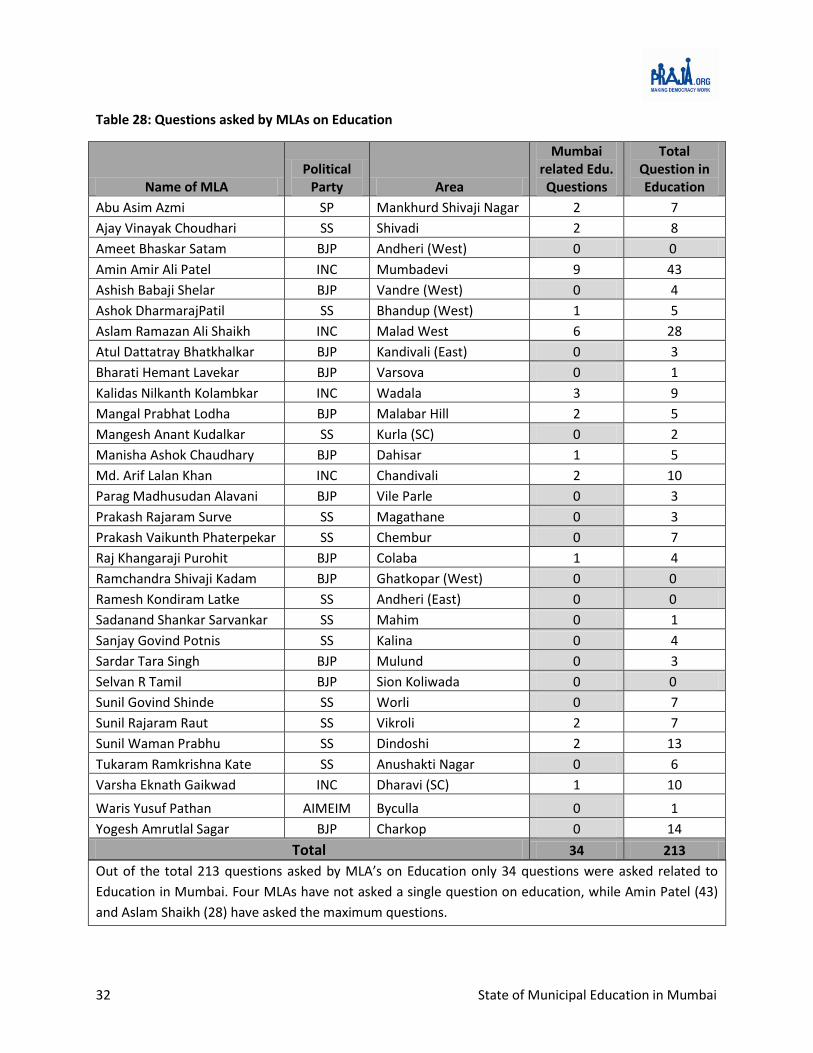
Table 28: Questions asked by MLAs on Education
Name of MLA Political
Party Area
Mumbai related Edu. Questions
Total Question in Education
Abu Asim Azmi SP Mankhurd Shivaji Nagar 2 7
Ajay Vinayak Choudhari SS Shivadi 2 8
Ameet Bhaskar Satam BJP Andheri (West) 0 0
Amin Amir Ali Patel INC Mumbadevi 9 43
Ashish Babaji Shelar BJP Vandre (West) 0 4
Ashok DharmarajPatil SS Bhandup (West) 1 5
Aslam Ramazan Ali Shaikh INC Malad West 6 28
Atul Dattatray Bhatkhalkar BJP Kandivali (East) 0 3
Bharati Hemant Lavekar BJP Varsova 0 1
Kalidas Nilkanth Kolambkar INC Wadala 3 9
Mangal Prabhat Lodha BJP Malabar Hill 2 5
Mangesh Anant Kudalkar SS Kurla (SC) 0 2
Manisha Ashok Chaudhary BJP Dahisar 1 5
Md. Arif Lalan Khan INC Chandivali 2 10
Parag Madhusudan Alavani BJP Vile Parle 0 3
Prakash Rajaram Surve SS Magathane 0 3
Prakash Vaikunth Phaterpekar SS Chembur 0 7
Raj Khangaraji Purohit BJP Colaba 1 4
Ramchandra Shivaji Kadam BJP Ghatkopar (West) 0 0
Ramesh Kondiram Latke SS Andheri (East) 0 0
Sadanand Shankar Sarvankar SS Mahim 0 1
Sanjay Govind Potnis SS Kalina 0 4
Sardar Tara Singh BJP Mulund 0 3
Selvan R Tamil BJP Sion Koliwada 0 0
Sunil Govind Shinde SS Worli 0 7
Sunil Rajaram Raut SS Vikroli 2 7
Sunil Waman Prabhu SS Dindoshi 2 13
Tukaram Ramkrishna Kate SS Anushakti Nagar 0 6
Varsha Eknath Gaikwad INC Dharavi (SC) 1 10
Waris Yusuf Pathan AIMEIM Byculla 0 1
Yogesh Amrutlal Sagar BJP Charkop 0 14
Total 34 213
Out of the total 213 questions asked by MLA’s on Education only 34 questions were asked related to
Education in Mumbai. Four MLAs have not asked a single question on education, while Amin Patel (43)
and Aslam Shaikh (28) have asked the maximum questions.
33 State of Municipal Education in Mumbai
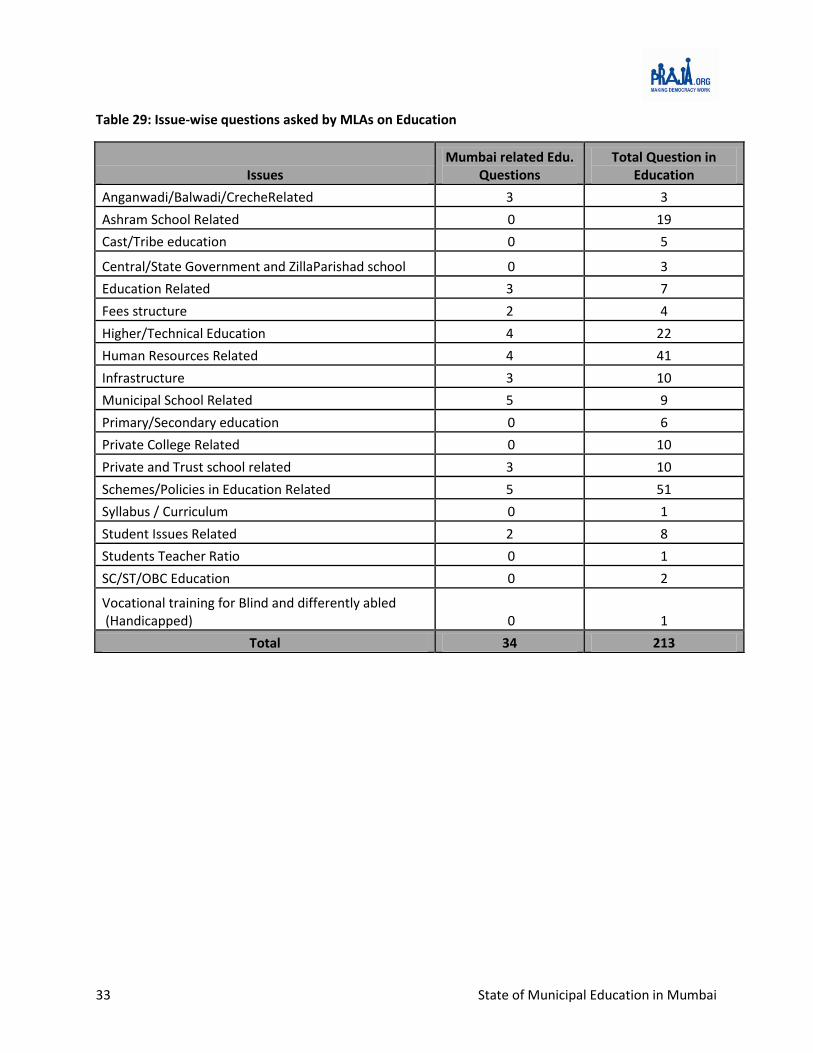
Table 29: Issue-wise questions asked by MLAs on Education
Issues Mumbai related Edu.
Questions Total Question in
Education
Anganwadi/Balwadi/CrecheRelated 3 3
Ashram School Related 0 19
Cast/Tribe education 0 5
Central/State Government and ZillaParishad school 0 3
Education Related 3 7
Fees structure 2 4
Higher/Technical Education 4 22
Human Resources Related 4 41
Infrastructure 3 10
Municipal School Related 5 9
Primary/Secondary education 0 6
Private College Related 0 10
Private and Trust school related 3 10
Schemes/Policies in Education Related 5 51
Syllabus / Curriculum 0 1
Student Issues Related 2 8
Students Teacher Ratio 0 1
SC/ST/OBC Education 0 2
Vocational training for Blind and differently abled (Handicapped) 0 1
Total 34 213
34 State of Municipal Education in Mumbai
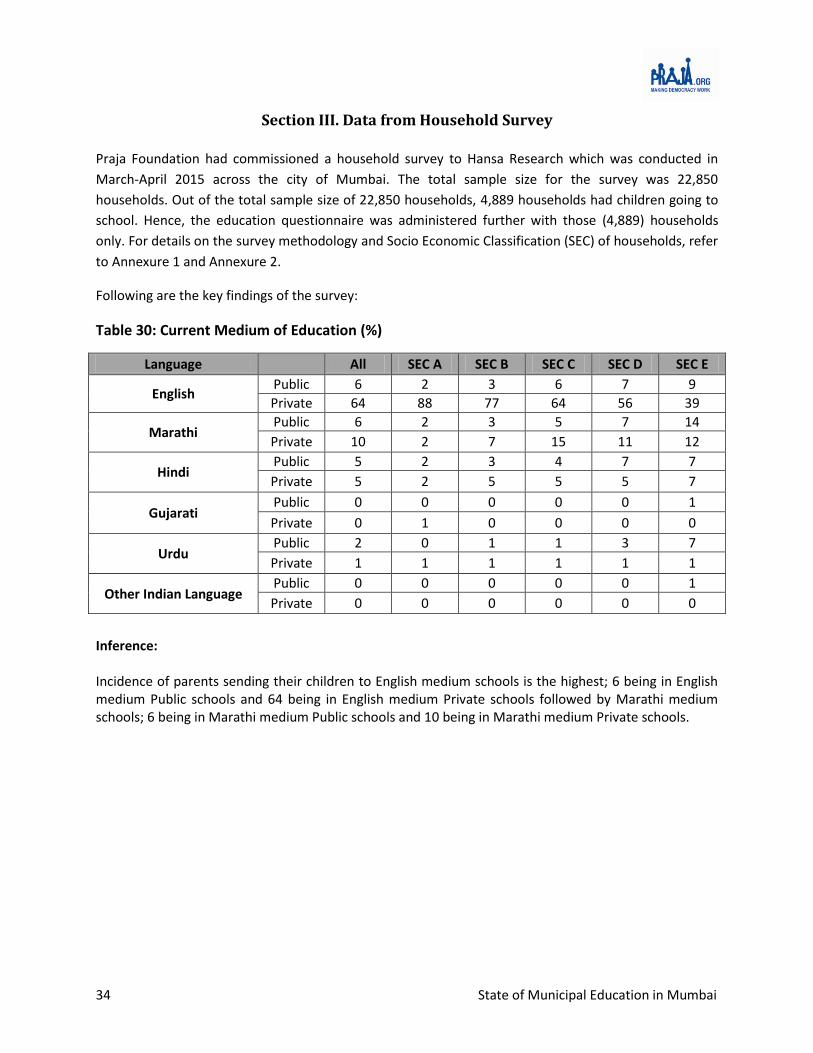
Section III. Data from Household Survey
Praja Foundation had commissioned a household survey to Hansa Research which was conducted in
March-April 2015 across the city of Mumbai. The total sample size for the survey was 22,850
households. Out of the total sample size of 22,850 households, 4,889 households had children going to
school. Hence, the education questionnaire was administered further with those (4,889) households
only. For details on the survey methodology and Socio Economic Classification (SEC) of households, refer
to Annexure 1 and Annexure 2.
Following are the key findings of the survey:
Table 30: Current Medium of Education (%)
Language
All SEC A SEC B SEC C SEC D SEC E
English Public 6 2 3 6 7 9
Private 64 88 77 64 56 39
Marathi Public 6 2 3 5 7 14
Private 10 2 7 15 11 12
Hindi Public 5 2 3 4 7 7
Private 5 2 5 5 5 7
Gujarati Public 0 0 0 0 0 1
Private 0 1 0 0 0 0
Urdu Public 2 0 1 1 3 7
Private 1 1 1 1 1 1
Other Indian Language Public 0 0 0 0 0 1
Private 0 0 0 0 0 0
Inference: Incidence of parents sending their children to English medium schools is the highest; 6 being in English medium Public schools and 64 being in English medium Private schools followed by Marathi medium schools; 6 being in Marathi medium Public schools and 10 being in Marathi medium Private schools.
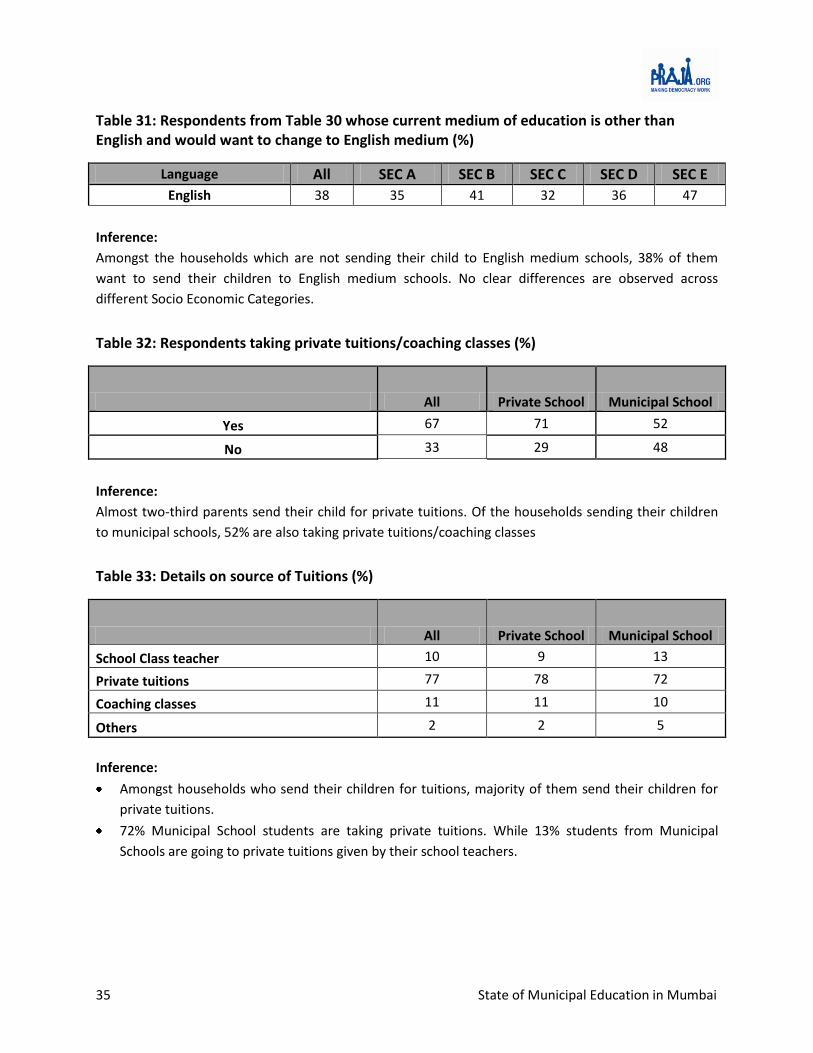
35 State of Municipal Education in Mumbai
Table 31: Respondents from Table 30 whose current medium of education is other than English and would want to change to English medium (%)
Language All SEC A SEC B SEC C SEC D SEC E
English 38 35 41 32 36 47
Inference:
Amongst the households which are not sending their child to English medium schools, 38% of them
want to send their children to English medium schools. No clear differences are observed across
different Socio Economic Categories.
Table 32: Respondents taking private tuitions/coaching classes (%)
All Private School Municipal School
Yes 67 71 52
No 33 29 48
Inference:
Almost two-third parents send their child for private tuitions. Of the households sending their children
to municipal schools, 52% are also taking private tuitions/coaching classes
Table 33: Details on source of Tuitions (%)
All Private School Municipal School
School Class teacher 10 9 13
Private tuitions 77 78 72
Coaching classes 11 11 10
Others 2 2 5
Inference:
Amongst households who send their children for tuitions, majority of them send their children for
private tuitions.
72% Municipal School students are taking private tuitions. While 13% students from Municipal
Schools are going to private tuitions given by their school teachers.
36 State of Municipal Education in Mumbai
Table 34: Percentage happy with the School
All Private School Municipal School
Yes 90 92 82
No 10 8 18
Inference: Although majority of the parents are happy with their child’s school (justifying their decision),
satisfaction is much higher amongst parents sending their children to Private schools as compared to
Municipal schools.
Parents of 18% Municipal school students are not happy with their children’s school.
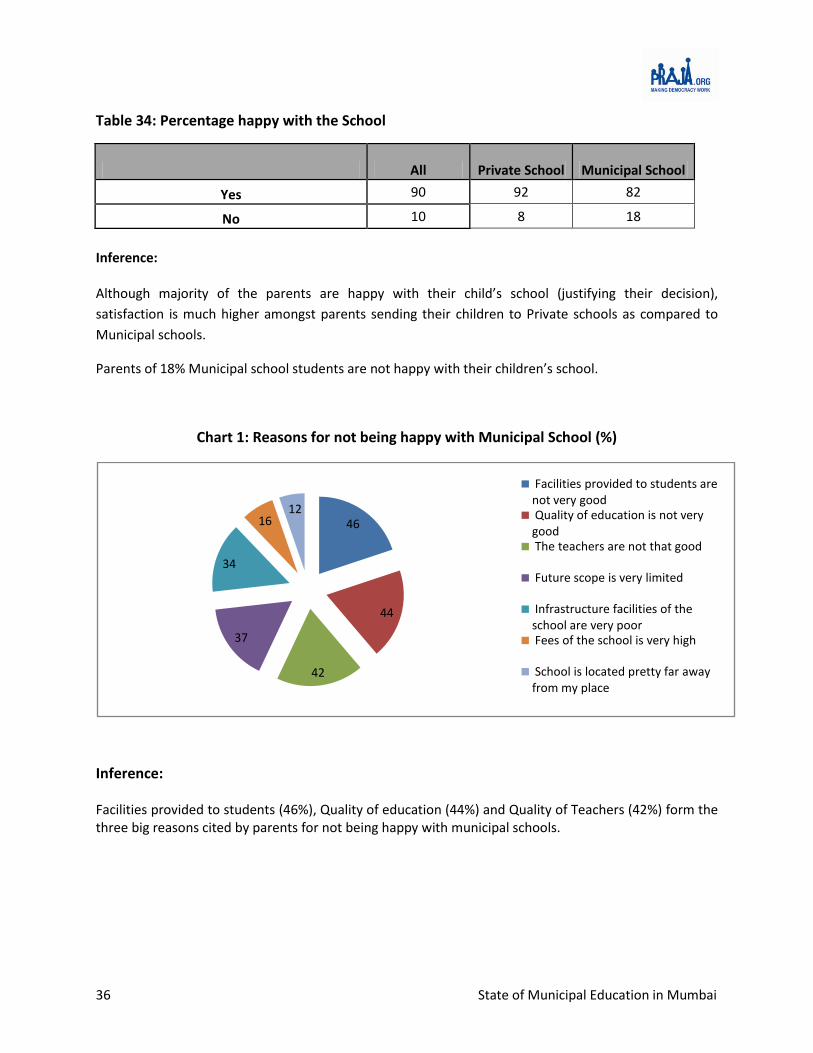
Chart 1: Reasons for not being happy with Municipal School (%)
Inference: Facilities provided to students (46%), Quality of education (44%) and Quality of Teachers (42%) form the three big reasons cited by parents for not being happy with municipal schools.
46
44
42
37
34
1612
Facilities provided to students are not very goodQuality of education is not very goodThe teachers are not that good
Future scope is very limited
Infrastructure facilities of the school are very poorFees of the school is very high
School is located pretty far away from my place
37 State of Municipal Education in Mumbai
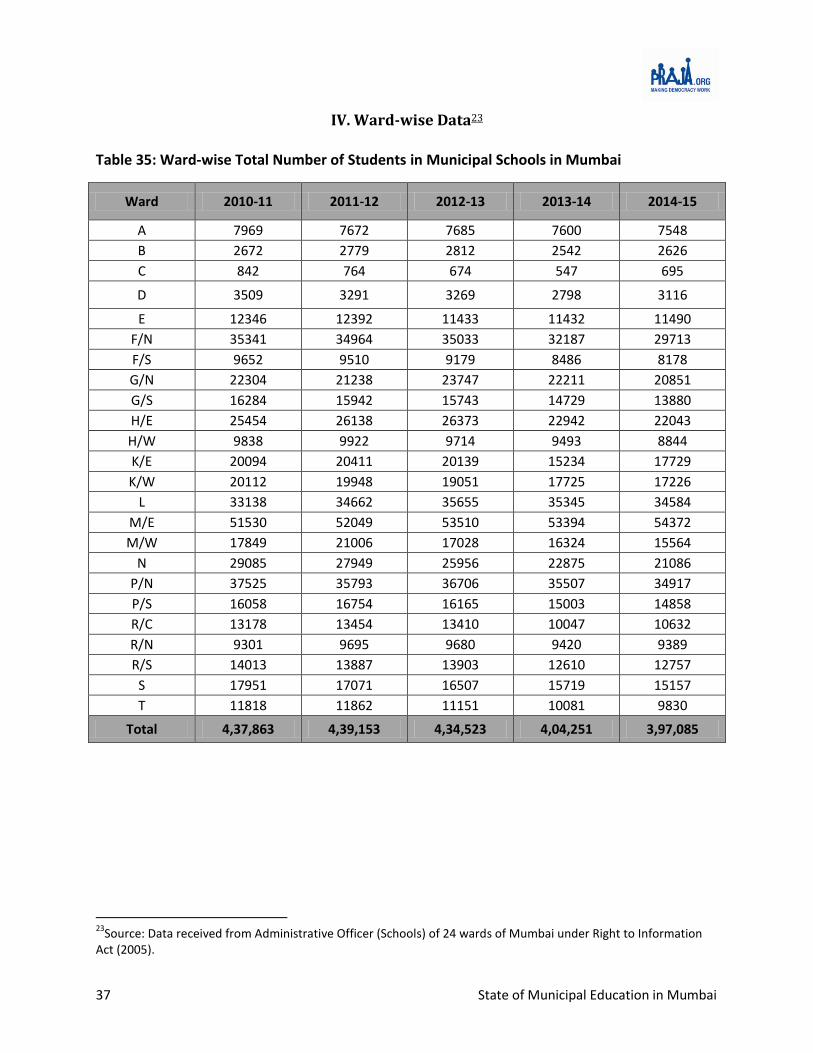
IV. Ward-wise Data23
Table 35: Ward-wise Total Number of Students in Municipal Schools in Mumbai
Ward 2010-11 2011-12 2012-13 2013-14 2014-15
A 7969 7672 7685 7600 7548
B 2672 2779 2812 2542 2626
C 842 764 674 547 695
D 3509 3291 3269 2798 3116
E 12346 12392 11433 11432 11490
F/N 35341 34964 35033 32187 29713
F/S 9652 9510 9179 8486 8178
G/N 22304 21238 23747 22211 20851
G/S 16284 15942 15743 14729 13880
H/E 25454 26138 26373 22942 22043
H/W 9838 9922 9714 9493 8844
K/E 20094 20411 20139 15234 17729
K/W 20112 19948 19051 17725 17226
L 33138 34662 35655 35345 34584
M/E 51530 52049 53510 53394 54372
M/W 17849 21006 17028 16324 15564
N 29085 27949 25956 22875 21086
P/N 37525 35793 36706 35507 34917
P/S 16058 16754 16165 15003 14858
R/C 13178 13454 13410 10047 10632
R/N 9301 9695 9680 9420 9389
R/S 14013 13887 13903 12610 12757
S 17951 17071 16507 15719 15157
T 11818 11862 11151 10081 9830
Total 4,37,863 4,39,153 4,34,523 4,04,251 3,97,085
23
Source: Data received from Administrative Officer (Schools) of 24 wards of Mumbai under Right to Information Act (2005).

38 State of Municipal Education in Mumbai
Table 36: Ward-wise drop in Enrolments between 2010-11 and 2014-15
Ward 2010-11 2014-15 % Change in Enrolments
A 7969 7548 -5
B 2672 2626 -2
C 842 695 -17
D 3509 3116 -11
E 12346 11490 -7
F/N 35341 29713 -16
F/S 9652 8178 -15
G/N 22304 20851 -7
G/S 16284 13880 -15
H/E 25454 22043 -13
H/W 9838 8844 -10
K/E 20094 17729 -12
K/W 20112 17226 -14
L 33138 34584 4
M/E 51530 54372 6
M/W 17849 15564 -13
N 29085 21086 -28
P/N 37525 34917 -7
P/S 16058 14858 -7
R/C 13178 10632 -19
R/N 9301 9389 1
R/S 14013 12757 -9
S 17951 15157 -16
T 11818 9830 -17
Total 4,37,863 3,97,085 -9
39 State of Municipal Education in Mumbai
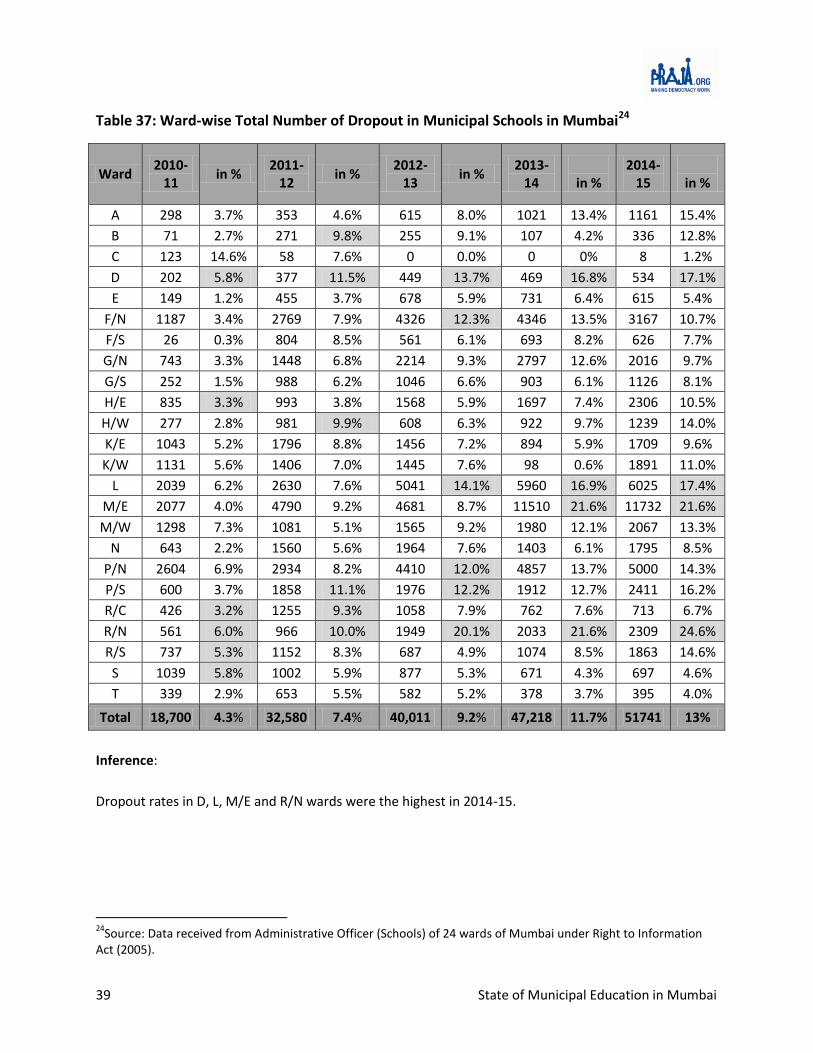
Table 37: Ward-wise Total Number of Dropout in Municipal Schools in Mumbai24
Ward 2010-
11 in %
2011-12
in % 2012-
13 in %
2013-14
in %
2014-15
in %
A 298 3.7% 353 4.6% 615 8.0% 1021 13.4% 1161 15.4%
B 71 2.7% 271 9.8% 255 9.1% 107 4.2% 336 12.8%
C 123 14.6% 58 7.6% 0 0.0% 0 0% 8 1.2%
D 202 5.8% 377 11.5% 449 13.7% 469 16.8% 534 17.1%
E 149 1.2% 455 3.7% 678 5.9% 731 6.4% 615 5.4%
F/N 1187 3.4% 2769 7.9% 4326 12.3% 4346 13.5% 3167 10.7%
F/S 26 0.3% 804 8.5% 561 6.1% 693 8.2% 626 7.7%
G/N 743 3.3% 1448 6.8% 2214 9.3% 2797 12.6% 2016 9.7%
G/S 252 1.5% 988 6.2% 1046 6.6% 903 6.1% 1126 8.1%
H/E 835 3.3% 993 3.8% 1568 5.9% 1697 7.4% 2306 10.5%
H/W 277 2.8% 981 9.9% 608 6.3% 922 9.7% 1239 14.0%
K/E 1043 5.2% 1796 8.8% 1456 7.2% 894 5.9% 1709 9.6%
K/W 1131 5.6% 1406 7.0% 1445 7.6% 98 0.6% 1891 11.0%
L 2039 6.2% 2630 7.6% 5041 14.1% 5960 16.9% 6025 17.4%
M/E 2077 4.0% 4790 9.2% 4681 8.7% 11510 21.6% 11732 21.6%
M/W 1298 7.3% 1081 5.1% 1565 9.2% 1980 12.1% 2067 13.3%
N 643 2.2% 1560 5.6% 1964 7.6% 1403 6.1% 1795 8.5%
P/N 2604 6.9% 2934 8.2% 4410 12.0% 4857 13.7% 5000 14.3%
P/S 600 3.7% 1858 11.1% 1976 12.2% 1912 12.7% 2411 16.2%
R/C 426 3.2% 1255 9.3% 1058 7.9% 762 7.6% 713 6.7%
R/N 561 6.0% 966 10.0% 1949 20.1% 2033 21.6% 2309 24.6%
R/S 737 5.3% 1152 8.3% 687 4.9% 1074 8.5% 1863 14.6%
S 1039 5.8% 1002 5.9% 877 5.3% 671 4.3% 697 4.6%
T 339 2.9% 653 5.5% 582 5.2% 378 3.7% 395 4.0%
Total 18,700 4.3% 32,580 7.4% 40,011 9.2% 47,218 11.7% 51741 13%
Inference:
Dropout rates in D, L, M/E and R/N wards were the highest in 2014-15.
24
Source: Data received from Administrative Officer (Schools) of 24 wards of Mumbai under Right to Information Act (2005).
40 State of Municipal Education in Mumbai
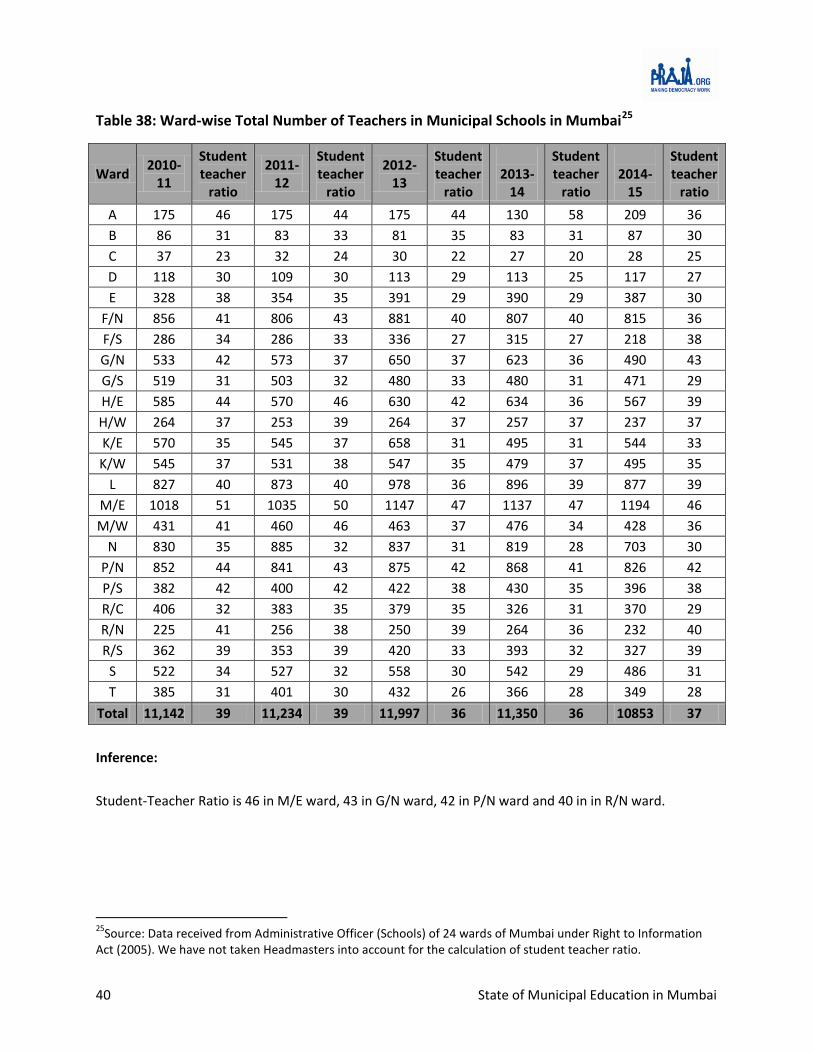
Table 38: Ward-wise Total Number of Teachers in Municipal Schools in Mumbai25
Ward 2010-
11
Student teacher
ratio
2011-12
Student teacher
ratio
2012-13
Student teacher
ratio
2013-
14
Student teacher
ratio
2014-
15
Student teacher
ratio
A 175 46 175 44 175 44 130 58 209 36
B 86 31 83 33 81 35 83 31 87 30
C 37 23 32 24 30 22 27 20 28 25
D 118 30 109 30 113 29 113 25 117 27
E 328 38 354 35 391 29 390 29 387 30
F/N 856 41 806 43 881 40 807 40 815 36
F/S 286 34 286 33 336 27 315 27 218 38
G/N 533 42 573 37 650 37 623 36 490 43
G/S 519 31 503 32 480 33 480 31 471 29
H/E 585 44 570 46 630 42 634 36 567 39
H/W 264 37 253 39 264 37 257 37 237 37
K/E 570 35 545 37 658 31 495 31 544 33
K/W 545 37 531 38 547 35 479 37 495 35
L 827 40 873 40 978 36 896 39 877 39
M/E 1018 51 1035 50 1147 47 1137 47 1194 46
M/W 431 41 460 46 463 37 476 34 428 36
N 830 35 885 32 837 31 819 28 703 30
P/N 852 44 841 43 875 42 868 41 826 42
P/S 382 42 400 42 422 38 430 35 396 38
R/C 406 32 383 35 379 35 326 31 370 29
R/N 225 41 256 38 250 39 264 36 232 40
R/S 362 39 353 39 420 33 393 32 327 39
S 522 34 527 32 558 30 542 29 486 31
T 385 31 401 30 432 26 366 28 349 28
Total 11,142 39 11,234 39 11,997 36 11,350 36 10853 37
Inference:
Student-Teacher Ratio is 46 in M/E ward, 43 in G/N ward, 42 in P/N ward and 40 in in R/N ward.
25
Source: Data received from Administrative Officer (Schools) of 24 wards of Mumbai under Right to Information Act (2005). We have not taken Headmasters into account for the calculation of student teacher ratio.
41 State of Municipal Education in Mumbai
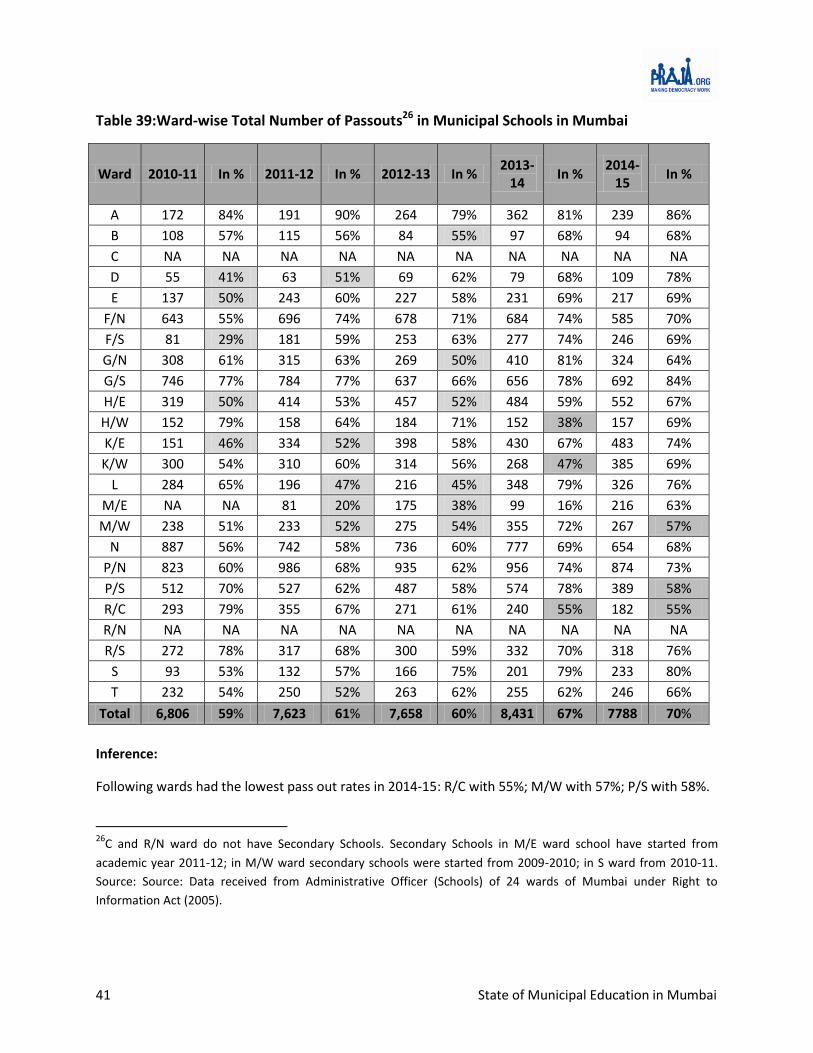
Table 39:Ward-wise Total Number of Passouts26 in Municipal Schools in Mumbai
Ward 2010-11 In % 2011-12 In % 2012-13 In % 2013-
14 In %
2014-15
In %
A 172 84% 191 90% 264 79% 362 81% 239 86%
B 108 57% 115 56% 84 55% 97 68% 94 68%
C NA NA NA NA NA NA NA NA NA NA
D 55 41% 63 51% 69 62% 79 68% 109 78%
E 137 50% 243 60% 227 58% 231 69% 217 69%
F/N 643 55% 696 74% 678 71% 684 74% 585 70%
F/S 81 29% 181 59% 253 63% 277 74% 246 69%
G/N 308 61% 315 63% 269 50% 410 81% 324 64%
G/S 746 77% 784 77% 637 66% 656 78% 692 84%
H/E 319 50% 414 53% 457 52% 484 59% 552 67%
H/W 152 79% 158 64% 184 71% 152 38% 157 69%
K/E 151 46% 334 52% 398 58% 430 67% 483 74%
K/W 300 54% 310 60% 314 56% 268 47% 385 69%
L 284 65% 196 47% 216 45% 348 79% 326 76%
M/E NA NA 81 20% 175 38% 99 16% 216 63%
M/W 238 51% 233 52% 275 54% 355 72% 267 57%
N 887 56% 742 58% 736 60% 777 69% 654 68%
P/N 823 60% 986 68% 935 62% 956 74% 874 73%
P/S 512 70% 527 62% 487 58% 574 78% 389 58%
R/C 293 79% 355 67% 271 61% 240 55% 182 55%
R/N NA NA NA NA NA NA NA NA NA NA
R/S 272 78% 317 68% 300 59% 332 70% 318 76%
S 93 53% 132 57% 166 75% 201 79% 233 80%
T 232 54% 250 52% 263 62% 255 62% 246 66%
Total 6,806 59% 7,623 61% 7,658 60% 8,431 67% 7788 70%
Inference:
Following wards had the lowest pass out rates in 2014-15: R/C with 55%; M/W with 57%; P/S with 58%.
26
C and R/N ward do not have Secondary Schools. Secondary Schools in M/E ward school have started from
academic year 2011-12; in M/W ward secondary schools were started from 2009-2010; in S ward from 2010-11.
Source: Source: Data received from Administrative Officer (Schools) of 24 wards of Mumbai under Right to
Information Act (2005).
42 State of Municipal Education in Mumbai
Table 40: Population-wise Number of Student in Government, Pvt. Aid, Pvt. Unaid and Unrecognised Schools in 2014-15
Ward Population
Government Pvt. Aid Pvt. Unaid Unrecognised
Total Schools
Total Students
No. School
No. student
No. School
No. student
No. School
No. student
No. School
No. student
A 185014 17 7381 1 518 14 6846 0 0 32 14745
B 127290 15 2456 11 3295 5 1503 5 1036 36 8290
C 166161 10 695 6 747 8 3016 0 0 24 4458
D 346866 27 2883 12 2026 32 7633 2 90 73 12632
E 393286 52 11369 14 3905 20 9362 4 595 90 25231
F/N 529034 77 29310 23 13131 30 14771 13 3214 143 60426
F/S 360972 46 7647 17 6364 7 2913 3 564 73 17488
G/N 599039 63 21157 12 4434 30 15421 8 1580 111 42381
G/S 377749 69 13456 5 1690 6 2990 0 0 80 18136
H/E 557239 61 21848 12 4268 15 11421 3 875 91 38412
H/W 307581 40 8559 10 3133 31 14362 0 0 81 26054
K/E 823885 121 30325 37 14981 67 37676 2 174 227 83156
K/W 748688 18 4224 5 902 16 6864 0 0 39 11990
L 902225 94 34174 40 15659 52 25435 3 347 189 75615
M/E 807720 78 54309 13 6785 41 17261 5 639 137 78994
M/W 411893 49 15348 12 7207 30 14249 1 355 92 37159
N 622853 76 20981 22 9566 33 16135 6 1685 137 48367
P/N 941366 75 34424 31 8017 54 25850 9 1352 169 69643
P/S 463507 40 14511 16 4504 21 13524 6 892 83 33431
R/C 562162 42 10643 28 6702 30 16013 1 204 101 33562
R/N 431368 22 9388 20 6317 22 9652 1 193 65 25550
R/S 691229 40 12528 26 8657 38 17429 1 35 105 38649
S 743783 64 14787 50 16718 41 16970 5 413 160 48888
T 341463 56 9369 13 3532 22 8581 2 158 93 21640
Total 12442373 1252 391772 436 153058 665 315877 80 14401 2431 874897
43 State of Municipal Education in Mumbai
Annexure 1 – Survey Methodology
Praja Foundation had commissioned the household survey to Hansa Research and the survey
methodology followed is as below:
In order to meet the desired objectives of the study, we represented the city by covering a sample
from each of its 227 wards. Target Group for the study was :
Both Males & Females
18 years and above
Belonging to that particular ward.
Sample quotas were set for representing gender and age groups on the basis of their split available
through Indian Readership Study (Large scale baseline study conducted nationally by Media
Research Users Council (MRUC) &Hansa Research group) for Mumbai Municipal Corporation Region.
The required information was collected through face to face interviews with the help of structured
questionnaire.
In order to meet the respondent within a ward, following sampling process was followed:
5 prominent areas in the ward were identified as the starting point
In each starting point about 20 individuals were selected randomly and the questionnaire was
administered with them.
Once the survey was completed, sample composition of age & gender was corrected to match the
population profile using the baseline data from IRS. This helped us to make the survey findings more
representatives in nature and ensured complete coverage.
The total study sample was 22,850.

44 State of Municipal Education in Mumbai
Annexure 2 – Socio Economic Classification (SEC) Note
SEC is used to measure the affluence level of the sample, and to differentiate people on this basis and study their
behaviour / attitude on other variables.
While income (either monthly household or personal income) appears to be an obvious choice for such a purpose,
it comes with some limitations:
Respondents are not always comfortable revealing sensitive information such as income.
The response to the income question can be either over-claimed (when posturing for an interview) or
under-claimed (to avoid attention). Since there is no way to know which of these it is and the extent
of over-claim or under-claim, income has a poor ability to discriminate people within a sample.
Moreover, affluence may well be a function of the attitude a person has towards consumption rather
than his (or his household’s) absolute income level.
Attitude to consumption is empirically proven to be well defined by the education level of the Chief Wage Earner
(CWE*) of the household as well as his occupation. The more educated the CWE, the higher is the likely affluence
level of the household. Similarly, depending on the occupation that the CWE is engaged in, the affluence level of
the household is likely to differ – so a skilled worker will be lower down on the affluence hierarchy as compared to
a CWE who is businessman.
Socio Economic Classification or SEC is thus a way of classifying households into groups’ basis the education and
occupation of the CWE. The classification runs from A1 on the uppermost end thru E2 at the lower most end of the
affluence hierarchy. The SEC grid used for classification in market research studies is given below:
EDUCATION
OCCUPATION Illiterate
literate but no
formal schooling
/ School up to 4th
School
5th
– 9th
SSC/
HSC
Some College
but not Grad
Grad/ Post-
Grad Gen.
Grad/ Post-
Grad Prof.
Unskilled Workers E2 E2 E1 D D D D
Skilled Workers E2 E1 D C C B2 B2
Petty Traders E2 D D C C B2 B2
Shop Owners D D C B2 B1 A2 A2
Businessmen/
Industrialists with
no. of employees
None D C B2 B1 A2 A2 A1
1 – 9 C B2 B2 B1 A2 A1 A1
10 + B1 B1 A2 A2 A1 A1 A1
Self-employed Professional D D D B2 B1 A2 A1
Clerical / Salesman D D D C B2 B1 B1
Supervisory level D D C C B2 B1 A2
Officers/ Executives Junior C C C B2 B1 A2 A2
Officers/ExecutivesMiddle/ Senior B1 B1 B1 B1 A2 A1 A1
*CWE is defined as the person who takes the main responsibility of the household expenses.
45 State of Municipal Education in Mumbai
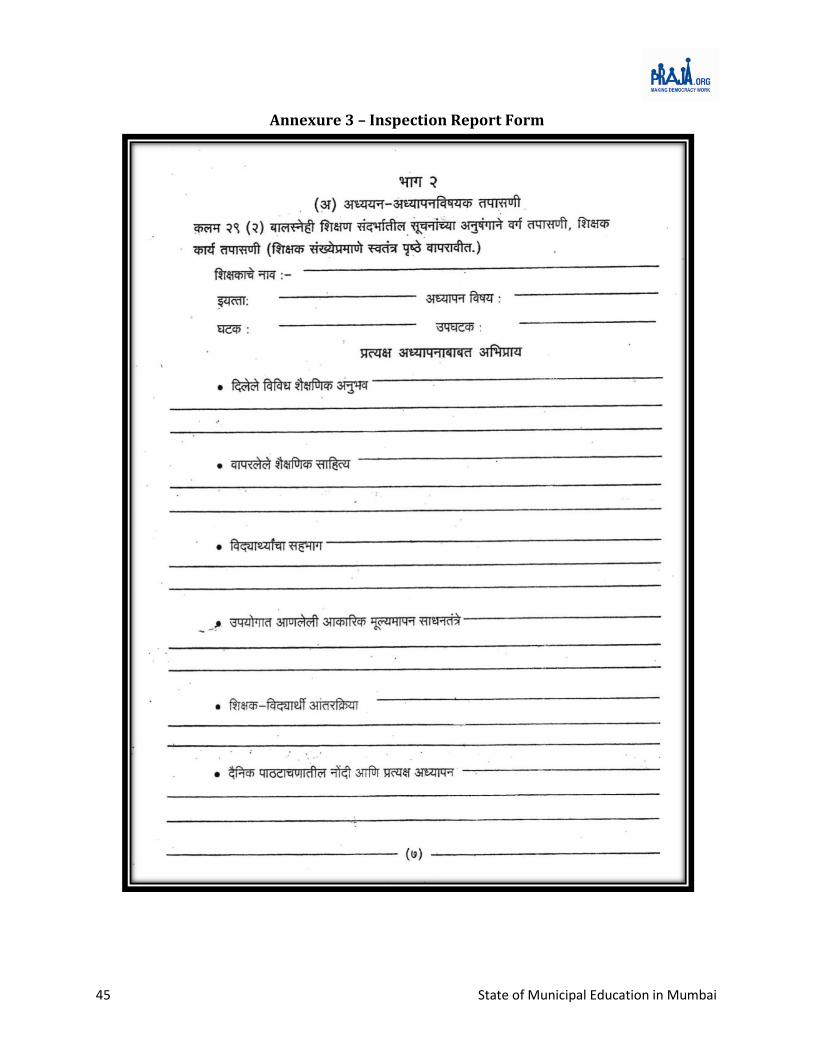
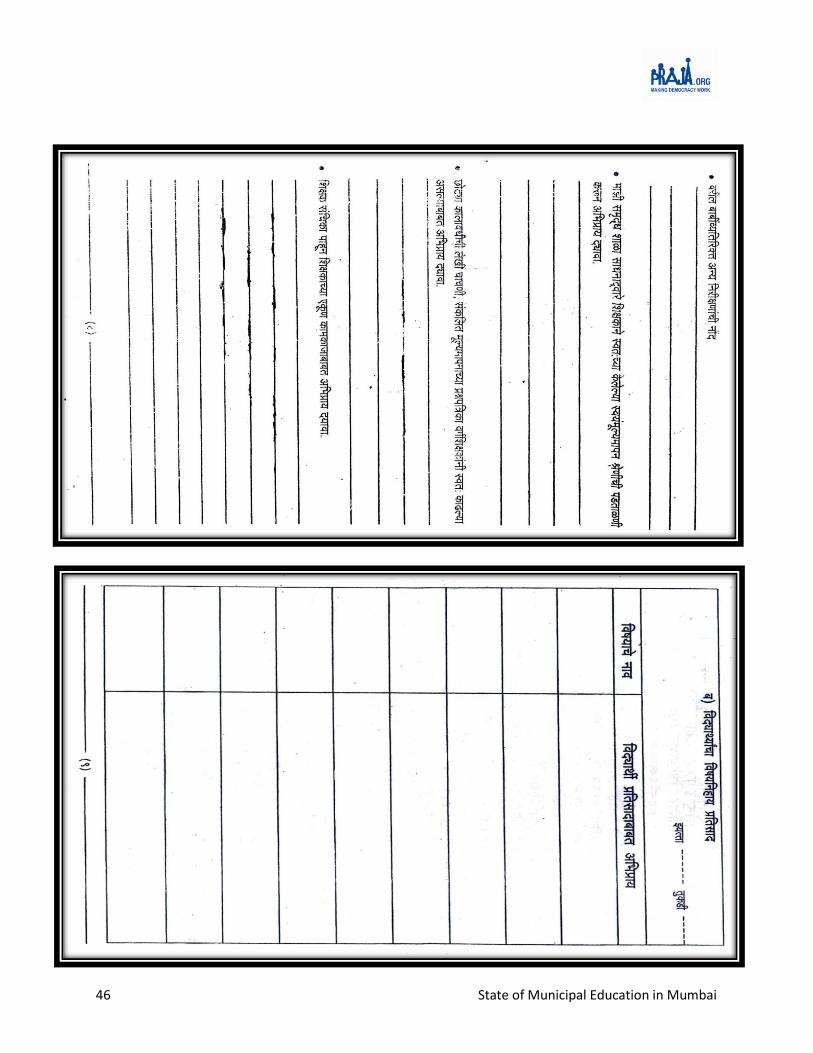
Annexure 3 – Inspection Report Form
46 State of Municipal Education in Mumbai

47 State of Municipal Education in Mumbai
Annexure 4 – Continuous Comprehensive Evaluation Form


![IELRC.ORG - Brihan Mumbai Municipal Corporation Act, 1888 · This Act may be cited as the '[Mumbai Municipal Corporation] Act. [It] extends only to [Brihan Mumbai]. ... receives the](https://img.dokumen.tips/doc/110x75/608406d4514dd2482753c8c1/ielrcorg-brihan-mumbai-municipal-corporation-act-this-act-may-be-cited-as-the.jpg)