Embed Size (px)
Citation preview
State of Municipal Education in MumbaiDecember 2014
Supported by
FORD FOUNDATION
1
2
Data from RTI
3
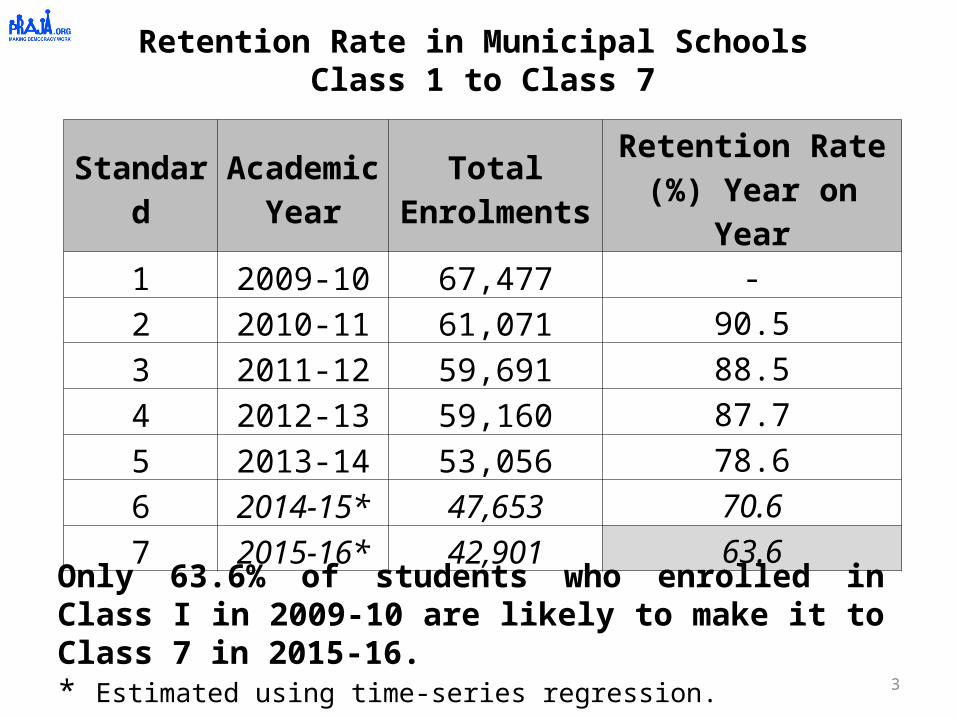
StandardAcademic
YearTotal
EnrolmentsRetention Rate (%)
Year on Year1 2009-10 67,477 -2 2010-11 61,071 90.53 2011-12 59,691 88.54 2012-13 59,160 87.75 2013-14 53,056 78.66 2014-15* 47,653 70.67 2015-16* 42,901 63.6
Retention Rate in Municipal Schools Class 1 to Class 7
Only 63.6% of students who enrolled in Class I in 2009-10 are likely to make it to Class 7 in 2015-16. * Estimated using time-series regression.
4
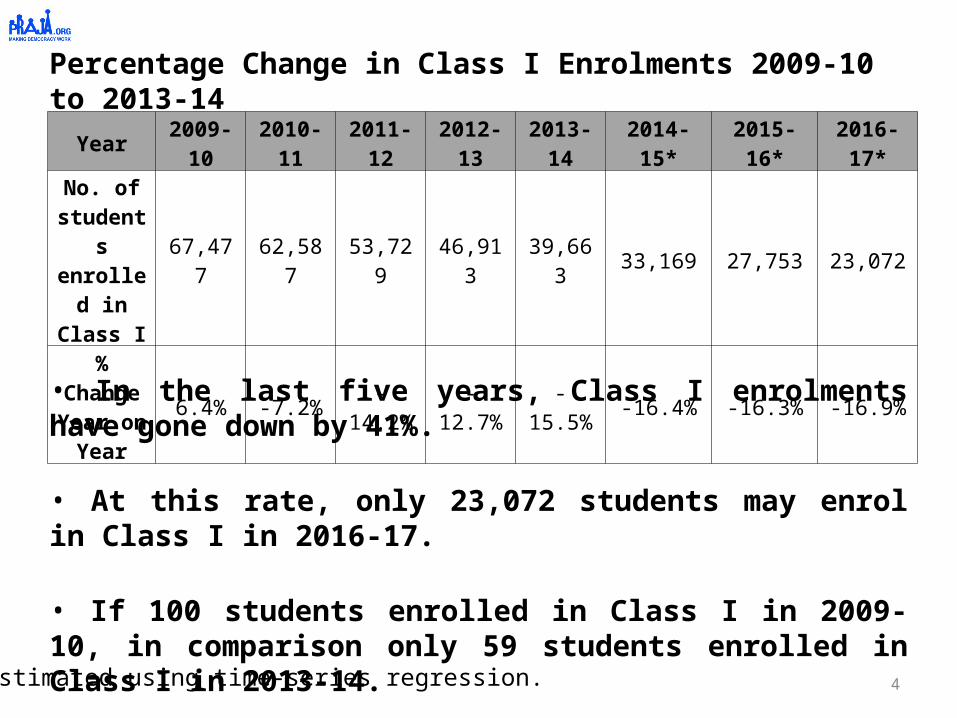
Percentage Change in Class I Enrolments 2009-10 to 2013-14
• In the last five years, Class I enrolments have gone down by 41%.
• At this rate, only 23,072 students may enrol in Class I in 2016-17.
• If 100 students enrolled in Class I in 2009-10, in comparison only 59 students enrolled in Class I in 2013-14.
Year 2009-10 2010-11 2011-12 2012-13 2013-14 2014-15* 2015-16* 2016-17*
No. of students enrolled in Class I
67,477 62,587 53,729 46,913 39,663 33,169 27,753 23,072
% Change Year on
Year6.4% -7.2% -14.2% -12.7% -15.5% -16.4% -16.3% -16.9%
*Estimated using time-series regression.

5
Total Students in Mumbai’s Municipal Schools 2009 - 2014
Year 2009-2010 2010-2011 2011-2012 2012-2013 2013-14
Total Students 455,900 437,863 439,153 434,523 404,251
% Change in Enrolments Year on
Year0.9% -4% 0.3% -1.1% -7%
Medium-wise Change in Enrolments Year on Year
Marathi -4.6% -8.1% -6.9% -11.2% -10.8%
Hindi 5.8% -1.4% 3% 0.7% -8.9%English 37.1% 1.2% 22.2% 18.1% 1.2%Urdu -2.9% 2.6% 2.1% 0.5% -3.3%
Gujarati -7.4% -7.5% -10.4% -12.9% -19.2%Kannada -8.2% -6.4% -8.1% -9.2% -21.5%
Tamil 2.7% -17% -12.3% -3.2% -10.6%Telugu -12.1% -15.6% 0.2% -8.8% -23.4%
• 51,649 students have left municipal school system in five years (11.3%).• Barring English, enrolments across all other mediums of instruction have declined in 2013-14.
6
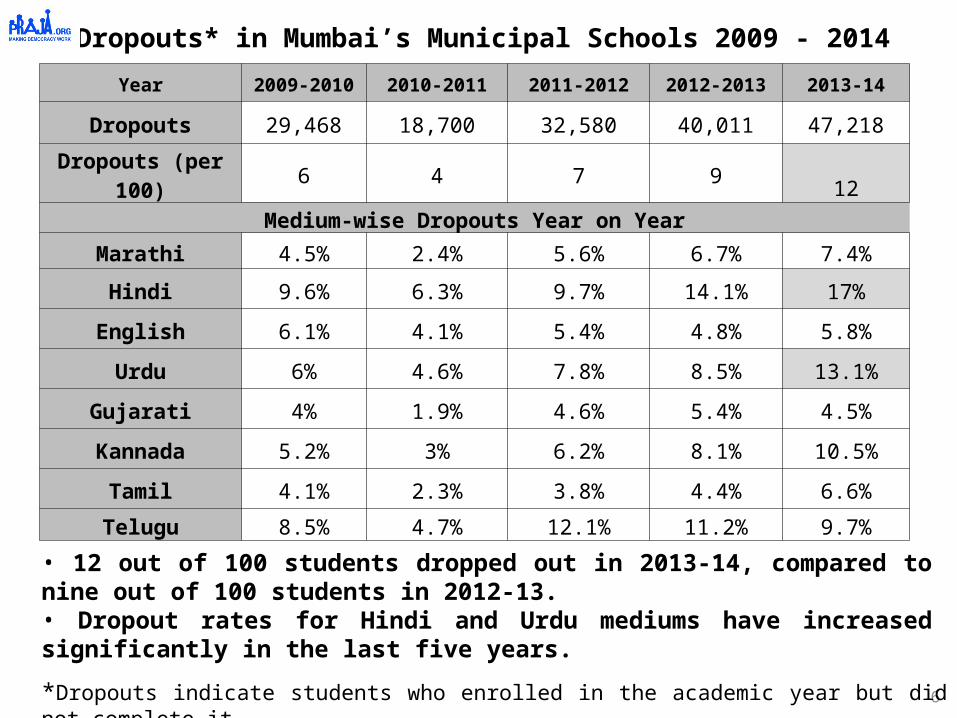
Dropouts* in Mumbai’s Municipal Schools 2009 - 2014
Year 2009-2010 2010-2011 2011-2012 2012-2013 2013-14
Dropouts 29,468 18,700 32,580 40,011 47,218
Dropouts (per 100) 6 4 7 9 12Medium-wise Dropouts Year on Year
Marathi 4.5% 2.4% 5.6% 6.7% 7.4%
Hindi 9.6% 6.3% 9.7% 14.1% 17%
English 6.1% 4.1% 5.4% 4.8% 5.8%
Urdu 6% 4.6% 7.8% 8.5% 13.1%
Gujarati 4% 1.9% 4.6% 5.4% 4.5%
Kannada 5.2% 3% 6.2% 8.1% 10.5%
Tamil 4.1% 2.3% 3.8% 4.4% 6.6%
Telugu 8.5% 4.7% 12.1% 11.2% 9.7%
*Dropouts indicate students who enrolled in the academic year but did not complete it.
• 12 out of 100 students dropped out in 2013-14, compared to nine out of 100 students in 2012-13. • Dropout rates for Hindi and Urdu mediums have increased significantly in the last five years.

Indicator : Schools with Infrastructure Facilities Available
Govt. and Local bodies
Pvt. Aided Pvt. Unaided Un-recognised
Total Schools 1266 443 653 110
BuildingNumber 1266 443 653 110
% 100.00 100.00 100.00 100.00Office cum store cum
HM roomNumber 1212 416 620 105
% 95.73 93.91 94.95 95.45One class room for every
teacherNumber 1006 265 295 78
% 79.46 59.82 45.18 70.91
RampNumber 1125 394 503 44
% 88.86 88.94 77.03 40.00
Separate Toilet for BoysNumber 1261 426 614 108
% 99.61 96.16 94.03 98.18
Separate Toilet for GirlsNumber 1264 433 635 107
% 99.84 97.74 97.24 97.27
Drinking Water FacilityNumber 1266 443 653 110
% 100.00 100.00 100.00 100.00Kitchen Shed (Govt.
&Aided Schools)Number 1071 383 615 106
% 84.60 86.46 94.18 96.36
Boundary WallNumber 1221 394 593 81
% 96.45 88.94 90.81 73.64
PlaygroundNumber 1183 386 538 79
% 93.44 87.13 82.39 71.82
7
Compliance with Infrastructure and other norms under RTE
8
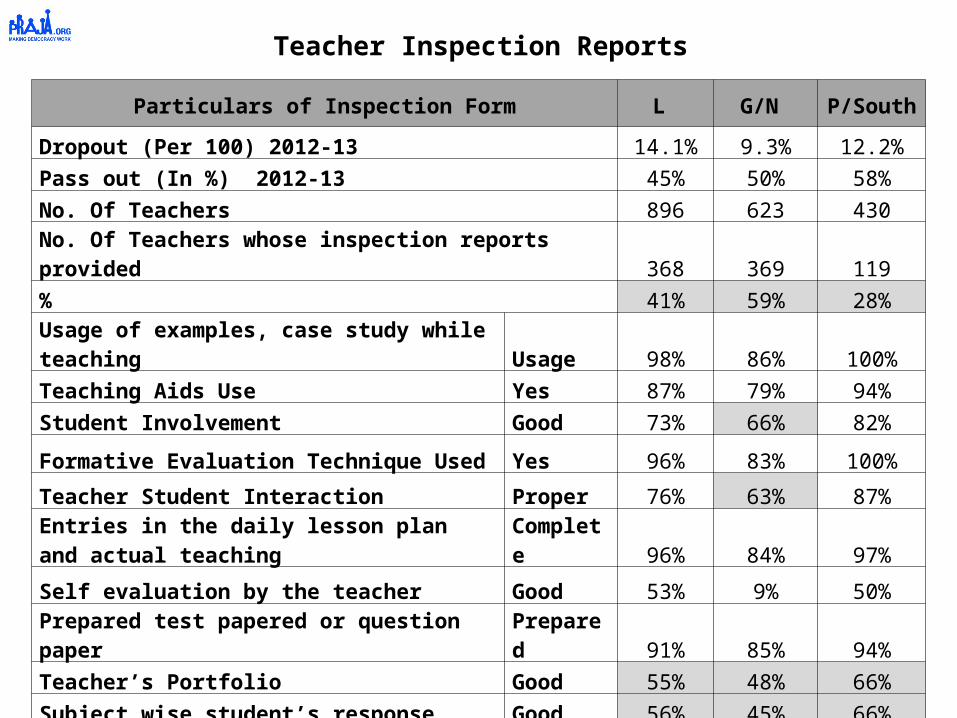
Particulars of Inspection Form L G/N P/South
Dropout (Per 100) 2012-13 14.1% 9.3% 12.2%Pass out (In %) 2012-13 45% 50% 58%No. Of Teachers 896 623 430No. Of Teachers whose inspection reports provided 368 369 119% 41% 59% 28%
Usage of examples, case study while teaching Usage 98% 86% 100%Teaching Aids Use Yes 87% 79% 94%Student Involvement Good 73% 66% 82%
Formative Evaluation Technique Used Yes 96% 83% 100%
Teacher Student Interaction Proper 76% 63% 87%
Entries in the daily lesson plan and actual teaching Complete 96% 84% 97%
Self evaluation by the teacher Good 53% 9% 50%
Prepared test papered or question paper Prepared 91% 85% 94%Teacher’s Portfolio Good 55% 48% 66%Subject wise student’s response Good 56% 45% 66%
Teacher Inspection Reports
9
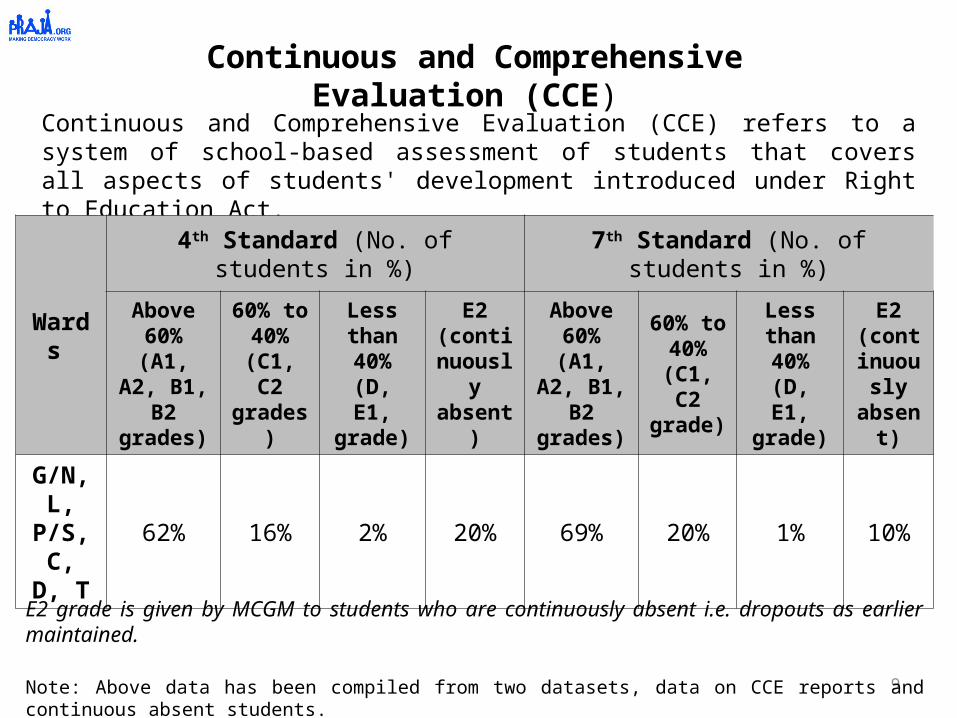
Continuous and Comprehensive Evaluation (CCE) refers to a system of school-based assessment of students that covers all aspects of students' development introduced under Right to Education Act.
Continuous and Comprehensive Evaluation (CCE)
Wards
4th Standard (No. of students in %) 7th Standard (No. of students in %)
Above 60% (A1,
A2, B1, B2 grades)
60% to 40% (C1,
C2 grades)
Less than 40%
(D, E1, grade)
E2 (continu
ously absent)
Above 60% (A1,
A2, B1, B2 grades)
60% to 40% (C1,
C2 grade)
Less than 40%
(D, E1, grade)
E2 (continuously absent)
G/N, L, P/S, C,
D, T62% 16% 2% 20% 69% 20% 1% 10%
E2 grade is given by MCGM to students who are continuously absent i.e. dropouts as earlier maintained.
Note: Above data has been compiled from two datasets, data on CCE reports and continuous absent students.
10
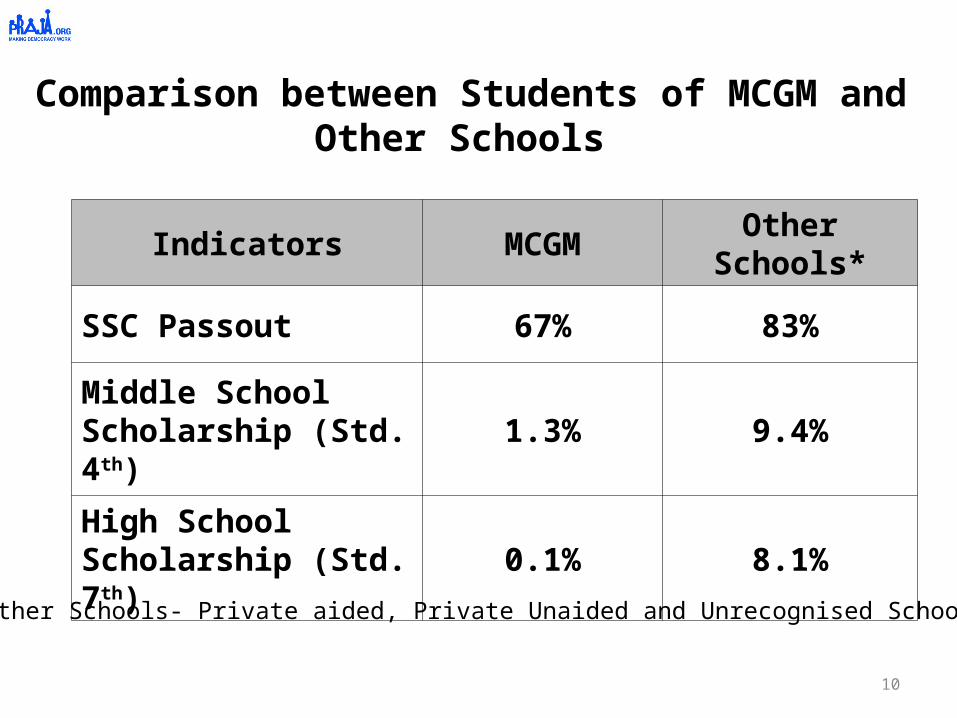
Comparison between Students of MCGM and Other Schools
Indicators MCGM Other Schools*
SSC Passout 67% 83%
Middle School Scholarship (Std. 4th) 1.3% 9.4%
High School Scholarship (Std. 7th) 0.1% 8.1%
*Other Schools- Private aided, Private Unaided and Unrecognised Schools
11
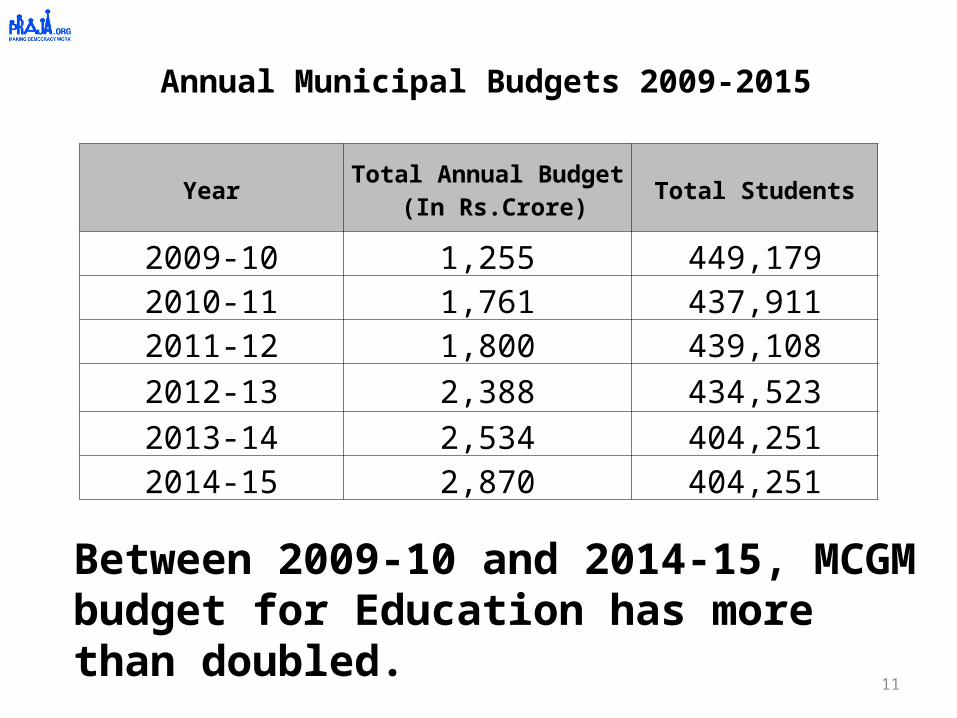
Annual Municipal Budgets 2009-2015
YearTotal Annual Budget
(In Rs.Crore)Total Students
2009-10 1,255 449,1792010-11 1,761 437,9112011-12 1,800 439,1082012-13 2,388 434,5232013-14 2,534 404,2512014-15 2,870 404,251
Between 2009-10 and 2014-15, MCGM budget for Education has more than doubled.
12
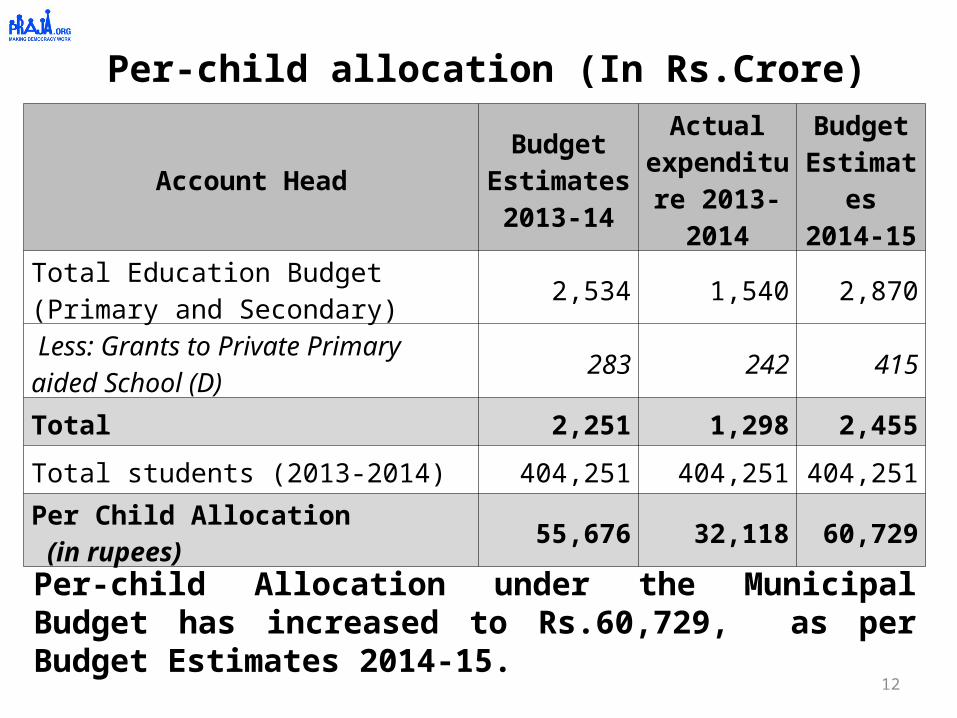
Account HeadBudget
Estimates 2013-14
Actual expenditure 2013-2014
Budget Estimates 2014-15
Total Education Budget (Primary and Secondary)
2,534 1,540 2,870
Less: Grants to Private Primary aided School (D)
283 242 415
Total 2,251 1,298 2,455
Total students (2013-2014) 404,251 404,251 404,251
Per Child Allocation (in rupees)
55,676 32,118 60,729
Per-child allocation (In Rs.Crore)
Per-child Allocation under the Municipal Budget has increased to Rs.60,729, as per Budget Estimates 2014-15.
13
Data from Household Survey
Praja Foundation had commissioned a household survey to Hansa Research. The survey was conducted in March-April 2014 across the city of Mumbai with a total sample size of 22,580 households. Of these, 4,276 households had children going to school. Hence, the education questionnaire was administered further with those (4,276) households only.
14
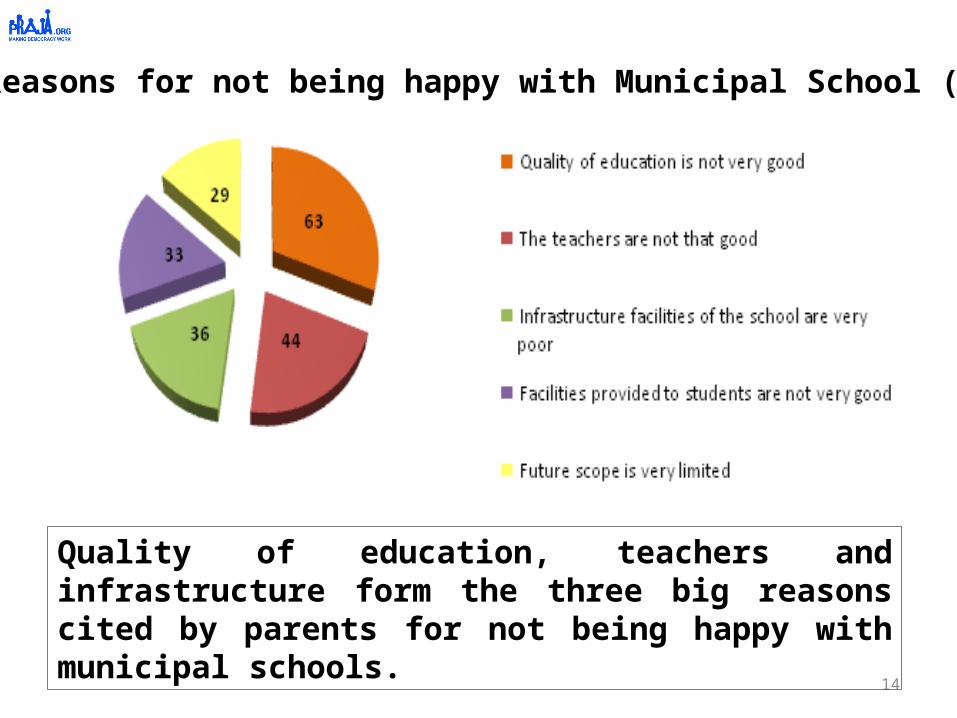
Reasons for not being happy with Municipal School (%)
Quality of education, teachers and infrastructure form the three big reasons cited by parents for not being happy with municipal schools.
15
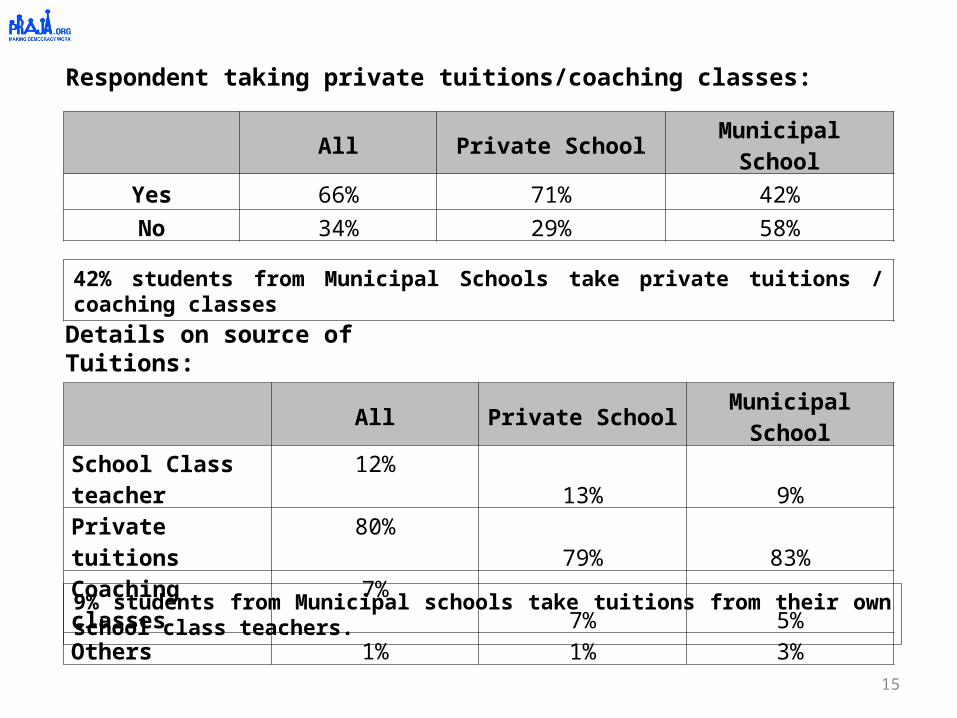
Respondent taking private tuitions/coaching classes:
42% students from Municipal Schools take private tuitions / coaching classes
Details on source of Tuitions:
9% students from Municipal schools take tuitions from their own school class teachers.
All Private School Municipal School
Yes 66% 71% 42%No 34% 29% 58%
All Private School Municipal School
School Class teacher 12% 13% 9%Private tuitions 80% 79% 83%Coaching classes 7% 7% 5%Others 1% 1% 3%
16
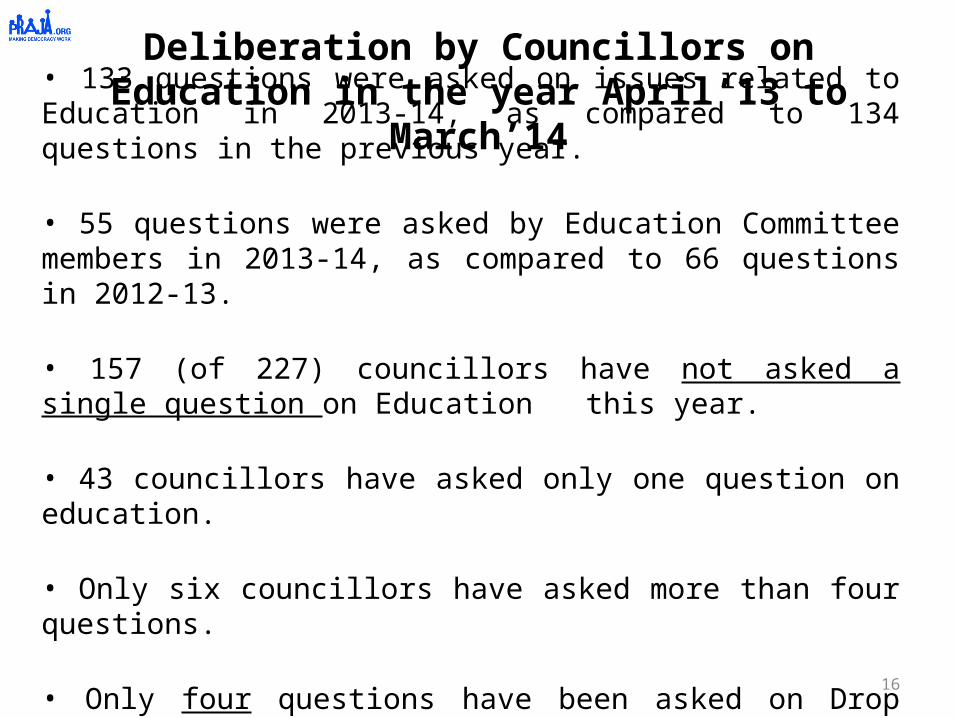
Deliberation by Councillors on Education in the year April’13 to March’14
• 133 questions were asked on issues related to Education in 2013-14, as compared to 134 questions in the previous year.
• 55 questions were asked by Education Committee members in 2013-14, as compared to 66 questions in 2012-13.
• 157 (of 227) councillors have not asked a single question on Education this year.
• 43 councillors have asked only one question on education.
• Only six councillors have asked more than four questions.
• Only four questions have been asked on Drop out rates.
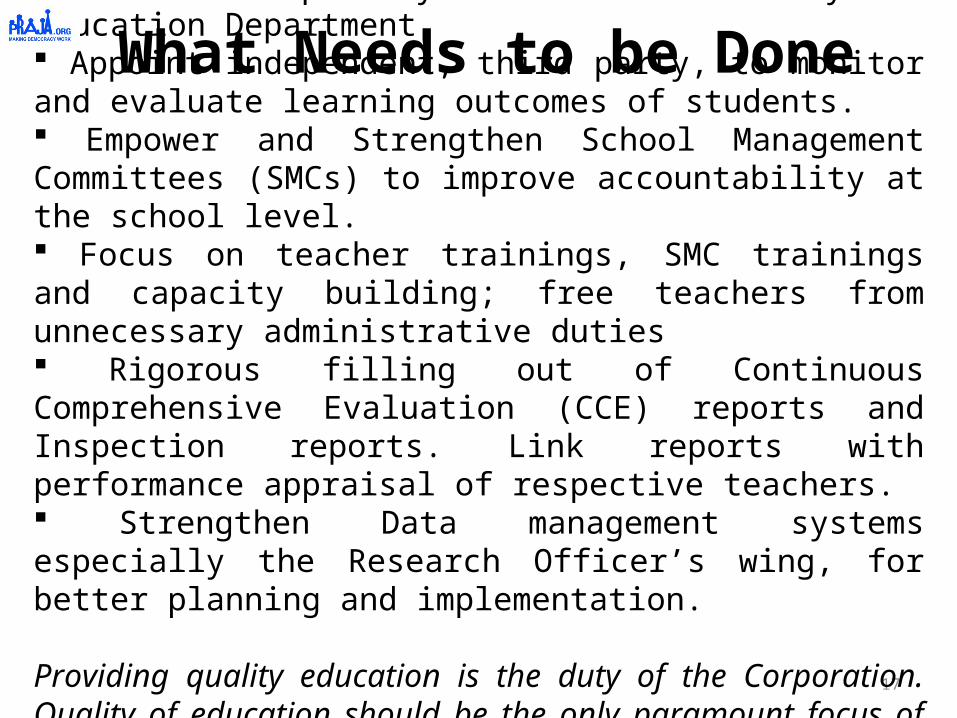
What Needs to be Done
17
More transparency and accountability in Education Department. Appoint independent, third party, to monitor and evaluate learning outcomes of students. Empower and Strengthen School Management Committees (SMCs) to improve accountability at the school level. Focus on teacher trainings, SMC trainings and capacity building; free teachers from unnecessary administrative duties Rigorous filling out of Continuous Comprehensive Evaluation (CCE) reports and Inspection reports. Link reports with performance appraisal of respective teachers. Strengthen Data management systems especially the Research Officer’s wing, for better planning and implementation.
Providing quality education is the duty of the Corporation. Quality of education should be the only paramount focus of the Corporation.
THANK YOU.
18